Effect of Sampling Conditions on the Sub-23 nm Nonvolatile Particle Emissions Measurements of a Moped

European Commission-Joint Research Centre, 21027 Ispra (VA), Italy
Appl. Sci. 2019, 9(15), 3112; https://0-doi-org.brum.beds.ac.uk/10.3390/app9153112
Submission received: 3 July 2019
/
Revised: 18 July 2019
/
Accepted: 31 July 2019
/
Published: 1 August 2019
Abstract
:Featured Application
Dilution at the tailpipe minimizes the differences of the sub-23 nm nonvolatile particle measurements between tailpipe and dilution tunnel.
Abstract
The solid (or nonvolatile) particle number (SPN) emissions of light-duty and heavy-duty vehicles and engines are regulated in the European Union. The measurements are conducted from the tailpipe during on-road tests, but from the dilution tunnel in the laboratory under controlled conditions. Recently, dedicated laboratory studies for the evaluation of the measurement uncertainty at the two sampling locations found differences due to the formation of nonvolatile particles, i.e., particles that do not evaporate in the thermal pre-treatment part of the particle number systems. In order to investigate the origin of these particles, measurements at the tailpipe, the transfer tube, and the dilution tunnel were conducted with cold and hot dilution and instruments with different lower detection limits (4 nm, 10 nm, and 23 nm). The results showed that sub-23 nm nonvolatile particles could be detected in the dilution tunnel, but not at the tailpipe, due to growth of low volatility compounds in the transfer tube and the finite residence time in the thermal pretreatment part of the particle number systems. When measuring below 23 nm, diluting at the tailpipe or reducing the residence time in the transfer tube to the dilution tunnel is important in order to minimize such differences.
1. Introduction
In the European Union (EU) the solid (or nonvolatile) particle number (SPN) emissions are regulated since 2011 for compression ignition (diesel) light-duty vehicles, since 2013 for heavy-duty diesel engines, since 2014 for positive ignition heavy-duty engines and gasoline direct injection vehicles, and since 2017 for non-road engines (19–560 kW), inland waterway vessels (>300 kW), and rail traction engines [1,2]. For light-duty vehicles the tests are complemented by on-road real driving emissions (RDE) tests since 2017 (Regulation (EU) 2017/1151).
While the SPN sampling on the road is done directly from the tailpipe of the vehicle, the sampling in the laboratory is done after dilution of the whole exhaust in a dilution tunnel with constant volume sampling (CVS). The laboratory particle number systems consist of a hot diluter (≥150 °C), an evaporation tube (350 °C), and a particle detector, typically a condensation particle counter (CPC) with 50% counting efficiency at 23 nm, specifications based on the Particle Measurement Program (PMP) [3,4]. For the on-road tests, the portable emissions measurement systems (PEMS) have simpler specifications: they must contain an evaporation tube with wall temperature >300 °C. The comparison of the PEMS and the PMP systems in the laboratory, the so-called validation test, gives differences up to 50% [1]. Approximately 30% difference is due to calibration uncertainties, mainly due to the fact that the PEMS technical requirements are not so strict (e.g., there is a 30% margin for the counting efficiencies). The rest 20% is due to the different sampling locations (tailpipe vs. CVS). There are not many studies that have examined the particle dynamics between the two locations [5,6,7]. It was found that agglomeration (coagulation), diffusion, and thermophoresis are the main processes that result in decreased number concentration at the dilution tunnel. The differences for modern vehicles with emission levels <1 × 10¹² particles/km are <20% [6], but they were higher (40%) for older diesel vehicles without particulate filters [5]. The opposite, i.e., higher concentration levels at the CVS than at the tailpipe, are rarely seen [8]. When seen, they are typically attributed to the volatile artefact, i.e., formation of volatile particles in the measurement system downstream of the evaporation tube due to re-nucleation of semi-volatile species [9,10]. Recently, it was mentioned that nonvolatile particles can also be formed in the tube to the dilution tunnel [11]. However there was no clear explanation of where and how they are formed. It was speculated that either they are formed at the transfer tube due to pyrolysis or that they are low volatility compounds that due to kinetic restrictions do not evaporate in the evaporation tube of the measurement system.
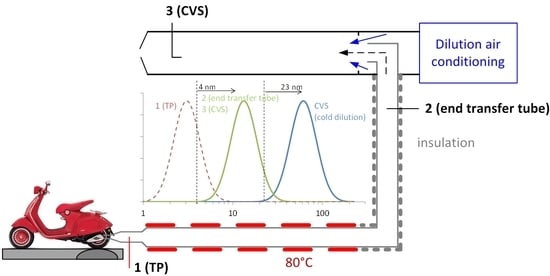
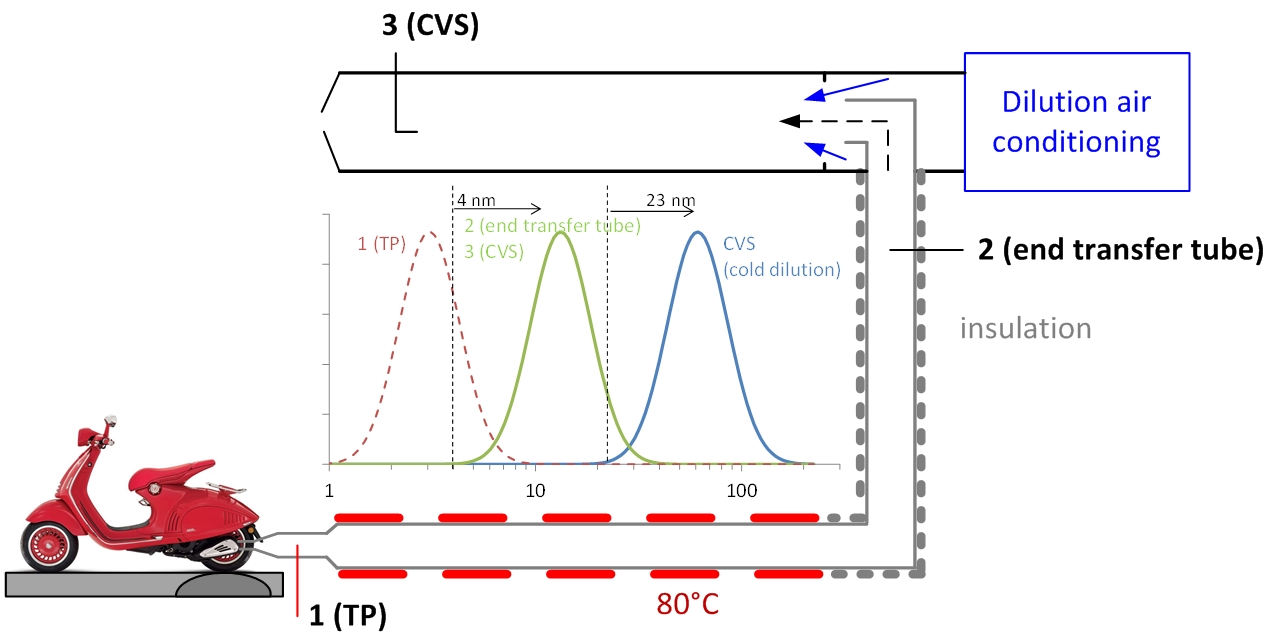
The objective of this paper is to investigate when (where) and how these nonvolatile particles appear. The term “appearance” instead of formation is used, because these particles may already exist at the tailpipe of the vehicles, but below the measurement range of the instruments. Particle number systems with different lower size detection limits (4 nm, 10 nm, 23 nm) at the tailpipe, the transfer tube, and the dilution tunnel are compared under cold and hot dilution conditions measuring the exhaust gas of a moped.
2. Materials and Methods
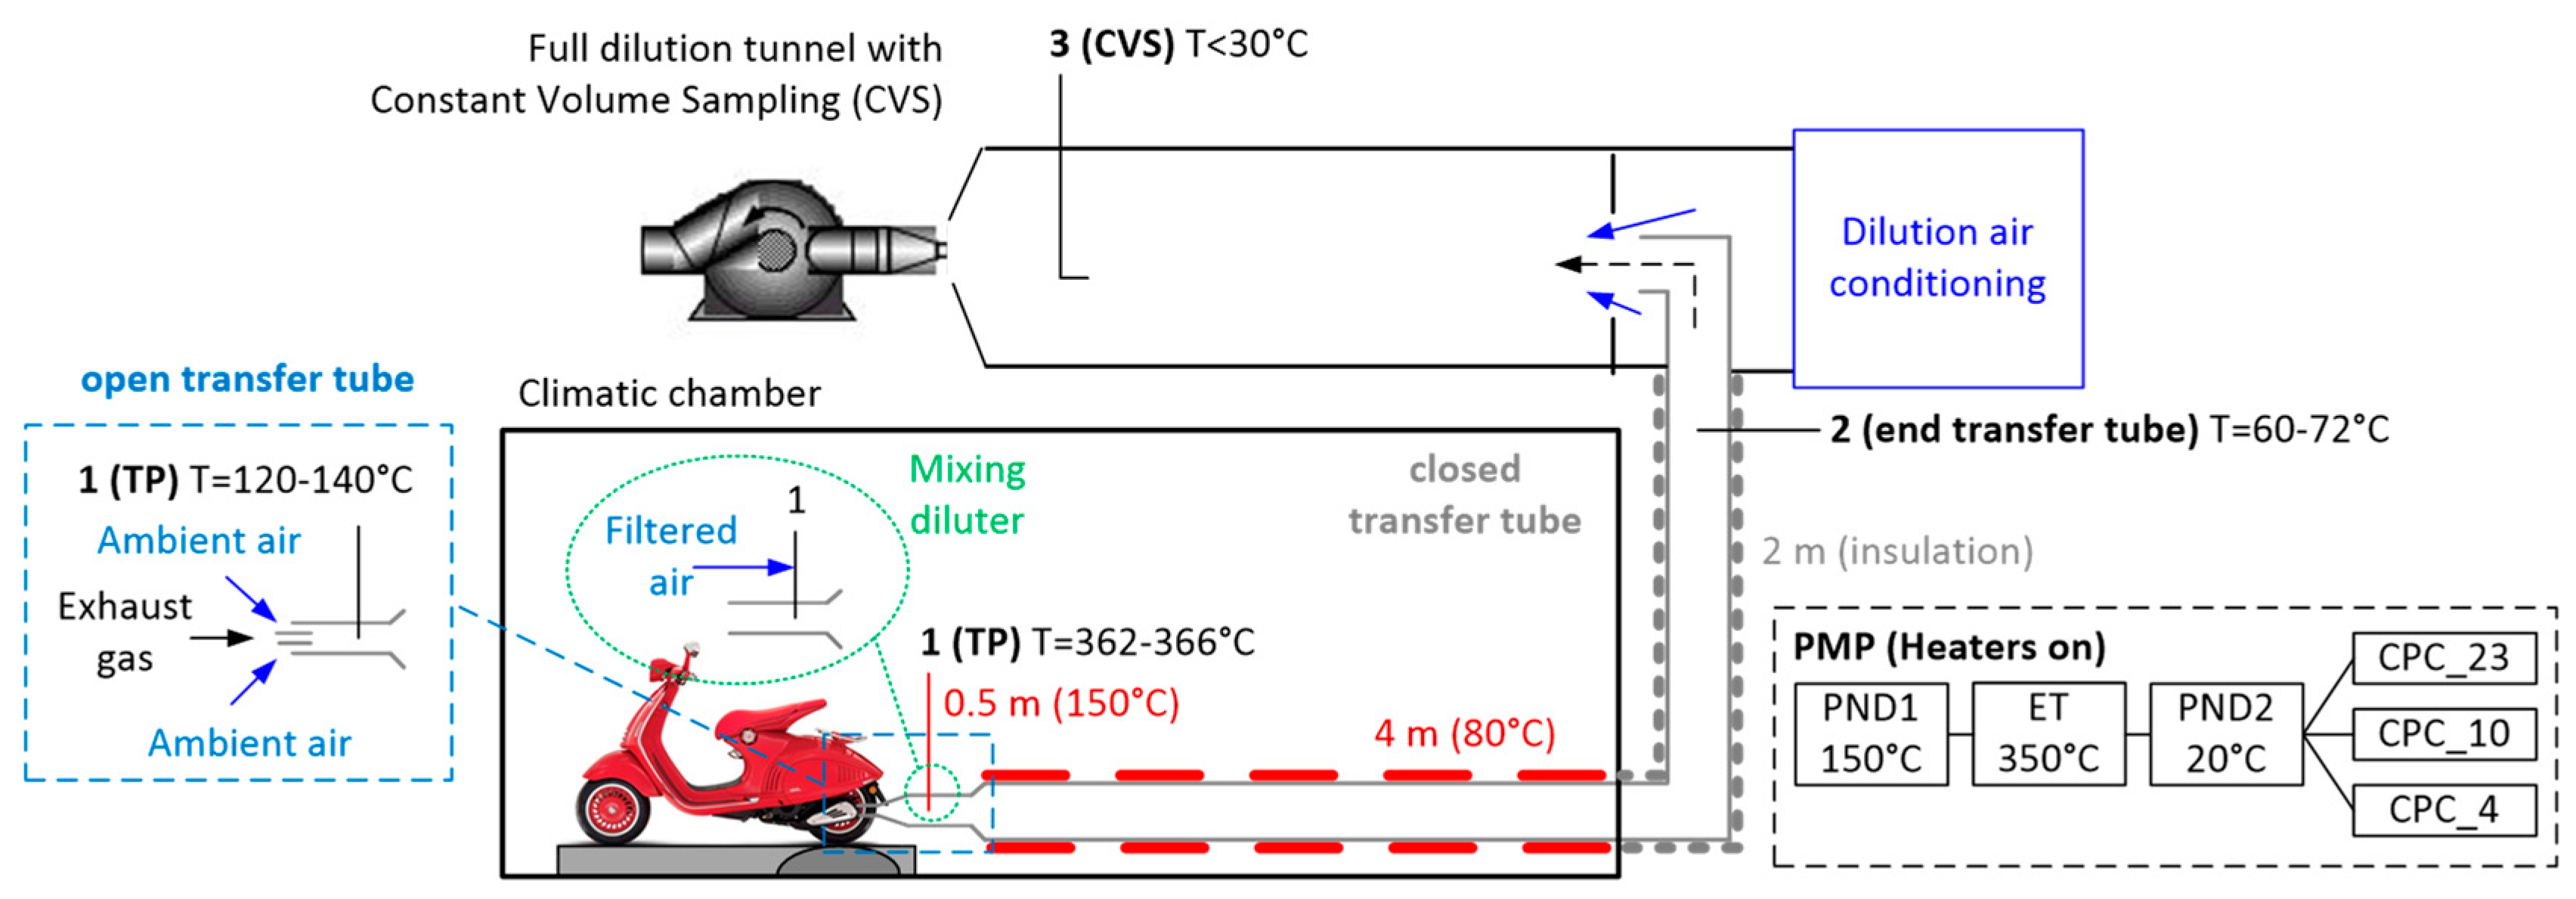
Figure 1 presents the experimental setup. The tests were conducted at the vehicles’ emissions laboratory (VELA 1) of the Joint Research Centre (JRC) of the European Commission. The facility is used for light-duty and L-category vehicles (such as mopeds and motorcycles) testing. Before this campaign a Euro 4 motorcycle was tested (6 tests) and before that motorcycle, a gasoline vehicle (6 tests).
The tests of this campaign were conducted with a Euro 4 moped with a 50 cm3 4-stroke engine with three-way catalyst. For the specific moped high differences between tailpipe and dilution tunnel were found in another study [11]. Between the tests of this study and the previous study the moped was driven >500 km in urban roads. Steady state test at the maximum speed of the moped (45 km/h) were run. The tailpipe of the moped was connected to a 6 m stainless steel transfer tube. The first 4 m were flexible and heated (heater set to 80 °C) and the last 2 m were fixed and insulated. The moped and the first 4 m of the transfer line were inside a climatic chamber kept at 23 °C. The whole exhaust gas was then diluted in a dilution tunnel with constant volume sampling (CVS). The last 2 m of the transfer line and the CVS were in another climatic room kept at 20 °C.
Samples were taken at three locations: (1) close to the tailpipe of the moped; (2) at the end of the transfer tube; and (3) at the dilution tunnel (CVS). The temperatures were also measured at these 3 locations, but they are available in real time only for position (1). Two identical and freshly calibrated measurement systems were used: one (PMP #1) was measuring always from the tailpipe (position 1). The second (PMP #2) was measuring from the CVS (position 3) and for a few tests from the end of the transfer tube (position 2). The systems fulfilled the light-duty vehicles regulations and the PMP specifications [4]. The PMP system of this study (AVL particle counter APC 489, Graz, Austria) [12] consisted of a hot diluter at 150 °C, an evaporation tube at 350 °C, a cold diluter with filtered ambient air at 20 °C, and full-flow butanol-based condensation particle counters (CPCs) with 50% counting efficiency at 23 nm (model 3790 from TSI, MN, Shoreview, MS, USA), 10 nm (model 3772 from TSI, USA) and 4 nm (model 3752 from TSI, USA). The thermal pre-treatment of the PMP systems evaporates volatile and semivolatile particles in order to allow only nonvolatile (solid) particles to be counted [4]. The CPCs optically detect particles that grow in the measurement range of the optics by condensation of butanol [13]. The PMP #1 was connected to the tailpipe with a stainless steel 0.5 m tube heated at 120 °C. This was the default configuration and was repeated in the middle and the end of the measurement campaign (tests 1, 5, 7) (Table 1).
For test 2, the 6 m transfer tube was left open at the side normally connected to the moped (Figure 1, left inset). The underpressure from the CVS sucked some ambient air also from the opening. The dilution was estimated to be around 2:1. This configuration (open transfer tube) is allowed in the EU motorcycles/mopeds regulation. Here the target was to see whether the nonvolatile particles are formed due to the cold dilution. For test 3, the 0.5 m heated tube of PMP #1 was switched off and a simple mixer diluter with filtered ambient air was added upstream (dilution 6:1). Target was to see whether cold dilution forms the nonvolatile particles. For test 4, the heaters of the PMP #2 system were switched off to measure the total particle number concentration at the dilution tunnel (nonvolatiles plus volatiles). Test 6a was conducted with PMP #2 sampling from the end of the transfer tube. The test was repeated (test 6b) setting the heater of the 4 m tube to 150 °C, instead of 80 °C that was the default set point for all other tests.
The concentrations of the CPCs were corrected for the dilution in the PMP systems and the average particle losses at 30 nm, 50 nm, and 100 nm, the so-called particle concentration reduction factor (PCRF). When the heaters were off, the PCRF was corrected 10% for the lower thermophoretic losses and 45% for the different densities at the primary diluter, resulting in a 35% lower PCRF [12]. The penetration after correction with the PCRF is approximately 100% ± 5% for sizes >30 nm. It drops to 50% at 15 nm, 25% at 10 nm, and <5% at 5 nm [10]. The concentrations given by the 10 nm and 4 nm CPCs are underestimated approximately by a factor of 2 for sizes below 30 nm, because the losses in the sub-30 nm range were not considered [6,10]. However, as the objective of the paper is to understand the formation of the nonvolatile particles which have an order of magnitude higher concentration, the loss correction (which is identical for both PMP systems) does not have any influence on the results and conclusions.
The corrected concentrations of the CPCs of PMP #1 connected to the tailpipe and of PMP #2 when connected at the end of the tailpipe were multiplied with the moped exhaust flow rate (approximately 0.2 m3/min). PMP #2 when connected to position 3 was multiplied with the CVS flow rate (approximately 5.5 m3/min) to calculate particles per second (particles/s) (see calculation details elsewhere [14]).
3. Results
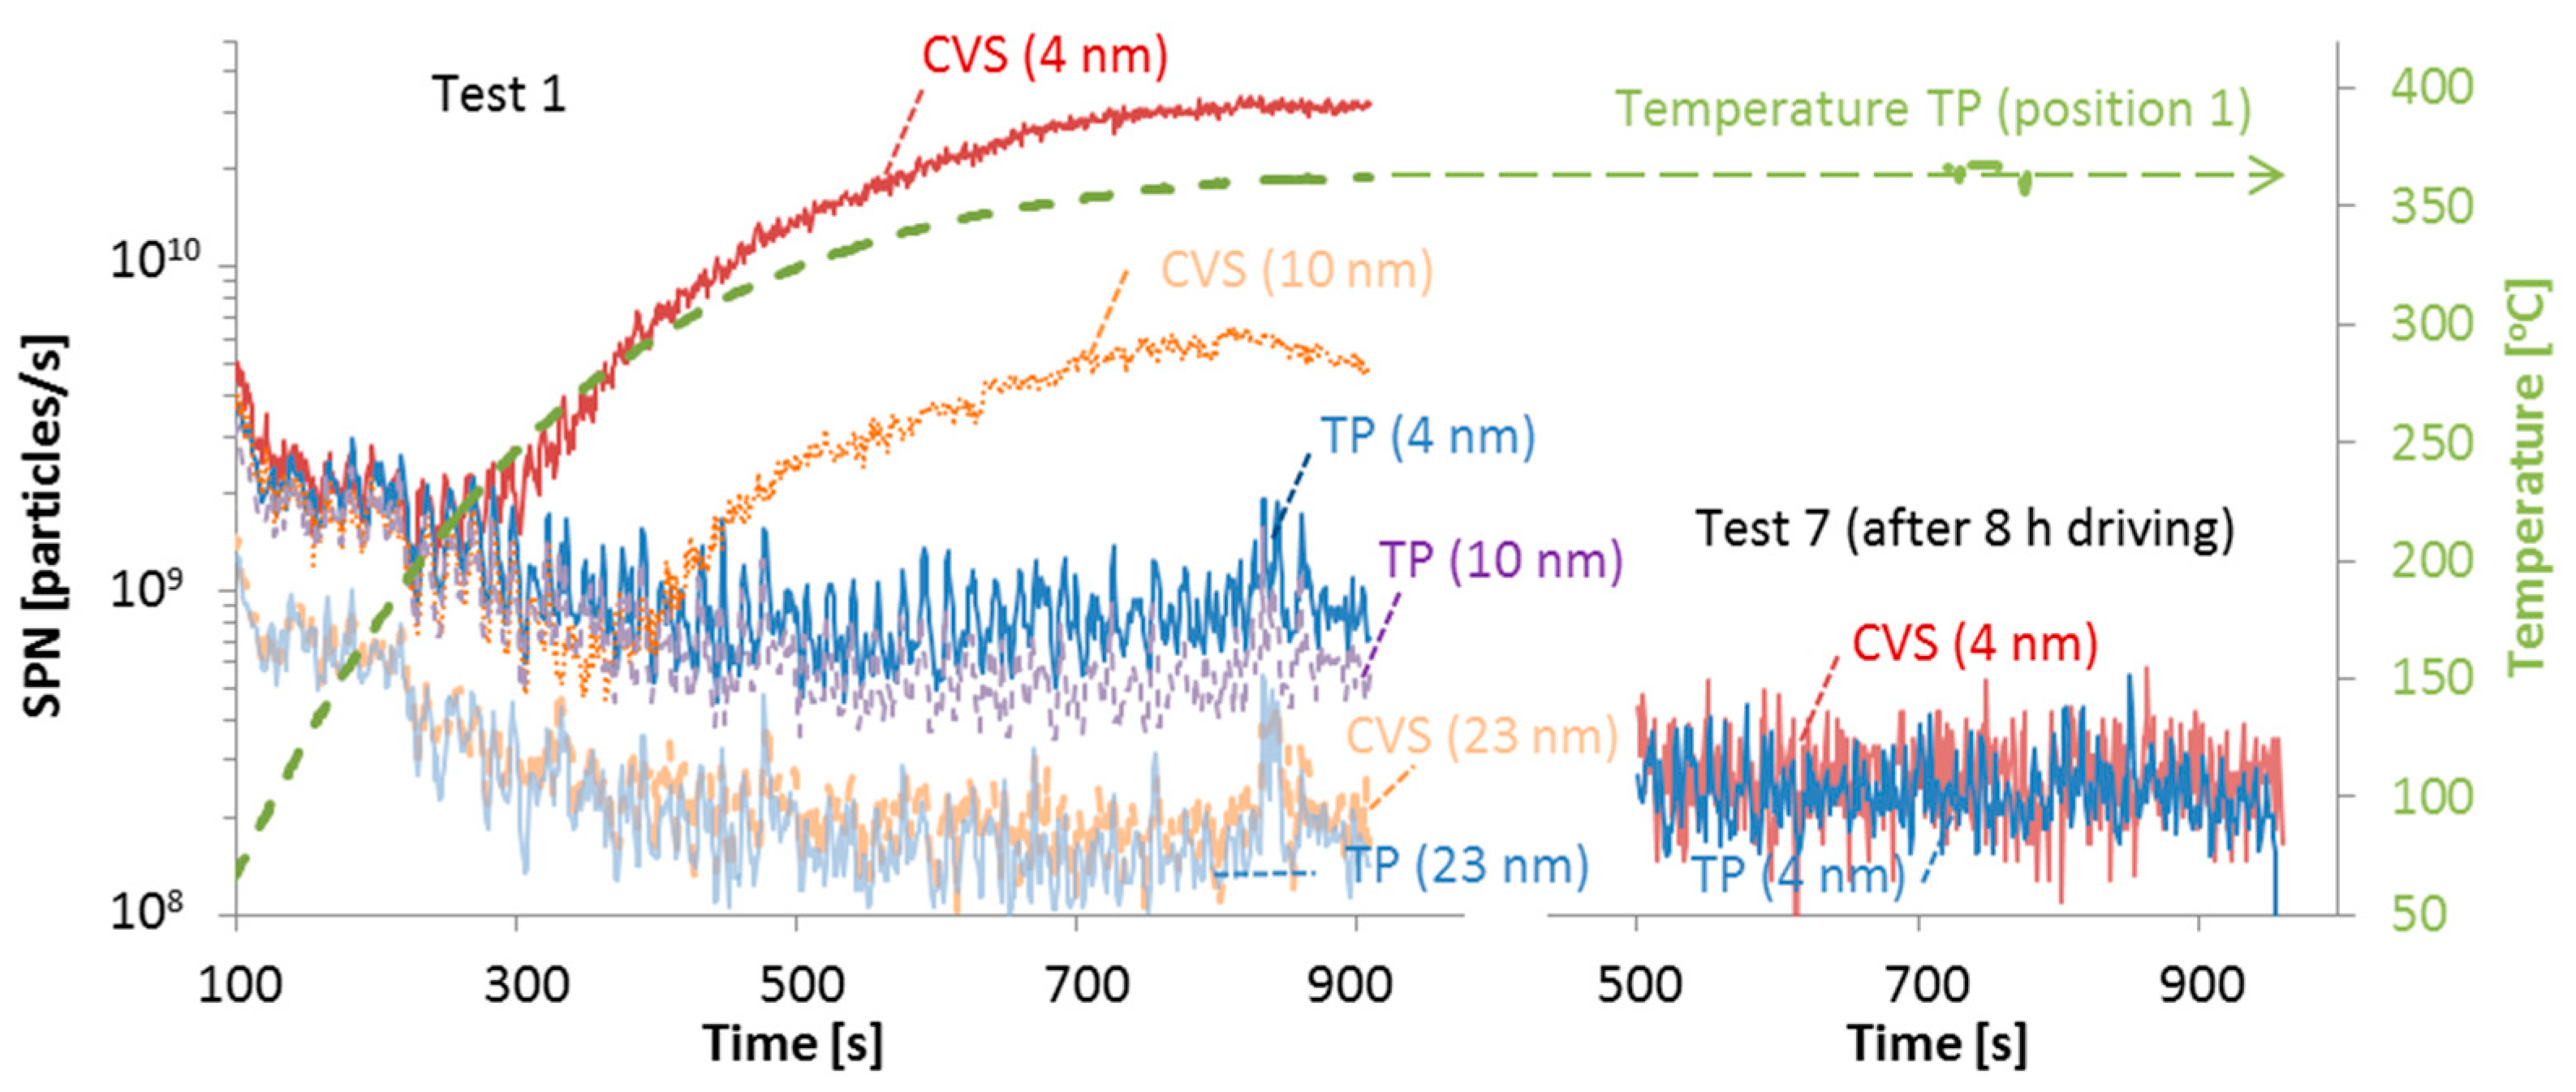
Figure 2 compares the two PMP systems at the tailpipe (TP) and the dilution tunnel (CVS) at the first and last tests of the measurement campaign. The last test was approximately after 8 h of laboratory testing (driving) in one week. No other vehicles were tested in the facility during this period. Focusing on the first test (left side), the tailpipe and the CVS SPN >23 nm concentrations were low but at the same level. The SPN > 4 nm concentrations at the TP and CVS were at the same level during the engine start (not shown here, approximately 100 s) and for a few minutes (200 s). At approximately 300 s, when the exhaust gas temperature exceeded 250 °C, they started to deviate. The difference exceeded one order of magnitude (reaching 3.3 × 10¹⁰ p/s or 2.6 × 10¹² p/km). The 10 nm CVS results were between the 23 nm and 4 nm results, while the 10 nm TP results were closer to the 4 nm TP results. This first test confirmed the appearance of nonvolatile particles at the CVS, not seen at the tailpipe, mentioned in the previous study [11]. The previous study confirmed that the particles measured at the CVS are nonvolatile because higher or lower dilution, or a catalytic stripper, did not change their concentration [11]. For the same reason it was also assumed that they are not formed inside the PMP system. It was not clear though when (where) and how they were formed.
Figure 2, right side, shows that after 8 h of testing the concentration at the CVS was identical to the one at the TP (2.5 × 10⁸ p/s or 2.5 × 10¹⁰ p/km). The tailpipe levels were 3 times lower than at the last test (also the 23 nm concentration, which is not shown) compared to the first test (8 × 10⁸ p/s or 6.4 × 10¹⁰ p/km).
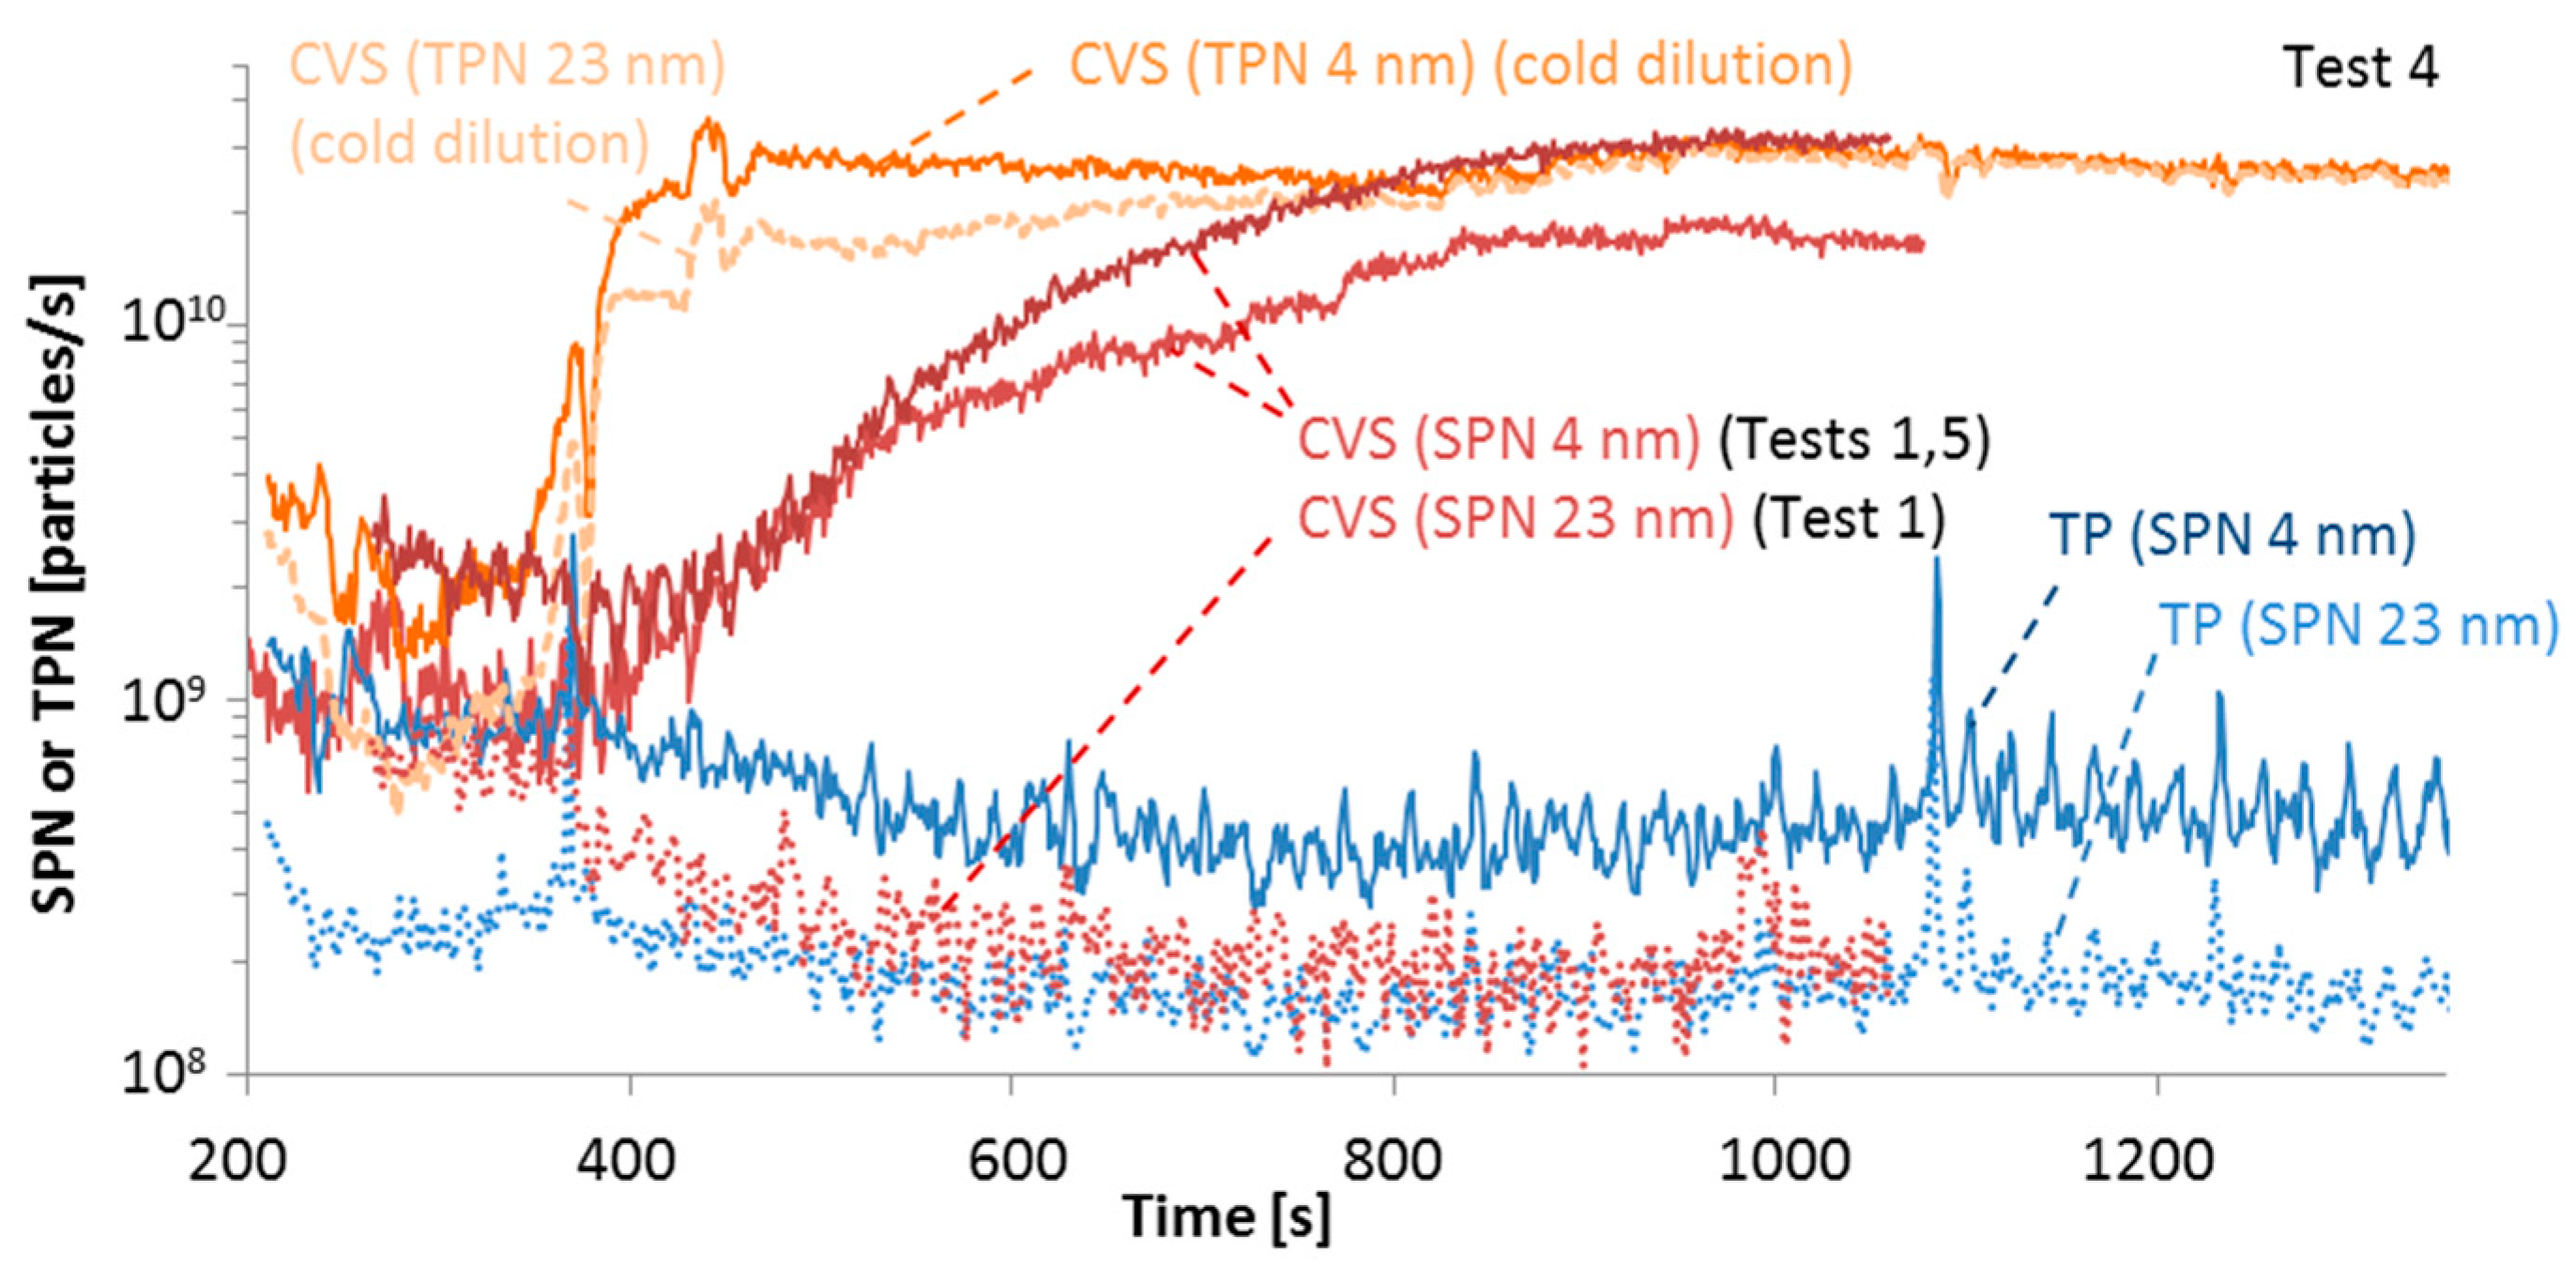
Figure 3 plots the results with cold dilution (i.e., heaters off) at PMP #2 measuring from the dilution tunnel (CVS cold dilution, orange lines, test 4). The results of two tests (1 and 5) with the heaters on for PMP #2 are also plotted for comparison (red lines). The emission rates from the tailpipe (heaters on, blue lines, test 4) are also shown to put the results into context. With the heaters off, the CVS results of the 23 nm and 4 nm CPCs were very close after 600 s, indicating that the particles had a mean size larger than 23 nm. The difference of the 4 nm CPCs with the heaters on and off (compare SPN 4 and TPN 4) is relatively small (less than a factor of 2) which can be attributed to experimental uncertainties and the particle losses in the PMP #2 system when the heaters were on and off [10]. This finding indicates that particles pre-existed and the volatile compounds heterogeneously nucleated and condensed on existing particles, rather than homogeneously nucleated.
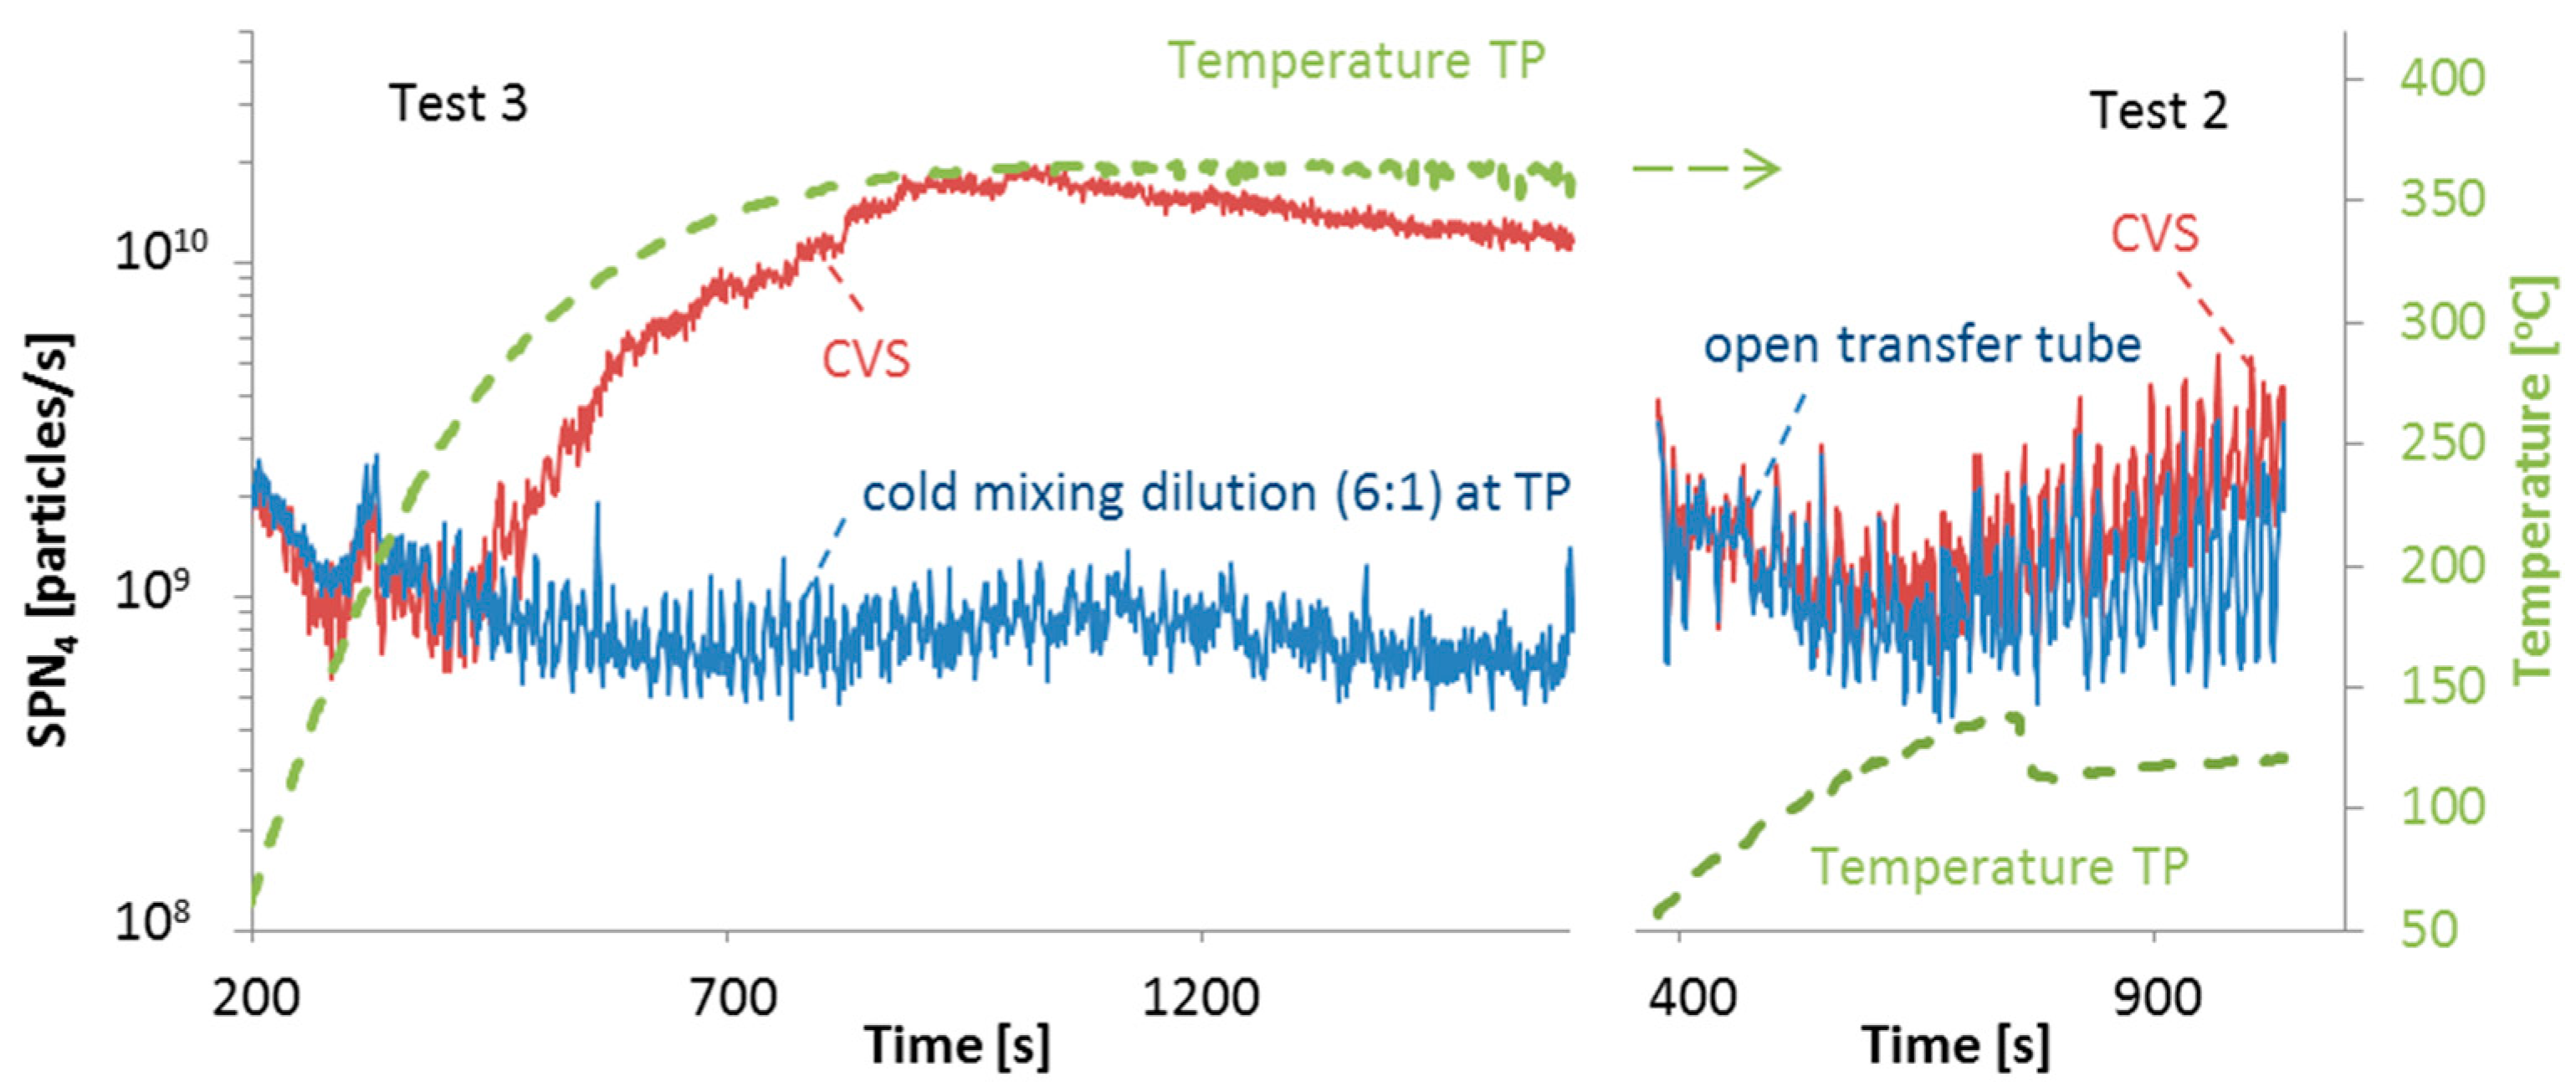
Figure 4 plots measurements with cold dilution at tailpipe. When a cold diluter was added upstream of the PMP #1 system at the tailpipe (cold mixing dilution 6:1 at TP, test 3), the concentration remained at low levels without indications of nonvolatile particles appearance. When the transfer tube was open at the side of the tailpipe (open transfer tube) the concentrations of particles >4 nm at the tailpipe and the dilution tunnel were similar (Figure 4, right side, test 2). The exhaust gas temperature close to the tailpipe immediately after this dilution (of approximately 2:1) was around 120–140 °C. The sudden drop of the temperature from 140 °C to 120 °C was due to a movement of the transfer tube that changed the dilution. The main conclusion of these tests is that with sudden cold dilution at the tailpipe the particles are not formed or do not grow to the measurement range of the systems.
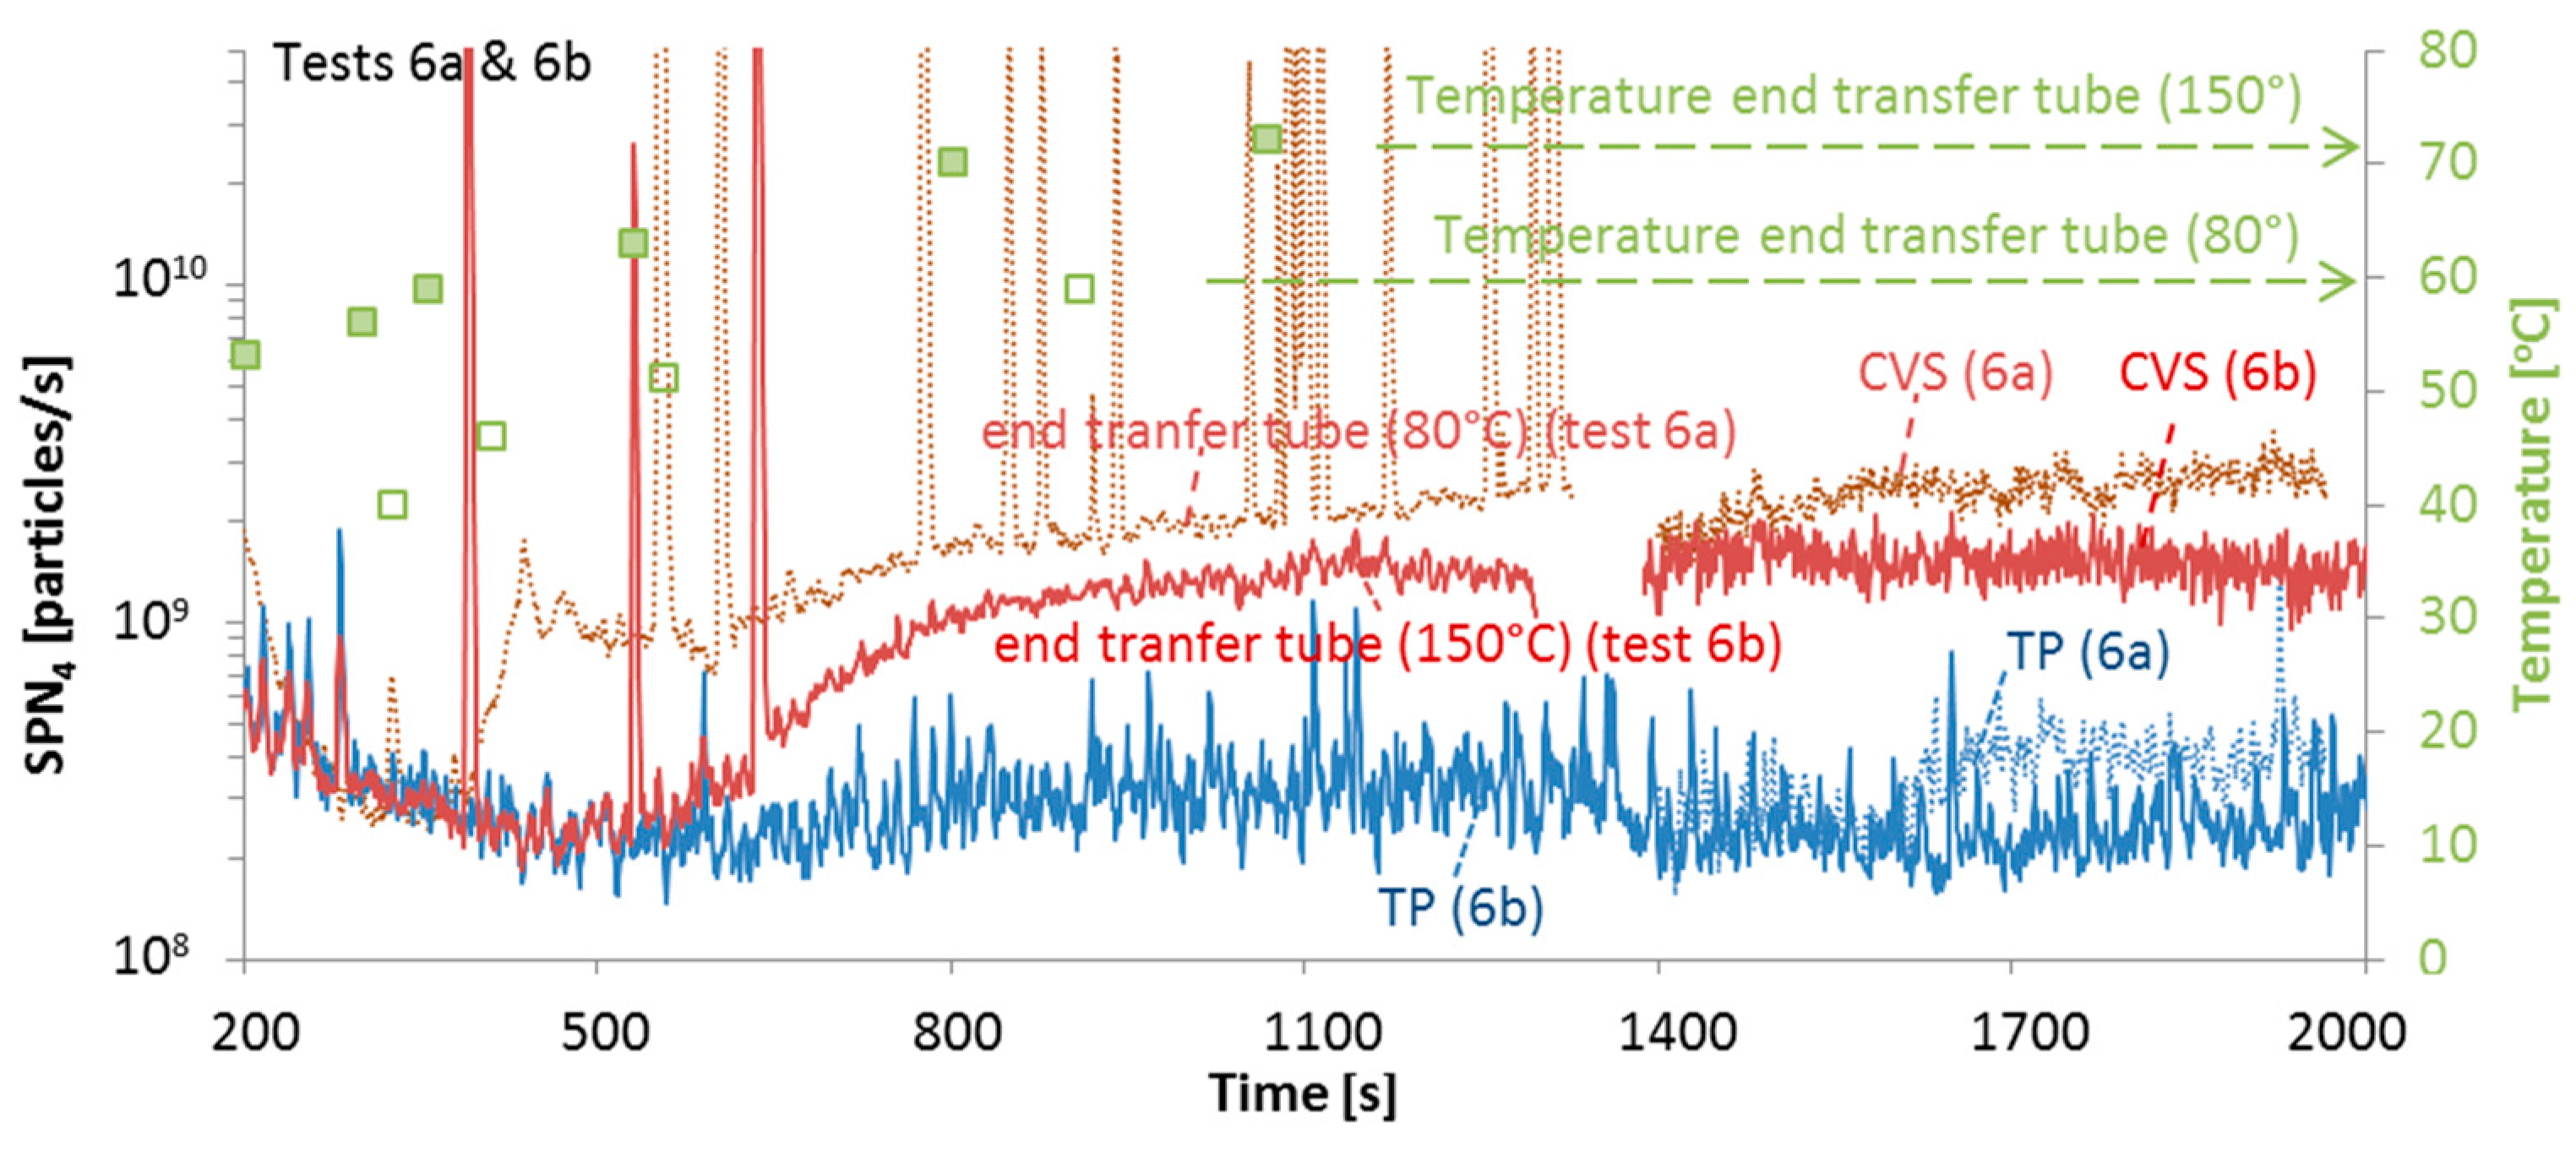
Figure 5 plots the SPN emissions at the end of the transfer tube and the dilution tunnel (CVS) and compares them with the tailpipe measurements (Tests 6a and 6b). The first measurement (6a) was with the transfer tube heated to 80 °C and PMP #2 sampling directly from the end of the transfer tube without a 0.5 m heated tube. The second measurement (6b) was conducted with the transfer tube heated at 150 °C and PMP #2 sampling via a 0.5 m tube heated at 120 °C. The spikes indicate water entering the PMP system; this was probably due to condensation at the wrong setup in the first case (PMP system without heated tube). In the second case there were no spikes, except at the beginning where the exhaust gas temperature at the sampling point was still below the dew point (around 53 °C for gasoline vehicles) [15]. Heating the transfer tube to 150 °C increased the final temperature at the end of the transfer tube from around 60 °C to approximately 72 °C (Figure 5, green squares). It delayed slightly the appearance of nonvolatile particles and their concentration was at lower level. However, the lower level could be due to the general decrease of nonvolatile particles concentration over time that was mentioned in Figure 2. When the PMP #2 system was transferred to the CVS (Figure 5, right side) the nonvolatile particle concentrations remained at the same levels, indicating that their complete formation took place in the transfer tube. Interestingly, the nonvolatile particles appeared at exhaust gas temperatures higher than the dew point.
4. Discussion
This study confirmed the findings of the previous study [11], that higher concentration of sub-23 nm nonvolatile particles may be measured at the dilution tunnel (2.6 × 10¹² p/km) than at the tailpipe (6.4 × 10¹⁰ p/km). It was shown for the first time that the higher concentrations were also detected at the end of the transfer tube to the dilution tunnel. The cold dilution that takes place at the dilution tunnel did not change their concentration. Also the concentration of total particles (including volatiles) was similar indicating that no additional homogeneous nucleation took place, thus all volatile material condensed (or heterogeneously nucleated) on pre-existing particles.
Cold dilution at the tailpipe and subsequent thermal pre-treatment or direct hot dilution had similar low concentrations of sub-23 nm particles confirming that it is not the cold dilution forming or growing the particles. Dilution of the whole exhaust and subsequent measurement at the dilution tunnel resulted in similar concentrations with direct hot measurements from the tailpipe. The dilution of the whole exhaust gas decreased the exhaust gas temperatures and consequently desorption of condensable species from the transfer tube that enhance the growth of particles. Extending these findings, it can be assumed that during dilution and cooling of the exhaust gas in the atmosphere, these particles would not form or they would remain < 4 nm.
Combining the previous findings, a likely scenario is that the moped emitted nanoclusters (particles in the 1–3 nm size range). Traffic related nanocluster-sized (1–3 nm) particles containing low volatility compounds have been reported recently [16,17,18,19,20]. Mopeds can emit hydrocarbons or polycyclic aromatic hydrocarbons (PAHs) [21,22,23], some of them with condensation/evaporation temperature (boiling point) around 350 °C (e.g., icosane, PAHs such as phenanthrene, anthracene). These nanoclusters may grow in the transfer tube to sizes detectable by the instrumentation due to heterogeneous nucleation and condensation of volatile material either emitted from the moped or desorbed from the transfer tube due to the high exhaust gas temperatures. The contribution of the desorbed material was confirmed by the open transfer tube test. Even though the dilution was only 2:1, no growth of particles took place. This means that high exhaust gas temperatures are needed to desorb semi-volatiles that will condense on the pre-existing particles during their residence time in the transfer tube and the gradual drop of the temperature. The reason that the particles are were not evaporated in the evaporation tube at 350 °C is due to their low volatility and kinetic restrictions (finite residence time in the evaporation tube) of the particle number measurement system [24]. This can partly explain why the nonvolatile particles were seen with the mopeds (residence time 15 s) [11], a motorcycle (residence time 3.5 s) [25], and less with another one (residence time 2.8) [25]. Pyrolysis as a mechanism of formation can be excluded, because increasing the temperature of the transfer tube from 80 °C to 150 °C did not increase or accelerate the formation or growth of these particles. Their formation in the particle number systems was excluded in a previous study and was confirmed in this one too.
In the previous study with the same moped [11] a counter with 50% counting efficiency of 2.5 nm still could not detect these particles at the tailpipe. With the instrumentation of this and the previous studies [11,25] the penetration of 4 nm particles is <5%, rendering it practically impossible to detect 1–3 nm nanoclusters and to determine whether the particles detected in the CVS are already present at the tailpipe even after cold dilution. Systems with relatively low particle losses [10] that can detect from 1 nm [26] would be necessary to investigate the existence of these particles at the tailpipe and distinguish the contribution of the vehicle from the transfer tube. The appearance of these sub-23 nm particles in the transfer tube due to formation or growth can be defined as a nonvolatile artefact, because these particles do not appear at the tailpipe with hot or cold dilution and they remain at sizes below the lower detection size of the measurement systems.
Although this study focused on a moped, formation of sub-23 nm particles was reported with motorcycles [25], a CNG (compressed natural gas) vehicle, and a diesel one during regeneration of the DPF (diesel particulate filter) [11]. Thus, attention is necessary when the exhaust gas temperature is high (on the order of 300 °C) and low volatility compounds are present either from the vehicle or the transfer tube.
The practical conclusion is that transfer tubes should be short with residence times on the order of the residence times in the evaporation tubes of the particle number measurement systems (i.e., <0.5 s). Practically it means that mixing-tees (diluters) should be used (i.e., dilution close to the tailpipe) for sub-23 nm measurements.
5. Conclusions
In order to investigate the differences reported between tailpipe and dilution tunnel particle number emissions, two identical systems were used to measure the exhaust gas of a moped under different sampling conditions. The systems comprised an evaporation tube at 350 °C in order to remove volatile and semi-volatile particles and condensation particle counters (CPCs) with lower detection limits at 4 nm, 10 nm, and 23 nm to measure nonvolatile particles. One system was measuring directly from the tailpipe under hot conditions, while the other was measured from the dilution tunnel or from the end of the transfer tube from tailpipe to dilution tunnel. For one test, a cold dilution was used upstream of the system connected to the tailpipe. For another test, the transfer tube was left open at the side connected to the moped. A final test was done with the system connected to the dilution tunnel with its heaters off.
The results showed that, while the 23 nm CPCs were measuring similar nonvolatile particle concentrations, the 10 nm and 4 nm CPCs started to deviate after 5 min of testing, with the CPCs at CVS measuring one order of magnitude higher. The concentrations at the CVS were at similar levels when the heaters were off and on, indicating that the particles pre-existed (i.e., they were emitted by the moped). The test with the system sampling from the end of the transfer tube showed that the high concentration was already detectable before the mixing at the dilution tunnel, indicating that the particles grew in the transfer tube and not in the dilution tunnel. Separate tests with cold dilution at the tailpipe confirmed that it is not the cold dilution that forms or grows the particles. A test with the transfer tube open at the moped side did not show high concentrations at the dilution tunnel, indicating that the pre-existing particles grew due to the desorbed material from the transfer tube at high exhaust gas temperatures.
The term nonvolatile artefact can be used to describe the appearance (growth) of these particles at the sub-23 nm CPCs at the dilution tunnel. However, the term should be used carefully, because in this study, the particles were not formed in the transfer tube, but pre-existed (i.e., were emitted by the moped) at sizes below the detection limit of the instruments; however they were grown due to the desorbed material from the transfer tube.
Future work for more detailed characterization and understanding of these particles needs sampling systems with low particle losses and particle counters that can measure from 1 nm. In addition to mopeds emissions, similar studies should be conducted to motorcycles, compressed natural gas (CNG) vehicles, and vehicles with particle filters during regenerations.
Funding
This research received no external funding.
Acknowledgments
The author would like to thank Athanasios Mamakos, Leonidas Ntziachristos, Yannis Drossinos and Tero Lähde for their helpful comments at an earlier draft version.
Conflicts of Interest
The author declares no conflict of interest.
Disclaimer
The opinions expressed in this manuscript are those of the author and should in no way be considered to represent an official opinion of the European Commission. Mention of trade names or commercial products does not constitute endorsement or recommendation by the author or the European Commission.
References
- Giechaskiel, B.; Lähde, T.; Suarez-Bertoa, R.; Clairotte, M.; Grigoratos, T.; Zardini, A.; Perujo, A.; Martini, G. Particle number measurements in the European legislation and future JRC activities. Combust. Engines 2018, 174, 3–16. [Google Scholar]
- Giechaskiel, B.; Maricq, M.; Ntziachristos, L.; Dardiotis, C.; Wang, X.; Axmann, H.; Bergmann, A.; Schindler, W. Review of motor vehicle particulate emissions sampling and measurement: From smoke and filter mass to particle number. J. Aerosol Sci. 2014, 67, 48–86. [Google Scholar] [CrossRef]
- Giechaskiel, B.; Mamakos, A.; Andersson, J.; Dilara, P.; Martini, G.; Schindler, W.; Bergmann, A. Measurement of Automotive Nonvolatile Particle Number Emissions within the European Legislative Framework: A Review. Aerosol Sci. Technol. 2012, 46, 719–749. [Google Scholar] [CrossRef]
- Giechaskiel, B.; Dilara, P.; Andersson, J. Particle Measurement Programme (PMP) Light-Duty Inter-Laboratory Exercise: Repeatability and Reproducibility of the Particle Number Method. Aerosol Sci. Technol. 2008, 42, 528–543. [Google Scholar] [CrossRef]
- Isella, L.; Giechaskiel, B.; Drossinos, Y. Diesel-exhaust aerosol dynamics from the tailpipe to the dilution tunnel. J. Aerosol Sci. 2008, 39, 737–758. [Google Scholar] [CrossRef]
- Giechaskiel, B.; Lähde, T.; Drossinos, Y. Regulating particle number measurements from the tailpipe of light-duty vehicles: The next step. Environ. Res. 2019, 172, 1–9. [Google Scholar] [CrossRef]
- Czerwinski, J.; Comte, P.; Mayer, A.; Reutimann, F. Investigations of Changes of the 2-Stroke Scooters Nanoparticles in the Exhaust- and CVS-System; SAE Technical Paper Series, 2013-24-0178; SAE International: Warrendale, PA, USA, 2013. [Google Scholar]
- Giechaskiel, B.; Zardini, A.; Martini, G. Particle Emission Measurements from L-Category Vehicles. SAE Int. J. Engines 2015, 8, 2322–2337. [Google Scholar] [CrossRef]
- Giechaskiel, B.; Manfredi, U.; Martini, G. Engine Exhaust Solid Sub-23 nm Particles: I. Literature Survey. SAE Int. J. Fuels Lubr. 2014, 7, 950–964. [Google Scholar] [CrossRef]
- Giechaskiel, B.; Vanhanen, J.; Väkevä, M.; Martini, G. Investigation of vehicle exhaust sub-23 nm particle emissions. Aerosol Sci. Technol. 2017, 51, 626–641. [Google Scholar] [CrossRef] [Green Version]
- Giechaskiel, B. Differences between tailpipe and dilution tunnel sub-23 nm non-volatile (solid) particle number measurements. Aerosol Sci. Technol. 2019, 1–13. [Google Scholar] [CrossRef]
- Giechaskiel, B.; Cresnoverh, M.; Jörgl, H.; Bergmann, A. Calibration and accuracy of a particle number measurement system. Meas. Sci. Technol. 2010, 21, 45102. [Google Scholar] [CrossRef]
- Giechaskiel, B.; Wang, X.; Horn, H.-G.; Spielvogel, J.; Gerhart, C.; Southgate, J.; Jing, L.; Kasper, M.; Drossinos, Y.; Krasenbrink, A. Calibration of Condensation Particle Counters for Legislated Vehicle Number Emission Measurements. Aerosol Sci. Technol. 2009, 43, 1164–1173. [Google Scholar] [CrossRef]
- Varella, R.A.; Giechaskiel, B.; Sousa, L.; Duarte, G. Comparison of Portable Emissions Measurement Systems (PEMS) with Laboratory Grade Equipment. Appl. Sci. 2018, 8, 1633. [Google Scholar] [CrossRef]
- Giechaskiel, B.; Zardini, A.A.; Clairotte, M. Exhaust Gas Condensation during Engine Cold Start and Application of the Dry-Wet Correction Factor. Appl. Sci. 2019, 9, 2263. [Google Scholar] [CrossRef]
- Rönkkö, T.; Kuuluvainen, H.; Karjalainen, P.; Keskinen, J.; Hillamo, R.; Niemi, J.V.; Pirjola, L.; Timonen, H.J.; Saarikoski, S.; Saukko, E.; et al. Traffic is a major source of atmospheric nanocluster aerosol. Proc. Natl. Acad. Sci. USA 2017, 114, 7549–7554. [Google Scholar] [CrossRef] [Green Version]
- Kontkanen, J.; Lehtipalo, K.; Ahonen, L.; Kangasluoma, J.; Manninen, H.E.; Hakala, J.; Rose, C.; Sellegri, K.; Xiao, S.; Wang, L.; et al. Measurements of sub-3 nm particles using a particle size magnifier in different environments: From clean mountain top to polluted megacities. Atmos. Chem. Phys. Discuss. 2017, 17, 2163–2187. [Google Scholar] [CrossRef]
- Kangasniemi, O.; Kuuluvainen, H.; Heikkilä, J.; Pirjola, L.; Niemi, J.V.; Timonen, H.; Saarikoski, S.; Rönkkö, T.; Dal Maso, M. Dispersion of a traffic related nanocluster aerosol near a major road. Atmosphere 2019, 10, 309. [Google Scholar] [CrossRef]
- Spezzano, P.; Picini, P.; Cataldi, D.; Messale, F.; Manni, C.; Santino, D. Particle-phase polycyclic aromatic hydrocarbon emissions from non-catalysed, in-use four-stroke scooters. Environ. Monit. Assess. 2007, 133, 105–117. [Google Scholar] [CrossRef]
- Sgro, L.A.; Sementa, P.; Vaglieco, B.M.; Rusciano, G.; D’Anna, A.; Minutolo, P. Investigating the origin of nuclei particles in GDI engine exhausts. Combust. Flame 2012, 159, 1687–1692. [Google Scholar] [CrossRef]
- Yang, H.-H.; Hsieh, L.-T.; Liu, H.-C.; Mi, H.-H. Polycyclic aromatic hydrocarbon emissions from motorcycles. Atmos. Environ. 2005, 39, 17–25. [Google Scholar] [CrossRef]
- Pham, C.T.; Kameda, T.; Toriba, A.; Hayakawa, K. Polycyclic aromatic hydrocarbons and nitropolycyclic aromatic hydrocarbons in particulates emitted by motorcycles. Environ. Pollut. 2013, 183, 175–183. [Google Scholar] [CrossRef]
- Cheruyiot, N.K.; Lee, W.-J.; Mwangi, J.K.; Wang, L.-C.; Lin, N.-H.; Lin, Y.-C.; Cao, J.; Zhang, R.; Chang-Chien, G.-P. An Overview: Polycyclic Aromatic Hydrocarbon Emissions from the Stationary and Mobile Sources and in the Ambient Air. Aerosol Air Qual. Res. 2015, 15, 2730–2762. [Google Scholar] [CrossRef] [Green Version]
- Burtscher, H. Physical characterization of particulate emissions from diesel engines: A review. J. Aerosol Sci. 2005, 36, 896–932. [Google Scholar] [CrossRef]
- Giechaskiel, B.; Zardini, A.A.; Lähde, T.; Perujo, A.; Kontses, A.; Ntziachristos, L. Particulate Emissions of Euro 4 Motorcycles and Sampling Considerations. Atmosphere 2019, 10, 421. [Google Scholar] [CrossRef]
- Vanhanen, J.; Mikkilä, J.; Lehtipalo, K.; Sipilä, M.; Manninen, H.E.; Siivola, E.; Petäjä, T.; Kulmala, M. Particle Size Magnifier for Nano-CN Detection. Aerosol Sci. Technol. 2011, 45, 533–542. [Google Scholar] [CrossRef]
Figure 1.
Experimental setup with two PMP systems at position 1 (PMP #1) and 2 or 3 (PMP #2). Exhaust gas temperatures at the different positions are also given. Square inset plots the open transfer tube configuration. Oval inset plots the cold dilution TP configuration with a mixing diluter. CPC = Condensation particle counter; CVS = Constant volume sampling; ET = Evaporation tube; PMP = Particle Measurement Programme; PND = Diluter; TP = Tailpipe.

Figure 2.
Solid particle number (SPN) emission rates at the tailpipe (TP) and the dilution tunnel (CVS) at the first (Test 1) and last test (Test 7) of the measurement campaign (default settings). The temperature at position 1 (TP) is also plotted.
Figure 2.
Solid particle number (SPN) emission rates at the tailpipe (TP) and the dilution tunnel (CVS) at the first (Test 1) and last test (Test 7) of the measurement campaign (default settings). The temperature at position 1 (TP) is also plotted.

Figure 3.
Total particle number (TPN) at the dilution tunnel (CVS) (orange lines, test 4) and solid particle number (SPN) at the tailpipe (TP) (blue lines, test 4) and the CVS (red lines, tests 1 and 5).
Figure 3.
Total particle number (TPN) at the dilution tunnel (CVS) (orange lines, test 4) and solid particle number (SPN) at the tailpipe (TP) (blue lines, test 4) and the CVS (red lines, tests 1 and 5).

Figure 4.
Solid particle number (SPN) emission rates for particles > 4 nm at the tailpipe (TP) and the dilution tunnel (CVS) with different configurations. The temperature at position 1 (TP) is also plotted.
Figure 4.
Solid particle number (SPN) emission rates for particles > 4 nm at the tailpipe (TP) and the dilution tunnel (CVS) with different configurations. The temperature at position 1 (TP) is also plotted.

Figure 5.
Solid particle number (SPN) emission rates for particles > 4 nm at the tailpipe (TP), the end of the transfer tube heated at 80 °C or 150 °C, and the dilution tunnel (CVS). The temperature at position 2 (end of transfer tube) is also plotted. Tests 6a and 6b.
Figure 5.
Solid particle number (SPN) emission rates for particles > 4 nm at the tailpipe (TP), the end of the transfer tube heated at 80 °C or 150 °C, and the dilution tunnel (CVS). The temperature at position 2 (end of transfer tube) is also plotted. Tests 6a and 6b.


Table 1.
Chronological order and experimental details of the various test configurations.
| Test | Test Configuration | PMP #1 at Position 1 * | PMP #2 (Position) |
|---|---|---|---|
| 1,5,7 | Default | Heaters on | Heaters on (position 3) |
| 2 | Open transfer tube | Heaters on | Heaters on (position 3) |
| 3 | Cold dilution TP | Mixing diluter 6:1, Heaters on | Heaters on (position 3) |
| 4 | Cold dilution CVS | Heaters on | Heaters off (position 3) |
| 6 | End transfer tube | Heaters on | Heaters on (position 2) * |
* The PMP #1 at position 1 had additionally a 0.5 m heated (120 °C) tube, except at “Cold dilution TP” where it was switched off and was measuring downstream of the mixing diluter. PMP #2 at position 2 was used with the 0.5 m heated (120 °C) tube. CVS = Constant volume sampling; PMP = Particle Measurement Programme; TP = Tailpipe.
© 2019 by the author. Licensee MDPI, Basel, Switzerland. This article is an open access article distributed under the terms and conditions of the Creative Commons Attribution (CC BY) license (http://creativecommons.org/licenses/by/4.0/).
Share and Cite
MDPI and ACS Style
Giechaskiel, B. Effect of Sampling Conditions on the Sub-23 nm Nonvolatile Particle Emissions Measurements of a Moped. Appl. Sci. 2019, 9, 3112. https://0-doi-org.brum.beds.ac.uk/10.3390/app9153112
AMA Style
Giechaskiel B. Effect of Sampling Conditions on the Sub-23 nm Nonvolatile Particle Emissions Measurements of a Moped. Applied Sciences. 2019; 9(15):3112. https://0-doi-org.brum.beds.ac.uk/10.3390/app9153112
Chicago/Turabian StyleGiechaskiel, Barouch. 2019. "Effect of Sampling Conditions on the Sub-23 nm Nonvolatile Particle Emissions Measurements of a Moped" Applied Sciences 9, no. 15: 3112. https://0-doi-org.brum.beds.ac.uk/10.3390/app9153112
Note that from the first issue of 2016, this journal uses article numbers instead of page numbers. See further details here.