A Bench Evaluation Test for Refrigeration Oils in a Refrigeration System Using a Screw Compressor

1
School of Energy and Power Engineering, Xi’an Jiaotong University, Xi’an 710049, China
2
School of Engineering, University of Tasmania, Hobart TAS7001, Australia
*
Author to whom correspondence should be addressed.
Appl. Sci. 2019, 9(15), 3202; https://0-doi-org.brum.beds.ac.uk/10.3390/app9153202
Submission received: 21 July 2019
/
Revised: 29 July 2019
/
Accepted: 1 August 2019
/
Published: 6 August 2019
(This article belongs to the Section Mechanical Engineering)
Abstract
:Refrigeration oil has a large effect on the performance of refrigeration systems. However, the physical and chemical indexes of fresh refrigeration oils often fail to reflect the actual operating characteristics, especially with respect to the degradation of refrigeration oils. In this paper, a bench evaluation test of refrigeration oils was carried out to investigate the degradation of synthetic refrigeration oils used with the refrigerant R134a, in a purpose-built, full-scale refrigeration system utilizing a screw compressor. To accelerate the degradation process of the refrigeration oil, the discharge temperature at the exit of the compressor was turned to a high level. Comparison tests of a mature refrigeration oil type A and a newly developed oil type B were performed under the same working conditions with 500 h of operating time. The performance of the screw compressor and refrigeration system was analyzed. The abrasion of the screw rotors and carbon deposition at the discharge port was investigated. Results showed that the bench evaluation test successfully predicted the degradation process of the refrigeration oils. The evolution analysis of the refrigeration oil viscosity and acid value during the bench evaluation test indicated that 15% of the physical and chemical indexes for refrigeration oil drain were too strict. Research work in this paper showed a more practical method to evaluate the performance of refrigeration oils through the bench evaluation test.
1. Introduction
Refrigeration oil is very important for lubricating, sealing, cooling and clearing the system of unwanted particles in the flow [1] in vapor compression refrigeration systems. In addition, the oil can decrease the vibration of the compressor [2]. This topic has been widely researched, and several standards have been formulated to select refrigeration oils for different types of compressors. These standards suggested different physical and chemical indexes for compressors under varying operating conditions. Thus, most research focused on the characteristics of fresh refrigeration oil. However, the physical and chemical indexes of fresh refrigeration oils sometimes failed to reflect the actual operating characteristics [3]. Performance tests of the refrigeration oil in refrigeration systems were often recommended for evaluating refrigeration oils.
When the fresh refrigeration oil is injected into the compressor, chemical reactions, such as oxidation and decomposition during the compression process, result in degradation of the refrigeration oil [4]. These changes then alter the physical and chemical indexes, leading to failure of the fluid to provide proper lubrication. Reaction principles of lubricant oils for engines have also been well researched. The degradation was mainly caused by chemical reactions, while the reaction speed was related to the working temperature [5]. In addition to these studies, chemical models of the effects of the oil on different components within the system were related to the temperature [6]. For refrigerant oil, the chemical situation is much clearer, due to no oxidizing agent being present in the system. Thus, considering degradation, synthetic oil often performs better than mineral oil, due to its high chemical stability. It is reported that biodegradable lubricants could be used in the refrigeration system, but have not yet been widely applied in compressors [7,8] due to the problem of degradation. Compared to the fresh refrigeration oil, physical and chemical indexes of the used refrigeration oil are more important to predict the oil life. Thus, research works have been carried out to determine the physical and chemical indexes for the oil drain. Standards, such as DIN 51503-2, suggest ±15% of viscosity and acid value for the oil drain. For this reason, a bench evaluation test is often recommended to investigate the newly developed fresh oil. Since the degradation of the oil is long, the accelerated life test method is adopted. According to the literature [9], the rate of oil aging (degradation) is doubled if its working temperature is increased by 10 °C. Thus, a bench evaluation test of the fresh oil for air compressors can be carried out easily, because the oxidation of the fresh oil in an air compressor is accelerated. Such bench evaluation test results of lubricating oils for the reciprocating air compressors and screw air compressors have been applied successfully [10]. Another method to evaluate the oil drain is to monitor the status of the lubricating oil during operation by continuously testing the metal content in the lubricating oil [11]. However, such a test system is quite complicated.
This issue becomes even more complicated when refrigeration oil is considered. Apart from the standard physical and chemical indexes of the refrigeration oil, the concentration of the refrigeration oil in the refrigerant is also an important factor in the refrigeration system [12] that adds another dimension of complexity to the analysis. Many research efforts have focused on both the oil concentration, as well as physical and chemical indexes of the refrigeration oil [13]. Li et al. [3] investigated the effects of refrigeration oil on the performance of an R600a refrigerator with a reciprocating compressor, using bench evaluation tests. However, very little literature was found to focus on bench evaluation tests for the life of the refrigerator oil. Furthermore, it was reported recently that refrigeration oils with nanoparticles could enhance the refrigeration capacity and stability of the compressor [14,15], although the actual performance of such refrigeration oil is yet to be evaluated.
In this paper, an accelerated bench evaluation test system was developed for the purpose of investigating the refrigeration oil performance in an actual R134a refrigeration system. Two types of synthetic refrigeration oils, a mature refrigeration oil type A and a newly developed refrigeration oil type B, were investigated using this accelerated bench evaluation test system. Each test of the refrigeration oils were controlled under the same working conditions, with 500 h of running time. The degradation process of the refrigeration oil and viscosity evolution of the refrigeration oil were used as the performance indexes for the refrigeration oil evaluation. This research work provides a useful tool for researchers to investigate the effect of refrigeration oil on the performance of refrigeration systems.
2. The Theoretical Basis of an Accelerated Degradation Bench Test
Synthetic fluids often lose their structural integrity via thermal, oxidative, and chemical degradation [1]. Increases in these reactions would result in an increase in degradation speed, resulting in low service life of the refrigeration oil. The degradation speed is related to chemical substances, temperature, and pressure. For most lubricants, the temperature is the main influential factor. The relationship between temperature and useful life time of many synthetic lubricants has been tested, as shown in references [16,17]. It is found that the correlation of the synthetic lubricants between the working temperature, T, and the service lifetime, H, can be described by the following equation:
where a and b are coefficients as shown in Table 1.
It can be seen that the coefficient a for these oils is similar, between −0.0295 and −0.03. If the average value −0.0296 was taken as the coefficient a for all of those oils, the lifetime of the lubricant oil under working temperature T1 and T2, representing the real operation temperature and the accelerated test temperature, respectively, would be calculated in the following equation:
Therefore, the service time of the accelerated test can be obtained by Equation (2) with the combination of the lifetime under the real operation and the two temperature values. According to this equation, if the working temperature was increased by 10 °C, the lifetime would be reduced by 50%. This provides the theoretical base for the accelerated degradation bench test. In this paper, in order to evaluate the lifetime of the refrigeration oil, the discharge temperature of the compressor is controlled to be much higher than normal working temperature in the actual refrigeration system. The refrigerant R134a is used as the working refrigerant in the experimental study, and the standard operating conditions are listed in Table 2.
To accelerate the degradation process of the refrigeration oil, the discharge temperature of the studied compressor is increased to 94 °C. The testing condition is shown in Table 3.
According to Equation (2), 100 h of service time of the refrigeration oil in the test bench system is equivalent to about 1668 h of service time in an actual system under the standard operating condition. Thus, 500 h of operating time under the experimental working conditions are set to evaluate the performance of the refrigeration oil for the oil service time of about 8300 h under the standard operating conditions. The viscosity and acid value are chosen as the main evaluation indexes. According to German Standard of Lubricants-Refrigerator oils-Part 2 (DIN 51503-2), if the change of the viscosity and acidity of the refrigeration oil is less than 15%, the oil is considered to successfully pass the test.
3. Experimental Setup
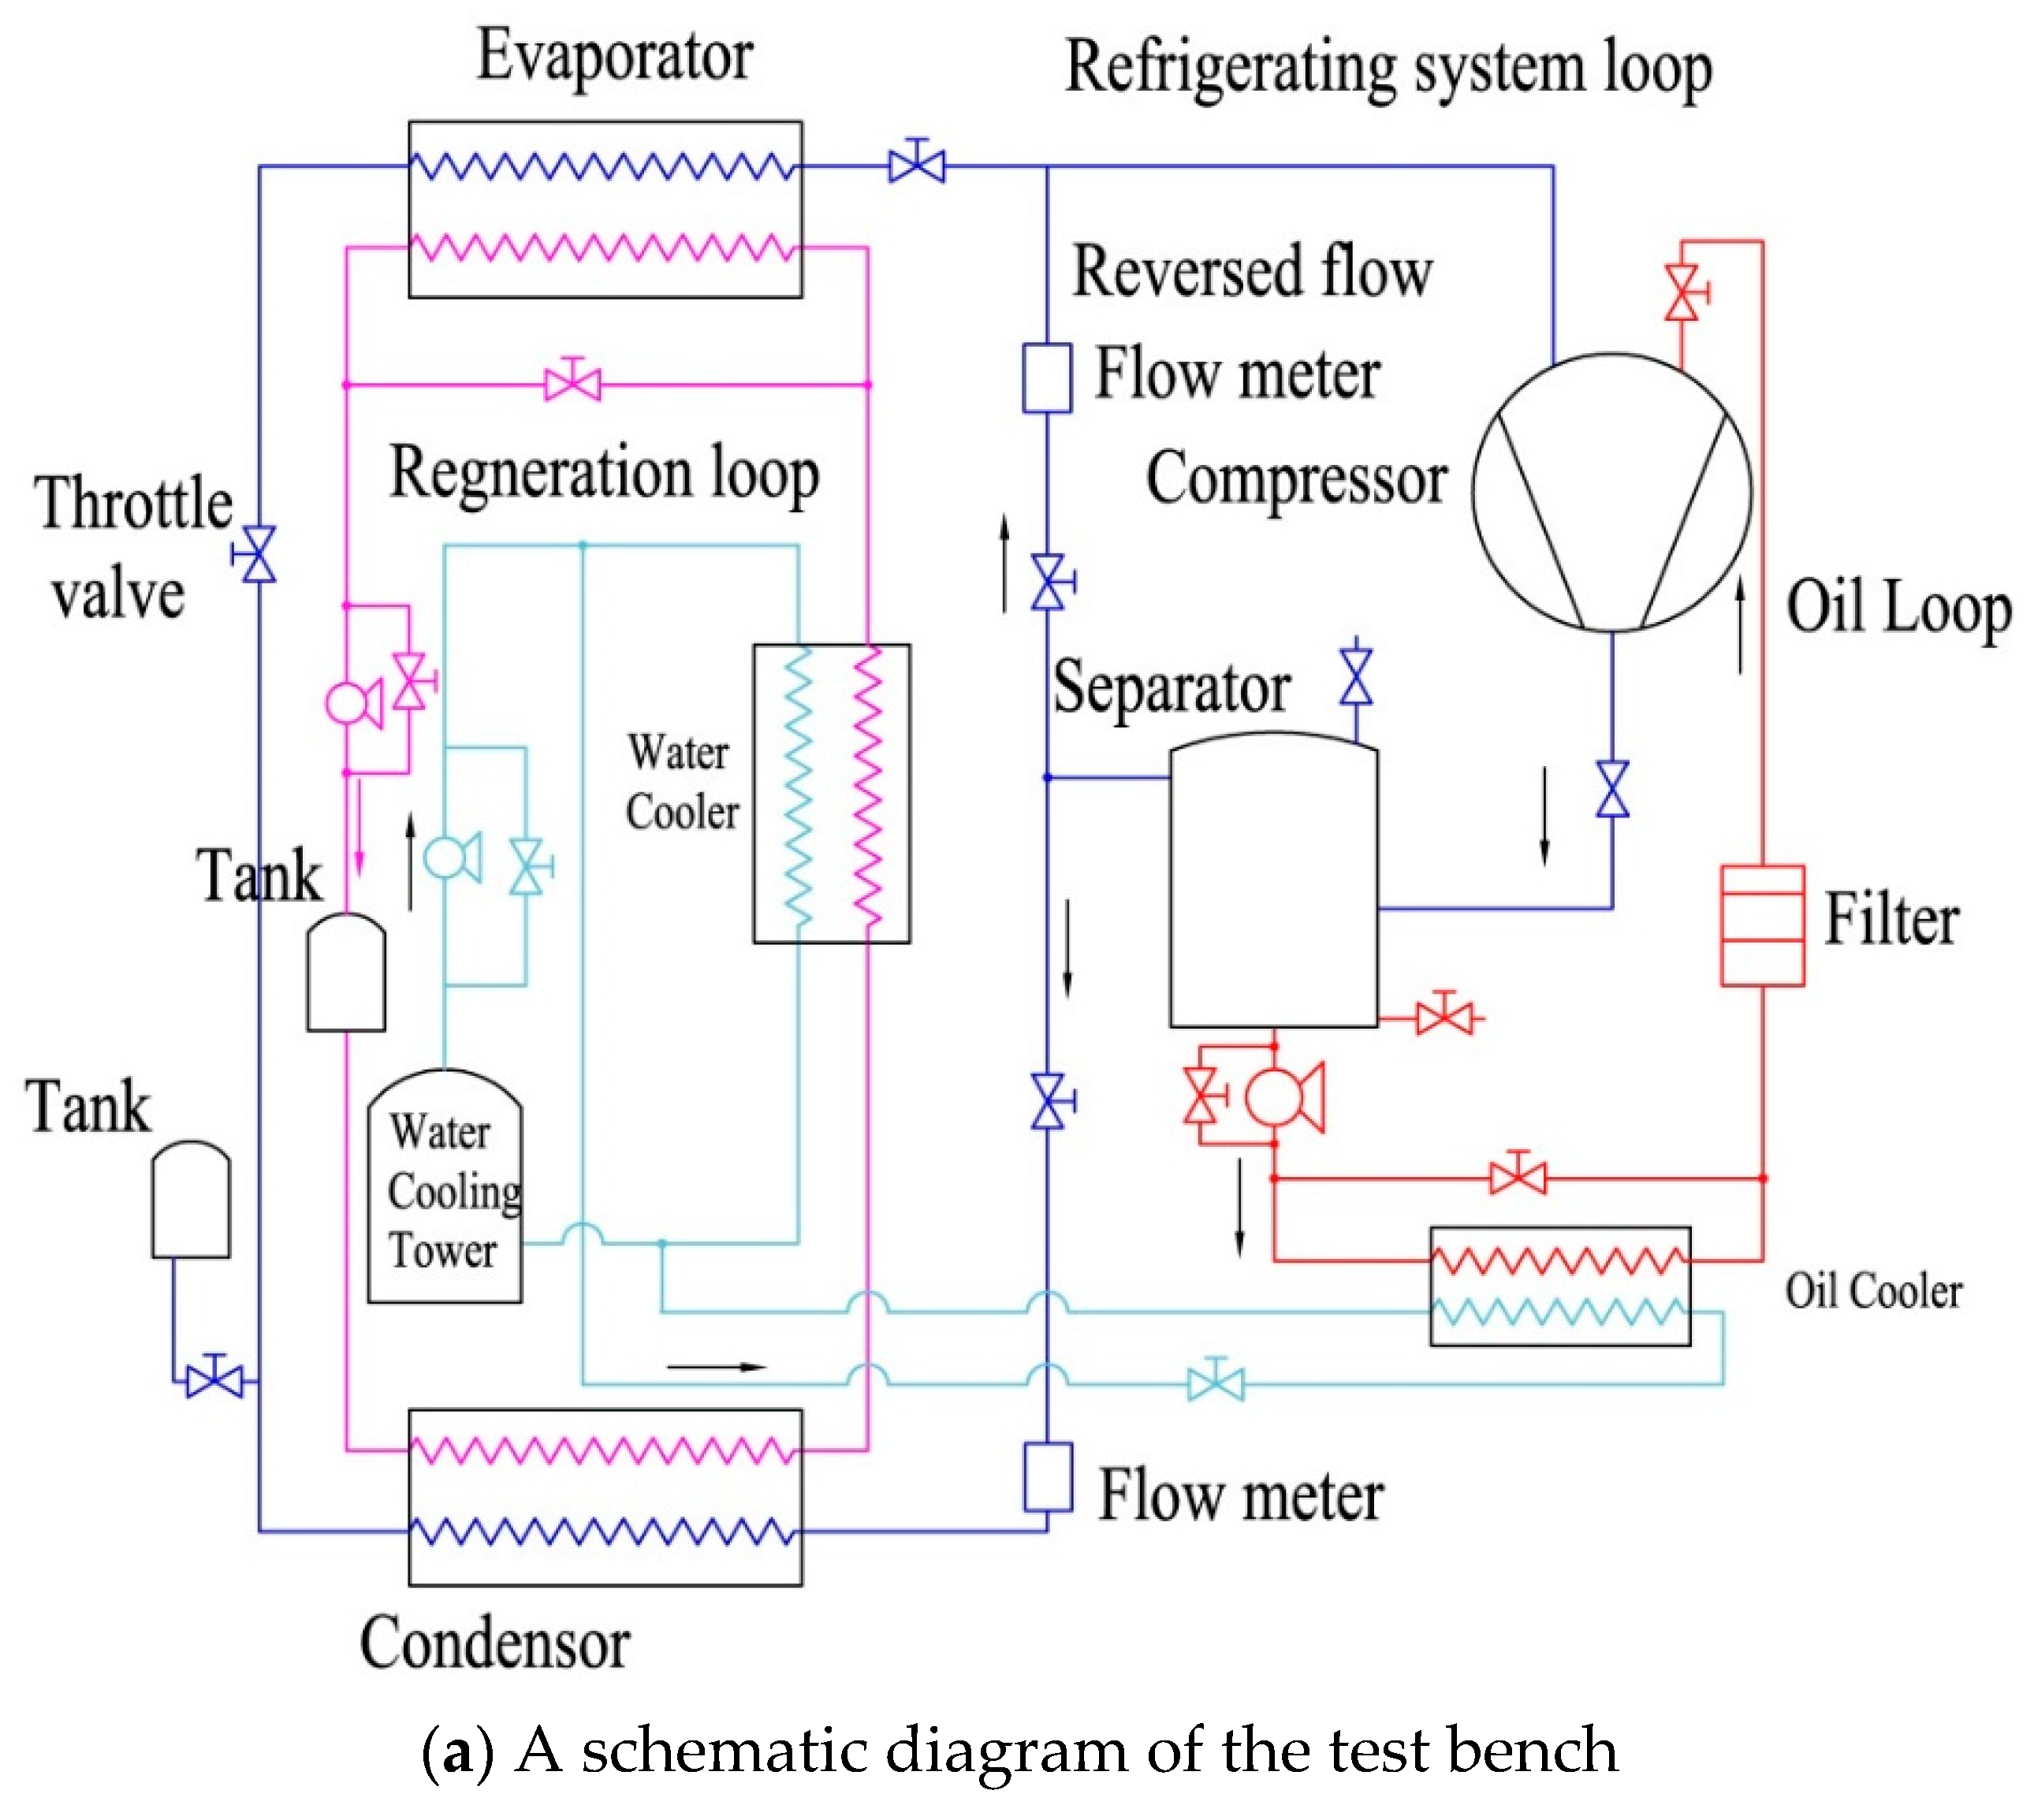
Figure 1 shows a schematic diagram and a picture of the experimental test bench. It consists of three loops, being the refrigerating system loop, the regeneration loop, and the oil circulation loop. In the refrigerating loop, the refrigerant flows into the compressor, where it mixes with the oil. The refrigerant-oil mixture is discharged from the compressor into the separator, where the refrigerant and oil separates. The refrigerant vapor flows to the condenser, where it is condensed and then is throttled into the evaporator. In the evaporator, the refrigerant absorbs the thermal energy from the regeneration loop and vaporizes. Then the refrigerant vapor enters the compressor, and the next cycle starts. The lubricating oil is injected into the refrigerant in the compression chamber to cool the compressed refrigerant vapor. At the same time, the oil seals the compressor linkage path and lubricates the compressor. In the regeneration loop, water circulates between the condenser and evaporator to transfer the thermal energy from the condenser to the evaporator. In the oil circulation loop, the oil separated from the separator flows into the oil-water heat exchanger, where it is cooled by the cooling water from the cooling tower. The cold oil is then introduced to the compressor. Some of the oil is injected into the compression chamber to cool the compressed refrigerant vapor, in order to control the discharge refrigerant temperature, while the remaining oil is used to lubricate the bearings of the compressor.
In order to control the discharge temperature and ensure that the compressor operates under a reasonable load near the standard working conditions, two technical measures are adopted in the experiment. Firstly, a reversed flow bypass is set from the outlet of the separator to the suction pipe of the compressor to introduce high-temperature refrigerant back to the suction of the compressor to increase the discharge temperature. By adopting this method, the compressor discharge pressure can be controlled to the desired level. Secondly, a side pipe is set across the side of the oil cooler, to increase the temperature of the injected oil, to then control the discharge temperature of the compressor.
All the pressures and temperatures are measured using pressure sensors and thermocouples, respectively. High precision K-type thermocouples are used to record the temperature with an accuracy of ±1 °C and are calibrated from −50 to 200 °C. The pressure transducers are Kulite XTM-190 pressure transducers with an accuracy of ±1% FSO (35 bar). Those pressure transducers are also verified using high precision pressure gauges. A mass flowmeter with an accuracy of ±0.2% from 0 to 40 kg/h is used to measure the flow rate of the refrigerant in the refrigeration system.
A screw compressor is applied in the experimental system and its parameters are listed in Table 4. The experimental operating conditions are listed in Table 3. Before testing, a helium mass spectrometer (leak detector) is used to check the seal performance. A vacuum-pumping system is then used to ensure the standard vacuum condition in the system before the refrigerant is charged.
4. Results and Discussion
To examine the performance of the accelerated bench test, two types of synthetic oils are used in the study. The first one is a mature synthetic refrigeration oil (Type A oil), which has been successfully applied in R134a refrigeration systems. The standard service life of this mature oil is more than 8000 h. If the bench test is effective, this oil should pass the test. This test provides a base for the evaluation of a newly developed synthetic refrigeration oil (Type B) which is applied in the test to predict its service life. The stability of the compressor and refrigeration system is first evaluated via the variation of discharge temperature, refrigeration capacity and compressor efficiency. Then, the degradation progress of the oils is further evaluated by analyzing the viscosity, flash point and an acid value of the oil samples extracted from the system every 70 h during the operation.
4.1. General Performance of the Compressor and Refrigeration System
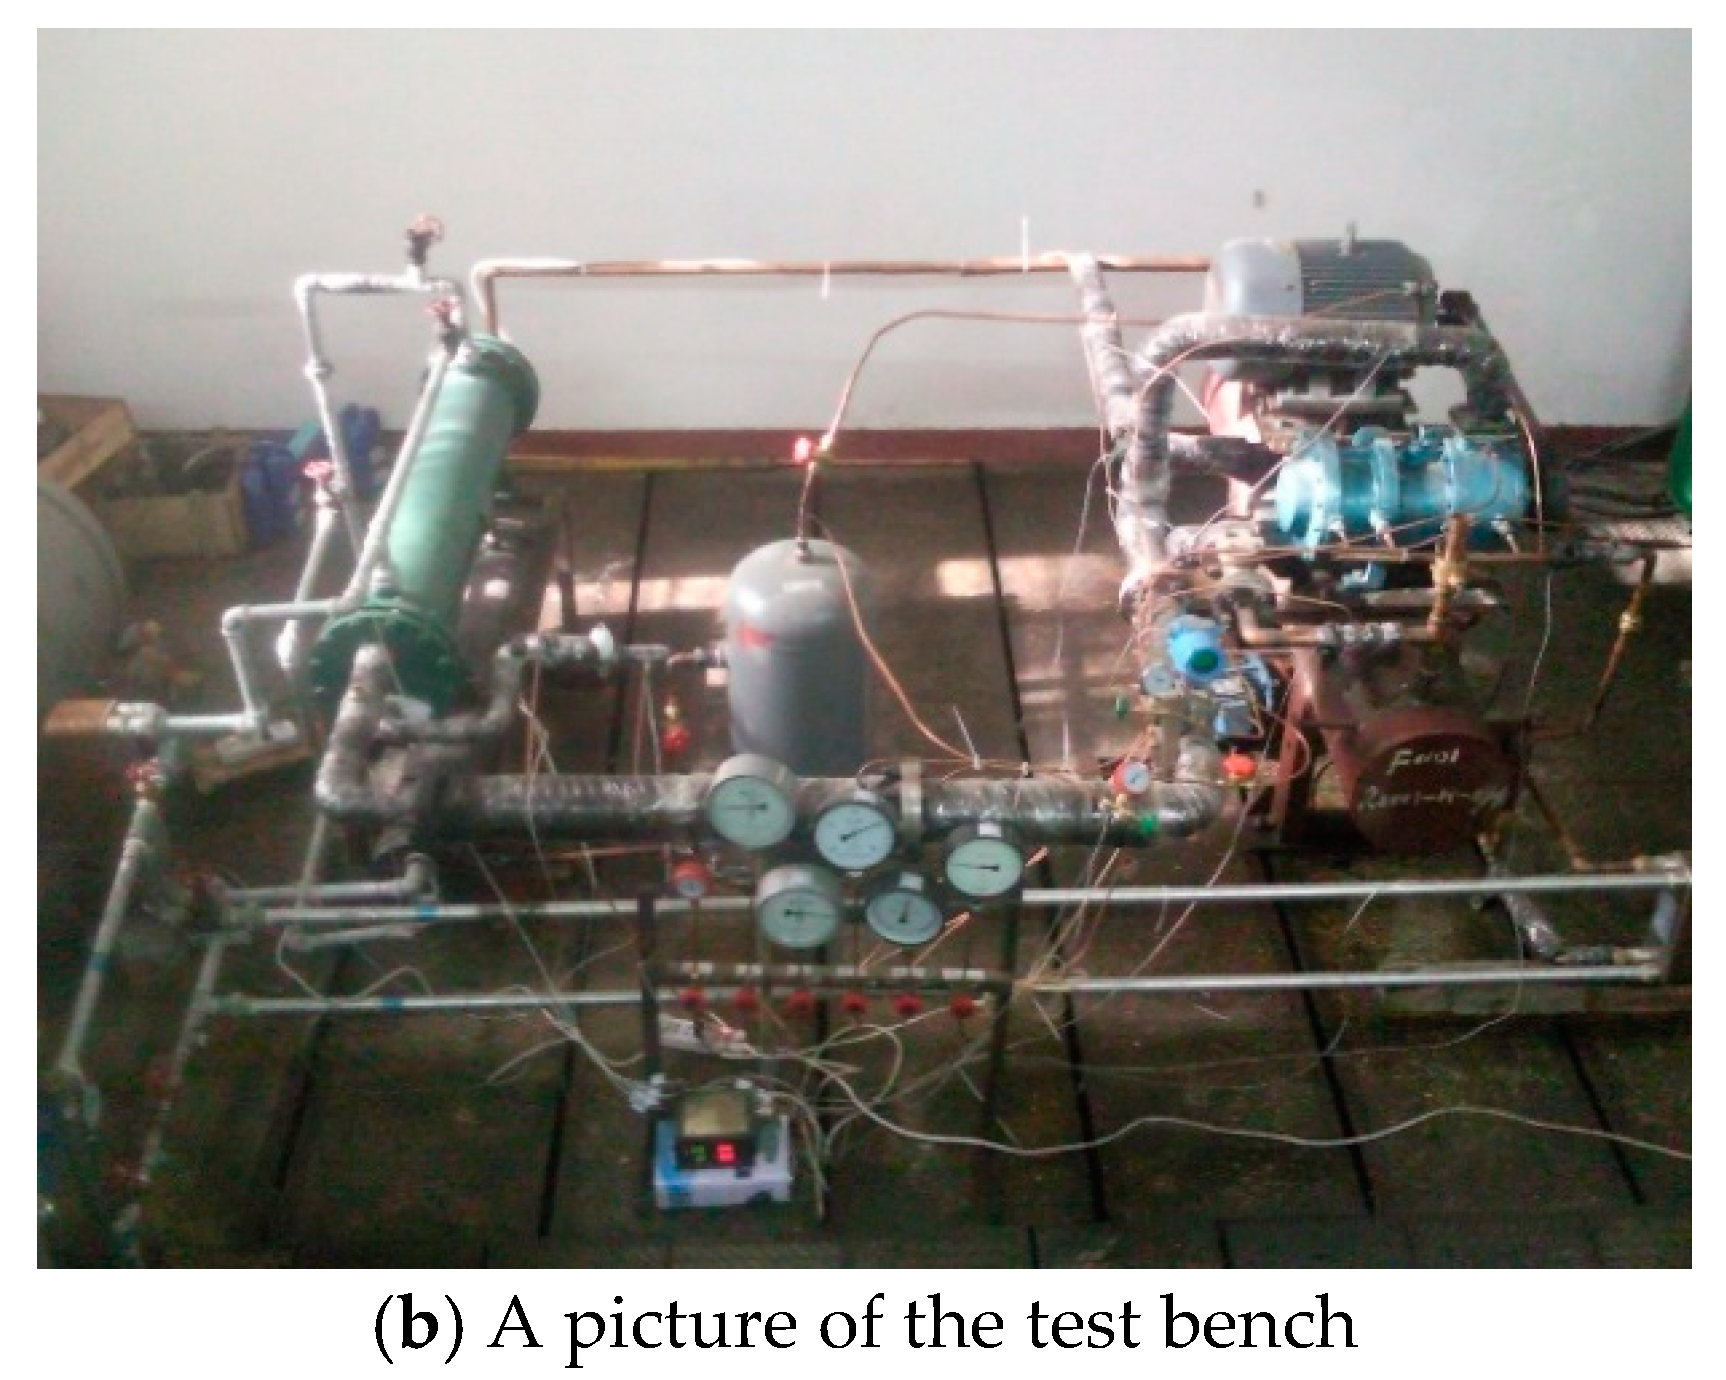
Figure 2 shows the discharge temperature of the compressor and refrigeration capacity of the system during the first 500 h of operation. It should be noted that the refrigeration capacity of the system is lower than the actual refrigeration capacity, since a reversed refrigerant flow bypass is introduced from the discharge to the suction of the compressor. However, it is important to use this refrigeration capacity as a reference to indicate the stability of the system. Figure 2a showed that the discharge temperature varies from 93 °C to 94 °C for the mature oil and from 91 °C to 93 °C for the newly developed oil. The refrigeration capacity varies from 11.25 kW to 11.75 kW for both oils. By considering the measurement error shown by the error bars in the figures, both discharge temperature and refrigeration capacity are quite stable during the test. This indicates that both oils are good for the application in the actual refrigeration system.
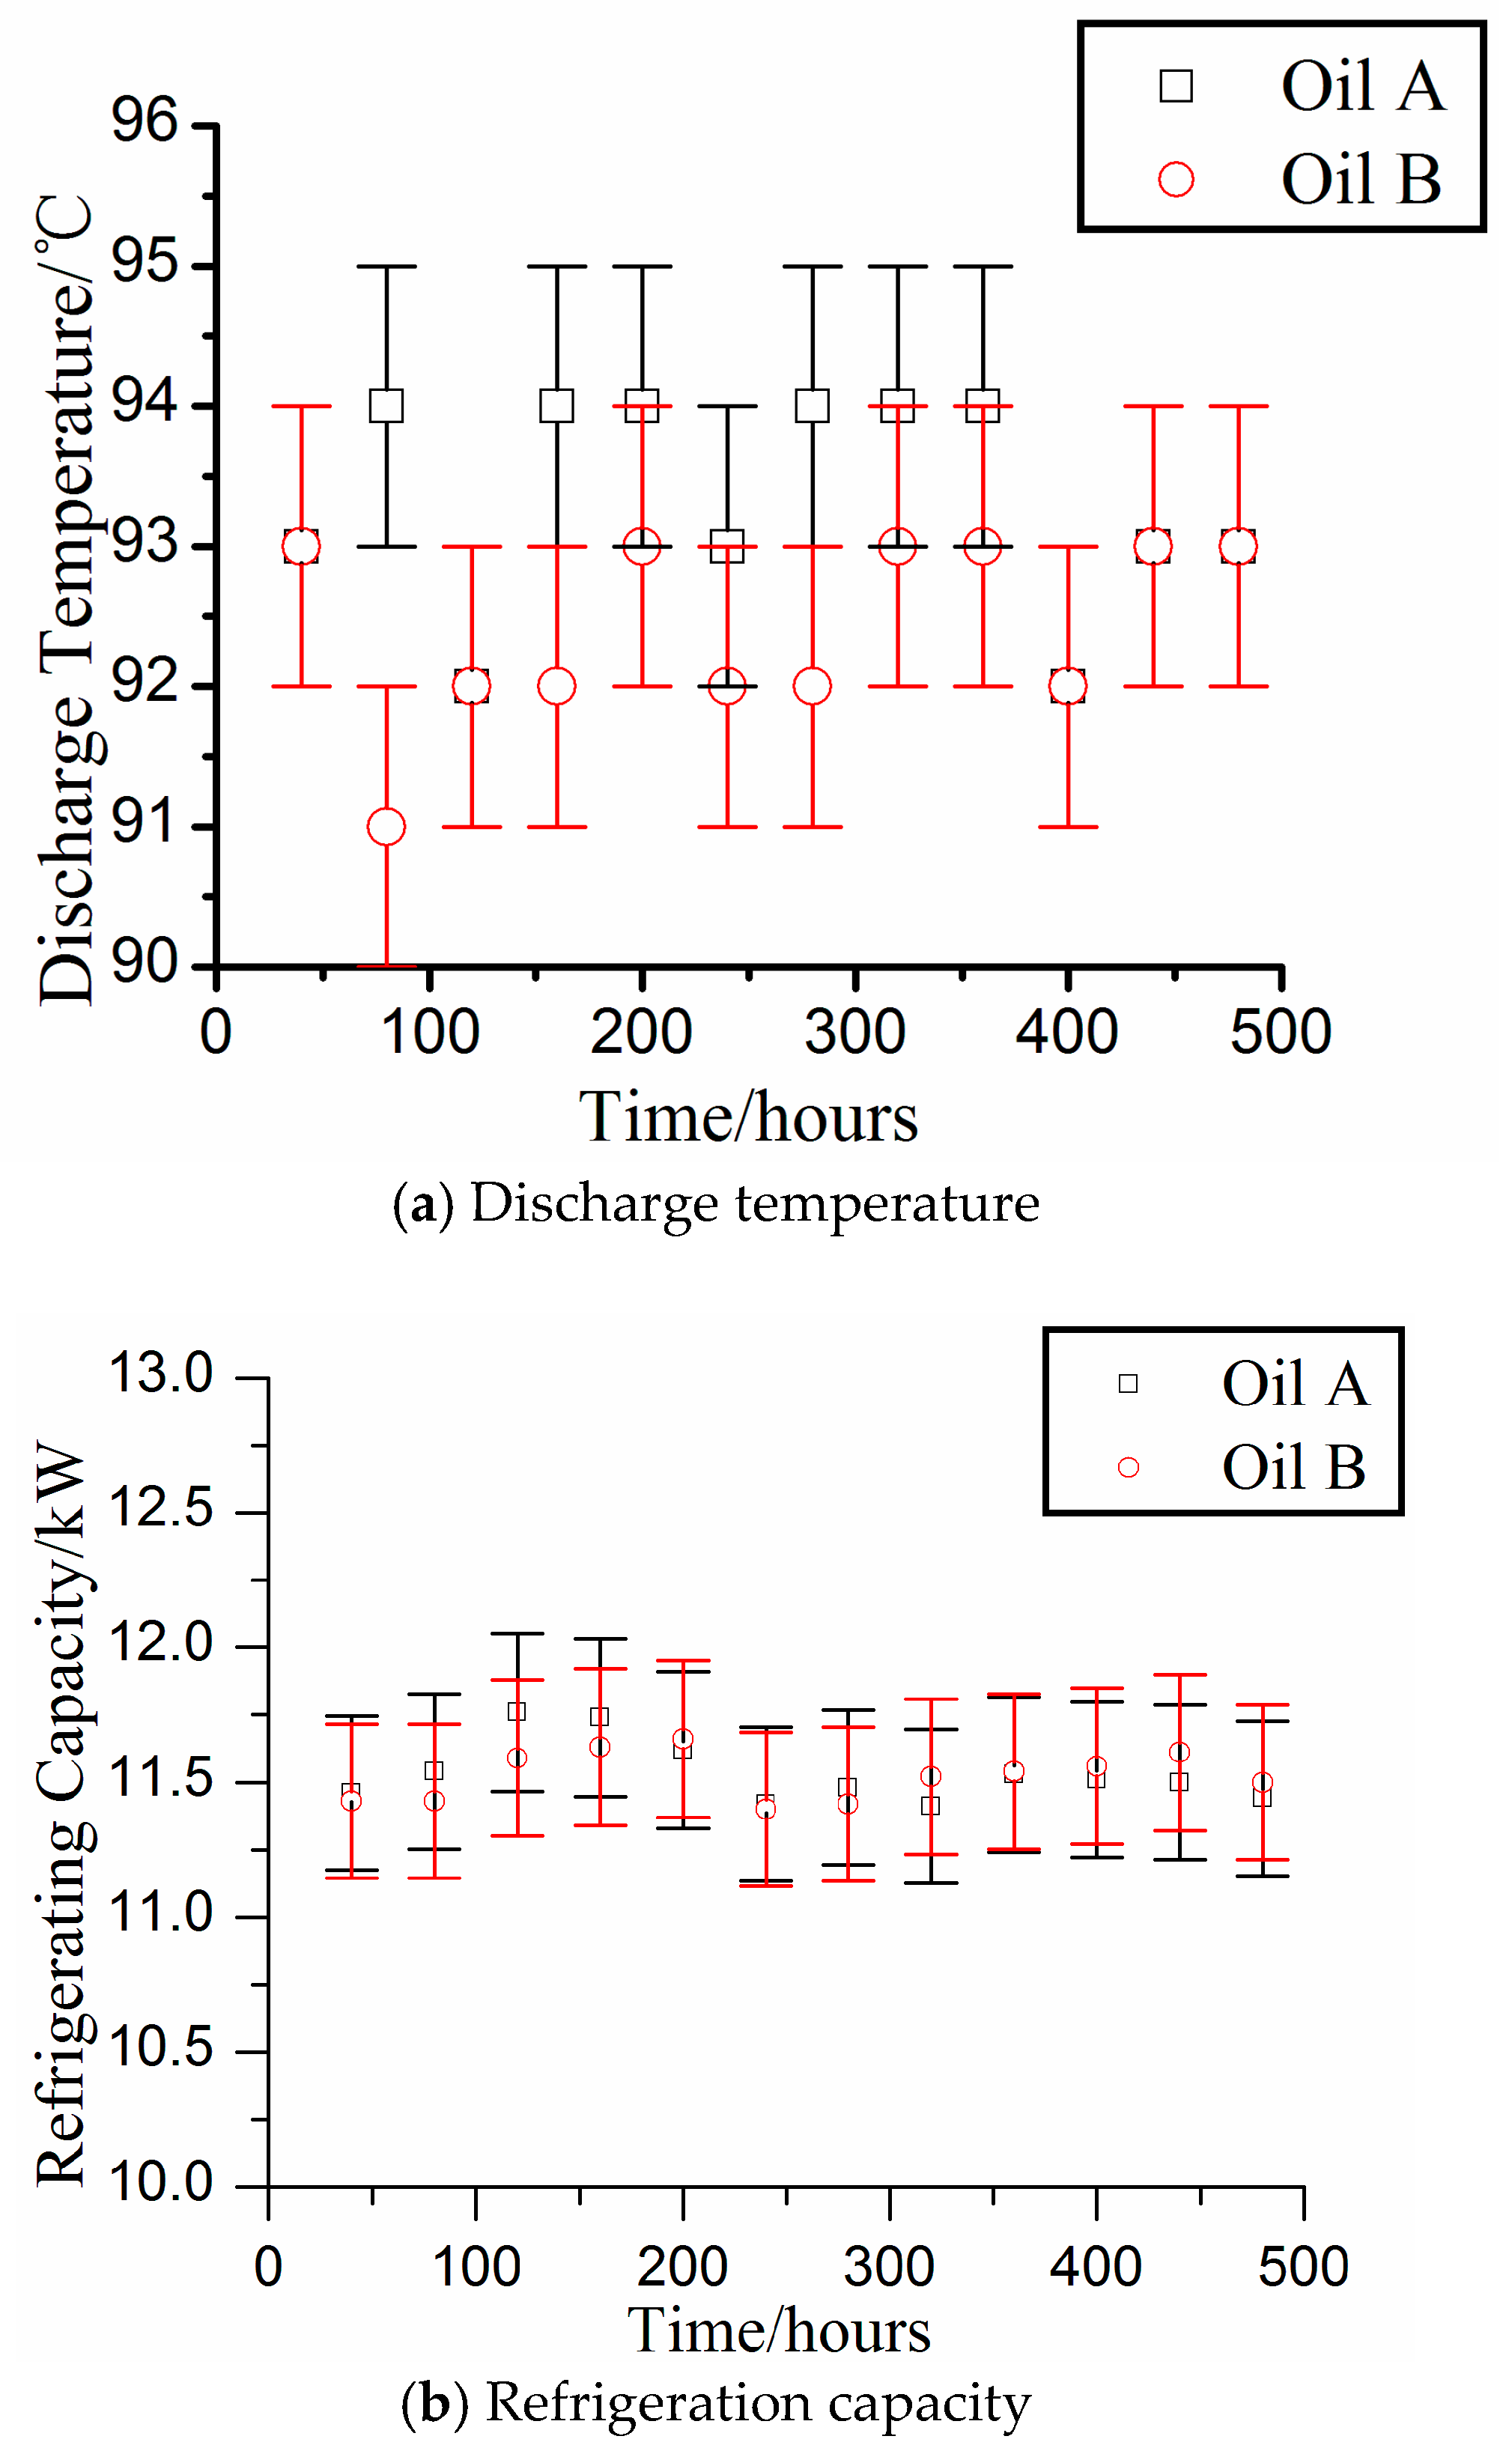
The efficiency of the compressor, ηc, was defined as
where m is the refrigerant mass flowrate through the compressor, hdis and hsuc are the specific enthalpies of the refrigerant at the discharge port and suction port of the compressor, respectively, and Pe is the electrical power input of the compressor. As shown in Figure 3, the efficiency, ηc, of the compressor remains almost the same during the test period. This implies that the working state and efficiency of the compressor were stable.
4.2. Viscosity Evolution
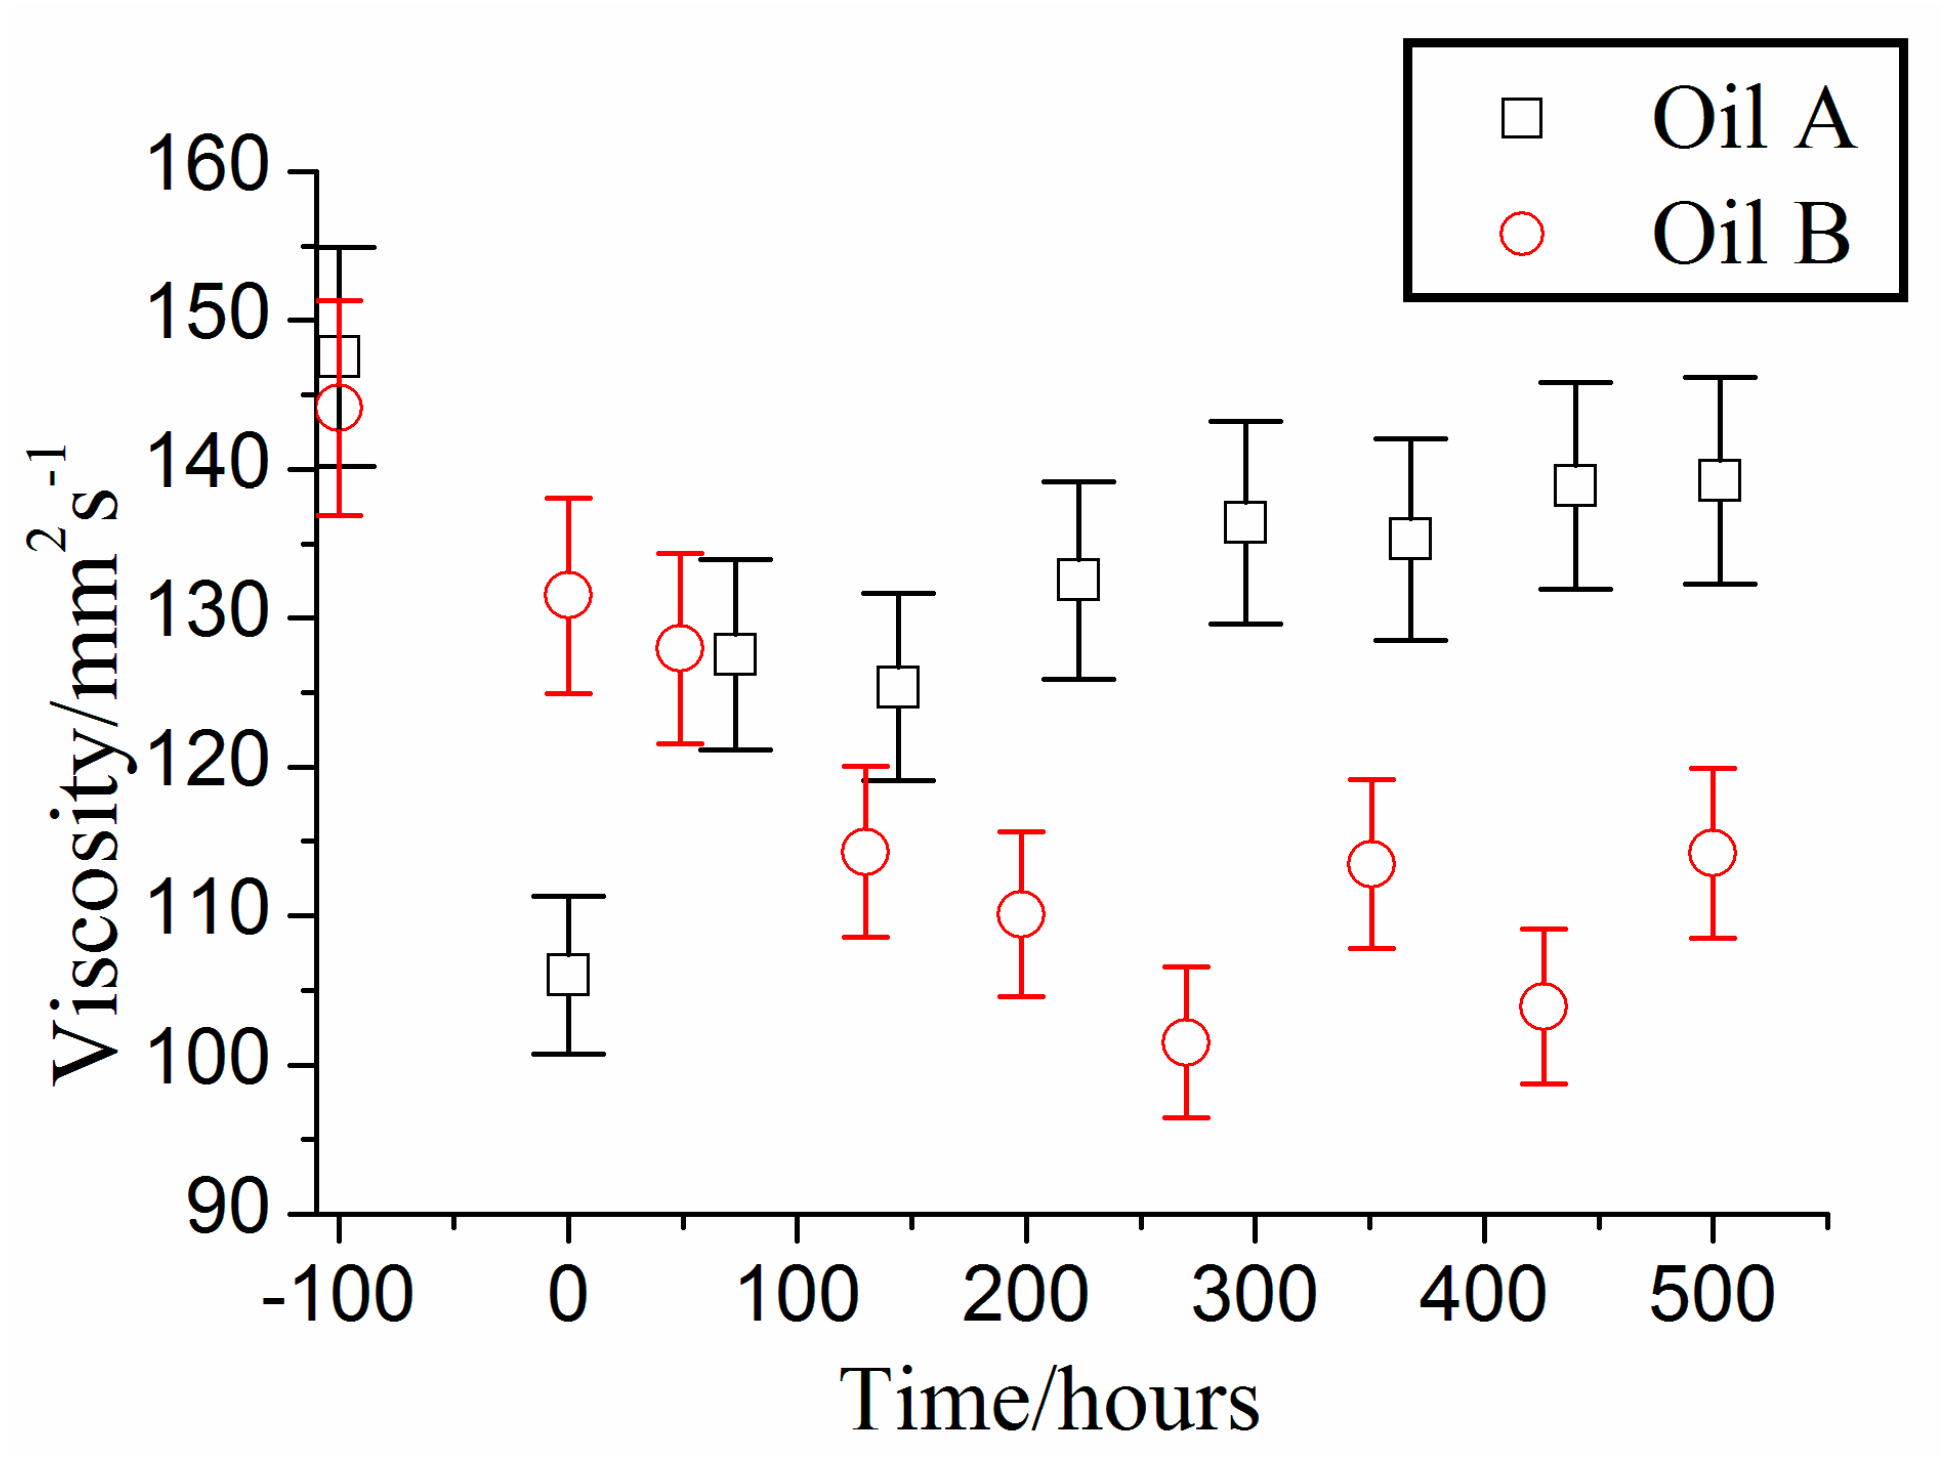
The viscosity of the oil and the refrigerant-oil mixture is important to ensure the compressor and the refrigeration system operate safely and reliably [3,18,19]. Figure 4 shows the viscosity evolution of the two studied oils. The viscosity at the first point of −100 h represents the viscosity of the fresh oils before they are injected into the refrigeration system. The viscosity at the point of 0 h indicates the initial viscosity of the oils, after they are loaded into the refrigeration system with a few minutes of operation, to ensure all the oils are well mixed in the system.
The viscosities of both of the two oils decreased after being injected into the system during the initial running for the first few minutes, which indicated that the refrigerant had effects on the oil viscosity. The oil characteristics are different between the fresh oil and refrigerant-oil mixture. Therefore, this implies that the bench test for the oil is important and meaningful.
As shown in Figure 4, as the refrigeration system continues to operate, the viscosity of the oil A increased slowly and then reached a stable condition after the system operated for about 400 h. However, oil B shows a different trend. The viscosity of oil B continuously decreased during the first 300 h and then gradually stabilized. According to the standard (DIN 51503-2), a viscosity variation of ±15% would trigger the oil drain. However, it was found that the viscosity of oil A decreased from 147.55 mm2/s to 105.95 mm2/s after being loaded into the system. This was a decrease of approximately 28.2%, which was higher than the 15% specified by the standard used. After 73 h of operation, its viscosity increased to 127.55 mm2/s, which was 13.6% lower than the fresh oil viscosity. After 500 h of operation, the viscosity increased to 139.22 mm2/s, which was 5.6% lower than the fresh oil viscosity. Since oil A is a mature oil that has been successfully applied in refrigeration systems, it could be concluded that a rapid initial decrease in the oil viscosity should not trigger the oil drain. These results indicated that the effectiveness of a given refrigeration oil should not be determined by the drop of the viscosity in the initial stage. The justification for the quality of the oil viscosity should depend on whether the system has reached stable operation. The decision of whether or not the oil should be replaced should be made only when the variation of the viscosity of the refrigeration oil in the system is larger than 15% during the stable operation. This further demonstrated that the bench test evaluation is important for justifying the efficacy of the refrigeration oil.
The viscosity of the oil B dropped from 144 mm2/s to 128 mm2/s in the initial stage, representing a decrease of approximately 11%. The viscosity continued to drop to 100 mm2/s during subsequent testing, or approximately a 22% drop from the operating hours 50 to 275. Based on the aforementioned standard, this oil B does not meet the requirement and should be replaced. However, the viscosity soon stabilized between 100 mm2/s and 114 mm2/s for the rest of the experimental running period. This variation is less than 15%. Meanwhile, the compressor efficiency and discharge temperature, and the refrigeration capacity, did not show a significant change. Also, no rotor abrasion was found. These observations indicated that there was no need to drain the refrigeration oil. Thus, the current standard for the oil drain seems too strict and should consider the variation of the refrigeration oil during the long term operation.
4.3. Acid Value
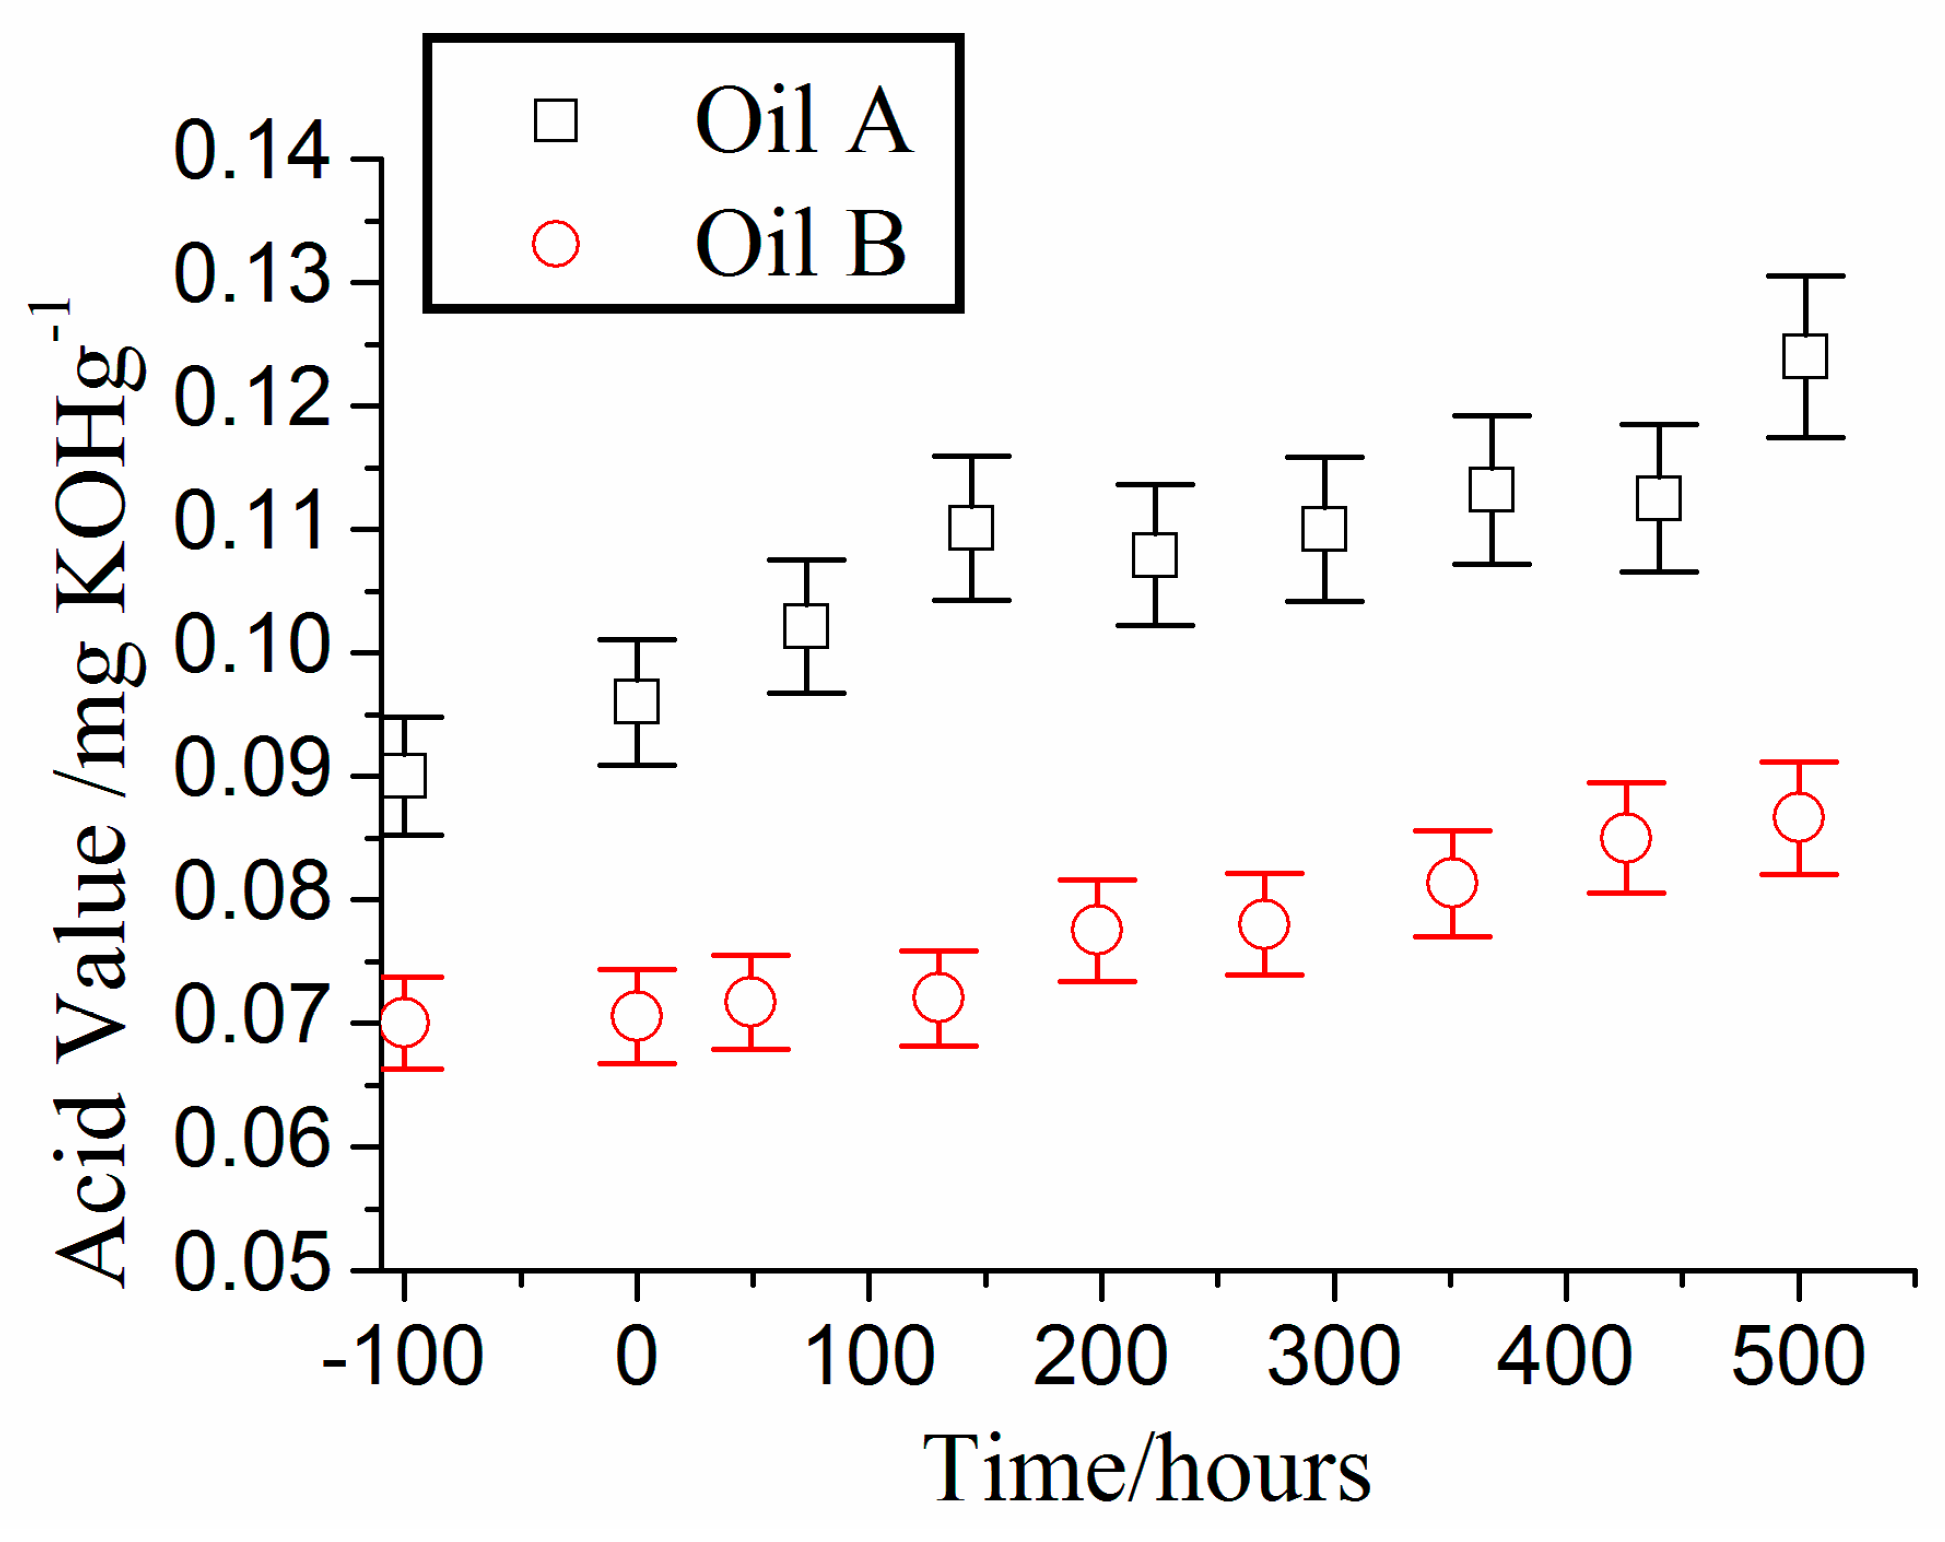
Figure 5 shows the acid value evolution of the two oils during the experimental study. Overall, both oils showed a continuously rising trend in acid value. Taking the acid value of the fresh oil as references, the acid value changes of the two oils exceeded 15% after 500 h of operation. As mentioned above, the oil A is a mature oil that has been successfully applied in refrigeration systems for years. Thus it seemed that the oil drain indexes of ±15% of the acid value were too strict. The acid value of oil B increased by 23.7%, while the acid value of oil A increased by 37.7%. If oil A is taken as a baseline, oil B should also be qualified for the application in the refrigeration system.
4.4. Wear Resistance and Carbon Deposition
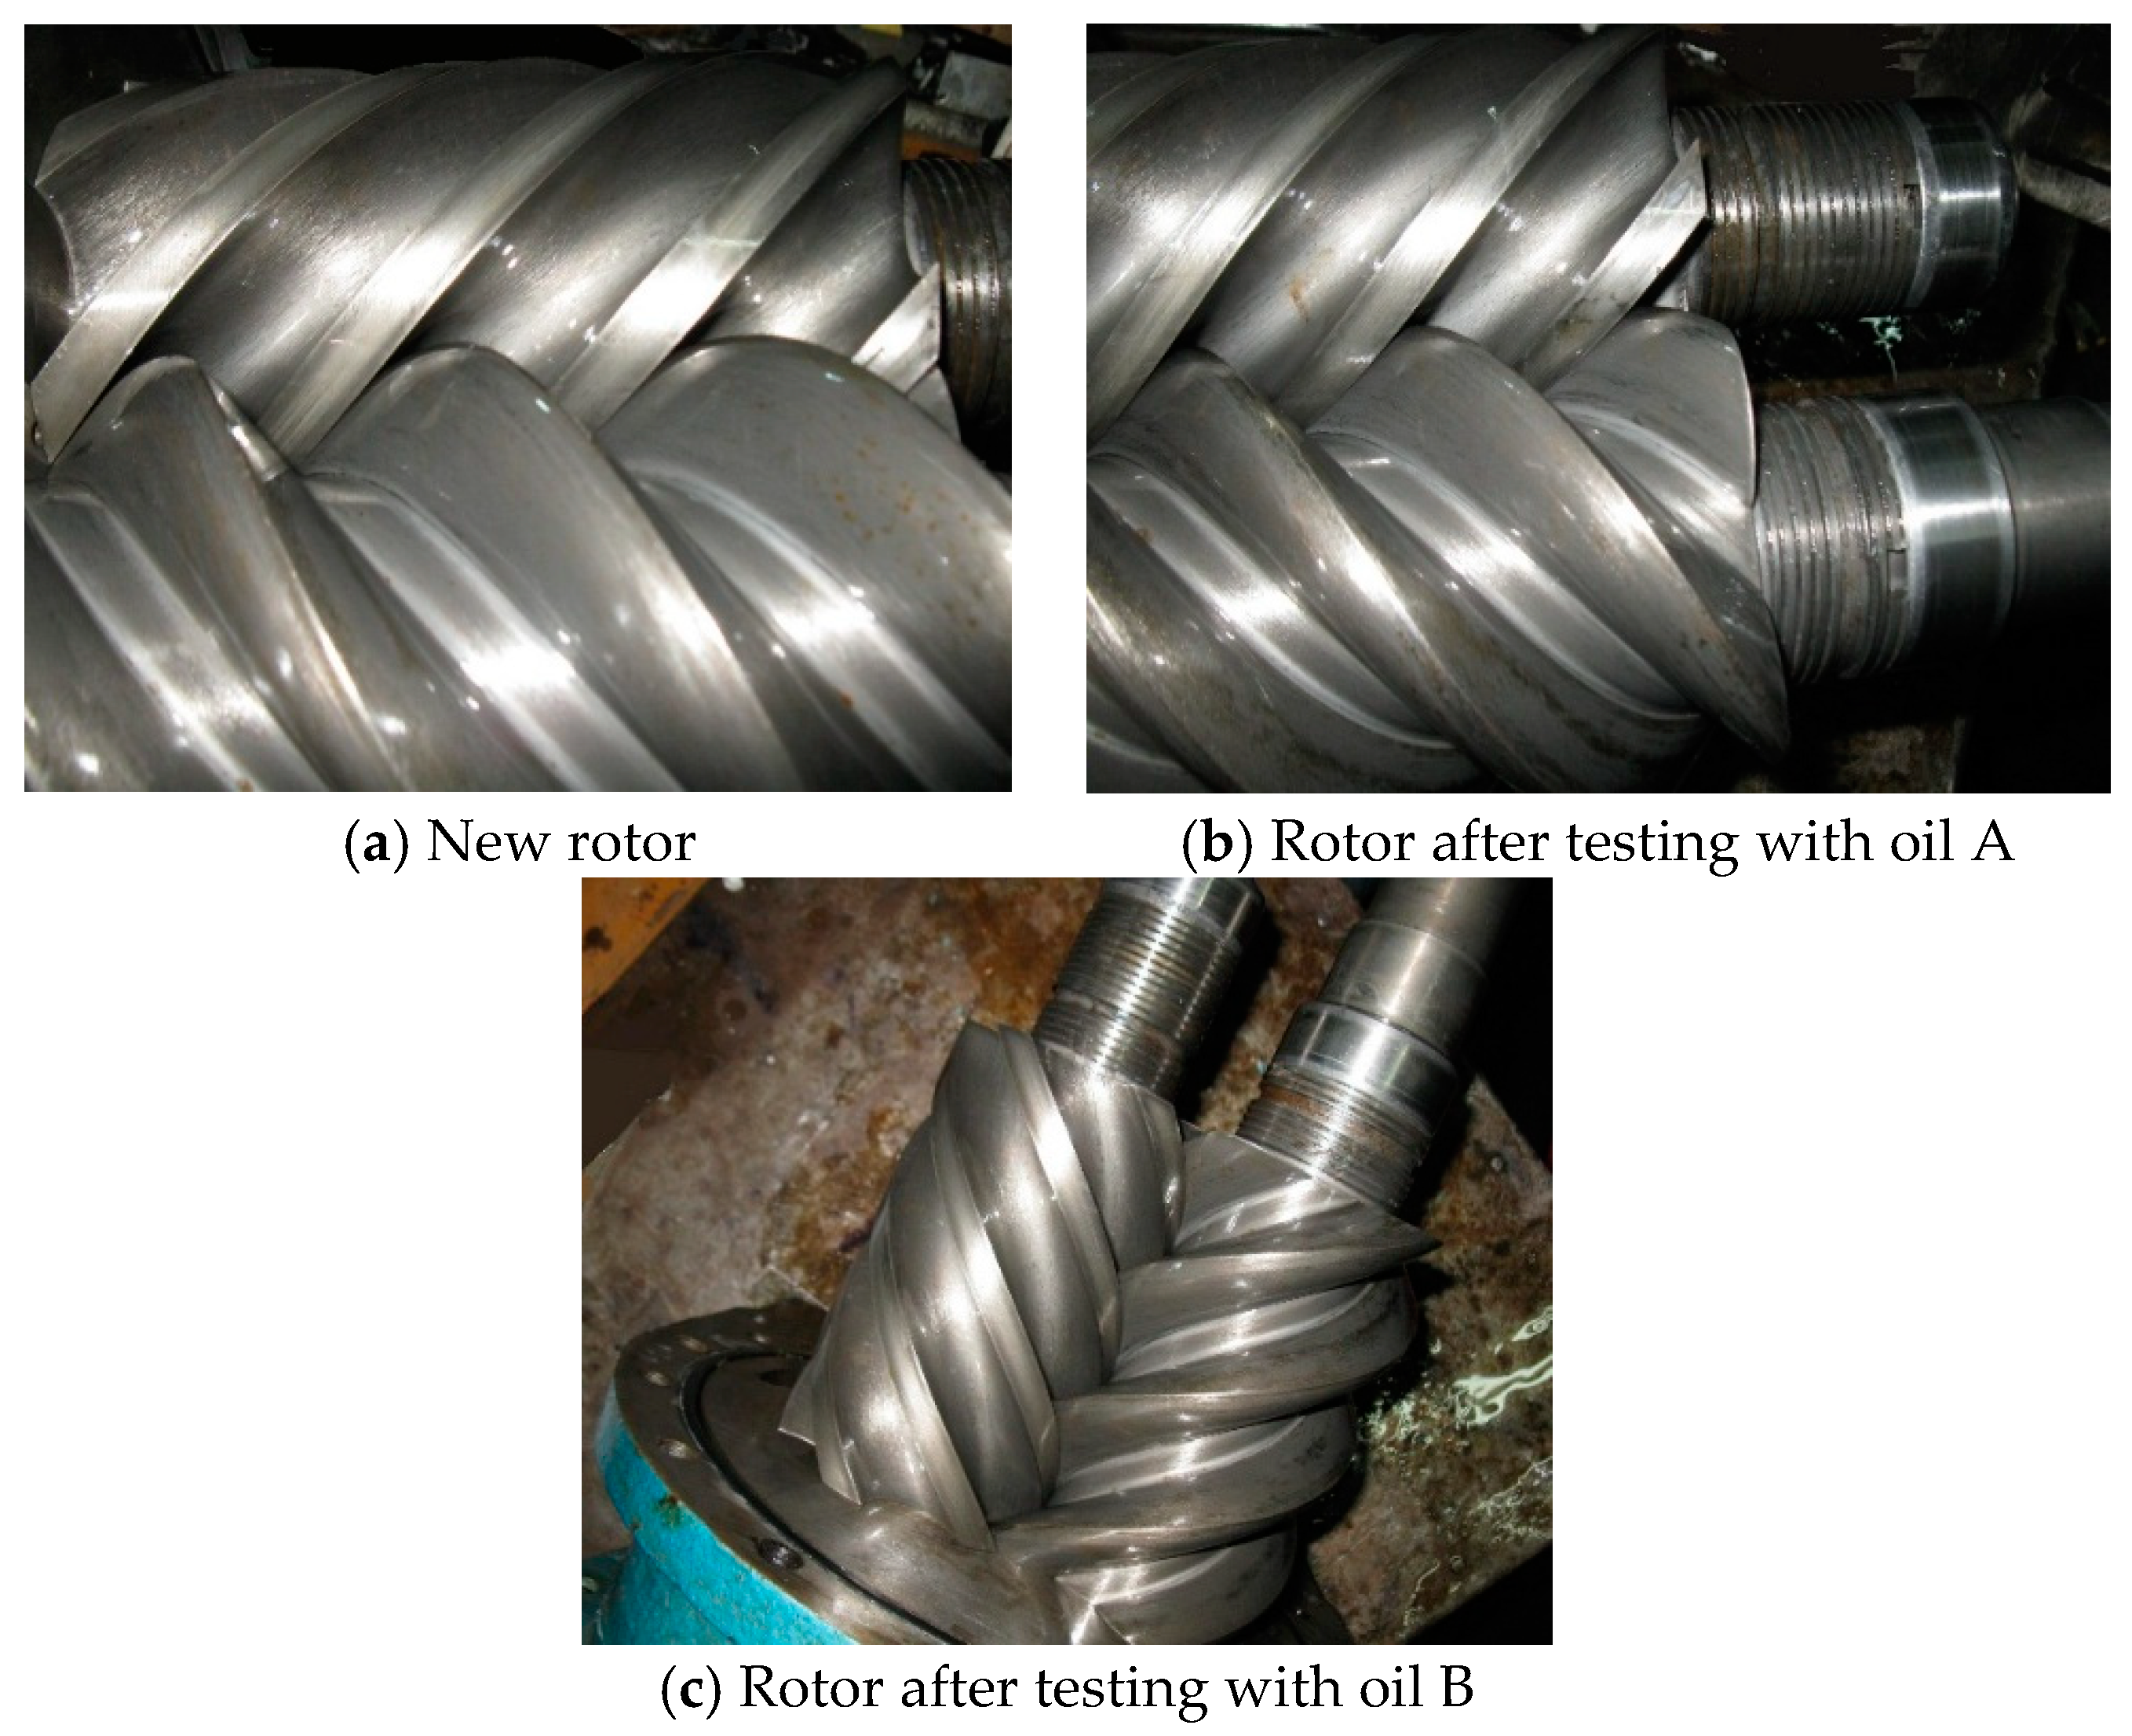
Appropriate viscosity of the refrigeration oil provides good lubrication between clearances of the screw compressor. Figure 6 shows the pictures of the rotors of the screw compressor before and after testing with oil A and oil B for about 500 h. It was clear that no abrasion could be found on rotor surfaces.
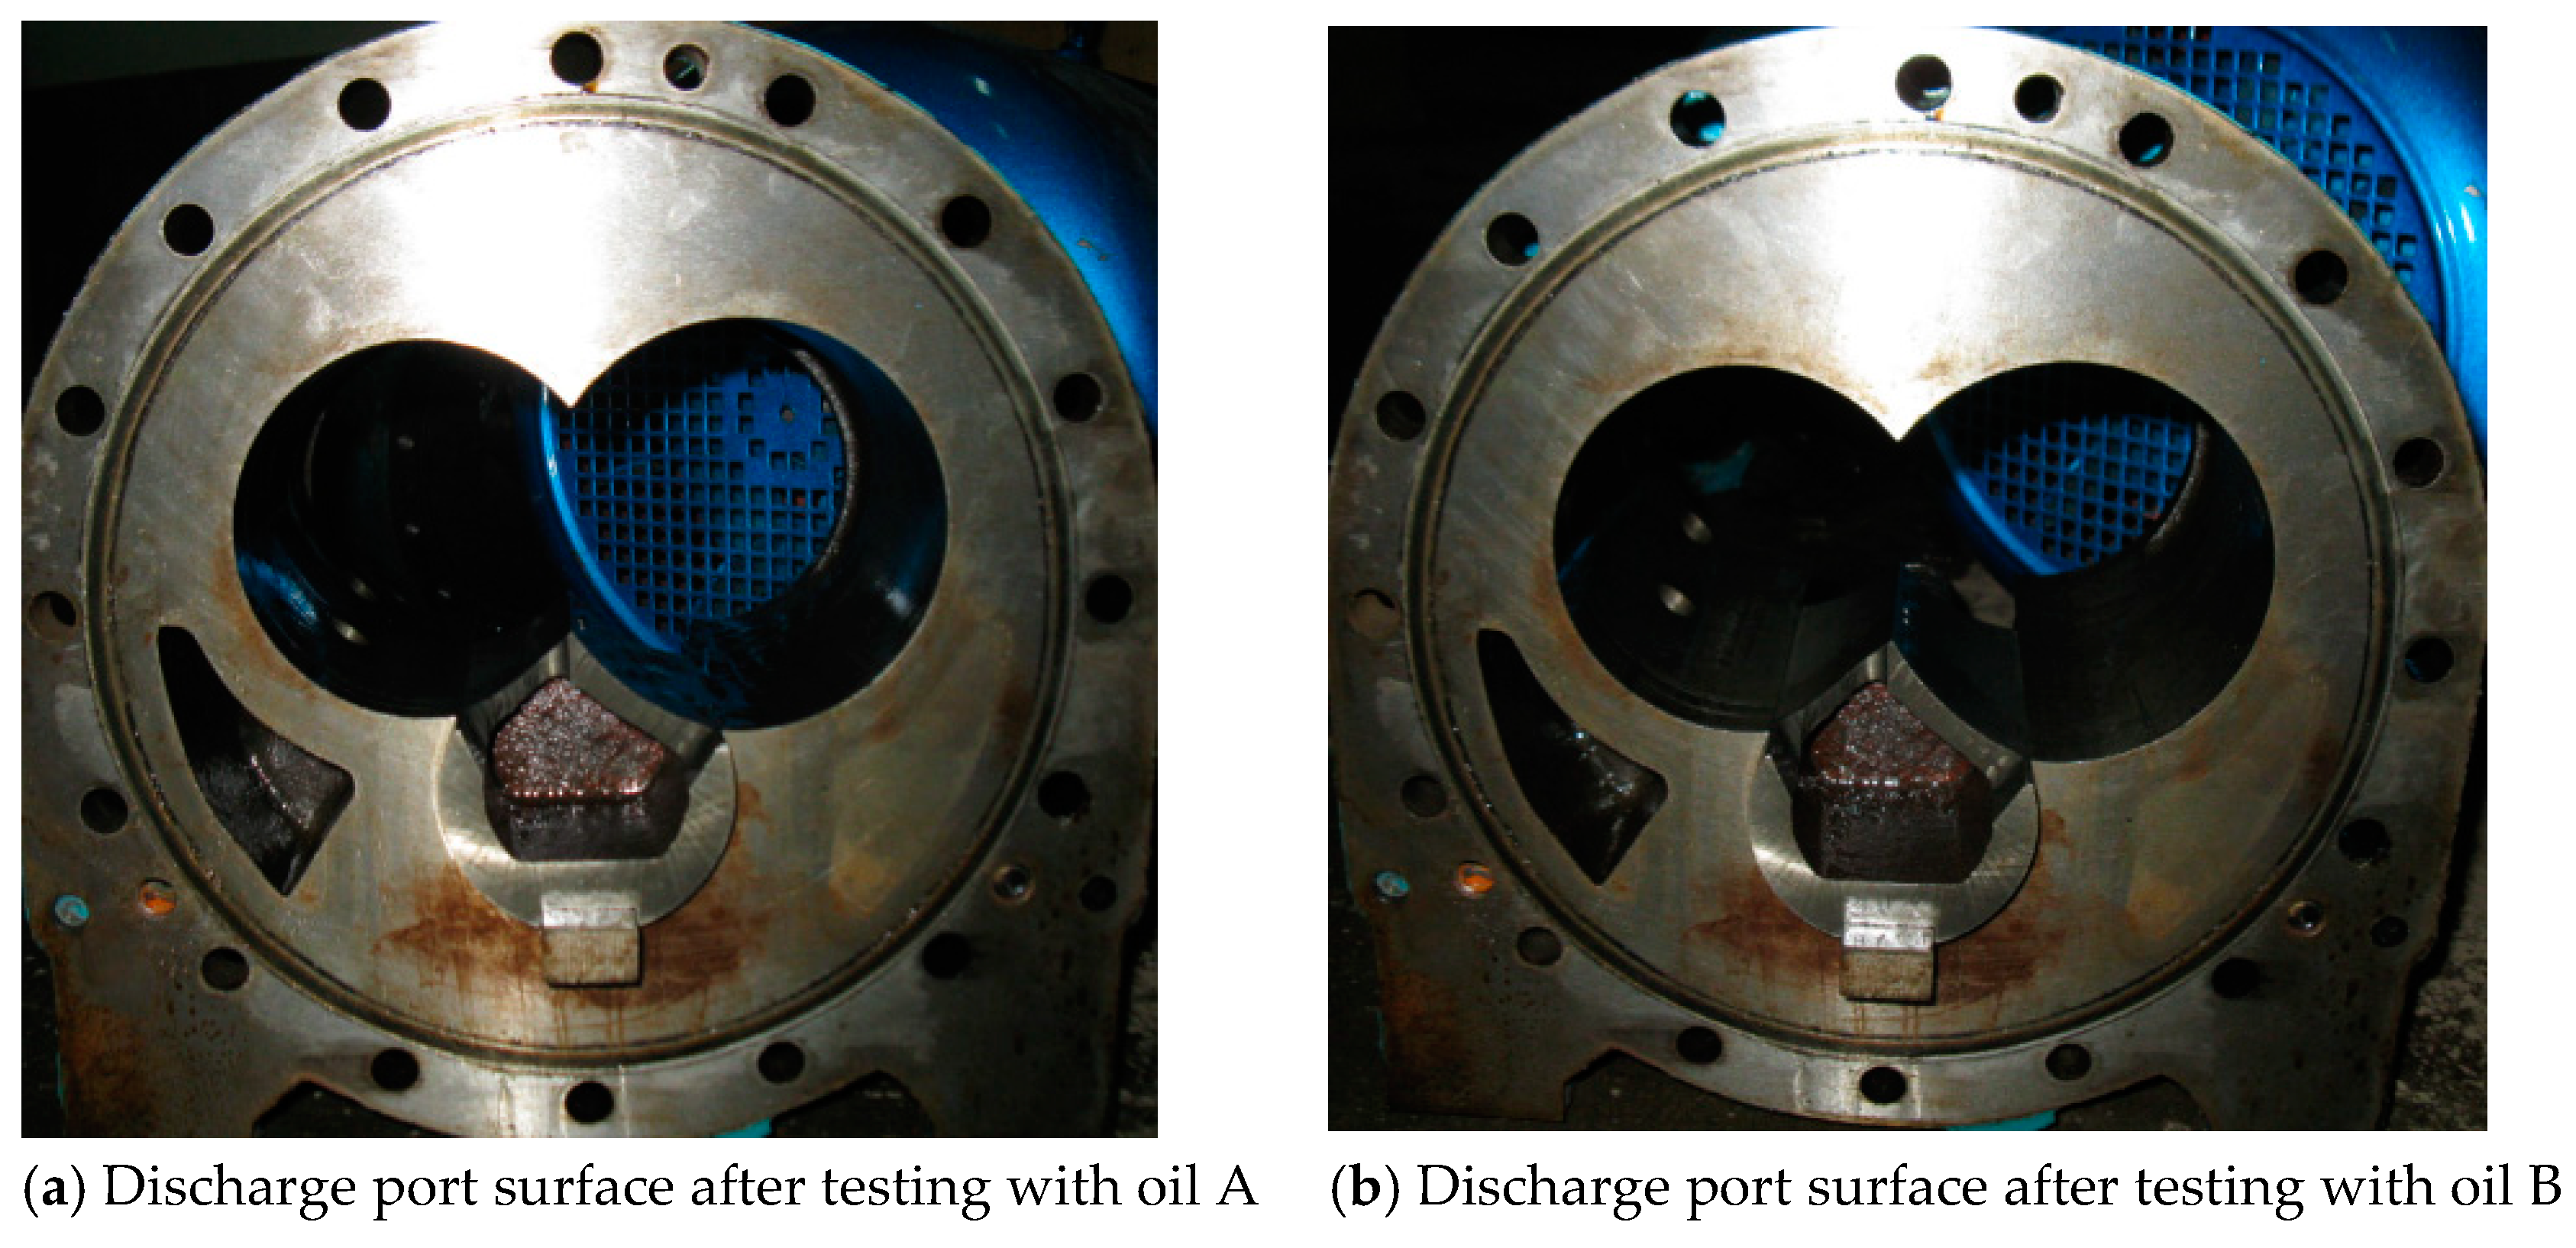
Carbon deposition of the oils on the compressor discharge port surface is often used to judge the thermo-stability of the refrigeration oils. This carbon deposition largely depends on the discharge temperature. The deposition speed increases as the discharge temperature increases. As shown in Figure 7, no carbon deposition was found on the discharge port, despite the much higher discharge temperature used in the evaluation test. This further demonstrated the oil A and B are suitable for application in the refrigeration systems.
5. Conclusions
An accelerated bench test experimental set up was established to evaluate the performance of the refrigeration oils used in an actual refrigeration system with a screw compressor. A mature oil type A and a newly developed oil type B were applied in the study with R134a as the working refrigerant. The fundaments of the accelerated test were discussed, and the experimental discharge temperature of the compressor in the refrigeration system was selected according to a fundamental concept. Specific conclusions were obtained and are explained in detailed below:
- Evolutions of the viscosity of the two refrigerant oils showed that the viscosity of the two synthetic oils dropped more than 15% during the initial loading stage. However, the variation of the viscosity was less than 15% once they reached the stable stage during the operation. This indicated that further study of the oil viscosity after the initial decreasing stage should be recommended to evaluate more reasonable oil drain indexes.
- The results showed that the acid value for oil B increased by 23.7% and for oil A increased by 37.7%, respectively, after 500 h of operation. Both increases in acid values were higher than the 15% recommended by the standard. Based on the compressor and refrigeration operation performance, which did not show a significant change, both oils still functioned well in the refrigeration system. This implied that the change of 15% in the standard was too strict for the refrigeration oil.
- Further investigation on the abrasion of the screw rotors and carbon deposition at the discharge port demonstrated that both oils functioned well during the accelerated bench test, despite the high change of the viscosity and acid value. This indicated that the accelerated bench test is important and the standard for the refrigeration oil may be too conservative.
- Research works in this paper showed an efficient and practical method to evaluate the performance of refrigerants, which can be easily utilized for development of refrigerant oil. However, to develop new refrigerating oils for new refrigerants, more tests should be carried out to establish a criterion for qualified oil.
Author Contributions
Conceptualization, Q.F. and X.W.; methodology, W.W.; validation, Z.Z. and L.Y.; formal analysis, Z.Z. and L.Y.; investigation, Z.Z.; resources, L.Y.; data curation, Z.Z.; writing—original draft preparation, Z.Z. and W.W.; writing—review and editing, X.W.; visualization, Z.Z.; supervision, W.W.; project administration, W.W.
Funding
This research received no external funding.
Conflicts of Interest
The authors declare no conflict of interest.
References
- Rizvi, S.Q.A. A Comprehensive Review of Lubricant Chemistry, Technology, Selection, and Design; ASTM Stock Number: MNL59; ASTM International: West Conshohocken, MD, USA, 2009. [Google Scholar]
- Boyde, S.; Randles, S.J.; Thompson, R.I.G. Reducing vibration with advanced lubricants. Ind. Lubr. Tribol. 2002, 54, 209–214. [Google Scholar] [CrossRef]
- Li, Y.; Kang, Y.; Wang, P.; Ma, S. Impact of refrigerator oil on the refrigeration effect of compressor using r600a refrigerant. Pet. Process. Petrochem. 2011, 42, 80–83. [Google Scholar]
- Karaosmanoğlu, F.; Yüzer, S.; Kerpicci, H.; Durak, E. The investigation of relationship between lubricating oil and refrigerant in refrigerator compressors. Ind. Lubr. Tribol. 2013, 65, 456–465. [Google Scholar] [CrossRef]
- Revellin, R.; Bonjour, J. Entropy generation during flow boiling of pure refrigerant and refrigerant-oil mixture. Int. J. Refrig. 2011, 34, 1040–1047. [Google Scholar] [CrossRef]
- Dugmore, T.I.J.; Stark, M.S. Effect of biodiesel on the autoxidation of lubricant base fluids. Fuel 2014, 124, 91–96. [Google Scholar] [CrossRef]
- Lea, C. Energy savings through use of advanced biodegradable lubricants. Ind. Lubr. Tribol. 2007, 59, 132–136. [Google Scholar] [CrossRef]
- Vithya, P.; Sriram, G.; Arumugam, S.; Harinath, B.V.; Saijagadeeswar, A. Tribological Analysis of Biodegradable Refrigeration oil for Vapour Compression Refrigeration System using Four Ball Tribometer. In Proceedings of the 3rd International Conference on Materials and Manufacturing Engineering 2018, ICMME 2018, Kanchipuram, Tamilnadu, India, 8–9 March 2018; Institute of Physics Publishing: Kanchipuram, Tamilnadu, India, 2018. [Google Scholar]
- Maier, K. Aspects of lubricant oxidation. J. Synth. Lubr. 2010, 4, 338–339. [Google Scholar] [CrossRef]
- Matthews, P.H.D. Lubrication of reciprocating compressors. Lubr. Sci. 2010, 5, 291–317. [Google Scholar] [CrossRef]
- Xia, Y.C.; He, Y.F.; Huo, H. Oil analysis and application based on multi-characteristic integration. Ind. Lubr. Tribol. 2010, 62, 298–303. [Google Scholar]
- Tuomas, R.; Isaksson, O. Measurement of lubrication conditions in a rolling element bearing in a refrigerant environment. Ind. Lubr. Tribol. 2009, 61, 91–99. [Google Scholar] [CrossRef]
- Saito, R.; Sundaresan, S.G. Refrigeration oils for low GWP refrigerants in various applications. IOP Conf. Ser. Mater. Sci. Eng. 2017, 232, 012093. [Google Scholar] [CrossRef] [Green Version]
- Sanukrishna, S.S.; Prakash, M.J. Thermal and rheological characteristics of refrigerant compressor oil with alumina nanoparticlesAn experimental investigation. Powder Technol. 2018, 339, 119–129. [Google Scholar] [CrossRef]
- Gill, J.; Singh, J.; Ohunakin, O.S.; Adelekan, D.S. Energetic and exergetic analysis of a domestic refrigerator system with LPG as a replacement for R134a refrigerant, using POE lubricant and mineral oil based TiO2-, SiO2- and Al2O3-lubricants. Int. J. Refrig. 2018, 91, 122–135. [Google Scholar] [CrossRef]
- Buenenmann, T.F.; Boyde, S.; Randles, S.; Thompson, I. Synthetic Lubricants-Non Aqueous. In Fuels and Lubricants Handbook: Technology, Properties, Performance, and Testing; Totten, G.E., Westbrook, S.R., Shah, R.J., Eds.; ASTM International: West Conshohocken, MD, USA, 2003; pp. 249–266. [Google Scholar]
- Lansdown, A.R. High. Temperature Lubrication; Mechanical Engineering Publications Ltd.: London, UK, 1988. [Google Scholar]
- Yoshimori, Y.; Shimomura, Y. Development of new ester refrigerating oil for R134a refrigerator. Refrigeration 2005, 80, 54–57. [Google Scholar]
- Reyes-Gavilan, J.L. Performance Evaluation of Naphthenic and Synthetic Oils in Reciprocating Compressors Employing R-134a as the Refrigerant; ASHRAE: Chicago, IL, USA, 1993. [Google Scholar]
Figure 1.
A schematic diagram and a picture of the test bench.


Figure 2.
Discharge temperature of the compressor and refrigeration capacity of the system during the 500 h of operation (Oil A, mature synthetic oil; Oil B, newly developed synthetic oil; the vertical lines are the error bars).
Figure 2.
Discharge temperature of the compressor and refrigeration capacity of the system during the 500 h of operation (Oil A, mature synthetic oil; Oil B, newly developed synthetic oil; the vertical lines are the error bars).

Figure 3.
Variation of the compressor efficiency, ηc, during the testing.

Figure 4.
Oil viscosity evolution (Data at −100 h represents the fresh oil before loading into the system; data at 0 h represents the initial oil after loading into the system; the vertical lines refer to the error bars).
Figure 4.
Oil viscosity evolution (Data at −100 h represents the fresh oil before loading into the system; data at 0 h represents the initial oil after loading into the system; the vertical lines refer to the error bars).

Figure 5.
Acid value evolution (Data at −100 h represents the fresh oil before being loaded into the system, data at 0 h represents the new initial oil after being loaded into the system; the vertical lines refer to the error bars).
Figure 5.
Acid value evolution (Data at −100 h represents the fresh oil before being loaded into the system, data at 0 h represents the new initial oil after being loaded into the system; the vertical lines refer to the error bars).

Figure 6.
Abrasion of rotors.

Figure 7.
Carbon deposition at the discharge port of the compressor.


Table 1.
Coefficients a and b for Equation (1).
| Oils | a | b |
|---|---|---|
| Mineral Oils | −0.0295 | 5.8984 |
| Alkyl Phosphates | −0.0296 | 6.3664 |
| Alkyl Silicates | −0.0296 | 7.5068 |
| Polyglycols | −0.0296 | 8.185 |
| Synthetic Hydrocarbons and Diesters | −0.0296 | 8.8652 |
| Silicones | −0.0296 | 9.5505 |
| Polyol Esters | −0.0296 | 10.006 |
| Polyphenyl Ethers | −0.03 | 13.152 |
Table 2.
Standard operating conditions of the refrigeration oil in an actual refrigeration system.
| Item/Unit | Value |
|---|---|
| Evaporating temperature/°C | −15 |
| Evaporating pressure/bar | 1.64 |
| Condensing temperature/°C | 45 |
| Inlet temperature of the compressor/°C | 25 |
| Discharge pressure of the compressor/bar | 11.60 |
| Discharge temperature of the compressor/°C | 52 |
Table 3.
Test condition of the bench test system.
| Item/Unit | Value |
|---|---|
| Evaporating temperature/°C | −15 |
| Evaporating pressure/bar | 1.64 |
| Condensing temperature/°C | 60 |
| Inlet temperature of the compressor/°C | 25 |
| Discharge pressure of the compressor/bar | 16.9 |
| Discharge temperature of the compressor/°C | 94 |
Table 4.
Parameters of the screw compressor.
| Parameters/Unit | Values |
|---|---|
| Rotor diameter/mm | 100 |
| Rotating speed/rpm | 2960 |
| Effective length of the rotor/mm | 150 |
| Capacity/m3·h−1 | 133 |
© 2019 by the authors. Licensee MDPI, Basel, Switzerland. This article is an open access article distributed under the terms and conditions of the Creative Commons Attribution (CC BY) license (http://creativecommons.org/licenses/by/4.0/).
Share and Cite
MDPI and ACS Style
Wu, W.; Zhang, Z.; Wang, X.; Yang, L.; Feng, Q. A Bench Evaluation Test for Refrigeration Oils in a Refrigeration System Using a Screw Compressor. Appl. Sci. 2019, 9, 3202. https://0-doi-org.brum.beds.ac.uk/10.3390/app9153202
AMA Style
Wu W, Zhang Z, Wang X, Yang L, Feng Q. A Bench Evaluation Test for Refrigeration Oils in a Refrigeration System Using a Screw Compressor. Applied Sciences. 2019; 9(15):3202. https://0-doi-org.brum.beds.ac.uk/10.3390/app9153202
Chicago/Turabian StyleWu, Weifeng, Zhao Zhang, Xiaolin Wang, Liangwei Yang, and Quanke Feng. 2019. "A Bench Evaluation Test for Refrigeration Oils in a Refrigeration System Using a Screw Compressor" Applied Sciences 9, no. 15: 3202. https://0-doi-org.brum.beds.ac.uk/10.3390/app9153202
Note that from the first issue of 2016, this journal uses article numbers instead of page numbers. See further details here.