Effects of Glazing with Preservatives on the Quality Changes of Squid during Frozen Storage


1
Shanghai Engineering Research Center of Aquatic Product Processing & Preservation, Shanghai Professional Technology Service Platform on Cold Chain Equipment Performance and Energy Saving Evaluation, Shanghai 201306, China
2
National Experimental Teaching Demonstration Center for Food Science and Engineering, Shanghai Ocean University, Shanghai 201306, China
3
College of Food Science and Technology, Shanghai Ocean University, Shanghai 201306, China
*
Authors to whom correspondence should be addressed.
Appl. Sci. 2019, 9(18), 3847; https://0-doi-org.brum.beds.ac.uk/10.3390/app9183847
Submission received: 10 August 2019
/
Revised: 11 September 2019
/
Accepted: 12 September 2019
/
Published: 13 September 2019
(This article belongs to the Special Issue Antioxidants in Natural Products)
Abstract
:This study aimed to investigate the effects of glazing with sodium polyacrylate (SP) and D-sodium erythorbate (DSE) on the quality changes of squid during frozen storage. Frozen squid samples were randomly divided into seven groups: (1) CK (unglazed); (2) WG (distilled water-glazed); (3) SG (0.1% SP -glazed); (4) SG-1DSE (0.1% SP with 0.1% DSE -glazed); (5) SG-3DSE (0.1% SP with 0.3% DSE-glazed); (6) SG-5DSE (0.1% SP with 0.5% DSE-glazed); (7) WG-1DSE (0.1% DSE-glazed). The efficacy of the different coatings was evaluated using various indicators, such as water holding capacity (WHC), pH value, low field nuclear magnetic resonance (LF-NMR), color, malondialdehyde (MDA) content value, free amino acids (FAAs) content, intrinsic fluorescence intensity (IFI) and the total sulfhydryl content (SH) content. Intrinsic fluorescence intensity (IFI) and low field nuclear magnetic resonance (LF-NMR) were used as fast monitoring techniques to monitor changes in quality of squid samples. The results showed that compared with the CK and WG groups, coating with either SG or DSE alone resulted in reduced rate of moisture loss (p < 0.05), lipid oxidation (p < 0.05) protein degradation (p < 0.05) and prolonged its shelf-life. The combination of glazing treatment with SG and DSE (groups SG-1DSE, SG-3DSE and SG-5DSE) further improved the protective effects of coating, particularly in the SG-3DSE group. Therefore, the glazing of SG-3DSE is recommended to be used to control the quality of frozen squid and to prolong its shelf-life during frozen storage.
1. Introduction
Squid, the most important group of cephalopods, has high yield [1]. Squid has many advantages, such as low fat content and high quality proteins, which has a positive impact on the health of consumers [2]. Generally, squid is easily susceptible to deterioration after being caught through long-distance fishing. To inhibit microbial growth, oxidation and enzymatic autolysis, freezing is a widely used technique in squid preservation [3]. However, traditional freezing may lead to deterioration of fish quality because of lipid oxidation, protein denaturation and surface dehydration during frozen storage [4].
Glazing, a widely used technique is used to protect the quality of fish from the effects of long-term frozen storage. A layer of ice on the surface of frozen fish prevents the contact between the air and the food’s surface, reduces the rate of oxidation and controls moisture loss [5]. The coating thicknesses are closely related to many factors, such as dipping time, fish temperature and coating temperature [6]. The quality of the product would be affected by the coating thickness, for example if the coating thickness was too low (<6%), it might not be able to play protective function completely over storage time, but excessive glazing (>12%) may harm the interests of customers [7]. A new regulation was issued by the Brazilian Agricultural Animal Husbandry and Supply Department: the thickness of ice on the surface of frozen fish products, with or without additives, cannot exceed 12% [8].
Water is usually used as traditional ice-glazing (IG), but this water glaze cracks easily and loses antioxidative effects during long-term frozen storage. Edible sodium polyacrylate (SP), as a water-soluble hydrophilic polymer, could dissolve in water to form a transparent and viscous solution [9]. Its viscosity is about 15~20 times that of carboxymethyl cellulose and the alginate; therefore, SP is popular in the food industry because of its thickening characteristics [10]. Sodium polyacrylate has many advantages, such as excellent mechanical strength and thermal stability, was approved as a safe food additive by U.S. Food and Drug Administration [10,11].
Antioxidants have been used as glazing materials for better protective effects on the quality of frozen food products during frozen storage such as chitosan [12,13,14], rosemary extract [15], saponin-free quinoa extract [16] and essential oil (EO) [17]. As a stereoisomer of sodium ascorbate, sodium erythorbate can effectively prevent or delay food oxidation [18,19]. Furthermore, it was reported that sodium erythorbate was an effective ascorbic acid for stabilizing muscle color, but sodium erythorbateis is cheaper than ascorbic acid [20]. The aim of the present study was to assess the effects of sodium polyacrylate and D-sodium erythorbate as the ice-glazing layer on squid during six months’ frozen storage. The quality of squid was investigated by physicochemical properties such as texture, color, protein denaturation, and lipid oxidation.
2. Materials and Methods
2.1. Materials and Freezing Process
Fresh squids weighing 410 ± 20 g were purchased from Luchao Port in Shanghai, China, packed in insulated polystyrene boxes with ice and then transported to the laboratory immediately. Several initial fresh squids were analyzed for data of the month 0. Then, the remaining samples were thoroughly washed and put on fish plates. The treated squid samples were frozen by ultra-low temperature cold storage freezing (Jiangsu Air Conditioner Co., Ltd., Jiangsu, China) at −55 °C. When the center of the squid reached −18 °C, these frozen samples were stored in a refrigerator at −30 °C.
2.2. Preparation of Glazing Solution
A solution of D-sodium erythorbate (DSE) from Aladdin Biochemistry Technology Co., Ltd. (Purity ≥ 98%, Shanghai, China) and edible sodium polyacrylate (SP) from Macklin Biochemical Co., Ltd. (50% aqueous solution, Average Mw3000–5000, Shanghai, China) was prepared. D-sodium erythorbate and sodium polyacrylate were mixed mechanically through different proportions and dissolved in distilled water. Subsequently, these solutions were mixed thoroughly with a magnetic stirrer (Shanghai Siro Instruments Co., Ltd., Shanghai, China) at room temperature, until complete dissolution. Finally, six glazing solutions including distilled water, 0.1% SP, 0.1% SP with 0.1% DSE (w/v), 0.1% SP with 0.3% DSE, 0.1% SP with 0.5% DSE, and 0.1% DSE were obtained. These solutions were stored at 3 °C for glazing.
2.3. Glazing and Frozen Storage
The frozen squid samples were randomly divided into seven groups: (1) CK (unglazed); (2) WG (distilled water-glazed); (3) SG (0.1% SP -glazed); (4) SG-1DSE (0.1% SP with 0.1% DSE -glazed); (5) SG-3DSE (0.1% SP with 0.3% DSE-glazed); (6) SG-5DSE (0.1% SP with 0.5% DSE-glazed); (7) WG-1DSE (0.1% DSE-glazed). Different groups of squid samples, dipped into the corresponding coating solutions (3 °C, 20~25 s), were applied an even glazing percentage (10% ± 1%) [15]. After glazing, the samples were packed in a polyethylene bag and immediately stored at −18 °C for 6 months.
Every month, samples, in triplicate, were taken from the refrigerator for analysis. Before being analyzed, the squid samples were thawed in flowing water.
2.4. Determination of Water-Holding Capacity (WHC)
WHC was analyzed according to the method proposed by Zang et al. [21] with the following modifications: portions of 2 × 1 cm (about 2 g) were cut from the carcass, weighed (W0). Then samples were covered by filter paper and located within a flat-bottom round (50 mm diameter) polyethene tube, then centrifuged at 5000 r/min for 10 min in 4 °C The samples were removed from the filter paper and re-weighed (W1). Analyses were performed in triplicate for each sample. The WHC was calculated as follows:
2.5. Determination of Weight Loss
The weight of squids before frozen storage without glazing was weighed (W2). Afore storage, frozen squids were taken out and its surface ice was stripped, weighed the present weight (W3). The weight loss of squids was calculated as follows:
2.6. Low-field Nuclear Magnetic Resonance (LF-NMR) Measurements
Portions of 3 cm × 3 cm × 0.5 cm (about 5 g) were cut from the carcass and sealed with polyethylene films. The LF-NMR measurements were implemented using a LF-NMR analyzer (MesoMR23-060H.I, Niumag Corporation, Shanghai, China) with a corresponding stable frequency of 20 MHz through CPMG pulse. The LF-NMR measurements were performed as described by Li et al. [22], with slight modifications. Acquisition parameters were as follows: the receiver bandwidth frequency (SW) = 100 kHz, analog gain (RG1) = 20 dp, P1 = 18.00μs, digital gain (DRG1) = 5, TD = 200,020, preamplifier gain (PRG) = 1, the duration between successive scans (TW) = 4000 ms, the number of the scans (NS) = 8, P2 = 37.00 μs, time echo (TE) = 0.400ms and NECH = 5000.
To obtain proton density weighted images, acquisition parameters were as follows: time repetition (TR) = 500ms and TE = 18.2 ms. The measurements were run in triplicate.
2.7. Determination of pH Value
The pH value was determined according to Sun et al. [12] with the following modifications: a portion of each sample (2 g) was added to 18 mL cooled distilled water and centrifuged at 3,000 r/min for 10 min. Then the supernatant was used to measure pH value with a pH meter (PB-10, Sartorius Ltd., Göttingen, Germany).
2.8. Determination of Color Parameters
The color of squid with no epidermis was determined in triplicate by a colorimeter (CR-400, Konica Minolta Corporation, Tokyo, Japan). White standard plate (Y = 88.5, x = 0.3149 and y = 0.3222) provided by manufacture was used as a standard. L* values represents the degree of lightness to darkness, the degree of redness to greenness was accounted by a* values and b* scale ranges from yellowness to blueness. Analyses were performed in five repetitions for each sample. Five measurements were made for each sample. The whiteness of squid was calculated as the following equation:
2.9. Determination of Malondialdehyde (MDA) Value
1 g of ground squid sample was homogenized in 9 mL of saline solution, centrifuged at 5000 r/min for 10 min in 4 °C. The supernatant was used to determine the MDA value by the MDA kit (Nanjing Jiancheng Bioengineering Institute, Nanjing, China). Analyses were performed in triplicate for each sample.
2.10. Determination of Free Amino Acids (FAAs)
FAAs was analyzed using an automatic amino acid analyzer (L-8800, Hitachi, Tokyo, Japan) according to the method of Li et al. [22]. The minced samples (1.0 g) were homogenized with 10 mL of 5% trichloroacetic acid and centrifuged at 8000 r/min for 10 min in 4 °C. The obtained precipitates were centrifuged again under the same conditions, then dilute the combined supernatant to 25 mL. The 1 mL extract is filtered with a 0.22 um disposable filter for reserve, and automatic amino acid analysis was used. The assays were run in triplicate.
2.11. Determination of the Total Sulfhydryl (SH) Content
The myofibrillar protein (MFP) was performed according to Li et al. [23]. Squid samples of 3 g were mixed and homogenized with 30 mL precooled KCl solution (0.6 mol/L, pH 7.0) and then the homogenate was centrifuged at 8000 r/min for 30 min in 0 °C, then the supernatant was added to three fold volume cooled distilled water and centrifuged at 8000 r/min for 30 min. The supernatant was discarded and precipitate was added to the same volume precooled KCl solution (1.2 mol/L, pH 7.0) to dissolve completely the actomyosin. The solution was centrifuged at 5000 r/min for 20 min to remove the insoluble protein and the supernatant was myofibrillar protein. Finally, the total sulfhydryl (SH) content was measured using a total mercapto measurement kit (Nanjing Jiancheng Bioengineering Institute, Nanjing, China). The measurements were run in triplicate and the mean value was considered to be the final result.
2.12. Determination of Intrinsic Fluorescence Intensity (IFI)
Intrinsic fluorescence intensity of squid samples was carried out with the method reported by Shi et al [15] with some modification. The myofibrillar protein solution was performed by paragraph 2.11 and the MFP (0.05 mg/ml) was diluted in 0.6M NaCl. Then solution was scanned by a fluorescence spectrophotometer (F-7100, Hitachi, Tokyo, Japan). The scan mode was emission and acquisition parameters were as follows: excitation and emission slit widths of 5 nm, excitation wavelength of 295 nm, emission wavelength of 300~410 nm, scan speed of 1200 nm/min and PMT Voltage of 400 V.
2.13. Statistical Analysis
Experimental data from each assay was analyzed using SPSS 21.0 (SPSS Inc., Chicago, IL, USA) for analysis of variance (ANOVA), with significance at p < 0.05. The results were recorded as the means ± SD.
3. Results and Discussion
3.1. Changes in WHC and Weight Loss
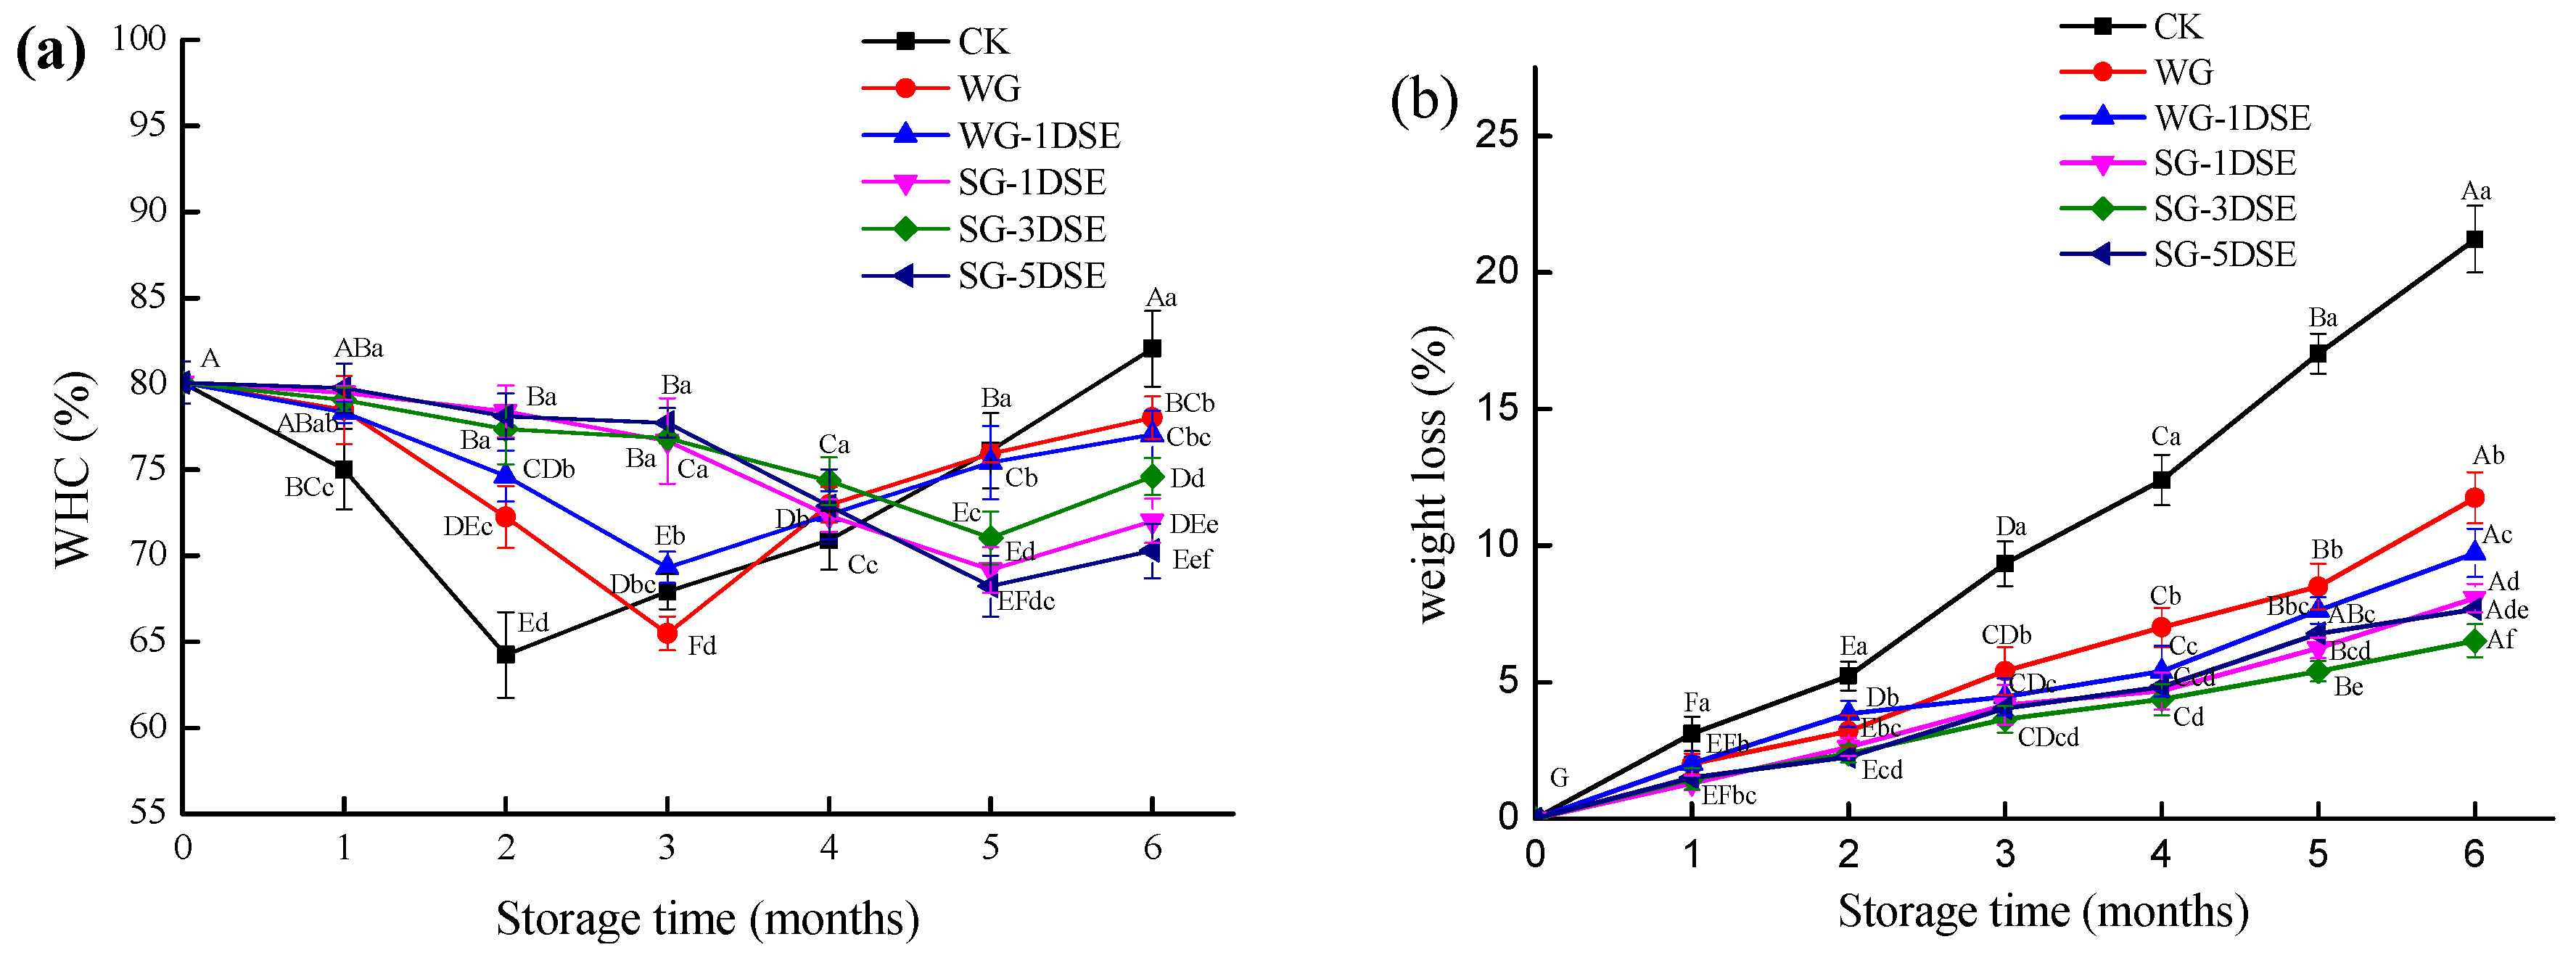
The changes in WHC in squid with different treatments during frozen storage are shown in Figure 1a. For all treatments, WHC values decreased first and then increased during frozen storage. The results were similar to that reported by Zang et al. [21]. The decreasing of WHC was caused by the growth of ice crystals during frozen storage [24], and unglazed squid showed the lowest (p < 0.05) WHC at the second months of storage. Compared with unglazed squid, glazed squid was significantly (p < 0.05) inhibited the diminished of WHC.
The changes of weight loss of squid with different treatments during frozen storage are shown in Figure 1b. With increasing storage time, the weight loss of the samples gradually increased. The results were similar to that reported by Soares et al. [13,25]. The weight loss of frozen sample was attributed to sublimation of water during frozen storage, and glazing can form a water vapor protective barrier against sample dehydration [26,27]. Therefore, the water content of the samples gradually decreased and the water from squid was more difficult to remove through centrifugation which resulted in a gradually increase of WHC during the late stage of frozen storage. The WHC of unglazed samples (CK group) increased rapidly (p < 0.05) from 2nd month. In the experimental groups, the glazing containing sodium polyacrylate and D-sodium erythorbate, especially in the SG-3GSE group, significantly inhibited water loss of squid during the whole frozen storage, which might be also attributed to their protective effects on the protein which thus protects the squid against dehydration [15,27].
3.2. Low Field-Nuclear Magnetic Resonance (LF-NMR) Analysis
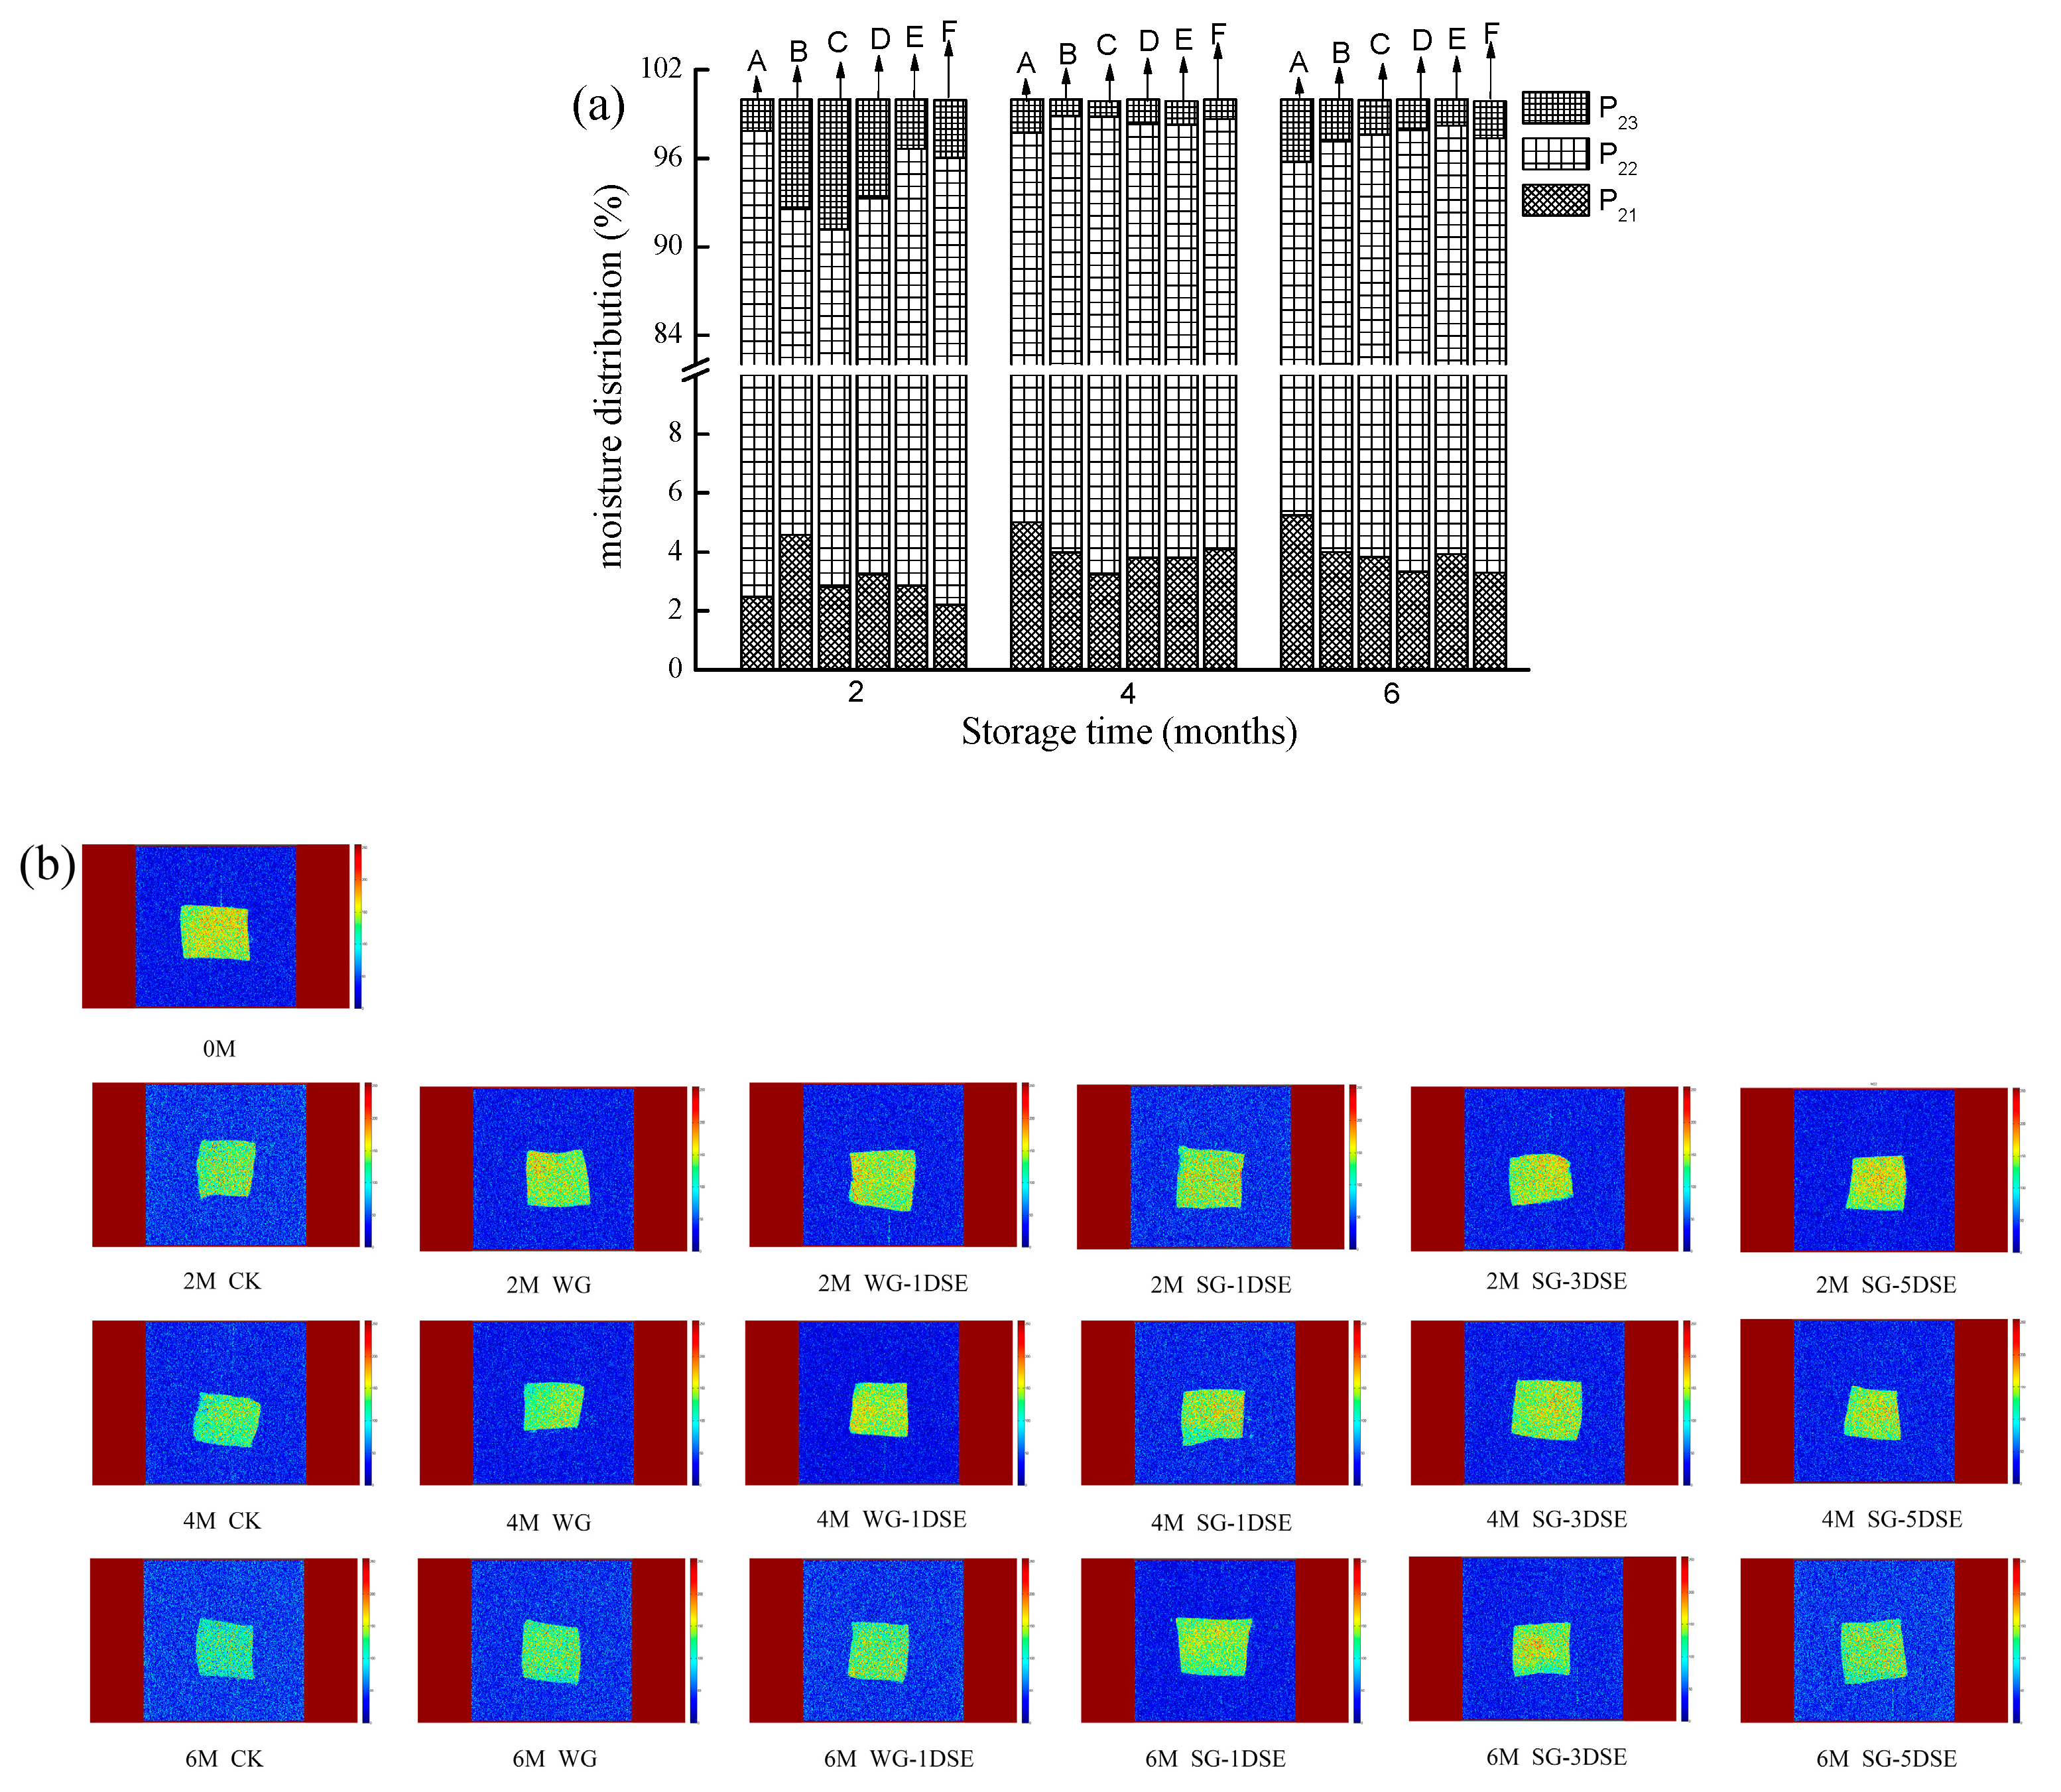
LF-NMR can be used to evaluate the freshness of fish, and MRI as a complementary technology can better understand water migration [22,23]. Figure 2 shows the relative content of three water components and MRI depending on storage time and treatment method. P21 represented content of the bound water entrapped within tertiary and quaternary protein structures. P22 represented the bound water that accounted for 90.5~95.6% of total water. In addition, P23 corresponds to content of free water extramyofibrillar space. It was noted that there were no regular trends in P22 of all samples, while P23 of glazing samples first declined rapidly and then increased steadily [23]. Furthermore, the samples glazed with sodium polyacrylate and D-sodium erythorbate (SG-1DSE, SG-3DSE and SG-5DSE) had lower (p < 0.05) P23 than other groups (CK, WG and WG-DSE).
Image brightness of samples presented a tendency of a red color towards blue color during frozen storage. The red color stands for high proton density and the blue color stands for low proton density in the pseudo-color images. Furthermore, brighter samples were observed inSG-1DSE, SG-3DSE and SG-5DSE groups than that of CK, WG and WG-DSE groups at the same interval, especially in the SG-3DSE group. This may be because samples glazed with sodium polyacrylate and D-sodium erythorbate could effectively inhibit water of myofibrillar network translate to free water [28]. Water component and MRI among different treatments showed the same results. These results demonstrated that samples glazed with sodium polyacrylate and D-sodium erythorbate could better reduce the transformation of water and could maintain the quality of frozen squid (p < 0.05), especially in the SG-3DSE group. Similar LF-NMR results to the findings of water-holding capacity during frozen storage were reported [24,29].
3.3. pH Value and Color Analysis
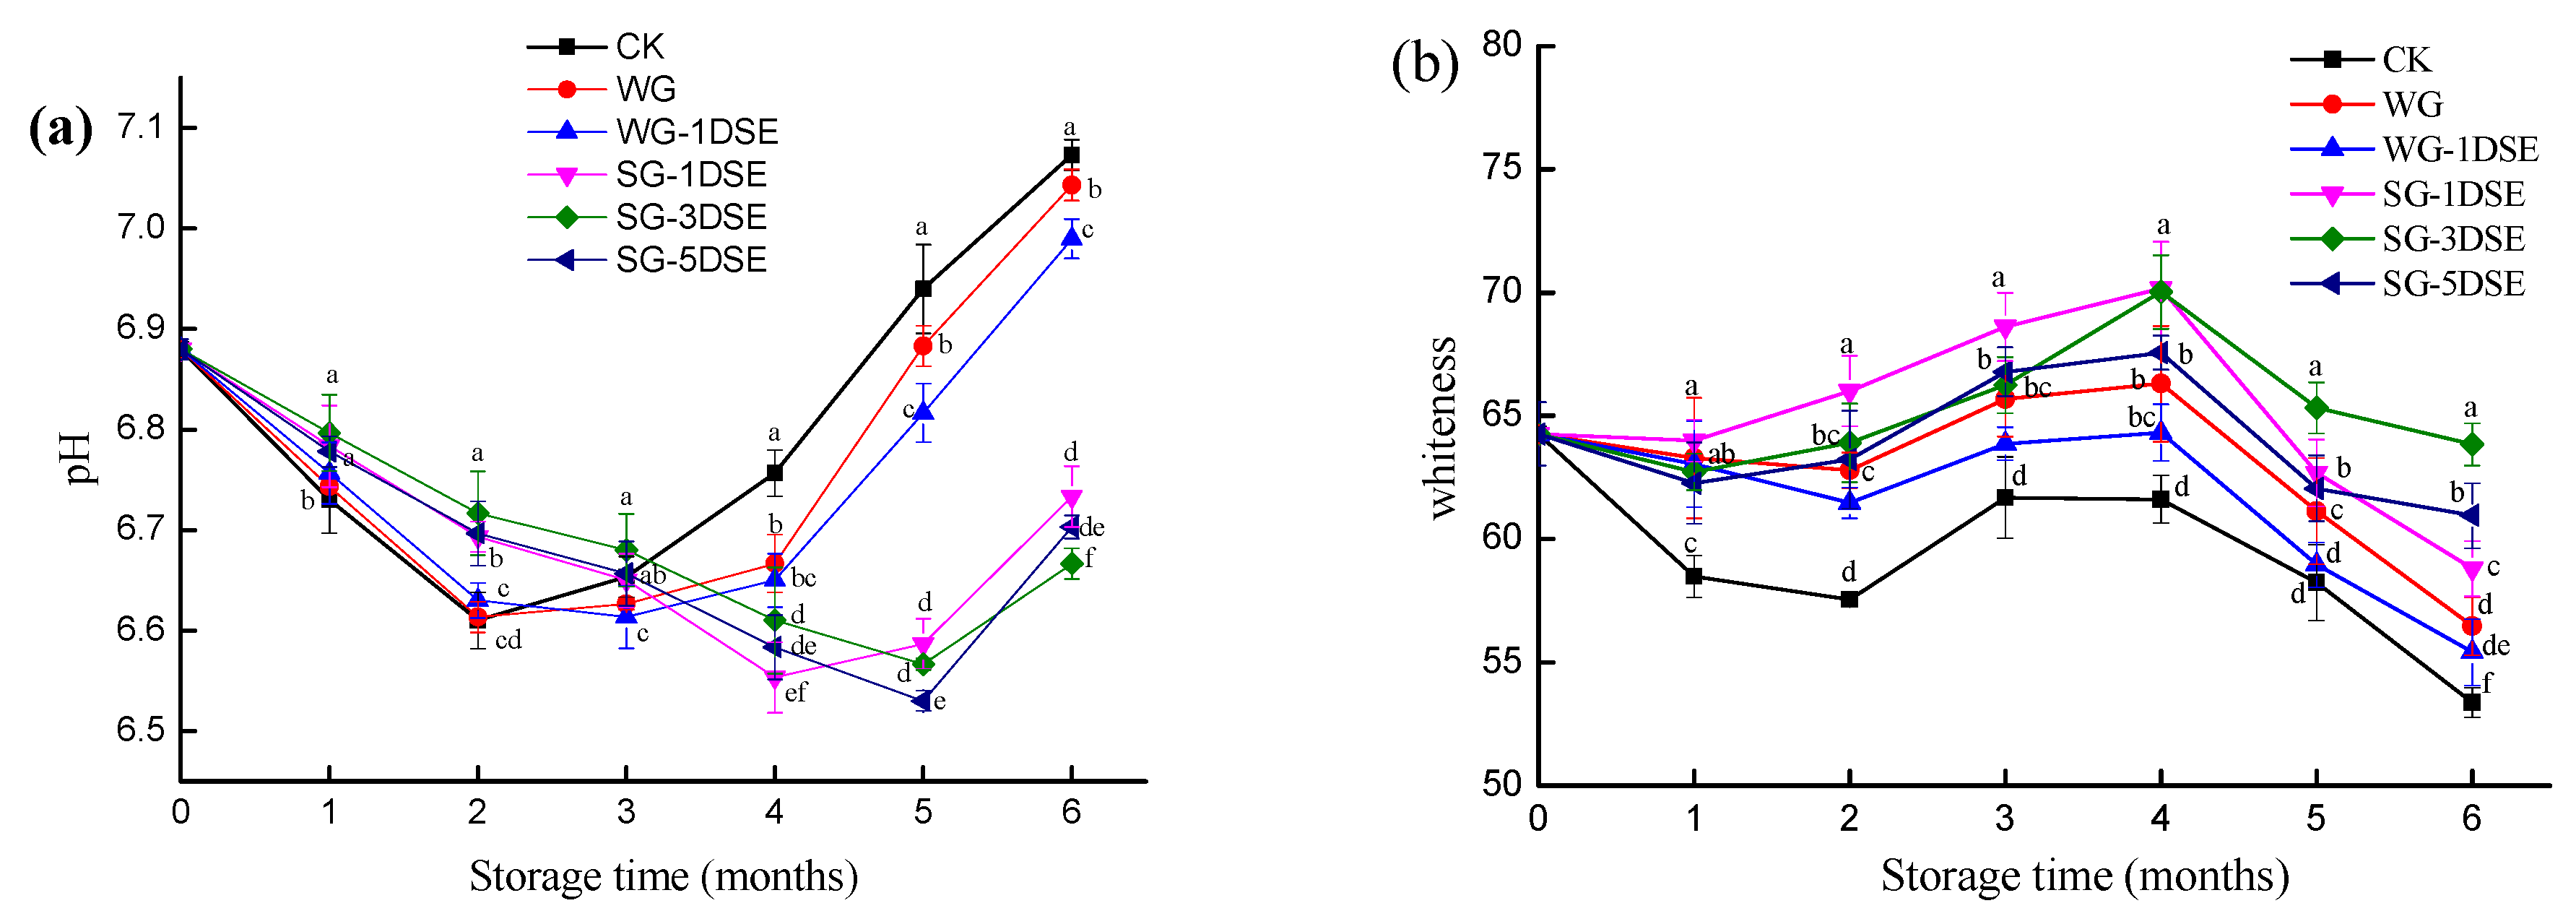
Changes in pH values of all squid samples during frozen storage are shown in Figure 3a. The pH value in all of the treatments first showed a decreasing trend, after that an increase was observed [17,30]. The decrease might be due to obvious acidification which was caused by the liberation of inorganic phosphates and the accumulation of lactic acid produced. As the storage time increased, the followed increase might be attributed to the accumulation of alkaline compounds (e.g., ammonia compounds, trimethylamine) [26,31]. SG-1DSE, SG-3DSE and SG-5DSE groups had significantly (p < 0.05) slower decreasing speed of pH value than those of CK, WG than WG-1DSE groups. It could be concluded that glazing with sodium polyacrylate effectively slowed down microbial growth and inhibited the activity of endogenous proteases, thus extending the extension of preservation of frozen squid. However, there were not significant differences between SG-1DSE, SG-3DSE and SG-5DSE groups.
Color values are widely used to characterize the freshness of fish and the whiteness of squids, which is a desirable parameter for consumers [32,33]. Whiteness of squids during frozen storage was depicted in Figure 3b. In the first four months of frozen storage, the whiteness increased with increasing storage time. This was caused by the frozen enhanced the light reflection intensity and decreased the whiteness [24]. In addition, the freezing denaturation of proteins caused by the increased of ice crystals also affected the increased of whiteness during frozen storage [34]. Whiteness decreased from the fourth to the sixth month, which was related to the degradation products of lipid affected the light reflection intensity [34,35]. However, the glazed groups always showed the higher whiteness compared to that of the unglazed groups (CK) during the frozen storage. Additionally, the whiteness of SG-3DSE group was the highest from 4th to 6th month in the glazed groups. Therefore, glazing significantly (p < 0.05) inhibited the color change of squid and retarded oxidation of proteins and lipids, especially in the SG-3DSE group.
3.4. Lipid Oxidationanalysis
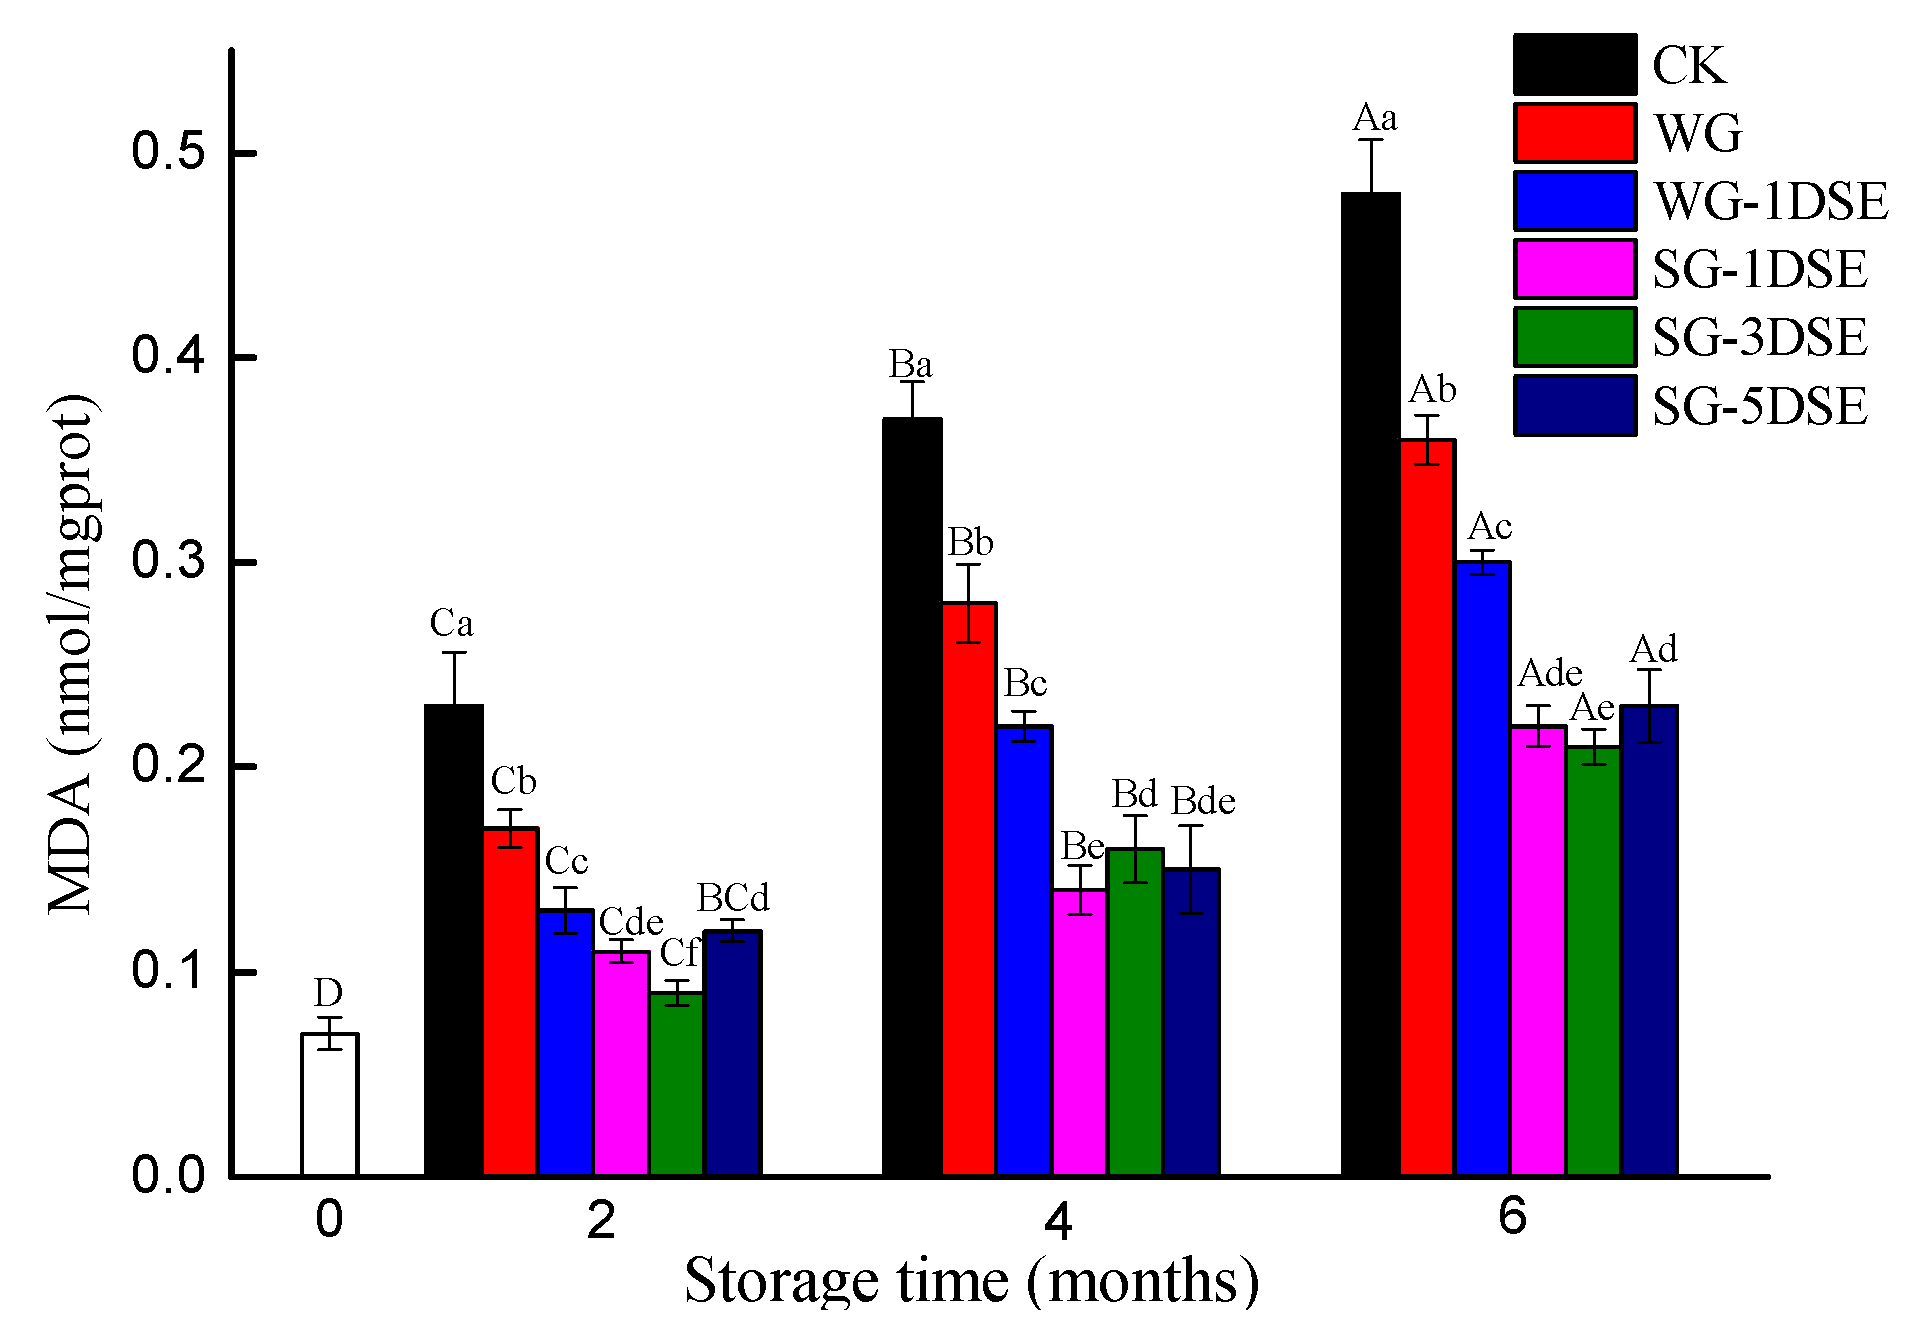
An amount of malonaldehyde (MDA) was employed to measure the extent of lipid oxidation [23,36]. Figure 4 showed that the MDA values for all samples increased during frozen storage, which agreed with the results of Xuan et al. [30]. This could be ascribed to the accumulation of the final products of unsaturated fatty acidoxidation [37]. However, squid is a kind of low-fat fish and MDA values were lower than those of most marine fish. During the whole frozen storage, the MDA values of unglazed squid (CK) increased rapidly (p < 0.05) from the initial value of 0.07 nmol/mgprot compared with the other experimental groups. There are indications that glazing treatment could effectively delay lipid oxidation, inhibiting the increase of MDA values in frozen squid. Although there were not significant differences for MDA values between SG-1DSE, SG-3DSEand SG-5DSE groups, MDA values of these groups still lower than those of other groups at the same interval. The glazing cured on the surfaces of the squid could form a protective film that isolated the squid from the environment [15]. Besides, glazing contain sodium polyacrylate could enhance the function of a protective film. Meanwhile, a slower formation of MDA values was observed in WG-1DSE group compared with the WG group during frozen storage, which was probably attributed to the antioxidant properties of D-sodium erythorbate. Bilinskiet al. [38] also reported that glazing with sodium erythorbate had more anti-oxidative effects than that of water-glaze alone in frozen pacific herring.
3.5. Protein Degradation and Oxidationanalysis
3.5.1. Changes in Free Amino Acids (FAAs)
As is known, squid is rich in proteins and the formation of FAAs caused by the degradation of proteins [39]. The FAAs of squids in the first, third and sixth month during frozen storage are shown in Table 1. It is worth noting that the most abundant amino acids in squid was proline, followed by alanine and arginine, which had a similar finding in squid by Fu et al. [39]. As storage time went on, the total contents of FAAs increased gradually for all samples. This increase was mainly related to the rapid degradation of protein [26]. However, the total contents of FAAs of SG-1DSE, SG-3DSE and SG-5DSE groups were 841.17, 780.16 and 899.63 mg/100 g, which lower than that of CK, WG and that of WG-1DSE groups (2485.43, 1072.28 and 982.23 mg/100 g) after six months of frozen storage. Besides, SG-3DSE group showed lowest the total contents of FAAs than those of SG-1DSE and SG-5DSE groups during frozen storage. As an off-taste amino acid, histidine had similar change properties. The content of histidine increased from 7.03 mg/100 g in first to 96.92 mg/100 g in the sixth month in the CK samples, while in the glazing groups, the WG, WG-1DSE, SG-1DSE, SG-3DSE and SG-5DSE were only 69.88, 48.48, 40.29, 33.52 and 34.01 mg/100 g after six months of storage. These findings suggested that the squid, glazed with sodium polyacrylate and D-sodium erythorbate, could significantly (p < 0.05) inhibit the degradation of proteins, especially in the SG-3DSE group. D-sodium erythorbate, as a preservative with strong antioxidant activity, might develop its antioxidant effects in fish preservation and thus decrease the degradation of proteins. Similarly, Cao et al. [40] introduced the idea that the combined glazing significantly stabilized the proteins by decreasing in the oxidation of protein in frozen shrimp, which was mainly governed by the antioxidant effect of sodium erythorbate. With the addition of sodium polyacrylate, the glazing effectively maintained the quality of squid during frozen storage, which was due to the formed glazing barrier prevented oxidation reactions from oxygen permeation.
3.5.2. Changes in Intrinsic Fluorescence Intensity (IFI)
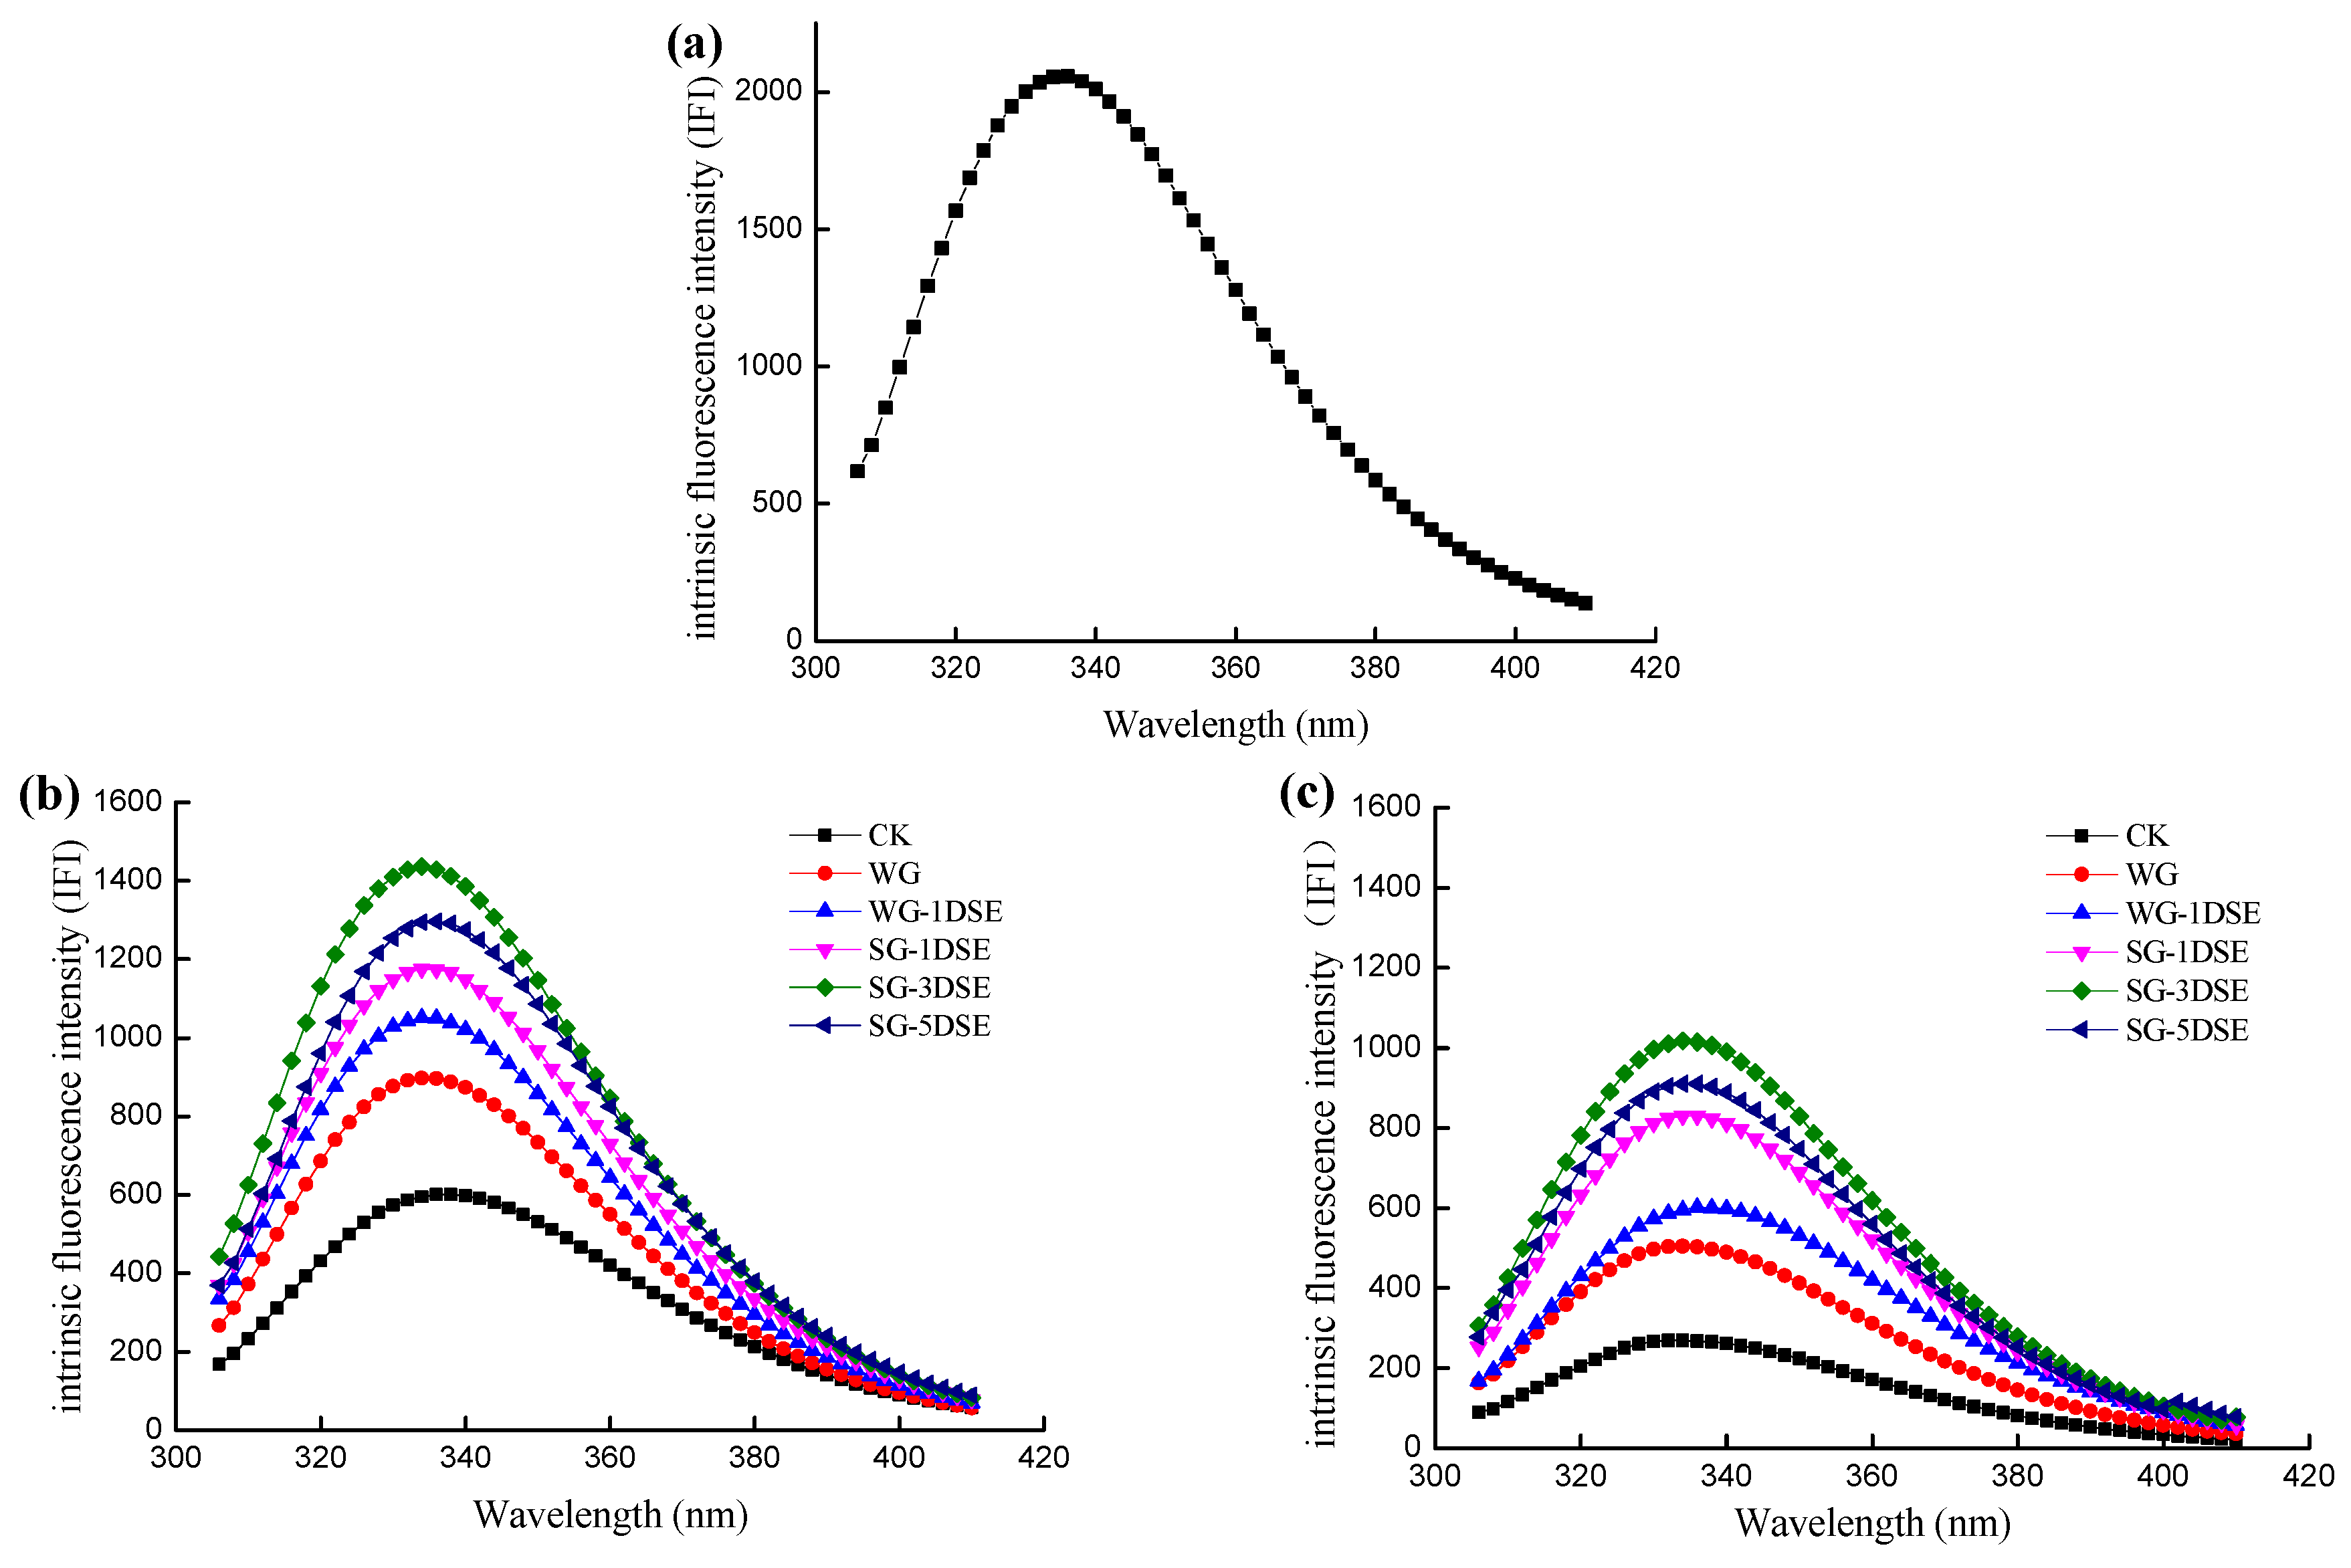
Tryptophan (Trp), a kind of aromatic amino acid, can indicate the degeneration of the protein [15]. The exposure magnitude index of Tryptophan residues could be measured by 295 nm light of intrinsic fluorescence measurements [41,42]. Therefore, changes in the intrinsic fluorescence intensity (IFI) of myofibrillar proteins of squid at month zero, and in the third and 6th months are shown in Figure 5. The data shows that there was a broad band with a maximum at 334 nm, when myofibrillar excited at 295 nm. As storage time went on, the IFI of myofibrillar protein demonstrated a decreasing trend. Compared to the initial value, the IFI in CK, WG, WG-1DSE, SG-1DSE, SG-3DSE and SG-5DSE groups squid decreased to 13.08%, 24.53%, 28.94%, 40.38%, 49.46% and 44.25% after six months of storage, respectively. The decrease in IFI could be ascribed to protein degeneration or denaturation and exposure of indole side chain of Trp [43]. The results revealed that protein degeneration or denaturation occurred rapidly during frozen storage. Compared with the Ck group, glazed samples were observed with lower decrease (p < 0.05) in IFI. Meanwhile, SG-3DSE had the highest IFI in the experimental groups at the same interval. The results also revealed that glazing significantly decreased protein degeneration and changes of structural during frozen storage, especially in the SG-3DSE group, which was consistent with the change of FAAs.
3.5.3. Changes in Sulfhydryl (SH) Content
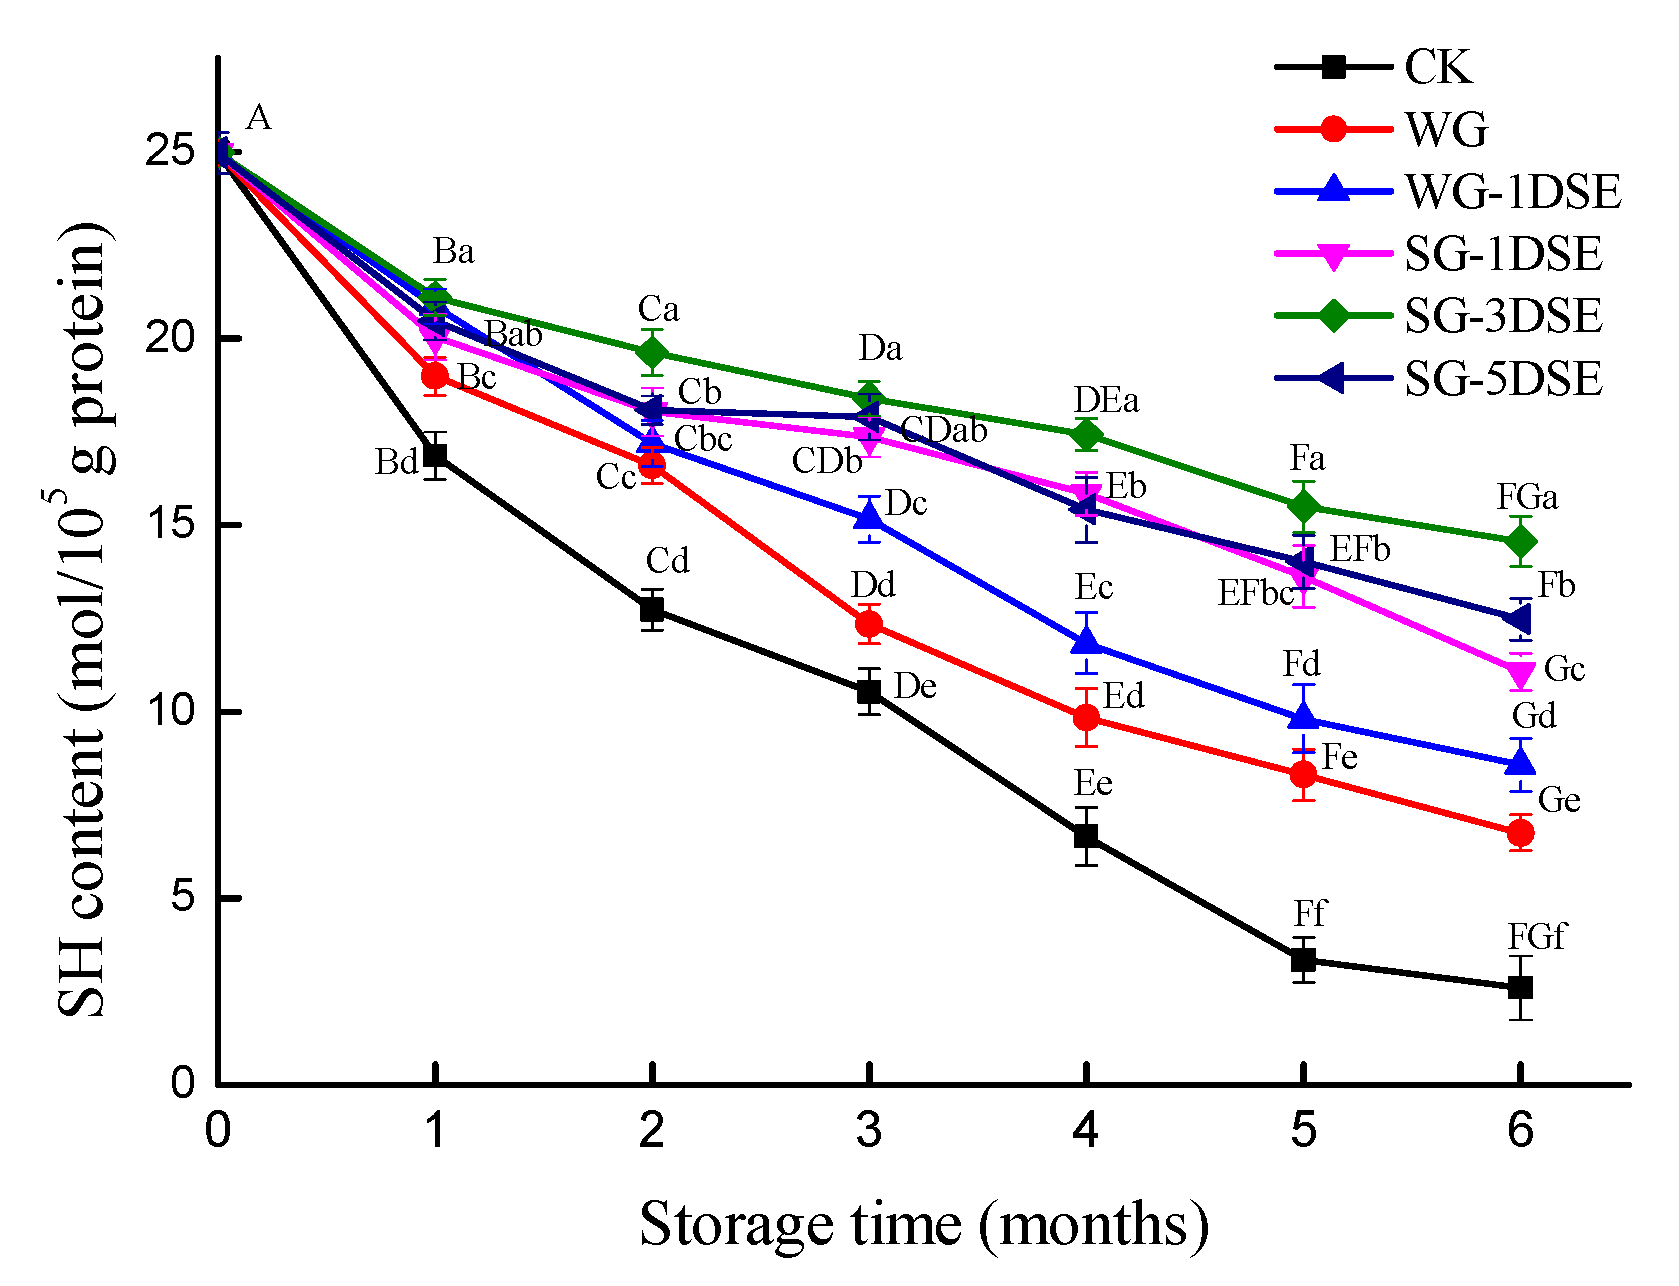
The total sulfhydryl (SH) content of actomyosin was determined to assess the oxidation degree of proteins during frozen storage [44]. As is revealed in Figure 6, the total SH content decreased gradually for all squid samples with the prolonged frozen storage time. The oxidation of SH can be explained by the formation of disulfide bonds following protein denaturation (due to the freezing process) or chemical reaction (cyc can be transformed to serine) [45]. Meanwhile, the serine content increased during frozen storage in Table 1, and the result of IFI showed that protein degeneration or denaturation occurred rapidly during frozen storage. The SH content in CK, WG, WG-1DSE, SG-1DSE, SG-3DSE and SG-5DSE groups squid decreased to 10.41%, 27.03%, 34.32%, 44.33%, 58.30% and 49.94% of the initial value after 6months of storage. Unglazed samples had the highest decrease of the SH content during the entire frozen storage period. After 6 months frozen storage, the SH content for SG-1DSE, SG-3DSE and SG-5DSE groups was significantly (p < 0.05) higher than these that of CK, WG and WG-1DSE groups. Additionally, the lowest decreasing rate was found in the SG-3DSE group. These findings suggested that glazing of squid could retard total SH content decrease and protect the protein from oxidation, especially in the SG-3DSE group. Shi et al. [15] reported that glazing of shrimp could significantly slow the total SH content of myofibrillar protein changes during frozen storage.
4. Conclusions
In this study, six treatment methods (CK, WG, WG-1DSE, SG-1DSE, SG-3DSE and SG-5DSE) were conducted to evaluate the changes of squids’ quality during frozen storage. After six months of frozen storage, the quality of squid declined significantly (p < 0.05), based on the analysis of the quality indexes (WHC, pH, LF-NMR, color, MDA, FAA, IFI and SH content). Compared with the unglazed groups (CK), the application of glazing of squids had a positive effect on moisture loss, lipid oxidation and protein degradation and oxidation. The addition of sodium polyacrylate enhanced the glazing’s water vapor protective barrier, which contributed to quality of squid maintenance. In addition, D-sodium erythorbate, as a preservative with strong antioxidant activity, its addition to glazing significantly inhibited the oxidation of lipids and proteins in squid, and prolonged its shelf-life. Meanwhile, the combination glazing treatment composed of sodium polyacrylate and D-sodium erythorbate efficiently (p < 0.05) delayed quality deterioration parameters than that of single preservative during frozen storage. Especially in the SG-3DSE group, it had great potential to maintain the quality of squid during frozen storage.
Author Contributions
Data curation, M.T. and W.Y.; Formal analysis, M.T. and P.L.; Funding acquisition, J.X.; Investigation, M.T., W.Y. and P.L.; Methodology, M.T. and P.L.; Software, W.Y.; Supervision, J.W. and J.X.; Validation, P.L.; Writing original draft, M.T. and J.W.; Writing review editing, J.X.
Funding
The authors gratefully acknowledge the funding from the National “13th Five-Year” Key Research and Development Program for Science and Technology Support (2018YFD0400605), China Agriculture Research System (CARS-47), and Shanghai Engineering Research Center Construction Special Fund from Shanghai Municipal Science and Technology Commission (17DZ2293400, 19DZ2284000).
Acknowledgments
The authors would like to express their profound gratitude to Weiqiang Qiu from Instrumental Analysis Center of Shanghai Ocean University for his technical assistance.
Conflicts of Interest
The authors declare no conflict of interest.
References
- Huang, C.Y.; Kuo, C.H.; Wu, C.H.; Ku, M.W.; Chen, P.W. Extraction of crude chitosans from squid (Illex argentinus) pen by a compressional puffing-pretreatment process and evaluation of their antibacterial activity. Food Chem. 2018, 254, 217–223. [Google Scholar] [CrossRef] [PubMed]
- García-Sánchez, G.; Sotelo-Romero, C.R.; Pacheco-Aguilar, R.; Ramírez-Suárez, J.C.; Sotelo-Mundo, R.; Scheuren-Acevedo, S.M.; García-Sifuentes, C.O.; Martínez-Porchas, M. Effect of freezing on protein denaturation and gelling capacity of jumbo squid (Dosidicus gigas) mantle muscle. LWT Food Sci. and Technol. 2015, 60, 737–742. [Google Scholar] [CrossRef]
- Rodriguez-Turienzo, L.; Cobos, A.; Moreno, V.; Caride, A.; Vieites, J.M.; Diaz, O. Whey protein-based coatings on frozen Atlantic salmon (Salmo salar): Influence of the plasticiser and the moment of coating on quality preservation. Food Chem. 2011, 128, 187–194. [Google Scholar] [CrossRef] [PubMed]
- Sun, Q.; Sun, F.; Xia, X.; Xu, H.; Kong, B. The comparison of ultrasound-assisted immersion freezing, air freezing and immersion freezing on the muscle quality and physicochemical properties of common carp (Cyprinus carpio) during freezing storage. Ultrason. Sonochemistry. 2019, 51, 281–291. [Google Scholar] [CrossRef] [PubMed]
- Zoldos, P.; Popelka, P.; Marcincak, S.; Nagy, J.; Mesarcova, L.; Pipova, M.; Jevinova, P.; Nagyova, A.; Mal’a, P. The effect of glaze on the quality of frozen stored Alaska pollack (Theragra chalcogramma) fillets under stable and unstable conditions. Acta Veterinaria Brno. 2011, 80, 299–304. [Google Scholar] [CrossRef] [Green Version]
- Soares, N.M.; Fernandes, T.A.; Vicente, A.A. Effect of variables on the thickness of an edible coating applied on frozen fish—Establishment of the concept of safe dipping time. J. Food Eng. 2016, 171, 111–118. [Google Scholar] [CrossRef]
- Vanhaecke, L.; Verbeke, W.; De Brabander, H.F. Glazing of frozen fish: Analytical and economic challenges. Anal. Chim. Acta 2010, 672, 40–44. [Google Scholar] [CrossRef]
- WW, Y. Foreign countries have new regulations on the export of aquatic products “ice clothes”. Ocean. Fish 2017, 7, 21. [Google Scholar] [CrossRef]
- Ylikantola, A.; Linnanto, J.; Knuutinen, J.; Oravilahti, A.; Toivakka, M. Molecular modeling studies of interactions between sodium polyacrylate polymer and calcite surface. Appl. Surf. Sci. 2013, 276, 43–52. [Google Scholar] [CrossRef]
- Zhou, Y.G.; Fu, G.P. The character and applications of edible sodium polyacrylate. China Food Addit. 2009, 1, 114–117. [Google Scholar] [CrossRef]
- Regubalan, B.; Pandit, P.; Maiti, S.; Nadathur, G.T.; Mallick, A. Potential Bio-Based Edible Films, Foams, and Hydrogels for Food Packaging. In Bio-based Materials for Food Packaging: Green and Sustainable Advanced Packaging Materials; Ahmed, S., Ed.; Springer: Singapore, 2018; pp. 105–123. [Google Scholar] [CrossRef]
- Soares, N.; Silva, P.; Barbosa, C.; Pinheiro, R.; Vicente, A.A. Comparing the effects of glazing and chitosan-based coating applied on frozen salmon on its organoleptic and physicochemical characteristics over six-months storage. J. Food Eng. 2017, 194, 79–86. [Google Scholar] [CrossRef]
- Soares, N.M.F.; Oliveira, M.S.G.; Vicente, A.A. Effects of glazing and chitosan-based coating application on frozen salmon preservation during six-month storage in industrial freezing chambers. LWT Food Sci. Technol. 2015, 61, 524–531. [Google Scholar] [CrossRef] [Green Version]
- Sathivel, S.; Liu, Q.; Huang, J.; Prinyawiwatkul, W. The influence of chitosan glazing on the quality of skinless pink salmon (Oncorhynchus gorbuscha) fillets during frozen storage. J. Food Eng. 2007, 83, 366–373. [Google Scholar] [CrossRef]
- Shi, J.; Lei, Y.; Shen, H.; Hong, H.; Yu, X.; Zhu, B.; Luo, Y. Effect of glazing and rosemary (Rosmarinus officinalis) extract on preservation of mud shrimp (Solenocera melantho) during frozen storage. Food Chem. 2019, 272, 604–612. [Google Scholar] [CrossRef] [PubMed]
- Trigo, M.; Rodríguez, A.; Dovale, G.; Pastén, A.; Vega-Gálvez, A.; Aubourg, S.P. The effect of glazing based on saponin-free quinoa (Chenopodium quinoa) extract on the lipid quality of frozen fatty fish. LWT 2018, 98, 231–236. [Google Scholar] [CrossRef] [Green Version]
- He, Q.; Gong, B.; He, J.; Xiao, K. A novel superchilling storage-ice glazing (SS-IG) approach using anti-oxidative and antimicrobial essential oil (EO) for freshness-keeping of sea bass (Dicentrarchus labrax). Aquac. 2019, 500, 243–249. [Google Scholar] [CrossRef]
- Figueirêdo, B.C.; Trad, I.J.; Mariutti, L.R.B.; Bragagnolo, N. Effect of annatto powder and sodium erythorbate on lipid oxidation in pork loin during frozen storage. Food Res. Int. 2014, 65, 137–143. [Google Scholar] [CrossRef]
- Hsu, W.H.; Lai, Y.J.; Wu, S.C. Effects of the anti-microbial peptide pardaxin plus sodium erythorbate dissolved in different gels on the quality of Pacific white shrimp under refrigerated storage. Food Control. 2017, 73, 712–719. [Google Scholar] [CrossRef]
- Mancini, R.A.; Hunt, M.C.; Seyfert, M.; Kropf, D.H.; Hachmeister, K.A.; Herald, T.J.; Johnson, D.E. Comparison of ascorbic acid and sodium erythorbate: Effects on the 24h display colour of beef lumbar vertebrae and longissimus lumborum packaged in high-oxygen modified atmospheres. Meat Sci. 2007, 75, 39–43. [Google Scholar] [CrossRef]
- Zang, J.; Xu, Y.; Xia, W.; Jiang, Q. The impact of desmin on texture and water-holding capacity of ice-stored grass carp (Ctenopharyngodon idella) fillet. Int. J. Food Sci. Technol. 2017, 52, 464–471. [Google Scholar] [CrossRef]
- Li, N.; Liu, W.; Shen, Y.; Mei, J.; Xie, J. Coating Effects of ε-Polylysine and Rosmarinic Acid Combined with Chitosan on the Storage Quality of Fresh Half-Smooth Tongue Sole (Cynoglossus semilaevis Günther) Fillets. Coatings 2019, 9, 273. [Google Scholar] [CrossRef]
- Li, N.; Shen, Y.; Liu, W.; Mei, J.; Xie, J. Low-Field NMR and MRI to Analyze the Effect of Edible Coating Incorporated with MAP on Qualities of Half-Smooth Tongue Sole (Cynoglossus Semilaevis Günther) Fillets during Refrigerated Storage. Appl. Sci. 2018, 8, 1391. [Google Scholar] [CrossRef]
- Zhang, M.; Xia, X.; Liu, Q.; Chen, Q.; Kong, B. Changes in microstructure, quality and water distribution of porcine longissimus muscles subjected to ultrasound-assisted immersion freezing during frozen storage. Meat Sci. 2019, 151, 24–32. [Google Scholar] [CrossRef] [PubMed]
- Campañone, L.A.; Roche, L.A.; Salvadori, V.O.; Mascheroni, R.H. Monitoring of Weight Losses in Meat Products during Freezing and Frozen Storage. Food Sci. Technol. Int. 2002, 8, 229–238. [Google Scholar] [CrossRef]
- Sun, X.; Guo, X.; Ji, M.; Wu, J.; Zhu, W.; Wang, J.; Cheng, C.; Chen, L.; Zhang, Q. Preservative effects of fish gelatin coating enriched with CUR/βCD emulsion on grass carp (Ctenopharyngodon idellus) fillets during storage at 4 °C. Food Chem. 2019, 272, 643–652. [Google Scholar] [CrossRef] [PubMed]
- Solval, K.M.; Espinoza Rodezno, L.A.; Moncada, M.; Bankston, J.D.; Sathivel, S. Evaluation of chitosan nanoparticles as a glazing material for cryogenically frozen shrimp. LWT Food Sci. Technol. 2014, 57, 172–180. [Google Scholar] [CrossRef]
- Sun, X.H.; Xiao, L.; Lan, W.Q.; Liu, S.C.; Wang, Q.; Yang, X.H.; Zhang, W.J.; Xie, J. Effects of temperature fluctuation on quality changes of large yellow croaker (Pseudosciaena crocea) with ice storage during logistics process. J. Food Process. Preserv. 2018, 42, e13505. [Google Scholar] [CrossRef]
- Zhu, H.; O’Farrell, M.; Bouquet, G.; Lunde, K.; Egelandsdal, B.; Alvseike, O.; Berg, P.; Gjerlaug-Enger, E.; Hansen, E.W. Evaluating nuclear magnetic resonance (NMR) as a robust reference method for online spectroscopic measurement of water holding capacity (WHC). J. Food Eng. 2016, 175, 51–57. [Google Scholar] [CrossRef]
- Xuan, X.T.; Fan, Y.F.; Ling, J.G.; Hu, Y.Q.; Liu, D.H.; Chen, S.G.; Ye, X.Q.; Ding, T. Preservation of squid by slightly acidic electrolyzed water ice. Food Control. 2017, 73, 1483–1489. [Google Scholar] [CrossRef]
- Wang, Z.; Hu, S.; Gao, Y.; Ye, C.; Wang, H. Effect of collagen-lysozyme coating on fresh-salmon fillets preservation. LWT 2017, 75, 59–64. [Google Scholar] [CrossRef]
- Pita-Calvo, C.; Guerra-Rodríguez, E.; Saraiva, J.A.; Aubourg, S.P.; Vázquez, M. Effect of high-pressure processing pretreatment on the physical properties and colour assessment of frozen European hake (Merluccius merluccius) during long term storage. Food Res. Int. 2018, 112, 233–240. [Google Scholar] [CrossRef] [PubMed] [Green Version]
- Sun, L.; Sun, J.; Thavaraj, P.; Yang, X.; Guo, Y. Effects of thinned young apple polyphenols on the quality of grass carp (Ctenopharyngodon idellus) surimi during cold storage. Food Chem. 2017, 224, 372–381. [Google Scholar] [CrossRef] [PubMed]
- Ma, L.K.; Zhang, B.; Deng, S.G.; Xie, C. Comparison of the Cryoprotective Effects of Trehalose, Alginate, and Its Oligosaccharides on Peeled Shrimp (Litopenaeus Vannamei) During Frozen Storage. J. Food Sci. 2015, 80, 540–546. [Google Scholar] [CrossRef] [PubMed]
- Lopkulkiaert, W.; Prapatsornwattana, K.; Rungsardthong, V. Effects of sodium bicarbonate containing traces of citric acid in combination with sodium chloride on yield and some properties of white shrimp (Penaeus vannamei) frozen by shelf freezing, air-blast and cryogenic freezing. LWT Food Sci. Technol. 2009, 42, 768–776. [Google Scholar] [CrossRef]
- Li, X.P.; Zhou, M.Y.; Liu, J.F.; Xu, Y.X.; Mi, H.B.; Yi, S.M.; Li, J.R.; Lin, H. Shelf-life extension of chilled olive flounder (Paralichthys olivaceus) using chitosan coatings containing clove oil. J. Food Process. Preserv. 2017, 41, e13204. [Google Scholar] [CrossRef]
- Fan, W.; Chi, Y.; Zhang, S. The use of a tea polyphenol dip to extend the shelf life of silver carp (Hypophthalmicthys molitrix) during storage in ice. Food Chem. 2008, 108, 148–153. [Google Scholar] [CrossRef]
- Bilinski, E.; Jonas, R.E.E.; Lau, Y.C. Control of Rancidity in Frozen Pacific Herring, Clupea harengus pallasi: Use of Sodium Erythorbate. J. Fish. Res. Board Can. 1979, 36, 219–222. [Google Scholar] [CrossRef]
- Fu, X.Y.; Xue, C.H.; Miao, B.C.; Li, Z.J.; Zhang, Y.Q.; Wang, Q. Effect of processing steps on the physico-chemical properties of dried-seasoned squid. Food Chem. 2007, 103, 287–294. [Google Scholar] [CrossRef]
- Cao, H.J.; Zhong, S.Y.; Zhang, B.; Wei, W.Y.; Shen, C.L.; Ying, X.G. Sodium erythorbate, stable chlorine dioxide, and gellan gum glazing for shelf life extension of commercial peeled shrimp (Litopenaeus vannamei) during frozen storage. J. Food Process. Preserv. 2019, e14108. [Google Scholar] [CrossRef]
- Qiu, C.; Xia, W.; Jiang, Q. Pressure-induced changes of silver carp (Hypophthalmichthys molitrix) myofibrillar protein structure. Eur. Food Res. Technol. 2014, 238, 753–761. [Google Scholar] [CrossRef]
- Lina, R.; Yanshun, X.; Qixing, J.; Wenshui, X.; Chunjiang, Q. Investigation on Structural Changes of Myofibrillar Proteins from Silver Carp (Hypophthalmichthys molitrix) during Frozen Storage. Food Sci. Technol. Res. 2013, 19, 1051–1059. [Google Scholar] [CrossRef]
- Lefevre, F.; Fauconneau, B.; Thompson, J.W.; Gill, T.A. Thermal Denaturation and Aggregation Properties of Atlantic Salmon Myofibrils and Myosin from White and Red Muscles. J. Agric. Food Chem. 2007, 55, 4761–4770. [Google Scholar] [CrossRef] [PubMed]
- Benjakul, S.; Visessanguan, W.; Thongkaew, C.; Tanaka, M. Comparative study on physicochemical changes of muscle proteins from some tropical fish during frozen storage. Food Res. Int. 2003, 36, 787–795. [Google Scholar] [CrossRef]
- Riebroy, S.; Benjakul, S.; Visessanguan, W.; Tanaka, M. Effect of iced storage of bigeye snapper (Priacanthus tayenus) on the chemical composition, properties and acceptability of Som-fug, a fermented Thai fish mince. Food Chem. 2007, 102, 270–280. [Google Scholar] [CrossRef]
Figure 1.
Changes of WHC (a) and weight loss (b) of CK, WG, WG-1DSE, SG-1DSE, SG-3DSE and SG-5DSE groups during frozen storage. Different lower case in different groups from same day indicates significant differences (p < 0.05). Different larger case in different groups from different day indicates significant differences (p < 0.05).

Figure 2.
Relative content of three water component (a) and magnetic resonance imaging (MRI) (b) of CK(A), WG (B), WG-1DSE (C), SG-1DSE (D), SG-3DSE (E) and SG-5DSE (F) groups during frozen storage.
Figure 2.
Relative content of three water component (a) and magnetic resonance imaging (MRI) (b) of CK(A), WG (B), WG-1DSE (C), SG-1DSE (D), SG-3DSE (E) and SG-5DSE (F) groups during frozen storage.

Figure 3.
pH value (a) and whiteness (b) of CK, WG, WG-1DSE, SG-1DSE, SG-3DSEand SG-5DSE groups during frozen storage. Different lower case in different groups from same day indicates significant differences (p < 0.05).
Figure 3.
pH value (a) and whiteness (b) of CK, WG, WG-1DSE, SG-1DSE, SG-3DSEand SG-5DSE groups during frozen storage. Different lower case in different groups from same day indicates significant differences (p < 0.05).

Figure 4.
MDA values of CK, WG, WG-1DSE, SG-1DSE, SG-3DSE and SG-5DSE groups during frozen storage. Different lower case in different groups from same day indicates significant differences (p < 0.05). Different larger case in different groups from different day indicates significant differences (p < 0.05).

Figure 5.
The intrinsic fluorescence intensity (IFI) of myofibrillar proteins of CK, WG, WG-1DSE, SG-1DSE, SG-3DSE and SG-5DSE groups in 0th (a), 3rd (b) and 6th (c) month.
Figure 5.
The intrinsic fluorescence intensity (IFI) of myofibrillar proteins of CK, WG, WG-1DSE, SG-1DSE, SG-3DSE and SG-5DSE groups in 0th (a), 3rd (b) and 6th (c) month.

Figure 6.
SH content of CK, WG, WG-1DSE, SG-1DSE, SG-3DSE and SG-5DSE groups during frozen storage. Different lower case in different groups from same day indicates significant differences (p < 0.05). Different larger case in different groups from different day indicates significant differences (p < 0.05).


Table 1.
FAA contents (mg/100g) of CK, WG, WG-1DSE, SG-1DSE, SG-3DSE and SG-5DSE groups during frozen storage.
Table 1.
FAA contents (mg/100g) of CK, WG, WG-1DSE, SG-1DSE, SG-3DSE and SG-5DSE groups during frozen storage.
| Storage | Groups | FAA | ||||||||
| Time | Asp | Thr | Ser | Glu | Gly | Ala | Val | Met | Ile | |
| Month 0 | 8.22 ± 0.12 | 19.86 ± 1.33 | 7.56 ± 0.01 | 24.84 ± 0.05 | 28.60 ± 0.13 | 45.70 ± 0.01 | 16.47 ± 0.02 | 14.95 ± 0.11 | 8.11 ± 0.01 | |
| Month 3 | CK | 37.73 ± 0.32a | 36.80 ± 0.42ab | 28.16 ± 0.45a | 81.65 ± 0.23a | 38.96 ± 0.81b | 114.44 ± 2.14b | 34.61 ± 0.19ab | 34.91 ± 0.24a | 27.21 ± 0.19ab |
| WG | 27.03 ± 3.46b | 37.13 ± 3.36a | 18.64 ± 2.24cd | 73.15 ± 5.30b | 50.51 ± 3.14a | 119.72 ± 2.34a | 37.31 ± 4.74a | 27.61 ± 3.52b | 29.49 ± 3.87a | |
| WG-1DSE | 30.96 ± 0.49b | 35.56 ± 0.37b | 27.96 ± 0.35a | 64.64 ± 0.94c | 32.46 ± 0.42d | 102.67 ± 1.57c | 37.92 ± 0.53ab | 24.21 ± 0.29c | 26.64 ± 0.33b | |
| SG-1DSE | 13.33 ± 2.52d | 26.18 ± 4.77cd | 20.03 ± 3.73c | 41.10 ± 7.77f | 47.008 ± 3.35a | 85.05 ± 9.36e | 22.02±4.15e | 17.67 ± 3.39d | 16.02 ± 3.00e | |
| SG-3DSE | 23.26 ± 1.11c | 25.42 ± 1.17d | 18.89 ± 0.09d | 56.38 ± 3.17d | 36.28 ± 1.53c | 95.34 ± 4.57d | 27.06 ± 1.52d | 18.32 ± 1.06de | 20.42 ± 1.22cd | |
| SG-5DSE | 25.51 ± 1.34c | 29.80 ± 1.46c | 24.49 ± 1.22b | 54.87 ± 3.23de | 32.63 ± 1.61d | 93.63 ± 4.61de | 30.12 ± 1.64c | 19.31 ± 1.04d | 21.53 ± 0.92c | |
| Month 6 | CK | 129.88 ± 0.26a | 162.77 ± 0.68a | 112.86 ± 1.14a | 284.23 ± 2.33a | 137.43 ± 0.45a | 224.53 ± 0.86a | 187.23 ± 0.35a | 105.84 ± 0.11a | 141.02 ± 0.05a |
| WG | 74.678 ± 2.25b | 52.49 ± 3.88b | 41.52 ± 1.19b | 113.13 ± 4.62b | 48.12 ± 0.15d | 135.36 ± 1.46c | 53.36 ± 2.77b | 36.07 ± 2.04b | 43.88 ± 1.31b | |
| WG-1DSE | 61.07 ± 0.55c | 45.29 ± 1.85c | 36.96 ± 0.86c | 91.63 ± 3.67c | 55.03 ± 2.43c | 112.94 ± 4.44e | 50.07 ± 1.61bc | 36.58 ± 1.57bc | 41.08 ± 1.13c | |
| SG-1DSE | 22.7 ± 0.62d | 39.04 ± 1.49d | 30.78 ± 1.65e | 75.64 ± 3.07d | 46.36 ± 2.43de | 119.12 ± 4.71d | 41.8 ± 1.04e | 37.59 ± 1.83b | 30.74 ± 0.46e | |
| SG-3DSE | 18.08 ± 1.56e | 33.27 ± 1.04e | 28.42 ± 0.63f | 61.03 ± 2.74f | 57.64 ± 1.25bc | 135.84 ± 2.48c | 36.89 ± 1.33f | 21.94 ± 0.84e | 25.64 ± 1.22f | |
| SG-5DSE | 21.95 ± 1.86d | 42.20 ± 2.56cd | 34.96 ± 0.50d | 75.69 ± 2.63de | 59.08 ± 2.71b | 152.98 ± 5.49b | 46.67 ± 2.82d | 25.12 ± 1.43d | 33.43 ± 1.57d | |
| Storage | Groups | FAA | ||||||||
| Time | Leu | Tyr | Phe | Lys | His | Arg | Pro | Total | ||
| Month 0 | 23.91 ± 0.02 | 14.13 ± 0.07 | 24.27 ± 0.23 | 8.26 ± 0.01 | 7.03 ± 0.01 | 37.40 ± 1.45 | 94.88 ± 2.47 | 384.20 ± 5.89 | ||
| Month 3 | CK | 55.67 ± 0.33a | 25.82 ± 0.51ab | 44.25 ± 1.88a | 33.36 ± 0.64c | 44.24 ± 0.82a | 76.28 ± 1.45a | 141.02 ± 6.07e | 855.12 ± 10.04a | |
| WG | 54.23 ± 6.98a | 22.29 ± 3.00b | 38.31 ± 5.17b | 40.01 ± 5.01b | 35.13 ± 5.00b | 40.92 ± 5.64f | 187.92 ± 13.04a | 839.43 ± 21.09ab | ||
| WG-1DSE | 26.64 ± 0.60d | 26.64 ± 0.12a | 27.45 ± 0.15cd | 47.27 ± 0.80a | 24.97 ± 0.41c | 67.58 ± 0.71c | 142.38 ± 4.37b | 756.33 ± 8.46c | ||
| SG-1DSE | 32.17 ± 6.06c | 13.79 ± 2.62de | 23.68 ± 4.62de | 19.77 ± 4.11f | 20.60 ± 2.87d | 70.38 ± 4.64b | 133.64 ± 10.07e | 602.44 ± 18.20e | ||
| SG-3DSE | 20.43 ± 1.92e | 20.44 ± 1.03c | 27.12 ± 1.86c | 25.53 ± 1.88e | 17.21 ± 1.24e | 48.84 ± 3.52de | 133.98 ± 7.17be | 627.69 ± 17.99de | ||
| SG-5DSE | 37.00 ± 1.96b | 16.17 ± 0.82d | 26.05 ± 1.35d | 32.84 ± 2.02d | 18.57 ± 2.11de | 54.54 ± 3.25d | 138.53 ± 12.02ef | 643.58 ± 19.24d | ||
| Month 6 | CK | 125.2 ± 0.47a | 126.56 ± 0.46a | 113.82 ± 2.13a | 216.22 ± 0.83a | 96.92 ± 0.34a | 135.82 ± 1.59a | 185.1 ± 2.46a | 2485.43 ± 8.47a | |
| WG | 80.61 ± 3.87b | 37.12 ± 0.64b | 62.64 ± 2.05b | 63.20 ± 0.99b | 59.88 ± 1.12b | 59.44 ± 3.45cd | 110.79 ± 4.06e | 1072.28 ± 23.16b | ||
| WG-1DSE | 76.08 ± 2.19c | 32.33 ± 0.93c | 55.86 ± 1.43c | 53.76 ± 1.98c | 48.48 ± 1.41c | 55.52 ± 1.67e | 129.55 ± 3.79d | 982.23 ± 16.51c | ||
| SG-1DSE | 54.87 ± 2.84d | 26.96 ± 1.06d | 28.65 ± 1.77f | 40.67 ± 2.01de | 40.29 ± 1.83d | 56.73 ± 5.62de | 149.21 ± 6.43b | 841.17 ± 21.43de | ||
| SG-3DSE | 44.01 ± 0.46e | 20.35 ± 2.89ef | 32.17 ± 1.95e | 30.87 ± 2.16f | 33.52 ± 1.25de | 63.95 ± 3.15c | 136.54 ± 4.68c | 780.16 ± 11.43f | ||
| SG-5DSE | 54.54 ± 2.01d | 22.77 ± 1.22e | 36.53 ± 2.19d | 43.11 ± 2.34d | 34.01 ± 2.16d | 79.40 ± 3.75b | 137.16 ± 5.84c | 899.63 ± 22.82d | ||
Different lower case in different groups from same day indicates significant differences (p < 0.05).
© 2019 by the authors. Licensee MDPI, Basel, Switzerland. This article is an open access article distributed under the terms and conditions of the Creative Commons Attribution (CC BY) license (http://creativecommons.org/licenses/by/4.0/).
Share and Cite
MDPI and ACS Style
Tan, M.; Li, P.; Yu, W.; Wang, J.; Xie, J. Effects of Glazing with Preservatives on the Quality Changes of Squid during Frozen Storage. Appl. Sci. 2019, 9, 3847. https://0-doi-org.brum.beds.ac.uk/10.3390/app9183847
AMA Style
Tan M, Li P, Yu W, Wang J, Xie J. Effects of Glazing with Preservatives on the Quality Changes of Squid during Frozen Storage. Applied Sciences. 2019; 9(18):3847. https://0-doi-org.brum.beds.ac.uk/10.3390/app9183847
Chicago/Turabian StyleTan, Mingtang, Peiyun Li, Wenhui Yu, Jinfeng Wang, and Jing Xie. 2019. "Effects of Glazing with Preservatives on the Quality Changes of Squid during Frozen Storage" Applied Sciences 9, no. 18: 3847. https://0-doi-org.brum.beds.ac.uk/10.3390/app9183847
Note that from the first issue of 2016, this journal uses article numbers instead of page numbers. See further details here.