1. Introduction
Agricultural tractors are multi-purpose machines used for performing various types of field operations. Different field operations subject agricultural tractors to varying workloads, which results in varying levels of fuel consumption under different conditions. These conditions include engine speed, soil condition, implementation type, and transmission gear step. Even though the same field operations may be conducted, workload and fuel consumption characteristics change frequently, and improper adjustments to operating conditions decrease tractor fuel efficiency. Engine speed and transmission gear selection are the most significant factors that affect the fuel efficiency of agricultural tractors [
1]. Therefore, in order to improve fuel efficiency, each field operation requires proper adjustment of transmission gear selection and engine speed.
The fuel efficiency of agricultural tractors can be maximized by operating the engine at full load conditions. To operate under full load conditions, engine speed, transmission gears, and workload should be adjusted appropriately. Park et al. reported that during field operations in Korea, tractors were operated in the 24% for plowing and 41% for rotary tillage overpowered condition due to the usage of inappropriate transmission gear and engine speed [
2]. In order to develop an integrated control system for maximizing fuel consumption efficiency, an engine speed control system should be designed to maintain the maximum economic speed of the diesel engine according to workload. Developing an engine speed control system requires the maximization of fuel efficiency and the incorporation of a method that allows engine speed to be controlled automatically.
Various methods have been proposed to maximize the fuel efficiency of tractors using engine speed adjustment control. Park et al. designed a passive eco-driving system in order to assist tractor operators for selecting the optimal operating engine speed and transmission gear depending on the workload. They reported that fuel consumption can be reduced by an average of 69% and 54% in plowing and rotavating operations [
2]. Chancellor and Thai also proposed an automatic system to control the engine speed and transmission gear ratio as optimal conditions using a mechanical instrument for adjusting the governor in five discrete speed ranges. The results showed that the fuel consumption can be reduced by 5–12%, compared to that of a good operator [
3]. Zhang et al. developed a simple mechanical engine throttle control device for maintaining an optimal engine speed based on the measured power take-off (PTO) load. The operation of this device was based on a specific volumetric fuel consumption map. They reported that more than 8% of specific fuel consumption could be reduced by using the throttle control device [
4]. Jiang designed a diesel engine speed controller using an optimal gain scheduling proportional–integral–derivative (PID) controller to improve engine performance and reduce fuel consumption. The engine operating region was divided into 15 sections by engine load and speed, and controller gains were determined through experiments. The fuel-saving performance of the system was reported to be better than existing mechanical speed governor [
5].
The objective of this study is to develop a load-sensitive engine speed control system to maximize fuel efficiency. In order to measure workload, torque transducer was attached to input shaft of transmission. This transducer can measure applied load torque to engine in real time not only PTO load but also draft load. Engine speed controller was developed using model-based controller design method. Simple mechanical system was designed for controlling mechanical fuel pump governor to engine speed within optimal engine speed point based on real time input shaft torque. To validate the performance of the system, an experiment was conducted by comparing plowing operations performed with and without the use of the control system.
2. Controller Design
In this study, the engine speed controller was developed through a model-based design using a tractor simulation model. The engine speed controller is composed of the tractor longitudinal dynamics model with engine performance map, proportional–integral (PI) controller, and desired engine speed determination algorithm for calculating the optimal engine speed. Matlab, Simulink R2015a (MathWorks, Inc., Natick, MA, USA) was used for designing the engine speed controller.
Figure 1 shows a simple block diagram of the engine speed controller using Matlab Simulink [
6].
2.1. Tractor Dynamic Simulation Model
A schematic representation of the dynamic simulation model of the tractor used for calculating its performance parameters is shown in
Figure 2. The simulation model solves the mathematical equations using the previously calculated engine speed, throttle command, and workload to determine the newly calculated engine speed. The engine model was designed using the look-up table module in Matlab/Simulink, and engine torque was defined as a function of rotational speed of engine and throttle opening, given in Equation (1). The tractor simulation model was based on a 48 kW MFWD diesel tractor (Tong Yang Moolsan, Seoul, South Korea). Specifications of the tractor are given in
Table 1 [
7].
where
is engine torque in N·m;
is engine rotational speed in RPM;
is throttle opening in %.
The engine torque for the simulation model was based on the PTO performance data of the T623 tractor tested by the OECD test code considering a power transmission efficiency of 90%. The full-load torque with full throttle was expressed as a second order polynomial of engine speed, and the partial-load torque with both full and reduced throttles (
) by a linear function of engine speed (
) [
8,
9,
10,
11,
12,
13]. The engine torque from Equation (1) was used to calculate the tractive force while considering the applied engine load torque, the selected transmission gear ratio, overall transmission efficiency, and draft load using Equations (2) and (3) [
9,
10,
11,
12,
13].
where
is tractive force in N;
is applied engine load torque;
is transmission efficiency;
. is transmission gear ratio;
is dynamic radius of driving wheel in m;
is draft load in N.
Finally, Equation (2) can be modified to the equation shown below using Equations (2) and (3).
The actual velocity of the tractor was calculated from the following equations using the draft force and the equivalent mass of the tractor.
was calculated using Equation (6). It is the summation of the mass of the tractor chassis and moment of inertia of the rotating part of transmission components, which is divided by the dynamic radius of driving wheel square. The tractor mass (
) and dynamic radius of rear wheel (
for the simulation model was 2485 kg and 0.665 m based on the T623 tractor OECD test report. In order to determine the moment of inertia of the rotating part of transmission (
), engine speed rising time from idle to a certain speed was measured with the gear engaged and engine torque was also measured during engine speed acceleration with full throttle open. Measured engine speed rising time and engine torque were used to calculate engine speed angular acceleration (
). For excluding the effect of load torque and tractor mass, the rear wheel of the tractor was suspended in air. Finally, Equation (7) was used for calculating the moment of inertia of the rotating part of transmission (
).
where
is the summation of equivalent mass of tractor and rotating part of transmission components in kg;
is the derivative of actual velocity in m s
−2;
is angular acceleration of wheel in rad s
−2;
is tractor mass in kg;
is moment of inertia of the rotating part of transmission components in kg m
2.
The actual velocity of the tractor was calculated by integrating the calculated
from Equation (5). The theoretical velocity of the tractor was calculated using Equations (8)–(9) using measured driving wheel slip conditions for 0.1 based on field experiment results. The engine speed for Equation (1) was obtained by multiplying the theoretical velocity and the transmission gear ratio [
9,
10,
11,
12,
13].
where
is the actual velocity of the tractor in m s
−1;
is the theoretical velocity of the tractor in m s
−1;
is slip of driving wheels (decimal);
is initial velocity of the tractor in m s
−1.
In order to characterize the behavior of the diesel engine and the throttle control motor at nominal operating speed, time delays are required in the model [
5]. To determine time delays for the diesel engine, the step input was applied to the diesel engine using the throttle command from 0 to 100%, and the engine speed response time was measured finally. For the throttle control motor, the step input was also applied, and the response time measured. Thus, the time delay of the diesel engine (0.4 s) and the throttle control motor (0.15 s) are represented in the feedback gain of the engine speed controller.
2.2. Desired Engine Speed Determination Algorithm
The desired engine speed required to maximize fuel efficiency was determined by an optimum fuel consumption curve as a function of the applied engine load torque (y-axis), which was measured at the transmission input shaft. A method proposed by Kim et al. was used to construct a specific volumetric fuel consumption (SVFC) map under the given load conditions [
13,
14]. Contours of equal SVFC of the model tractor are shown in
Figure 3 [
13]. To construct the optimum fuel efficiency curve, the minimum SVFC point was taken from each applied engine load torque and connected to a single regression curve point, such as the exponential functions shown in
Figure 3. The low-torque region of the optimum curve was slightly shifted to the rated speed to guarantee a stable response to unexpected workload fluctuations.
2.3. PI Controller
A graphical representation of the PI controller used in this study is shown in
Figure 4. This controller produced a throttle command for engine speed control using the difference between the desired and real engine speeds and the PI control algorithm. An anti-wind-up controller was used for preventing the saturation of the integrator [
15].
3. Computer Simulation
Computer simulations were conducted to validate the previously developed dynamic tractor simulation model, and to adjust the gains of the PI controller. Additional simulations were conducted to observe variations in fuel consumption and the dynamic behavior of the engine. In the simulations, the same conditions as an actual plowing operation were applied to the developed tractor model with the PI controller.
To verify the tractor simulation model, plowing operations were conducted [
13]. The throttle opening and workload input data for the simulation model were collected during the field operations, as shown in
Figure 5. Tractor performance data, including the input shaft torque and engine speed, were monitored during the operations and the results were compared with those simulated by the tractor model under the same throttle opening and workload conditions from field plowing operation data.
To optimize the PI controller, the engine speed responses to step and ramp inputs of workload under various PI controller gain parameters were simulated, and the optimal controller parameters were determined with the aim to minimize the root mean square error (RMSE) between the desired and actual engine speeds.
The initial values of the gain parameters (K
p, K
i) of the PI controller were determined using the Ziggler and Nichols gain tuning methods, based on the engine speed response from the step input of engine throttle [
15]. In this research, the main objective of gain tuning is minimizing the engine speed overshoot by commanding a desired engine speed. If engine speed overshoot occurs during field operation, the engine could become unstable.
Finally, the controllability and response performance of the controller was simulated using the dynamic tractor simulation model, and the collected workload from plowing operations was used as input data for the simulation model.
3.1. Validation of Tractor Model
In order to validate the simulation model, the simulated engine speed and input shaft torque were compared with field experiment data, as shown in
Figure 6 and
Figure 7. The measured and simulated values were found to be similar. The average percentage errors were calculated using Equation (10).
where
is average percentage error in %;
is sample number;
is simulated value at
step;
is measured value at
step.
The average percentage errors and standard deviation between simulated and measured engine speed values were 2.03% and 1.37%. For input shaft torque, the average percentage error and standard deviation were 4.87% and 3.95%, respectively.
Therefore, the plowing operation could be simulated by the dynamic simulation model within a 5% average error using the measured engine throttle opening and workload. As a result, the developed model was considered as a suitable simulation model for optimizing the engine speed controller.
3.2. Optimization Results of Controller Parameter
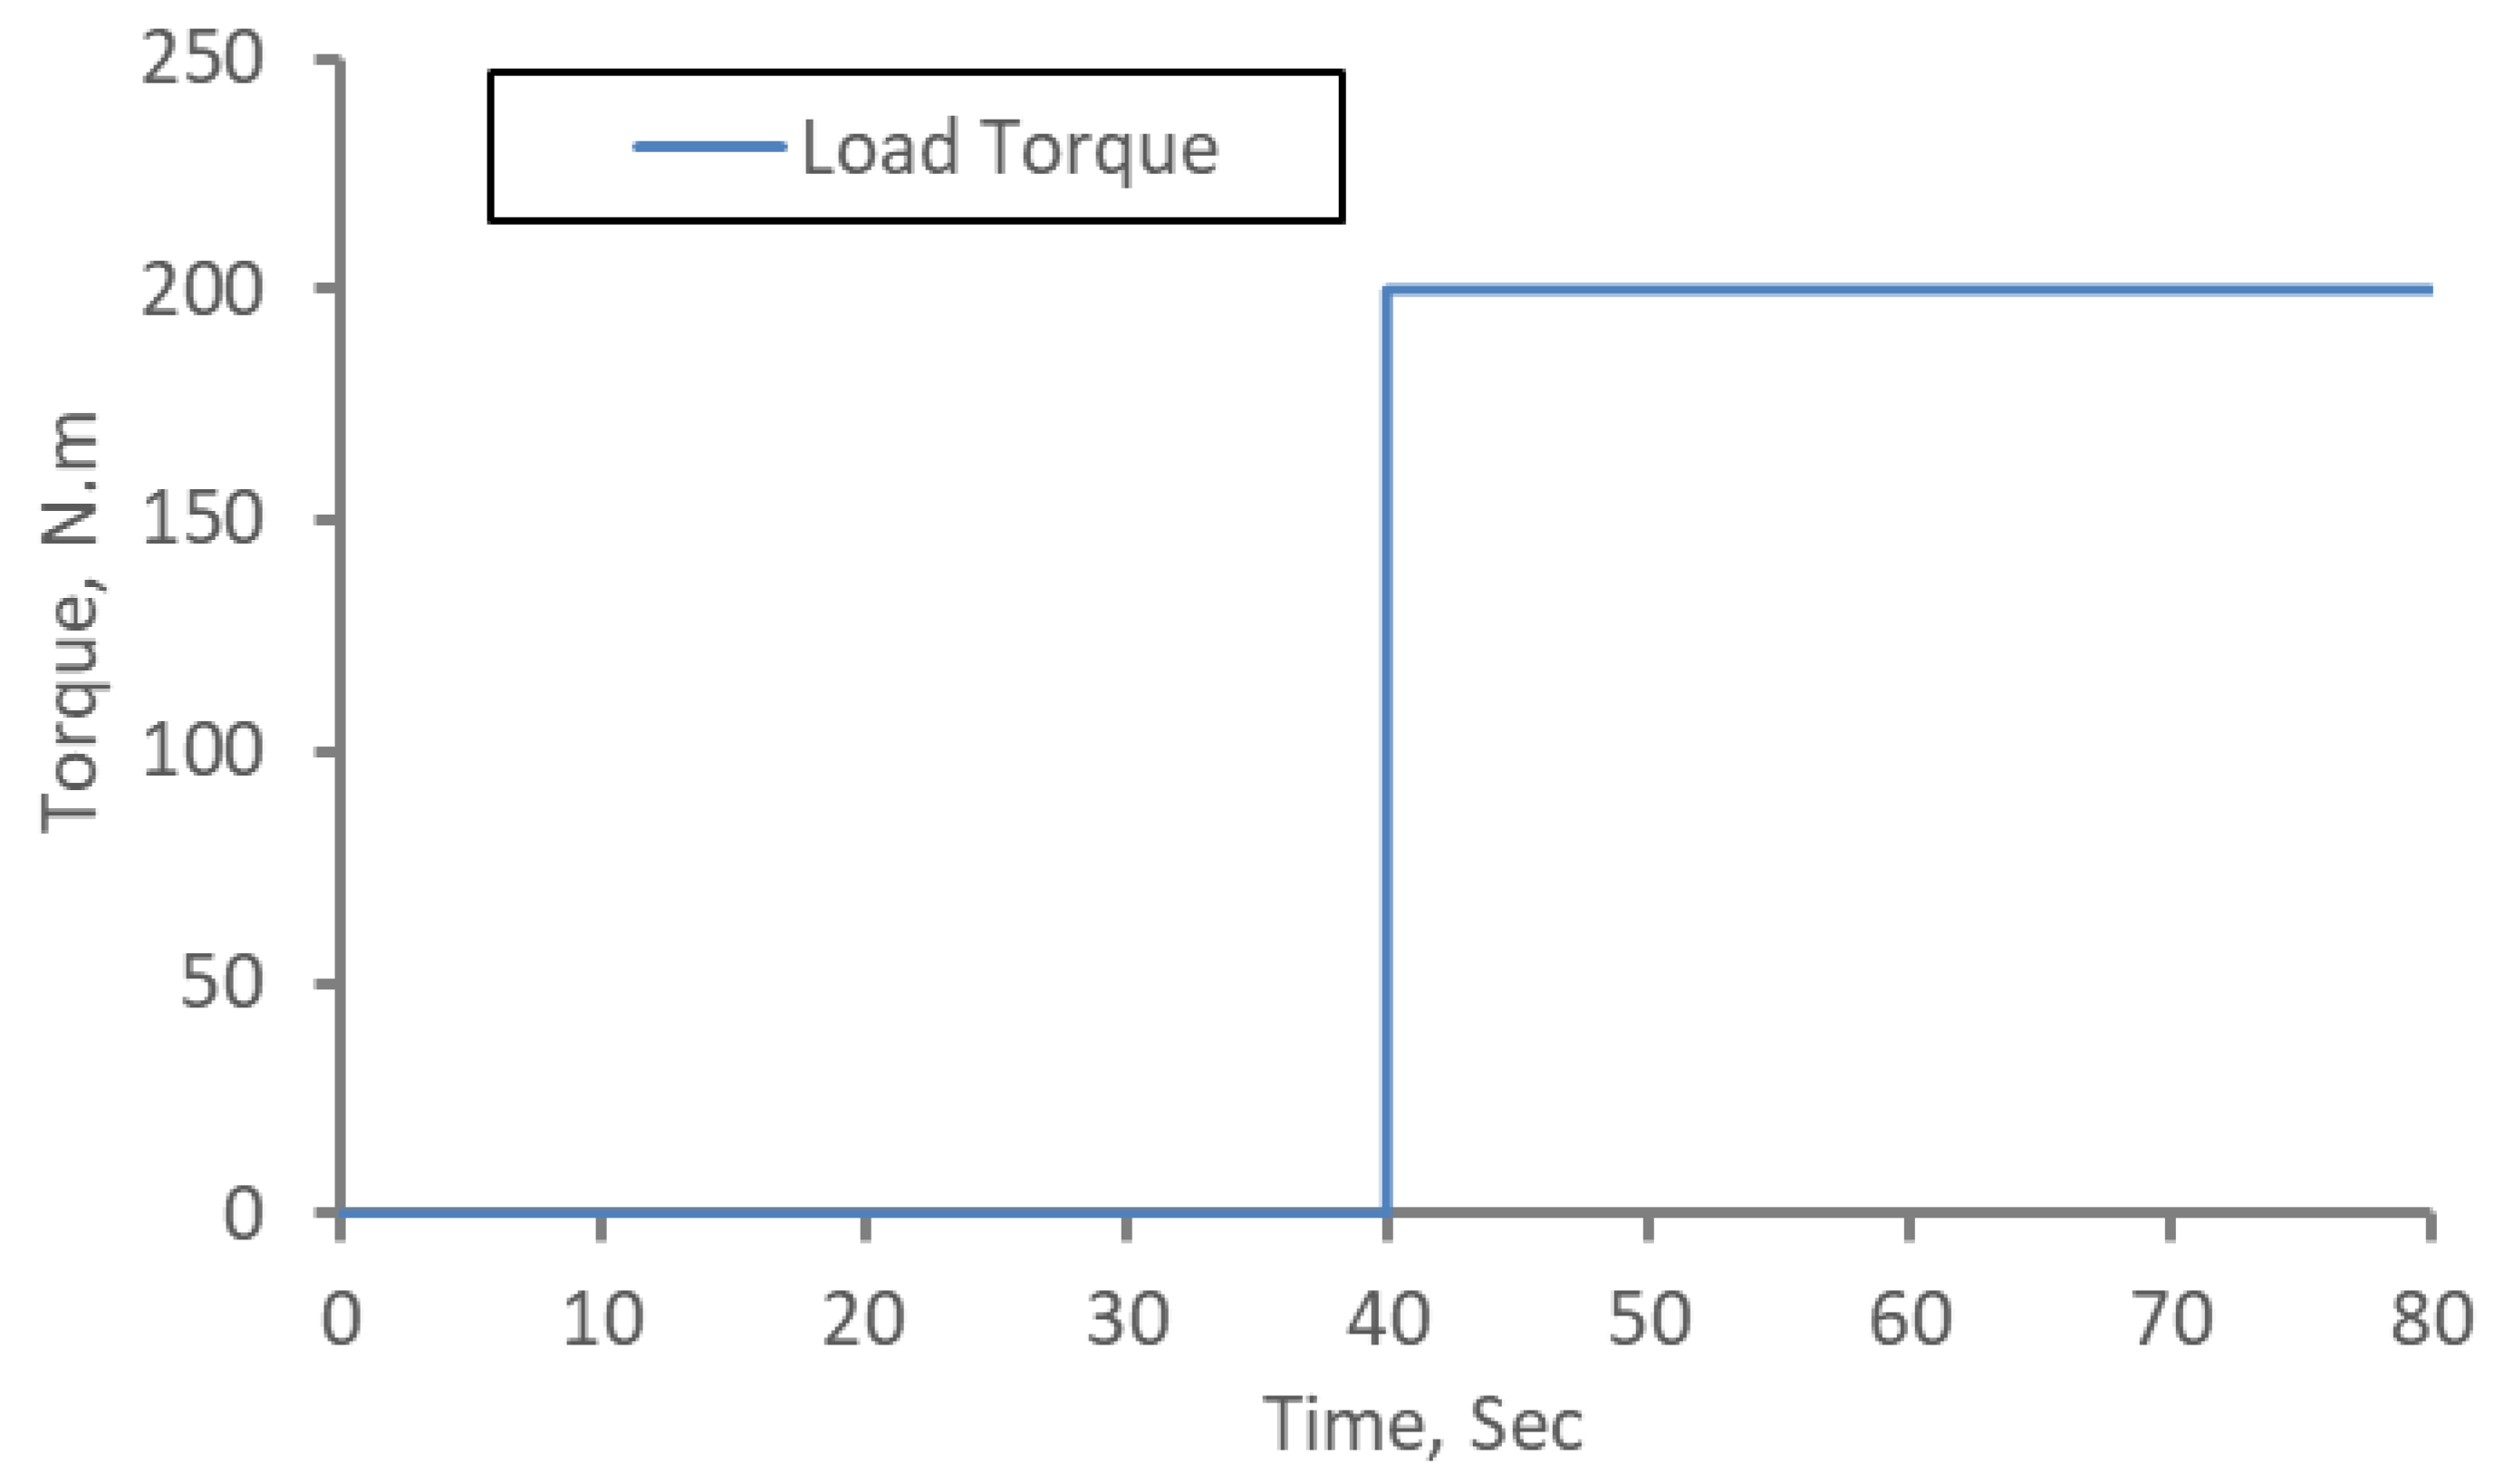
In order to optimize the engine speed controller parameter, the load torque acting on the transmission input shaft was assumed to be a step and ramp input, as shown in
Figure 8 and
Figure 9. The engine speed determination algorithm determined the desired engine speed required to maximize fuel efficiency by using the load torque of the input shaft, as shown in
Figure 3.
Therefore, the desired engine speed from the algorithm (
Figure 3) could also be determined in terms of the step and ramp shaped input load torque.
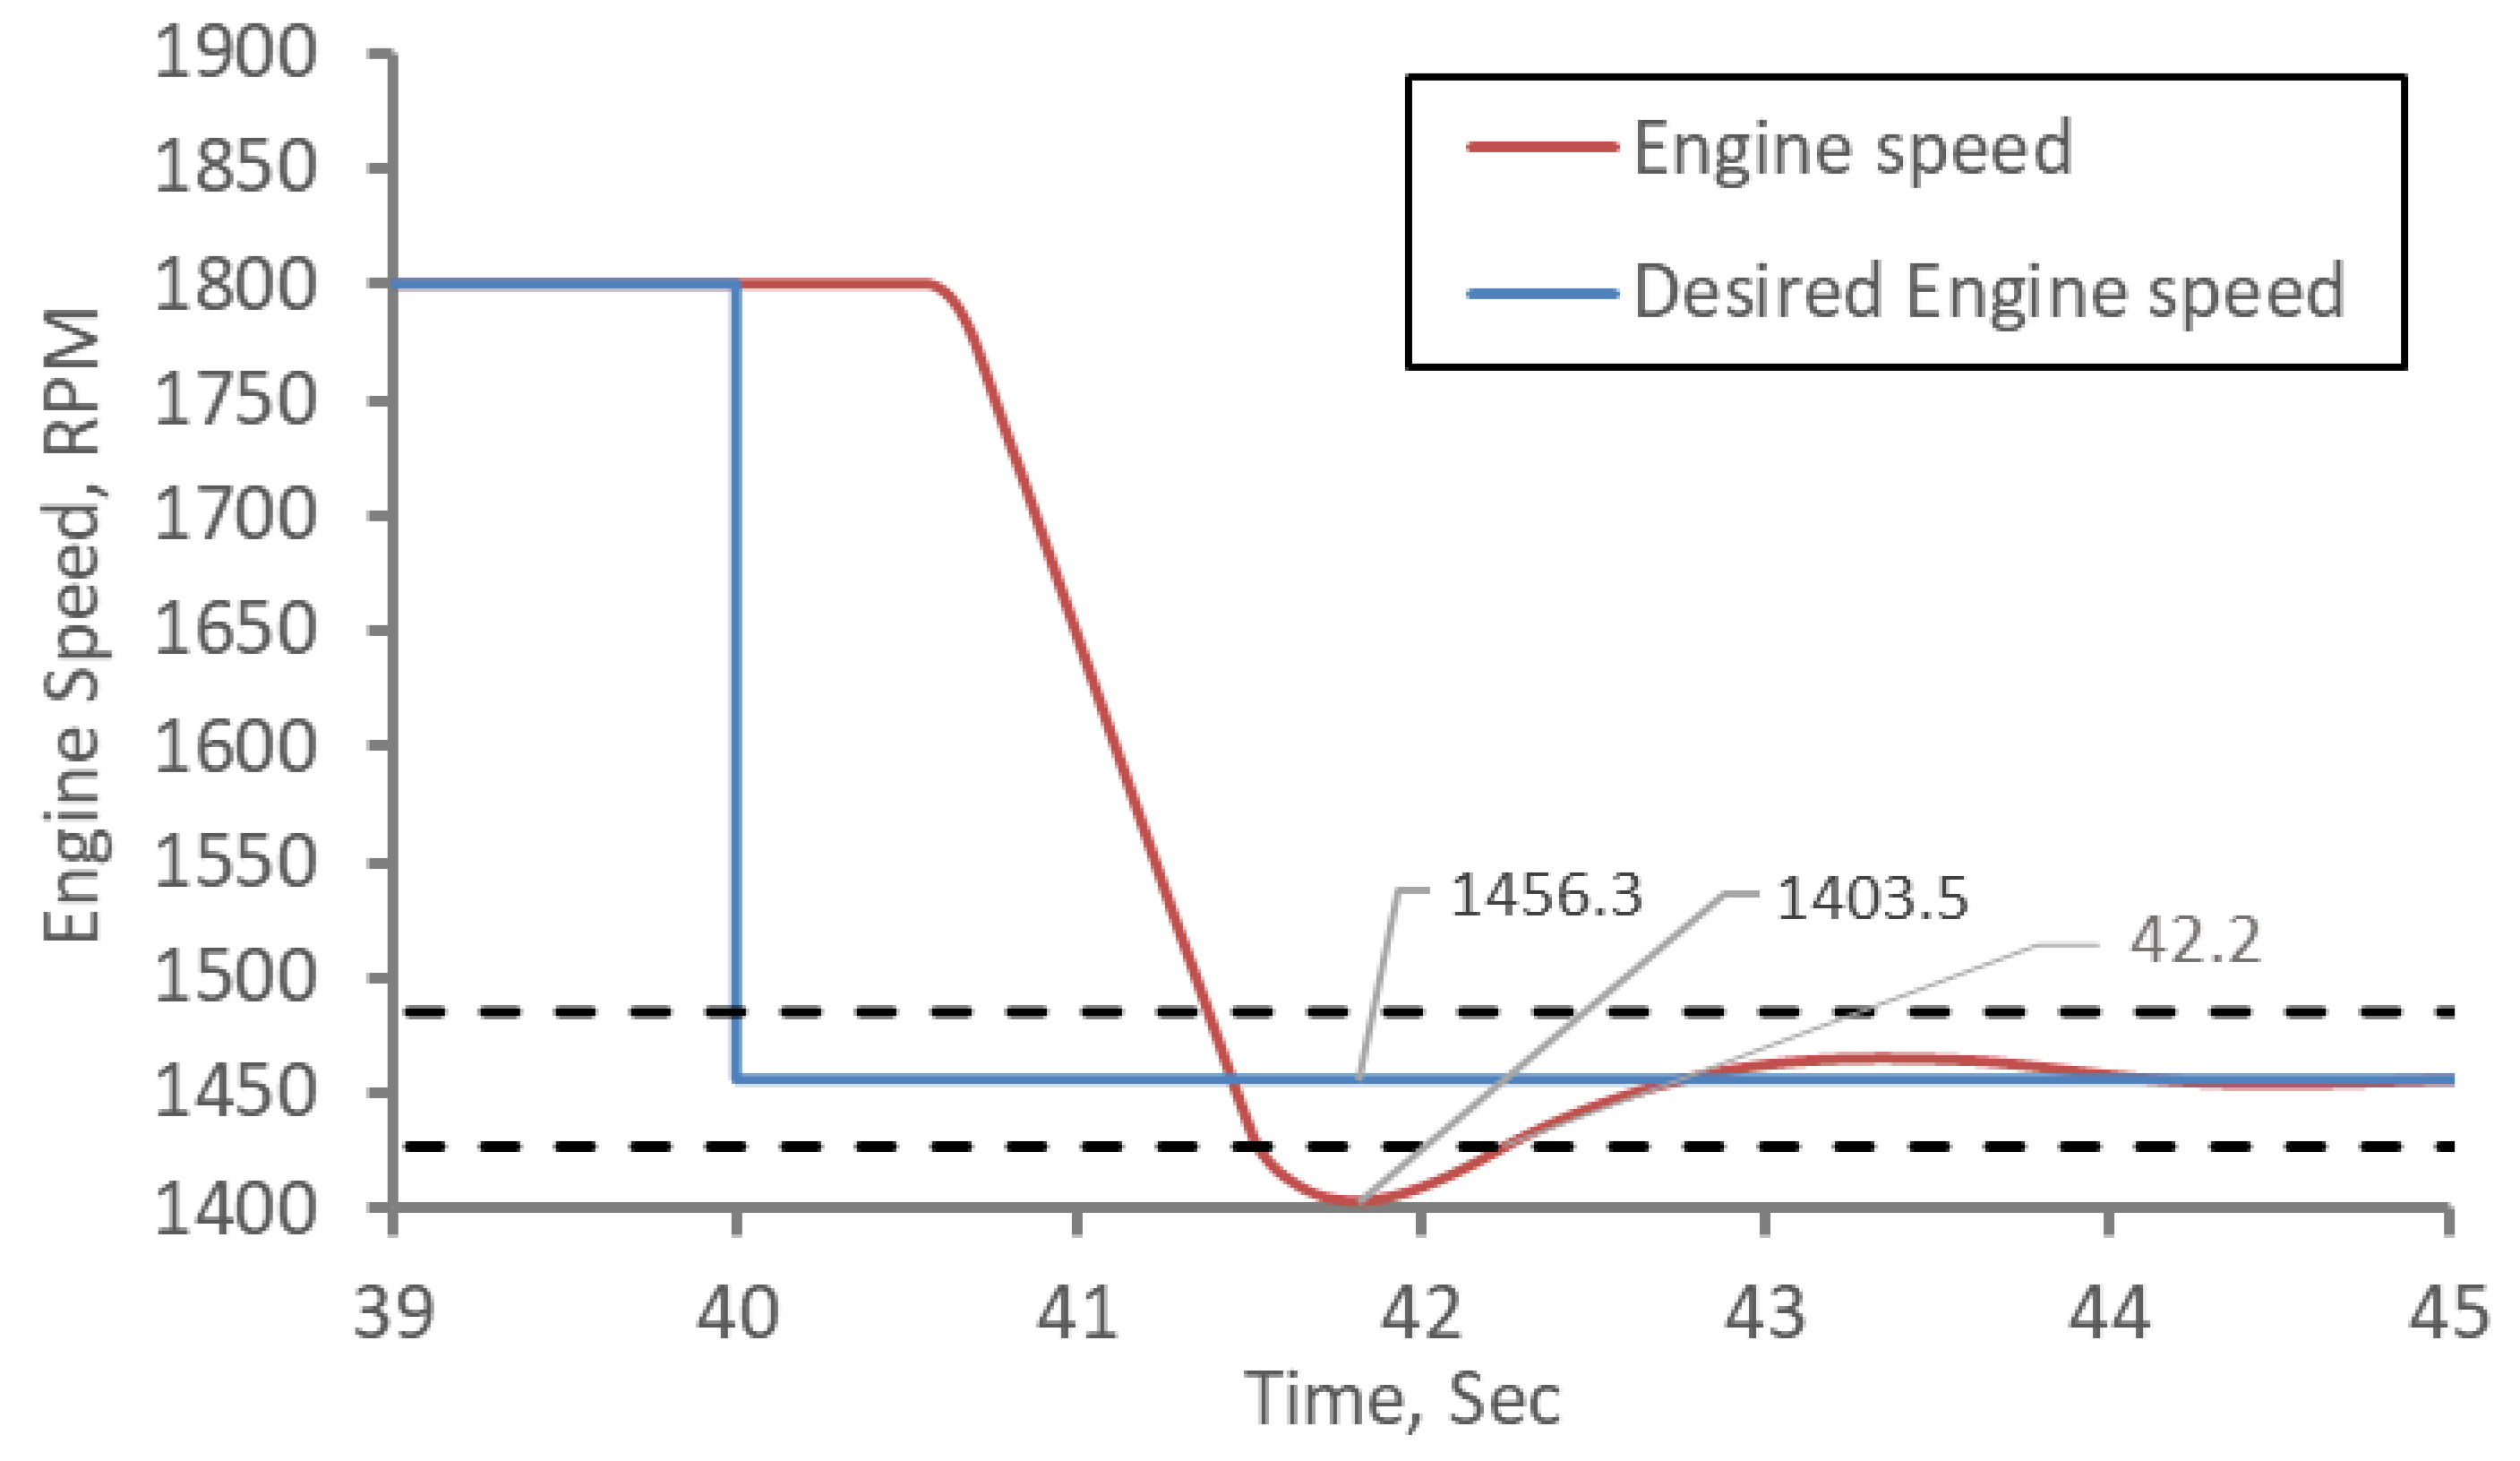
Figure 10 shows the simulation results for the step response of the engine speed controller using the tuned gain parameter. The maximum overshoot for the step input was approximately 53 rpm from the desired engine speed, which is approximately 3.6% of the target value. The settling time of the engine speed controller was set to 2% of the target value. The settling time of the step input simulation results required approximately 2.2 s. These responses were due to the constant time delay of the diesel engine (0.4 s) and the motor (0.15 s).
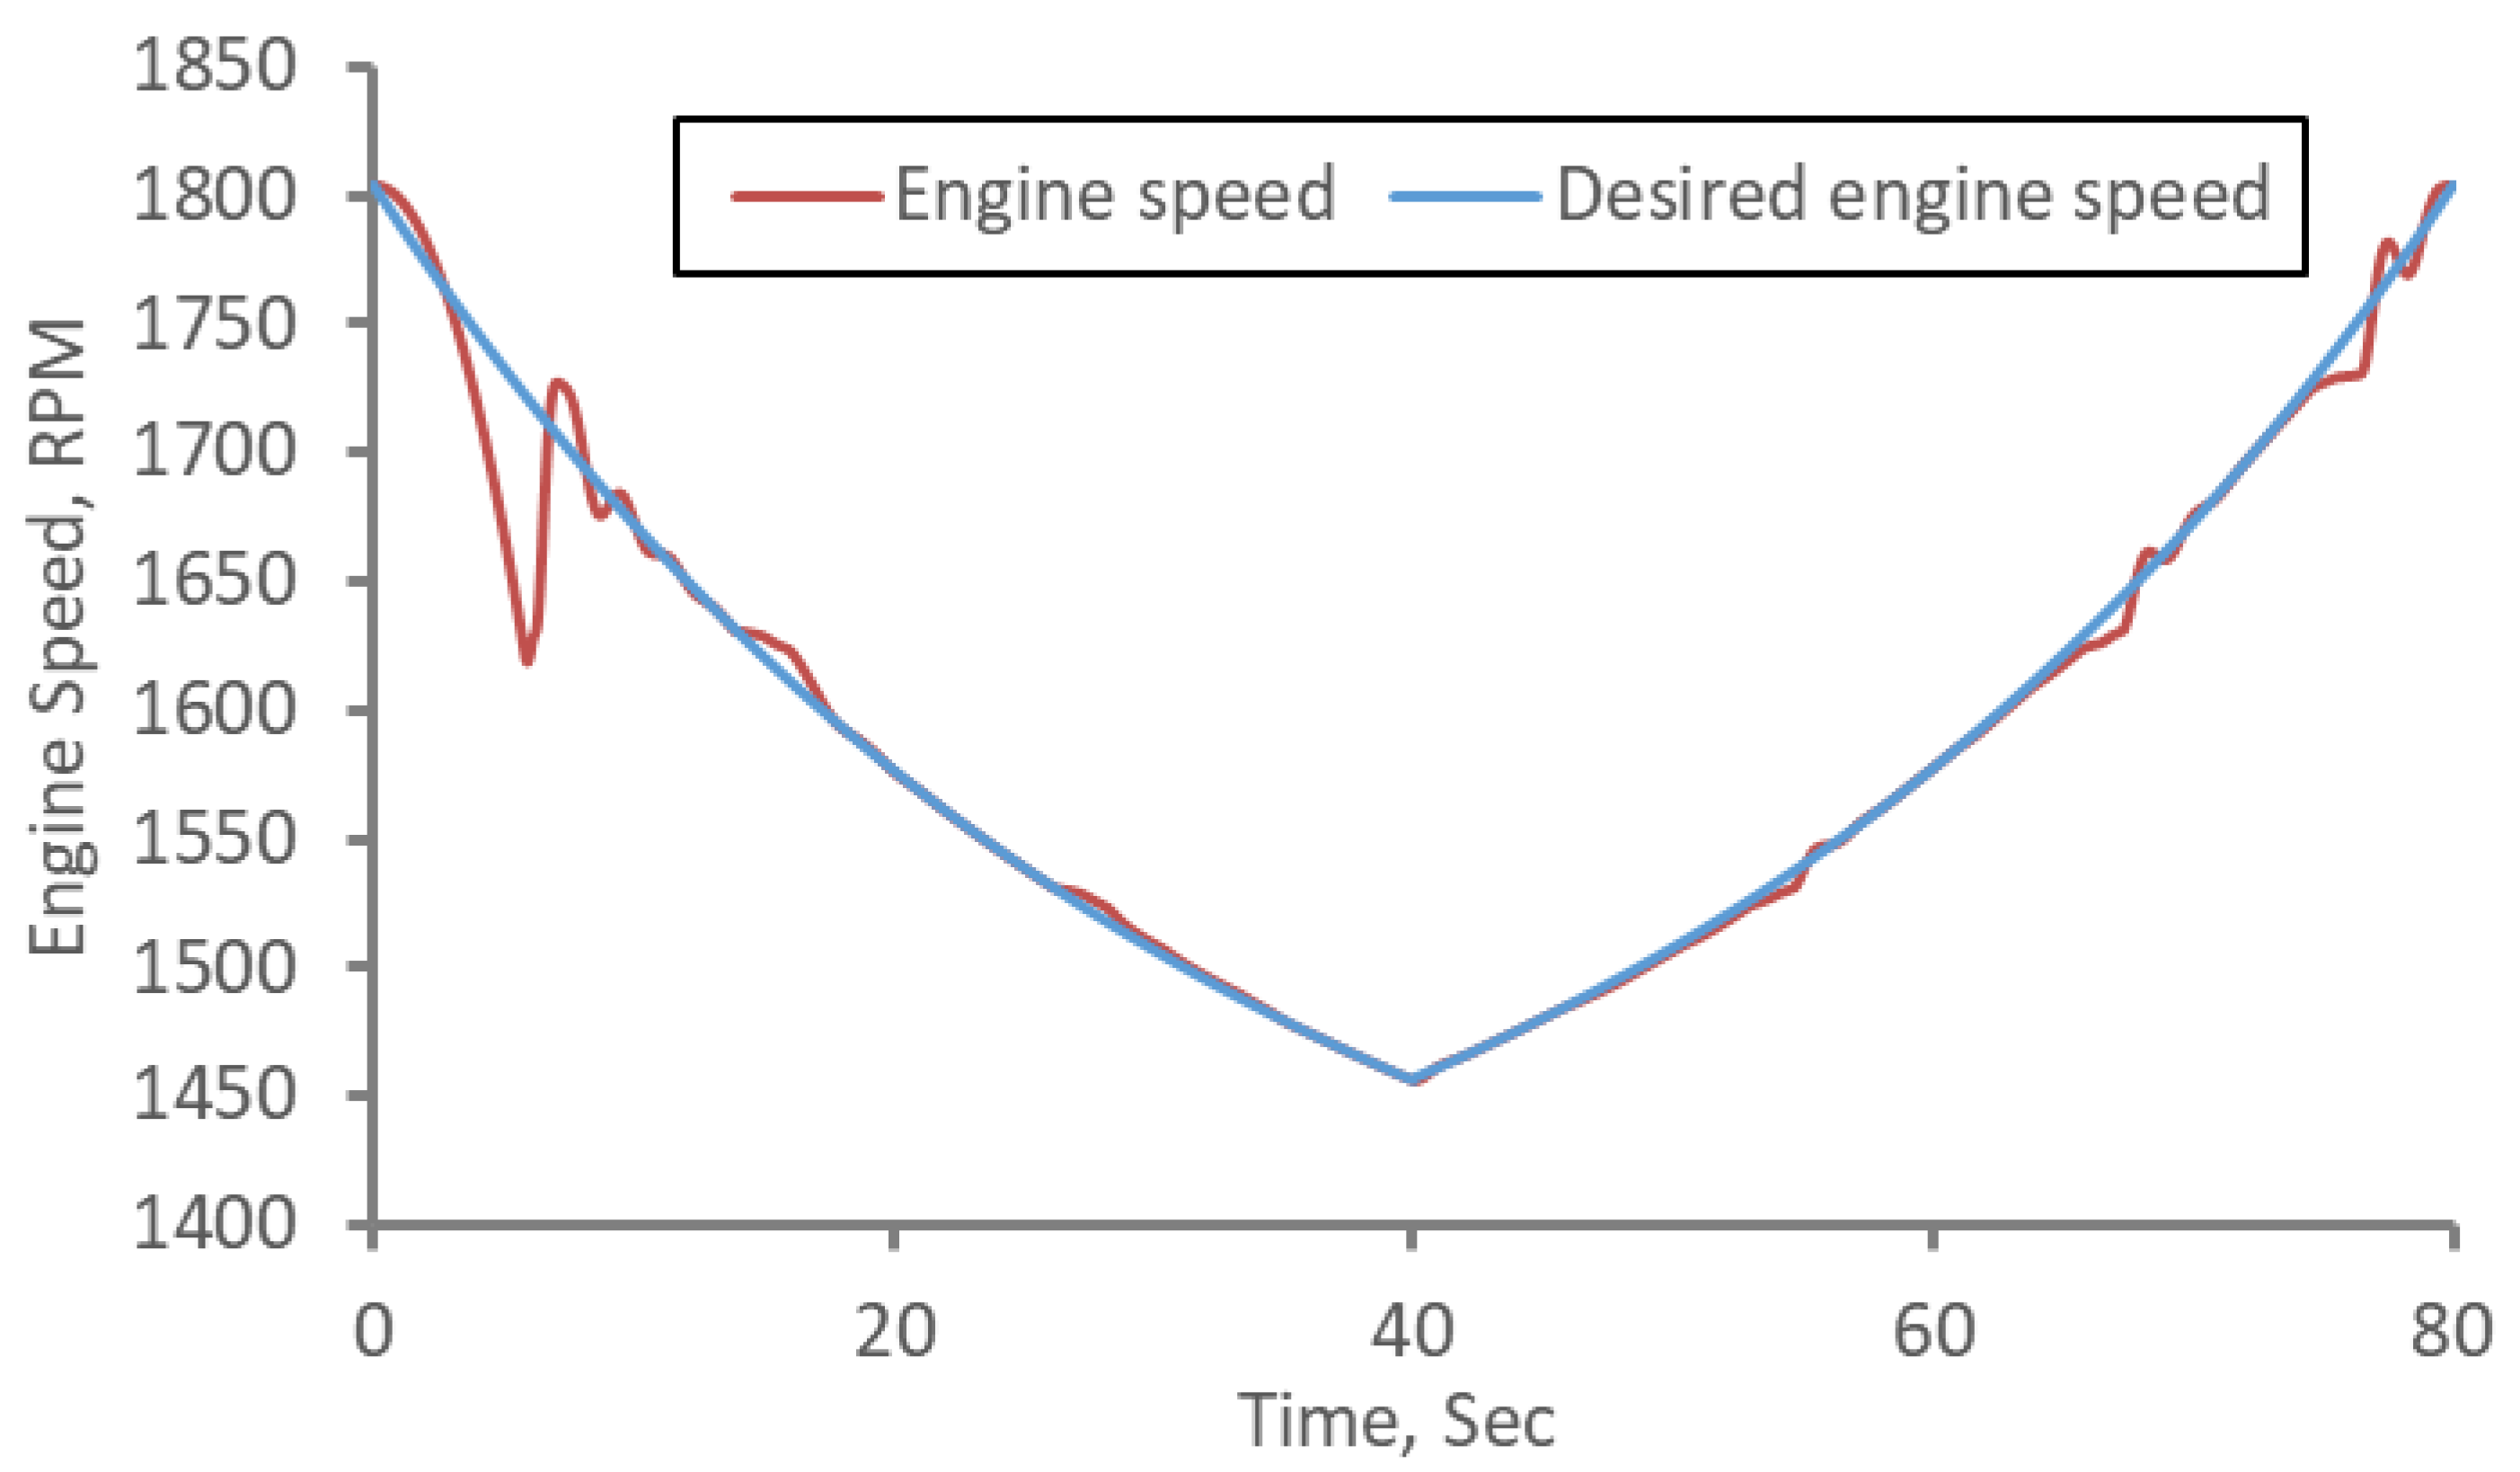
Figure 11 shows the simulation results of the ramp response of the engine speed controller using the tuned gain parameter. The engine speed controller was found to show high traceability within a 2.1% averaged error from the desired engine speed. This was concluded to be acceptable for application to the actual load using the determined gain parameters.
3.3. Actual Load Simulation
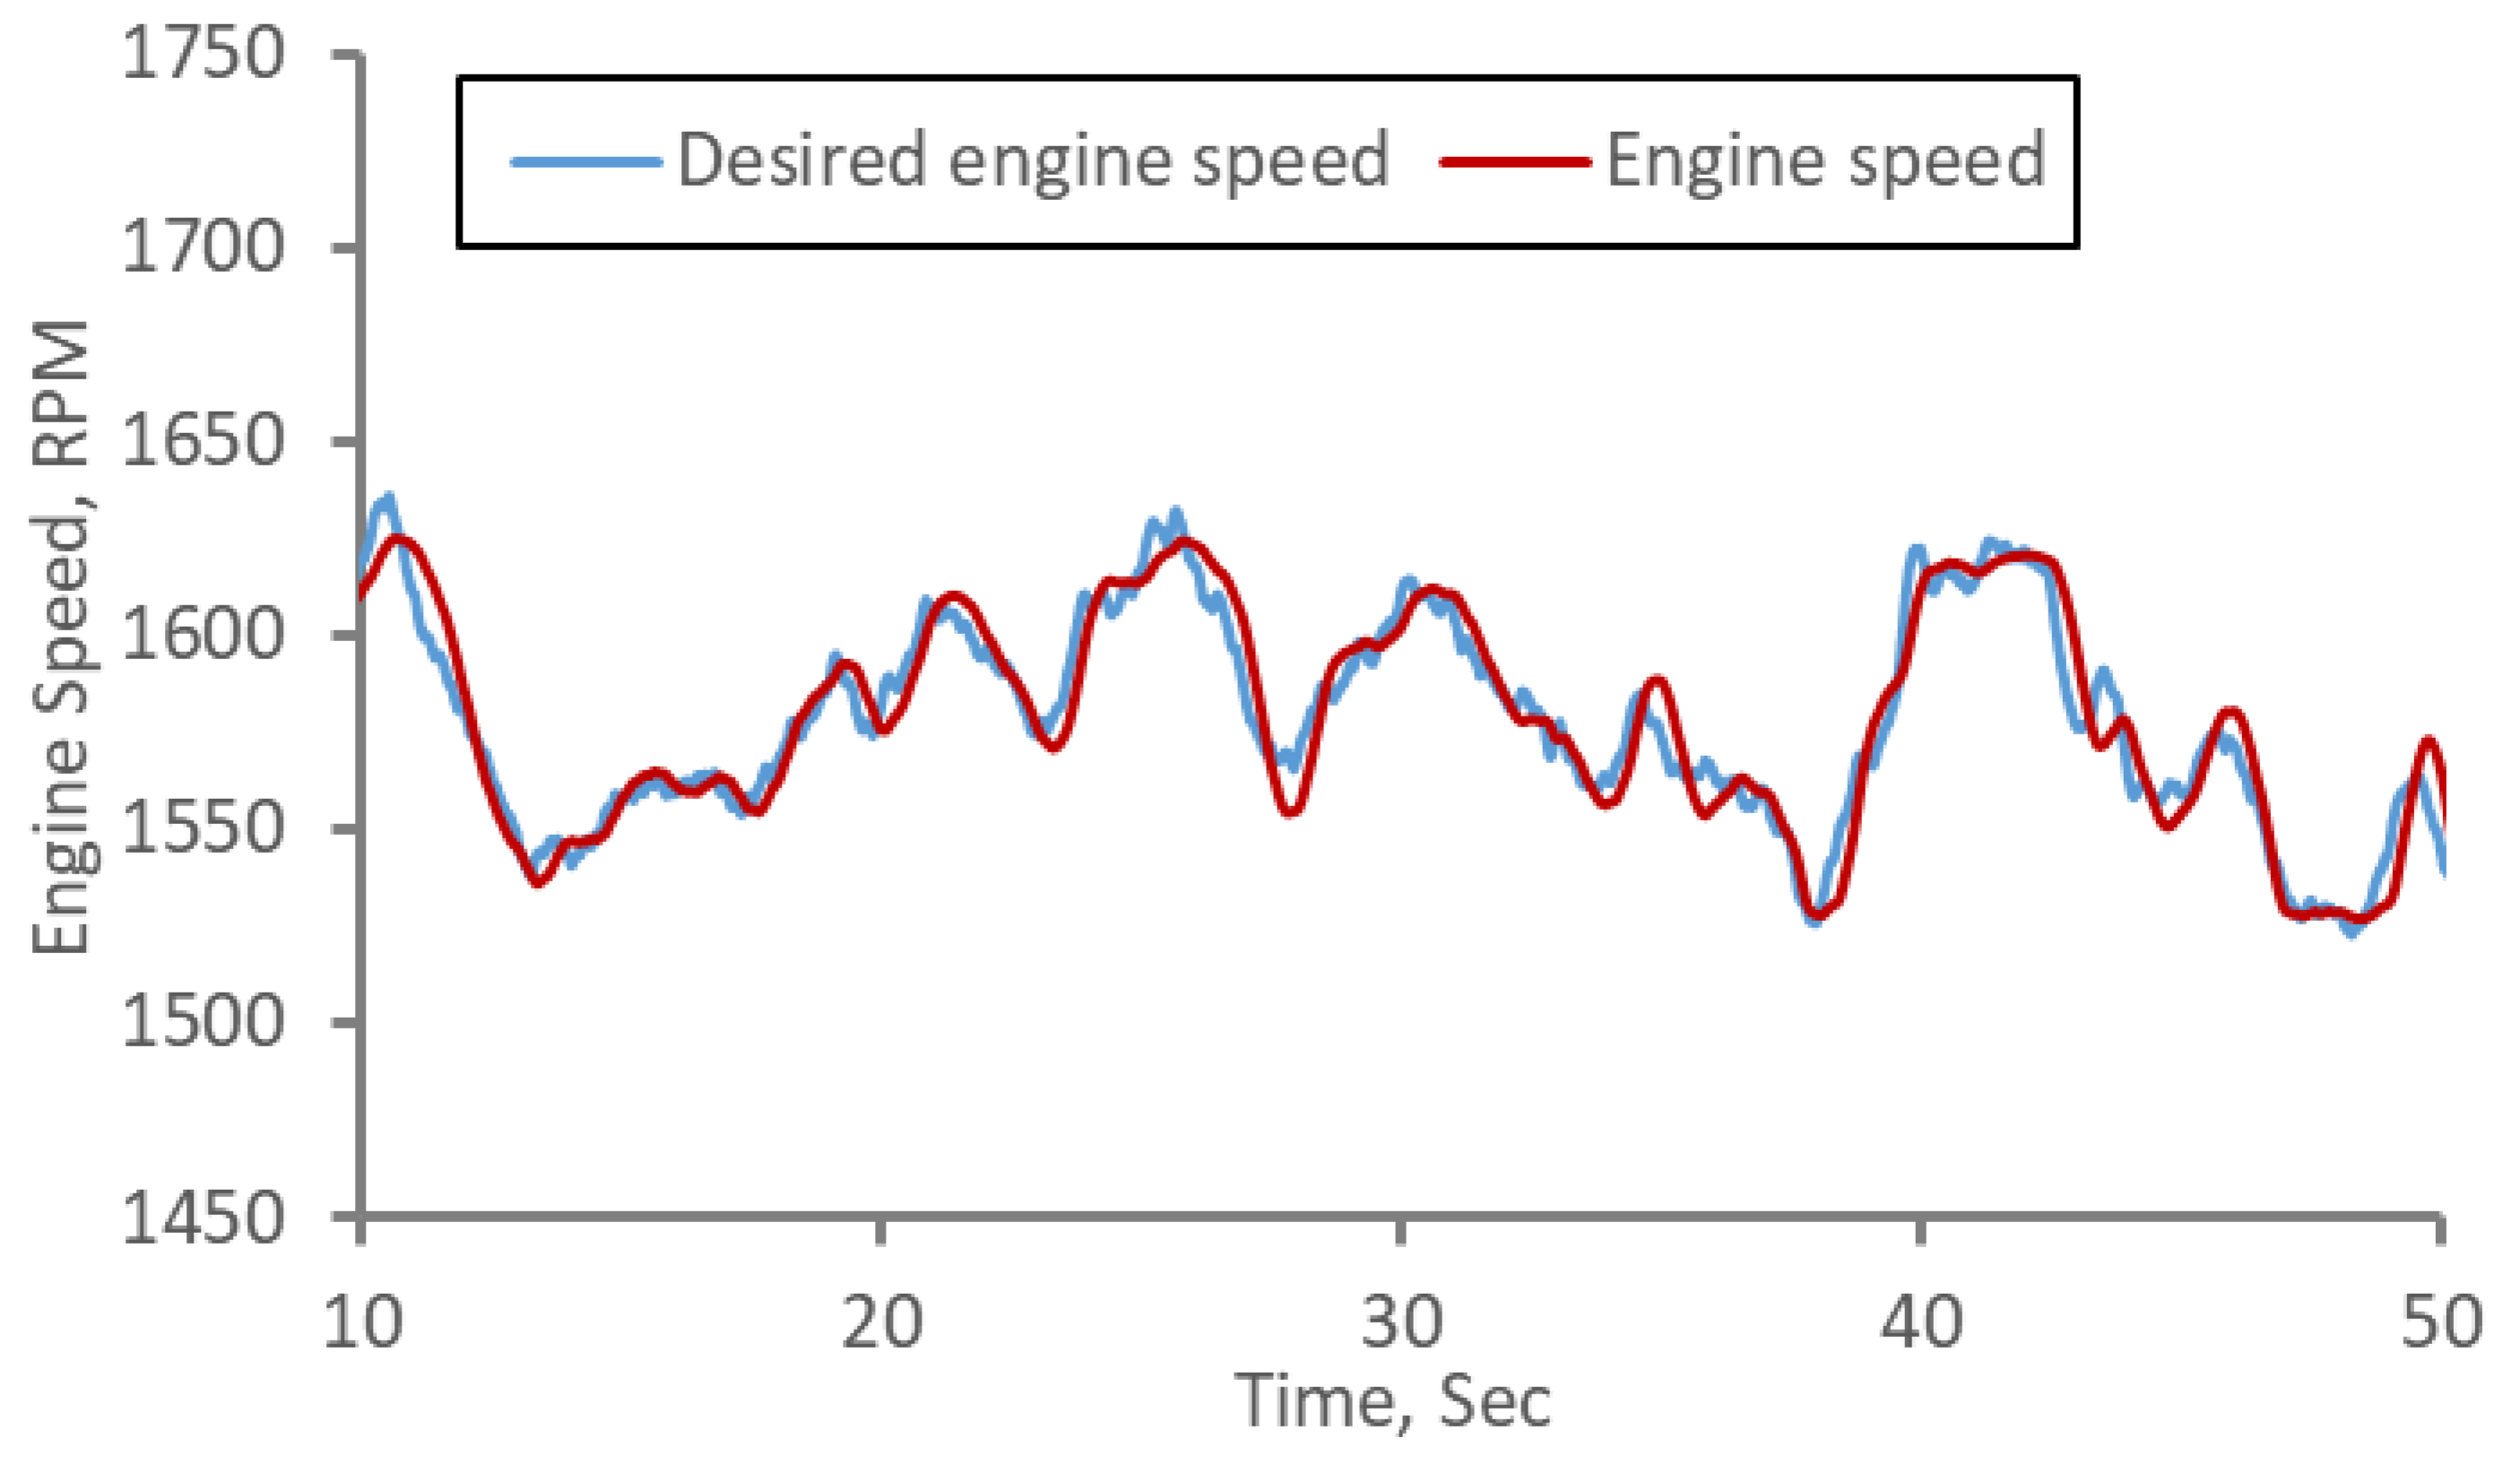
The simulation results of the engine speed control performance using the measured input shaft torque during a plowing operation are shown in
Figure 12, and the throttle command of the controller is shown in
Figure 13 [
13].
In the simulation results obtained using actual load, the engine speed could be adjusted to within 2–3% of the desired engine speed using the developed engine speed controller. According to the results of the previously performed simulation, the optimized engine speed controller using the control algorithm was concluded to be suitable for adjusting the engine speed of the diesel engine of an agricultural tractor.
4. Throttle Control System
The throttle control system used for adjusting engine speed was built with four parts of the tractor engine, a microprocessor with the engine speed control algorithm, a throttle actuator, and a data acquisition system. A schematic diagram of the throttle control system is shown in
Figure 14.
4.1. Tractor
T623, the 48 kW MFWD tractor used for the simulation model, was also used to develop the throttle control system. T623 has a C 3.3T 2232/2200 (Caterpillar, Peoria, IL, USA) turbocharged, four-stroke, three-in-line diesel engine with direct fuel injection and a capacity of 3300 cm
3. The specifications of T623 are listed in
Table 1.
4.2. Microcontroller Unit and Measuring System
The AT90CAN128 (Atmel Co., San Jose, California, USA) microprocessor was used to control the throttle actuator with the engine speed control algorithm. Because it is an 8-bit microprocessor, it has 128 K flash memory, 8 channels for analogue-to-digital conversion within 10-bit resolution, and 53 programmable I/O ports. In addition, it includes a Controller Area Network (CAN) controller for a CAN network.
The strain gages were attached to the input shaft of the transmission to measure the load applied to the tractor engine. A full bridge circuit was constructed to improve the sensitivity of the torque effect. In order to collect the signal from the rotating shaft, the cable from the strain gages must be prevented from twisting. In this study, a hollow-type slip ring was used to prevent the cables from twisting. The engine speed was measured using a magnetic pick-up sensor attached to the slip ring of input shaft.
Figure 15 shows the strain gages and the slip ring for the transmission input shaft.
To determine the fuel consumption of the engine, inlet flow and drain flow of the fuel supply system were measured using two flow rate sensors [
13]. A pulse-output flow meter was used for the measurements. Specifications of the flow meter are listed in
Table 2.
DEWE-3010 (DEWETRON GmbH, Austria) was used as the data acquisition system for receiving signals from a sensor attached to the tractor. DEWE-3010 has 15 digital channels and 17 analogue channels with 16-bit resolution and 100 kHz maximum sampling rate. In this study, the throttle potentiometer and input shaft torque signal were collected through a 10 Hz low-pass filter within a 100 Hz sampling rate.
4.3. Throttle Actuating System
The throttle actuating system was developed to adjust the throttle opening shown in
Figure 16. The system consists of a DC servo motor (which serves as the actuator), a microprocessor, and an accelerator pedal with a potentiometer. The wire between the throttle lever of the fuel pump and the accelerator pedal was separated from the accelerator pedal and attached to the designed pulley of the DC servo motor. The pulley pulled the connecting wire of the fuel pump governor, allowing this mechanism to be available for engine speed control. A DC servomotor with 44.0 kg·cm maximum torque, an individual servo system, and 120° of revolution angle were used for adjusting the fuel injection quantity of fuel pump. The size of the rotating pulley was determined by the maximum rotating angle of the DC servomotor, and it was used for improving control precision.
For the automatic operating system, the input shaft torque and engine speed signal obtained from the data acquisition system were transmitted to the microprocessor, and then the rotating angle of the DC servomotor was calculated to adjust the engine speed.
In the manual operating system, a linear potentiometer attached to the accelerator pedal in the tractor cabin was used to acquire user input for the throttle opening position. The measured displacement signal from the potentiometer was transmitted to the microprocessor, and the signal from the potentiometer corresponded to the amount of throttle opening displacement.
4.4. Engine Speed Control Algorithm
Figure 17 shows a flowchart of the engine speed control algorithm. The objective of the algorithm is to control engine speed according to workload variations in order to maximize fuel efficiency. As the workload continuously changes, the desired engine speed (
Figure 3) also varies continuously. Accordingly, the engine speed control algorithm is designed to continuously follow the desired engine speed using the designed throttle actuating system.
4.5. Verification of the Control System
To verify the control system, plowing operations were performed using the experimental tractor in a paddy field. A field test analyzed engine speed control performance and fuel-saving ability. To verify the control performance, a plowing operation was conducted before verifying the fuel efficiency performance. After verifying the control performance of the engine speed controller, numerous plowing operations were conducted to evaluate fuel-saving performance under various working conditions, such as transmission gear selection, driver habits, and workload. Specifications of the equipment used for the plowing operation are given in
Table 3.
The performance data collected from the tractor while using the control system included the engine speed, input shaft torque, throttle opening, and fuel consumption. These data were compared with the results taken from the tractor without using the control system to verify the overall performance of the system. Without the control system, the tillage depth, engine speed, and transmission gear selection were expected to operate according to the usual habits of the operator, and the operator was prohibited from shifting the transmission gear up or down during field operation.
When using the control system, the same tillage depth and transmission gear selection as in the case without the system were maintained, and the engine speed control algorithm (
Figure 17) was used to automatically control the throttle without considering operator behavior. The control system was also prohibited from shifting the transmission gear up or down the during field operation. The plowing depth was measured at randomly selected positions in the operation field using a ruler after each test was completed [
13]. The field for the test was used 100 × 100 m square flat paddy field. Plowing operation was conducted in a straight path alone one side of the field. After tractor reach the end side of the field, turned and moved to another side of the field with lifting up the plow implement. After reached to another side of the field, lifted down the plow implement and started plowing for opposite direction. If tractor reached the end side of the field, turned and moved to another side of field and started plowing along the side of tillage area before. The measurements were taken during the driving of the tractor along a straight path and for ensuring statistical significance, three paths were taken with same transmission gear step and tillage depth and performance data was averaged using three paths measurements.
The average water content of soil was determined from randomly selected samples from the surface of the paddy field using the oven drying method [
13]. The texture of soil in the experimental field was classified as loam based on the USDA definition. The soil strength was expressed in terms of the cone index from 8 to 10 randomly selected locations in the field, as shown in
Table 4 [
13].
5. Control System Verification
5.1. Verification of the Control System
To verify the throttle control system, the engine speed adjustment performance was analyzed using performance data from one of the plowing operations. The control performance verification results are presented as percentage errors between the desired engine speed and the engine operating speed.
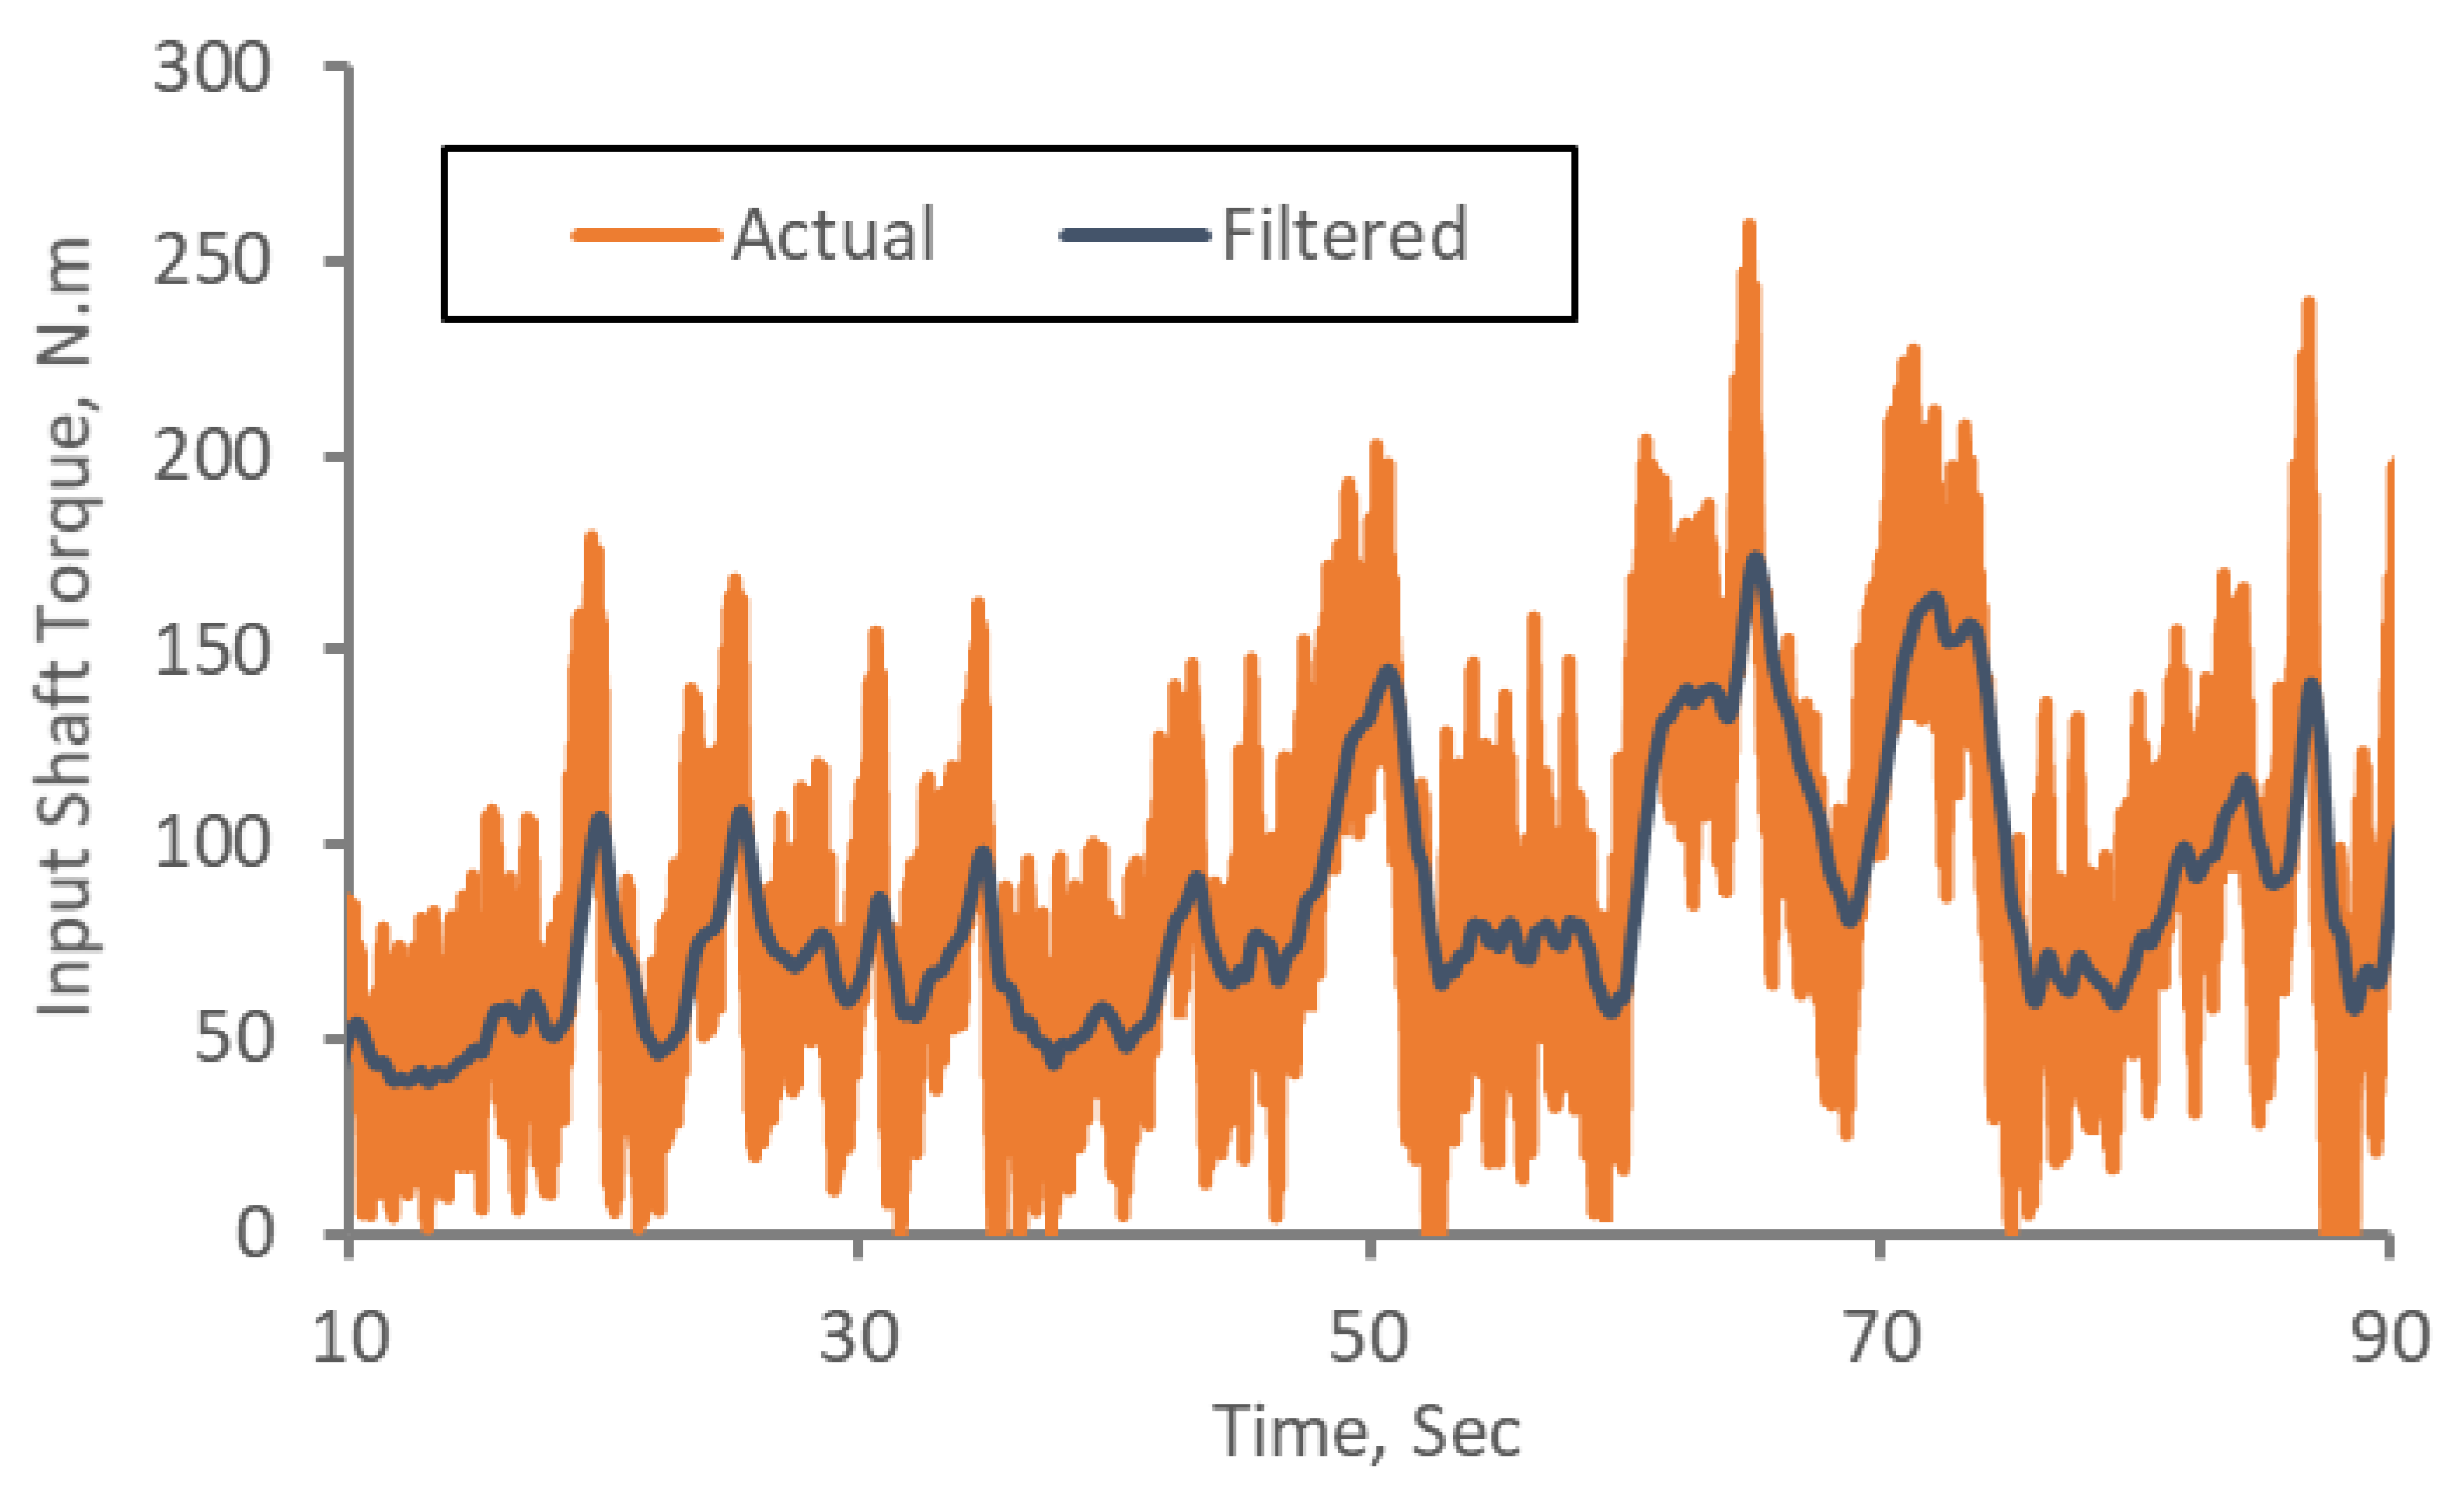
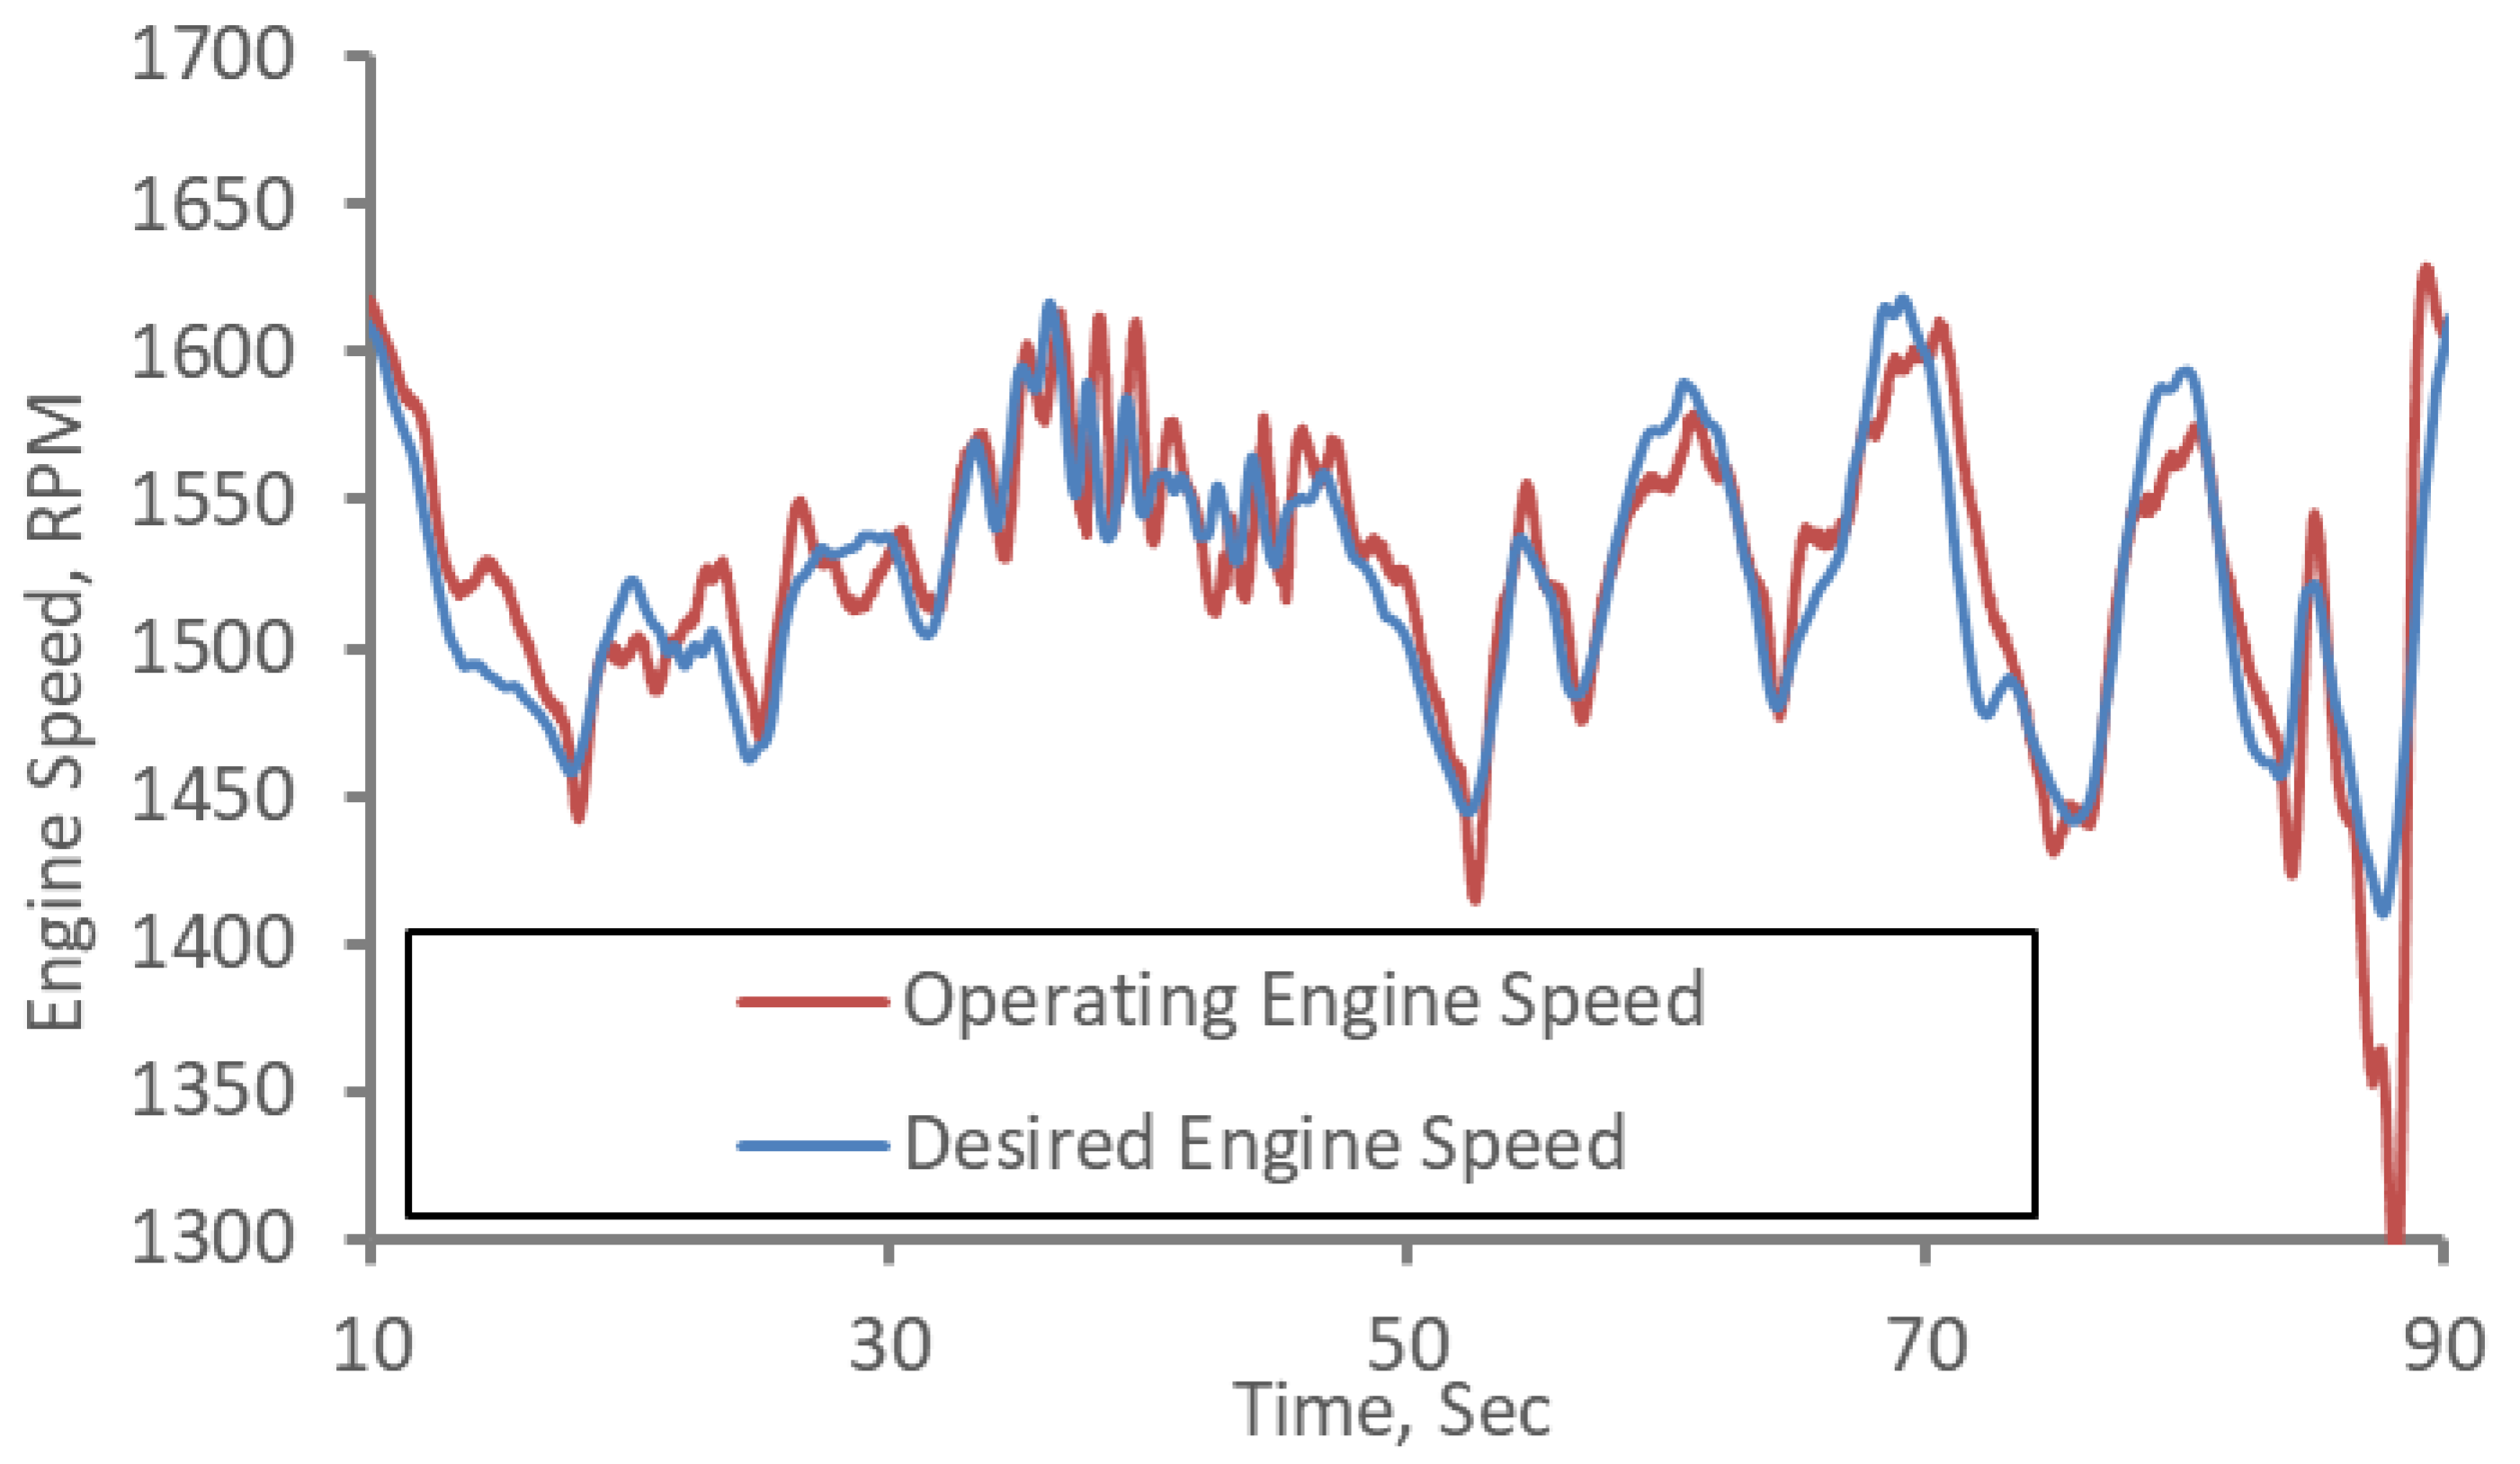
Figure 18 shows the engine operating speed and desired engine speed from the plowing operation performed without the control system. Without the control system, the operating conditions of the agricultural tractor were easily affected by the behavior of the operator. Therefore, the data show a significant difference between the desired engine speed and engine operating speed. For these reasons, different drivers produce different results. The engine operating speed was only affected by the input shaft transmission torque of the agricultural tractor, as shown in
Figure 19.
Figure 20 shows the engine operating speed and the desired engine speed from the plowing operation using the control system. With the control system, the engine operating speed was closer to the desired engine speed than without the control system. The engine operating speed values showed a 1.17% error on average compared to the desired engine speed. Therefore, the throttle control system can be considered suitable for the purpose of maintaining and adjusting the engine operating speed close to the desired engine speed.
Figure 21 shows the measured input shaft transmission torque using the throttle control system. The characteristics of the input shaft torque using the control system were very similar to the input shaft torque without the system. However, the engine operating speed showed significant differences. Moreover, adjusting the throttle only affected the engine operating speed and not the input shaft torque from the draft load during the plowing operation. In other words, this system could be used for adjusting the engine speed without affecting the results of the operation. Consequently, the engine operating speed can be controlled by the system for the desired engine speed that maximizes the fuel efficiency by using real-time input shaft torque.
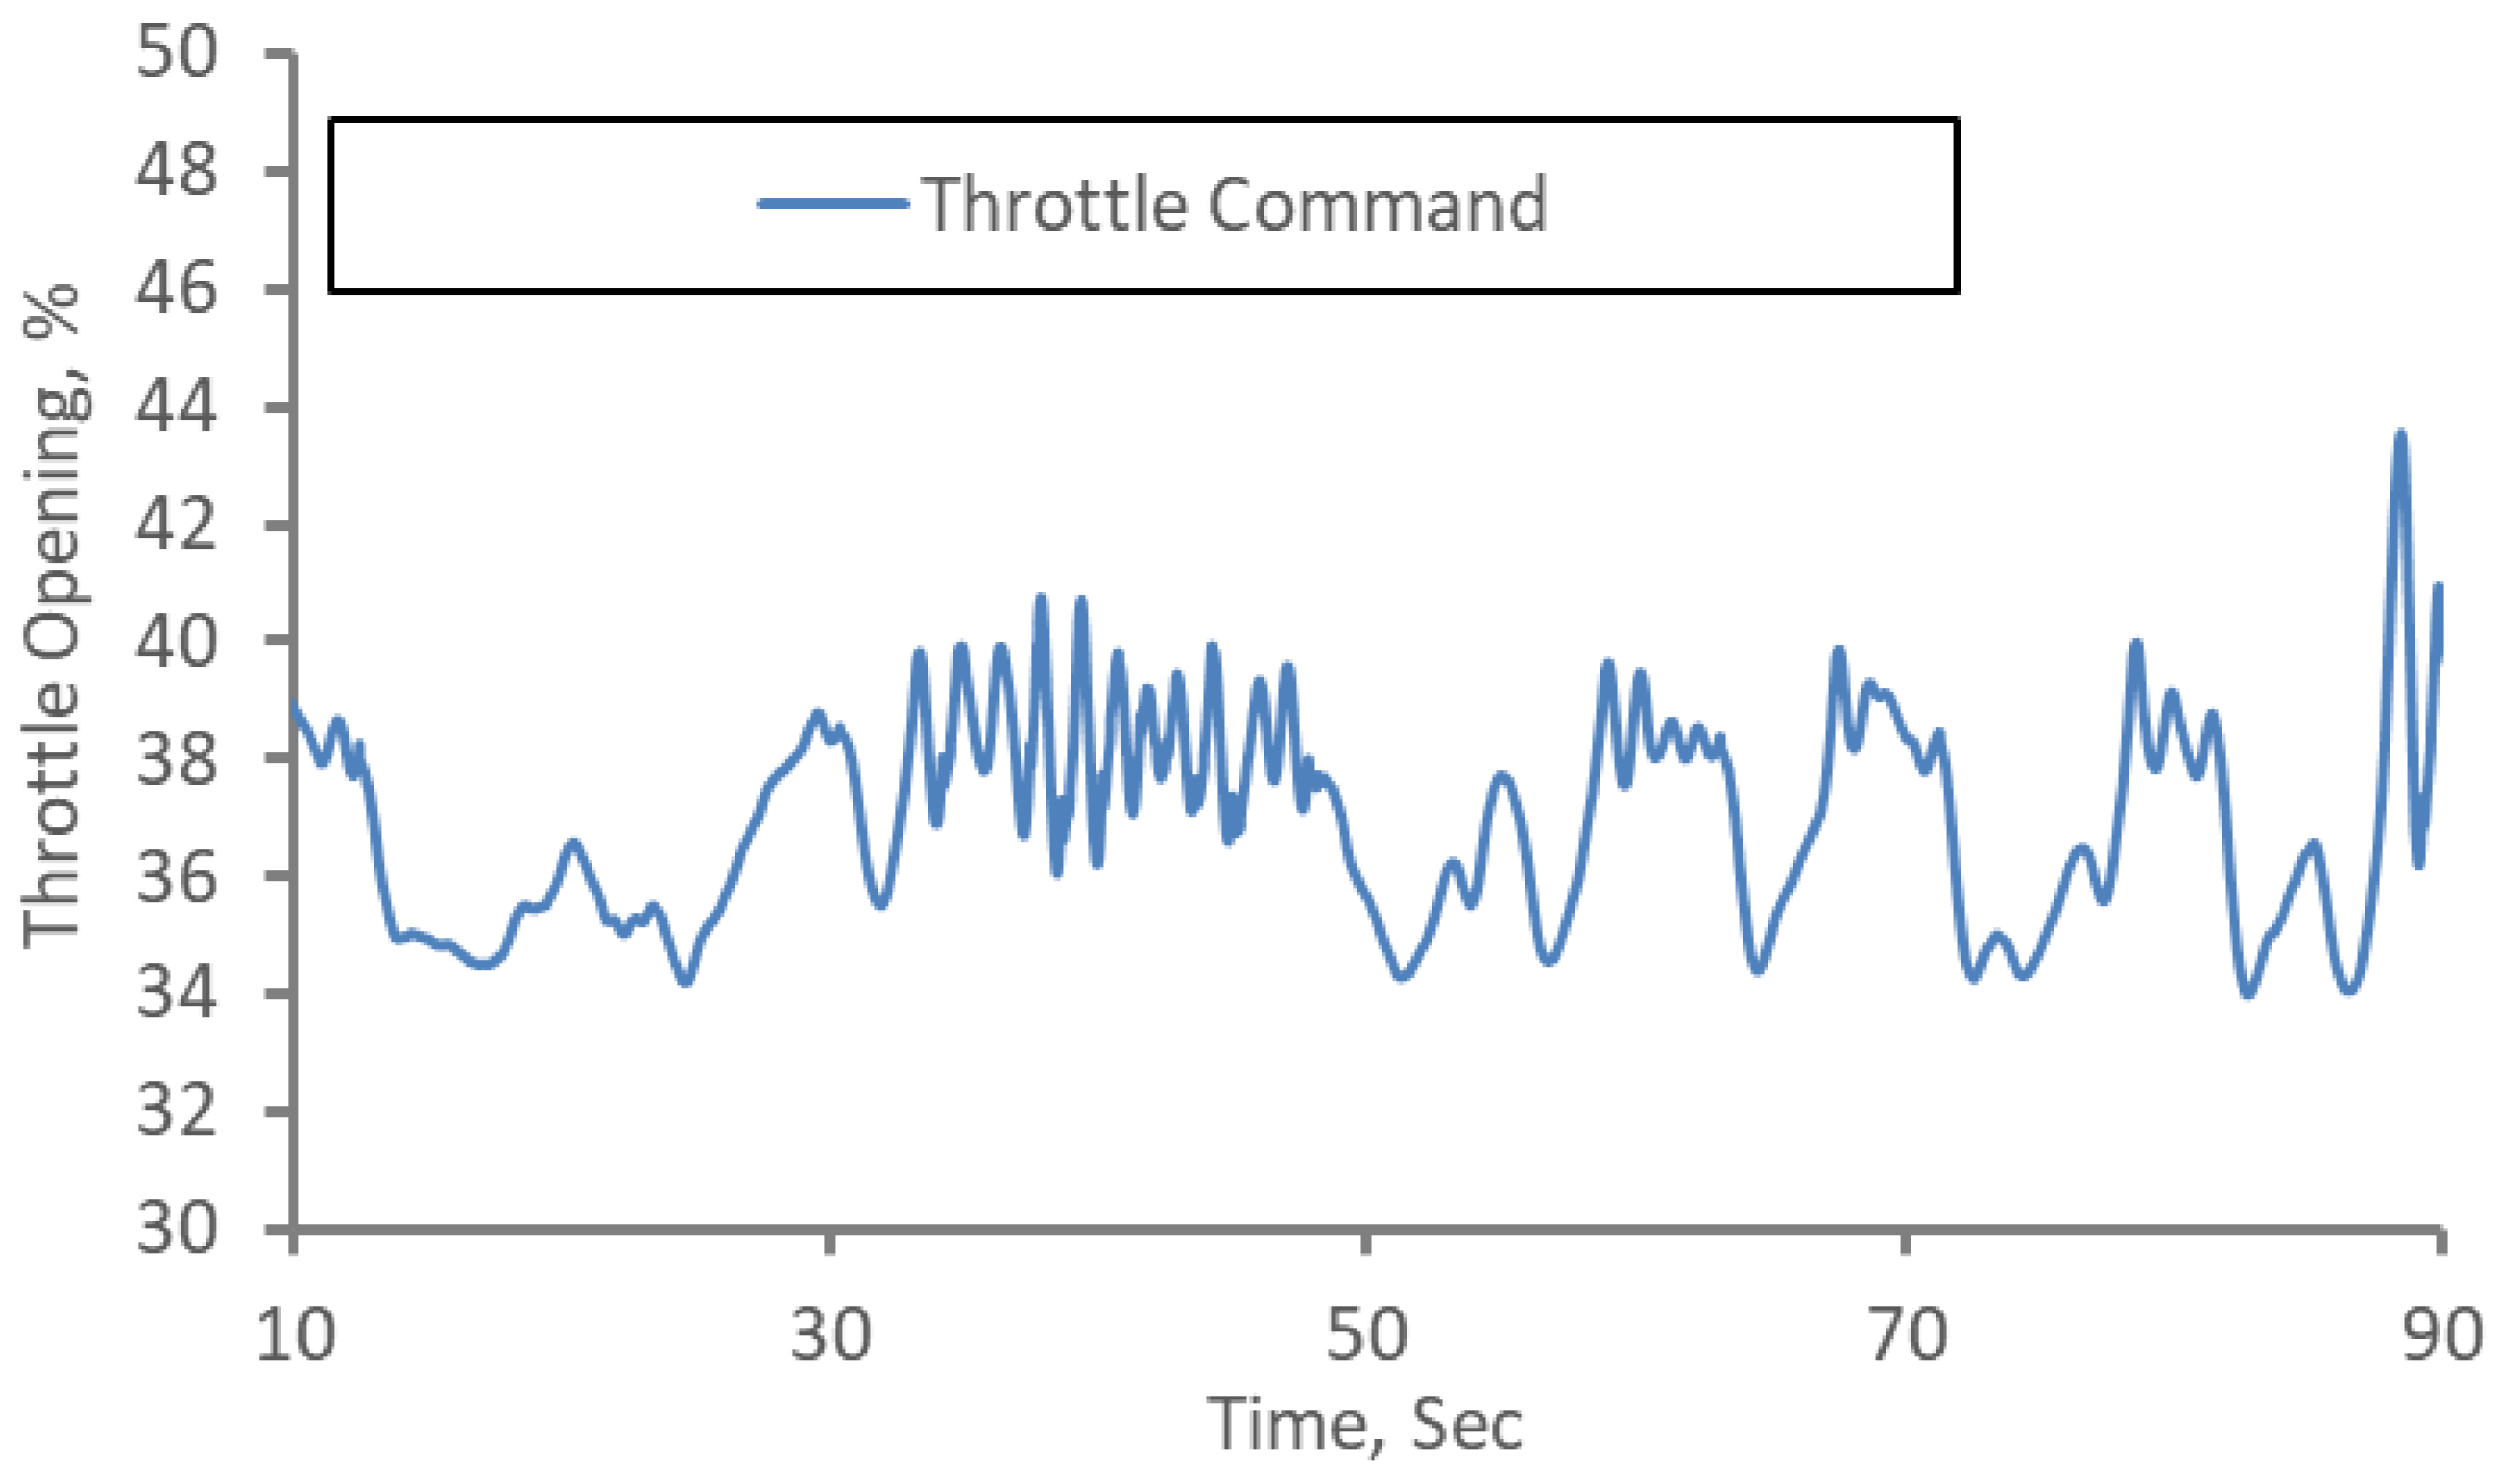
Figure 22 shows the throttle command for engine speed control during field operation. The throttle opening was maintained within 34.6–43.5%, and it showed a similar tendency to the engine speed.
It is concluded that the operating engine speed of an agricultural tractor can be controlled within a stable range by using the throttle control system.
5.2. Fuel-Saving Performance
In this study, three fuel efficiency parameters were used to evaluate the fuel conservation performance of the system. FCA and SVFC, were calculated from FC using Equations (11) and (12), respectively [
13].
where FCA is fuel consumption per tilled area in L ha
−1; FC is fuel consumption per work hour in L h
−1; SVFC is specific volumetric fuel consumption in L(kWh)
−1;
is working width in m.
For evaluating fuel-saving performance, the fuel efficiency parameters were analyzed through operation with and without the control system. The fuel conservation performance evaluation results are presented as percentage differences between scenarios with and without the system.
The results of the fuel efficiency parameters from field experiments with and without the control system are shown in
Table 5. A gear step was used from L-4 to M-3 to adjust the operating speed from 2.70 to 6.94 km/h at the rated engine speed. With the control system, FC was reduced from 23.03 to 57.87%, and FCA was reduced from 4.11 to 42.06%. SVFC was reduced from 15.73 to 38.48% in almost all gear steps, but two cases showed increases of 0.66 to 7.24% when the control system was not used. As a result, this system was considered to be more effective at reducing FC. This was attributable to the tendency of the engine speed to be more easily adjusted by the FC than FCA and SVFC [
13]. Almost every desired engine speed for the measured input shaft torque corresponded to the maximum torque output speed. The maximum torque output speed was approximately half of the rated engine speed, which was 1300–1400 RPM in this study. Accordingly, a reduction in the operation speed cannot be avoided. In addition, reduction in the work speed also leads to a reduction in tractive resistance and tractive power. Therefore, reduced work speed and tractive power led to lower FCA and SVFC reduction rates than FC, and even increases of SVFC were observed in two cases. As each set of fuel efficiency performance data were obtained under different driving habits, the range of results were significantly widened.
The engine operating region during the plowing operations is presented as a set of measured input shaft torques in
Figure 23.
With the control system, the engine operating region was distributed around the optimum operating curve from the desired engine speed determination algorithm. Without the control system, the operating region was more widely distributed. As a result, the engine operating region was maintained under 70% of the rated speed. Consequently, the reduced engine speed attributable to the control system led to improved fuel efficiency.
Overall, the developed engine speed control system can be considered an effective system for improving fuel efficiency. Although some experiment results showed less efficiency for reducing SVFC, it could be concluded that the control system may be effective approach towards reducing FC, FCA, and SVFC for common drivers.
This system could be useful for developing an integrated control system for engines, automatic transmissions, and instruments for agricultural tractors. Nevertheless, additional research into the development of integrated control systems for tractors with automatic transmission are still required.
6. Conclusions
This study was conducted to develop an engine speed control system to maximize the fuel efficiency of a tractor in plowing operations using simple mechanical devices. The desired engine speed determination algorithm based on measured input shaft torque and PI controller for adjusting the engine speed was designed using a developed computer simulation model. This model was verified by comparing measured operating performance data and simulated data. Finally, an engine throttle control system was constructed using the desired engine speed control algorithm, a PI controller, servo motor, torque and speed measurement instruments, and parameters of fuel conservation performance. A summary of the results of this study are listed below.
A 1-DOF dynamic tractor simulation model and a fuel consumption prediction map were developed and verified using measured field operation data. Using the simulation model, the mean errors of the simulated engine speed and input shaft torque were 2.03% and 4.87%, respectively, compared with those obtained from the field experiment. It means that 1-DOF dynamic tractor simulation model can predict fuel consumption and work performance and also can be used for model-based controller design methodology.
Desired engine speed determination algorithm was developed based on workload applied to engine using look-up table method. Fuel consumption prediction map was used to determining the most efficient point of engine speed at measured workload torque. Simple continuous optimal operating line for maximizing fuel efficiency was developed and applied to engine speed control algorithm.
The parameter gains of the PI controller were tuned using the simulation model by Ziggler and Nichols gain tuning methods, and the applicability of the controller was verified with the tractor model and controller using the measured field experiment data. Main objective of gain tuning is minimizing the engine speed overshooting. After simulation, the average percentage errors and standard deviation between simulated and measured engine speed values were 2.03% and 1.37%. For input shaft torque, the average percentage error and standard deviation were 4.87% and 3.95%, respectively.
A measuring system was constructed and used for collecting the input shaft torque, fuel consumption, and engine speed data from plowing operations. Hollow type slip ring and strain gage were installed to input shaft of transmission for measuring input shaft torque and engine speed. In order to measure fuel consumption two flow rate sensors were used for inlet flow and drain flow of the fuel supply system.
The mechanical governor in the experimental tractor was converted into an electrical governor using simple servo motor and throttle potentiometer in order to control the throttle and engine speed control system. This was conducted to maximize the fuel efficiency.
By plowing field test data, with the engine speed control system in plowing operations can improve FC, FCA, and SVFC about 23.03–57.87%, 4.11–42.06%, and -7.24–38.48%, respectively, over those without using the control system.
The results of this study can be applied to the development of an optimal engine control algorithm to maximize the fuel efficiency of tractors depending on the workload of different tractor field operations.
Author Contributions
Conceptualization, J.W.L.; methodology, J.W.L. and Y.-J.P.; software, J.W.L.; validation, S.C.K. and J.O.; data curation, W.-J.C., H.-W.H. and J.-T.K.; supervision, Y.-J.P.; writing-original draft preparation, J.W.L.; writing-review & editing, Y.-J.P.
Funding
The author(s) disclose receipt of the following financial support for the research, authorship, and/or publication of this article: This work was supported by the National Research Foundation of Korea (NRF) Grant funded by the Republic of Korea Government (MOE) (2010-0023058).
Conflicts of Interest
The authors declare no conflict of interest.
References
- Grisso, R.; Pitman, R.; Perumpral, J.V.; Roberson, G.T. Gear up and Throttle down to Save Fuel; Virginia Cooperative Extension: Blacksburg, VA, USA, 2010; pp. 442–450. [Google Scholar]
- Park, S.H.; Kim, Y.J.; Im, D.H.; Kim, C.K.; Jung, S.C.; Kim, H.J.; Jang, Y.; Kim, S.S. Development of eco driving for agricultural tractor. J. Biosyst. Eng. 2010, 35, 77–84, (In Korean, with English abstract). [Google Scholar] [CrossRef]
- Chancellor, W.J.; Thai, N.C. Automatic control of tractor transmission ratio an engine speed. Trans. ASABE 1984, 27, 642–646. [Google Scholar] [CrossRef]
- Zhang, N.; Perumpral, J.V.; Byler, R.K. Automatic control system for optimizing diesel engine performance. Comput. Electron. Agric. 1987, 2, 31–46. [Google Scholar] [CrossRef]
- Jiang, J. Optimal gain scheduling controller for a diesel engine. IEEE Control Syst. Mag. 1994, 14, 42–48. [Google Scholar]
- Mathworks Inc. Matlab 2015b User Help Manual; Mathworks Inc.: Natick, MA, USA, 2015. [Google Scholar]
- Tong Yang Moolsan. T623 User Manual; Tong Yang Moolsan: Seoul, Korea, 2010. [Google Scholar]
- Organisation for Economic Co-Operation and Development. OECD Code 2: Standard Code for the Official Testing of Agricultural and Forestry Tractor Performance; Organisation for Economic Co-Operation and Development: Paris, France, 2010. [Google Scholar]
- Qingwen, S.; Grigoriadis, K.M. Diesel Engine Speed Regulation Using Linear Parameter Varying Control. In Proceedings of the American Control Conference, Denver, CO, USA, 4–6 June 2003; Volume 1, pp. 779–784. [Google Scholar]
- American Society of Agricultural and Biological Engineers. ASABE Standard ASABE D497.5 Agricultural Machinery Management Data; American Society of Agricultural and Biological Engineers: St. Joseph, MI, USA, 2006. [Google Scholar]
- Kim, K.U.; Kim, K.D.; Koo, Y.M.; Park, K.J. Agricultural Machinery Design 1; Moon Woon Dang: Seoul, Korea, 2009. (In Korean) [Google Scholar]
- Kolator, B.; Białobrzewski, I. A simulation model of 2WD tractor performance. Comput. Electron. Agric. 2011, 76, 231–239. [Google Scholar] [CrossRef]
- Lee, J.W.; Kim, J.S.; Kim, K.U. Computer simulations to maximise fuel efficiency and work performance of agricultural tractors in rotovating and ploughing operations. Biosyst. Eng. 2016, 142, 1–11. [Google Scholar] [CrossRef]
- Kim, S.C.; Kim, K.U.; Kim, D.C. Modeling of fuel consumption rate for agricultural tractors. J. Biosyst. Eng. 2010, 35, 1–9, (In Korean, with English abstract). [Google Scholar] [CrossRef]
- Ogata, K. Modern Control Engineering-International Edition, 5th ed.; Prentice Hall: Upper Saddle River, NJ, USA, 2009. [Google Scholar]
Figure 1.
Block diagram of engine speed controller.
Figure 1.
Block diagram of engine speed controller.
Figure 2.
Block diagram of tractor dynamic model.
Figure 2.
Block diagram of tractor dynamic model.
Figure 3.
Optimum performance curve of specific volumetric fuel consumption map.
Figure 3.
Optimum performance curve of specific volumetric fuel consumption map.
Figure 4.
Feedback controller for engine speed control based on proportional–integral (PI) algorithm.
Figure 4.
Feedback controller for engine speed control based on proportional–integral (PI) algorithm.
Figure 5.
Throttle opening and workload data for the simulation model.
Figure 5.
Throttle opening and workload data for the simulation model.
Figure 6.
Comparison of simulation and measured engine speeds.
Figure 6.
Comparison of simulation and measured engine speeds.
Figure 7.
Comparison of simulation and measured input shaft torque.
Figure 7.
Comparison of simulation and measured input shaft torque.
Figure 8.
Step input for engine speed controller.
Figure 8.
Step input for engine speed controller.
Figure 9.
Ramp input for engine speed controller.
Figure 9.
Ramp input for engine speed controller.
Figure 10.
Maximum overshoot and settling time of engine speed controller from step input.
Figure 10.
Maximum overshoot and settling time of engine speed controller from step input.
Figure 11.
Response of engine speed controller from ramp input.
Figure 11.
Response of engine speed controller from ramp input.
Figure 12.
Simulation results of engine speed controller using actual load data.
Figure 12.
Simulation results of engine speed controller using actual load data.
Figure 13.
Throttle command of plowing operation simulation.
Figure 13.
Throttle command of plowing operation simulation.
Figure 14.
Schematic diagram of throttle control system.
Figure 14.
Schematic diagram of throttle control system.
Figure 15.
Strain gages and pick-up sensor installed on input shaft.
Figure 15.
Strain gages and pick-up sensor installed on input shaft.
Figure 16.
Schematic diagram of the throttle actuating system.
Figure 16.
Schematic diagram of the throttle actuating system.
Figure 17.
Flowchart of the control algorithm.
Figure 17.
Flowchart of the control algorithm.
Figure 18.
Measured engine speed and desired engine speed during plowing operation without the control system.
Figure 18.
Measured engine speed and desired engine speed during plowing operation without the control system.
Figure 19.
Measured and filtered input shaft torque during plowing operation without the control system.
Figure 19.
Measured and filtered input shaft torque during plowing operation without the control system.
Figure 20.
Measured engine speed and desired engine speed during plowing operation using the control system.
Figure 20.
Measured engine speed and desired engine speed during plowing operation using the control system.
Figure 21.
Measured and filtered input shaft torque during plowing operation using the control system.
Figure 21.
Measured and filtered input shaft torque during plowing operation using the control system.
Figure 22.
Throttle command of the engine speed controller.
Figure 22.
Throttle command of the engine speed controller.
Figure 23.
Engine operating region of plowing operations.
Figure 23.
Engine operating region of plowing operations.
Table 1.
Specifications of MFWD tractor used for modelling in this study [
7].
Table 1.
Specifications of MFWD tractor used for modelling in this study [
7].
| Item | Specification |
|---|
| Unballasted weight, kN | 24.4 |
| Weight distribution (Front: Rear), % | 47.6: 52.4 |
| Transmission (main/sub/creep) | Forward 24, Backward 24 (4/3/2) |
| Engine | Manufacturer and Model | Caterpillar C3.3T 2232/2200 |
| Rated power, kW | 48 kW @ 2200 rpm |
| PTO | Rated power, kW | 47.61 |
| Rated speed, rpm | 540, 733 @ rated engine speed |
| Tire | Front | 11.2-20 8PR (drive tires) |
| Rear | 14.9-30 8PR (drive tires) |
Table 2.
Specifications of the flow meter used in this study.
Table 2.
Specifications of the flow meter used in this study.
| Item | Specification |
|---|
| Model | OF10-ZAT-AR |
| Manufacturer | Aichi Tokei Denki, Japan |
| Pulse out (mL/Pulse) | 2.5 |
| Measuring range (L/h) | 5–300 |
| Max. Pressure (MPa) | 0.5 at 20 ℃ |
Table 3.
Specification of equipment used for plowing [
13].
Table 3.
Specification of equipment used for plowing [
13].
| Item | Specification |
|---|
| Moldboard Plow |
|---|
| Length × Width × Height (mm) | 2140 × 1805 × 1165 |
| Type | Mounted |
| Plowing width (mm) | 1810 |
| Center of resistance rearward from rear axle (mm) | 1583 |
Table 4.
Soil properties of the paddy field.
Table 4.
Soil properties of the paddy field.
| Plot | Soil Texture | Average Water Content, (% d.b) | Average Cone Index by Depth (kPa) |
|---|
| 0 mm | 50 mm | 100 mm | 150 mm | 200 mm | 250 mm |
|---|
| PaddyField | Loam | 38.9 | 201 | 615 | 732 | 735 | 1485 | 2425 |
Table 5.
Fuel efficiency parameter results of plowing operations.
Table 5.
Fuel efficiency parameter results of plowing operations.
| Transmission Gear Step (Tractor Speed at Rated Engine RPM (kph) | FC (L/h) | FCA (L/ha) | SVFC (L/kWh) |
|---|
| Non-Control | Control | Change (%) | Non-Control | Control | Change (%) | Non-Control | Control | Change (%) |
|---|
| L-4 (2.70) | 7.58 | 4.07 | −46.31 | 16.18 | 13.23 | −18.25 | 1.55 | 1.13 | −26.8 |
| L-4 (2.70) | 8.17 | 3.66 | −55.25 | 17.65 | 10.89 | −38.27 | 1.49 | 0.98 | −34.39 |
| M-1 (2.85) | 8.66 | 3.88 | −55.22 | 18.93 | 11.6 | −38.72 | 1.19 | 0.8 | −33.21 |
| M-1 (2.85) | 7.97 | 3.83 | −51.99 | 16.37 | 11.16 | −31.85 | 1.3 | 0.8 | −38.48 |
| M-2 (4.51) | 6.9 | 4.31 | −37.6 | 10.56 | 7.45 | −29.49 | 0.71 | 0.72 | 0.66 |
| M-2 (4.51) | 5.74 | 4.42 | −23.03 | 8.89 | 7.91 | −11.04 | 0.66 | 0.71 | 7.24 |
| M-2 (4.51) | 10.56 | 4.45 | −57.87 | 13.82 | 8.01 | −42.06 | 1.04 | 0.68 | −34.5 |
| M-3 (6.94) | 10.62 | 7.45 | −29.87 | 11.09 | 10.64 | −4.11 | 0.87 | 0.59 | −31.88 |
| M-3 (6.94) | 11.48 | 5.84 | −49.13 | 11.97 | 7.38 | −38.31 | 0.67 | 0.57 | −15.73 |
© 2019 by the authors. Licensee MDPI, Basel, Switzerland. This article is an open access article distributed under the terms and conditions of the Creative Commons Attribution (CC BY) license (http://creativecommons.org/licenses/by/4.0/).


