Wheat Bread with Dairy Products—Technology, Nutritional, and Sensory Properties


LEAF—Linking Landscape, Environment, Agriculture and Food, Instituto Superior de Agronomia, Universidade de Lisboa, Tapada da Ajuda, 1349-017 Lisboa, Portugal
*
Author to whom correspondence should be addressed.
Appl. Sci. 2019, 9(19), 4101; https://0-doi-org.brum.beds.ac.uk/10.3390/app9194101
Submission received: 2 September 2019
/
Revised: 25 September 2019
/
Accepted: 27 September 2019
/
Published: 1 October 2019
(This article belongs to the Special Issue Eco-Novel Food and Feed)
Abstract
:Featured Application
Bakery industry, as nutritional and functional breads, with a considerable contribution to balance the daily diet for children and seniors in terms of proteins and minerals.
Abstract
As the relation between diet and health became a priority for the consumers, the development of healthy foods enriched with functional ingredients increased substantially. Dairy products represent an alternative for new products and can be used to enhance the functional and nutritional value of bakery products. The addition of yoghurt and curd cheese to wheat bread was studied, and the impact on the dough rheology, microstructure, bread quality, and sensory properties were evaluated. Dairy product additions from 10 to 50 g and higher levels up to 70 g of yoghurt and 83 g of curd cheese were tested. Replacements were performed on wheat flour basis and water absorption. It was observed that the yoghurt additions had a positive impact on the rheology characteristics of the dough. For curd cheese additions, the best dough evaluated on extension was the 30 g of wheat flour formulation. In both cases, the microstructure analysis supported the results obtained for doughs and breads. These breads showed a significant improvement on nutrition profile, which is important to balance the daily diet in terms of major and trace minerals and is important for health-enhancing and maintenance. Good sensorial acceptability for breads with 50 g of yoghurt and 30 g of curd cheese was obtained.
1. Introduction
Bakery products are staple foods, widely consumed in large quantities worldwide, with an important role in human nutrition [1]. Due to the increased awareness of health issues, the bakery industry is moving to provide functional and healthy foods, mainly via fortification with satiating and active ingredients, such as proteins, fibres, minerals, vitamins, and bioactive peptides [2] in response to an increasingly demanding consumer.
The incorporation of ingredients that exhibit functional properties, in addition to traditional nutrients, is an interesting alternative to the development of innovative bakery foods. Brazilian bread cheese is known worldwide, but the incorporation of dairy products (such as yogurt and curd cheese) in bread formulations is not common in the bakery markets.
Nutritional benefits of dairy products (DP) include increasing the amount of minerals with good assimilability (mainly Ca and P), vitamins (A and B12), protein, and essential amino acids (lysine, methionine, and tryptophan). Technology benefits may also be considered and can include improvement of dough handling properties and bread quality (flavour, crumb structure, and texture). These benefits result from the effect of protein and milk fat on the bread structure [3].
Good nutrition, especially adequate, easily digestible protein and mineral intake, is a determinant factor for the human health. Protein and minerals are considered key nutritional components in a well-balanced diet with an important contribution to maintain muscle mass and bone structure [4]. Some studies have reported the technological properties of dairy products as potential ingredients into a wide variety of products [5], such as infant formulas [6], that could aid in achieving dietary requirements for children and seniors.
Yoghurt (Yg) is a fermented milk product that consists of a casein network formed at the isoelectric point [7], being the acid obtained by the activity of the specific lactic acid bacteria (LAB), Streptococcus thermophilus and Lactobacillus delbrueckii ssp. bulgaricus cultures. Yg is considered the most popular dairy product worldwide for its nutritional and health benefits, since it is a rich source of protein (casein), vitamins (B2, B6, and B12), and minerals (such as Ca, P, and K), and contributes to good microbiota. This product is a potential ingredient for bakeries, representing an interesting alternative for new bakery products [8], and can be incorporated into bread formulations as a fresh product.
Curd cheese (Cc) is a co-product obtained by the thermal denaturation and subsequent precipitation of the soluble whey proteins. These products are considered to have a high protein nutritional value, representing of 20–30% of the proteins present in bovine milk. This complex mixture of globular protein molecules (α-lactalbumin and β-lactoglobulin) presents a higher protein efficiency ratio than wheat proteins [9] and is considered to be an important source of essential amino acids (leucine, isoleucine, and valine). Previous work has shown significant increments in protein, ash, and mineral contents (Ca, K, Mg, and P) in bread with whey protein concentrate [10]. However, some authors reported that whey protein exerted some negative effects on bread quality by depressing the loaf volume and increasing the crumb firmness [11].
The aim of the present study was to evaluate the influence of yoghurt and curd cheese addition as potential ingredients for the design of new bread formulations and assess their effect on wheat dough (WD) rheology and bread quality, as well as the aging kinetics and nutritional profile.
Different contents of yoghurt and curd cheese were added to wheat flour dough, and the impact on dough rheology was assessed by small amplitude oscillatory measurements (SAOS) and extension properties. Dough microstructure was also evaluated. The breads produced were also characterized in terms of microstructure, texture profile, and shelf life. Sensory analysis was performed to evaluate the acceptability of the developed breads. The maximum addition of each dairy product was discussed in terms of the potential applications for the market.
2. Materials and Methods
2.1. Raw Material
Bread was prepared using commercial wheat flour—WF (EspigaT65) purchased from the Granel cereal milling industry (Alverca, Portugal) with (per 100 g) 13.5 g of moisture, 11.3 g of protein, and 0.6 g of ash (supplier Near Infra-Red results (Hägersten, Sweden)
The fresh yogurt (Yg) used was a commercial product from LongaVida, Portugal, with the label stating the nutritional composition per 100 g: 3.7 g of protein, 0.8 g of ash, 3.7 g of lipids, 5.5 g of carbohydrates, 0.06 g of salt, and 0.12 g of Ca. The dry extract of Yg was determined from the standard Portuguese method: NP.703-1982, corresponding to 11.5% of dry matter (88.5% of moisture).
Fresh curd cheese (Cc) from Lacticínios de Paiva (Lamego, Paiva, Portugal), was used with the following nutritional composition per 100 g: 10.7 g of protein, 3.5 g of ash, 0.2 g of fibber, 9.0 g of lipids, 3.0 g of carbohydrates, 0.2 g of salt, and 0.3 g of Ca. The dry extract of Cc was determined from the standard Portuguese method: NP.3544-1987, corresponding to 25.8% of dry matter (74.2% of moisture).
Commercial white crystalline saccharose (Sidul, Santa Iria de Azóia, Portugal), sea salt (Vatel, Alverca, Portugal), baker’s dry yeast (Fermipan, Lallemand Iberia, SA, Setubal, Portugal), and SSL-E481- sodium stearoyl-2 lactylate (Puratos, Portugal) were also used.
2.2. Bread Dough Preparation
Bread dough preparation was performed according to a previous study [12]. Water absorption (WA) was determined and optimized to 61.8 g/100 g of wheat flour, according to the farinograph tests (AACC 54–21.02). Control dough and doughs enriched individually with Yg and Cc were prepared considering additions of 10, 20, 30, and 50 g, and the highest levels were 70 g for Yg and 83 g for Cc. The maximum incorporation of the dairy products is determined by the level of water of the wheat dough, i.e., the water absorption with a value of 61.8%. Replacements of dairy products were based on a 100 g of wheat flour basis (baker´s formula), and the dry extract of each dairy product was considered to calculate the moisture coming from each dairy product addition, i.e., for 50 g of yoghurt addition the value for moisture is 44.2 g and dry matter 5.7 g, so we added 94.3 g of wheat flour and 17.6 g of water. The following other ingredients added were kept constant: salt: 1.0%; sugar: 0.6%; dry yeast: 2.4% and sodium stearoyl-2 lactylate: 0.3%. The different bread formulations tested are presented in Table 1.
2.3. Physical Characterisation of the Wheat Dough
2.3.1. Extension Properties
Wheat dough extension properties (WDEP) were accessed by uniaxial extension tests using an SMS/Kieffer Dough and Gluten Extensibility Rig probe coupled to the texture analyser (Texturometer TA-XTplus, Stable MicroSystems, Surrey, UK) with a load cell of 5 kg, according to the method described earlier [13] with some modifications. The pieces of dough were left to rest for 60 min at 30 oC. The measurement conditions were measure force in tension, test speed 1.0 mm·s−1, distance 70 mm, and triggers force 5 g. The force required to stretch the dough sample and the displacement of the hook were recorded as a function of time. The parameters of major importance were (i) R—resistance to deformation (N), (ii) E—extensibility (mm), and (iii) deformation energy (N·mm−1). The ratio number R/E (N·mm−1) was also calculated and reflects the balance between the levels of elastic and viscous components of the wheat dough [14].
2.3.2. Rheology Characterisation
Fundamental viscoelastic behaviour of wheat dough (WD) after fermentation was studied by small amplitude oscillatory shear (SAOS) measurements using a controlled stress rheometer (Haake Mars III-Thermo Scientific, Karlsruhe, Germany) with an Universal Temperature Control-Peltier system to control temperature. The procedure was in agreement with the conditions previously optimized [12]. Stress sweeps were performed at 0.1 and 1.0 Hz to determine the linear viscoelastic region and select the stress to use. Frequency sweep tests, performed at 5 °C to inhibit the yeast fermentative activity, were applied to evaluate the effect of the Yg and Cc additions on dough structure. The evolution of the dough after fermentation time, expressed in terms of storage (G´) and loss (G”) moduli, were obtained, ranging the frequency from 0.001 Hz to 100.0 Hz at a constant shear stress within the previously determined linear viscoelastic region of each sample. All determinations were repeated at least three times to ensure reproducibility of the results.
2.4. Technological Characteristics of the Bread
2.4.1. Bread Texture
Bread texture was evaluated using a texturometer TA-XTplus (Stable MicroSystems, Surrey, UK) in penetration mode. Each bread sample was cut into slices with a height of 20 mm and 120 × 100 mm rectangular shape, and slices rested for 15 min before testing. An acrylic cylindrical probe with 10 mm diameter pierced 5 mm of the sample at 1 mm/s of crosshead speed, with a load cell of 5 kg, according to the method earlier described in reference [12]. Comparison of the bread texture with different Yg and Cc contents was performed in terms of firmness.
Bread staling was evaluated measuring firmness during a storage time of 96 h, and the aging kinetics of the bread was described as a function of the dairy product incorporation according to a linear Equation (1)
where A can be considered the aging kinetics and B the initial firmness.
Firmness = A * time + B,
2.4.2. Quality Parameters of Bread
Bread moisture was determined according to the standard method AACC 44–15.02. Water activity (aW) variations were determined at room temperature (Hygrolab, Rotronic).
Bake loss (BL) of breads, which is defined as the amount of water and organic material (sugars fermented and CO2 released) lost during baking [15], was calculated, according to the Equation (2).
where
Bake loss (%) = [(Wbb − Wab)/Wbb] × 100
- Wab: weight of the loaf after baking;
- Wbb: weight of the loaf before baking.
Bread volume was determined by rapeseed displacement according to the standard method AACC 10-05.01 after 2h of cooling down [8]. Specific bread volume was calculated using Equation (3).
Knowing the weight and the volume of the bread, the specific weight (g/cm3) can also be estimated using the Equation (4), i.e., the reciprocal of specific bread volume.
All the experiments were done at least in triplicate.
Specific volume (cm3/g) = bread volume (cm3)/bread weight (g)
Specific weight (g/cm3) = bread weight (g)/bread volume (cm3)
2.5. Image Analysis of the Bread Slices
The gas cell number of the crumb breads was evaluated 120 min after production using image analysis technology. Images of three slices of breads (control, yoghurt, and curd cheese breads) were scanned full-scale using an Image Scanner (Xerox Corporation, Webster, NY, USA).
A threshold method was used for differentiating gas cells, and the segmentation was performed manually by binarization of grey-scale images into black-and-white images using the Otsu and default ImageJ algorithms, carried out in the ImageJ-based Fiji 1.46 software package [16].
2.6. Nutritional Composition of the Bread
Total nitrogen content was analysed by the MicroKjeldahl method (ISO 20483:2006). The quantification was performed by molecular absorption spectrophotometric equipment (Skalar-Sanplus System, Auto-Analyser, Giesen, Germany) [17,18].
Fat content was determined according to NP 4168. Ash content was determined by incineration at 550 °C in a muffle furnace (AACC Method 08-01.01).
Total mineral contents were determined by inductively coupled plasma atomic emission spectrometer (ICP-AES: Thermo System, ICAP-7000 series). All the experiments were done in triplicate.
2.7. Dough and Bread Microstructure
A scanning electron microscope (TM3030 PLUS—TabletUp Microspcope - Hitachi, Fukuoka Japan) was used to observe the microstructure of the control dough, doughs, and breads obtained with dairy product additions. Samples were placed on the specimen holder, dried automatically by the equipment, and the freezing model was applied (−14 °C). The observations were analysed at 400 × of magnification, and 150 × of magnification, with scale bar of 200 µm for doughs and 500 µm for bread crumb, respectively.
2.8. Sensory Evaluation
Sensory evaluation of breads was carried out in a sensory evaluation room, in individual cabinets, under white light, and at room temperature by a panel of 25 untrained panelists, ages between 20–50, who were regular consumers of bread. Samples were analyzed 24 h after baking. Before analysis, the samples were sliced into equally sized slices (2 cm thick), coded, and then randomly served. Breads were evaluated based on their appearance and sensory acceptance, scoring with the descriptors: color, aroma, taste, texture, and overall acceptability on a five-point hedonic scale, where 1—“dislike extremely”; 3—“indifferent”; 5—“like extremely”. Breads were considered acceptable if their mean scores for overall acceptance were above 3 (like or like extremely).
2.9. Statistical Analysis
The experimental results were statistically analysed by determining the average value, standard deviation, and the significance level was set at 95% for each parameter evaluated. Statistical analysis (RStudio, Version 1.1.423) was performed by variance analysis, the one factor (ANOVA), and post-hoc comparisons (Tukey test).
3. Results and Discussion
3.1. Wheat Dough Extension Properties (WDEP)
The effect of yoghurt (Yg) and curd cheese (Cc) addition on wheat dough extension properties at 30 °C after 60 min of fermentation time was studied, and the results obtained are presented in Figure 1. It is clearly observed that the Yg and Cc have different impacts on dough extension properties, most probably due to the different nature and structure of the proteins added—acid precipitated caseins from Yg and soluble whey protein precipitated by thermal denaturation from Cc. The extension properties are positively affected by Yg addition and are adversely affected by Cc incorporations.
Considering Figure 1A, the dough resistance values were similar to control dough up to 50 g of Yg addition, whereas for 70 g a reduction of about 21% was observed compared to control.
For Cc additions, all the levels evaluated result in dough resistance values lower than the control, with a significant reduction of about 64% (p < 0.05) for the highest level of Cc added (83 g).
From Figure 1B,C, it can be seen that, at 20 g of Yg addition, a steep increase both in extensibility (B) and deformation energy (C) is observed, and remained constant for the rest of the levels evaluated, with higher values compared to the control. Relative to Cc additions, lower values of extensibility and deformation energy than the control dough were observed, except at 30 g of addition, which showed values similar to the control.
In terms of R/E ratio values, the differences observed for Yg and Cc additions are clearly reflected on Figure 1D. The resistance versus extensibility is an important ratio to evaluate the balance between dough resistance (elasticity) and extensibility (viscosity), and a good combination of both parameters is required to obtain desirable dough properties and bread quality [13].
Overall, the addition of Yg has a positive impact on the structure of the dough, which was seen by the increase of the extensibility and deformation energy. One can suggest a synergic interaction between the Yg proteins and wheat proteins on the gluten network development. In addition, the presence of the exopolysaccharides produced by the lactic acid bacteria present in yoghurt, can also act on the system as lubricants, together with gliadins, giving more stability and extensibility to the wheat dough. Similar results were observed by other authors [3,10] who also reported an increase in deformation energy due to the strengthening effect of hydrolyzed caseins and sodium caseinates from the added dairy product.
However, opposite results were obtained for Cc addition that affected the dough properties in extension, suggesting that denatured whey protein has an antagonistic effect with wheat proteins, strongly affecting the gluten matrix. These results can be attributed to the gluten proteins dilution effect [11,12] and protein competition for available water, impacting negatively on dough development [19]. Similar results were previously reported by other researchers [10], demonstrating that dairy by-products such as whey protein, in general, reduce the extensibility and the deformation energy.
Therefore, it can be stated that the Yg addition had no adverse impact on the technology characteristics of the dough, which will have a positive impact on bread quality. The incorporation of the Cc implied a significant reduction on extensibility properties, which would promote a significant depression on bread volume.
Dough Viscoelastic Behaviour
The changes of dough viscoelastic properties after 60 min of fermentation time were monitored by a controlled stress rheometer. The variation of storage (G´) and dissipative (G”) moduli was recorded by frequency sweeping from 0.001 to 100 Hz at a low constant stress value under linear conditions, and the G´ values were plotted at 0.1 Hz and 1.0 Hz to show the rheology changes observed by addition of the Yg and Cc to the wheat dough (Figure 2A1,B1).
As can be seen at Figure 2A1,B1, which are focused on G´ at 0.1 and 1.0 Hz, the behaviour of the doughs with Yg and with Cc were similar. In both, the steepest increase on slope arises from concentrations over 20 g of addition. The almost linear increase of G´ with Yg and Cc addition is characteristic of the dough structuring, indicating a reinforcement of higher density of the molecular links.
The presence of vegetable (cereals) and animal (milk) proteins adds complexity to the protein matrix with protein–protein interactions, which leads to an increasingly structured material [3,20].
Figure 2A2/A3,B2/B3 represent the mechanical spectra obtained with different Yg (A) and Cc (B) additions, where it can be observed that the G´ and G” moduli increase with dairy product addition. In general, all the systems show a certain degree of dependence on the frequency range applied, and the addition of Yg and Cc promote the reinforcement of the dough structure, expressed in terms of viscoelastic functions (G´ and G”) increase.
The apparent disagreement between technology performances—empirical large amplitude extensional rheology (Kieffer Dough and Gluten Extensibility Rig) and small amplitude oscillatory fundamental rheology—can be explained, beyond the different nature and structure of the proteins in play, if the presence of a significant amount of exopolyssacarides in Yg is considered. In fact, the major differences in nature from Yg and Cc are the content of exopolyssacarides produced by lactic acid bacteria and protein structural characteristics of the Yg material. As was recently published [21], the impact of exopolyssacarides on the rheology of dough shows positive interactions with the gluten matrix development.
3.2. Evaluation of Bread Properties
3.2.1. Bread Texture and Aging Kinetics
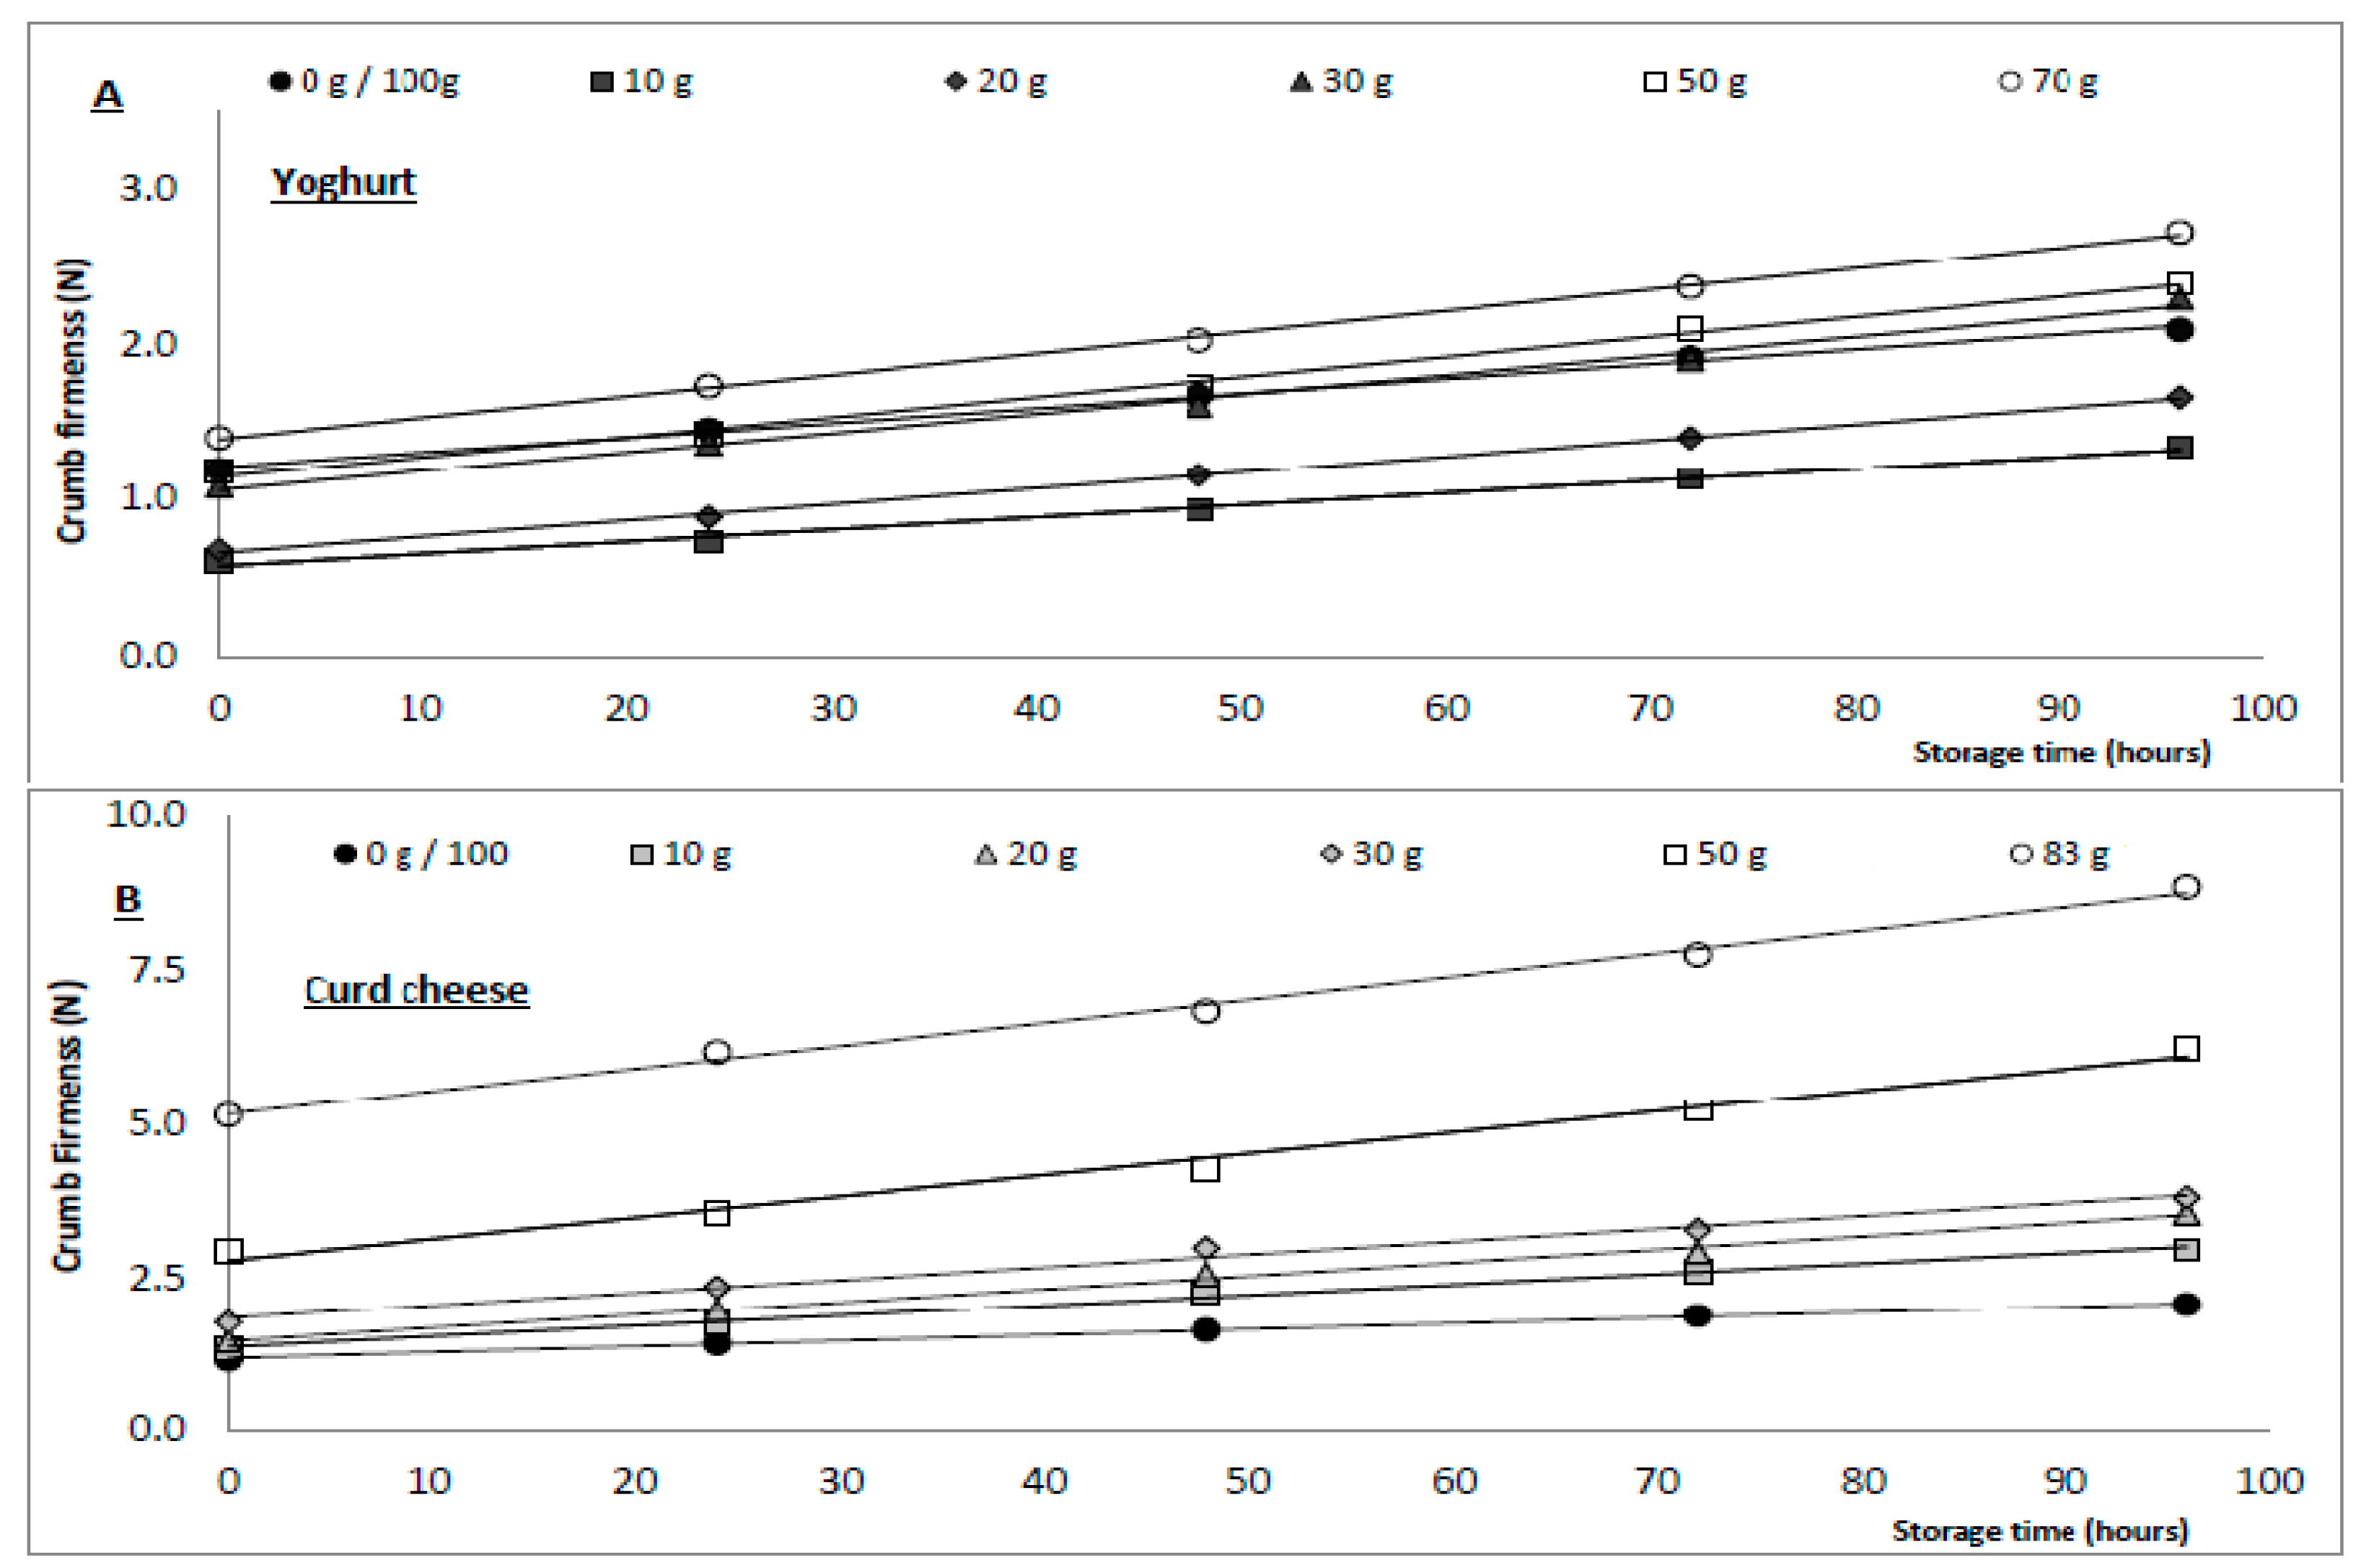
The texture of the breads produced with different contents of yoghurt and curd cheese was evaluated in terms of firmness by a puncture test. The determination of firmness during a storage time of 96 h at room temperature was also performed to evaluate the effect of dairy product additions on the kinetics of bread aging (Figure 3A,B) [12]. From Figure 3A,B, it can be observed that both Yg and Cc additions had different impacts on the aging kinetics of the breads.
Bread aging kinetics was described as a function of the dairy products incorporation, and a positive linear relation (R2 > 0.98) was observed, with parameters presented in Table 2, and clearly reflect the impact of the different levels of Yg and Cc addition on bread aging kinetics (A, the slope) and firmness (B, the interception).
As can be seen from Figure 3A,B and the respective linearizations on Table 2, the Yg breads are clearly less firm than Cc breads: the initial firmness of the control bread (1.21 N) is higher than low incorporations of Yg up to 50 g (1.15 N), and for higher replacements (70 g), the firmness is slightly higher (1.39 N) than control.
The Yg breads aging kinetics (A) ranging from 0.78 × 10⁻² N/h for the 10 g up to 1.36 × 10⁻² N/h for the 70 g of Yg addition and are similar to control bread (0.94 × 10⁻² N/h). In the case of Cc breads, a completely different effect can be observed, i.e., all breads are firmer and the rate of staling is higher than the control bread. The initial firmness up to 30 g of addition is similar to the control, but at 50 g of Cc addition, the increased is about 130%, and at 83 g, it goes up to 330%.
The rate of staling is also increasing substantially, ranging from 1.70 × 10⁻² N/h for the 10 g, up to 3.72 × 10⁻² N/h for the 83 g curd cheese addition, representing an increase of 120%.
Similar results were obtained in earlier studies [11], indicating that the whey protein significantly increase the bread crumb firmness. Our findings are also in agreement with those obtained by other authors [3,10] with the addition of dairy products in bread dough formulations.
This difference in bread texture with addition of Yg and Cc should reflect the complexity of the interactions of the major macromolecules at play and are in agreement with the results observed in extension properties evaluation (Figure 1). Starting from the gluten matrix, when yoghurt is added, some reinforcement of the structure was seen by the increase of extensibility and deformation energy. Values of dough resistance were similar to the control, not interfering substantially on the R/E values. The opposite is observed for curd cheese breads, where R/E values increased steeply, revealing an imbalance of the elastic and viscous components of the wheat dough, clearly reflected in bread texture and aging kinetics.
3.2.2. Quality Parameters of the Bread
The quality features of breads, i.e., moisture content, water activity (aW), specific bread volume (SBV), and the percentage of bake loss (BL), were determined, as well as the crumb cells numbers. The results of quality parameters obtained for yoghurt and curd cheese breads are summarized in Table 3. No significant differences were observed in initial moisture content (43.5–42.6%) and water activity (0.95–0.92) for the different yoghurt breads and the control.
According to the results obtained for the Cc breads, significant differences were observed for the initial moisture content, varying between 43.5% and 38.9%, with a reduction of 11.0% of moisture, compared to the control bread and the higher Cc concentration (83 g). This effect can be explained by the water competition between wheat proteins and precipitated whey proteins during the dough development. Similar results were obtained by other authors [10] by testing the incorporation of dairy by-products on new bread formulations. Water activity had no significant variations (p > 0.05).
No significant differences (p > 0.05) in specific bread volume (SBV) values between control and Yg breads, up to 50 g, were observed (Figure 4A), as well as in the crumb cell numbers (Table 3). The highest replacement tested, 70 g Yg, presented slightly lower SBV (3.30 cm3/g), compared to the control bread (4.44 cm3/g), representing a decrease of 26% (p < 0.05). In terms of bake loss values, no significant differences, up to 50 g of Yg addition, were observed. However, for 70 g of Yg addition the bake loss was lower (11.6%), compared to control bread (16.0%), and this is in line with the slightly higher density observed, leading to a less weight loss during baking.
These good bread volumes of the yoghurt bread are probably due to the synergic effect of the different proteins on the system. In addition, the contribution of exolpolyssacarides, by building a structured polysaccharide network that interacts with the gluten matrix [21], can give more stability and extensibility to the wheat dough (Figure 1B), contributing to the gas retention and leading to a good appearance and desirable bread volume, as observed in Figure 4A.
The addition of Cc to the dough reduces significantly (p < 0.05) the specific bread volume (4.44–1.28 cm3/g) during the baking process compared to control bread at the highest Cc concentration (83 g). As expected, the crumb gas cells for these breads decreased significantly (p < 0.05), varying from 2748.5 (control bread) to 276.0 (83 g of Cc), a reduction of 90% that is a consequence of the depression of 70% in bread volume, clearly observed in Figure 4B. These results, caused by the addition of precipitated whey protein, could be attributed to the antagonistic interaction between these proteins and the gluten complex, reducing the flexibility and the extensibility of the network (Figure 1B), which increases the density of the bread reducing the volume [1].
Our results are in agreement with those obtained by other authors [3] who reported the effect of the whey protein on loaf volume decrease, and hence on the reduction of the gas cell numbers, but sodium caseinate and hydrolyzed casein additions had no significant impact on these values.
3.2.3. Microstructure of Doughs and Breads
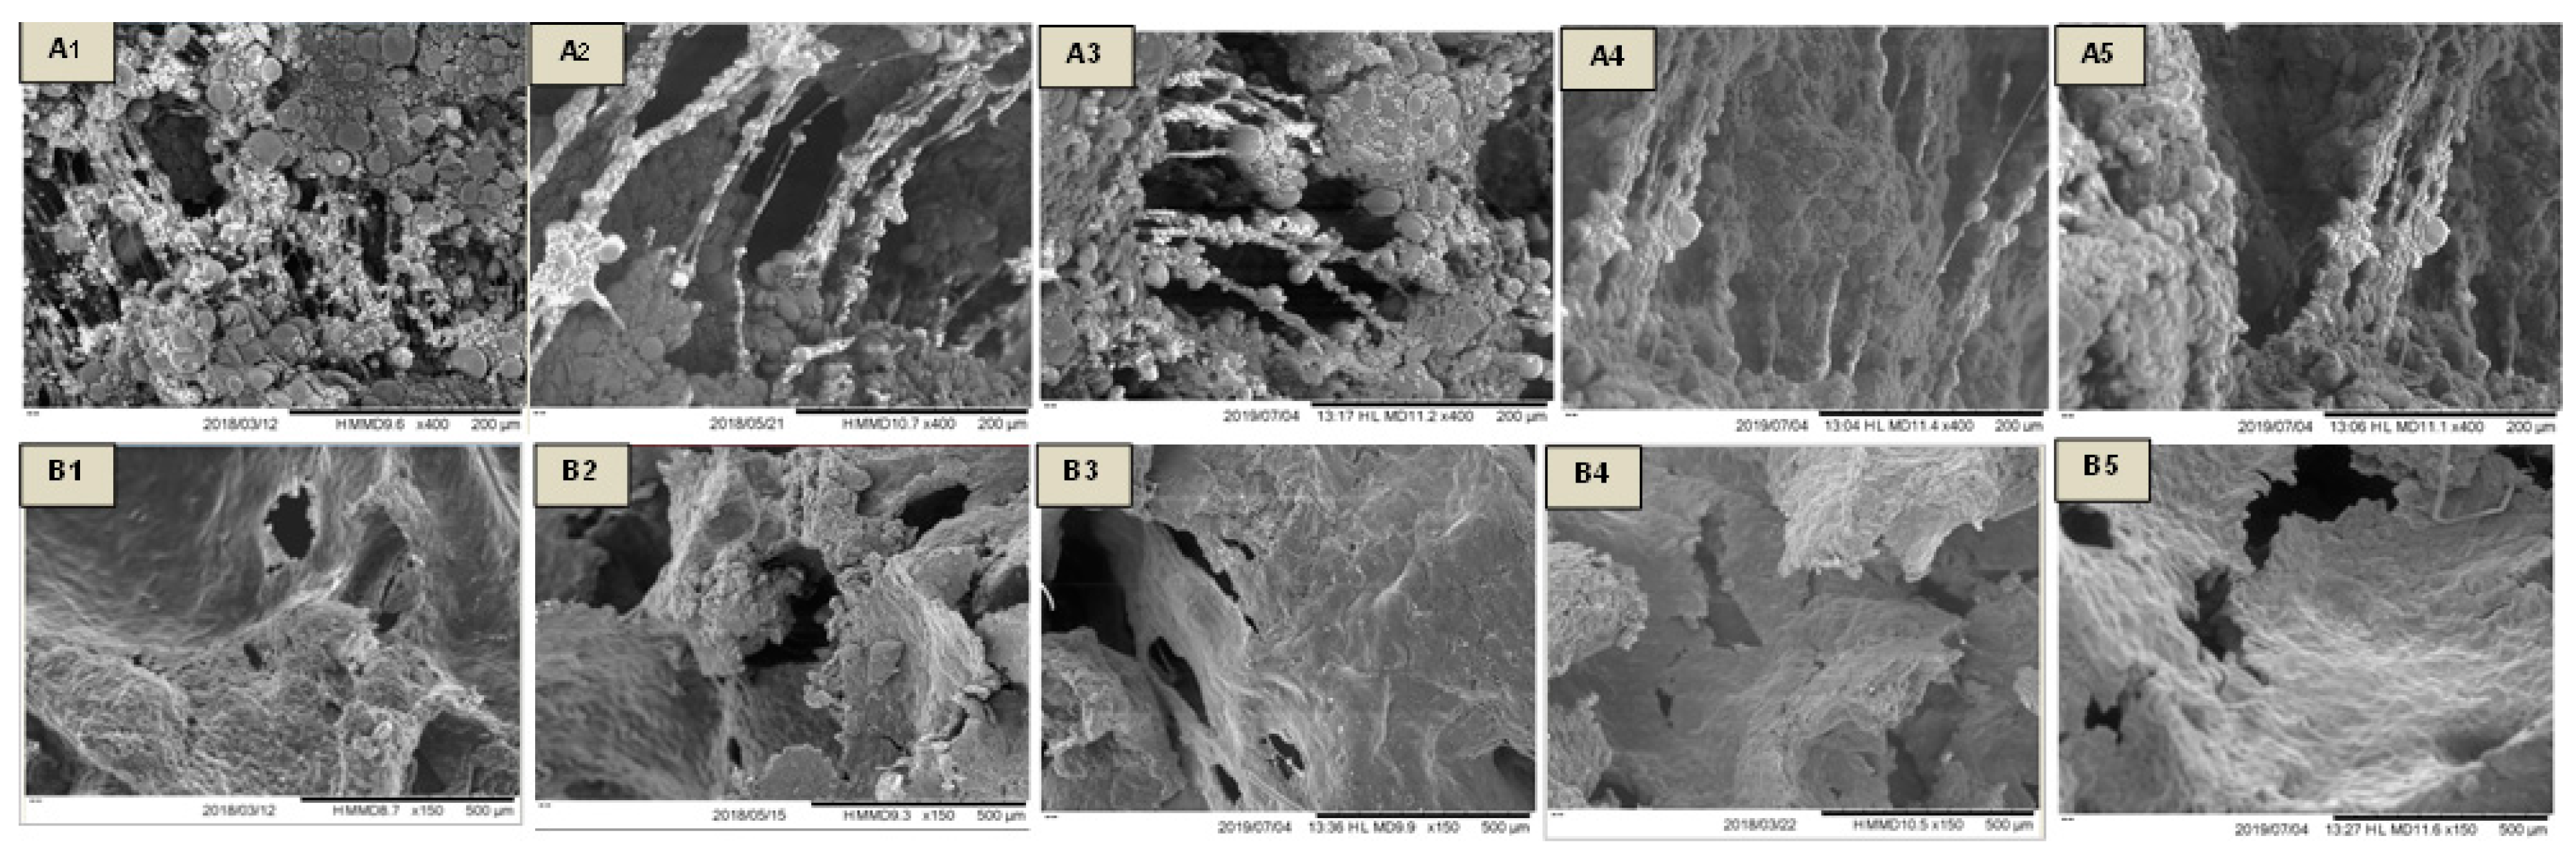
Environment scanning electron microscopy was used to evaluate the microstructure of the doughs, obtained with different levels of yoghurt and curd cheese (30 g and 50 g), after 60 min of fermentation at 30 °C (Figure 5A1–A5). The microstructure of the breads crumb was also observed (Figure 5B1–B5). Figure 5A1–A5 show that dough is made up of the gluten network with small and large starch granules characteristic of the wheat dough.
Comparing the Yg doughs, the dough with 30 g and 50 g (Figure 5A2,A3) displayed a remarkable gluten film, with defined glutenins strands when compared to control dough, which is more evident at 30 g of Yg addition. These results are in agreement with those obtained on the extension properties, supporting the improvement of the flexibility of the net responsible for the increase on the extensibility and deformation energy values (Figure 1B,C). With Cc additions, the gluten film became less notable, as shown in Figure 5 (A4—30 g and A5—50 g of Cc addition), revealing that denatured whey protein interfered with the development of the gluten network, reducing the extensibility of the net (Figure 1B) and thus affecting the gas retention. Therefore, with the structure morphology of these doughs, the reduction of the specific volume of the breads was expected, as observed (Figure 4B).
Figure 5 (B1–B5) show the changes of crumb bread structure of the Yg bread (B2–B3) and Cc bread (B4–B5) compared to the control bread (B1). A more complex cell structure with higher number of gas cells between starch granules and denatured gluten in bread crumb with 30 g of Yg compared to the control is also noticed. This microstructural feature is associated with a lower staling rate, a low degree of firmness, and better bread volume [8]. For breads with 50 g of Yg addition, a more sheet-like structure was observed, probably due to the higher caseins interactions and most probably by the presence of exopolysaccharides that interact with the gluten network, leading to a more homogeneous structure [21]. For the Cc addition, Figure 5B4,B5, a heterogeneous and disaggregated bread crumb is observed, which is a consequence of the interference of the denatured whey protein in the gluten network.
The scanning electron microscopy images obtained for breads with Yg and Cc revealed that the interactions between dairy proteins with different nature and structures with gluten and starch matrix could partially explain and support the results obtained in dough extensibility and bread quality properties.
3.3. Nutritional Composition of the Breads
The nutritional composition, including the mineral contents, was determined for control and experimental breads obtained with 30 g and 50 g of Yg and Cc addition. A positive impact on protein and ash content was observed for both levels of dairy products tested. However, a remarkable effect was obtained for 50 g of addition in both cases, representing an increase of 7% and 30%, respectively, for Yg breads and 31% and 66% for Cc bread (Table 4). In terms of lipids, there was an increase of 28.0% for 50 g Yg addition and 163.0% of 30 g of Cc addition (the highest level to be considered in terms of bread quality). This increasing in fat is not high for the Yg breads but is considerable in the case of the Cc breads, as these are mainly saturated fatty acids from milk. This can be considered an additional restriction related with the curd cheese incorporation.
Milk and dairy products are valuable sources of minerals with a good assimilability [11] and exert several essential physiological functions in the human body. As they contain major minerals (Ca, K, Mg, and P) and trace elements (including Cu, Fe, Mn, Zn), incorporation of both dairy products promotes a significant improvement on mineral composition (p < 0.05) in general (Table 4).
In the breads with 50 g of addition, a significant increase was observed in Ca (Yg–51%, Cc–145%), K (Yg–20%), P (Yg–21%, Cc–54%), S (Yg–6%, Cc–43%), and Mg (Yg–24%, Cc–12%) compared to control bread. The fortification of the Yg and Cc breads with major and trace minerals is clearly noticeable, representing, in general, more than 15% of the recommended daily dosage for Ca (Yg–16%; Cc–24%), K (Yg–15%), and P (Yg–16%; Cc–18%).
For trace elements, interesting values were also noticed, especially for Cu (Yg–58%; Cc–46%) and Mn (Yg–32%; Cc–34%) (Reg. (CE), No 1924/2006; Dir. No 90/494 (CE)). These significant improvements will contribute to increase the minerals intake in not only daily diet of children’s but also in adulthood and the elderly, where the aging process is associated with a gradual and progressive bone demineralization, along with lowered strength and physical endurance [4].
3.4. Sensory Evaluation
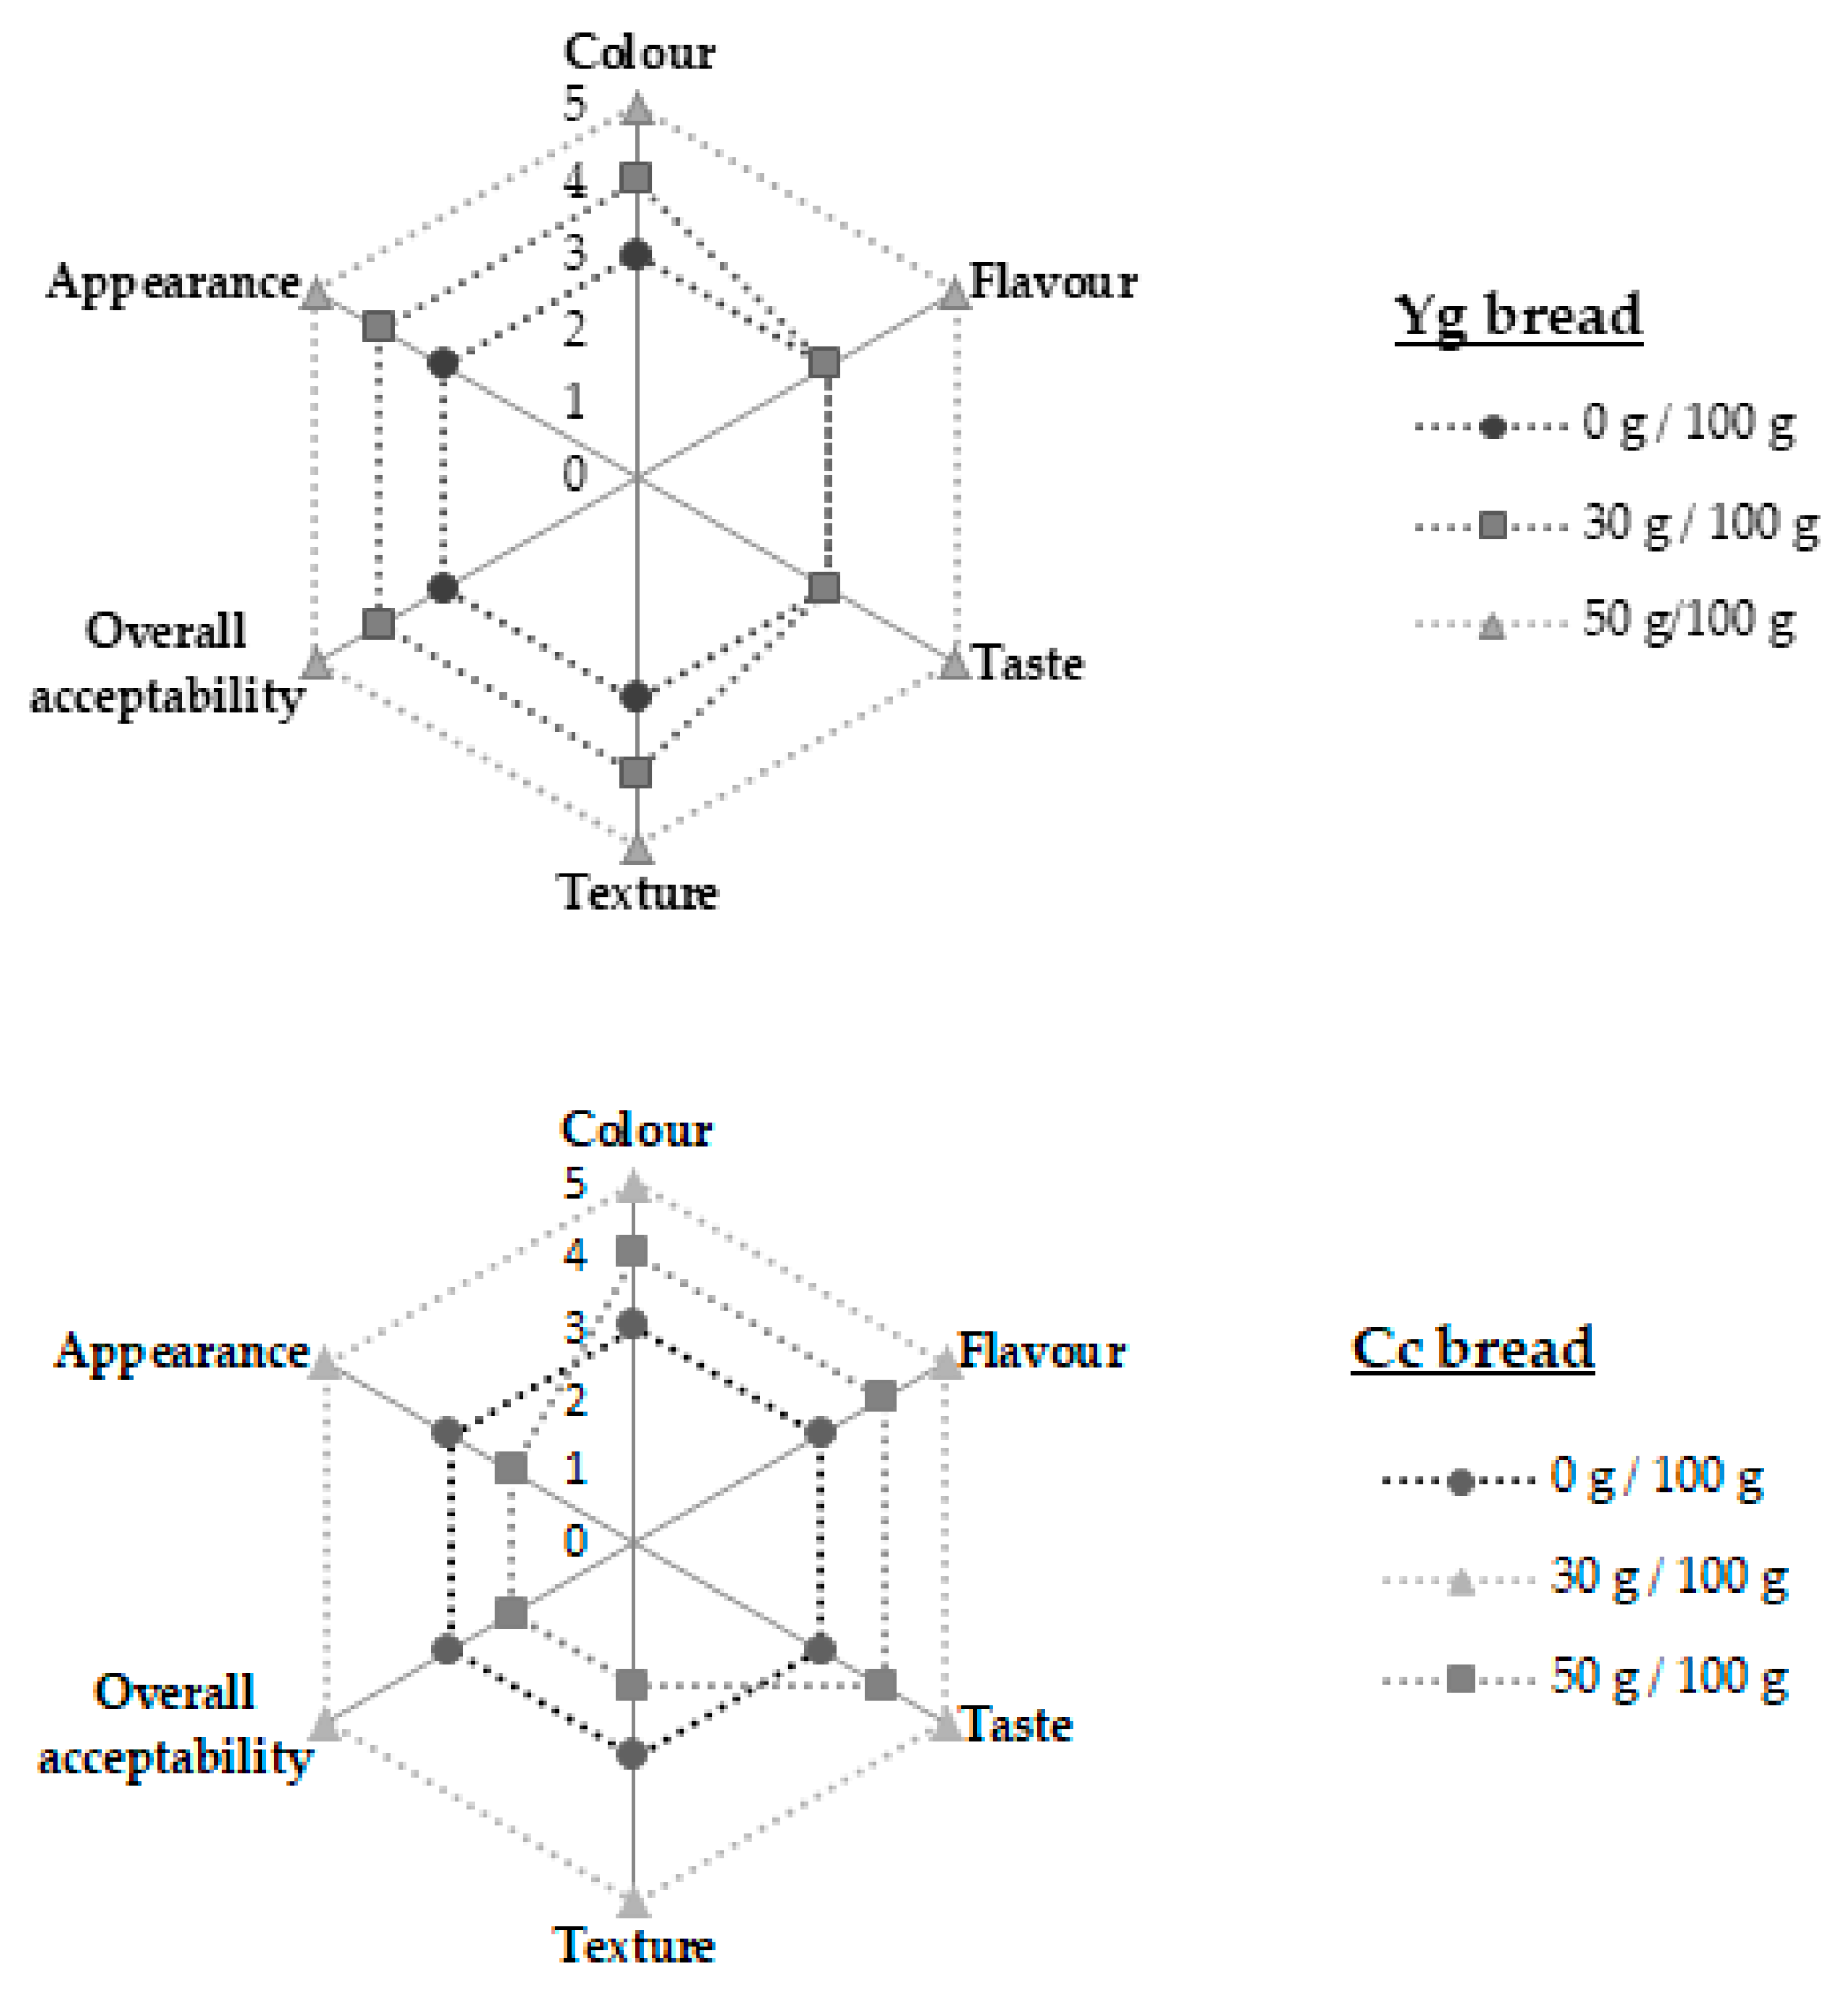
The results of sensory analysis obtained for control bread and breads enriched with Yg (A) and Cc (B) are given in Figure 6. Appearance, flavor, crust color, aroma, texture, and overall acceptability of breads with 30 g and 50 g of both dairy products significantly differ in respect to control bread (0 g/100 g).
Considering the Yg breads (Figure 6A), higher levels of yoghurt addition (50 g) caused a pleasant lactic aroma, taste, and crust color, with a significant positive influence on bread acceptability. This bread scored 5 for all attributes. In terms of texture, this Yg bread was classified as more crunchy, softer, and had a good alveoli distribution compared to the other breads (0 g and 30 g).
The best preference of Cc breads (Figure 6B) was obtained to 30 g of Cc addition, with a good acceptability in overall sensory attributes, and classified as having a better taste, crust color, and aroma. This bread also scored 5 for all attributes. For higher concentration tested (50 g), the excessive amounts of Cc proteins negatively affected the texture of this bread and the alveoli distribution, which influenced their sensorial acceptability. Results of sensory characteristics indicated that a partial replacement of wheat flour by 50 g of Yg and 30 g of Cc gave satisfactory overall consumer acceptability, and with respect to purchase intention, these breads were the best classified as “would buy for sure.”
4. Conclusions
From the results of this work, it can be stated that all incorporations of the Yg resulted in good bread quality properties, and no significant adverse effect on texture and aging bread kinetics was observed. However, for Cc additions, from 30 g of Cc on, a significant increase of the crumb firmness and the aging kinetics was registered. The microstructure analysis supported the results obtained for the dough rheology and bread texture.
Considering nutritional composition, a significant increase in mineral contents was observed, indicating that the Yg and curd Cc can be used as nutritional and functional ingredients in bread formulations, which can have a significant impact on well-being. In terms of lipid content and based on higher levels to be considered as bread quality, the increase on Yg bread (50 g) was not significant, on the order of 28%, compared to control bread. However, for Cc breads (30 g), the increase in fat was much higher, around 168%, and these lipids coming from milk are mainly saturated fatty acids.
The incorporation of both dairy products studied were demonstrated to be an interesting alternative on the design of new bakery goods, with both technology properties and sensory acceptability. In terms of nutritional profile, Yg and Cc additions presented a considerable contribution to balance the daily diet, especially for children and seniors, in terms of protein, as well as in major and trace minerals, which are important to human health. However, the curd cheese addition promoted a significant increase in lipid content, which can constitute a limitation.
Author Contributions
C.G., conceived and planned the experiments; performed all samples preparation and analysis, data analysis, and interpretation of the results: and wrote the manuscript. A.R. and I.S. supervised the research work, contributed to the discussion of the data, and revised the manuscript.
Funding
This work was funded by the University of Lisbon (Doctoral Grant reference to C10781w) and by the Portuguese Foundation for Science and Technology (FCT) through the research unit UID/AGR/04129/2013 (LEAF—Linking Landscape, Environment, Agriculture and Food).
Conflicts of Interest
The authors declare no conflicts of interest.
References
- Smith, J.P.; Daifas, D.P.; El-Khoury, W.; Koukoutsis, J.; El-Khoury, A. Shelf life and safety concerns of bakery products. Crit. Rev. Food Sci. Nutr. 2004, 44, 19–55. [Google Scholar] [CrossRef] [PubMed]
- Fardet, A. Complex foods versus functional foods, nutraceuticals and dietary supplements: Differential health impact (Part 1). Agro Food Ind. Hi Tech. 2015, 26, 20–24. [Google Scholar]
- Kenny, S.; Wehrle, K.; Stanton, C.; Arendt, E.K. Incorporation of dairy ingredients into wheat bread: Effects on dough rheology and bread quality. Eur. Food Res. Technol. 2000, 21, 391–396. [Google Scholar] [CrossRef]
- Walker, S.P.; Wachs, T.D.; Grantham-McGregor, S.; Black, M.M.; Nelson, C.A.; Huffman, S.L. Inequality in early childhood: Risk and protective factors for early child development. Lancet 2011, 378, 1325–1338. [Google Scholar] [CrossRef]
- Urista, C.M.; Fernandez, R.A.; Rodriguez, F.R.A.; Cuenca, A.A.; Tellez, A.J. Review: Production and functionality of active peptides from milk. Food Sci. Technol. Int. 2011, 17, 293–317. [Google Scholar] [CrossRef] [PubMed]
- Li, S.; Zhang, T.; Cai, M.; Huang, B.; Ren, Y. Evaluation of amino acid conversion method for calculating whey protein content in infant formula powder. J. Food Saf. Qual. 2014, 5, 219–226. [Google Scholar]
- Tamime, A.Y.; Robinson, R.K. Yoghurt: Science and Technology, 2nd ed.; CRC Press LLC: Boca Raton, FL, USA, 1999. [Google Scholar]
- Sharafi, S.; Yousefi, S.; Faraji, A. Developing an innovative textural structure for semi-volume breads based on interaction of spray-dried yogurt powder and jujube polysaccharide. Int. J. Biol. Macromol. 2017, 104, 992–1002. [Google Scholar] [CrossRef] [PubMed]
- Morens, C.; Bos, C.; Pueyo, M.E.; Benamouzig, R.; Gausseres, N.; Luengo, C. Increasing habitual protein intake accentuates differences in postprandial dietary nitrogen utilization between protein sources in humans. J. Nutr. 2003, 133, 2733–2740. [Google Scholar] [CrossRef] [PubMed]
- Madenci, A.B.; Bilgiçli, N. Effect of whey protein concentrates and buttermilk powders on rheological properties of dough bread quality. J. Food Qual. 2014, 37, 117–124. [Google Scholar] [CrossRef]
- Wronkowska, M.; Jadacka, M.; Soral-Smietana, M.; Zander, L.; Dajnowiec, F.; Banaszczyk, P.; Jelinski, T.; Szmatowicz, B. ACID whey concentrated by ultrafiltration a tool for modelling bread properties. LWT-Food Sci. Technol. 2015, 61, 172–176. [Google Scholar] [CrossRef]
- Graça, C.; Fradinho, P.; Sousa, I.; Raymundo, A. Impact of Chlorella vulgaris on the rheology of wheat flour dough and bread texture. LWT-Food Sci. Technol. 2018, 89, 466–474. [Google Scholar] [CrossRef]
- Bureova, I.; Kracmar, S.; Dvorakova, P.; Streda, T. The relationship between rheological characteristics of gluten-free dough and the quality of biologically leavened bread. J. Cereal Sci. 2014, 60, 271–275. [Google Scholar] [CrossRef]
- Hou, G.G. Asian Noodles: Science, Technology, and Processing; Wiley and Sons, Inc.: Hoboken, NJ, USA, 2010. [Google Scholar]
- Alvarez-Jubete, L.; Auty, M.; Arendt, E.K.; Gallagher, E. Baking properties and microstructure of pseudocereal fours in gluten-free bread formulations. Eur. Food Res. Technol. 2010, 230, 437–445. [Google Scholar] [CrossRef]
- Crowley, P.; Grau, H.; Arendt, E.K. Influence of additives and mixing time on crumb grain characteristics of wheat bread. Cereal Chem. 2000, 77, 370–375. [Google Scholar] [CrossRef]
- Krom, M. Spectrophotometric determination of ammonia; a study of modified Berthelot reaction using salicylate and dichloroisocyanurate. Analyst 1980, 105, 305–316. [Google Scholar] [CrossRef]
- Searle, L. The Berthelot or indophenol reaction and its use in the analysis chemistry of nitrogen. Analyst 1984, 109, 549–568. [Google Scholar] [CrossRef]
- Noisuwan, A.; Hemar, Y.; Bronlund, J.E.; Wilkinson, B.; Williams, M.A.K. Viscosity, swelling and starch leaching during the early stages of pasting of normal and waxy rice starch suspensions containing different milk protein containing different milk protein ingredients. Starch-Stärke 2007, 59, 379–387. [Google Scholar] [CrossRef]
- Graça, C.; Raymundo, A.; Sousa, I. Rheology changes in oil-in-water emulsions stabilized by a complex system of animal and vegetable proteins induced by thermal processing. LWT-Food Sci. Technol. 2016, 74, 263–270. [Google Scholar] [CrossRef]
- Lynch, K.M.; Coffey, A.; Arendt, E.K. Exopolysaccharides producing lactic acid bacteria: Their techno-functional role and potential application in gluten-free bread products. Food Res. Int. 2018, 110, 52–61. [Google Scholar] [CrossRef] [PubMed]
- Bilgin, B.; Dalioglu, O.; Konyali, M. Functionality of bread made with pasteurized whey and/or buttermilk. Ital. J. Food Sci. 2006, 3, 277–286. [Google Scholar]
Figure 1.
Effect of the Yg and Cc incorporation, after 60 min of fermentation time at 30 °C, on the extension properties of the dough, in terms of: (A)—resistance to extension (N), (B)—extensibility (mm), (C)—deformation energy (N.mm−1) and (D)—ratio R/E (N.mm−1), with different levels of dairy product (DP) additions: 10, 20, 30, 50, and higher replacements (HR) tested—70 g for Yg and 83 g for Cc—compared with control dough (0 g/100 g). Different letters indicate statistically significant differences at p < 0.05 (in Tukey test), compared with the control dough parameters (black bars).

Figure 2.
Variation of storage (G´) at 0.1 Hz and 1.0 Hz (A1–B1) and frequency sweep curves—change of the storage (G’—close symbols) and loss (dissipative (G”)—open symbols) moduli with frequency (A2, A3; B2, B3), for samples with differents levels of DP: A yoghurt doughs and B for curd cheese doughs.

Figure 3.
Variation of firmness (N) and aging kinetics for breads prepared with different contents of Yg (A) and Cc (B) addition, replacing the flour in bread formulation, at initial and 96 h of storage time, and respective linear equations: staling rate as crumb firmness with time for the different concentrations of Yg and Cc.

Figure 4.
Breads obtained with different levels of yoghurt (A) and curd cheese (B) incorporation: 10 g, 20 g, 30 g, 50 g and 70 g Yg, and 83 g Cc/100 g wheat flour, compared to control bread (without dairy product, 0 g/100 g wheat flour).
Figure 4.
Breads obtained with different levels of yoghurt (A) and curd cheese (B) incorporation: 10 g, 20 g, 30 g, 50 g and 70 g Yg, and 83 g Cc/100 g wheat flour, compared to control bread (without dairy product, 0 g/100 g wheat flour).

Figure 5.
Scanning electron micrographs (400 ×, scale bar = 200µm for dough; 150 ×, scale bar = 500 µm for bread crumb): A—fermented dough (60 min/37 °C); A1—Control dough; A2—30 g Yg, A3—50 g Yg; A4—30 g Cc, A5—50 g Cc; B—breads: B1—control bread, B2—30 g Yg, B3—50 g Yg; B4—30 g Cc, B5—50 g Cc, at first day of storage time.

Figure 6.
Sensory profile analysis of breads enriched with yoghurt (A) and curd cheese (B), with 30 g and 50 g of addition, compared with control bread (0 g/100 g).
Figure 6.
Sensory profile analysis of breads enriched with yoghurt (A) and curd cheese (B), with 30 g and 50 g of addition, compared with control bread (0 g/100 g).


Table 1.
Bread formulations optimized to the control bread (CB) and different levels of yoghurt (Yg) and curd cheese (Cc) addition, considering the moisture content and dry extract of each dairy product (DP) *.
Table 1.
Bread formulations optimized to the control bread (CB) and different levels of yoghurt (Yg) and curd cheese (Cc) addition, considering the moisture content and dry extract of each dairy product (DP) *.
| Ingredients | CB | Yg10g | Cc10g | Yg20g | Cc20g | Yg30g | Cc30g | Yg50g | Cc50g | Yg70g | Cc83g |
|---|---|---|---|---|---|---|---|---|---|---|---|
| Wheat flour | 100.0 | 98.9 | 97.4 | 97.7 | 94.8 | 96.6 | 92.2 | 94.3 | 87.1 | 92.0 | 78.5 |
| Deionized water | 61.8 | 53.0 | 54.4 | 44.1 | 47.0 | 35.3 | 39.6 | 17.6 | 24.7 | 0.0 | 0.0 |
| Yoghurt * | 0.0 | 10.0 | - | 20.0 | - | 30.0 | - | 50.0 | - | 70.0 | - |
| Curd cheese * | 0.0 | - | 10.0 | - | 20.0 | - | 30.0 | - | 50.0 | - | 83.3 |
* 100 g of Yg: moisture—88.5 g; dry extract—11.5 g; * 100 g of Cc: moisture: 74.2 g; dry extract: 25.8 g.
Table 2.
Parameters of linear relationship: bread aging kinetics (A) and firmness (B) obtained for control bread (CB—0 g/100 g) and for the different levels of yoghurt (Yg) and curd cheese (Cc) tested.
Table 2.
Parameters of linear relationship: bread aging kinetics (A) and firmness (B) obtained for control bread (CB—0 g/100 g) and for the different levels of yoghurt (Yg) and curd cheese (Cc) tested.
| DP Levels | Aging Kinetics (A) | Firmness (B) | R2 |
|---|---|---|---|
| CB | 0.94 × 10⁻² | 1.21 | 0.997 |
| Yg10g | 0.78 × 10⁻² | 0.58 | 0.991 |
| Yg20g | 1.03 × 10⁻² | 0.67 | 0.999 |
| Yg30g | 1.23 × 10⁻² | 1.06 | 0.992 |
| Yg50g | 1.28 × 10⁻² | 1.15 | 0.998 |
| Yg70g | 1.36 × 10⁻² | 1.39 | 0.995 |
| Cc10g | 1.70 × 10⁻² | 1.40 | 0.995 |
| Cc20g | 2.14 × 10⁻² | 1.50 | 0.995 |
| Cc30g | 2.08 × 10⁻² | 1.87 | 0.987 |
| Cc50g | 3.45 × 10⁻² | 2.81 | 0.988 |
| Cc83g | 3.72 × 10⁻² | 5.18 | 0.994 |
Table 3.
Quality parameters, moisture, aw, bake loss, specific bread volume (SBV), and cell numbers of the control bread (CB—0 g/100 g) and breads produced with yoghurt (Yg) and curd cheese (Cc) addition *.
Table 3.
Quality parameters, moisture, aw, bake loss, specific bread volume (SBV), and cell numbers of the control bread (CB—0 g/100 g) and breads produced with yoghurt (Yg) and curd cheese (Cc) addition *.
| X g/(100 − X) g WF | Moisture (%) | aw | Bake Loss (%) | SBV (cm3/g) | Cell Numbers |
|---|---|---|---|---|---|
| CB | 43.50 ± 0.31 a | 0.95 ± 0.01 a | 16.16 ± 0.58 a | 4.44 ± 0.09 a | 2748.5 ± 52.3 a |
| Yg10g | 42.81 ± 0.11 a | 0.93 ± 0.05 a | 13.13 ± 1.86 a | 4.40 ± 0.25 a | 2875.0 ± 30.1 ab |
| Yg20g | 43.60 ± 1.34 a | 0.92 ± 0.02 a | 14.70 ± 1.06 a | 4.10 ± 0.23 ab | 2982.0 ± 65.4 ab |
| Yg30g | 43.65 ± 0.34 a | 0.93 ± 0.03 a | 13.15 ± 2.48 a | 3.84 ± 0.26 ab | 3015.3 ± 38.7 b |
| Yg50g | 43.30 ± 0.33 a | 0.93 ± 0.05 a | 12.07 ± 1.29 b | 3.61 ± 0.36 ab | 2799.7 ± 67.0 a |
| Yg70g | 42.60 ± 0.27 a | 0.92 ± 0.04 a | 11.55 ± 2.26 b | 3.30 ± 0.23 b | 2568.0 ± 85.0 a |
| Cc10g | 44.10 ± 0.24 a | 0.95 ± 0.03 a | 11.40 ± 0.26 b | 3.90 ± 0.22 b | 1131.0 ± 77.0 b |
| Cc20g | 43.10 ± 0.08 ab | 0.94 ± 0.01 a | 10.52 ± 1.15 b | 3.47 ± 0.18 bc | 1035.0 ± 88.2 b |
| Cc30g | 42.40 ± 0.50 bc | 0.93 ± 0.05 a | 10.70 ± 1.41 b | 3.21 ± 0.04 c | 1235.0 ± 83.1 c |
| Cc50g | 41.93 ± 0.20 c | 0.94 ± 0.03 a | 9.00 ± 0.60 b | 2.84 ± 0.16 d | 344.0 ± 15.5 d |
| Cc70g | 38.85 ± 1.48 d | 0.95 ± 0.02 a | 9.60 ± 1.27 b | 1.28 ± 0.09 e | 276.0 ± 25.0 e |
* Different letters (a, b, c, d) within the same column, for each dairy product, indicate statistically significant differences at p < 0.05 (Tukey test), compared with the bread control parameters.
Table 4.
Nutritional composition * and mineral content of breads produced with yoghurt and curd cheese: 30 g and 50 g of yoghurt (Yg) and curd cheese (Cc).
Table 4.
Nutritional composition * and mineral content of breads produced with yoghurt and curd cheese: 30 g and 50 g of yoghurt (Yg) and curd cheese (Cc).
| Control Bread | Yoghurt Breads | Curd Cheese Breads | |||
|---|---|---|---|---|---|
| (g/100 g) | 0 g | 30 g | 50 g | 30 g | 50 g |
| Ash | 1.75 ± 0.02 a | 1.94 ± 0.14 a | 2.28 ± 0.11 b | 2.61 ± 0.02 b | 2.90 ± 0.12 c |
| Lipids | 1.92 ± 0.15 a | 2.22 ± 0.21 a | 2.46 ± 0.20 ab | 5.06 ± 0.06 c | 8.03 ± 0.16 d |
| Proteins | 8.44 ± 0.15 a | 8.50 ± 0.17 a | 9.03 ± 0.57 a | 9.85 ± 0.17 b | 11.02 ± 0.32 c |
| Carbohydrates | 44.30 ± 0.45 a | 44.20 ± 0.45 a | 43.4 ± 0.22 a | 40.15 ± 0.80 b | 32.38 ± 1.43 c |
| kcal | 228.22 ± 1.39 a | 230.75 ± 1.23 a | 232.22 ± 1.83 a | 244.73 ± 2.87 c | 249.5 ± 2.13 d |
| Mineral Content (mg/100 g) | |||||
| Na (mg/g) | 4.29 ± 0.07 a | 4.06 ± 0.11 b | 3.73 ± 0.28 b | 4.74 ± 0.05 c | 3.16 ± 3.39 b |
| K | 215.32 ± 1.41 a | 227.80 ± 4.85 a | 257.25 ± 5.4 b | 160.91 ± 3.39 c | 117.58 ± 2.52 c |
| P | 107.05 ± 1.99 a | 115.80 ± 2.29 a | 128.9 ± 1.05 b | 144.06 ± 0.73 c | 164.93 ± 5.84 c |
| S | 96.8 ± 1.70 a | 98.60 ± 2.33 a | 102.01 ±1.16 a | 117.11 ± 2.35 b | 138.62 ± 3.07 c |
| Ca | 79.76 ± 1.70 a | 105.90 ± 2.68 b | 120.5 ± 0.41 b | 160.92 ± 2.44 c | 195.33 ± 2.29 d |
| Mg | 24.90 ± 0.77 a | 25.72± 0.66 a | 30.83 ± 0.05 b | 26.54 ± 0.41 a | 27.96 ± 0.40 a |
| Fe | 2.09 ± 0.44 a | 1.36 ± 0.23 b | 1.50 ± 0.12 b | 1.35 ± 0.14 b | 1.17 ± 0.02 b |
| Zn | 1.17 ± 0.03 a | 1.16 ± 0.01 a | 1.08 ± 0.01 a | 1.24 ± 0.03 a | 0.87 ± 0.01 c |
| Mn | 0.48 ± 0.05 a | 0.61 ± 0.02 b | 0.68± 0.01 b | 0.55 ± 0.03 a | 0.63 ± 0.05 b |
| Cu | 0.18 ± 0.02 a | 0.64 ± 0.10 b | 0.52 ± 0.08 b | 0.19 ± 0.01 a | 0.46 ± 0.05 b |
* Different letters (a, b, c, d) within the same row indicate statistically significant differences at p < 0.05 (Tukey test), compared with the bread control parameters.
© 2019 by the authors. Licensee MDPI, Basel, Switzerland. This article is an open access article distributed under the terms and conditions of the Creative Commons Attribution (CC BY) license (http://creativecommons.org/licenses/by/4.0/).
Share and Cite
MDPI and ACS Style
Graça, C.; Raymundo, A.; Sousa, I. Wheat Bread with Dairy Products—Technology, Nutritional, and Sensory Properties. Appl. Sci. 2019, 9, 4101. https://0-doi-org.brum.beds.ac.uk/10.3390/app9194101
AMA Style
Graça C, Raymundo A, Sousa I. Wheat Bread with Dairy Products—Technology, Nutritional, and Sensory Properties. Applied Sciences. 2019; 9(19):4101. https://0-doi-org.brum.beds.ac.uk/10.3390/app9194101
Chicago/Turabian StyleGraça, Carla, Anabela Raymundo, and Isabel Sousa. 2019. "Wheat Bread with Dairy Products—Technology, Nutritional, and Sensory Properties" Applied Sciences 9, no. 19: 4101. https://0-doi-org.brum.beds.ac.uk/10.3390/app9194101
Note that from the first issue of 2016, this journal uses article numbers instead of page numbers. See further details here.