Article

Electricity Evaluation and Emission Characteristics of Poultry Litter Co-Combustion Process

1
Industrial and Systems Engineering Department, Morgan State University, 1700 East Cold Spring Lane, Baltimore, MD 21251, USA
2
Center for Advanced Energy Systems and Environmental Technologies, School of Engineering, Morgan State University, 5200 Perring Parkway, Baltimore, MD 21239, USA
*
Author to whom correspondence should be addressed.
Submission received: 6 September 2019 / Revised: 27 September 2019 / Accepted: 27 September 2019 / Published: 1 October 2019
(This article belongs to the Special Issue Biomass Energy and Biomass as a Clean Renewable Fuel)

Abstract

:

Featured Application

Results and findings from this study can be used to further develop the sustainable and environmentally friendly small-scale biomass combustion system.

Abstract

Electricity generation and emission characteristics during the poultry litter and natural gas co-combustion process has rarely been studied. In this study, a Stirling engine was successfully integrated into the existing lab-scale swirling fluidized bed combustion system in order to further investigate the poultry litter and natural gas co-combustion process. Electricity, gaseous emissions, particulate matter (PM), and fly ash composition were analyzed under various operating conditions. Results indicated that the electricity reached 905 W under a water flow rate of 13.1 L/min and an engine head temperature of 584 °C. It was found that excess air (EA) ratios between 0.79 and 1.08 can relatively produce more electricity with lower emissions. At a secondary air (SA) height of 850 mm, secondary air/total air (SA/TA) ratios between 0.22 and 0.44 may significantly reduce NOx and CO emissions. By increasing the mixing ratio (MR), SO2 was reduced while NOx increased at the beginning of co-combustion process but then decreased again. Additionally, PM results were lower than Maryland emissions standards. The fly ash results showed a higher nutrient content (close to 16%). This study shows the possibility of using poultry litter as a sustainable energy source for energy production while emitting lower emissions in the small decentralized combustion system.

Graphical Abstract

1. Introduction

During poultry production on farms, poultry litter (or broiler litter) is generated as a mixture of poultry excreta (or manure), bedding materials (e.g., wood shavings, sawdust, peanut hulls, and rice hulls), spilled feed, dead birds, bones, and feathers [1,2]. Over the past few decades, there have been increasing mass quantities of poultry litter produced all over the world due to the increasing demand for animal and protein products in human’s daily diet. In 2009, about 25 million tons of total poultry litter were produced in Europe and in the U.S. [1]. The U.S. is the world’s largest broiler chicken producer with an annual production approximately between 8.4 billion (in 2012) and 8.9 billion (in 2017) [3]. Using the assumption of poultry litter production between 1.1 and 1.4 tons per 1000 birds, the U.S. alone annually produces around 9.24–12.46 million tons of poultry litter [1,4]. Brazil is the second largest producer of broiler chickens. It is estimated that the annual volume of poultry litter generated by Brazil is annually around 8–10 million tons [5]. In most cases, poultry litter is applied to the croplands as an organic fertilizer due to its rich nutrients, such as nitrogen, phosphorous, calcium, and potassium [5]. However, excessive overtime application and indiscriminate use have been blamed for eutrophication, pathogen contamination, nuisances (e.g., flies and odors), fish death, and other negative effects on human and animal health [1,5,6]. Increment of poultry litter production in the Delmarva Peninsula and all its challenges have stimulated the process of developing and seeking more efficient, cost-effective, environment-friendly, and sustainable poultry litter disposal methods and technologies.
Several technical reviews were conducted to compare and summarize alternative poultry litter disposal technologies for energy production and to identify existing technical challenges. Kelleher et al. [7] found that three main alternative disposal routes—composting, anaerobic digestion, and combustion—may increase the opportunities to produce market energy and nutrient ash by furthering the advancement in disposal routes while providing financial incentives. In 2010, Perera et al. [8] reviewed environmental and social issues from using poultry litter as a feedstock for energy production by four techniques, anaerobic digestion, combustion, co-firing (or co-combustion), and gasification. Recently, Dalólio et al. [5] analyzed characteristics of poultry litter as a fuel and discussed the main thermal-chemical processes (e.g., anaerobic digestion, combustion, gasification, and pyrolysis) for energetic conversion. The study then proposed measures to improve its performance as a sustainable biomass fuel. Literature reviewed and pointed out that the thermal-chemical processes are effective disposal routes from both technical and environmental points of view to generate useful energy from poultry litter with lower emissions.
Combustion is widely considered as one of the most simple, cost-effective, and environmentally benign thermal-chemical processes to date. It provides space heating and large-scale power generation, as well as combined heat and power [6,7,9]. In the U.S., there are currently several European-based companies which have constructed commercial centralized combustion systems. For instance, Ireland-based Biomass Heating Solutions Inc. has constructed a manure to combined heat and power plants in Maryland, where the combustion systems use poultry litter as an energy resource to produce useful energy [10]. However, there are several technical challenges of burning U.S. poultry litter in current combustion units. This is because U.S. poultry growers typically clean out poultry litter up to a certain depth, and then proceeds to put a fresh layer of bedding materials on the existing layers for an extended number of flocks. On the other hand, the EU government requires broiler sheds to be completely cleaned out after each flock [11]. However, most of the U.S. poultry farms often clear sheds completely every 1–2 years. Different farming practices, cleaning periods, and bedding materials in the U.S. result in low fixed carbon, high ash, and heating values of poultry litter between 6.78 and 27.90 MJ/kg with an average of 14.08 MJ/kg [2]. These characteristics result in problems on maintaining steady and complete combustion of poultry litter alone [1,2,6]. In addition, decentralized poultry farms and a large volume of poultry litter generation per farm make it difficult to transport and process poultry litter in a centralized location within a large-scale combustion system.
Therefore, co-combustion of poultry litter with fossil fuels (i.e., coal) has been considered as an alternative to increasing the heating value of solid fuels. This alternative will also help to solve technical challenges in the small-scale combustion system. Table 1 provides a summary of major findings associated with poultry wastes and coal combustion studies in the last two decades. When compared with coal, natural gas possesses several advantages and is usually considered as a “bridge fuel” to aid in transitions to renewable and near-zero-emission energy resources. As a result, there is an increase in the utilization of natural gas, and thereby makes up roughly a quarter of the total U.S. energy consumption [12]. The shifts from coal to natural gas in recent decades have been due to very small amounts of CO2, NOx, SO2, CO, and other reactive hydrocarbons in its emissions. In addition, virtually no particulate matter (PM) emissions are found during the combustion process [13]. Despite possessing several environmental benefits, natural gas has rarely been used over coal during the poultry litter and fossil fuel co-combustion processes. To this end, Zhu and Lee [14] conducted a co-combustion study of poultry litter and natural gas within a lab-scale advanced swirling fluidized bed combustion system to mainly evaluate system performance and predict carbon combustion efficiency. The highest carbon combustion efficiency (89%) was found at around 30% excess air (EA) and 20% secondary air (SA) at a height of 0.85 m during the co-combustion process. Results showed that the emissions of NOx increase significantly, and the CO concentration decreases with increasing EA ratios within a range of 0–40%. In a further study, Zhu et al. [15] applied an artificial neural network to predict carbon combustion efficiency and found relatively high carbon combustion efficiencies (over 84%) within the following ranges: moisture contents of 11%–14%, litter ratios of 0.05–0.1, EA of 0.22–0.45, and SA of 0.18–0.27. Previous studies have focused on the combustion performance (e.g., combustion efficiency and temperature distribution) and gas emissions (e.g., CO, NOx, and SO2) during the poultry litter and natural gas co-combustion process. So far, electricity generation from poultry litter and natural gas co-combustion has not been investigated. In addition, PM emissions and fly ash analysis during the poultry litter and natural gas co-combustion process has not been studied in the previous research work.
The main objective of this study is to explore the feasibility of electricity production with low emissions during the poultry litter and natural gas co-combustion process within a lab-scale advanced swirling fluidized bed combustion system. During the electricity generation and production process, the effects of operating conditions, namely EA ratio (0.04–1.54), SA/ primary air (PA) ratio (0.22–0.78), SA height (650 mm, 850 mm, and 1100 mm), and mixing ratio (MR) (1.89, 2.29, 2.61, 4.51, and 7.42) on gas emissions (e.g., CO, NOx, and SO2) were also investigated. Moreover, the PM emissions and chemical composition of fly ash were also analyzed to study the impact of poultry litter byproducts and to increase the feasibility of poultry litter utilization as sustainable energy sources to produce biomass energy in a small decentralized combustion system.

2. Materials and Methods

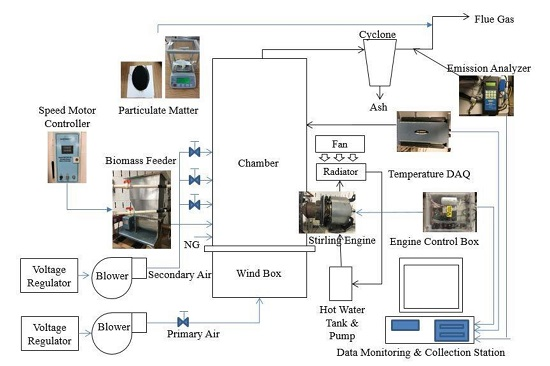
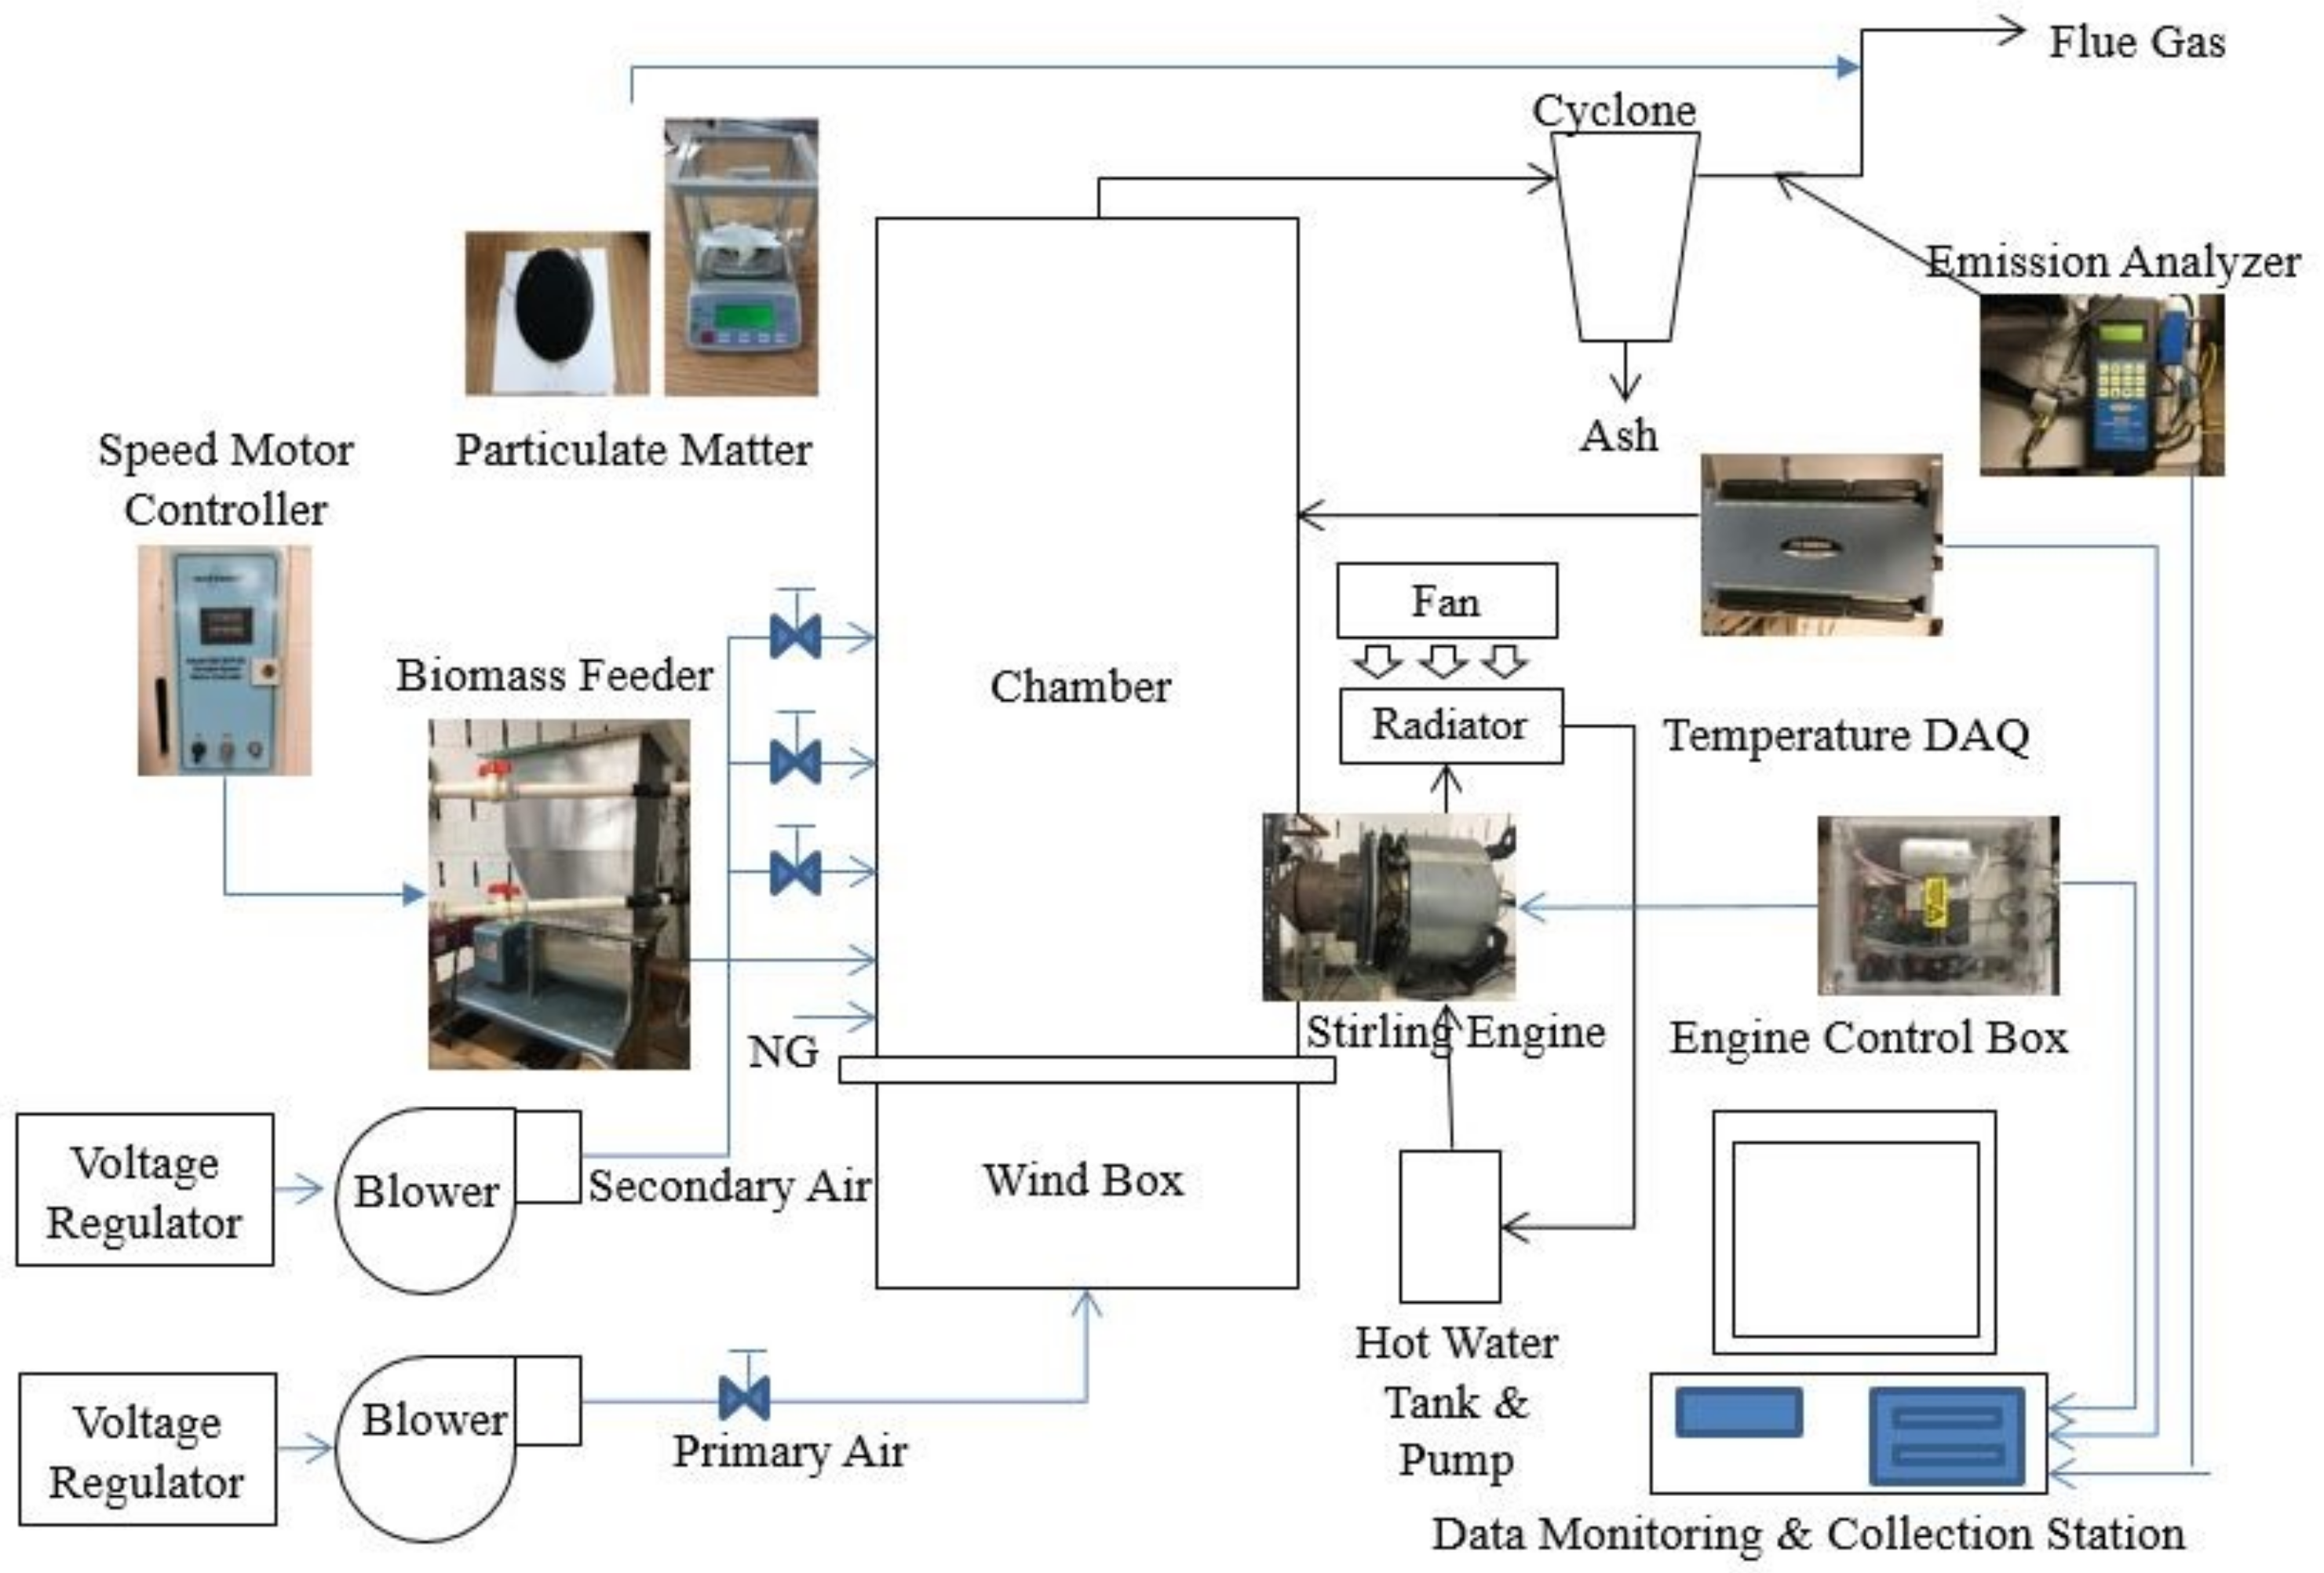
2.1. Apparatus and Experiment Setup

As shown in Figure 1, a lab-scale biomass conversion system was designed, assembled, and developed by the Center for Advanced Energy Systems and Environmental Control Technologies (CAESECT) at Morgan State University. The system converted biomass fuels into useful energy for a small-size poultry farm (2–3 poultry houses). The lab-scale biomass conversion system included an advanced swirling fluidized bed combustion system, a Stirling engine, a fuel-feeding system, an air-supply system, a cyclone, and other instrumentation components. In this study, the lab-scale biomass conversion system was used to study electricity generation and emission characteristics during the poultry litter and natural gas co-combustion process.
The cylinder combustion chamber of the lab-scale advanced swirling fluidized bed combustion system had a diameter of 304.8 mm and a height of 1500.0 mm. The chamber was fabricated with a 12” Schedule 40 carbon steel pipe and was covered inside with 12.7 mm-thickness refractory ceramic. At the bottom of the chamber stood a PA distributor plate (with 36 holes) and its caps connected to the cylinder wind box (304.8 mm in diameter and 330.2 mm in height). PA was injected as fluidizing air to suspend the materials inside the chamber from a 9.8 Amps blower (HP33ARP, Cadillac Products, Tory, MI, USA) through the wind box and the PA distributor plate. SA, also known as swirling air, was injected symmetrically from a 0.49 Amps blower (4C441A, Dayton, OH, USA) through four nozzles at each layer in the tangential direction. There were three different layers of SA supply into the chamber at heights of 650 mm, 850 mm, and 1100 mm. During the test, PA was controlled by using a variable voltage transformer (TDGC-2KM, Circuit Specialists, Tempe, AZ, USA) while SA was controlled by a different voltage transformer (3PN2210, Staco Energy, Miamisburg, OH, USA). A screw-type feeder (105X-G, Acrison, Moonachie, NJ, USA) was used to feed materials into the combustion chamber at a height of 228.6 mm. A speed motor controller was attached to the feeder and controlled the fuel-feeding rate of poultry litter. Natural gas was provided at a height of 120.0 mm for ignition and co-combustion with poultry litter. The 1 kW free piston Stirling engine (E1.4B-00001, Microgen Engine Corporation, The Netherlands) used pressurized helium as a working fluid. The Stirling engine was integrated into the existing lab-scale advanced swirling fluidized bed combustion system at a height of 406.4 mm in order to generate electricity and heat simultaneously during the poultry litter co-combustion process. More specifically, the Stirling engine head was immersed into the region of highest temperature and transferred the maximum external heat from hot flue gas into the working fluid. Then, the hot working fluid expanded a displacer and forced a piston to move to produce mechanical work. Thereafter, linear mechanical work was converted to electricity because the power piston was coupled with a linear alternator. A cooling system was set up to reject waste heat and prevent overheating on the Stirling engine head. The cooling system consisted of a radiator (CU1290, Spectra Premium Industries Inc., Boucherville, QC, Canada) and a cooling fan to reject heat. In addition, a high-temperature hose, a coolant flow sensor, and a control valve for the water flow control (a minimum speed of 7 L/min and a maximum speed of 25 L/min), and a pump system (1XLK9, 1/8 hp, 115 volts, Dayton, OH, USA) were also included in the cooling system. The pump system had a pump and a water storage tank, which recirculated water (a mixture of 50 vol% water and 50 vol% antifreeze coolant), which absorbed waste heat adjacent to the compression space. The Stirling engine experienced the periodical compression and expansion of working fluid at different temperature levels to generate electricity. The engine head temperature and flow rate of mixer were used to control temperature difference. Air ratios were controlled to affect the combustion chamber temperature as well as the engine head temperature. A cyclone was fitted to the exit of combustor and used as a secondary measure to collect fly ash for PM reduction.
Figure 2 is a simplified flow chart of the poultry litter and natural co-combustion process in the lab-scale biomass conversion system. In this process, poultry litter and natural gas were fed as fuel while PA and SA were injected as oxidizers into the combustor. When the fuel and oxidizer were properly reacted, there were three major outputs, which included heat, ash (e.g., fly ash, and bottom ash), and gaseous emissions (e.g., CO, NOx, SO2, and PM). In this study, the generated heat was converted into electricity by using the Stirling engine.
After steady-state combustion was reached under each working condition, flue gas samples were collected after the cyclone outlet. The micro-emission analyzer (Model 500, Enerac, Inc., Holbrook, NY, USA), along with ENERCOM software, was used to measure, record, and analyze the concentration levels of major gaseous emissions (e.g., CO, NOx, and SO2) in the flue gas samples. Each sample was collected with an O2 volume between 10% and 12%. Six (6) rugged heavy-duty transition joint K-type thermocouples (Omega TJ36-CASS-18U-6, Omega Engineering Inc., Norwalk, CT, USA) along with a data acquisition system (Omega OMB-DAQ-2416) were installed to measure, monitor, and collect real-time axial temperature changes with the combustion chamber varied at heights of 177.8 mm, 381.0 mm, 635.0 mm, 889.0 mm, 1143.0 mm, and 1574.8 mm above the PA distributor plate, respectively. The engine head temperature and water flow rate of Stirling engine were measured by the mounted K-type thermocouple and the water flow sensor, respectively. In addition, electricity output was measured and monitored with an engine control box, along with the Microgen Test Rig Data Viewer. For this test, 203 mm width × 254 mm length Whatman Quartz microfiber filters was inserted between the cyclone and the chimney to collect PM particles during the co-combustion test at a duration of 2 h. The total weight of the collected PM sample was measured by using a micro-scale (high-resolution balance, capacity: 600 g, accuracy: 0.01 g). Then, the emission factor of PM was calculated based on a total weight of PM and the heating value of the poultry litter.

2.2. Materials

The biomass fuel used in this study was broiler litter, which was a mixture of chicken manure and bedding material (sawdust). Samples were collected at a local poultry farm (Bethel Farms, Salisbury, MD, USA) and analyzed in two different forms, as received and dry basis. The proximate and ultimate analyses were conducted by experienced laboratory staff of Mineral Labs, Inc., Salyersville, KY, USA. The composition results from analyses are presented in Table 2. Specific testing methods to analyze the composition of proximate and ultimate analyses were also included. Fixed carbon and oxygen were calculated by subtracting the percentage of other compositions from 100%. Broiler litter was collected from a permanently roofed storage shed and transported to the testing site. Samples were stored in the plastic bags at a room temperature of 23 °C before testing. Samples were pre-sized by using a sizer for an average size of 3 mm while removing bulk samples, dead birds, bones, and stones to prevent clogging and damaging in the fuel feeder.

2.3. Experimental Conditions

Before the combustion test, manual inputs and corresponding outputs of operating conditions, which included the fuel-feeding rates and air flow rates, were correlated. Fuel-feeding rates of poultry litter (4.6–774.0 lb/h) were first characterized across different manual inputs on the speed motor controller of feeder (0–99.9%) within an error margin of 0–5%. Then, the air flow rates of PA and SA were calculated with an estimated uncertainty of about 3% by multiplying the air velocity in the pipe center and pipe diameter. The air velocity was measured under various voltage regulator settings, using the airflow meter (922, Fluke, Everett, WA, USA). Ratios of SA and TA (SA/TA) were computed from the calculated air flow rates. After that, the EA was computed by dividing the total weight of fuel (poultry litter plus natural gas) by air (PA plus SA) before subtracting one. In order to calculate the weights of natural gas, PA, and SA from volumetric flow rate readings, the densities of natural gas and combustion air were assumed to be 0.800 kg/m3 and 1.225 kg/m3, respectively. The MR was then also computed from poultry litter weight and natural gas weight.
At the beginning of each test run, volumetric flow rate of PA (about 10 ft3/min) and volumetric flow rate natural gas (5 ft3/h) were used to ignite the combustion process. Next, natural gas was added to the system until a maximum flow rate of 38 ft3/h reached and the chamber temperature reached values between 595 °C and 620 °C. Feeding rate of poultry litter (4.6 lb/h) was then slowly fed into the chamber. By adjusting the feeding rates of poultry litter and natural gas, the total heat input of fuels was kept at 110,000 Btu/h throughout the test. Working conditions for experiments were as follows: EA in a range of 0.04 and 1.31; SA/TA ratio at 0.22, 0.33, 0.44, 0.56, 0.67, and 0.78; MR at 1.89, 2.29, 2.61, 4.51, and 7.42. When studying the effect of one particular operating condition on system performance, all other parameters were kept constant.

3. Results and Discussion

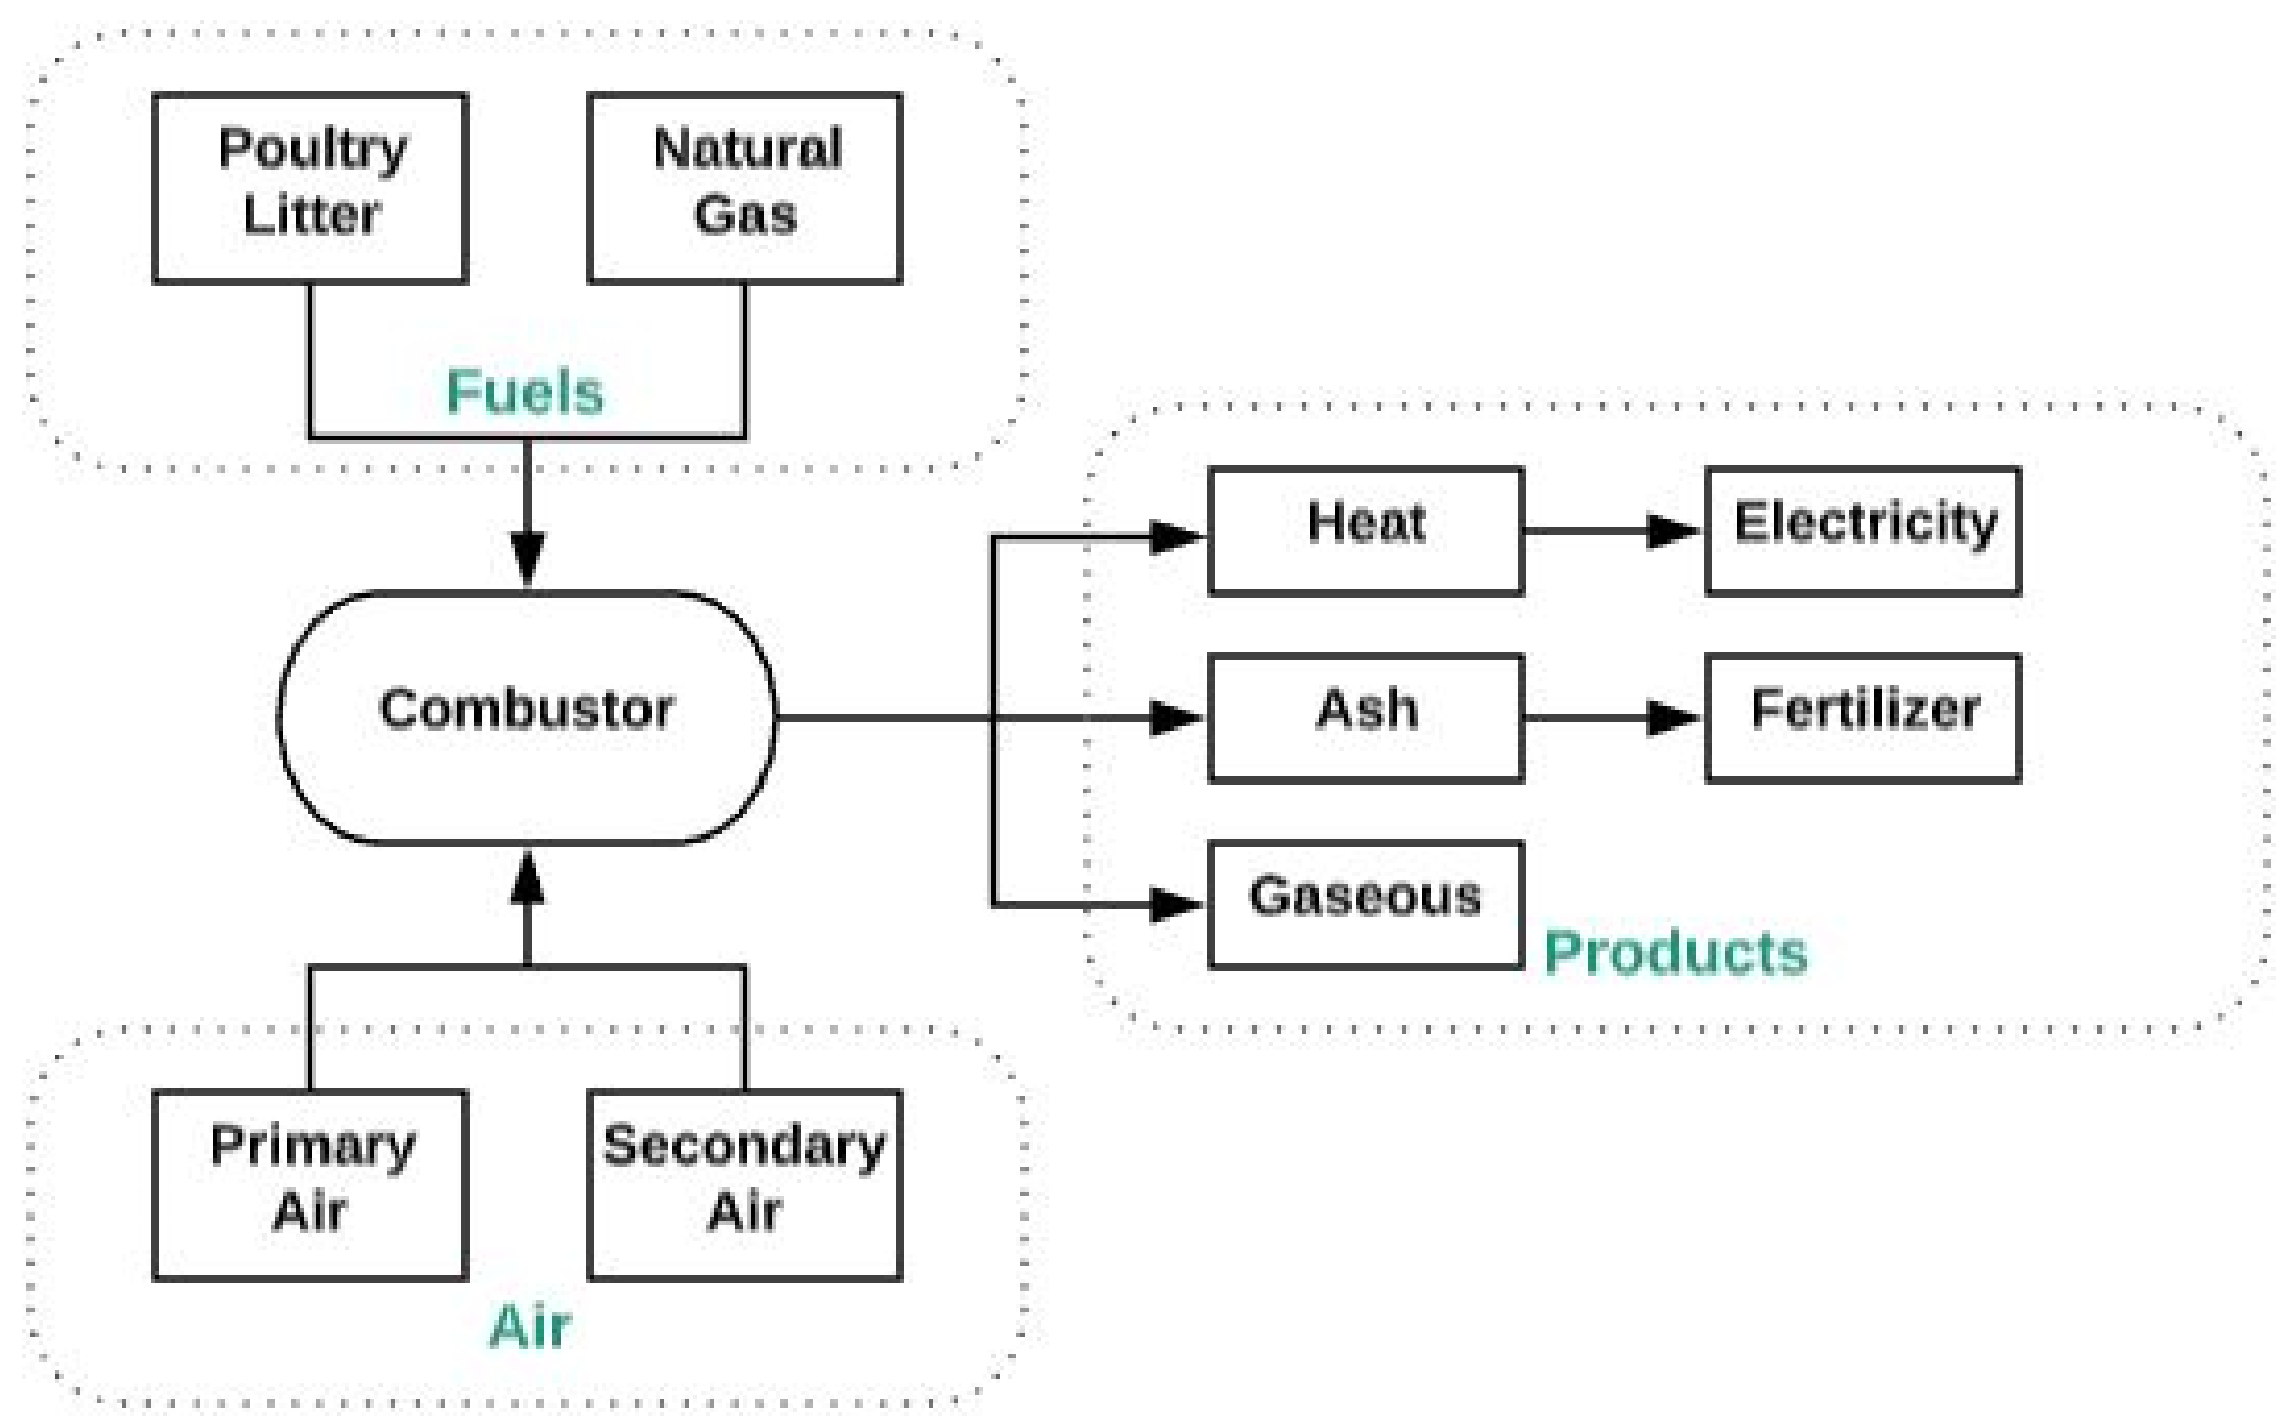
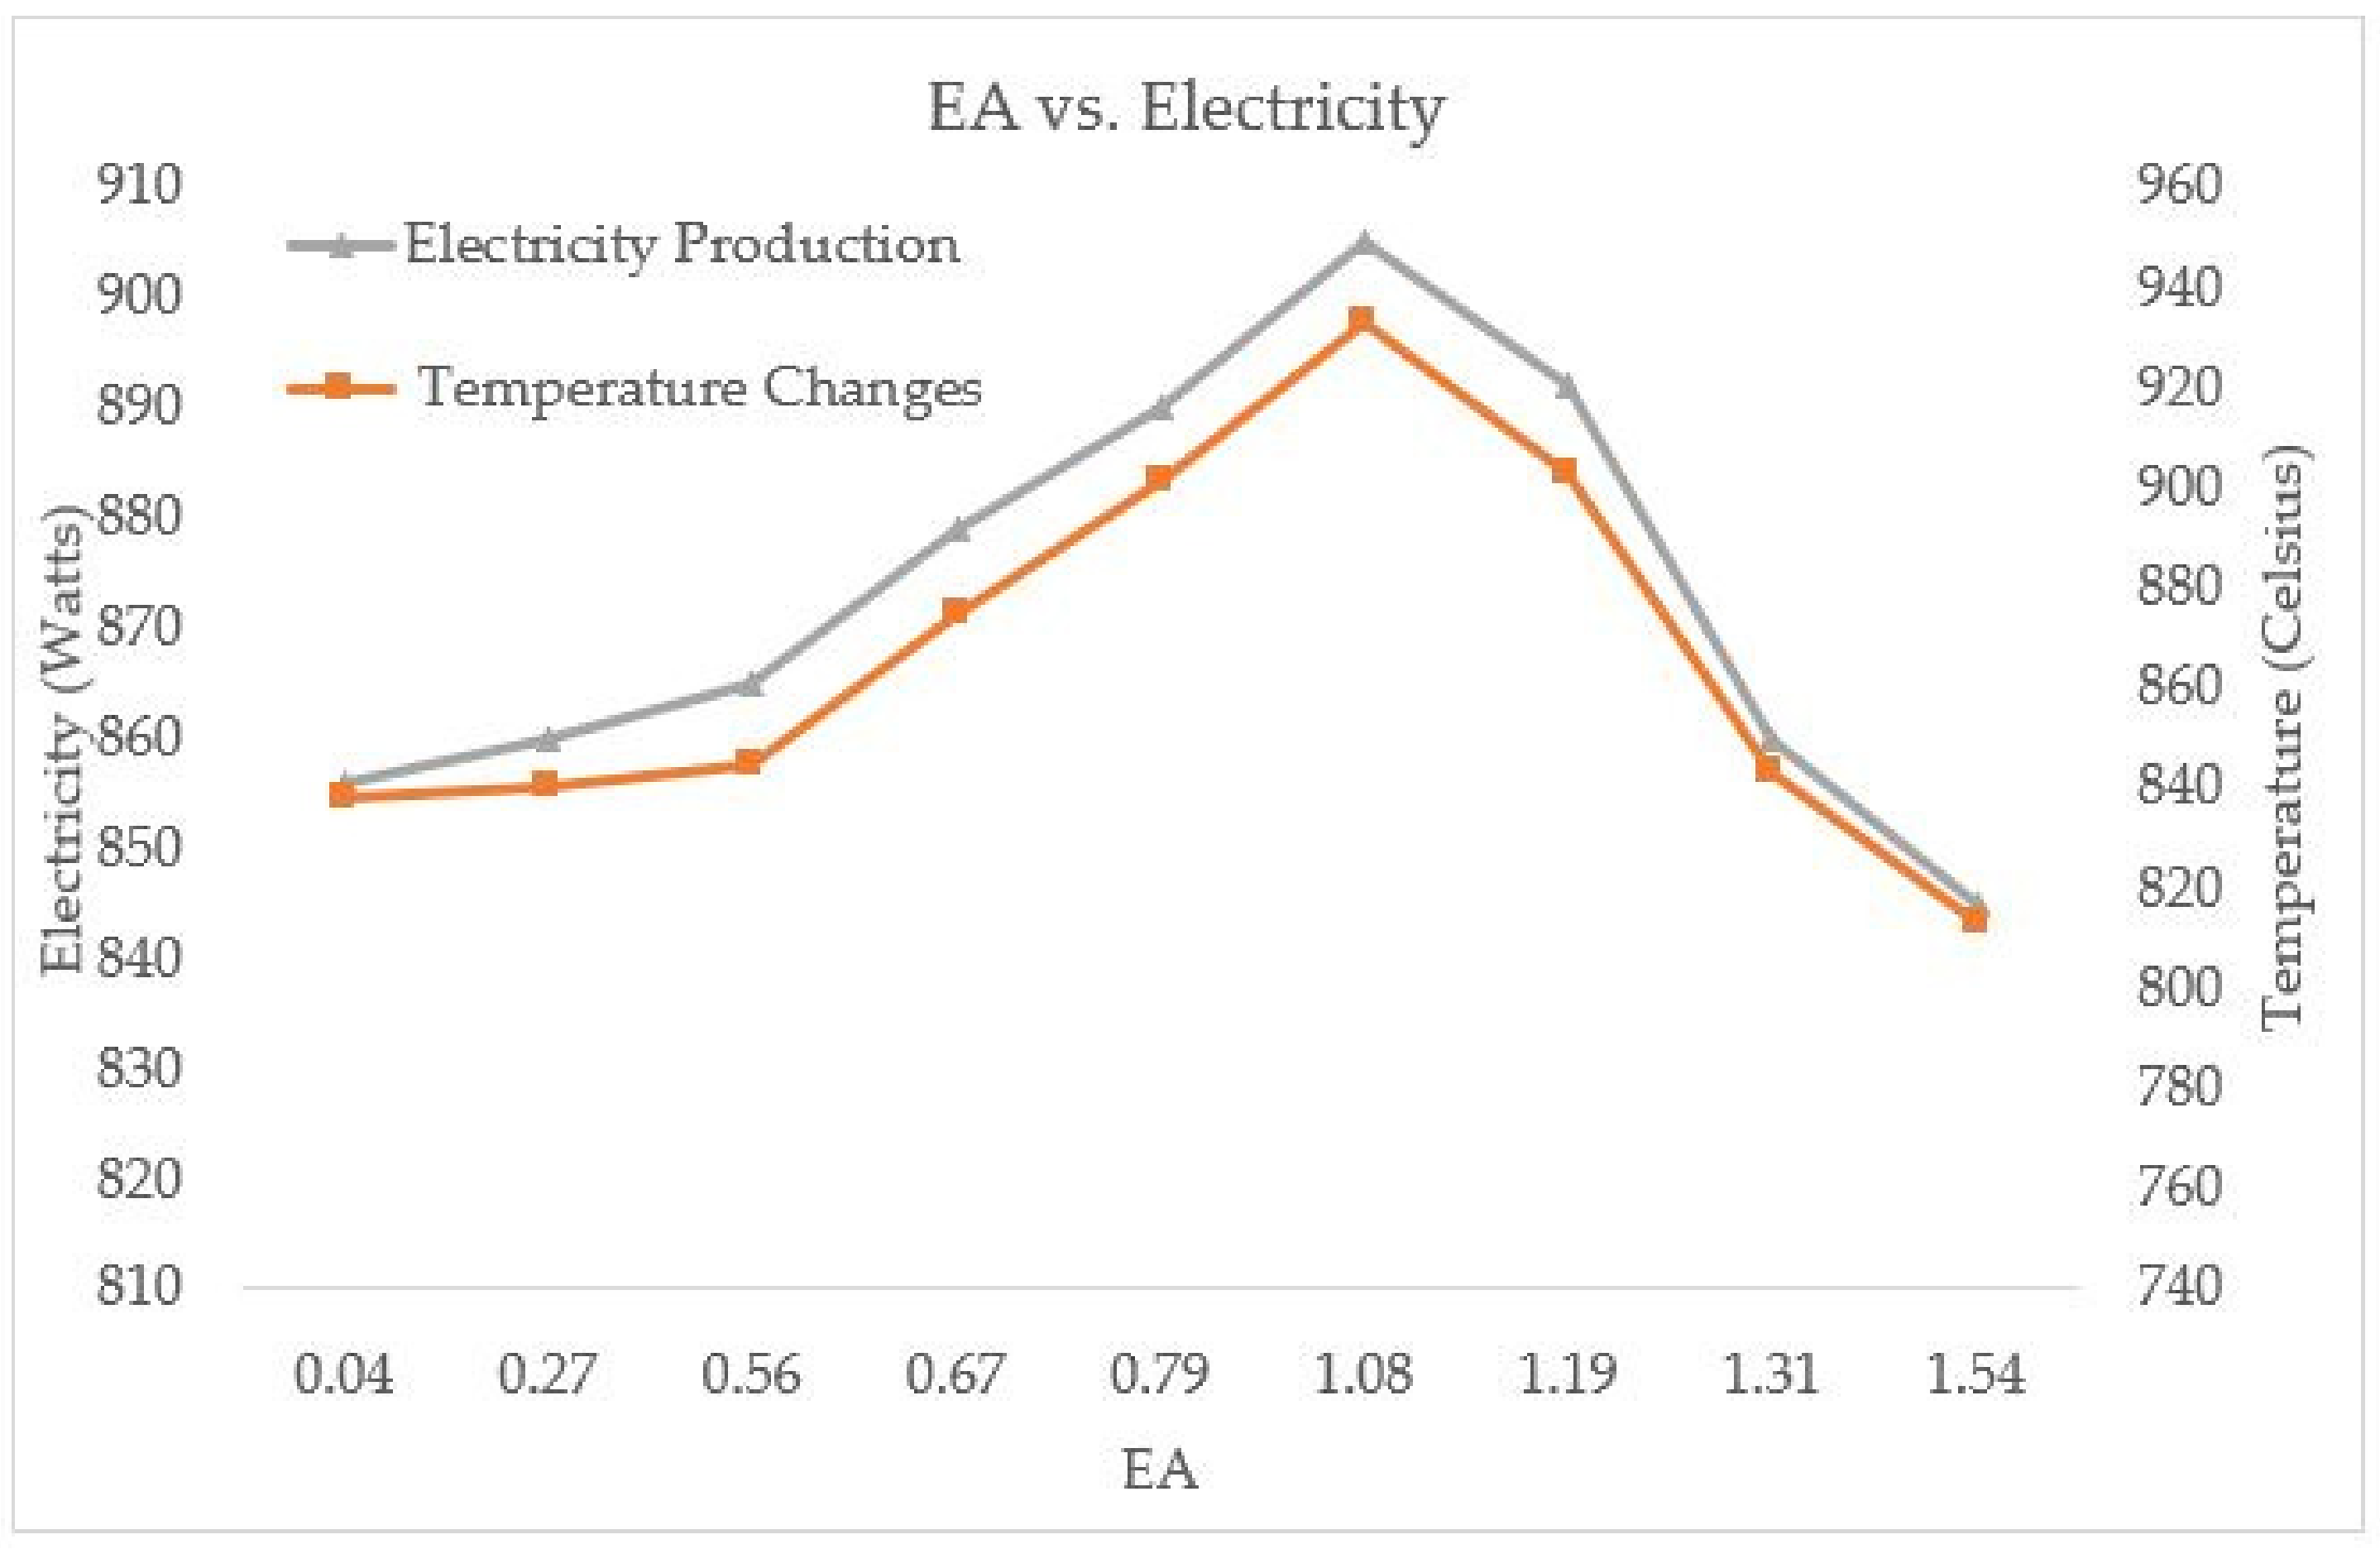
3.1. Poultry Litter as an Energy Resource for Electrcity Production

This study demonstrates that the Stirling engine was successfully installed to convert one of biomass fuels (i.e., poultry litter) into useful energy (i.e., electricity). Electricity outputs of the Stirling engine were determined with the difference between heat absorption from the co-combustion process and heat rejection through the cooling process. The engine head temperatures, also known as the head control temperatures, were an important indicator of the heat absorption during the co-combustion process while water flow rates in the Stirling engine were critical to heat rejection during the cooling process of working fluid. As shown in Figure 3, the electricity outputs were measured at water flow rates of 9.1, 10.4, 13.1, and 19.4 L/min, along with various engine head control temperatures ranging from 220 °C to 584 °C. Experimental results indicated that the electricity output linearly increased with the Stirling engine head control temperature. In fact, the engine head control temperature was directly affected by the surrounding chamber’s temperature and external thermal energy during co-combustion. According to the increased heat input and chamber’s temperature, more work was performed by the power piston to generate higher electricity. When the engine head control temperature was lower than 350 °C, the minimum threshold of electricity output was found at a water flow of 19.5 L/min and confirmed that heat rejection at this flow rate was more than the required cooling on the Stirling engine. However, when the engine head control temperature eclipsed at 400 °C, the minimum threshold of electricity output was found to be at a water flow of 9 L/min and showed that this flow rate was too low for enough engine cooling. These results inferred that neither the high (19.5 L/min) nor the low (9 L/min) water flow rate was enough to provide sufficient cooling and produce optimal electricity outputs during the poultry litter and natural gas co-combustion process. The lab-scale biomass conversion system was found to require a 13.1 L/min water flow rate to effectively cool pressurized helium gas in the Striling engine within the acceptable range of cooling temperature while preventing melting of engine parts and producing relatively high electricity outputs, and thereby improve the overall system performance. At a water flow rate of 13.1 L/min, the electricity output reached a maximum value of 905 W at a Stirling engine head control temperature of 584 °C.
Figure 4 illustrates the results of chamber temperature at a height of 381.0 mm near the Stirling engine and electricity output under various EAs during the poultry litter and natural gas co-combustion process.
It was found that the chamber temperature increased from 838 °C to 933 °C when EA increased from 0.04 to 1.08, while chamber temperature started to decrease and finally dropped to 813 °C by further increasing EA from 1.04 to 1.54. The increasing chamber temperature can be explained by the complete combustion of the poultry litter and natural gas in the system by supplying oxygen in excess of the stoichiometric amount (up to 108%). However, if the EA is above 1.08, it may increase the gas velocity and reduce particle residence time, which reduce the flame and the chamber temperature. Results also indicated that the electricity output was one of the major performance factors for the Stirling engine and that the electricity output has a strong positive relationship with surrounding chamber temperatures. The electricity output had a similar trend to the chamber temperature as it increased from 856 W to 905 W while EA increased from 0.04 to 1.08. However, the electricity output decreased to 845 W when there was a great deal of EA injection. These results indicated that EA is critical to the chamber temperature and electricity production. The optimal EA is suggested to be 1.08 in order to maximize the electricity output during the poultry litter and natural gas co-combustion process in the lab-scale biomass conversion system.

3.2. Effect of Operating Conditions on Emissions

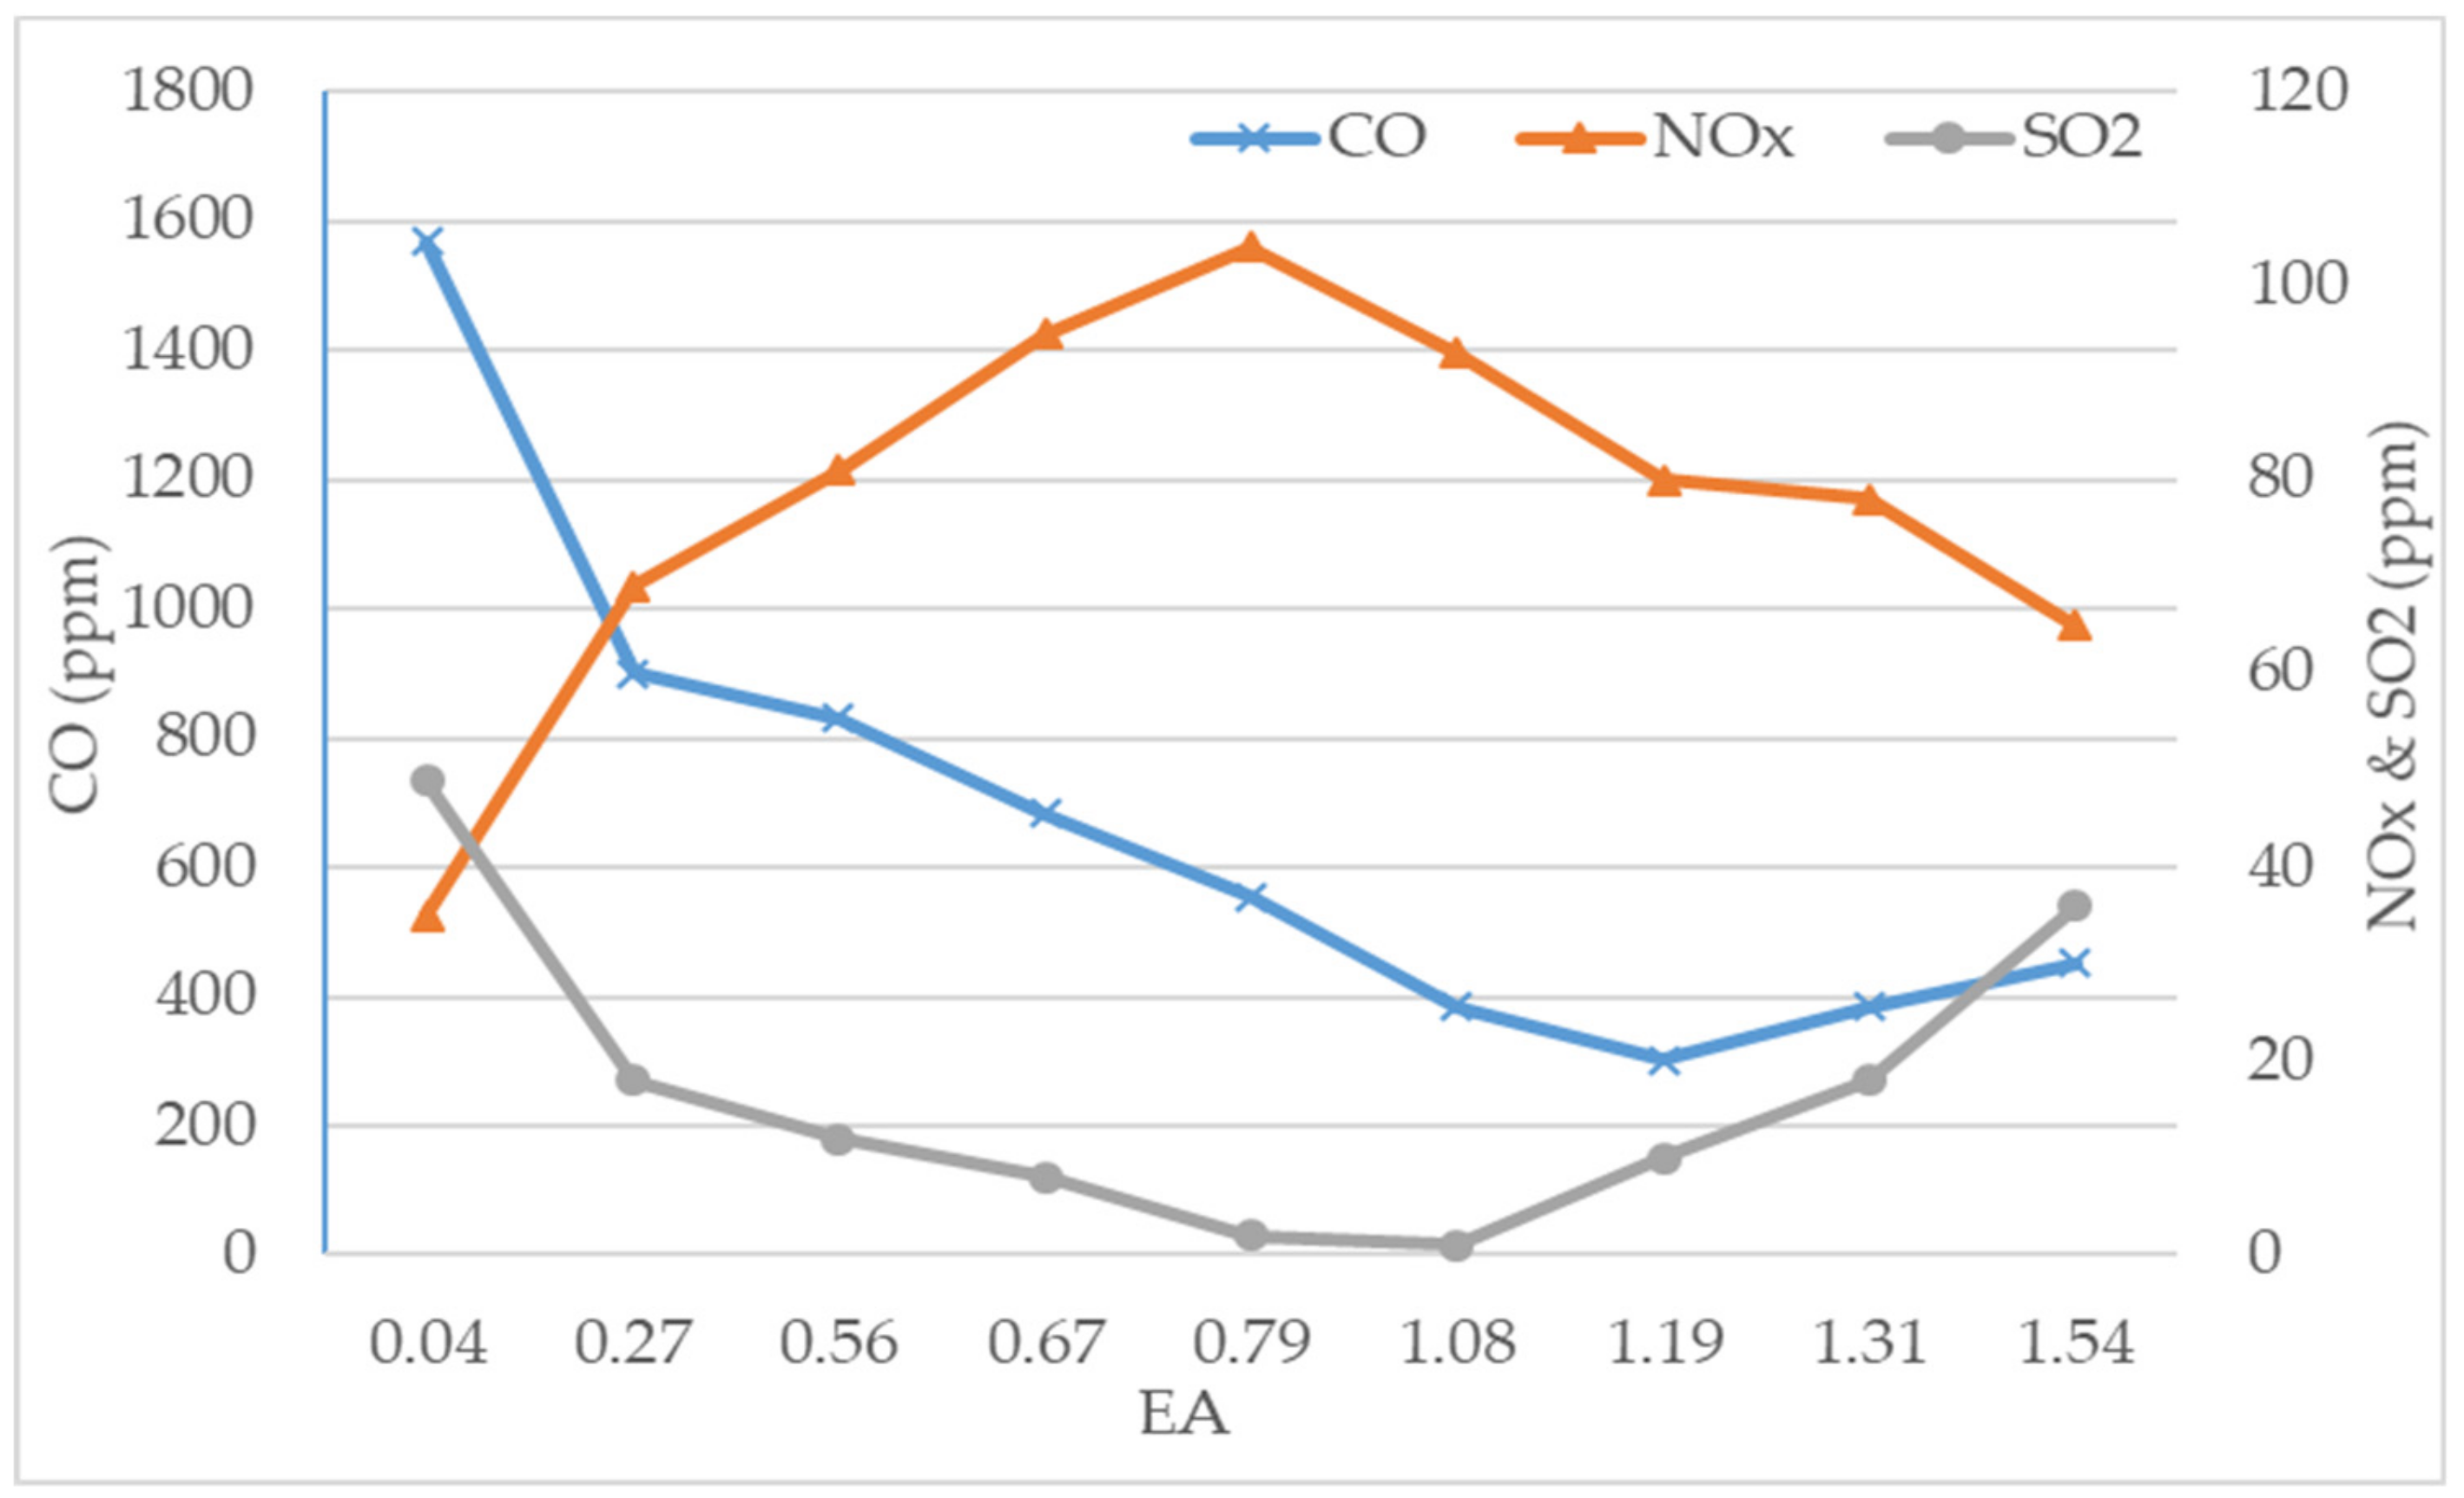
3.2.1. Effect of EA on Emissions

Figure 5 shows the effect of EA ratios on the emissions in the range of EA between 0.04 and 1.54 at an MR of 2.23. Under this condition, the total heating input of 109,754 Btu/h was provided by a poultry litter-feeding rate of 15.6 lb/h and a natural gas-feeding rate of 34 ft3/h. Results indicated that the EA ratio had a marginal effect on SO2 emissions while the EA ratio played a major role in both CO and NOx emissions. A large CO emission reduction from 1539 ppm to 301 ppm occurred when increasing EA from 0.04 to 1.19. Additionally, a slight tendency of CO increment was observed when the EA ratio was greater than 1.19. CO reduction is probably due to the effect of additional oxygen in EA. A higher EA ratio may have provided sufficient oxygen for complete combustion and enhanced the rate of CO oxidation into CO2. However, a great deal of EA may increase the velocity of fluidizing air and reduce particle residence time. This may be due to the fact that CO does not have sufficient time to convert into CO2 [19]. A high amount of EA may also entrain more unburned small particles (i.e., CO) from incomplete combustion into atmosphere. In a previous study, Varol et al. [20] had similar results that CO emissions are increased by the increasing EA ratio above 1.23 because any further increase in EA cools the combustor and causes CO emission to increase.
NOx emissions during the biomass combustion mainly originate from the nitrogenous species (e.g., NH3 and HCN). These compounds are released with the volatiles and the oxidation of nitrogen retained in the char may produce NOx emissions. Since biomass combustion has a relatively lower temperature than fossil fuels combustion, the formation of thermal NO is insignificant [19,21]. In all test runs, the NO2 concentrations at different points during the poultry litter co-combustion in the lab-scale biomass conversion system were negligible, ranging from 0 to 4 ppm. For this reason, NO would be expected to form the majority of NOx emissions and NO was originated from fuel-N during the poultry litter co-combustion. It was found that the emission of NO during the poultry litter co-combustion process increased significantly as the EA ratio increased from 0.04 to 0.79. These results are in accordance with other studies showing that the NO emission increases with the EA ratio [20,22,23,24]. This phenomenon can be explained due to the increasing oxygen concentration as the EA increases, which may increase the chance of converting fuel-N components into NO. This is because the O2 concentration is regarded as a significant factor in NOx formation [25]. In addition, increasing EA results in higher freeboard temperature, which then promotes the release of volatile nitrogen to enhance the conversion of nitrogen radicals into NO. Higher temperature also reduces the char and CO concentrations, which in turn decreases the reduction of NO to N2 on the char surface and increases NOx formation. These observations suggest NO-forming nitrogen was released as nitrogen containing compounds within the volatiles and subsequently oxidized to NO in the gas phase [22]. NOx was started to decrease when EA was greater than 0.79. This is because the greater EA may suspend char-C within the freeboard and react with NO emission (i.e., 2NO + 2C → N2 + 2CO). The NOx emissions were further decreased when the EA was greater than 1.19. Additionally, NO reduction can be explained by the combination effect of decreased freeboard temperature to reduce a small amount of thermal NOx formation, which then increased CO emissions from 301 ppm to 600 ppm. A large amount of CO would be splashed and entrained into the freeboard by increasing the fluidized air and react with NO emission (2NO + 2CO → 2CO2 + N2) [23].
SO2 emissions normally strongly correlate with the sulfur content of the fuel. Previous studies ignored SO2 emissions due to the low sulfur content in the poultry litter samples. In this study, it was found that SO2 emission decreased from 49 ppm to 1 ppm when an EA ratio increased from 0.04 and 1.08. This SO2 reduction was due to an increase in EA which resulted in three reactions. First, a high O2 concentration and an optimal reaction temperature (close to 800 °C) favored CaSO4 formation. Second, an increase in gas-solid contact benefited SO2 retention. Third, high amounts of Ca and Mg contents in poultry litter ash can react with SO2 [6,9,21]. Then, SO2 emission was increased when the EA rose from 1.08 to 1.54. This can be explained by the relatively low temperature (700–750 °C) within the EA range between 0.79 and 1.54, which does not benefit SO2 capture and subsequently increase the concentration of SO2. It was observed that CO and SO2 emissions were decreased with a minor increment of NOx emission within the range of EA between 0.04 and 0.79. On the other hand, the CO and SO2 emissions were starting to slightly increase when the EA was higher than 1.19. Therefore, the EA ratio is suggested to be in the range from 0.79 to 1.08 for minimizing all three major emissions during the poultry litter and natural gas co-combustion process.

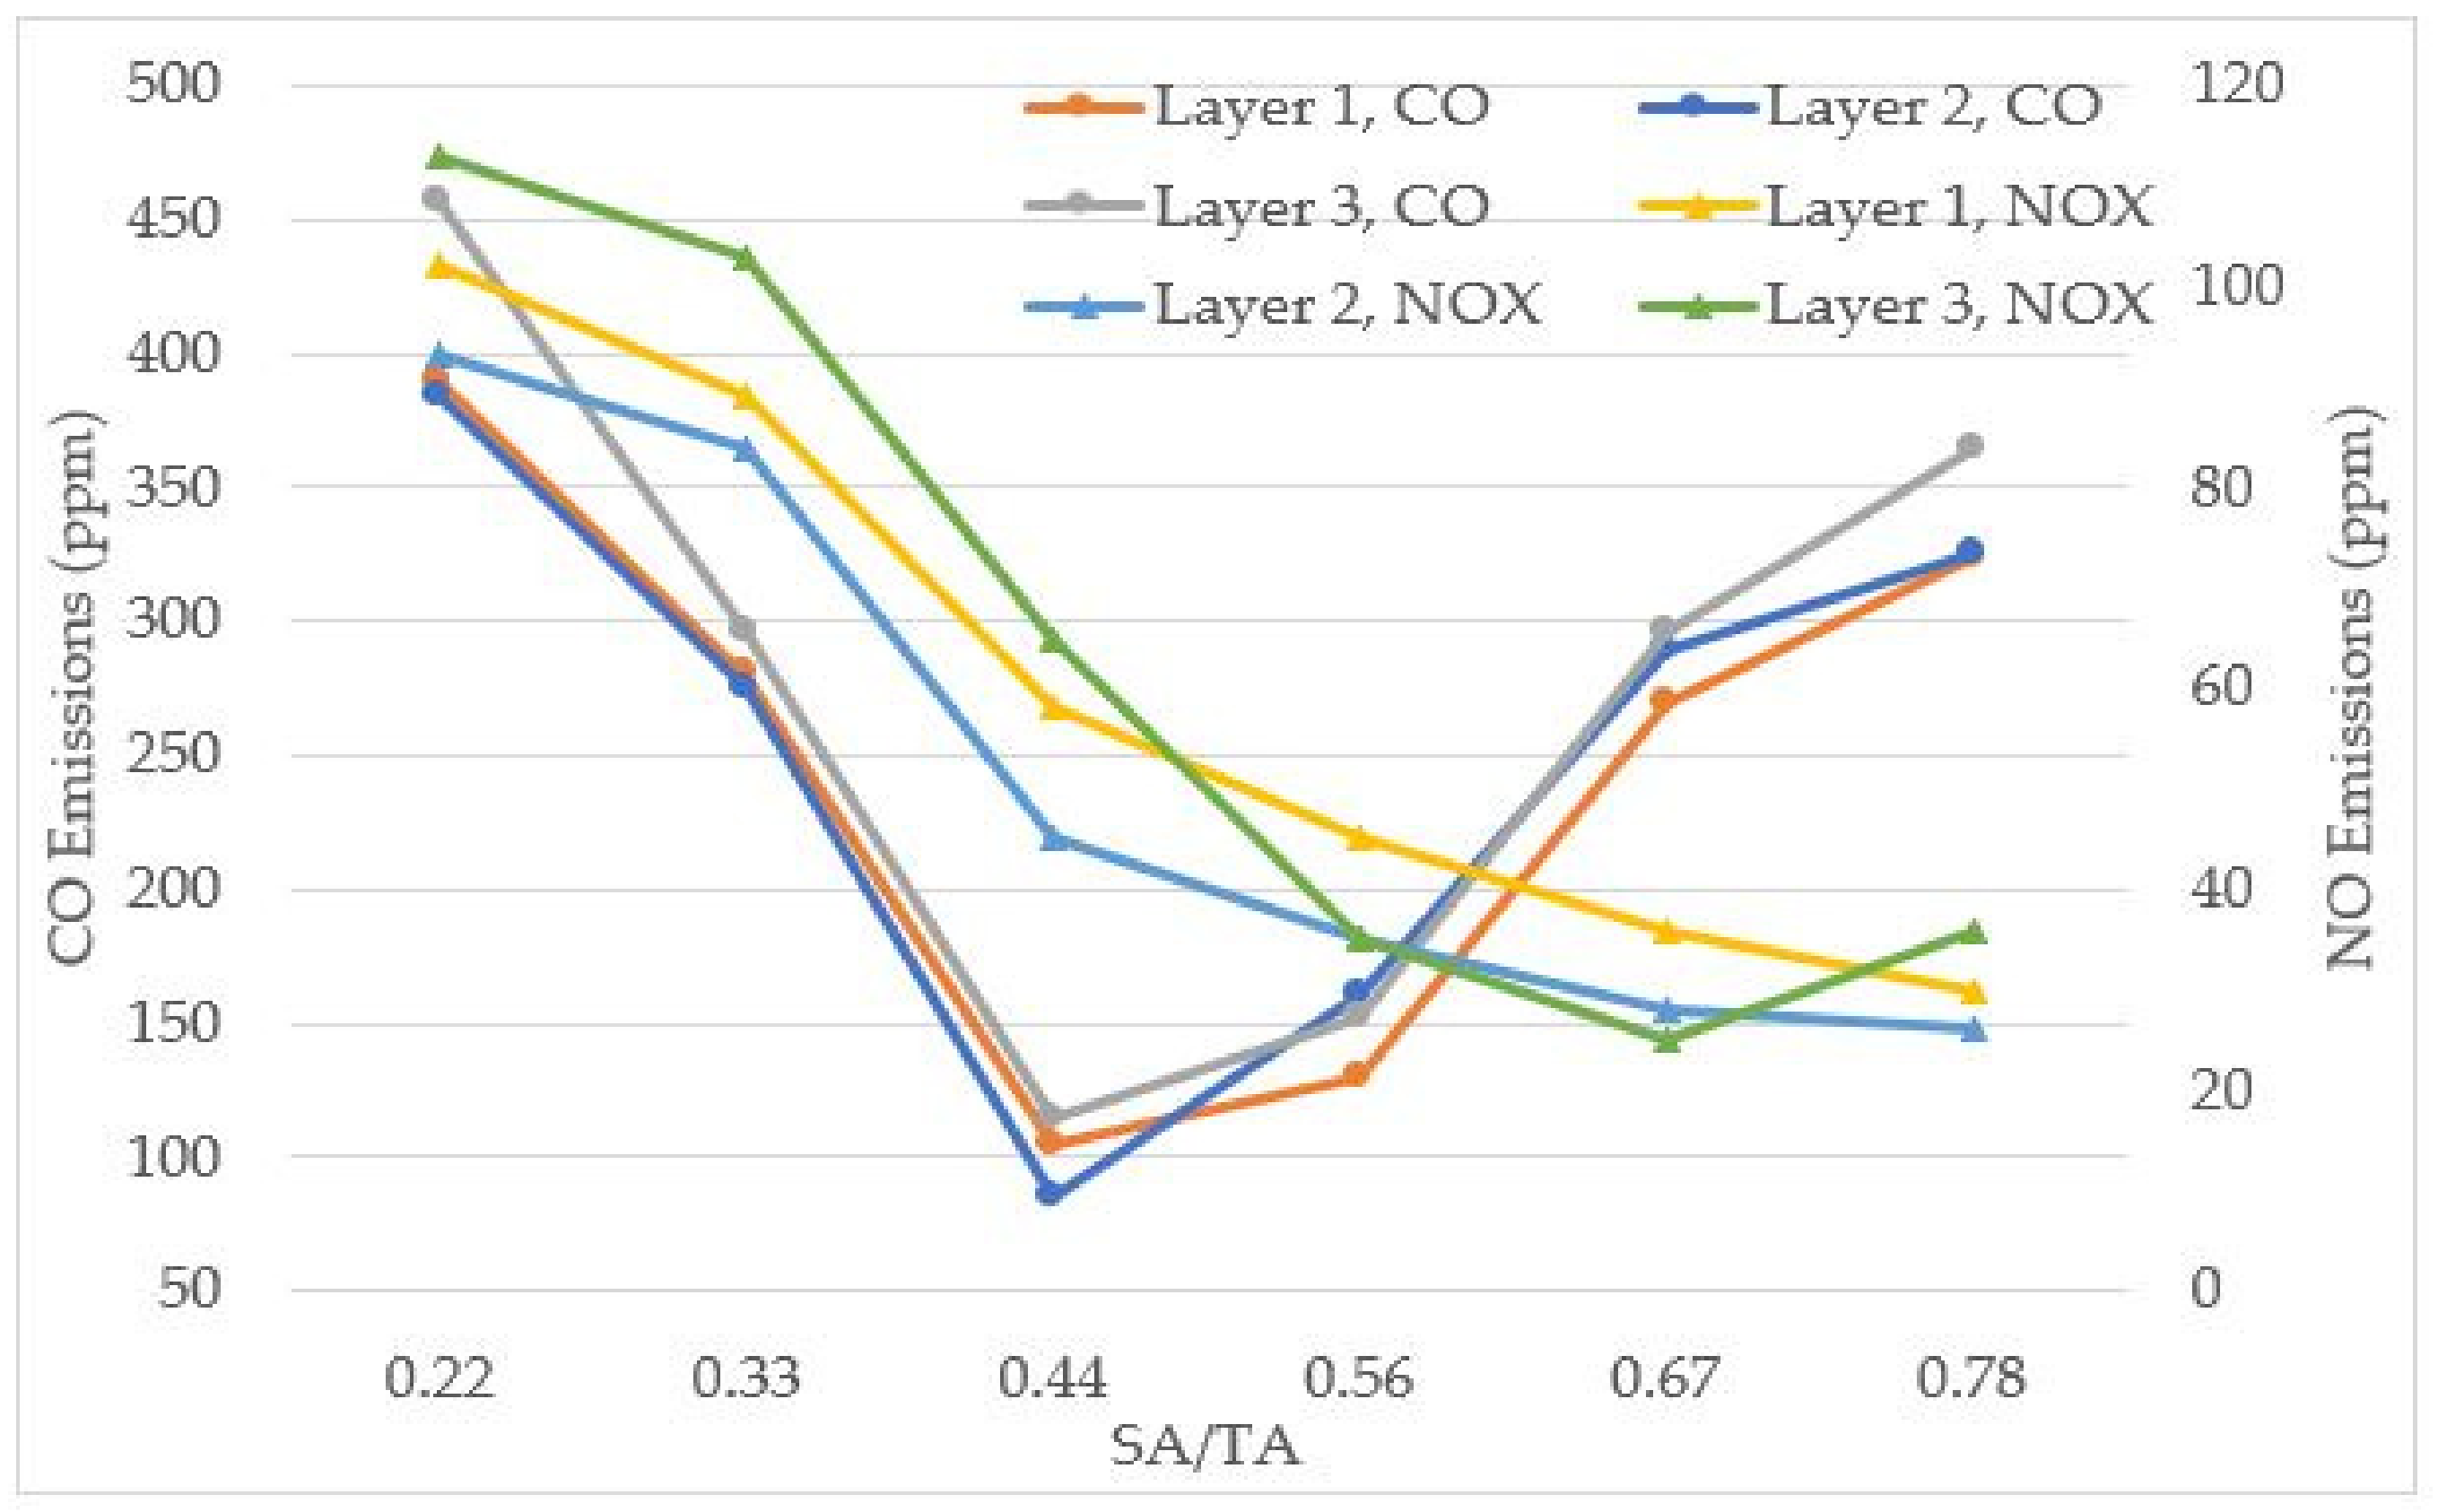
3.2.2. Effects of SA Ratio and SA Height on Emissions

As shown in Figure 6, results showed that NOx emissions decreased by increasing the SA/TA ratio because the bed at lower parts of the combustor formed a reduction zone and the freeboard became an oxidizing zone when the SA was applied as the staged combustion [21]. When the SA was introduced into the combustion combustor, the amount of PA was reduced in the fuel bed, and a more reducing atmosphere dominated in the dense phase. Therefore, with an increasing portion of SA in the freeboard region, NO was more likely to be reduced by species such as CO, CH4, and char in the fuel bed region [21]. In addition, SA injection enabled the adequate mixing of combustion air with combustible gases formed by devolatilization and achieved the complete burnout, which encouraged the formation of N2 rather than NO emissions [26].
Unlike the researches that investigated the staged combustion as primary measures to reduce NOx in solid fuel combustion, some studies found that air staging has a relatively weak role in determining CO emissions. Moreover, the effect of SA on CO emission is still not very clear [22,27,28]. Many authors strongly suggested that SA was mainly responsible for the reduction of CO emissions [23,29]. In this study, a similar phenomenon was noticed that CO emissions decreased with an increase of SA/total air (TA) from 0.22 to 0.44. First, it is plausible that the combustion fraction in the bed zone was smaller than those of the bed surface and freeboard zone due to its lower density and lower amounts of fixed carbon in the poultry litter. Thus, SA was required to be near the freeboard zone to achieve the complete combustion of suspended volatiles. Second, the accumulated poultry litter and its unburned char were carried back to the bed surface, which prolonged the residence time of particles in the chamber and achieved the complete combustion. However, CO emissions became worse with an additional increase in SA/TA ratio from 0.44 to 0.78. This is because significantly high SA ratios may have caused the temperature to decrease at the cyclone outlet while some unburned particles were entrained from the combustion chamber to the cyclone before completing combustion. Therefore, there was an increasing trend of CO emission when the SA/TA ratio was greater than 44%.
In previous studies, it was found that the different SA locations at the freeboard zone [27] and splash zone [28] have an influence on emissions. In this study, the effect of SA injection locations on the CO and NOx were further investigated to identify optimal SA injection location during the poultry litter and natural gas co-combustion process in the lab-scale biomass conversion system. SA was injected into the freeboard region of the lab-scale combustion chamber at heights of 650 mm, 850 mm, and 1100 mm. It was observed that CO and NOx emissions at a height of 850 mm were relatively smaller than at heights of 650 mm and 1100 mm. The SA location was very low (i.e., at 650 mm), resulting in large quantities of CO emission emitted because the lower SA location may have created an extra resistance on the PA coming through the PA distributor plate, which then may affect hydrodynamics of the dense phase. The dense phase also became denser with large particle numbers and increased CO production. On the contrary, results indicated that there was a high chance of removing unburned particles before completing combustion of solid fuels. Thus, there was an increase in CO emissions if the location of SA was very high (i.e. at 1100 mm). The optimal location of SA injection at a height of 850 mm during the poultry litter co-combustion process may reduce CO emission levels by promoting oxygen distribution and swirling effects, and increasing residence time. Nevertheless, the relationship between NOx emission and SA injection height is still not very clear and therefore further investigation is needed.

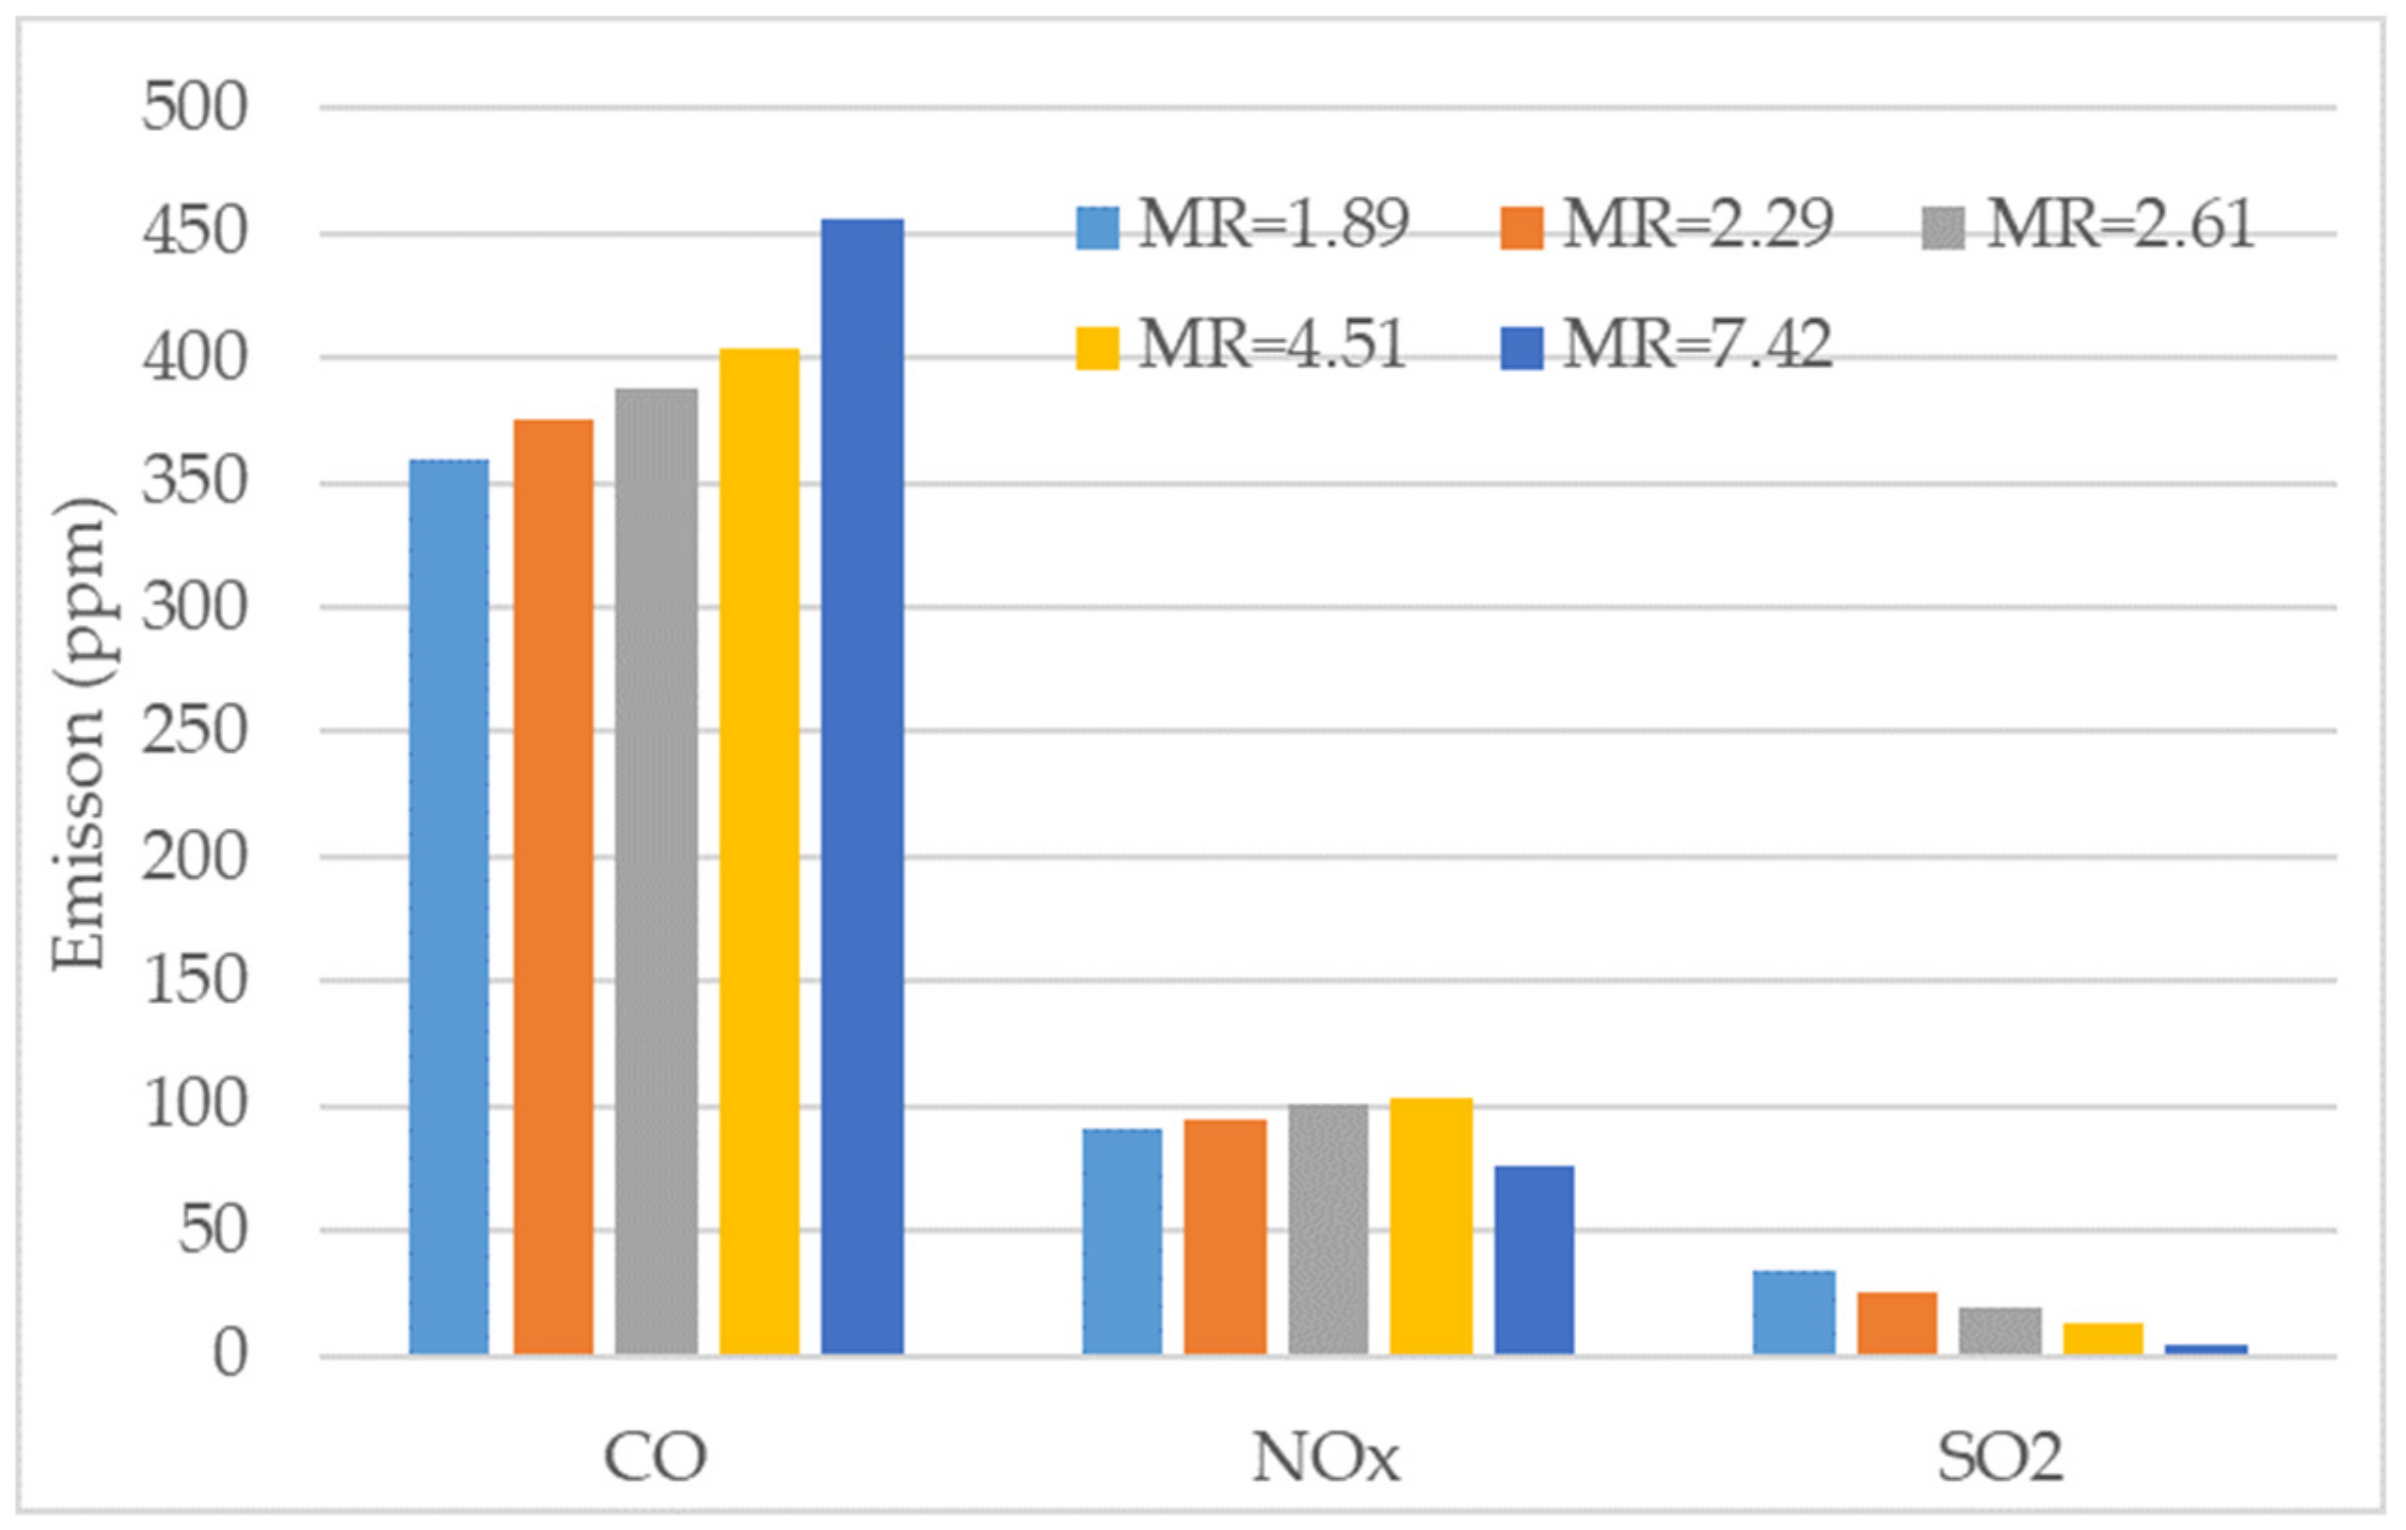
3.2.3. Effect of MR on Emissions

The effect of MR on the pollutant emissions, which included CO, NOx, and SO2, were investigated during the electricity production process in the lab-scale biomass conversion system. In order to ensure similar combustion conditions, the total heating value input of the fuel was maintained constant (110,000 Btu/h) while regulating the poultry litter- and natural gas-feeding rates under the suggested operating conditions—EA = 1.08 and SA = 0.44 at an SA height of 850 mm from the previous two sections (Section 3.2.1 and Section 3.2.2). The poultry litter shares in natural gas mixture were determined to be 1.89, 2.29, 2.61, 4.51, and 7.42 by thermal fractions. As shown in Figure 7, increased poultry litter shares from 1.89 to 7.42 resulted in an increase of the CO concentrations from 360 ppm to 456 ppm in the flue gas. There are three possible reasons that can be invoked as a way to account for this CO increment: (1) high volatile content of poultry litter attributed to the cooling effect and unburned of the upper part of the combustor, (2) higher poultry litter shares at the dense zone, which created a reducing atmosphere with lower temperature, and (3) added moisture from poultry litter, which may have caused convective cooling in the bed region and inhibit conversion of CO into CO2.
It was observed that NO emissions followed an increasing trend from 1.89 to 4.51 while a decreasing trend was observed when the MR was greater than 4.51. The increase in NO, despite a drop in the bed temperature, could be due to a number of reasons. First, as the poultry litter fraction increased, more NH3 would be released and subsequently converted to NO. Second, increased moisture on biomass fuels contributed to more O and OH radicals, which would react with the NH species to form NO [21]. However, further increasing the MR of poultry litter from 4.51 to 7.42 reduced NO emissions. A possible reason for that is the low percentage of poultry litter, where the volatile matter released in the freeboard could not create a strong reducing atmosphere to suppress the NOx formation while it increased the content of organic N fraction in the poultry litter, which is similar to the de-NOx effect of adding NH3 (or urea). Thus, with the increasing poultry litter share up to a certain extent, volatiles (i.e., NH3) evolved from fuel produced an instantaneous fuel-rich condition in the freeboard region, which led to NOx reduction via reactions (4NH3 + 5O2 4NO + 6H2O and 2NO + 4NH3 + 2O2 3N2 + 6H2O) to form N2 instead of NO emission during the co-combustion process. In addition, the large amounts of CO generated in the dense zone at an MR of 4.51 may have acted with NO and therefore inhibited the formation of NOx emissions.
Based on the ultimate analyses results of poultry litter and natural gas, S content of poultry litter was higher than that of natural gas. However, experimental results indicated that SO2 emission was reduced by the addition of poultry litter as a result of poultry litter ash derived from natural desulfurization. Since poultry litter contains considerable amounts of CaO and K2O, it may have taken part in the retention reactions [30]. In addition, poultry litter co-combustion has an optimal temperature (close to 800 °C) for retaining SO2 as CaSO4 [30]. As poultry litter share increases, the chamber temperature gets lower at the bottom of the riser because the poultry litter has a lower heating value than natural gas. As a result, this promoted the retention reaction of SO2 at optimal temperature. Results indicated that SO2 emission decreased from 34 ppm to 5 ppm as MR of poultry litter increased from 1.89 to 7.42.

3.3. PM Emission and Fly Ash Analysis

Several studies showed that the combustion of biomass fuels in small-scale heating appliances is a common source of both gaseous emissions (e.g., CO, CO2, NOx, and SO2) and PM emissions. Results of gaseous emissions from poultry litter and fossil fuel co-combustion were discussed by several studies, but there were few results on the PM emission. Normally, PM can be classified by the following parameter: aerodynamic size, mass concentration, mass size concentration, number concentration, number size distribution, chemical concentration, and emission factor [31]. In this study, an emission factor of PM was calculated from the mass of PM per total heating value of fuel consumed. Under optimal working conditions—gaseous emissions, EA = 1.08, SA/TA = 0.44, SA height = 850 mm, and MR = 2.29, PM samples were collected and measured. Results indicated that emission factors of PM were 0.002 lb/MMBtu, 0.004 lb/MMBtu, and 0.1538 lb/MMBtu for the feeding rates of 15.6 lb/h, 17.2 lb/h, and 21.4 lb/h, respectively. At various feeding rates, all PM results were less than Maryland’s permitting PM thresholds of 0.35 lb/MMBtu during poultry litter and natural co-combustion in the lab-scale biomass conversion process. A combination of optimal operating conditions as a primary measure and the cyclone as a secondary measure played a vital role in reducing PM during the poultry litter and natural gas co-combustion process.
For a sustainable biomass-to-energy strategy, it is essential to close the material fluxes and integrate the biomass ashes within the natural cycles. Combustion of poultry litter on poultry farms for space heating will yield large quantities of ash that must be managed properly. Poultry litter ash (on average 0.1% and 10%) is one of the byproducts from poultry litter combustion. Practically, poultry litter ash has a smaller volume, less pathogens, and a higher nutrient content over untreated poultry litter. The soluble phosphate and potassium may remain in the ash, while the majority nitrogen is removed. Table 3 summarizes the methods for analysis along with concentration levels of major nutrients, including phosphorus, potassium, and nitrogen in the fly ash after the poultry litter co-combustion process. High amounts of phosphate (up to 10%) and potassium (up to 6%) in fly ash confirmed the fact that poultry litter ash can be recycled as a soil conditioner/amendment, with high amounts of phosphate and potassium serving as vital macronutrients. In addition, the ash is odorless, dry, and free of pathogens, making it more suitable than the fresh poultry litter for transport and storage [32].

4. Conclusions

Co-combustion studies of poultry litter and natural gas were performed in the lab-scale biomass conversion system with the Stirling engine to analyze electricity production, gaseous emissions (e.g., CO, NOx, and SO2), fly ash composition, and PM emissions. The effects of operating conditions on the system performance were also investigated, namely EA ratio (0.04–1.54), SA/PA ratio (0.22–0.78), SA heights (650 mm, 850 mm, and 1100 mm), and mixing ratio (1.89, 2.29, 2.61, 4.51, and 7.42). Results indicated that increasing EA ratio from 0.04 to 0.79 may significantly reduce the amounts of CO and SO2 emissions with an increase in NOx production. The further increment of EA ratio above 0.79 caused NOx reduction, but increased CO and SO2 emissions. EA was suggested to be 0.79 to 1.08 for emission reduction and produced 905 W of electricity from the co-combustion of poultry litter and natural gas co-combustion process. An optimal SA/TA ratio was found to be 0.44 and the ideal SA height was 850 mm, in order to minimize the emissions. This is because these conditions promoted oxygen distribution and swirling effects, while increasing residence time. It was found that increasing the content of poultry litter and the MR to 4.51 may have potential to reduce both SO2 and NOx emissions. In addition, collected PM emissions were all below Maryland emissions standards, ranging from 0.002 lb/MMBtu to 0.1538 lb/MMBtu. Moreover, high amounts of phosphate (close to 10%) and potassium (close to 6%) in fly ash confirmed the fact that poultry litter ash can be recycled as a soil amendment. This study showed that the co-combustion of poultry litter and natural gas in the lab-scale biomass conversion system can be used as a cleaner alternative to current practices for converting energy sources (e.g., poultry litter and natural gas) into useful energy (i.e., electricity) while lowering emissions.

Author Contributions

S.L. and X.Q. coordinated projects and received grants from the Abell Foundation. X.Q. reviewed published literature reviews and found the research gaps during the poultry litter co-combustion process. X.Q. and S.L. conceived and designed approach to setting up testing facility and performed the combustion test. X.Q., R.C., Y.Y. and S.L. collected poultry litter samples from a poultry farm. X.Q., S.L., R.C., M.C., O.A., and Y.Y. collected and analyzed experimental results in this study. X.Q. and S.L. wrote the draft manuscript. G.C. and S.L. reviewed this manuscript and provided their constructive comments and suggestions to improve the quality of article.

Funding

This research was funded by the Abell Foundation and the APC was partially funded by the School of Graduate Studies at Morgan State University.

Acknowledgments

The author (Xuejun Qian) would like to acknowledge the Abell Foundation and Office of Technology Transfer at Morgan State University for providing a partial financial support for this study. In addition, authors would like to appreciate kind support of research facilities from the Microgen Engine Corporation and Center for Advanced Energy Systems and Environmental Control Technologies (CAESECT).

Conflicts of Interest

The authors declare no conflicts of interest.

References

  1. Lynch, D.; Henihan, A.M.; Bowen, B.; Lynch, D.; McDonnell, K.; Kwapinski, W.; Leahy, J.J. Utilisation of poultry litter as an energy feedstock. Biomass Bioenergy 2013, 49, 197–204. [Google Scholar] [CrossRef] [Green Version]
  2. Qian, X.; Lee, S.; Soto, A.-M.; Chen, G. Regression model to predict the higher heating value of poultry waste from proximate analysis. Resources 2018, 7, 39. [Google Scholar] [CrossRef]
  3. United States Department of Agriculture (USDA). National Agricultural Statistics Service Poultry Statistics Fact Sheet, Poultry Production Data. Available online: https://www.usda.gov/sites/default/files/documents/nass-poultry-stats-factsheet.pdf (accessed on 19 August 2019).
  4. Chastain, J.P.; Coloma-del Valle, A.; Moore, K.P. Using broiler litter as an energy source: Energy content and ash composition. Appl. Eng. Agric. 2012, 28, 513–522. [Google Scholar] [CrossRef]
  5. Dalólio, F.S.; da Silva, J.N.; de Oliveira, A.C.C.; Tinôco, I.D.F.F.; Barbosa, R.C.; de Oliveira Resende, M.; Albino, L.F.T.; Coelho, S.T. Poultry litter as biomass energy: A review and future perspectives. Renew. Sustain. Energy Rev. 2017, 76, 941–949. [Google Scholar] [CrossRef]
  6. Li, S.; Wu, A.; Deng, S.; Pan, W.P. Effect of co-combustion of chicken litter and coal on emissions in a laboratory-scale fluidized bed combustor. Fuel Process. Technol. 2008, 89, 7–12. [Google Scholar] [CrossRef]
  7. Kelleher, B.P.; Leahy, J.J.; Henihan, A.M.; O’dwyer, T.F.; Sutton, D.; Leahy, M.J. Advances in poultry litter disposal technology–a review. Bioresour. Technol. 2002, 83, 27–36. [Google Scholar] [CrossRef]
  8. Perera, P.; Bandara, W. Potential of Using Poultry Litter as a Feedstock for Energy Production; Louisiana Forest Product Development Center: Baton Rouge, LA, USA, 2010. [Google Scholar]
  9. Abelha, P.; Gulyurtlu, I.; Boavida, D.; Barros, J.S.; Cabrita, I.; Leahy, J.; Kelleher, B.; Leahy, M. Combustion of poultry litter in a fluidised bed combustor. Fuel 2003, 82, 687–692. [Google Scholar] [CrossRef]
  10. Manure-to-Energy Poultry Plant Celebrated in Maryland. Available online: https://www.farmprogress.com/manure/manure-energy-poultry-plant-celebrated-maryland (accessed on 19 August 2019).
  11. The Case for Built-Up Litter in US Broiler Complexes. Available online: https://poultryhealthtoday.com/case-built-litter-us-broiler-complexes/ (accessed on 19 August 2019).
  12. Zhang, X.; Myhrvold, N.P.; Caldeira, K. Key factors for assessing climate benefits of natural gas versus coal electricity generation. Environ. Res. Lett. 2014, 9, 114022. [Google Scholar] [CrossRef] [Green Version]
  13. Liang, F.Y.; Ryvak, M.; Sayeed, S.; Zhao, N. The role of natural gas as a primary fuel in the near future, including comparisons of acquisition, transmission and waste handling costs of as with competitive alternatives. Chem. Cent. J. 2012, 6, S4. [Google Scholar] [CrossRef]
  14. Zhu, S.; Lee, S.W. Co-combustion performance of poultry wastes and natural gas in the advanced Swirling Fluidized Bed Combustor (SFBC). Waste Manag. 2005, 25, 511–518. [Google Scholar] [CrossRef]
  15. Zhu, S.; Lee, S.; Hargrove, S.K.; Chen, G. Prediction of combustion efficiency of chicken litter using an artificial neural network approach. Fuel 2007, 86, 877–886. [Google Scholar] [CrossRef]
  16. Henihan, A.M.; Leahy, M.J.; Leahy, J.J.; Cummins, E.; Kelleher, B.P. Emissions modeling of fluidised bed co-combustion of poultry litter and peat. Bioresour. Technol. 2003, 87, 289–294. [Google Scholar] [CrossRef] [Green Version]
  17. Jia, L.; Anthony, E.J. Combustion of poultry-derived fuel in a coal-fired pilot-scale circulating fluidized bed combustor. Fuel Process. Technol. 2011, 92, 2138–2144. [Google Scholar] [CrossRef]
  18. Topal, H.; Amirabedin, E. Determination of some important emissions of poultry waste co-combustion. Sci. J. Riga Tech. Univ. Environ. Clim. Technol. 2012, 8, 12–17. [Google Scholar] [CrossRef] [Green Version]
  19. Armesto, L.; Bahillo, A.; Veijonen, K.; Cabanillas, A.; Otero, J. Combustion behaviour of rice husk in a bubbling fluidised bed. Biomass Bioenerg. 2002, 23, 171–179. [Google Scholar] [CrossRef]
  20. Varol, M.; Atimtay, A.T.; Olgun, H.; Atakül, H. Emission characteristics of co-combustion of a low calorie and high sulfur–lignite coal and woodchips in a circulating fluidized bed combustor: Part 1. Effect of excess air ratio. Fuel 2014, 117, 792–800. [Google Scholar] [CrossRef]
  21. Suksankraisorn, K.; Patumsawad, S.; Vallikul, P.; Fungtammasan, B.; Accary, A. Co-combustion of municipal solid waste and Thai lignite in a fluidized bed. Energ. Convers. Manag. 2004, 45, 947–962. [Google Scholar] [CrossRef]
  22. Chyang, C.S.; Wu, K.T.; Lin, C.S. Emission of nitrogen oxides in a vortexing fluidized bed combustor. Fuel 2007, 86, 234–243. [Google Scholar] [CrossRef]
  23. Duan, F.; Chyang, C.; Chin, Y.; Tso, J. Pollutant emission characteristics of rice husk combustion in a vortexing fluidized bed incinerator. J. Environ. Sci. 2013, 25, 335–339. [Google Scholar] [CrossRef]
  24. Eiamsa-Ard, S.; Kaewkohkiat, Y.; Thianpong, C.; Promvonge, P. Combustion behavior in a dual-staging vortex rice husk combustor with snail entry. Inter. Commun. Heat Mass 2008, 35, 1134–1140. [Google Scholar] [CrossRef]
  25. Madhiyanon, T.; Sathitruangsak, P.; Soponronnarit, S. Combustion characteristics of rice-husk in a short-combustion-chamber fluidized-bed combustor (SFBC). Appl. Eng. 2010, 30, 347–353. [Google Scholar] [CrossRef]
  26. Nussbaumer, T. Combustion and co-combustion of biomass: Fundamentals, technologies, and primary measures for emission reduction. Energ. Fuels 2003, 17, 1510–1521. [Google Scholar] [CrossRef]
  27. Fang, M.; Yang, L.; Chen, G.; Shi, Z.; Luo, Z.; Cen, K. Experimental study on rice husk combustion in a circulating fluidized bed. Fuel Process. Technol. 2004, 85, 1273–1282. [Google Scholar] [CrossRef]
  28. Kuprianov, V.I.; Kaewklum, R.; Chakritthakul, S. Effects of operating conditions and fuel properties on emission performance and combustion efficiency of a swirling fluidized-bed combustor fired with a biomass fuel. Energy 2011, 36, 2038–2048. [Google Scholar] [CrossRef]
  29. Piao, G.; Aono, S.; Kondoh, M.; Yamazaki, R.; Mori, S. Combustion test of refuse derived fuel in a fluidized bed. Waste Manag. 2000, 20, 443–447. [Google Scholar] [CrossRef]
  30. Sun, P.; Hui, S.E.; Gao, Z.; Zhou, Q.; Tan, H.; Zhao, Q.; Xu, T. Experimental investigation on the combustion and heat transfer characteristics of wide size biomass co-firing in 0.2 MW circulating fluidized bed. Appl. Eng. 2013, 52, 284–292. [Google Scholar] [CrossRef]
  31. Simões Amaral, S.; Andrade de Carvalho, J.; Martins Costa, M.; Pinheiro, C. Particulate matter emission factors for biomass combustion. Atmosphere 2016, 7, 141. [Google Scholar] [CrossRef]
  32. Billen, G.; Lassaletta, L.; Garnier, J. A vast range of opportunities for feeding the world in 2050: Trade-off between diet, N contamination and international trade. Environ. Res. Lett. 2015, 10, 025001. [Google Scholar] [CrossRef]
Figure 1. Schematics of the biomass conversion system and instrumentations.
Applsci 09 04116 g001
Figure 2. Flow chart of the poultry litter co-combustion process.
Applsci 09 04116 g002
Figure 3. Power outputs at various head temperatures and water flow rates.
Applsci 09 04116 g003
Figure 4. Effects of EA ratio on electricity outputs and chamber temperatures.
Applsci 09 04116 g004
Figure 5. Effect of EA ratio on CO, NOx, and SO2 emissions
Applsci 09 04116 g005
Figure 6. Effect of SA/total air (TA) ratios on gaseous emissions.
Applsci 09 04116 g006
Figure 7. Effect of mixing ratio (MR) on CO, NOx, and SO2 emissions.
Applsci 09 04116 g007
Table 1. Summary of co-combustion studies of poultry litter and coal.
Fuel TypesMajor FindingsRef.
Chicken litter + coalIncreasing of chicken litter mass fraction reduces SO2, but increases CO.[6]
Poultry litter + peatSecondary air (SA) in two stages reduces nitrogen oxide (NOx) (about 160–220 ppm) in freeboard and also reduces CO emission (about 1450–5820 ppm).[9]
Chicken litter + peatConcentrations (e.g., CO & volatile organic compound) decreased with the primary air (PA)/SA ratio is 0.4. SA decreases N to NOx from 30% to 15%.[16]
Poultry-derived fuel (PDF) + coalCo-combustion emitted about 20% higher NOx (in a range of 265–280 ppm) than 100% coal.[17]
Poultry wastes + coalExcess air (EA) had a remarkable effect on CO & CH4. SA reduces CO emissions, but NOx formation is still not very clear.[18]
Table 2. Proximate and ultimate analysis of poultry litter samples.
Fuel ComponentsAs Received (wt %)Dry Basis (wt %)
Proximate analysis (analysis method)
Moisture (D3302/D3173)21.20-
Volatile matter (D3175)50.4063.96
Fixed carbon (difference, calculated)9.4411.98
Ash (D3174)18.9624.06
Ultimate analysis (analysis method)
Carbon (C)26.8834.11
Hydrogen (H)4.445.64
Oxygen (O) (difference, calculated)24.2030.71
Nitrogen (N)3.284.16
Sulfur (S)1.041.32
Heating value (Btu/lb) (D5865/5864)4856 (11.30 MJ/kg)6163 (14.34 MJ/kg)
Table 3. Summary of fly ash composition analysis.
ParametersAs Received (Raw) Basis (%)Dry Basis (%)Method Reference
Available phosphate (P2O5)8.89.0AOAC 993.31
Total phosphate (P2O5)9.779.98AOAC 965.09/ICP
Soluble potash (K2O)4.54.6AOAC 969.04
Total potash (K2O)5.585.70AOAC 965.09/ICP
Total nitrogen22Combustion

