Article

Research on Polarization and Phase Fading Compensation in Michelson Interferometer Based on 3 × 3 Coupler and Novel Probe with Built-in Faraday Rotator

School of Physics, University of Electronic Science and Technology of China, Chengdu, Sichuan 611731, China
*
Author to whom correspondence should be addressed.
Submission received: 18 September 2019 / Accepted: 26 September 2019 / Published: 5 October 2019
(This article belongs to the Collection Optical Design and Engineering)

Abstract

:
A self-designed probe and a feedback control scheme based on the Michelson interferometer with a 3 × 3 fiber coupler are proposed. A 45° Faraday rotator is built into the self-designed probe, and a feedback control scheme is used to judge the direction of increase or decrease for the phase compensation, so as to solve the problems of polarization and phase fading. In addition, a result-normalized method is applied in a micro-vibration measurement experiment. The experimental interferometer system achieves a high frequency of 1 MHz micro-vibration. The normalized results keep stable with a maximum deviation from the mean of 1.9% when the power of light reflected back into the self-designed probe is altered. Applied research is carried out by detecting the displacement due to a photoacoustic wave. Therefore, the experimental interferometer system is available for the practical application of micro-displacement measurements, noncontact high-frequency detection, and point-by-point image scanning in biological tissue.

1. Introduction

Fiber interferometry has great application potential in the field of optical fiber sensing due to advantages such as its small size, light weight, anti-electromagnetic interference, high sensitivity, and low cost. It can accurately measure physical parameters such as pressure [1], strain [2], temperature [3,4], displacement [5,6], amongst others. Fiber interferometry is widely used to monitor the health of large steel structures [7], underwater acoustic detection [8], biomedical imaging [9,10], etc. There are polarization and phase fading problems in most fiber interferometers, and many methods have been proposed to solve these problems. Previously, polarization-maintaining fiber and polarization controllers [11] were used to avoid polarization fading. This solution often makes the resulting fiber-optic system too expensive for practical use. Martinelli used a Faraday rotation mirror (FRM) as the reflector in the arms of a Michelson interferometer [12]. Zhang et al. designed an optic current sensor based on a Faraday mirror and studied the birefringence [13]. Zhang et al. reported a phase-stepping method based on direct current phase tracking to stabilize the phase [14]. An active feedback regulation based on the proportional–integral–derivative algorithm was applied in a Michelson interferometer [15]. Lu et al. studied a homodyne interferometer with zero-crossing triggering to avoid phase fading [16]. Although these methods are effective, polarization and phase fading problems are not considered at the same time. The active and passive phase stabilization for the fiber Michelson interferometer with FRM was studied by Elezov et al. [17]. However, its sensing part is limited to the fiber itself, which is not suitable for noncontact and high-frequency detection.
In this paper, we report a novel self-designed probe with a built-in Faraday rotator that is connected to one arm of a Michelson interferometer, with an FRM in another arm. The result shows that polarization fading is well controlled. Meanwhile, the sensing light is focused on the surface of the object under detection, which can realize high-frequency noncontact detection. A feedback control scheme based on a 3 × 3 fiber coupler is proposed, resolving the phase difference uncertainty problem. The performance detection result with the proposed normalization shows that the interferometry system can detect high-frequency- and micro-vibrations. Photoacoustic technology has unique advantages in biological imaging [18,19]. The proposed experimental system detects the photoacoustic wave with a non-contact style, which is of great potential for point-by-point imaging scanning in nondestructive inspections.

2. Materials and Methods

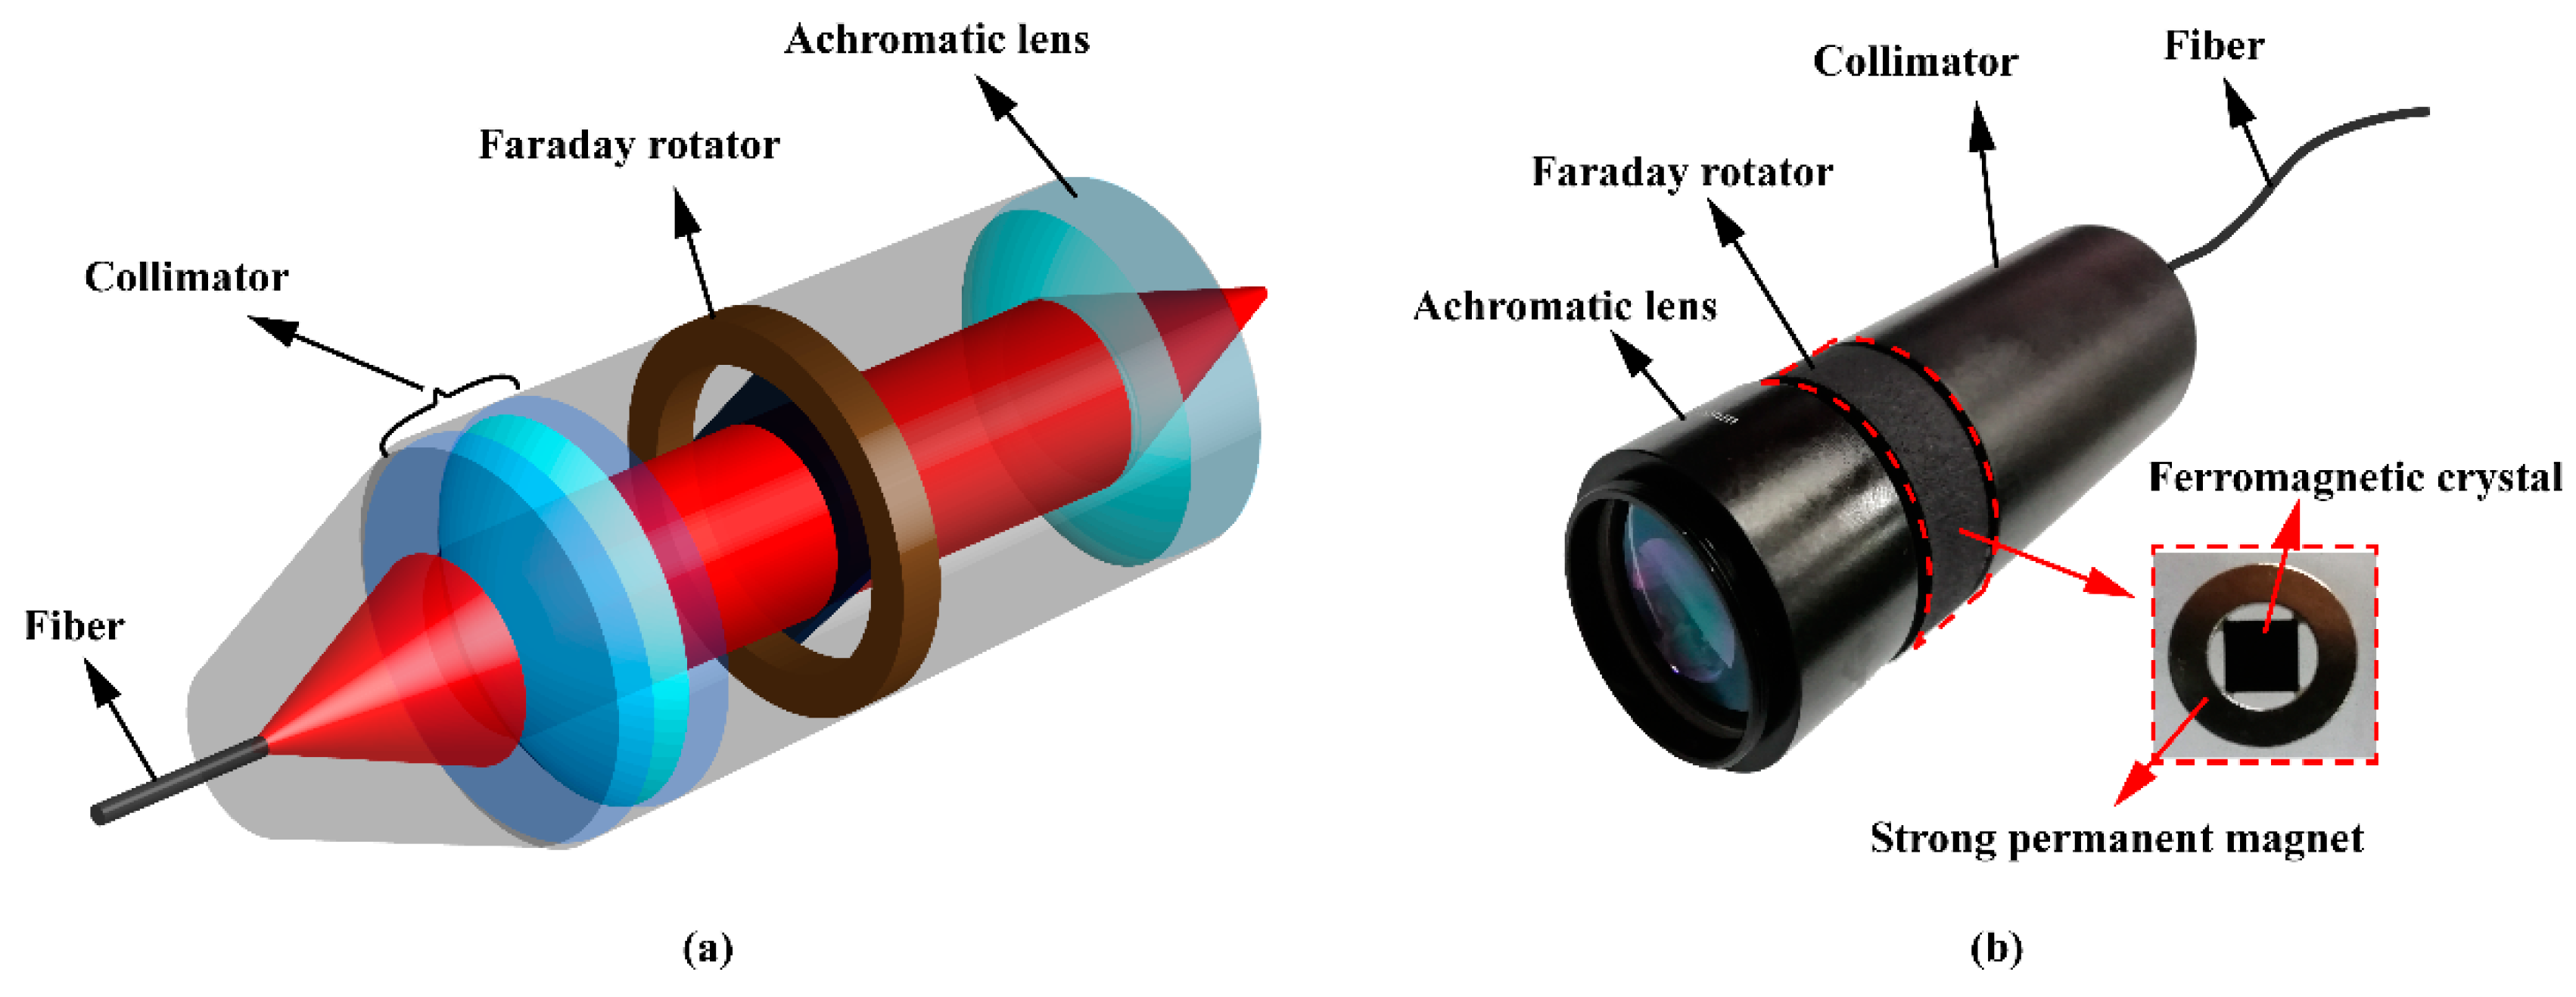
2.1. Depolarization Fading System Model Based on Probe with Built-in Faraday Rotator

The depolarization fading system model based on a novel probe with a built-in Faraday rotator, which is a Michelson interferometer, is shown in Figure 1. As the optical source of the fiber interferometer, a narrow linewidth tunable continuous wave laser (HP 8168F) with a linewidth of less than 100 kHz is used. The wavelength of the laser is tuned to 1550 nm, which is the low-loss working window of single mode fiber (SMF-28e) used in the system. The laser launches the light into a fiber circulator, and the second port of the circulator is connected to a 3 × 3 fiber coupler with equal splitting ratios. The 3 × 3 fiber coupler has a symmetrical structure with a 2 π / 3 phase difference between the outputs. Two output ends of the 3 × 3 fiber coupler are used to connect a single mode fiber at two of the interferometer arms, while the third arm is unused. At the distal end of one interferometer arm, a 45° FRM with an optic pigtail is connected and reflects the light. At the distal end of the other arm, a self-designed probe is fabricated. The light is transmitted through the probe and reflected on the surface of a reflector. The light in both interferometer arms transmits in reverse through the fiber and generates an interference in the 3 × 3 fiber coupler. All three outputs on the left-hand side of the 3 × 3 coupler, including the one coming back through the third port of the circulator, are detected by photodetectors (PDs). Three PDs convert the received optical power into voltage signals.
The self-designed probe consists of a collimator, a Faraday rotator, and an achromatic lens, as shown in Figure 2a. Figure 2b is a corresponding picture of the self-designed probe. The collimator expands the light output from the fiber into a beam with a diameter of 7 mm. The Faraday rotator is a configuration of ferromagnetic crystals surrounded by strong permanent magnets, as shown in the red square in Figure 2b. In this paper, the Faraday rotator is fabricated with a rotation angle of 45° by configuring the thickness of the ferromagnetic crystals and the magnetic flux density of the strong permanent magnets. In addition, the Faraday rotator can be installed and removed expediently. Its center wavelength is 1550 nm, and the transmittance is more than 90%. The size of the ferromagnetic crystals is 8 mm × 8 mm, so that the entire beam from the collimator can pass through. Here, an achromatic lens with a focal distance of 20 mm is used to focus the beam on the surface of an object. In addition, with a numerical aperture of 0.172, it can receive more reflected light.
If the two interference lights pass through two different single mode fibers, the polarization of light in the two interference arms must be considered, which affects the interference fringe visibility due to birefringence. For the arm with FRM, the working principle of FRM is detailed in [20], with the conclusion being that the input polarization corresponds to the output polarization when light passes through a single mode fiber, a 45° FRM, and transmits in reverse. Next, we analyze that the interference arm with the self-designed probe has the same effect as FRM.
The net birefringence in a length of fiber can be represented by the Jones matrix formalism, as follows [18]:
R = α d [ a b b a ] ,
where a and b are parameters related to the fiber birefringence; denotes the conjugate; α represents the fiber loss (including the loss of fiber itself and the fiber connection); and d = ( a.a + b.b ) . When light transmits through the fiber in the reverse direction, the Jones matrix can be expressed as:
R = α d [ a b b a ] .
Note that the collimator and achromatic lens in the self-designed probe are made of isotropic material, whose impact on the polarization of the beam is small enough to be ignored. In addition, the cavities generated between the collimator and Faraday rotator, Faraday rotator and achromatic lens, and achromatic lens and object under detection are full of air, so the polarization of light through this free space can be considered unchanged. The Jones matrix, corresponding to a Faraday rotator, for the axis of propagation by an angle θ , is given by:
F = [ cos θ sin θ sin θ cos θ ]
There is no mirror in the self-designed probe; instead, the surface of the object under detection reflects the focused light back into the probe. Thus, the Jones matrix for the reflection at the surface of an object can be described as:
M = ε [ 1 0 0 1 ] ,
where ε denotes the loss coefficient for receiving the return light (less than 1%). The net Jones matrix corresponding to the self-designed probe, including the surface of an object, is given by:
T = [ cos θ sin θ sin θ cos θ ] θ = 45 ε [ 1 0 0 1 ] [ cos θ sin θ sin θ cos θ ] θ = 45 = ε [ 0 1 1 0 ] .
When considering the whole process of transmitting light along a length of fiber through the self-designed probe and back along the same fiber, the Jones matrix is thus described by:
R = R T R = α 2 ε [ 0 1 1 0 ] .
It is found that when the light travels forwards and backwards through the self-designed probe, the resulting polarization becomes constant and orthogonal to the original polarization, which is independent of the birefringence properties of the fiber.
Through the above analysis, it is clear that the self-designed probe has the same effect as FRM, and both should be added separately in the two interference arms of a Michelson interferometer. No matter what the distribution of the birefringence is along the separate arms of the Michelson interferometer, the evolution of their respective polarization will always end up at the same point. As a consequence, the interference fringe visibility is kept stable with respect to the variance of the polarization of the two arms.

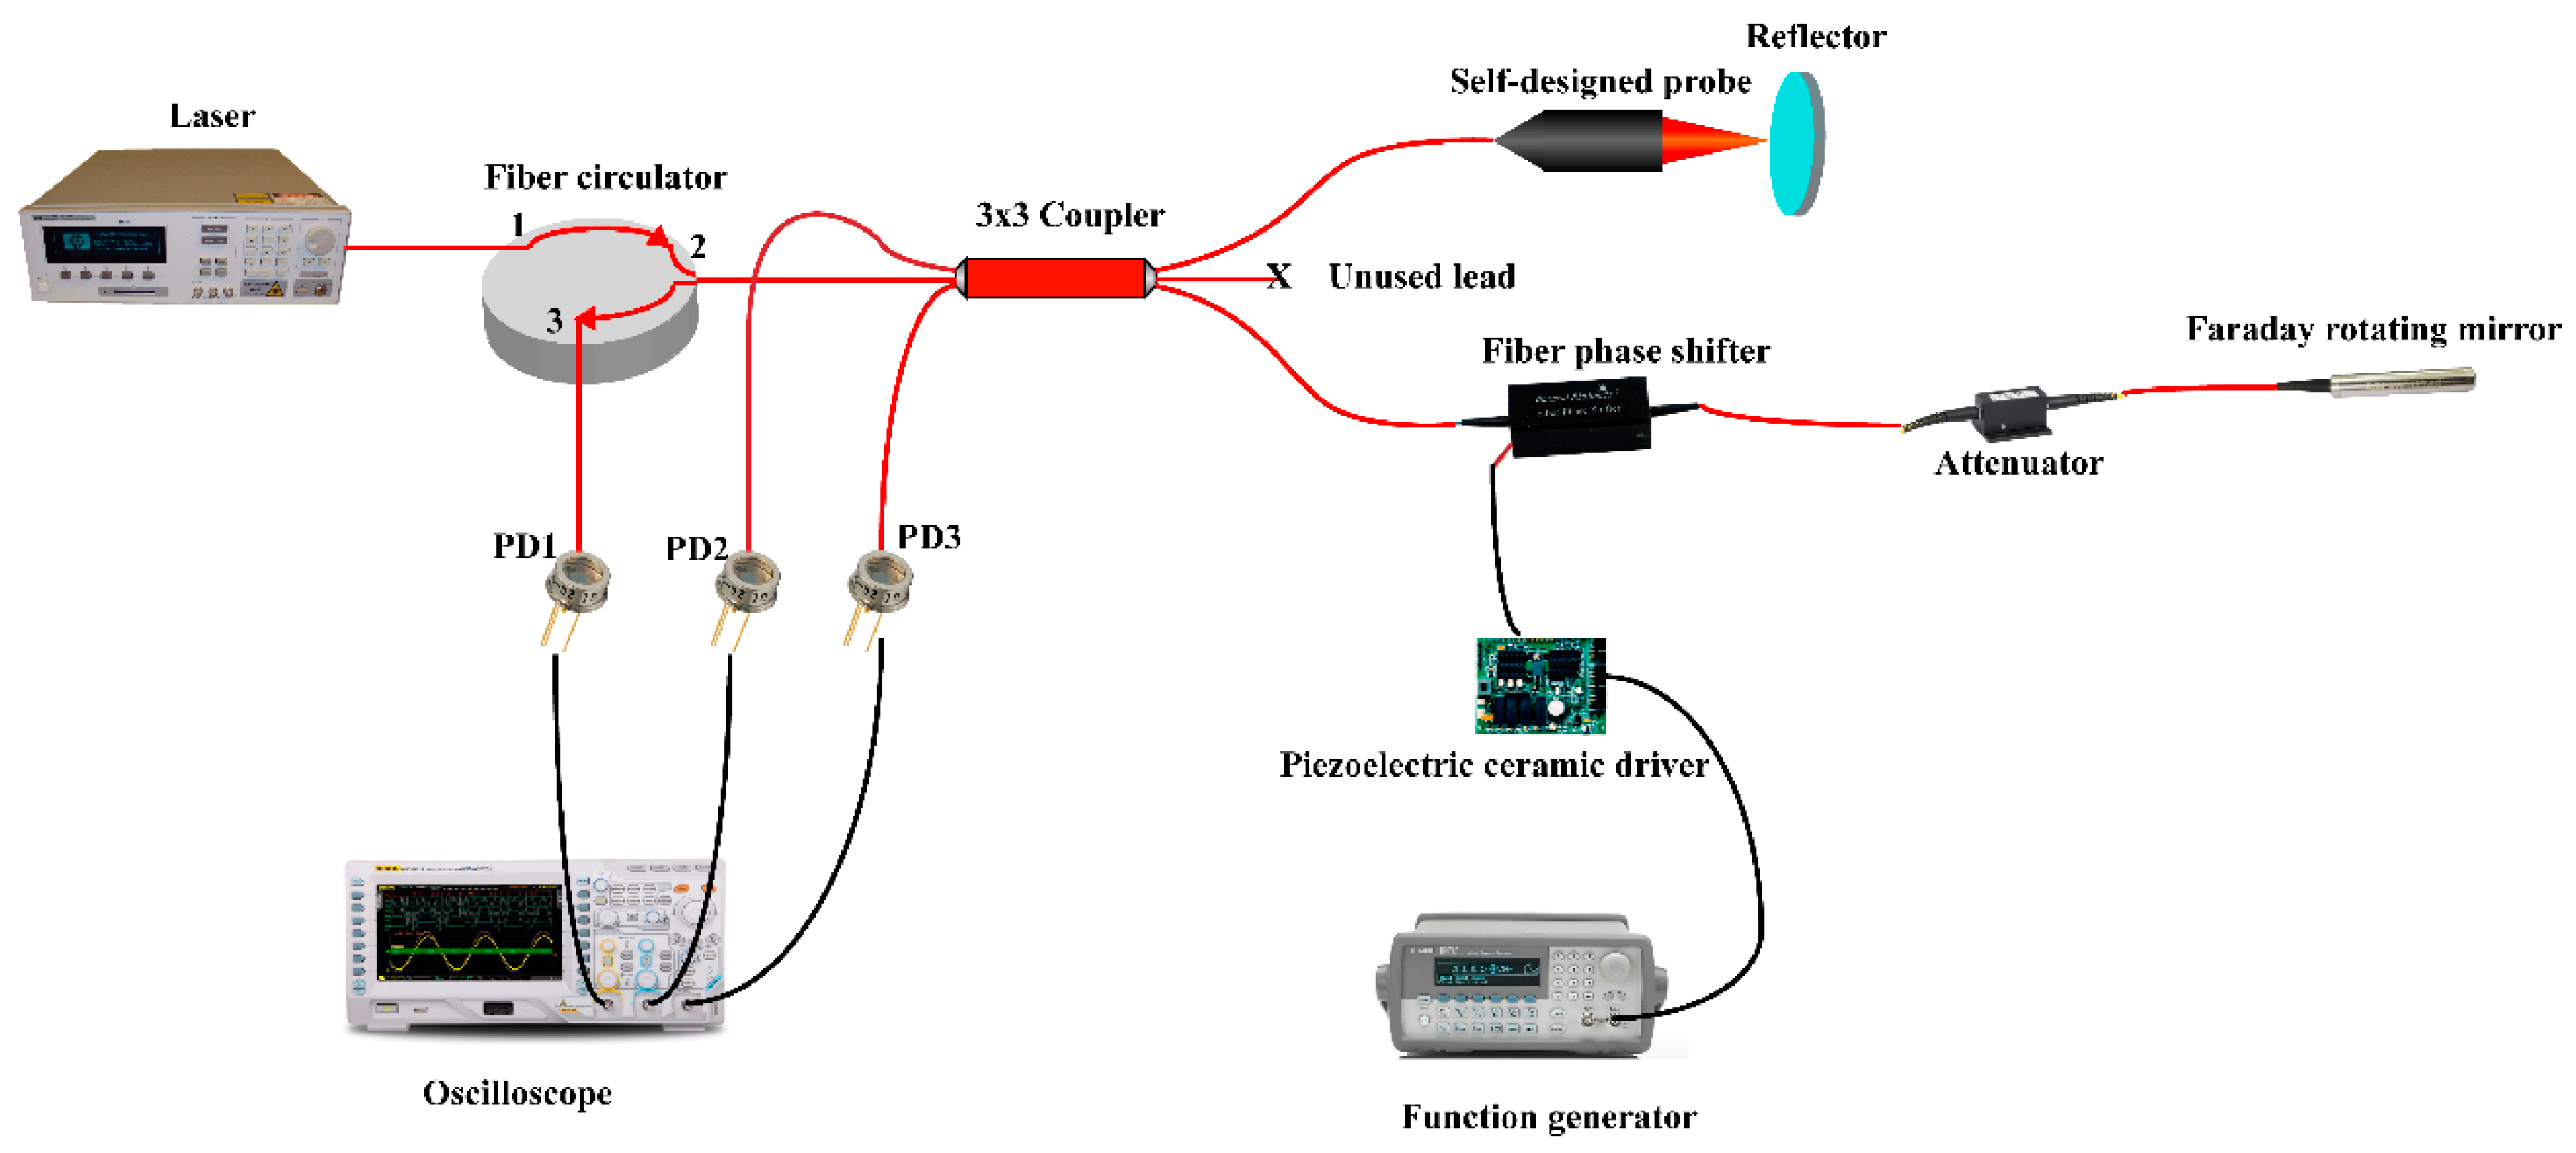
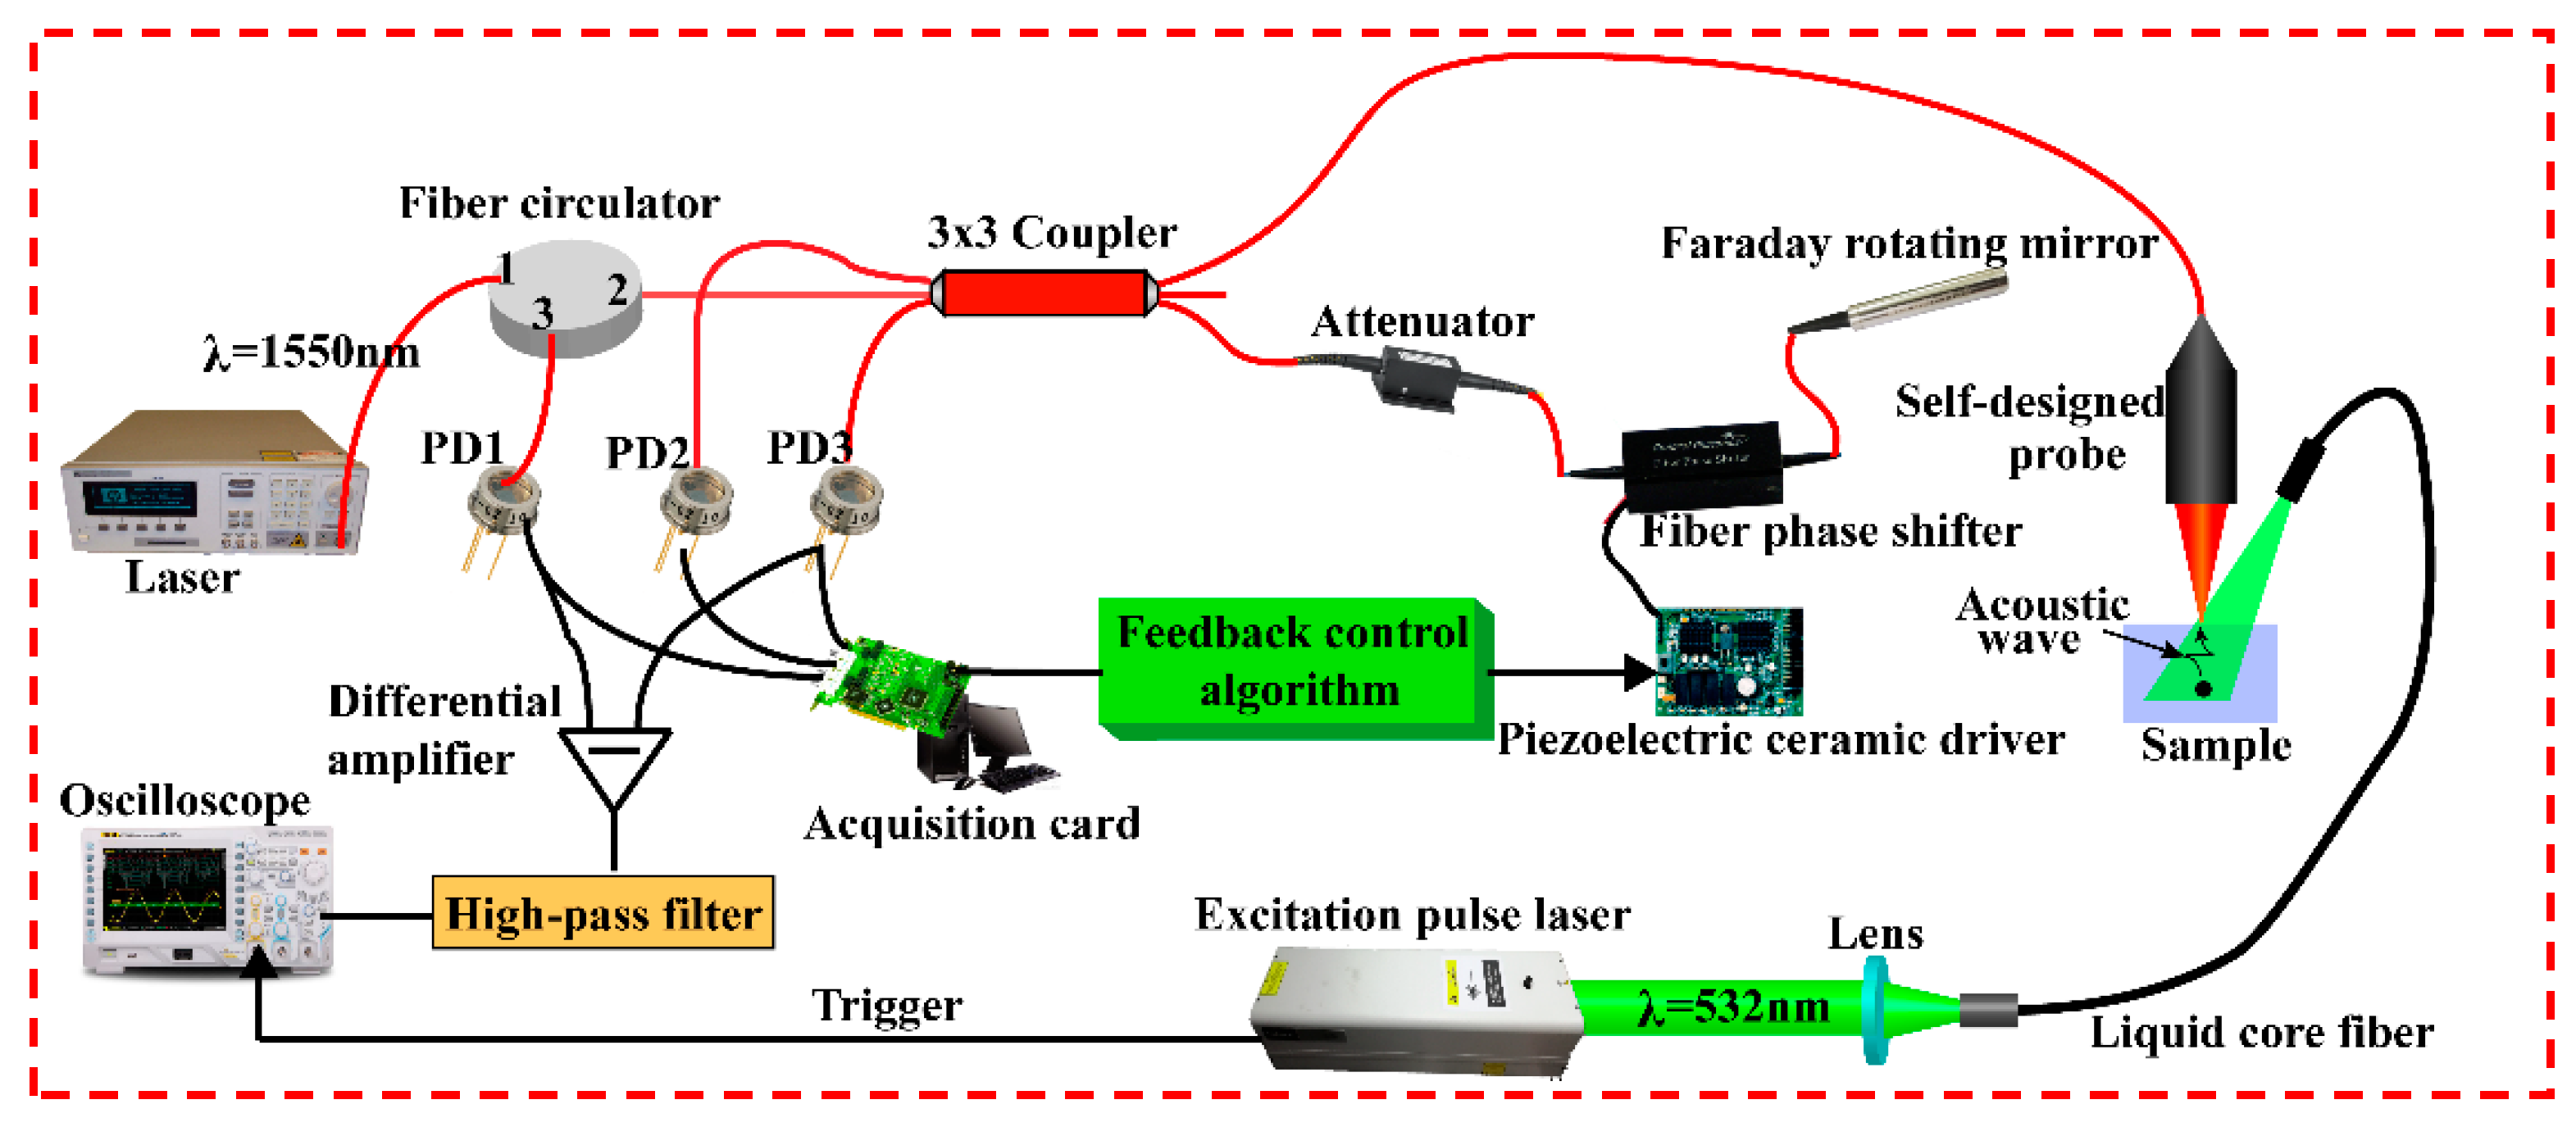
2.2. Experimental Interferometer System with Phase Feedback Control Scheme

The experimental interferometer system with a phase feedback control scheme is shown in Figure 3. As described in Figure 1, the interferometer structure keeps the same configuration, apart from adding a phase feedback control scheme. As a hardware platform to implement the feedback control algorithm, a data acquisition card (NI PCIe-6343) working on a desktop computer is used. The data acquisition card has a 32-channels analog input with a 16-bit resolution and a maximum sampling frequency of 500 kHz. In addition, it has a 4-channels analog output with a 16-bit resolution and a maximum update frequency of 900 kHz. The outputs of the 3 PDs are digitized by a multichannel data acquisition card and then processed in a feedback control algorithm. The output signal of the algorithm is exploited to control the fiber phase shifter in an interference arm.
As far as is known, the interference intensity of two channels of light can be described by:
I = I 1 + I 2 + 2 I 1 I 2 cos ( Δ ϕ ) = ( I 1 + I 2 ) ( 1 + ν cos ( Δ ϕ ) ) ,
where I 1 and I 2 are the power of the two channels of light, respectively; Δ ϕ is the phase difference of the two channels of light; and ν = 2 I 1 I 2 / ( I 1 + I 2 ) , which denotes the fringe visibility and is defined by the following formula:
ν = I max I min I max + I min ,
where I max and I min are the maximum and minimum of the interference intensity, respectively. The fringe visibility may also be degraded by a difference in the polarization of the two lights. The effect of the mismatched polarization between the two light channels may be accounted for by a coefficient in the expression of the fringe visibility:
ν = 2 I 1 I 2 ( I 1 + I 2 ) η ,
where η is the degradation coefficient due to the mismatched polarization. According to the preliminary analysis, the polarization of light in the two interference arms can stay the same when the interference is generated by the depolarization interference system used in this paper. That is, there is no degradation of the fringe visibility due to a mismatched polarization. Thus, it can be considered that η = 1 .
For the sake of description, the interference arm with FRM is called the reference arm, and the interference arm with the self-designed probe is called the sensing arm. When a symmetrical 3 × 3 coupler with a 2 π / 3 phase difference between the outputs is exploited in Figure 3, the outputs of the 3 PDs can be expressed as:
P 1 = I 1 + I 2 + 2 I 1 I 2 cos ( ϕ 0 + ϕ n + 2 π λ 2 x ) P 2 = I 1 + I 2 + 2 I 1 I 2 cos ( ϕ 0 + ϕ n + 2 π λ 2 x + 2 π 3 ) P 3 = I 1 + I 2 + 2 I 1 I 2 cos ( ϕ 0 + ϕ n + 2 π λ 2 x 2 π 3 )
where I 1 and I 2 are the light intensities detected by the PDs from the reference arm and sensing arm, respectively; ϕ 0 is the initial phase difference between the two interference arms; ϕ n is the random phase change caused by the external environment; λ is the wavelength of the light; and x is the surface displacement of the object under detection. Note that the output of the photodetector is converted into voltage from the current and that the current is linear with the power of light.
If ϕ 0 + ϕ n = n π ( n = 0 , ± 1 , ) , the difference between P 3 and P 2 can be expressed as:
P 32 = P 3 P 2 = 2 3 I 1 I 2 sin ( ϕ 0 + ϕ n + 2 π λ 2 x ) = 2 3 I 1 I 2 sin ( n π + 2 π λ 2 x ) .
If the surface displacement x of the object is small enough, we believe that Equation (11) can be transformed into:
P 32 = ± 2 3 I 1 I 2 2 π λ 2 x .
According to Equation (12), when the wavelength of the light and the intensity of the sensing arm and reference arm are all determined, the result of P 32 is linear with the surface displacement of the object under detection. In order to realize this, the random phase change caused by the external environment should be considered and eliminated. A fast and accurate feedback control scheme to compensate for the phase fading is proposed, and the process of the direction and magnitude of the phase compensation is considered at the same time.
First, the dc-offset of the interference signal is calculated as:
I 1 + I 2 = ( P 1 + P 2 + P 3 ) / 3 .
When the interference system is constructed and the power of the laser is set, the power of the light from the reference arm ( I 1 ) will be determined and can be detected before the experiment. However, the power of the light from the sensing arm ( I 2 ) may vary for some reason in the part of the reflected light received from the surface of the object. The vibration of the self-designed probe caused by the external environment and the different reflection on the surface of the object both give rise to variance when receiving the reflected light, but we can get I 2 according to Equation (13). Consequently, the magnitude of ϕ 0 + ϕ n can be calculated by taking the arcsine in Equation (11) (supposing the displacement x is small enough), and can be expressed as:
ϕ 0 + ϕ n = arcsin ( P 32 2 3 I 1 I 2 ) .
We can get the magnitude of ϕ0 + ϕn, but the quadrant is not determined, so the direction of the phase compensation is uncertain. In order to solve this problem, a method for using the orthogonal signal is proposed here. Supposing the displacement x is small enough, we can get the cosine form of ϕ 0 + ϕ n from Equations (10) and (13):
P 4 = P 1 P 1 + P 2 + P 3 3 = 2 I 1 I 2 cos ( ϕ 0 + ϕ n ) .
In order to describe the proposed method more clearly, a schematic diagram is shown in Figure 4. When the phase difference ϕ 0 + ϕ n is located in the phase range of [ π / 2 , π / 2 ) , it should be stabilized in a phase of 0. At this time, the positive and negative of the phase difference correspond to the increase and decrease of the phase compensation, and the sign of P 4 is positive. When the phase difference ϕ 0 + ϕ n is located in the phase range of [ π / 2 , 3 π / 2 ) , it should be stabilized in the phase of π . At this time, the positive and negative of the phase difference are the opposite of the increase and decrease of the phase compensation, and the sign of P 4 is negative. Consequently, the result of multiplying the value of P 4 , being positive or negative, by ϕ 0 + ϕ n is used as the phase compensation feedback control output. As a result, wherever the phase difference is located, it can be stabilized at the nearest point by using a feedback control output phase with the precise magnitude and correct direction.

3. Results

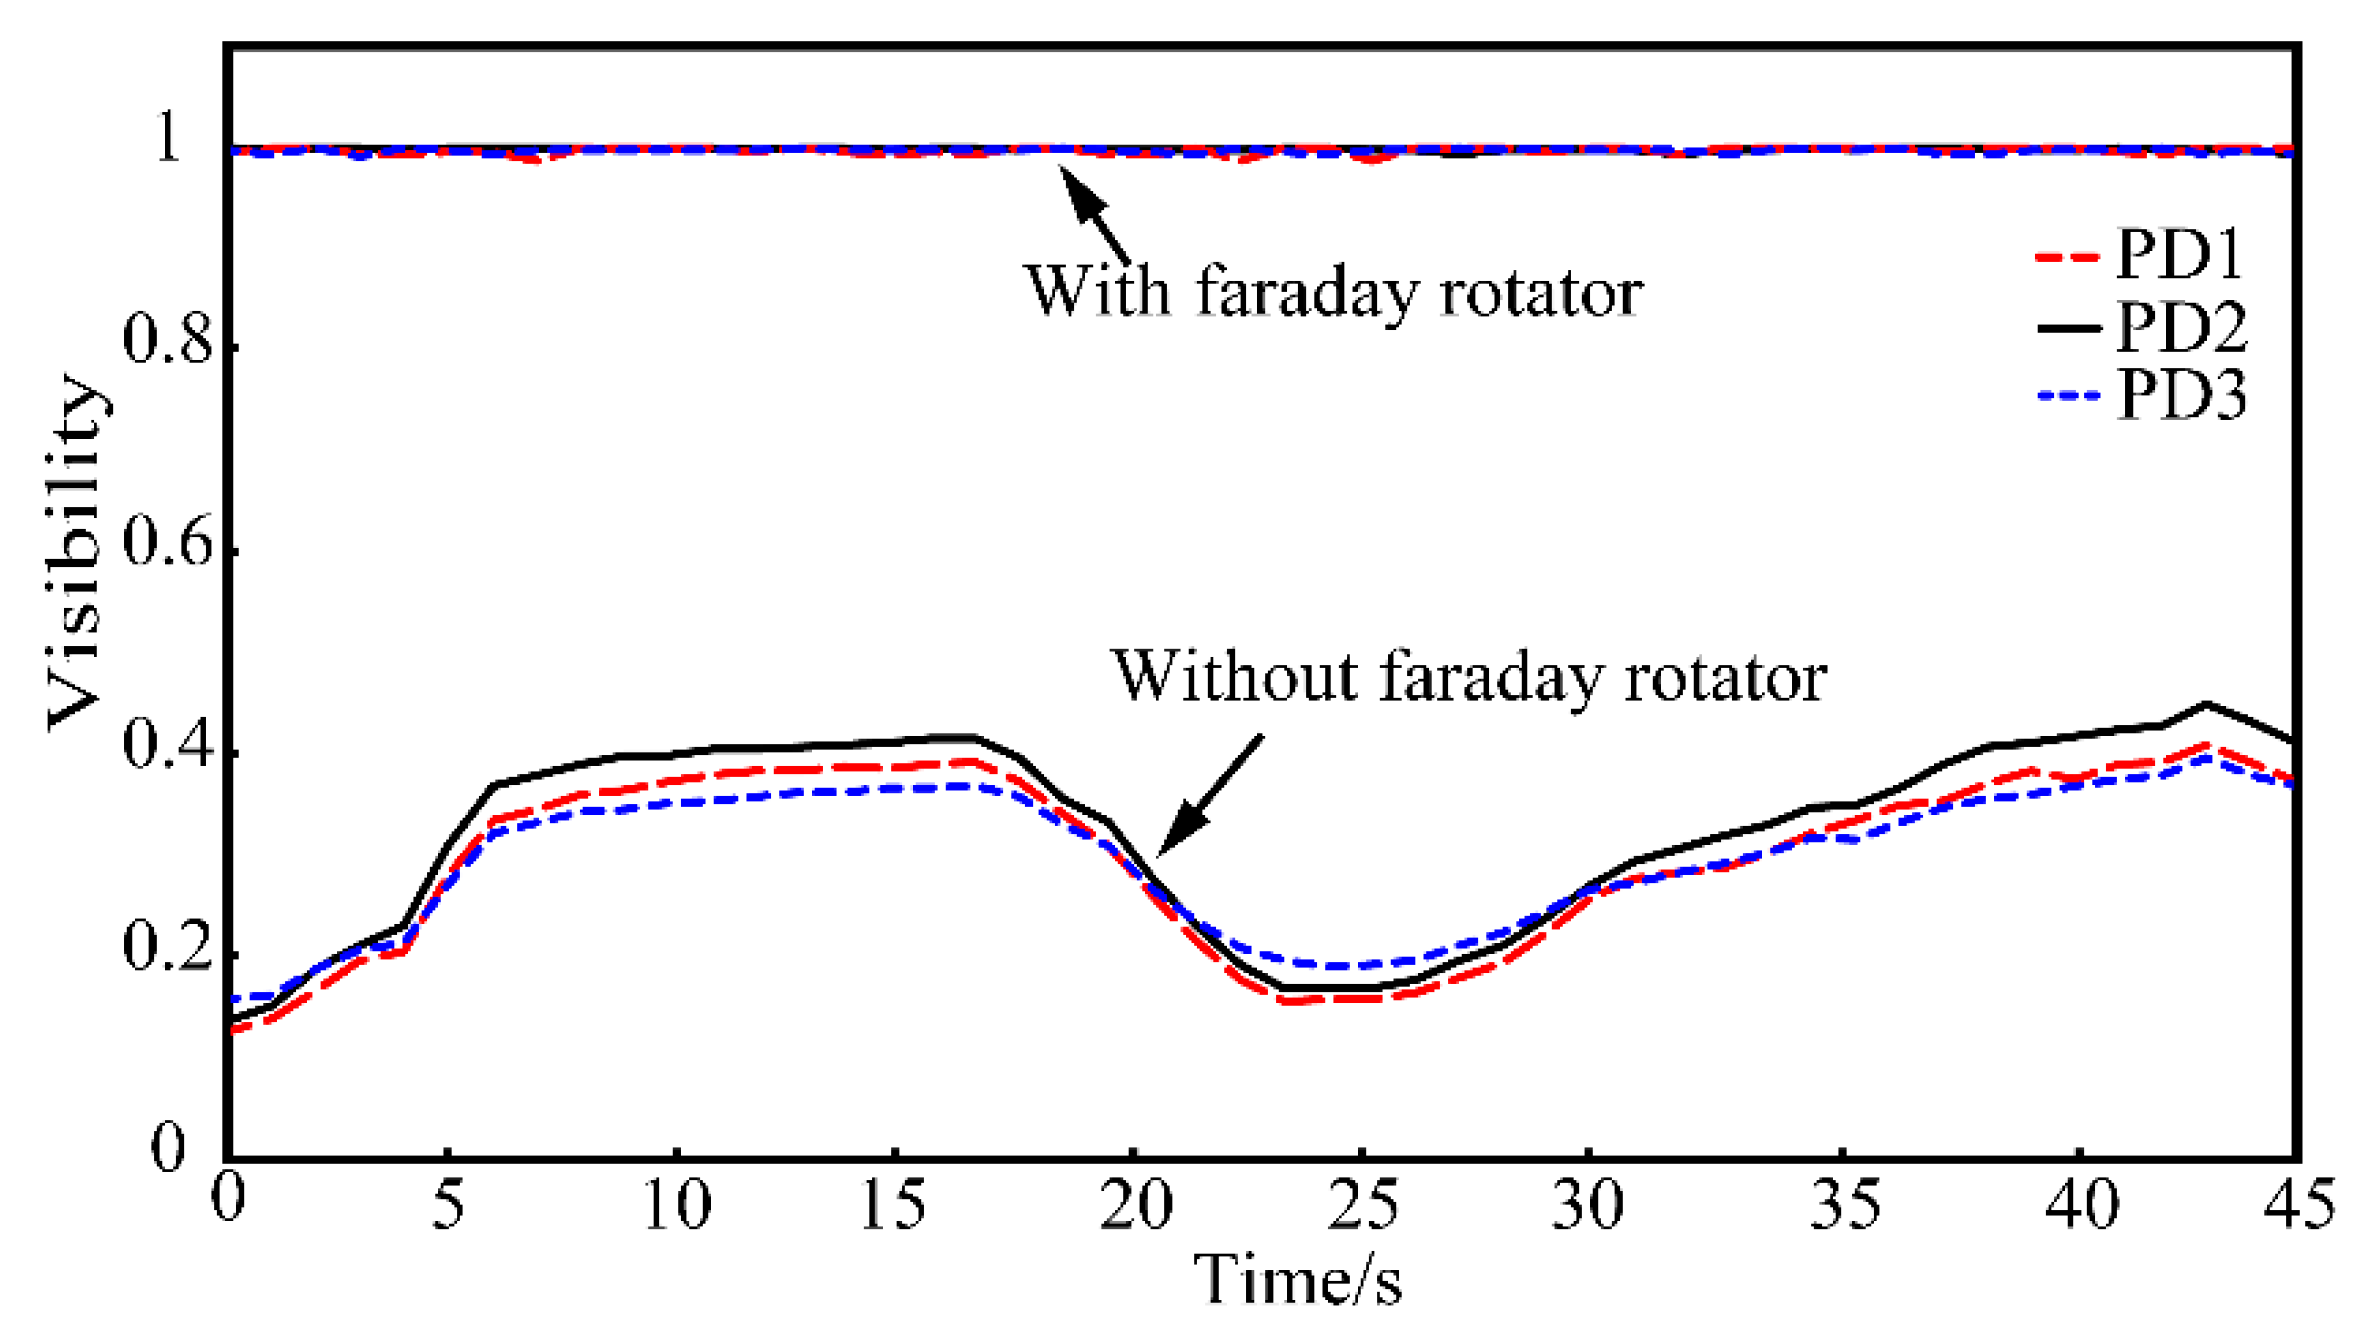
3.1. Performance of Depolarization Fading with Self-Designed Probe

The experimental system for measuring the performance of depolarization fading is shown in Figure 1. A tunable laser (HP 8168F) with a linewidth of 100 KHz was adjusted to 1550 nm. A fiber phase shifter was added in the reference arm to change the phase difference of the two interference arms with more than 2 π . The driving frequency of the piezoelectric ceramic driver was set to 100 Hz. From Equation (9), it can be seen that η will equal ν when I 1 equals I 2 . Consequently, the degradation coefficient η can be measured through Equation (8). To make I 1 equal to I 2 , three steps should be followed: (1) Remove the FRM and record the results of the PDs. (2) Place black tissue paper between the self-designed probe and the reflector to ensure that the outputs of the PDs are zero and then add the FRM. (3) Add an attenuator to the arm with the FRM and adjust it to make the results of the PDs equal to the record in Step 1. After the above three steps were implemented, three outputs of the PDs were acquired to measure the degradation coefficient η of three interference signals. The maximum and minimum of the interference intensity were acquired every 6 ms and the visibility was calculated according to Equation (8). First, the measured results were obtained under the condition with a Faraday rotator. All the operating steps were repeated under the condition without a Faraday rotator. The results recorded for 45 s are shown in Figure 5, and it can be seen that the visibility varies from approximately 0.1 to 0.4 without the Faraday rotator. However, the visibility is close to 1 and remains stable with the Faraday rotator. Meanwhile, the results show that the three interference signals have an almost equal visibility under the same conditions. This proves that the polarization fading is eliminated in the interference system with the self-designed probe.

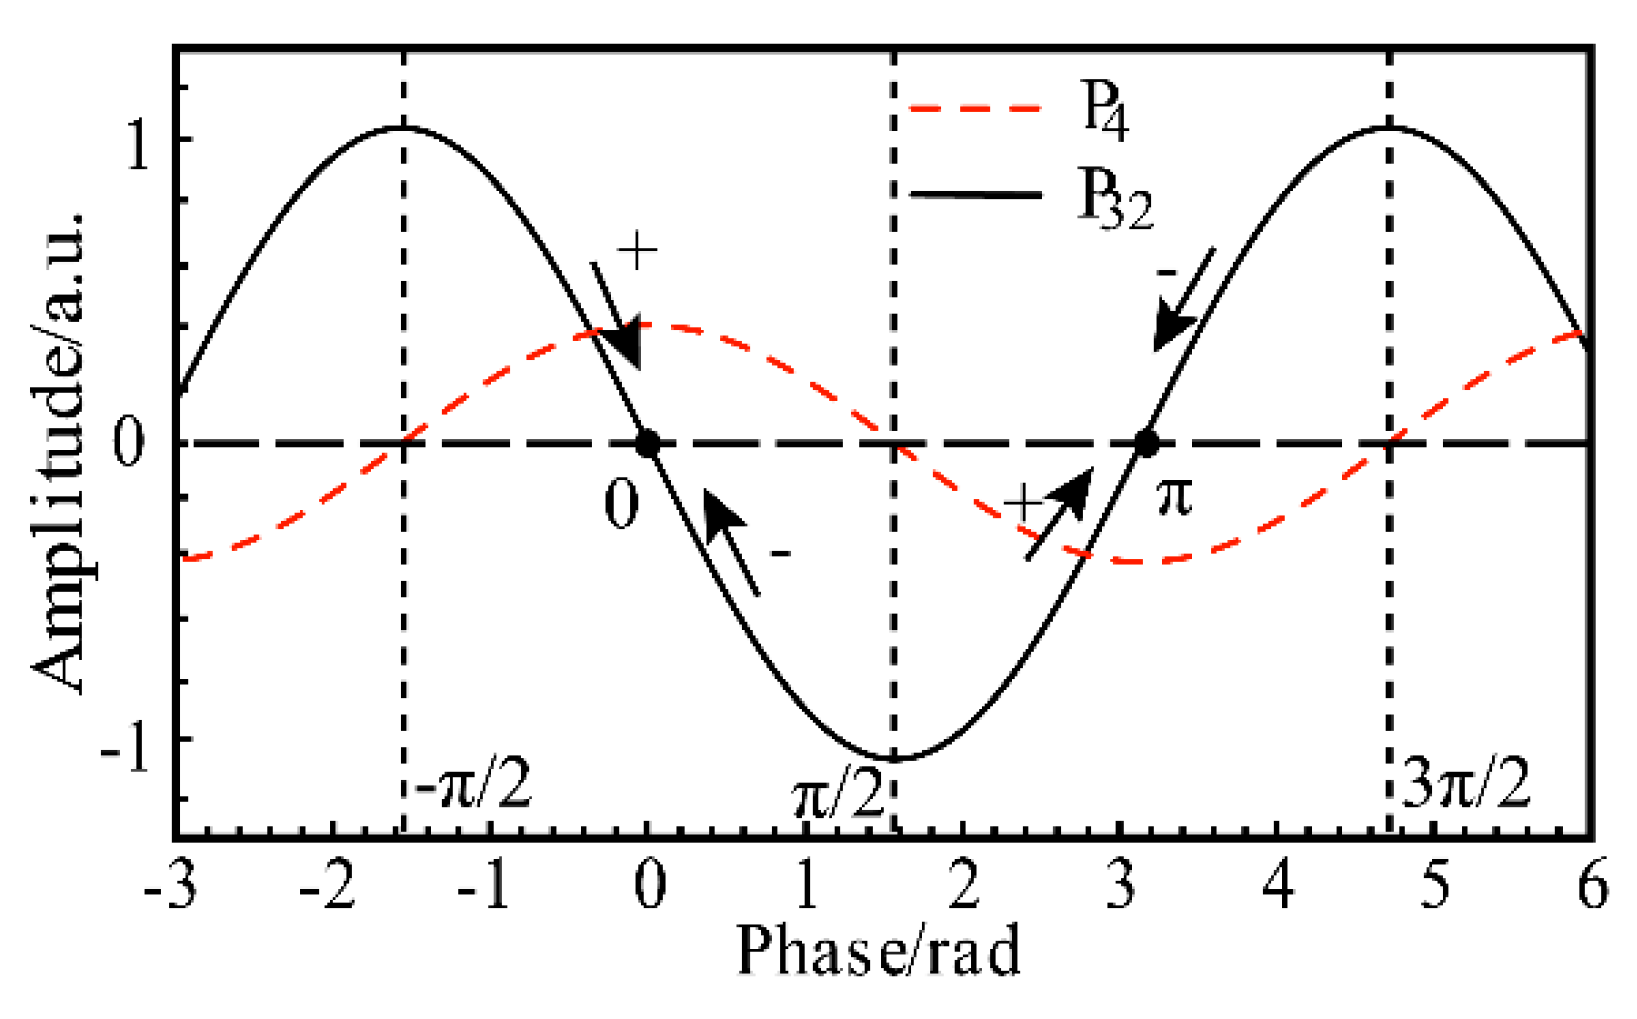
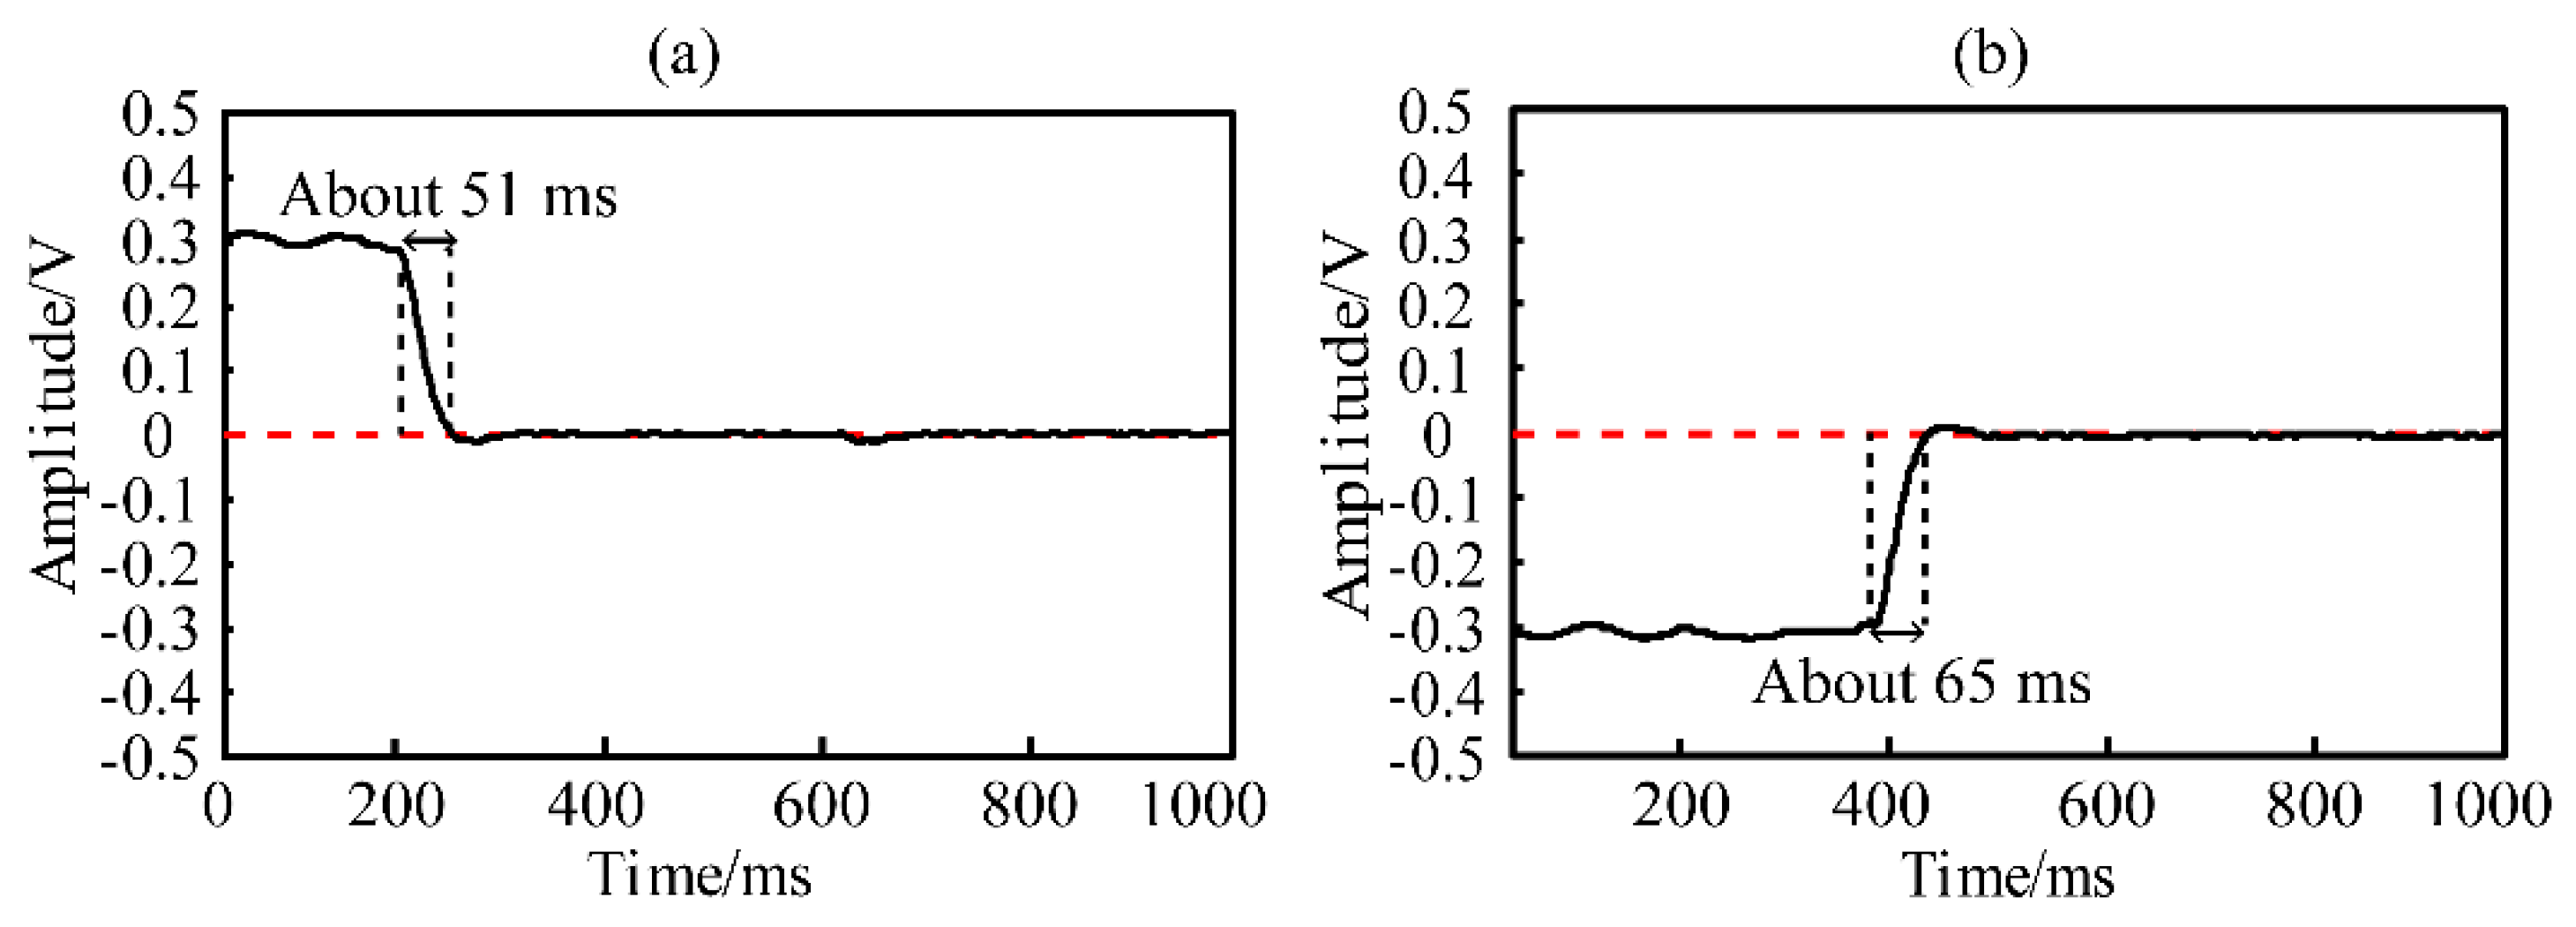
3.2. Performance of Feedback Control Scheme for Phase Fading

The experimental system for measuring the performance of the feedback control scheme is shown in Figure 3. The outputs of the 3 PDs are digitized by a multichannel data acquisition card, after which the data are processed using the Labview software. The feedback signal is outputted by a digital analog converter in the data acquisition card. Note that only a reflector is needed here to reflect the light back into the self-designed probe, without the piezoelectric ceramic vibrator. The power of the laser source was adjusted to 4 mW, after which three steps were followed. First, we removed the reflector and observed the outputs of the three PDs. Different outputs will be observed due to more loss through the circulator in PD1 and the performance index difference of the 3 × 3 coupler and PDs. Second, we adjusted the outputs to be approximately equal by digitally correcting the signals, and we recorded the value. Third, we placed a reflector vertically in front of the self-designed probe and applied the feedback control algorithm to the interference system. The signal of P 32 was recorded when the feedback control was carried out, as shown in Figure 6. It can be seen that the phase fading is compensated wherever the initial phase difference is located. Figure 6a,b show the phase compensation results when the initial phase difference are located at [ π / 2 , π / 2 ) and [ π / 2 , 3 π / 2 ) respectively. It is seen that the phase difference is compensated directly to the ideal point in the right direction; however, the positive and negative of the phase difference are the opposite of the increase and decrease of the phase compensation. About 65 ms are needed to compensate for the phase when the feedback control scheme is implemented, with the initial phase difference being far from the ideal point. The time is reduced at the moment when the phase difference is controlled close to the ideal point. Meanwhile, the performance of the feedback control scheme is measured under the condition that the power of the light reflected back into the self-designed probe is changed via the adjustment of the angle of the reflector. The results show that the proposed feedback control scheme can compensate for the phase difference without adjusting the parameters manually when the power of the light reflected back into the self-designed probe changes.

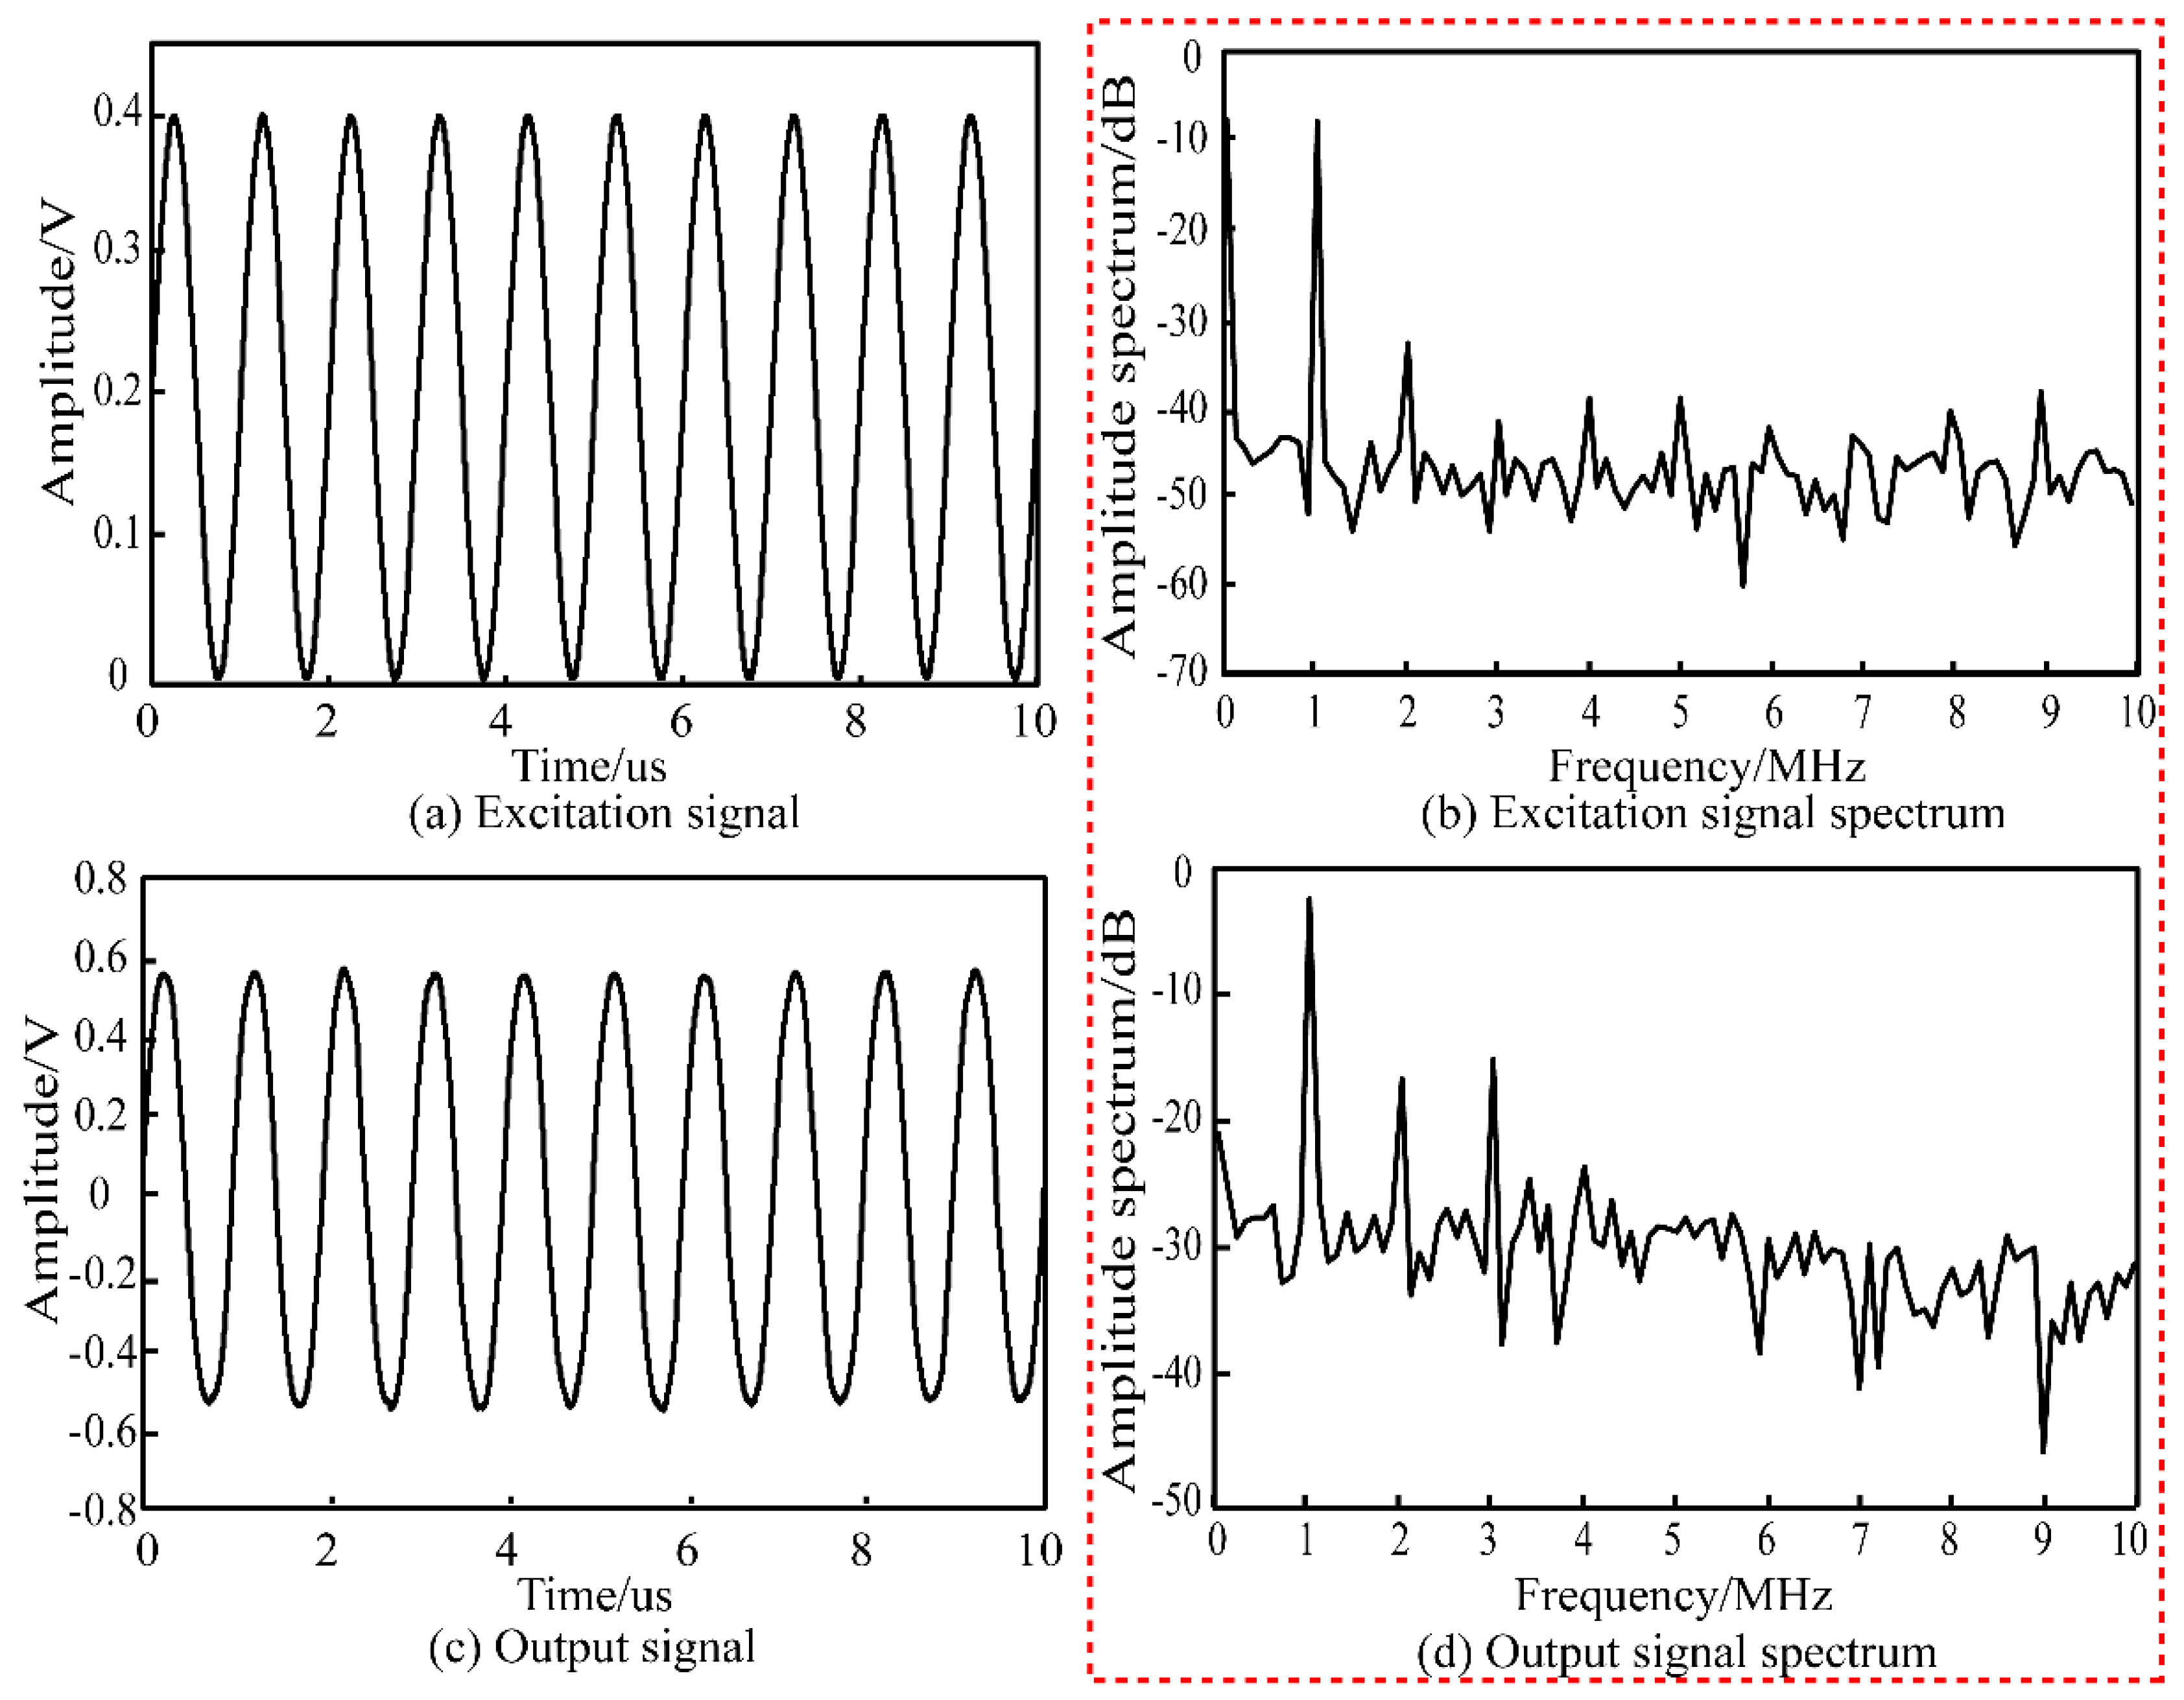
3.3. Detection Performance of the Interferometer

According to the interferometer input–output relationship in Equation (12), the experimental interferometer system shown in Figure 3 was applied to perform a micro-vibration measurement experiment. A reflector was attached to a piezoelectric ceramic vibrator, with the driving frequency set to 1 MHz. The differential output signal of PD3 and PD2 ( P 32 ) was amplified by a preamplifier with a frequency range of 20 KHz to 2 MHz and was then acquired by a digital oscilloscope (DPO 3012, Tekronix). Before detection, the same three steps as those used in Section 3.2. were followed. Here, the value recorded in Step 2 was 0.09 V. The peak-to-peak value of the sinusoidal excitation signal from the function generator was adjusted to 0.2 V, with a DC bias voltage of 0.2 V. The excitation signal is shown in Figure 7a. The output signal from the interferometer is shown in Figure 7c. Figure 7b,d show the spectra of the excitation signal and output signal, respectively.
It can be seen from Figure 7 that the experimental interferometer system used in this paper, with the self-designed probe and proposed feedback control scheme, has a good follow-up effect on the piezoelectric ceramic excitation signal. According to the spectra of the excitation signal and output signal, the two signals have the same main frequency of 1 MHz with different intensities. In addition, compared with the excitation signal spectrum, the output interferometer signal spectrum has tiny harmonic frequencies with 1 MHz components. But the origin of these harmonics is unclear at the moment. Moreover, we successfully detected micro-vibrations with frequencies ranging from 600 kHz to 2.3 MHz by adjusting the frequency of the function generator. Higher frequency signals cannot be detected here because the frequencies are out of the frequency range of the piezoelectric ceramic vibrator and the preamplifier. If a higher frequency measurement should be implemented, a higher frequency piezoelectric ceramic vibrator would be needed to generate high frequency micro-vibrations. In addition, a preamplifier with a higher bandwidth would be needed.
It is known that the output interferometer signal is related to the displacement of vibrations from Equation (12). The relationship is linear when the powers of the two lights from the reference arm and sensing arm are constant. However, the power of the light from the sensing arm ( I 2 ) may vary slightly if the self-designed probe is moved for detection in a point-by-point scanning mode. In addition, the slight vibration caused by the external environment may give rise to the variance of I 2 . If we can obtain the value of I 2 when the output signal is recorded, the output signal can be normalized by dividing it by I 2 . In our experiment, the value of I 2 was changed by adjusting the angle of the reflector under the condition that the amplitude and frequency of the excitation signal were constant. Three sets of measured and calculated results are shown in Table 1. It can be seen that the output signal decreases significantly as I 2 is reduced and that the maximum deviation from the mean is 35%. By contrast, the normalized result stays stable, with a maximum deviation from the mean of 1.9%. Therefore, the normalized result can partly eliminate the effect caused by the variance of the light power from the self-designed probe.

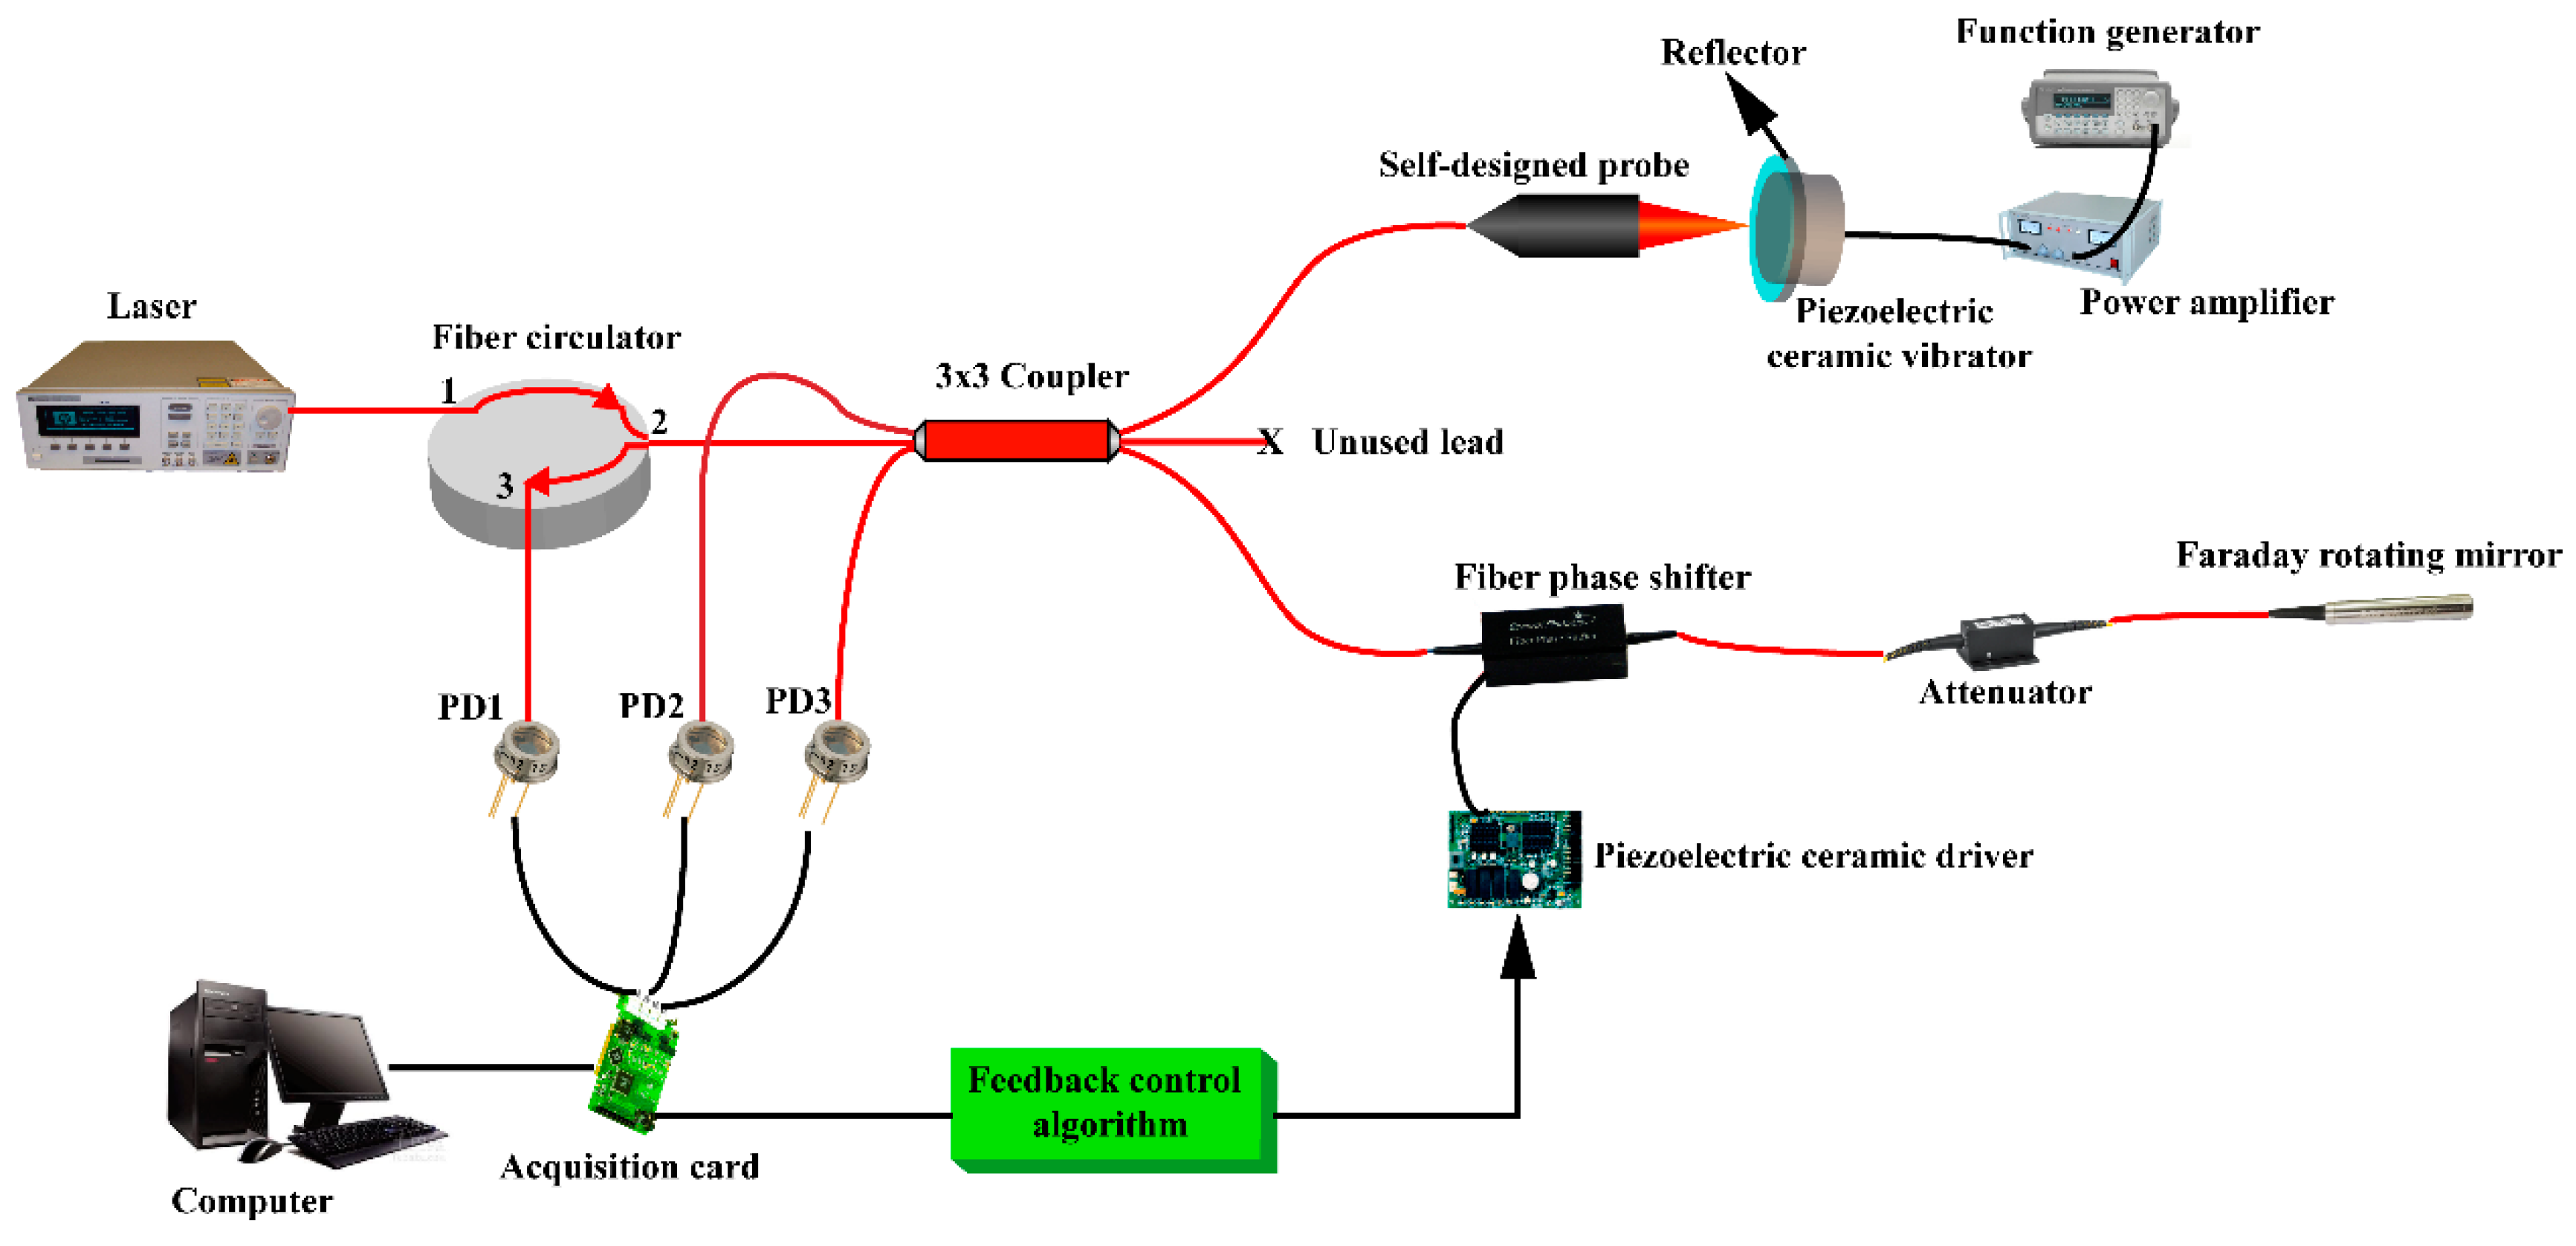
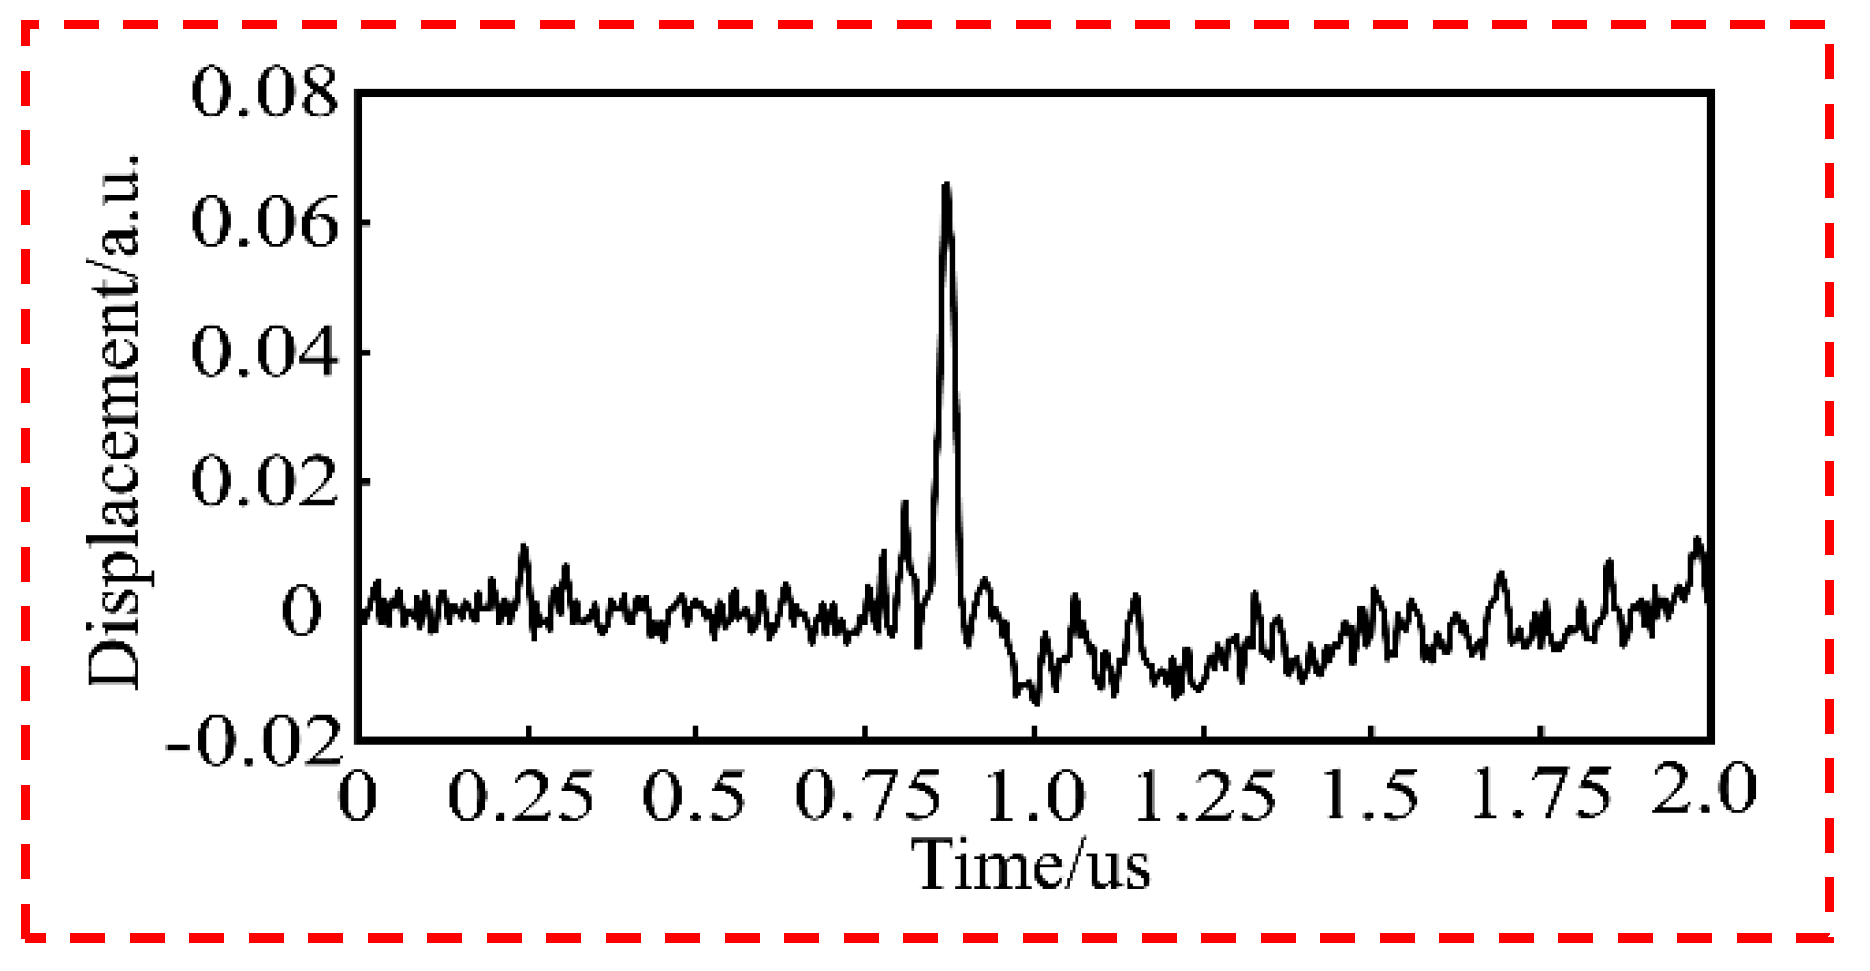
4. Application in Photoacoustic Detection

A practical application research of the interference system was implemented. Figure 8 shows the schematic diagram of the application of the photoacoustic detection. The schematic diagram consists of two parts: an excitation part and detection part. In the excitation part, a Q-switched Nd:YAG laser (Continuum, Surelite I-20) was used to excite the acoustic pressure waves within the sample. It emits a train of 8-ns duration pulses at a 532-nm wavelength, with a repetition rate of 20 Hz and a maximum energy of 160 mJ per pulse. The excitation beam was coupled to the liquid-core fiber through a lens, and it illuminated the sample. The detection part is same as that shown in Figure 3. The detection beam from the self-designed probe, which was focused onto the sample surface and phase-shifted by the acoustic pressure waves, was recoupled into the same probe. The outputs of PD1 and PD3 passed through an oscilloscope with a sampling frequency of 100 MHz.
The sample was made by mixing and heating 95 mL deionized water, 2 g agar powder and 3 mL 20%-Intralipid. As the photoacoustic wave source, a hair was embedded in the sample. Figure 9 shows the detected displacement due to a photoacoustic wave, which is related to the photoacoustic pressure. The depth of the hair can be obtained through further analyses. If a point-by-point scanning mechanism is implemented, a three-dimensional image can be reconstructed. Note that the optical absorption and scattering coefficients that were made here of the sample are similar to those of biological tissues. Consequently, the proposed experimental system has an application value in biomedical photoacoustic imaging. The biggest advantage of the proposed experimental system is that it can detect an acoustic wave pressure with a non-contact style, which is very useful for trauma and internal biological tissue detection. In addition, the experimental system has the advantages of electromagnetic immunity, a wide bandwidth and a focal point with an optical focus size.

5. Conclusions

In this paper, an experimental interferometer system with a self-designed probe and feedback control scheme was built. We studied the performance of the depolarization of the self-designed probe. The results show that the polarization fading of two interference arms are well eliminated with a coefficient approximately equal to 1. A new feedback control scheme was proposed to compensate for the phase fading. It was demonstrated that the phase fading can be compensated in the right direction wherever the initial phase difference is located, regardless of the variance of the light power from the self-designed probe. The time required is about 65 ms. Moreover, a micro-vibration with a high frequency of 1 MHz was measured correctly, and a result-normalizing method was suggested. The normalized results stayed relatively stable, with a maximum deviation from the mean of 1.9% when the light power from the self-designed probe varied. An experimental system for the application in photoacoustic detection was set up and used to detect the displacement due to photoacoustic waves.
It was proven that the proposed experimental interferometer system can detect high-frequency and micro displacements, which solves the polarization and phase fading problems at the same time. The sensing light can be focused on the surface of an object, and the variance of the light power can be considered and corrected; thus, a non-contact detection style can be implemented in some special cases, with the advantages of non-destructive testing and convenience. This has an important application value in micro-displacement and point-by-point scanning measurements.

Author Contributions

S.J. conceived, designed, and performed the experiments and also wrote the paper; J.R. discussed the results and the conclusions; J.T. searched for the literature and prepared the draft.

Funding

This work was funded, in part, by the Fundamental Research Funds for the Central Universities, grant number ZYGX2015J146; and the International Cooperation Project of Sichuan Province Science and Technology Agency, grant number 2014HH0037.

Conflicts of Interest

The authors declare no conflict of interest.

References

  1. Han, M.; Wang, X.W.; Xu, J.C.; Cooper, K.L.; Wang, A.B. Diaphragm-based extrinsic fabry-perot interferometric optical fiber sensor for acoustic wave detection under high background pressure. Opt. Eng. 2005, 44, 060506. [Google Scholar] [CrossRef]
  2. Yan, L.; Gui, Z.G.; Wang, G.J.; An, Y.Q.; Gu, J.Y.; Zhang, M.Q.; Lin, X.L.; Wang, Z.B.; Wang, G.; Jia, P.G. A micro bubble structure based fabry–perot optical fiber strain sensor with high sensitivity and low-cost characteristics. Sensors 2017, 17, 555. [Google Scholar] [CrossRef] [PubMed]
  3. Zhang, Y.A.; Yuan, L.; Lan, X.W.; Kaur, A.; Huang, J.; Xiao, H. High-temperature fiber-optic Fabry-Perot interferometric pressure sensor fabricated by femtosecond laser. Opt. Lett. 2013, 38, 4609–4612. [Google Scholar] [CrossRef] [PubMed]
  4. Chen, Z.S.; Xiong, S.S.; Gao, S.C.; Zhang, H.; Wan, L.; Huang, X.C.; Huang, B.S.; Feng, Y.H.; Liu, W.P.; Li, Z.H. High-temperature sensor based on fabry-perot interferometer in microfiber tip. Sensors 2018, 18, 202. [Google Scholar] [CrossRef] [PubMed]
  5. Lin, D.J.; Jiang, X.Q.; Xie, F.; Zhang, W.; Zhang, L.; Bennion, L. High stability multiplexed fiber interferometer and its application on absolute displacement measurement and on-line surface metrology. Opt. Express 2004, 12, 5729–5734. [Google Scholar] [CrossRef] [PubMed]
  6. Xiong, W.; Xiao, G.Z.; Han, X.; Chen, X.L.; Yang, K.Y.; Luo, H. All-fiber interferometer for displacement and velocity measurement of a levitated particle in fiber-optic traps. Appl. Opt. 2019, 58, 2081–2084. [Google Scholar] [CrossRef] [PubMed]
  7. Wang, A.; Xiao, H.; May, R.G.; Wang, J.; Zhao, W.; Deng, J.; Zhang, P.; Pickrell, G.R. Optical fiber sensors for harsh environments. Proc. SPIE Int. Soc. Opt. Eng. 2000, 4077, 2–6. [Google Scholar]
  8. Rong, Q.Z.; Zhou, R.X.; Hao, Y.X.; Yin, X.L.; Shao, Z.H.; Gang, T.T.; Qiao, X.G. Ultrasonic sensitivity-improved Fabry-Perot interferometer using acoustic focusing and its application for noncontact imaging. IEEE Photonics J. 2017, 9, 7011210. [Google Scholar] [CrossRef]
  9. Eom, J.; Park, S.J.; Lee, B.H. Noncontact photoacoustic tomography of in vivo chicken chorioallantoic membrane based on all-fiber heterodyne interferometry. J. Biomed. Opt. 2015, 20, 106007. [Google Scholar] [CrossRef] [PubMed]
  10. Chen, Z.J.; Yang, S.H.; Wang, Y.; Xing, D. Noncontact broadband all-optical photoacoustic microscopy based on a low-coherence interferometer. Appl. Phys. Lett. 2015, 106, 043701. [Google Scholar] [CrossRef]
  11. Hochreiner, A.; Bauer-Marschallinger, J.; Burgholzer, P.; Jakoby, B.; Berer, T. Non-contact photoacoustic imaging using a fiber based interferometer with optical amplification. Biomed. Opt. Express. 2013, 4, 2322–2331. [Google Scholar] [CrossRef] [PubMed] [Green Version]
  12. Martinelli, M. A universal compensator for polarization changes induced by birefringence on a retracing beam. Opt. Commun. 1989, 72, 341–344. [Google Scholar] [CrossRef]
  13. Zhang, R.X.; Yao, X.S.; Liu, T.G.; Li, L. The effect of linear birefringence on fiber optic current sensor based on Faraday mirror. In Proceedings of the SPIE—The International Society for Optical Engineering, Beijing, China, 9–11 October 2014. [Google Scholar]
  14. Zhang, C.; Duan, F.J. Phase stepping methods based on PTDC for Fiber-Optic Projected-Fringe Digital Interferometry. Opt. Laser. Technol. 2012, 44, 1089–1094. [Google Scholar]
  15. Lundin, P.; Guan, Z.G.; Svanberg, S. Active feedback regulation of a Michelson interferometer to achieve zero-background absorption measurements. Appl. Opt. 2011, 50, 373–378. [Google Scholar] [CrossRef] [PubMed]
  16. Lu, J.; Gao, Y.Z.; Ma, Z.H.; Zhou, H.X.; Wang, R.K.K.; Wang, Y. In vivo photoacoustic imaging of blood vessels using a homodyne interferometer with zero-crossing triggering. J. Biomed. Opt. 2017, 22, 036002. [Google Scholar] [CrossRef] [PubMed]
  17. Elezov, M.S.; Scherbatenko, M.L.; Sych, D.V.; Goltsman, G.N. Active and passive phase stabilization for the all-fiber Michelson interferometer. J. Phys. 2018, 1124, 051014. [Google Scholar] [CrossRef]
  18. Lutzweiler, C.; Razansky, D. Optoacoustic imaging and tomography: Reconstruction approaches and outstanding challenges in image performance and quantification. Sensors 2013, 13, 7345–7384. [Google Scholar] [CrossRef] [PubMed]
  19. Wang, L.H.; Hu, S. Photoacoustic tomography: In vivo imaging from organelles to organs. Science 2012, 335, 1458. [Google Scholar] [CrossRef] [PubMed]
  20. Kersey, A.D.; Marrone, M.J.; Davis, M.A. Polarization-insensitive fiber optic Michelson interferometer. Electron. Lett. 1991, 27, 518–520. [Google Scholar] [CrossRef]
Figure 1. Schematic of the depolarization fading system based on a probe with a built-in Faraday rotator.
Applsci 09 04173 g001
Figure 2. The self-designed probe with a built-in Faraday rotator: (a) the schematic diagram; (b) a picture of the probe and Faraday rotator details.
Applsci 09 04173 g002
Figure 3. The experimental interferometer system.
Applsci 09 04173 g003
Figure 4. The schematic diagram of judging the direction of the phase compensation.
Applsci 09 04173 g004
Figure 5. The result of the degradation coefficient caused by the polarization.
Applsci 09 04173 g005
Figure 6. The result of the phase fading compensation via the feedback control scheme when the initial phase difference is located at (a) [ π / 2 , π / 2 ) and (b) [ π / 2 , 3 π / 2 ) .
Applsci 09 04173 g006
Figure 7. The time-domain and frequency-domain waveforms of the experimental signals: the (a) excitation signal; (b) excitation spectrum; (c) output signal; and (d) output signal spectrum.
Applsci 09 04173 g007
Figure 8. The experimental system of the application of the photoacoustic detection.
Applsci 09 04173 g008
Figure 9. The detected displacement due to a photoacoustic wave.
Applsci 09 04173 g009
Table 1. The list of measured and calculated results, in V.
I 1 I 1 + I 2 I 2 Output SignalNormalized Result
0.090.180.300.561.86
0.090.150.220.421.91
0.090.110.140.271.92

