Estimation of Seismically-Induced Crest Settlement of Earth Core Rockfill Dams


1
Department of Civil and Environmental Engineering, Hanyang University, 222 Wangsimni-ro, Sageun-dong, Seongdong-gu, Seoul 04763, Korea
2
Rural Research Institute, Korea Rural Community Co., Ansan-si, Geonggi-do 15364, Korea
*
Author to whom correspondence should be addressed.
Appl. Sci. 2019, 9(20), 4343; https://0-doi-org.brum.beds.ac.uk/10.3390/app9204343
Submission received: 27 August 2019
/
Revised: 11 October 2019
/
Accepted: 12 October 2019
/
Published: 15 October 2019
(This article belongs to the Section Civil Engineering)
Abstract
:The settlement at the dam crest induced by earthquake loading is an important design parameter widely used to evaluate the seismic performance of dams. Two-dimensional nonlinear dynamic analyses were performed to calculate the dam crest settlement of earth core rockfill dams (ECRDs). The numerical model was first validated against centrifuge test measurements. Comparisons showed that the numerical model provided reasonable estimates of the measured response. A series of dynamic numerical analyses were performed for a wide range of ground motions. The calculated settlements were revealed to compare well with field recordings of dam crest settlements. The settlements were also plotted against ground motion parameters, including free-field surface peak ground acceleration (PGA), peak ground velocity (PGV), Arias intensity (Ia), and moment magnitude (M). Predictive equations for the crest settlement were also presented. It wes demonstrated that PGA provided a good estimate of the settlement, but Ia provided the most favorable fit according to the calculations. Additionally, multiple parameters models were also presented to enhance the accuracy of the predictions.
1. Introduction
The settlement at the dam crest induced by seismic excitation is an important seismic design parameter for earth dams and is routinely used to evaluate the seismically-induced damage level of dams. Extensive data were collected and summarized to estimate the settlement characteristics of earth dams [1]. The dams considered were earth core rockfill dams (ECRDs), concrete-faced rockfill dams (CFRDs), hydraulic fill dams, and earthfill dams. An empirical formula was proposed that correlated the free-field outcrop peak ground acceleration (PGA) and moment magnitude (M) with the surface settlement. However, because a wide range of dams was used, a significant level of scatter was inevitable. Additionally, the strength of the correlation of various ground motion parameters other than PGA to potentially enhance the correlation was not investigated.
Recently, a series of numerical simulations was performed to evaluate the dynamic response of earth dams. Yang and Chi [2] performed a series of finite element limit analyses to evaluate the seismic stability of earth core rockfill dams (ECRDs). However, the crest settlement was not calculated. Pang et al. [3] performed numerical simulations to calculate the settlement of concrete-faced rockfill dams (CFRD) and to derive fragility curves. Zhang et al. [4] performed dynamic analyses to investigate the stress induced in the concrete slab of CFRDs. However, neither of the numerical models were validated against recordings. The literature review demonstrated that a study using a validated or verified numerical model to calculate the dam settlement has not yet been performed.
The aim of this paper was to develop empirical equations to predict the crest settlement of earth core rockfill dams (ECRDs). The predictive equation could potentially be used for damage assessment of ECRDs. A two-dimensional (2D) nonlinear model validated against centrifuge tests was used to perform a series of dynamic analyses. Multivariate regression analyses were performed to correlate the calculated crest settlements with a number of ground motion parameters.
2. Numerical Model
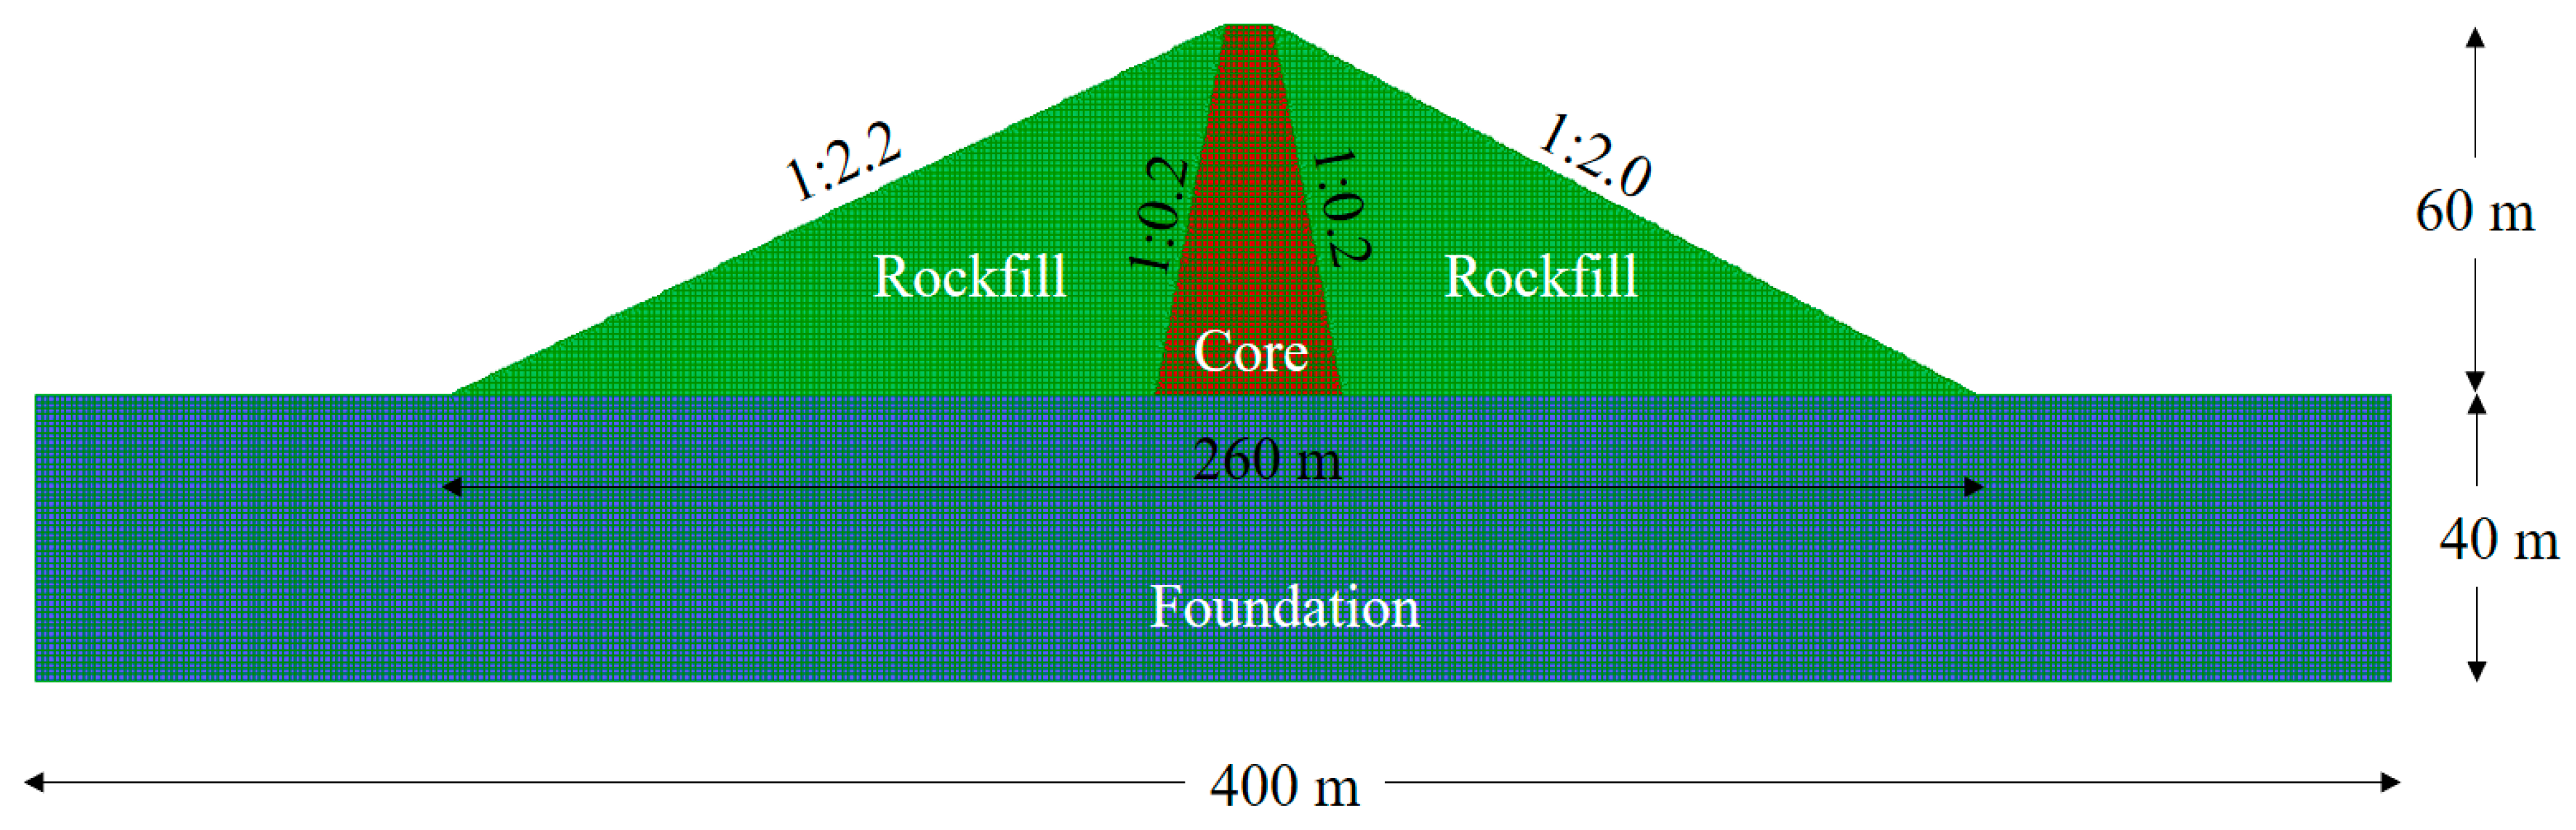
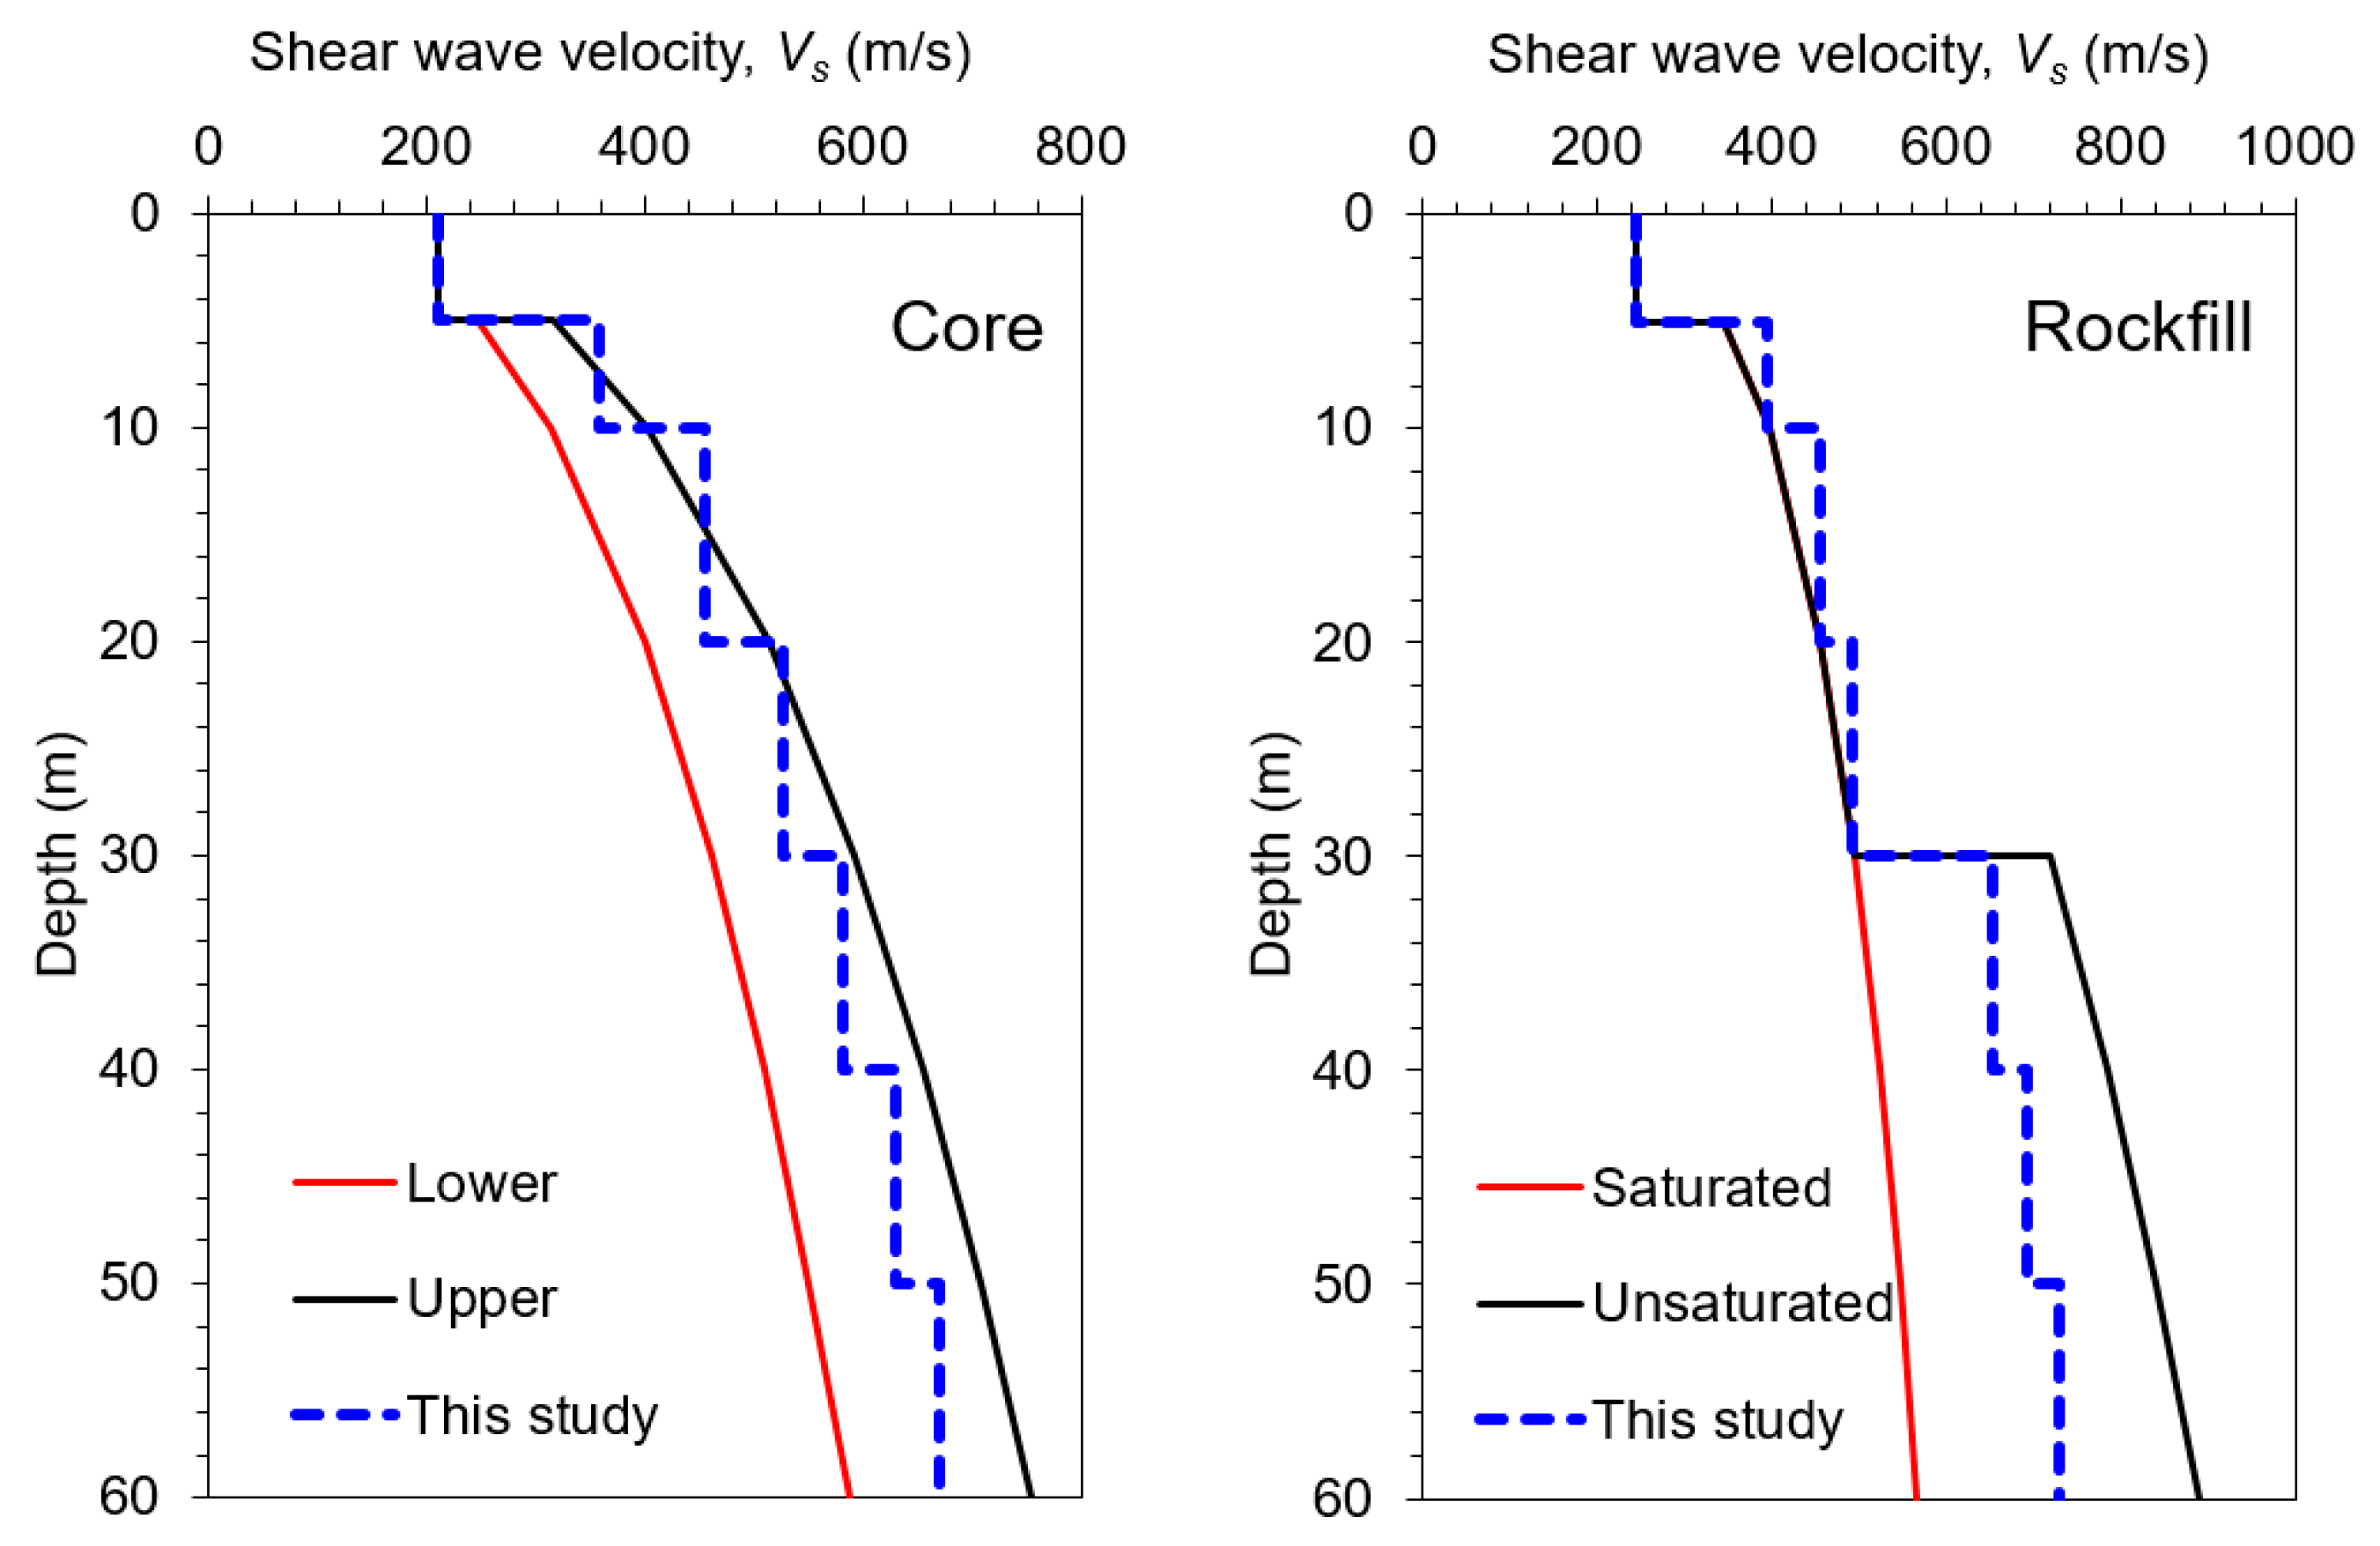
A series of 2D dynamic analyses was performed using the finite difference analysis program FLAC2D (Fast Lagrangian Analysis of Continua in two dimensions), Version 7.0 [5] to calculate the settlement at the crest of an ECRD. The baseline numerical model of the ECRD is shown in Figure 1. The dam was 60 m and 260 m in height and width, respectively. The dimensions of the dam were assigned based on actual ECRDs constructed in Korea. The upstream and downstream slopes were set to 1:2.2 and 1:2.0, respectively. The slope of the core was set to 1:0.2. The thickness and width of the soil model below the dam were set to 40 m and 400 m, respectively. The shear wave velocity profiles of the rockfill and core sections were constructed from the empirical shear wave velocity equations of Sawada and Takahashi [6], as shown in Figure 2. The core profile lay between the lower and upper bounds of Sawada and Takahashi’s [6] equations for the core. The rockfill profile also fell between the saturated and unsaturated rockfill profiles of Sawada and Takahashi [6]. The applicability of the empirical equations of Sawada and Takahashi [6] was confirmed using geophysical measurements [7] and inversion analysis results derived from artificial blast recordings [8]. Table 1 lists the properties used for the rockfill and the core. For the underlying foundation soil, the shear wave velocity was set at 1100 m/s.
The nonlinearity of the soil was reported to play an important role in the seismic response of slopes [9]. The Sig3 model, which is one of the most widely used nonlinear soil models among those included in the library of FLAC2D, was used to simulate the nonlinear behaviors of the rockfill and the core. The Sig3 model was defined as follows:
where Ms is the secant shear modulus, L is log(γ), and xo, a, and b are curve-fitting parameters. Sig3 was used in a number of studies to represent the nonlinear soil response under seismic loading [9,10,11,12,13]. The parameters for the Sig3 model were selected to match the plastic index (PI) = 0 curves of Darendeli [14] in the middle of each soil layer. The Mohr–Coulomb model was used with the Sig3 model to simulate plastic deformation, which is induced at large shear strains. The small strain damping was modeled via the Rayleigh damping formulation, which was defined as follows [15]:
where [C] is the damping matrix, [M] is the mass matrix, [K] is the stiffness matrix, and α and β are the Rayleigh coefficients that determine the frequency dependence of the damping formulation. These coefficients were defined as follows [15]:
where ξ is the damping ratio. The formulation matched the target damping ratio only at the frequencies of fm and fn. In the analyses, the 1st and 5th modes were used, as recommended by Lee et al. [9].
FLAC2D used the mixed discretization scheme to subdivide each quadrilateral element into two overlaid constant-strain triangle elements. It was reported that the mixed scheme accurately modeled the plastic collapse load [16]. Free-field boundary conditions were applied to the lateral boundaries to absorb reflected waves. The viscous damper proposed by Kuhlemeyer and Lysmer [17] was applied at the lower boundary to absorb the downward propagating motion. The size of the elements was selected to propagate a minimum of 25 Hz components using the following equation:
where H is the height of the element, fmax is the maximum frequency of the input motion, and Vs is the shear wave velocity.
3. Validation of the Numerical Model
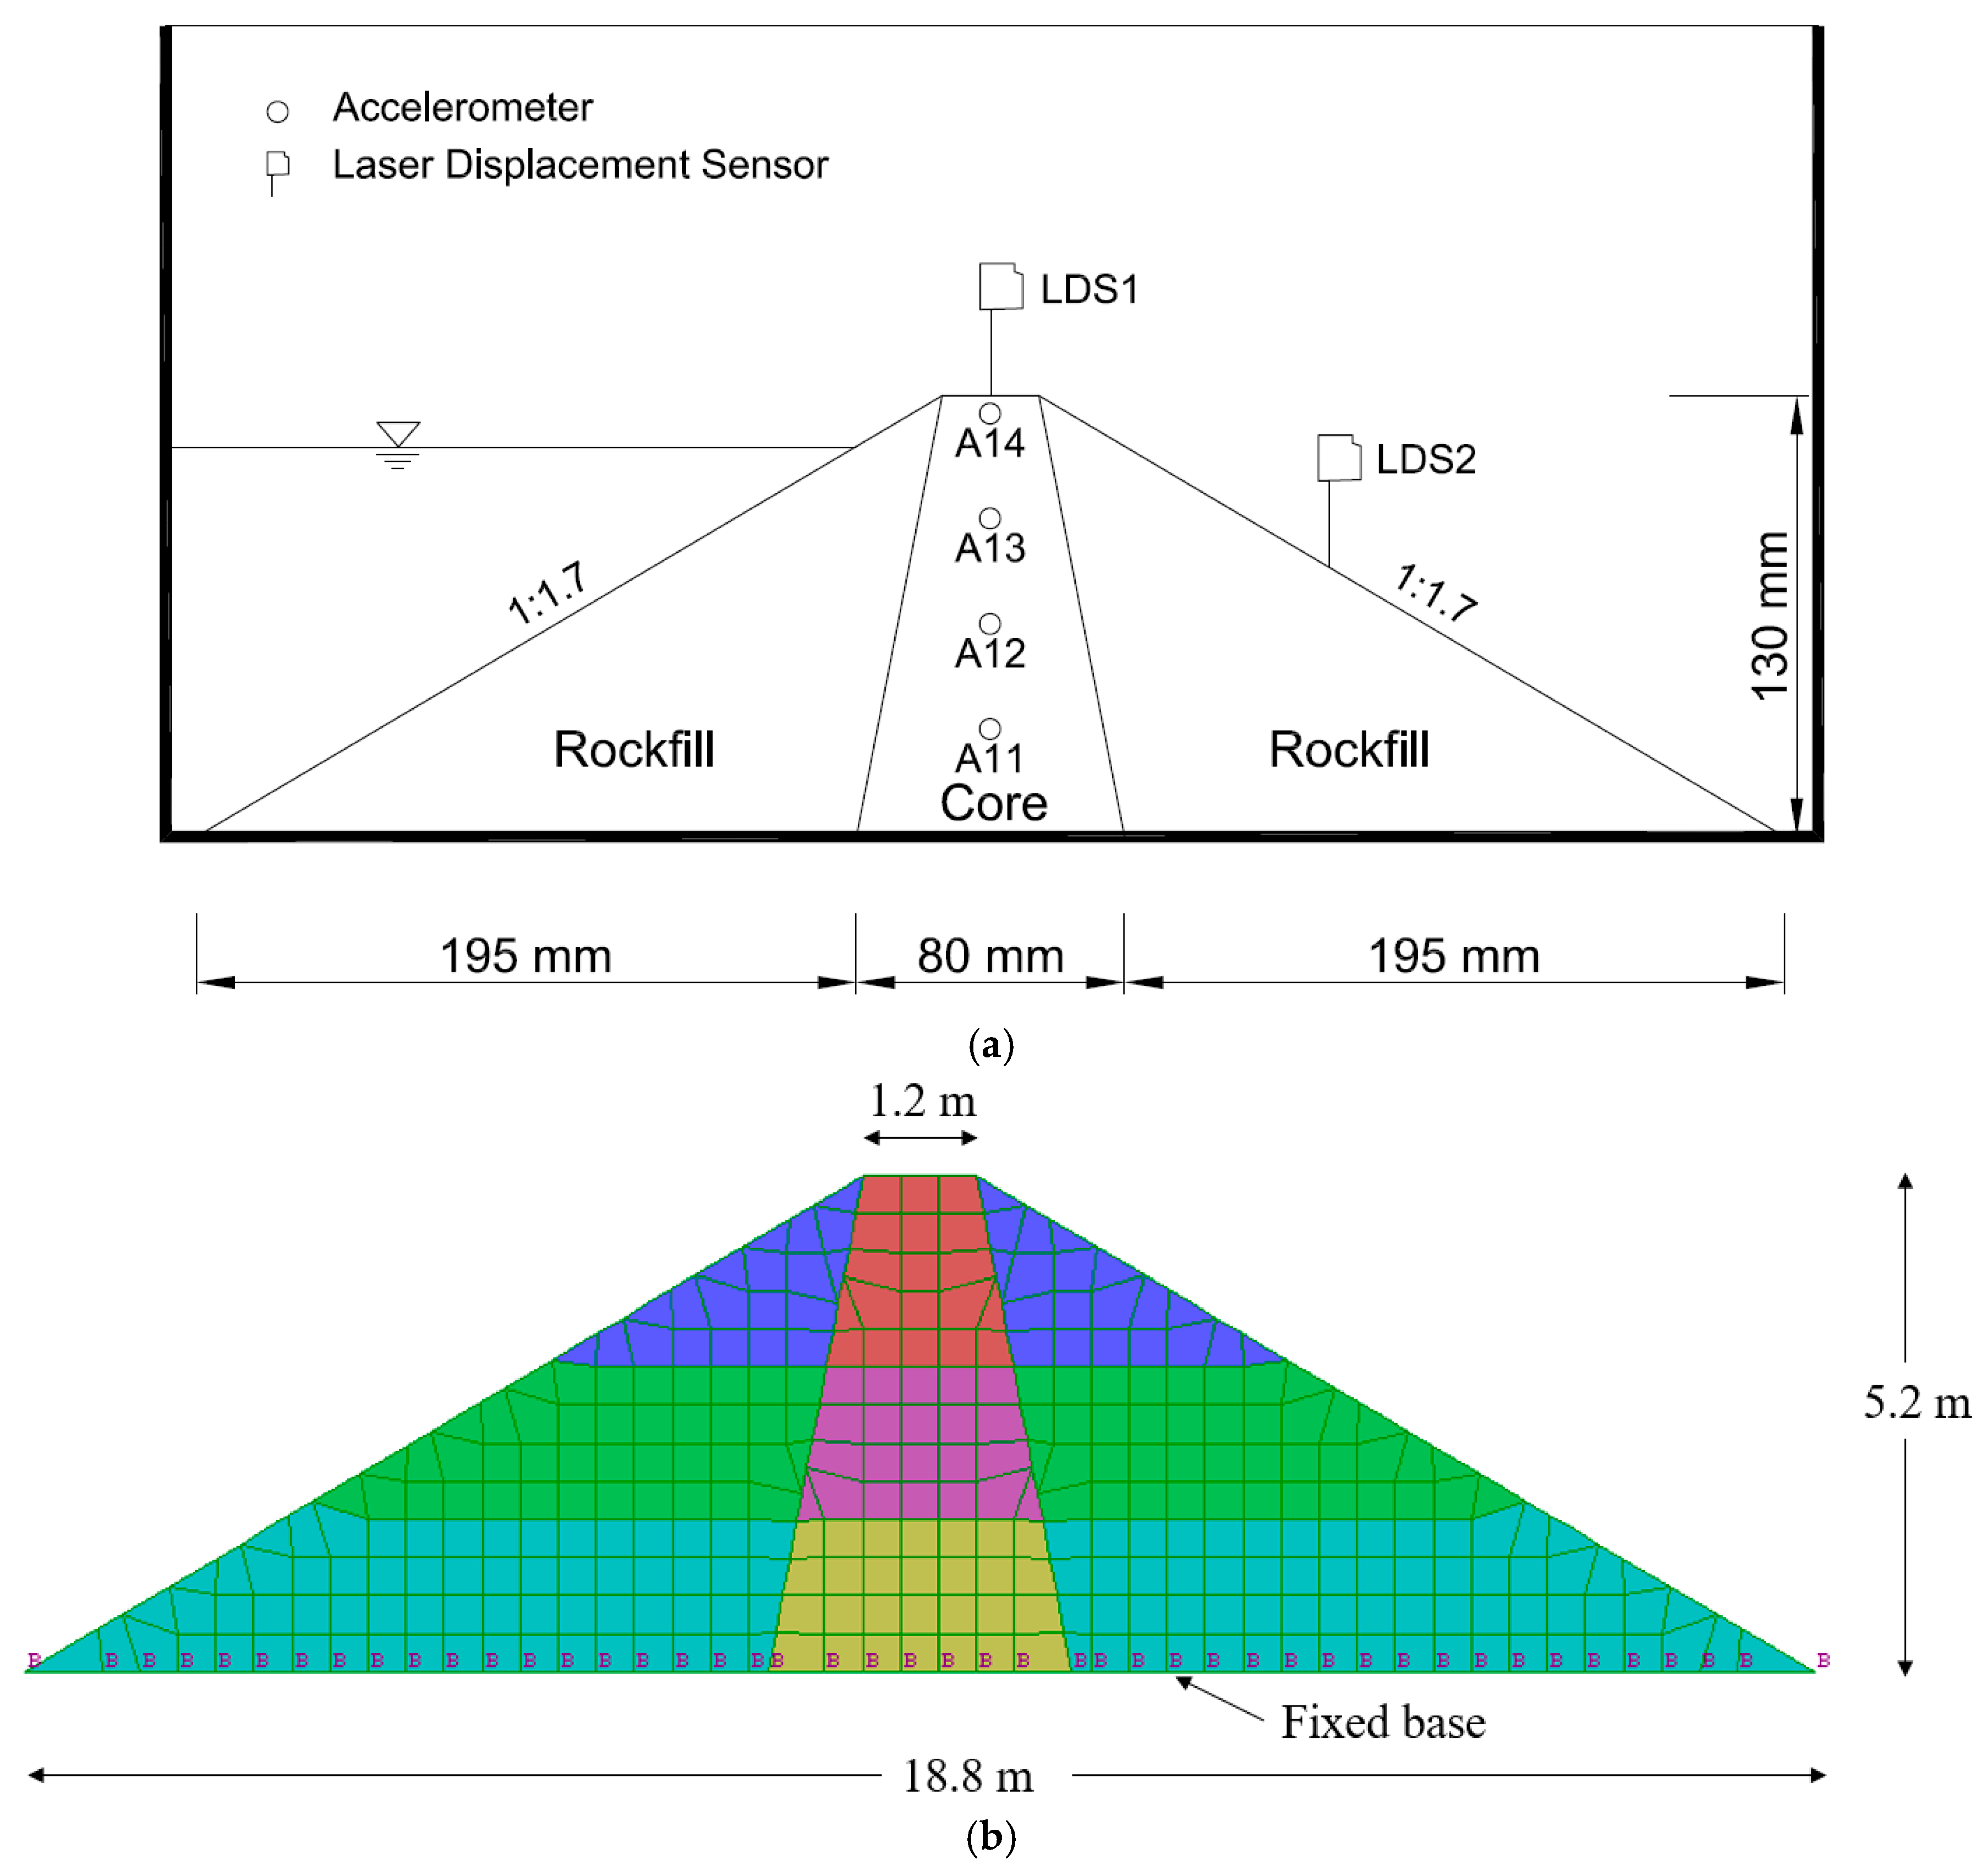
The numerical model was validated against the centrifuge test measurements presented by Kim et al. [18]. The centrifuge model and the corresponding numerical model are shown in Figure 3. The height and width of the ECRD were 5.2 m and 18.8 m, respectively. The model was significantly smaller than an earth core dam, but it was considered to be acceptable for validation purposes [18]. The following pressure-dependent equations reported by Kim et al. [18] were applied to assign the shear wave velocities of the rockfill and core.
where σc is the confining pressure (kPa) and Vs is the shear wave velocity (m/s). The equations were developed to match the resonant column test results of materials used in the centrifuge tests. Triaxial tests with specimens that were 50 mm diameter were also performed to measure the shear strengths. Table 2 lists the properties of the centrifuge model.
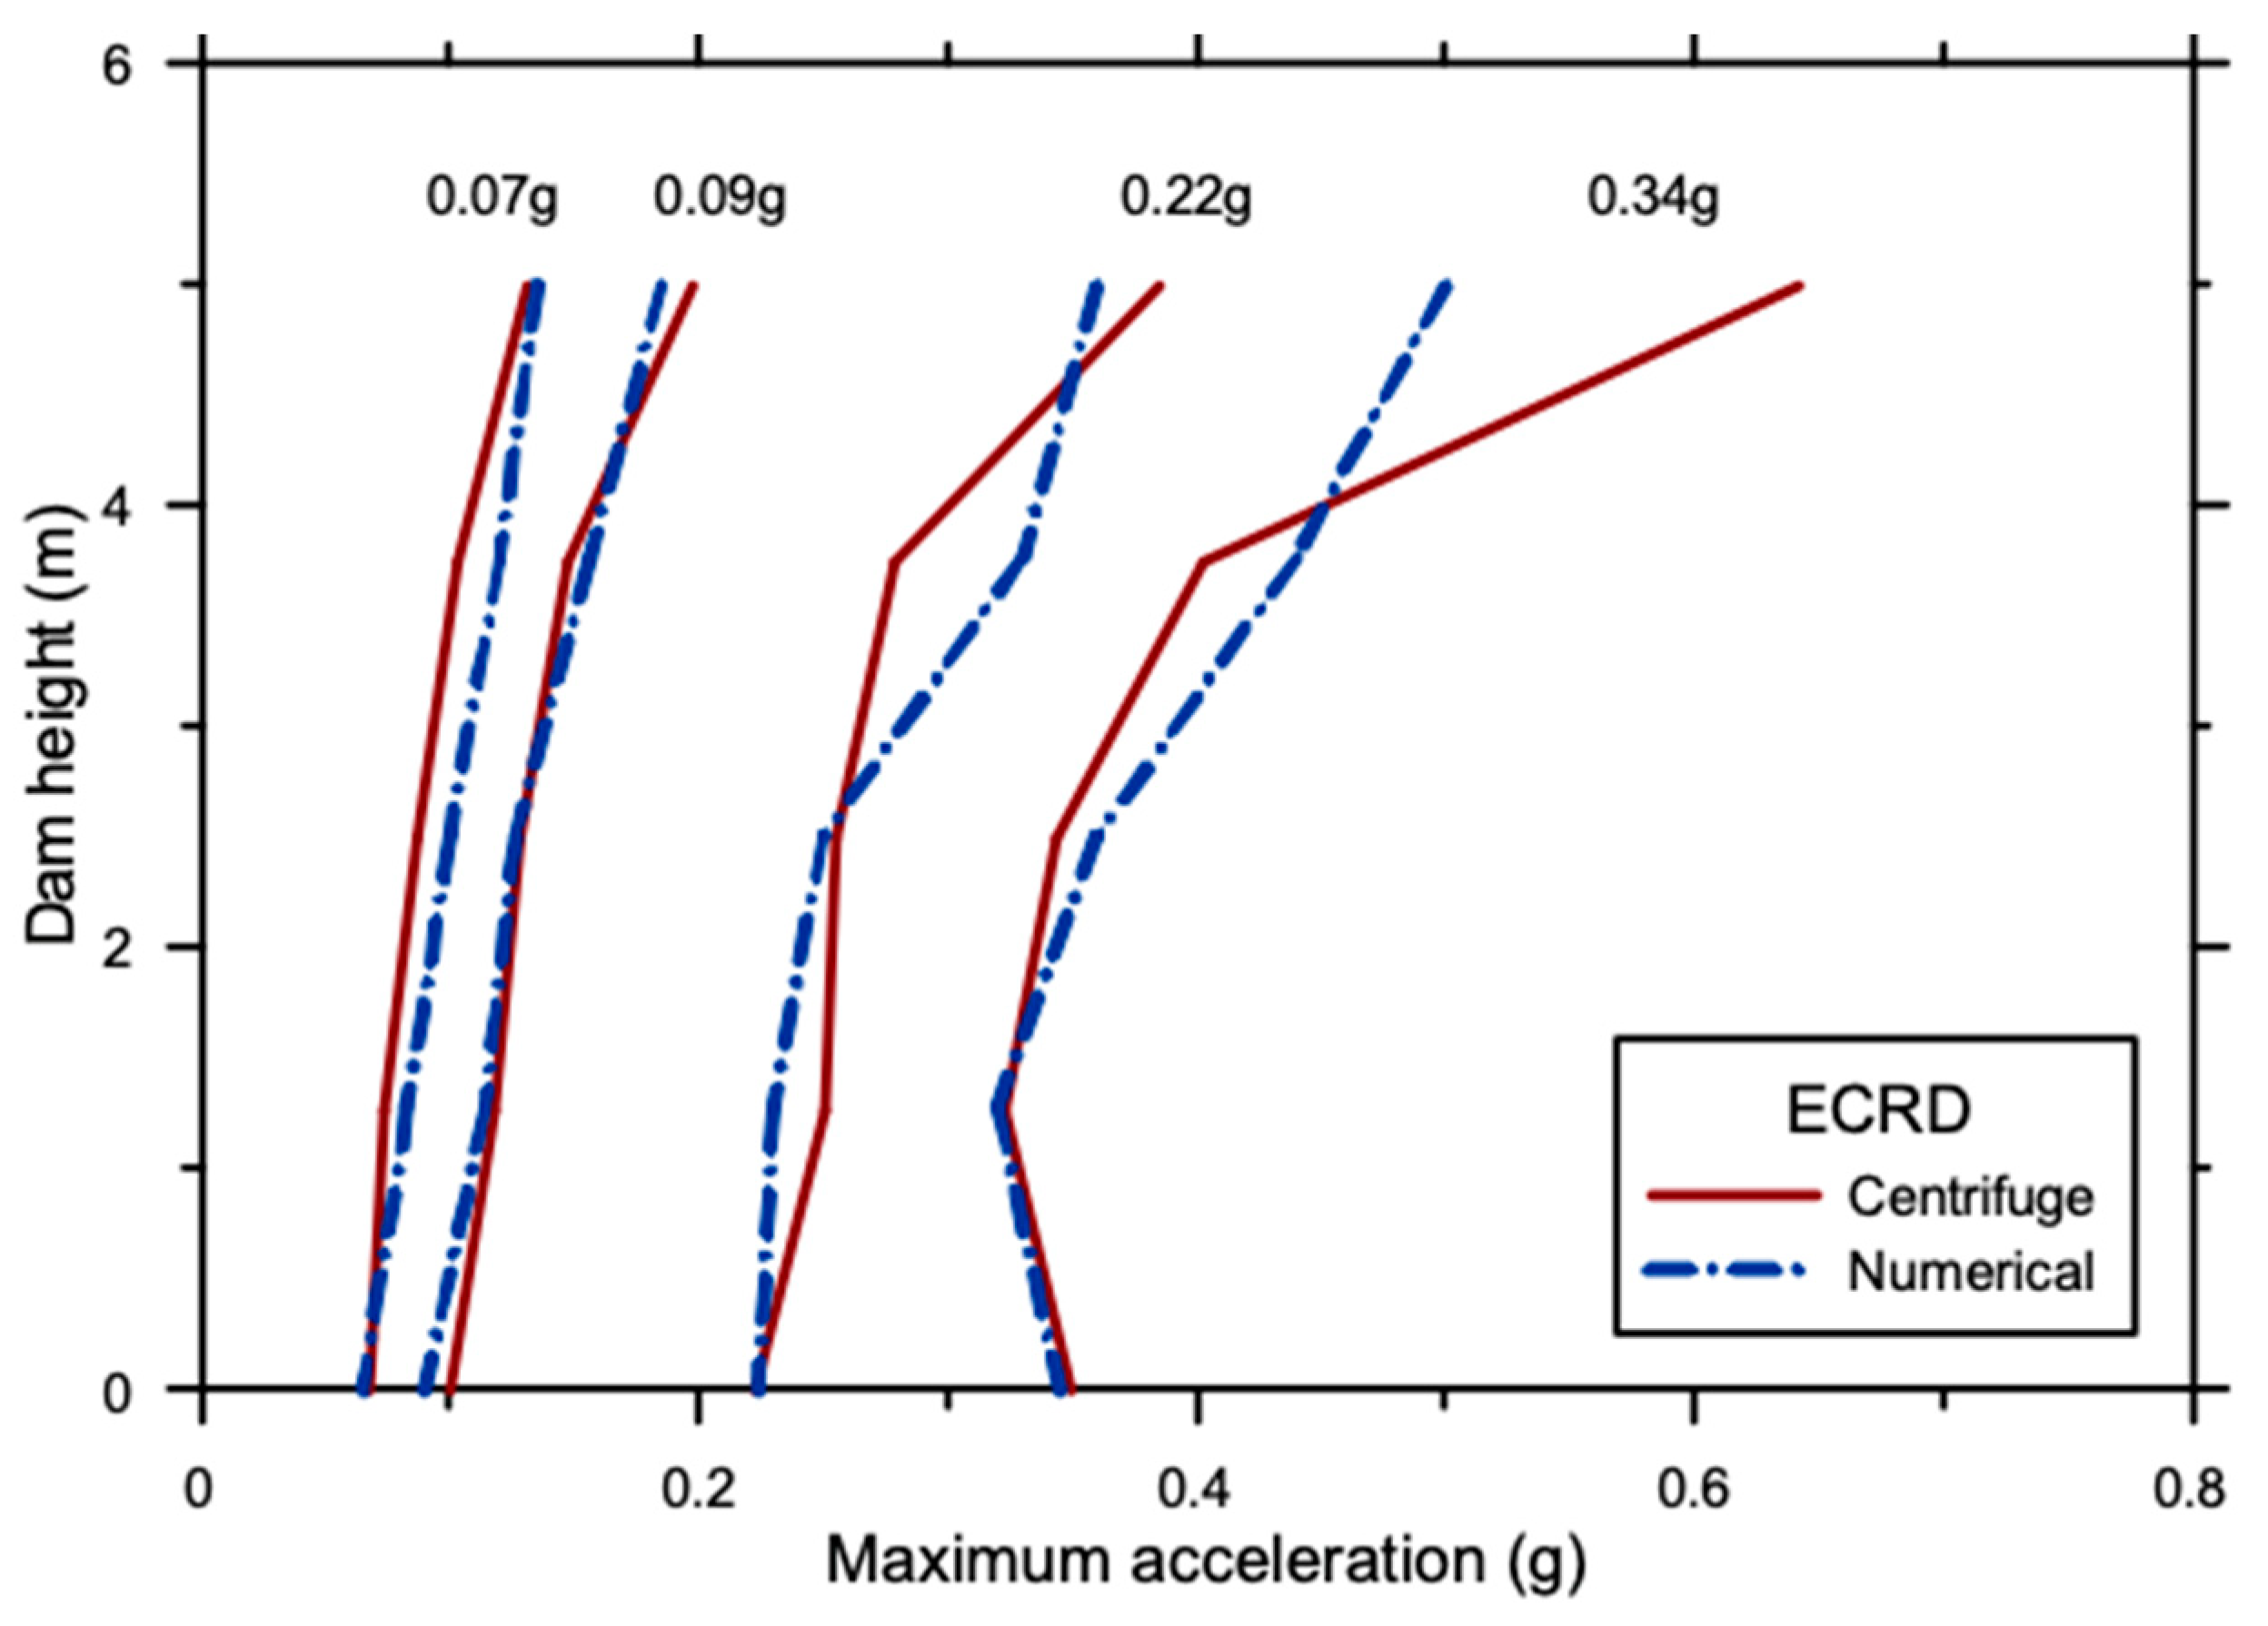
The numerical model was identical to the ECRD model described in the previous section, including the constitutive model, the damping formulation, and the lateral boundary conditions. The fixed condition was applied to the bottom boundary to simulate the rigid boundary of the centrifuge model, whereas the viscous dampers were used at the bottom boundary in the baseline ECRD model. Figure 4 compares the values measured by Kim et al. [18] and the computed PGA profiles from the model defined by this study. The numerical analysis was shown to provide reliable estimates of the dam response. It was therefore concluded that the numerical model could be used to predict the settlement of ECRDs.
4. Crest Settlement Calculations and Correlation with Ground Motion Parameters
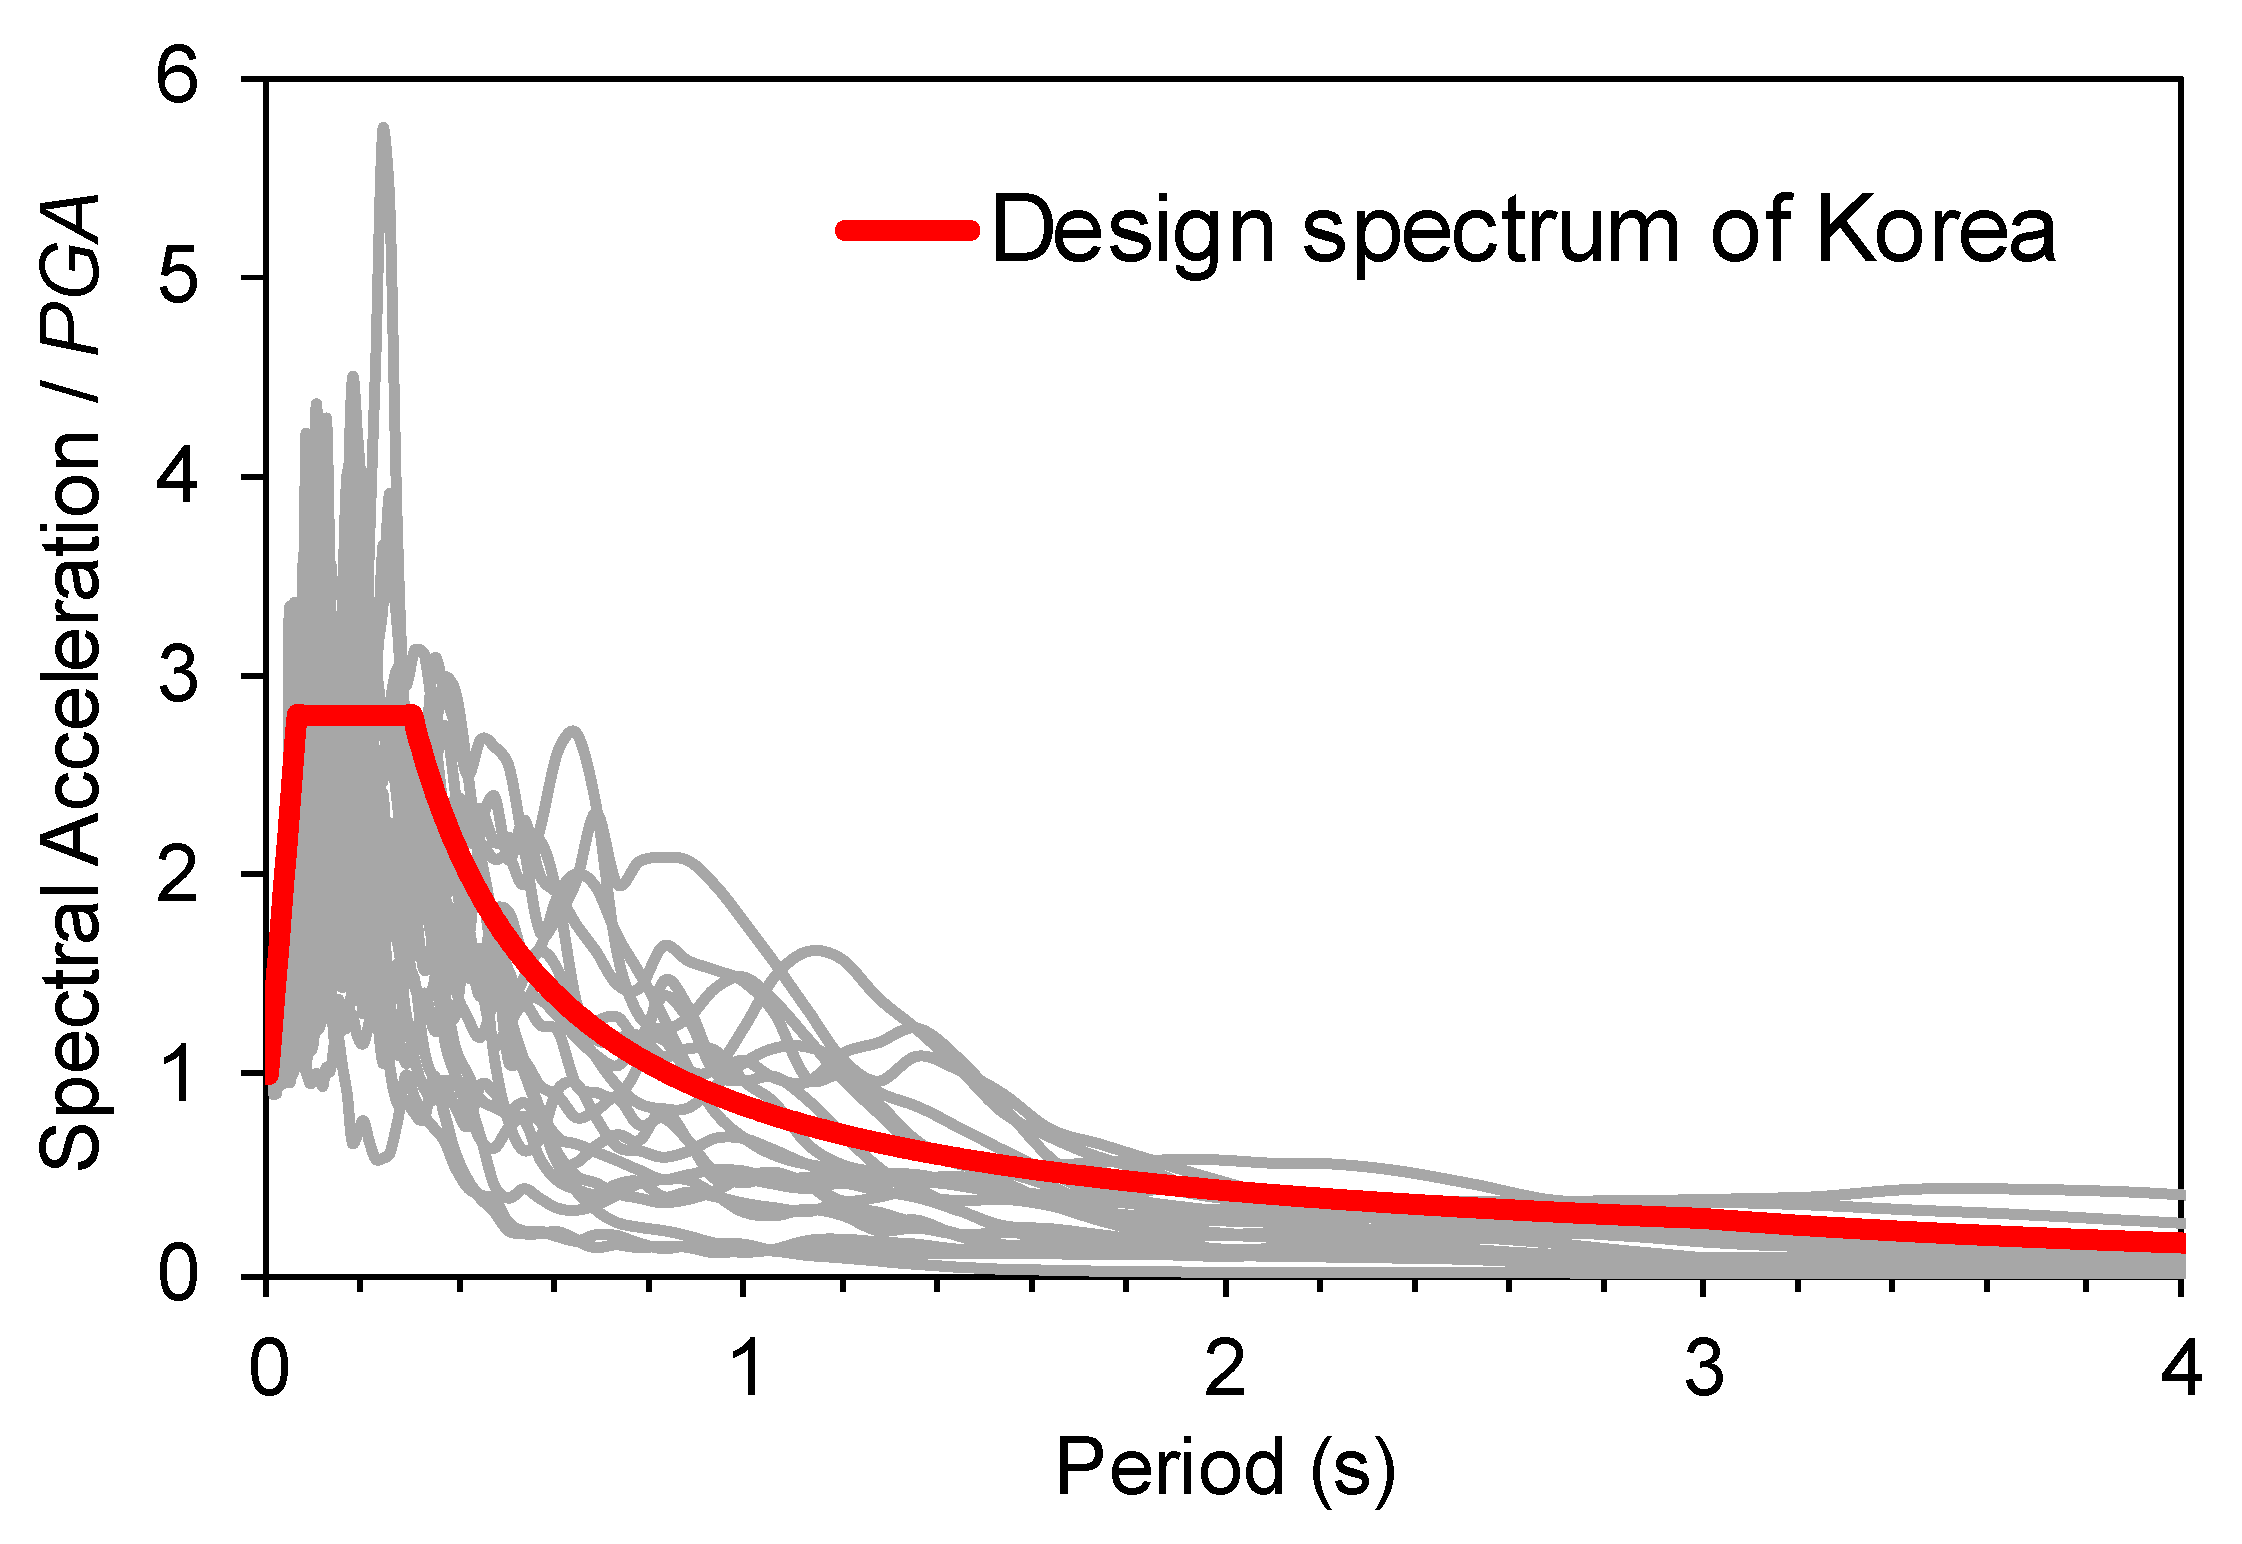
A total of 20 ground motions were selected from the Next Generation Attenuation (NGA-West2) database (https://ngawest2.berkeley.edu/) to perform a suite of nonlinear numerical simulations, from which empirical correlations between the ground motion parameters (GMs) and the crest settlement were developed. Detailed information regarding the respective ground motions, including PGA, peak ground velocity (PGV), and moment magnitude (M), were provided in the NGA-west2 database. These are summarized in Table 3. All 5% damped acceleration response spectra and the design spectrum of Korea [19] normalized to PGA are shown in Figure 5. The motions were imposed at the bottom of the computational domain, as shown in Figure 1.
The crest settlements and settlement ratios were calculated from the dynamic analyses. The settlement ratio was defined as the vertical settlement normalized by the height of the dam. It should be noted that this definition was different from that of Swaisgood [1], where the settlement ratio was defined as the vertical settlement at the dam crest (including the settlement of the dam structure and the underlying soil) divided by the height of both the dam and the underlying soil. Swaisgood [1] used this ratio because the respective settlements of the dam structure and the underlying soil could not be separated from the measured crest settlements. Because the settlement of the underlying soil was highly dependent on the site-specific stratigraphy and also because the foundation soil influenced both the numerator and the denominator, the difference in these definitions may either produce a higher or a lower ratio estimate. In this study, because stiff elastic soil was assumed to underlie the dam, only the calculated settlement in the dam structure was used to calculate the settlement ratio.
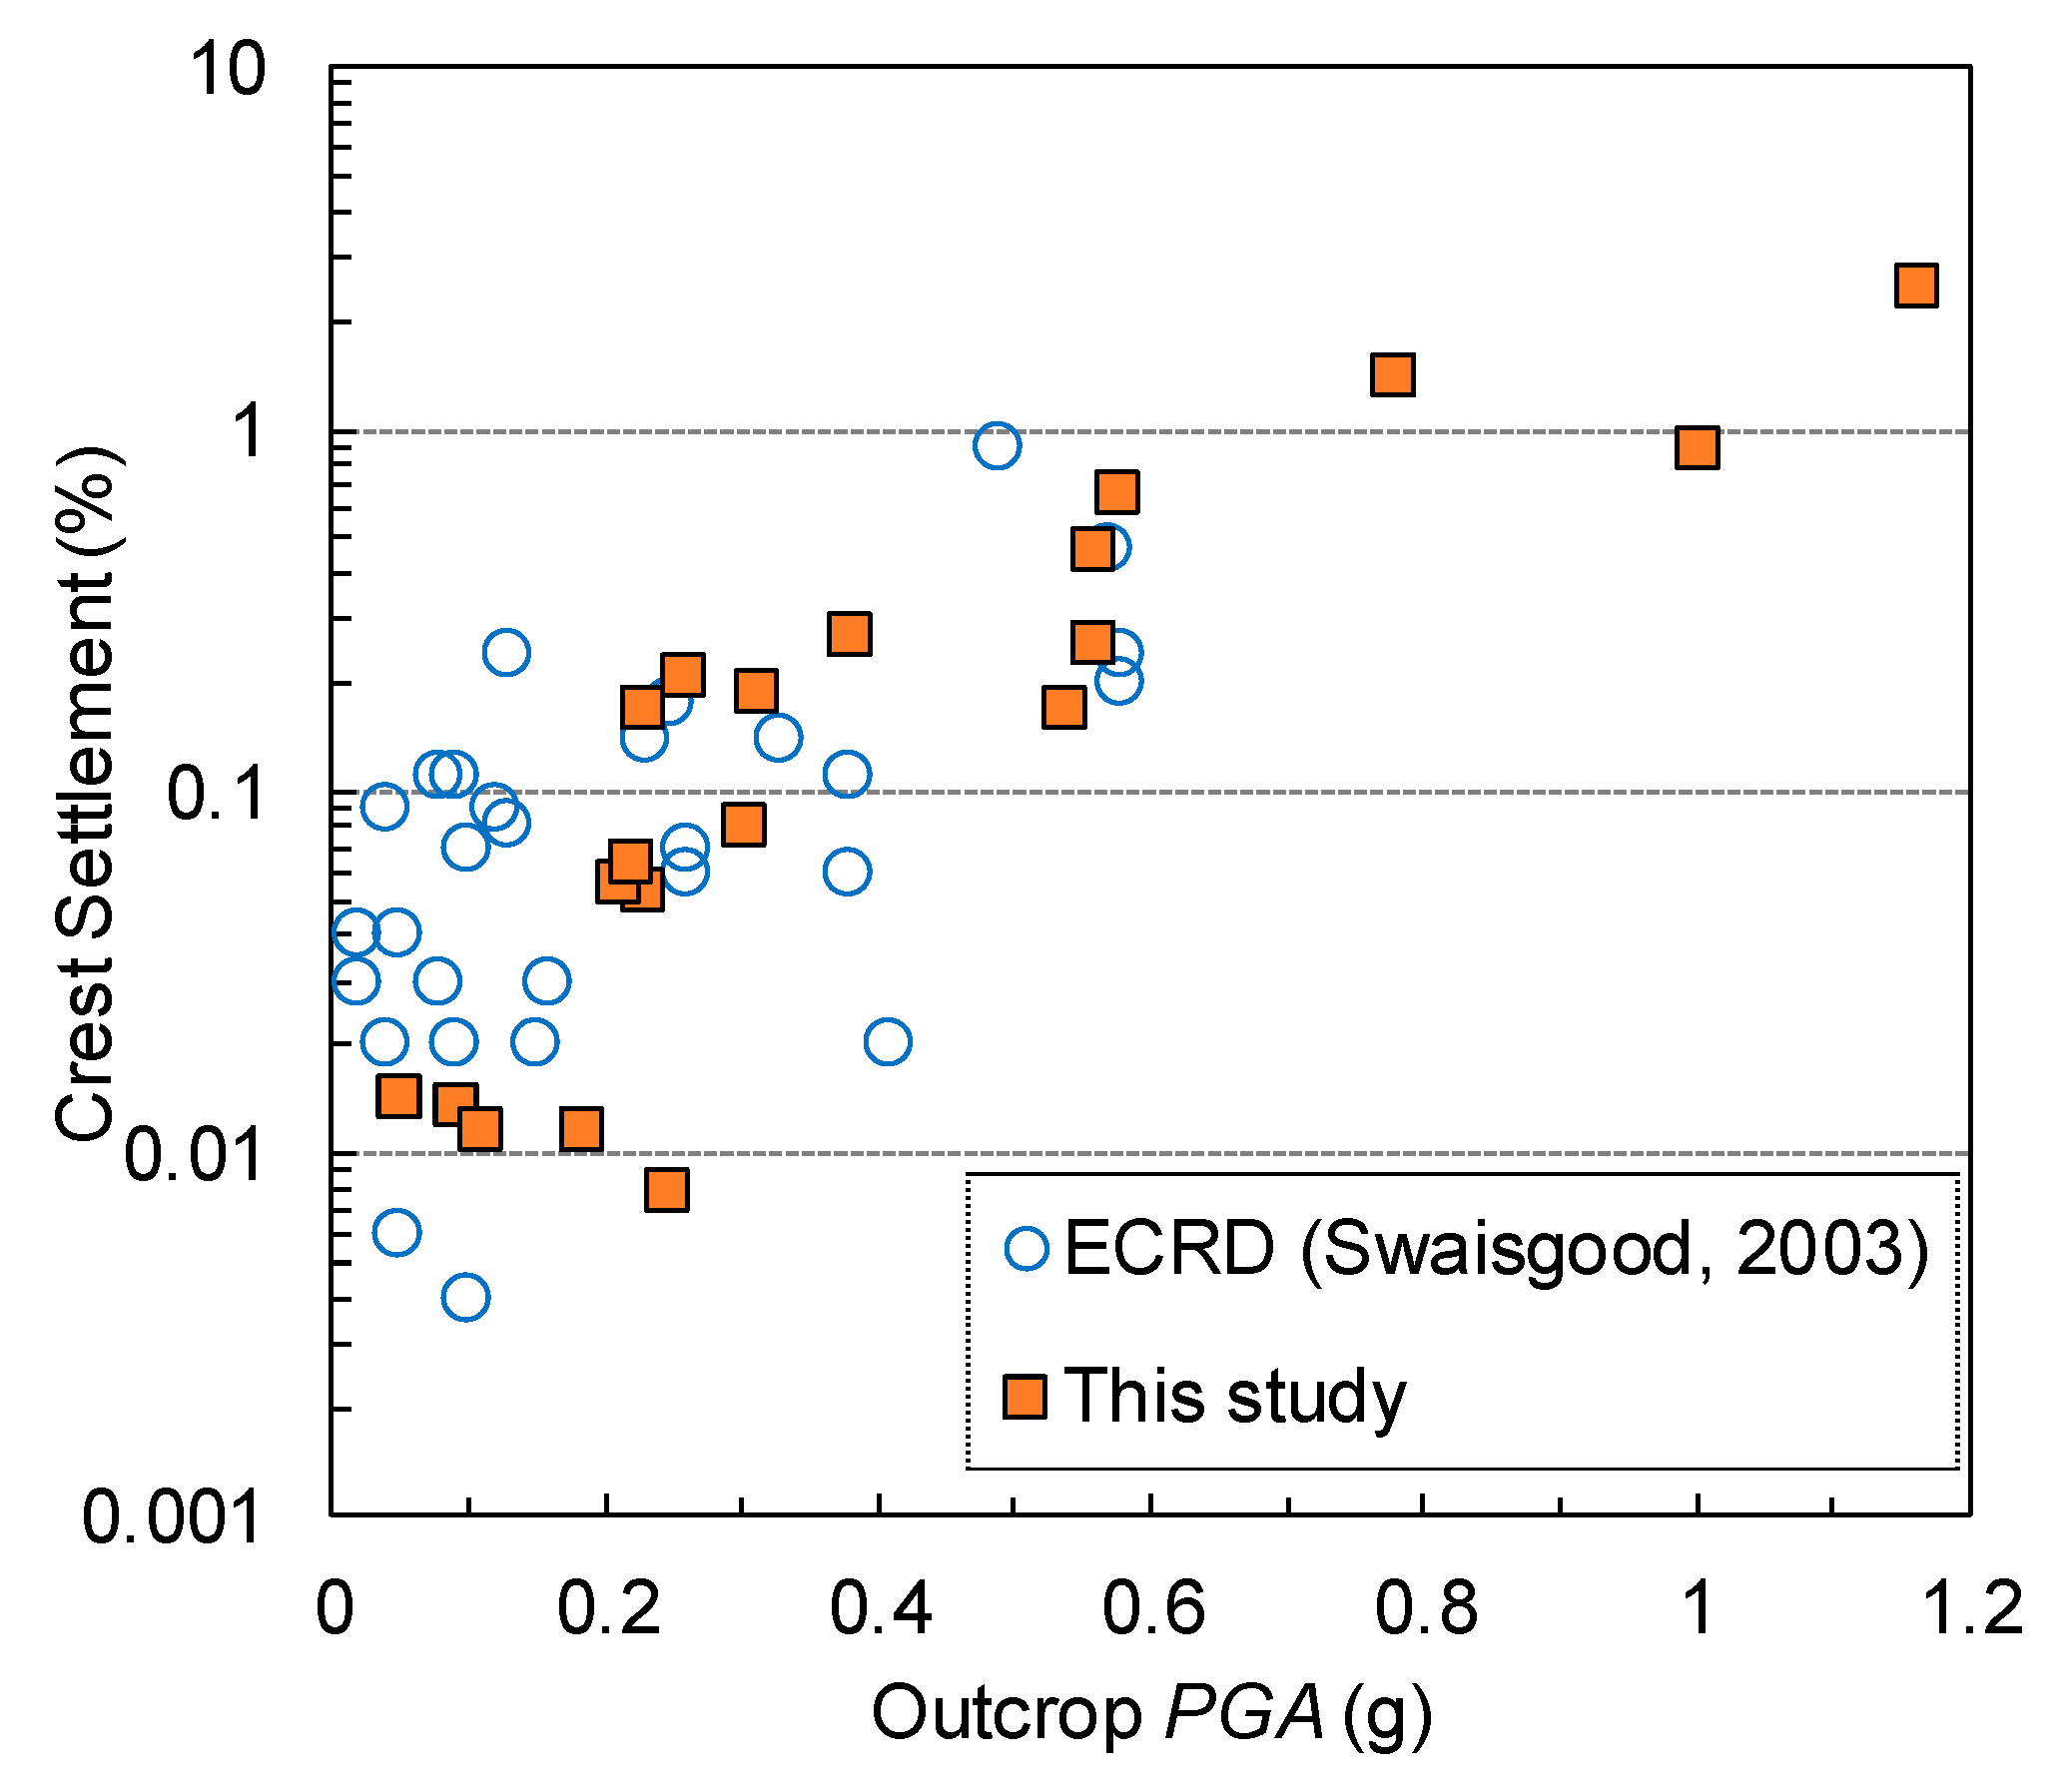
The calculated settlements were compared with Swaisgood’s [1] data in Figure 6. The numerically calculated settlements fell within the range of measured values. The numerical settlements were lower than the measurements at low intensities (free-field PGA < 0.2 g). The differences in the dam dimensions, material properties, and underlying soil profiles may all have influenced the calculated settlement ratio. However, the results were very similar at PGA > 0.2 g. It was therefore further validated that the numerical model provided reasonable estimates of the crest settlement. It also highlighted that the difference in the definition of the settlement ratio did not have a pronounced influence on the calculated results for free-field PGA > 0.2 g. It also demonstrated that nonlinear dynamic analysis could be used as a seismic design tool to predict crest settlement and to evaluate the susceptibility of the dam damage.
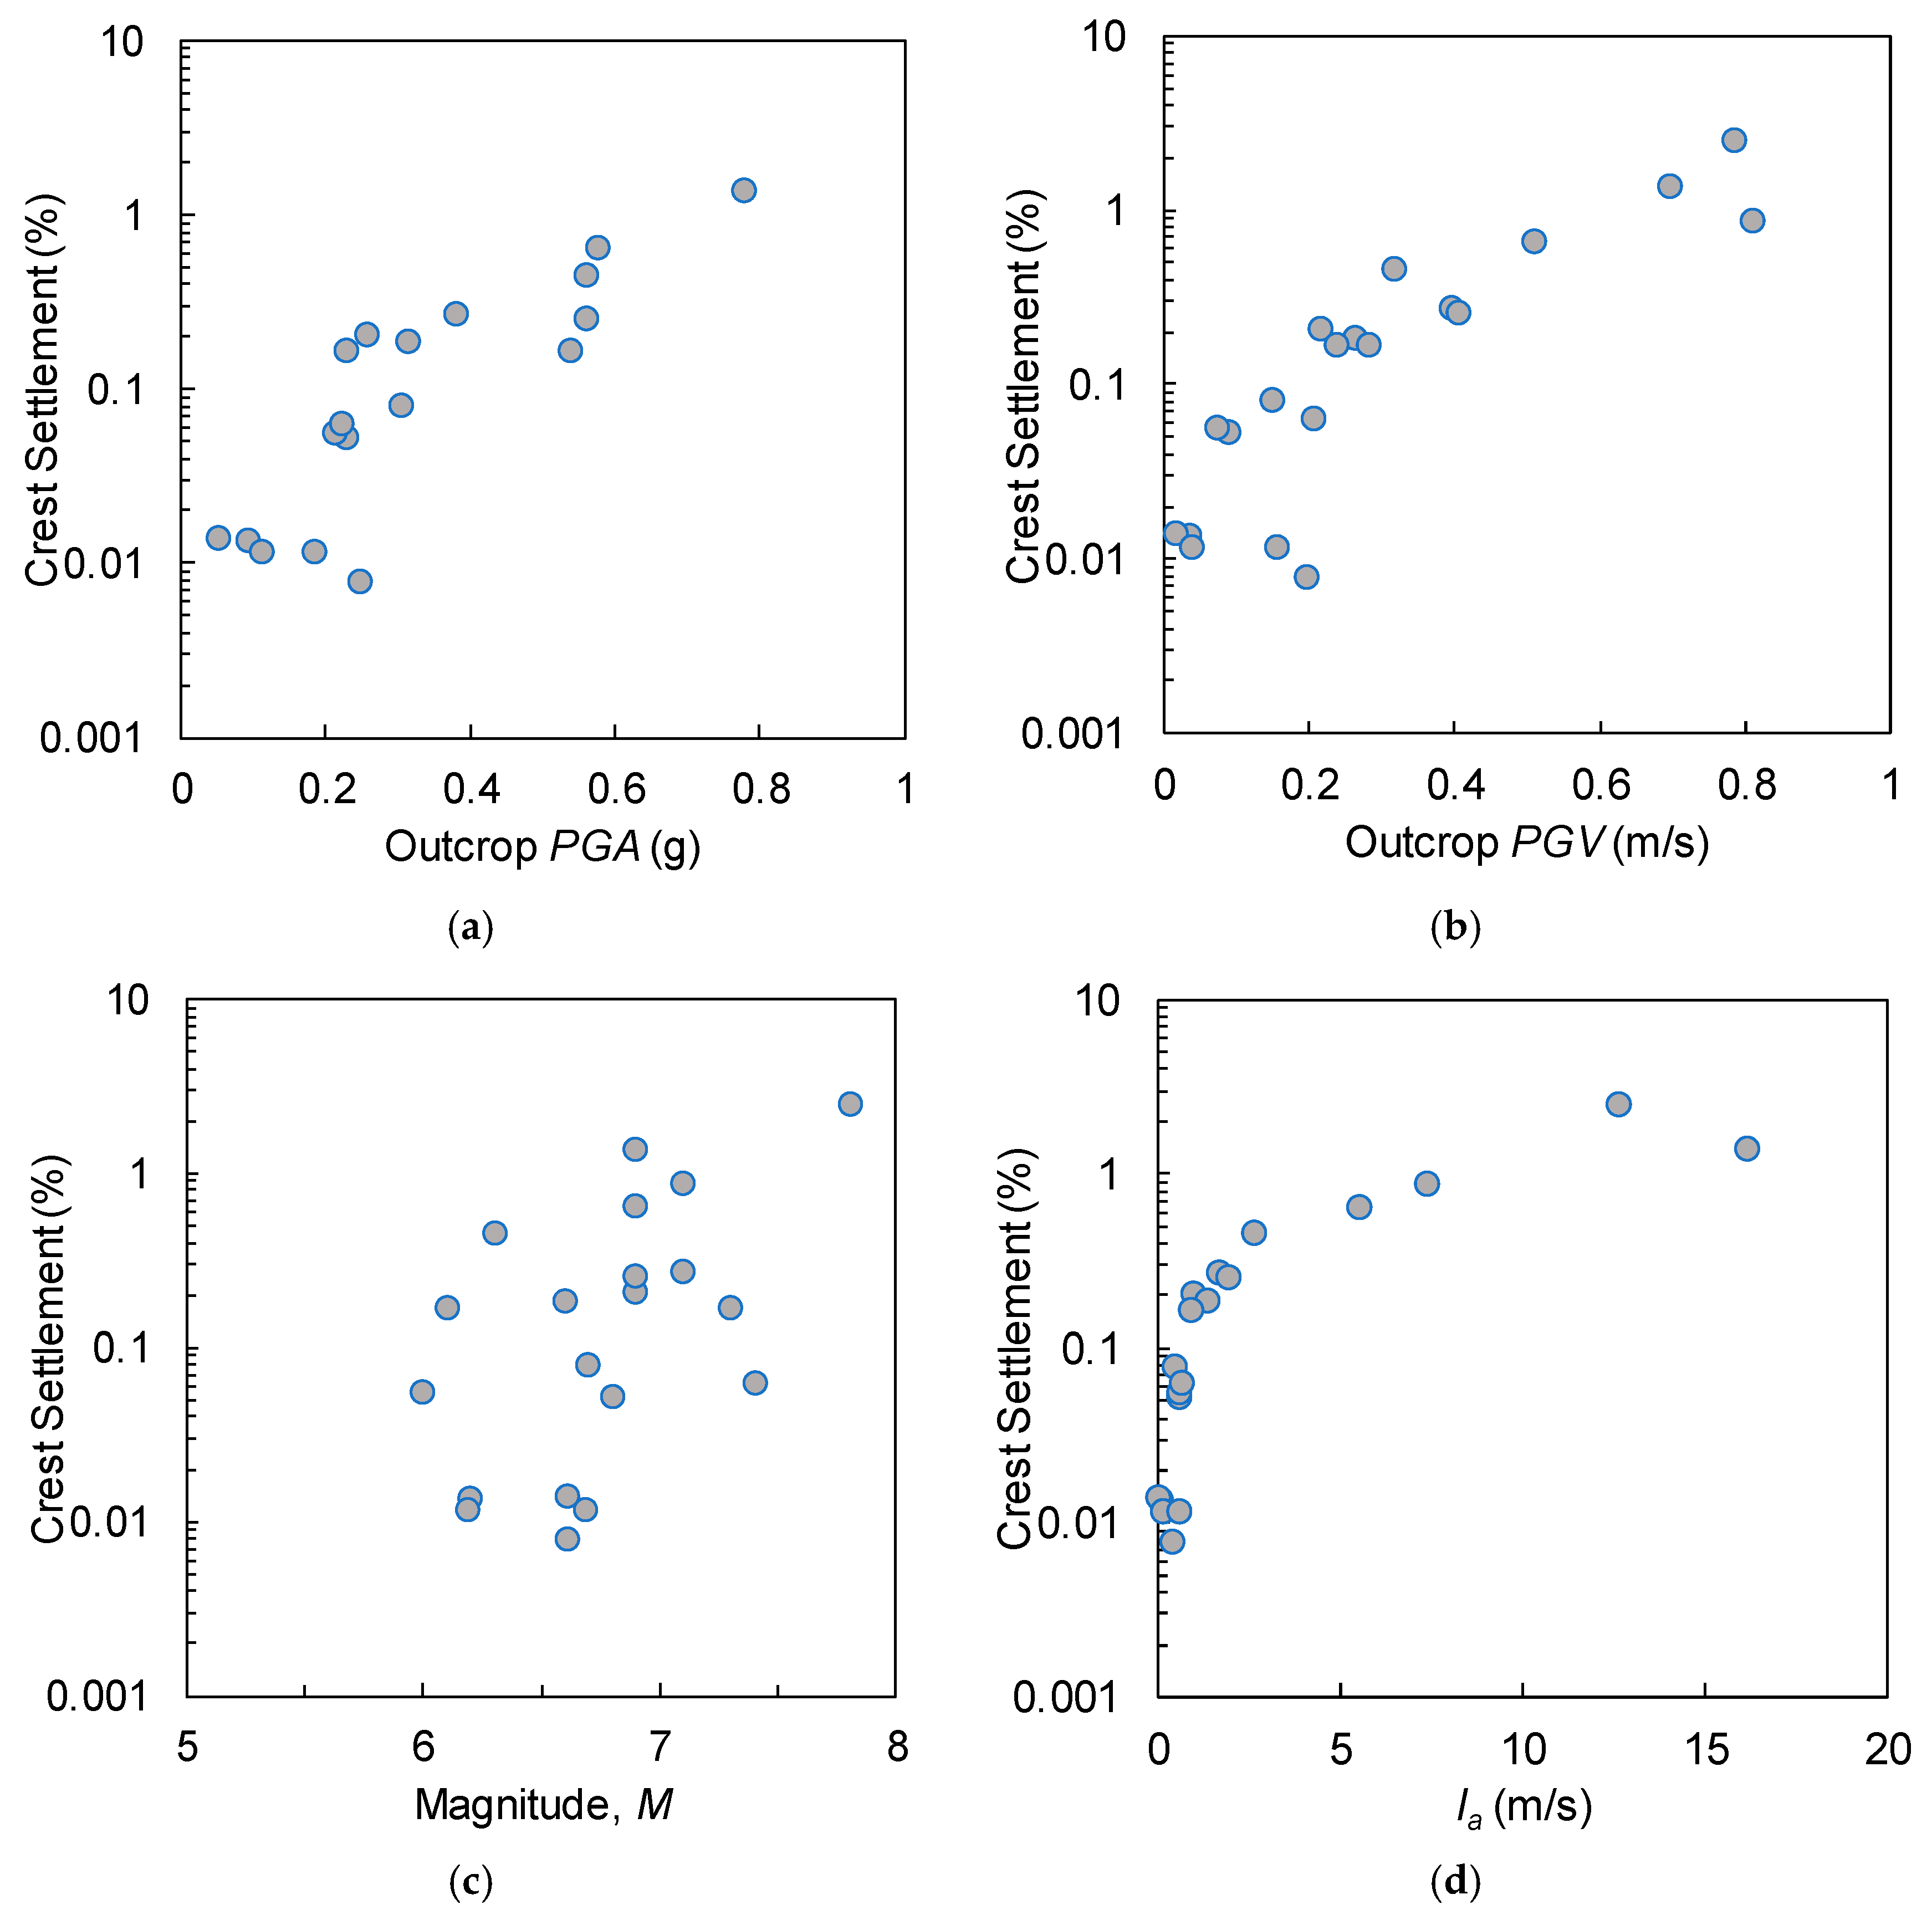
Figure 7 shows the calculated settlement ratios plotted against PGA, PGV, arias intensity (Ia), and M. The multivariate regression analyses were performed to evaluate the goodness of fit. The functional form for the predictive equation of the crest settlement was as follows:
where S is the settlement (%), are the model coefficients, and are the ground motion parameters. The coefficients and parameters are listed in Table 4. Also listed are the R2 for each model. The model coefficients and the coefficient of determination (R2) were calculated using multivariate regression analyses.
Among the four GMs, Ia was revealed to have the strongest dependence on the settlement. For the single-parameter model, Ia was demonstrated to provide the best fit with the calculated settlements, resulting in R2 = 0.82. PGA resulted in the second-best estimate of R2 = 0.77. M was revealed to be positively correlated with the settlement, but produced the lowest R2 of 0.33. The settlement prediction was further improved by using multiple parameters. When using PGA and Ia, the uncertainty was reduced by 10.0% and 5.3% compared with the use of the single parameters PGA and Ia, respectively. The four-parameter model resulted in R2 = 94.1%, which was 12.1% higher compared with the single-parameter model.
5. Conclusions
A series of nonlinear finite difference analyses was performed to calculate settlements at the crest of earth core rockfill dams (ECRDs) subjected to earthquake loading. Before performing the analyses, the numerical model was validated against centrifuge test recordings. The conclusions drawn from this study were as follows.
- The nonlinear model of the dam was demonstrated to provide reliable estimate of the seismic response of ECRDs when compared with the centrifuge test measurements. It was therefore revealed that the nonlinear model was capable of predicting the settlement and could be used for the evaluation of the seismic performance of ECRDs.
- The calculated settlements using twenty ground motions were compared with field recordings. The results compared well with the recordings for peak ground acceleration (PGA) exceeding 0.2 g. It was therefore further validated that the numerical model could be used in the seismic design.
- The settlements were also plotted against ground motion parameters, including the free-field surface PGA, peak ground velocity (PGV), Arias intensity (Ia), and moment magnitude (M). Predictive equations for the crest settlement were also presented. It was demonstrated that PGA provided a good estimate of the settlement. However, Ia provided the most favorable fit with the calculations. Therefore, using the primary parameter to predict the crest was recommended.
Author Contributions
D.P. and K.-C.P. conceived the idea, outlined the work, and reviewed the paper; V.-Q.N. performed numerical analyses and co-wrote the paper; J.-H.K. analyzed the calculated responses and performed multivariate regression analyses; B.-H.C. outlined the scope of the work and reviewed the manuscript.
Funding
This research was supported by Fundamental Technology Development Program for Extreme Disaster Response funded by Korean Ministry Of Interior and Safety (MOIS), grant number 2017-MOIS31-002 and the National Research Foundation of Korea (NRF) grant funded by the Korea government (MEST) (NRF-2019R1A2C1011323).
Conflicts of Interest
The authors declare no conflict of interest.
References
- Swaisgood, J. Embankment dam deformations caused by earthquakes. In Proceedings of the 2003 Pacific Conference on Earthquake Engineering, Christchurch, New Zealand, 13–15 February 2003. [Google Scholar]
- Yang, X.-G.; Chi, S.-C. Seismic stability of earth-rock dams using finite element limit analysis. Soil Dyn. Earthq. Eng. 2014, 64, 1–10. [Google Scholar] [CrossRef]
- Pang, R.; Xu, B.; Kong, X.; Zou, D. Seismic fragility for high CFRDs based on deformation and damage index through incremental dynamic analysis. Soil Dyn. Earthq. Eng. 2018, 104, 432–436. [Google Scholar] [CrossRef]
- Zhang, X.; Zhang, Z.; Wei, Y.; Liang, J.; Hu, J. Examining the seismic stress evolution in the face slab of concrete-faced rock-fill dams using dynamic centrifuge tests. Soil Dyn. Earthq. Eng. 2019, 123, 337–356. [Google Scholar] [CrossRef]
- Itasca Consulting Group. FLAC—Fast Lagrange Analysis of Continua; User Manual, Version7.0; Itasca Consulting Group: Minneapolis, MN, USA, 2011. [Google Scholar]
- Sawada, Y.; Takahashi, T. Study on the material properties and the earthquake behaviors of rockfill dam. In Proceedings of the 4th Japan Earthquake Engineering Symposium, Tokyo, Japan, 26–28 November 1975; pp. 695–702. [Google Scholar]
- Ha, I.S.; Kim, N.R.; Lim, J.Y. Estimation of Shear Wave Velocity of Earth Dam Materials Using Artificial Blasting Vibration Test. J. Korea Soc. Civ. Eng. 2013, 33, 619–629. [Google Scholar]
- Ha, I.-S. Estimation of shear wave velocity of earth dam materials using artificial blasting test. Soil Dyn. Earthq. Eng. 2013, 55, 120–129. [Google Scholar] [CrossRef]
- Lee, J.-H.; Ahn, J.-K.; Park, D. Prediction of seismic displacement of dry mountain slopes composed of a soft thin uniform layer. Soil Dyn. Earthq. Eng. 2015, 79, 5–16. [Google Scholar] [CrossRef]
- Callisto, L.; Ricci, C. Interpretation and back-analysis of the damage observed in a deep tunnel after the 2016 Norcia earthquake in Italy. Tunn. Undergr. Space Technol. 2019, 89, 238–248. [Google Scholar] [CrossRef]
- Lu, C.-C.; Hwang, J.-H. Implementation of the modified cross-section racking deformation method using explicit FDM program: A critical assessment. Tunn. Undergr. Space Technol. 2017, 68, 58–73. [Google Scholar] [CrossRef]
- Sanderson, S.T. Non-Linear Deformation Analysis of an Embankment Dam. Master’s Thesis, Portland State University, Portland, OR, USA, 18 June 2018. [Google Scholar]
- Aliberti, D.; Cascone, E.; Biondi, G. Seismic performance of the San Pietro dam. Procedia Eng. 2016, 158, 362–367. [Google Scholar] [CrossRef]
- Darendeli, M.B. Development of a New Family of Normalized Modulus Reduction and Material Damping Curves. Ph.D. Thesis, University of Texas at Austin, Austin, TX, USA, August 2001. [Google Scholar]
- Chopra, A. Structural Dynamics: Theory and Applications to Earthquake Engineering, 2nd ed.; Prentice Hall: Bergen County, NJ, USA, 2001. [Google Scholar]
- Ziotopoulou, R.W.B.A.K. PM4Sand (Version 2): A Sand Plasticity Model for Earthquake Engineering Applications; Report No. UCD/CGM-12/01; University of California: Davis, CA, USA, 2012; p. 100. [Google Scholar]
- Kuhlemeyer, R.L.; Lysmer, J. Finite element method accuracy for wave propagation problems. J. Soil Mech. Found. Div. 1973, 99, 421–427. [Google Scholar]
- Kim, M.-K.; Lee, S.-H.; Choo, Y.W.; Kim, D.-S. Seismic behaviors of earth-core and concrete-faced rock-fill dams by dynamic centrifuge tests. Soil Dyn. Earthq. Eng. 2011, 31, 1579–1593. [Google Scholar] [CrossRef]
- Ministry of Public Safety and Security (MPSS). Common Application of Seismic Design Criteria; Ministry of Public Safety and Security: Sejong, Korea, 2017. (In Korean)
Figure 1.
2D finite element model of a baseline earth core rockfill dam (ECRD).

Figure 2.
Shear wave velocity profiles of the rockfill and the core.

Figure 3.
The models of ECRD used for validation. (a) Centrifuge model [18] and (b) numerical model of ECRD from this investigation.
Figure 3.
The models of ECRD used for validation. (a) Centrifuge model [18] and (b) numerical model of ECRD from this investigation.

Figure 4.
Comparison of measured peak ground acceleration (PGA) profiles from centrifuge tests and calculated profiles from 2D dynamic simulations.
Figure 4.
Comparison of measured peak ground acceleration (PGA) profiles from centrifuge tests and calculated profiles from 2D dynamic simulations.

Figure 5.
Spectrum of 5% damped response of input motions and the design response spectrum of Korea [19] normalized to the PGA.
Figure 5.
Spectrum of 5% damped response of input motions and the design response spectrum of Korea [19] normalized to the PGA.

Figure 6.
Comparison of crest settlement versus outcrop PGA data of ECRD presented in Swaisgood [1] and this study.
Figure 6.
Comparison of crest settlement versus outcrop PGA data of ECRD presented in Swaisgood [1] and this study.

Figure 7.
Crest settlement plotted against ground motion parameters. (a) PGA, (b) peak ground velocity (PGV), (c) moment magnitude (M), and (d) Arias Intensity (Ia).
Figure 7.
Crest settlement plotted against ground motion parameters. (a) PGA, (b) peak ground velocity (PGV), (c) moment magnitude (M), and (d) Arias Intensity (Ia).


Table 1.
Properties of the dam and foundation soil.
| Layer | Unit Weight (kN/m3) | Friction Angle (o) | Cohesion (kPa) | Poisson’s Ratio |
|---|---|---|---|---|
| Rockfill | 21 | 45 | 0 | 0.30 |
| Core | 20 | 27 | 32.5 | 0.35 |
| Foundation soil | 24 | 50 | - | 0.25 |
Table 2.
Properties of the dam and foundation soil for the centrifuge model.
| Layer | Unit Weight (kN/m3) | Friction Angle (o) | Cohesion (kPa) | Poisson’s Ratio |
|---|---|---|---|---|
| Rockfill | 21.09 | 40 | 2 | 0.30 |
| Core | 21 | 33 | 64 | 0.35 |
Table 3.
Details of input ground motion selected to perform nonlinear dynamic analyses.
| No. | Earthquake Name | Station Name | PGA (g) | PGV (cm/s) | Magnitude, M |
|---|---|---|---|---|---|
| 1 | Nahanni, Canada | Nahanni Station #3 | 0.148 | 6.1 | 6.8 |
| 2 | Loma Gilroy, USA | Gilroy Array #2 | 0.17 | 14.2 | 6.9 |
| 3 | Whittier Narrow, USA | Rancho Palos Verdes | 0.186 | 4.6 | 6 |
| 4 | San Fernando, USA | Pacoima Dam | 0.209 | 18.9 | 6.6 |
| 5 | Northridge, USA | Beverly Hills | 0.217 | 9.8 | 6.7 |
| 6 | Kocaeli, Turkey | Arcelik | 0.218 | 17.7 | 7.4 |
| 7 | Landers, USA | Yermo Fire | 0.244 | 25.7 | 7.3 |
| 8 | Hector, USA | North Palm Spr. | 0.265 | 28.5 | 7.1 |
| 9 | Loma Gilroy, USA | Gilroy Array #3 | 0.357 | 28.6 | 6.9 |
| 10 | Parkfield, USA | Parkfield–Cholame | 0.357 | 21.5 | 6.1 |
| 11 | El Centro, USA | Imperial Valley Distr. | 0.4 | 37.8 | 6.9 |
| 12 | Mammoth Lakes, USA | Long Valley Dam | 0.43 | 23.5 | 6.3 |
| 13 | Duzce, Turkey | Bolu | 0.727 | 56.4 | 7.1 |
| 14 | Kobe, Japan | Nishi–Akashi | 0.509 | 37.3 | 6.9 |
| 15 | Tabas, Iran | Mhud–Bajestan | 0.899 | 55 | 7.8 |
| 16 | Chi-chi, Taiwan | Taiwan | 0.057 | 2.3 | 6.2 |
| 17 | Tottori, Japan | HYG007 | 0.035 | 1.2 | 6.61 |
| 18 | Northridge, USA | Vasquez Rocks Park | 0.15 | 11.1 | 6.69 |
| 19 | Morgan Hill, USA | Gilroy Array | 0.069 | 2.7 | 6.19 |
| 20 | San Fernando, USA | Pasadena, Old Seismo Lab | 0.095 | 5.8 | 6.61 |
Table 4.
Coefficients for the crest settlement prediction model.
| 1-Parameter Model | 2-Parameter Model | 3-Parameter Model | 4-Parameter Model | ||||||||
|---|---|---|---|---|---|---|---|---|---|---|---|
| GM1 | PGA | PGV | Ia | M | PGA | PGA | PGA | PGA | PGA | PGA | PGA |
| GM2 | PGV | Ia | M | PGV | M | PGV | PGV | ||||
| GM3 | M | Ia | Ia | Ia | |||||||
| GM4 | M | ||||||||||
| 1.803 | 2.16 | 0.127 | 0.774 | 1.735 | 1.606 | 0.845 | 2.197 | 0.748 | 1.616 | 2.15 | |
| 0.089 | 0.264 | 0.079 | −0.847 | 0.203 | −1.25 | −2.422 | |||||
| 0.339 | 0.075 | 0.094 | 0.1 | ||||||||
| 0.396 | |||||||||||
| 0.773 | 0.71 | 0.334 | 0.82 | 0.774 | 0.803 | 0.873 | 0.811 | 0.89 | 0.891 | 0.941 | |
© 2019 by the authors. Licensee MDPI, Basel, Switzerland. This article is an open access article distributed under the terms and conditions of the Creative Commons Attribution (CC BY) license (http://creativecommons.org/licenses/by/4.0/).
Share and Cite
MDPI and ACS Style
Park, K.-C.; Nguyen, V.-Q.; Kim, J.-H.; Park, D.; Choi, B.-H. Estimation of Seismically-Induced Crest Settlement of Earth Core Rockfill Dams. Appl. Sci. 2019, 9, 4343. https://0-doi-org.brum.beds.ac.uk/10.3390/app9204343
AMA Style
Park K-C, Nguyen V-Q, Kim J-H, Park D, Choi B-H. Estimation of Seismically-Induced Crest Settlement of Earth Core Rockfill Dams. Applied Sciences. 2019; 9(20):4343. https://0-doi-org.brum.beds.ac.uk/10.3390/app9204343
Chicago/Turabian StylePark, Ki-Chun, Van-Quang Nguyen, Jung-Hyun Kim, Duhee Park, and Byoung-Han Choi. 2019. "Estimation of Seismically-Induced Crest Settlement of Earth Core Rockfill Dams" Applied Sciences 9, no. 20: 4343. https://0-doi-org.brum.beds.ac.uk/10.3390/app9204343
Note that from the first issue of 2016, this journal uses article numbers instead of page numbers. See further details here.