Article

Combined Vertical-Horizontal Flow Biochar Filter for Onsite Wastewater Treatment—Removal of Organic Matter, Nitrogen and Pathogens

by
Sahar S Dalahmeh
1,*,
Almoayied Assayed
2 and
Ylva Stenström
1
1
Department of Energy and Technology, Swedish University of Agricultural Sciences (SLU), 75007 Uppsala, Sweden
2
Water and Environment Centre, Royal Scientific Society, Amman 11941, Jordan
*
Author to whom correspondence should be addressed.
Submission received: 13 October 2019 / Revised: 22 November 2019 / Accepted: 30 November 2019 / Published: 9 December 2019
(This article belongs to the Special Issue Biochar for the Environmental Wastewater Treatment)

Abstract

:
This study investigated the performance of a combined vertical-horizontal flow biochar filter (VFF-HFF) system in terms of organic matter, total nitrogen (Tot-N), Escherichia coli and Salmonella removal and explored the effects of hydraulic loading rate (HLR) on pollutant removal. The combined VFF-HFF system used biochar as the filter medium and comprised two stacked sections: (i) an aerobic vertical flow filter (VFF) in which the wastewater percolated through the biochar medium in unsaturated mode and (ii) a horizontal flow filter (HFF), in which the biochar was saturated with water and had limited access to air, to enable anaerobic conditions and enhance the denitrification process. The system was tested over 126 weeks using real wastewater applied at different HLR (23, 31, 39 L m−2 day−1). The results showed that long-term removal of organic matter in the entire system was 93 ± 3%, with most (87 ± 5%) occurring in the VFF. For Tot-N, the long-term removal was 71 ± 12%, with increasing trends for nitrification in the VFF and denitrification in the HFF. Mean long-term nitrification efficiency in the VFF was 65 ± 15% and mean long-term denitrification efficiency in the HFF 49 ± 14%. Increasing HLR from 23 to 31 L m−2 day−1 increased the nitrification efficiency from 42 to 61%. Increasing the HLR further to 39 L m−2 day−1 decreased the denitrification efficiency from 45 to 25%. HLR had no significant effects on VFF and HFF performance in terms of E. coli and Salmonella removal, although the VFF achieved a 1.09–2.1 log10 unit reduction and the HFF achieved a 2.48–3.39 log10 unit reduction. Thus, long-term performance, i.e., removal of pollutants measured during the last 52 weeks of the experiment, was satisfactory in terms of organic matter and nitrogen removal, with no signs of clogging, indicating good robustness of the combined VFF-HFF biochar filter system.

Graphical Abstract

1. Introduction

Biochar is a carbon produced by thermal decomposition of organic materials at elevated temperature (300–800 °C) in the absence of oxygen [1]. In the wastewater treatment sector, there is growing interest in using biochar as a renewable biofilm carrier and adsorbent to replace or complement sand filters. This is because utilization of biochar for wastewater purification not only increases treatment efficiency and reduces the spread of hazardous contaminants, but also helps to conserve finite natural sands and mountain landscapes and to mitigate climate change effects through carbon sequestration [2,3]. Moreover, exhausted biochar can be easily regenerated by pyrolysis or composting, or used as a soil amendment.
Onsite wastewater treatment systems (OWTS) are defined as systems treating wastewater from single or multiple dwellings [4] and can be installed next to the source of generation [5]. The capacity of onsite systems varies across countries and regulating bodies, ranging from 1000 to 10,000 PE [6]. Systems with a septic tank for primary treatment, followed by a gravity-fed leaching field, infiltration bed or sand filtration bed, are widely used for OWTS, due to their low operating cost, easy maintenance and low energy consumption [7].
There had been much research on designing OWTS for enhanced removal of organic matter and phosphorus, but nitrogen removal in these systems is less well studied. Nitrate (NO3) and pathogen contamination of groundwater and lake water used as drinking water sources has been reported worldwide, with OWTS often cited as the primary source of contamination [8,9,10,11,12,13]. The microbial quality of effluent from OWTS is important. Worldwide, microbial outbreaks have been reported in drinking water wells, bathing waters and fishing waters located close to OWTS facilities [13,14]. For example, in Sweden, 70% of microbial outbreaks in private wells occur in wells located near an OWTS [15]. Therefore, developing OWTS which are capable of removing nitrogen and pathogens, among other pollutants, is particularly critical to protect public health and the environment. In fact, nitrogen removal in OWTS is required to ensure that effluent from such systems is in compliance with treated water quality regulations. Under Swedish regulations, OWTSs in sensitive catchments are required to remove at least 50% of nitrogen in wastewater [16].
The efficiency of single-pass and vertical flow biochar filters in removing solids, organic matter, pathogen indicators and micropollutants from OWTSs has been assessed in previous studies [2,17,18,19,20]. These unsaturated filters are designed to remove organic pollutants, with no consideration to removing nitrogen by denitrification. Utilization of biochar wetlands for removal of nitrogen in treatment of domestic wastewater effluent has been studied [21,22]. For example, Zhou, Wang [22] investigated biological nitrogen transformation in intermittent aerated subsurface-flow constructed wetlands under various influent C/N ratios and reported 97–99% removal of ammonium nitrogen (NH4+-N) and 46–98% removal of total nitrogen (Tot-N). In a study investigating N removal from piggery wastewater using biochar wetlands [23], it was found that biochar adsorbed 60% of NH4+-N, but that absorption was sensitive to changes in particle size, pH and temperature.
There is thus well-established knowledge of nitrification/denitrification, the need for nitrogen removal in OWTS and the potential of biochar for this purpose. However, OWTS incorporating biochar filters as a simple and low-cost technology to remove nitrogen and pollutants and reduce the carbon footprint need to be designed. To our knowledge, no previous study has sought to develop a compact multi-stage biochar filter for enhanced removal of nitrogen in OWTS.
This study assessed the performance of a compact unit for OWTS consisting of a stacked vertical flow filter unit (VFF) and horizontal flow filter unit (HFF), both packed with biochar as the filter medium, in removal of organic matter, nitrogen and pathogens from household wastewater. Specific objectives of the work were to: (i) assess the progress of organic matter degradation, nitrification and denitrification in the combined VFF-HFF biochar filters over an operating period of 126 weeks, (ii) determine the effects of hydraulic loading rate (HLR) on nitrification, denitrification and removal of Escherichia coli and Salmonella spp. and (iii) assess the long-term removal of organic matter, nitrogen and pathogens. The principles of the VFF-HFF biochar filter design are that (1) the large specific surface and high porosity of the biochar and the unsaturated flow mode in the VFF provide a suitable environment for development of aerobic biofilm, where biodegradation of organic matter and nitrification occur; and (2) the saturated flow mode and limited oxygen access in the HFF provide an anoxic environment for denitrification, while the large micropore space in the biochar hosts anoxic microzones to sustain denitrification.

2. Materials and Methods

The combined vertical-horizontal flow biochar filter system we developed comprises two sections (Figure 1). The first of these is an aerobic vertical flow filter (VFF) section, in which wastewater percolates through the biochar medium in unsaturated mode, i.e., the pores in the medium have access to air, encouraging nitrification of NH4-N. The second section in the system is a horizontal flow filter (HFF), in which the biochar is saturated with water and has little access to air, enabling anaerobic conditions to enhance the denitrification process, and hence nitrogen removal from the wastewater.

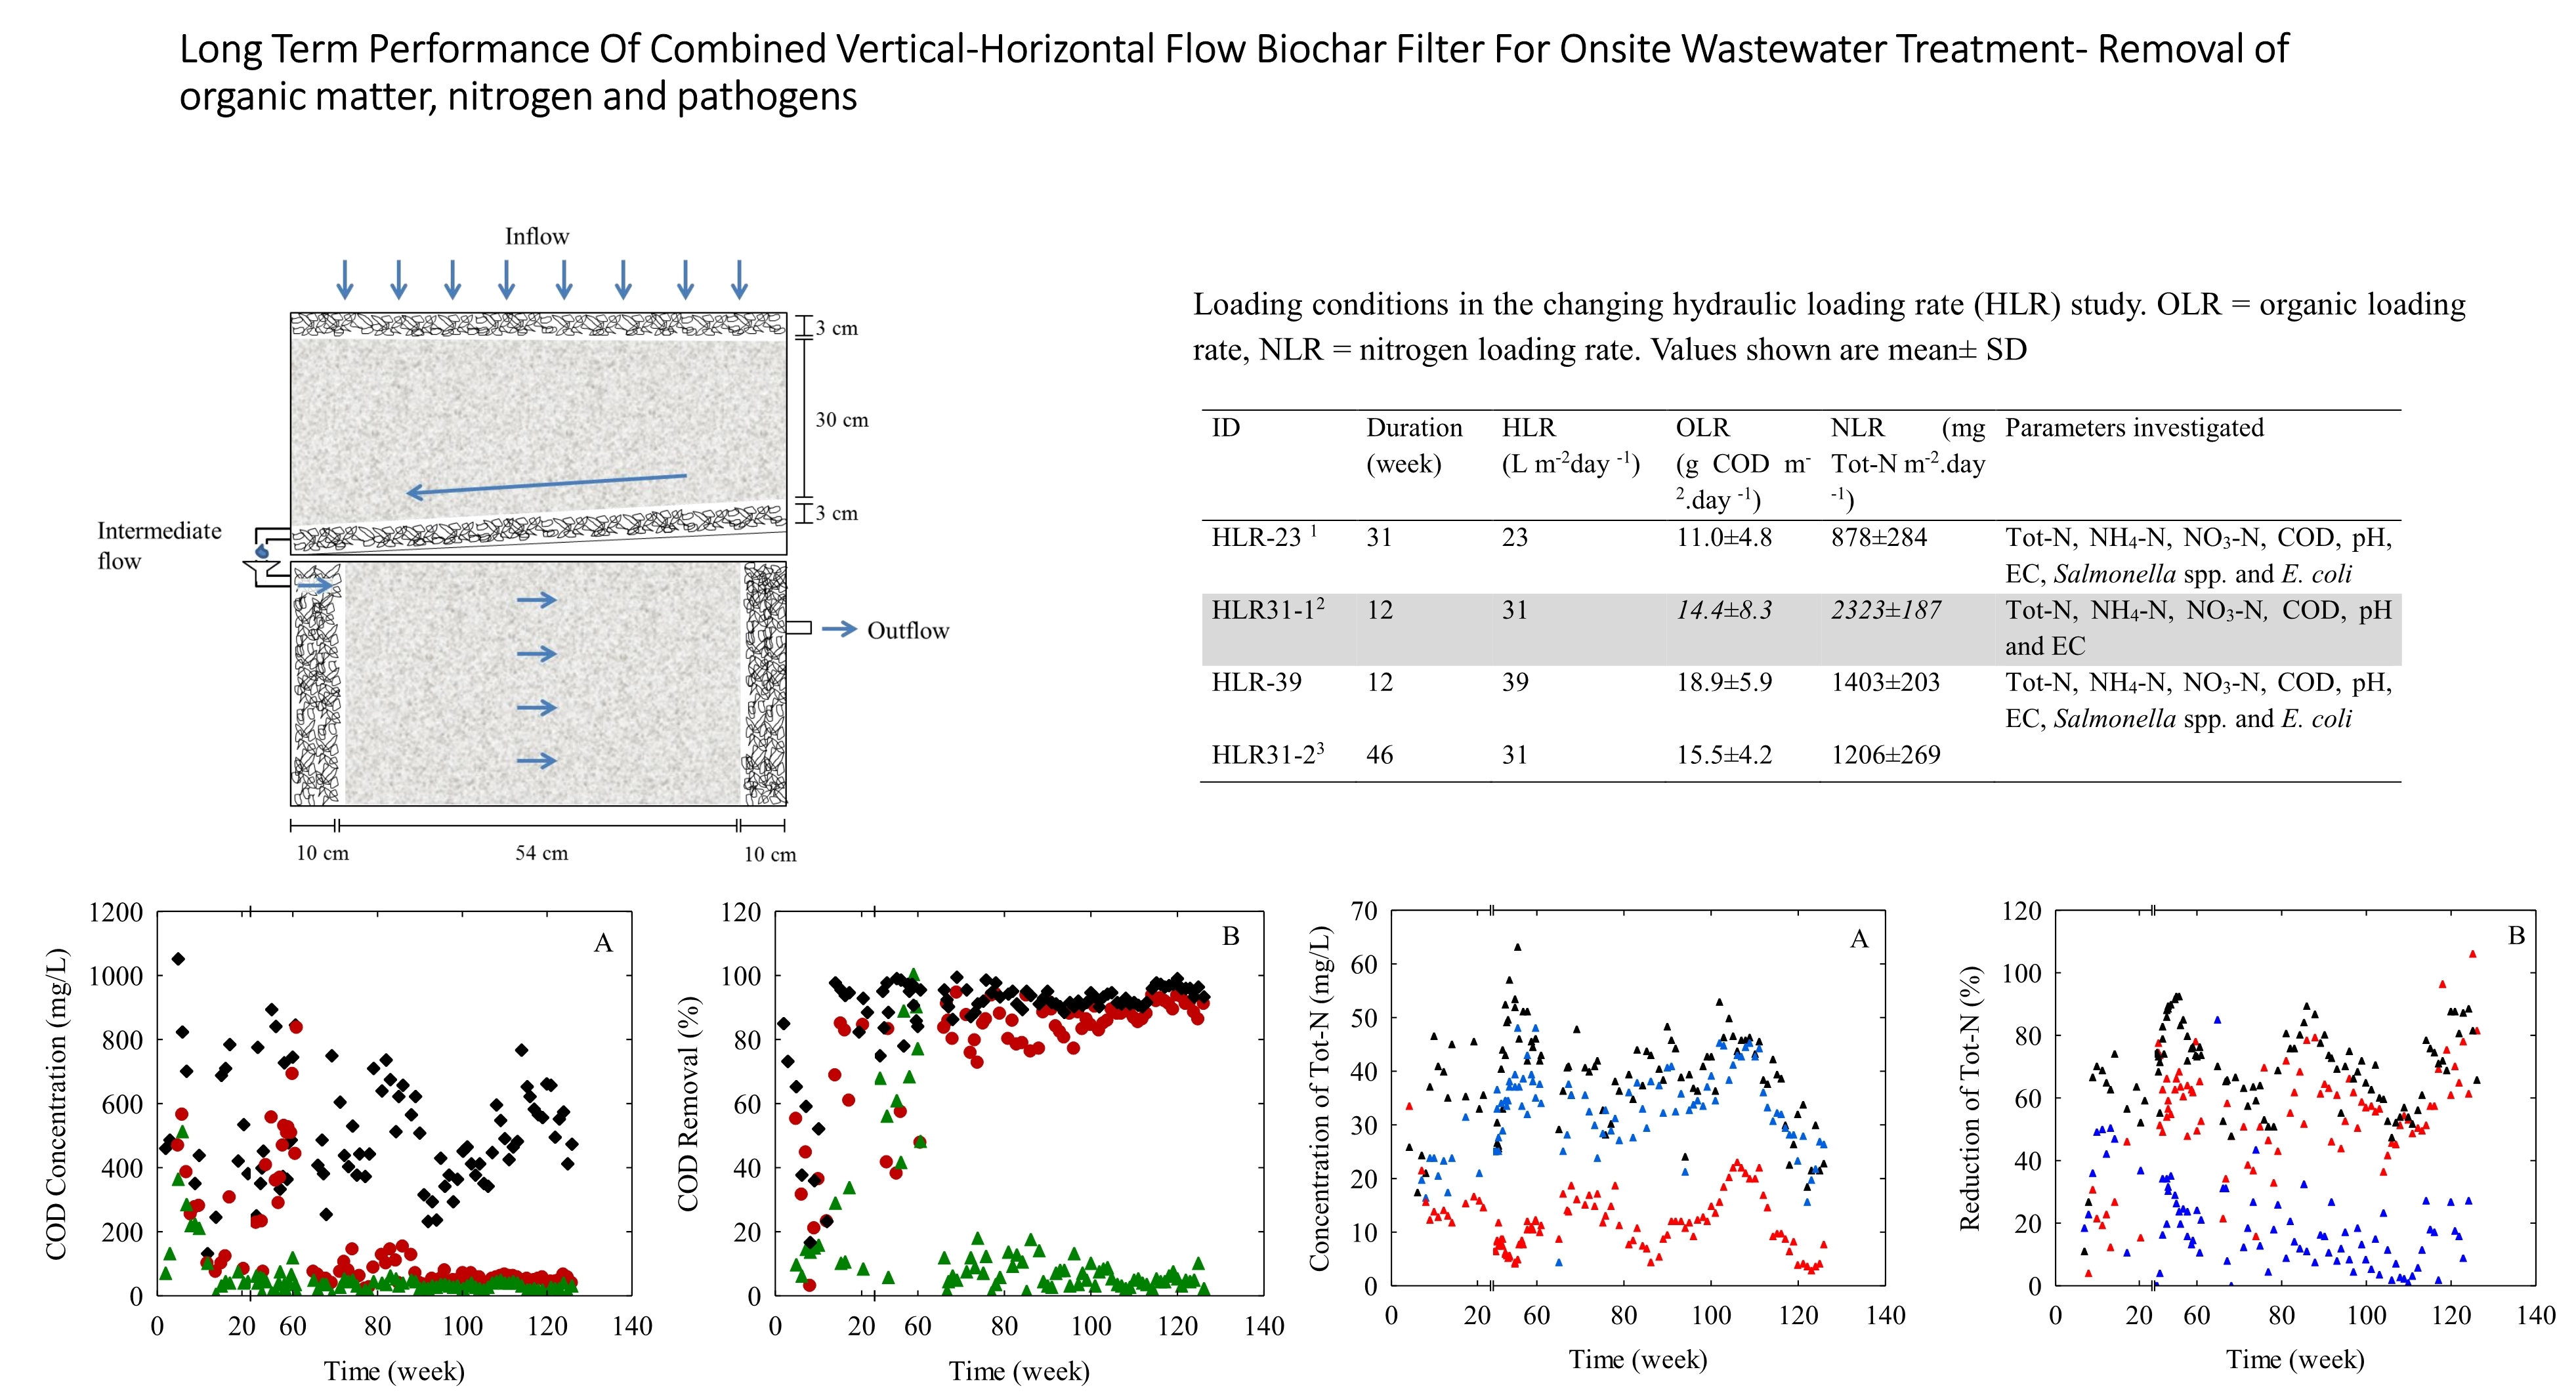
2.1. Experimental Set-up

A VFF-HFF biochar filter was installed and filled with biochar originating from a mixture of pine and spruce wood biomass obtained from Vindelkol AB (Vindelkol, Umeå, Sweden). The HFF and VFF sections comprised of two 70-L boxes, each measuring 74 cm × 29 cm × 40 cm (height × width × depth), placed on top of each other. In the VFF, a 3-cm drainage layer of coarse biochar (8–16 mm particle diameter) with slope 2.5% was installed at the bottom. The section was then packed up to 30 cm with biochar with particle size 2.5–5.0 mm. A second 3-cm layer of coarse biochar was placed on top of the main filter, to function as a distribution layer and prevent clogging on the surface by wastewater solids. The HFF biochar filter was prepared by filling the box with coarse biochar (25–40 mm particle diameter) in two 10-cm layers at the inlet and outlet sides. The remaining 54 cm of the section was filled with fine biochar (1.6–2.5 mm diameter). The depth of biochar in the HFF was 30 cm and the outlet was located 2 cm lower than the inlet. Before the start of the experiment, the filter was gently washed with distilled water.
The specific area of the biochar was determined according to Brunauer [24] and found to be 170–220 m2 g−1. The internal structure and topography of the packed biochar were studied using elemental scanning electron microscopy (SEM). SEM micrographs and energy dispersive X-ray spectrographs (EDS) of the samples were obtained using a HITACHI TM-1000 scanning electron microscope equipped with an Oxford Instruments EDX detector. The SEM image of the biochar showed longitudinal hollow tubes with pore size ranging from 30 to 60 microns (Figure S1 in Supplementary Information).
The filters were fed with raw wastewater, which was brought in from Uppsala wastewater treatment plant (Kungsängsverket) on a weekly basis and stored refrigerated (4 ± 2 °C) before use. Prior to each feeding, the refrigerated wastewater was homogenized and the required doses were then pumped from the storage container to distribution containers kept at room temperature (20 °C). After acclimatization to room temperature for 20 min, the wastewater doses were pumped from the distribution containers to the filters, using a peristaltic pump. When removal of Salmonella spp. was investigated, the cultivated Salmonella was added to the distribution containers while the wastewater was acclimatizing.

2.2. Operating Conditions of the Filters

The filters were tested over an operating period of 126 weeks, starting from October 2016 until end of March 2019. During the operating period, removal of pollutants by the filters was investigated in response to different loading conditions mimicking start-up, steady state, operational pauses and variable HLR.

2.2.1. Start-up, Pause and Restart Period

Removal of pH, Tot-N, NH4-N, nitrate nitrogen (NO3-N) and chemical oxygen demand (COD) in the biochar filters was investigated during the start-up period of 25 weeks of operation. During this period, the filters were loaded at a HLR of 16–23 L m−2 day−1, an organic loading rate (OLR) of 11.0 ± 4.5 g COD m−2 day−1 and a nitrogen loading rate (NLR) of 773 ± 228 mg Tot-N m−2 day−1. After that, the filters were paused for 26 weeks and then reloaded with wastewater under similar loading rates as in the start-up phase for a period of 6 weeks. The pause in operation was planned to mimic discontinuity of wastewater flows due to vacation by household members or technical problems leading to stoppages in filter operation.

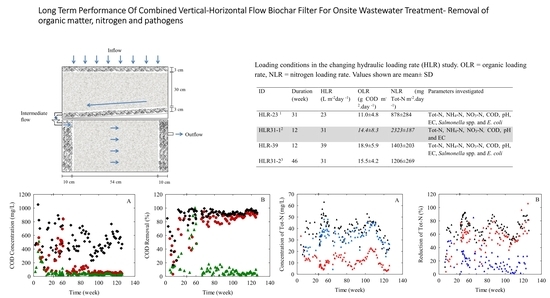
2.2.2. Changing Hydraulic Loading Rate and Long-Term Removal

The response of the VFF and HFF filters to changing hydraulic loading conditions was investigated with respect to removal of Tot-N, NH4-N, NO3-N, COD, E. coli and Salmonella spp. During the study period, the HLR was first increased from 23 to 31 L m−2 day−1 for a period of 12 weeks, and then to 39 L m−2 day−1 for another 12 weeks. Thereafter, the HLR was decreased again to 31 L m−2 day−1 and the filters were operated at this HLR for 46 weeks. The long-term performance of the filters was assessed in terms of nitrogen removal, nitrification and denitrification during the last 52 weeks of the experiment. The OLR varied in response to variations in COD in the incoming wastewater. The effect of these variations in OLR on nitrogen removal was investigated.
The filters received wastewater at the planned HLR, without modifying the quality of the wastewater for any wastewater parameter except Salmonella spp. Detectable colonies of Salmonella spp. were not found in the raw wastewater and therefore cultivated Salmonella spp. was added to the wastewater used to feed the filters, to reach a final concentration of 106–108 CFU mL−1 in the wastewater. The OLR and NLR applied during the HLR trials are summarized in Table 1.

2.3. Sampling, Analyses and Calculations

Samples of influent and effluent from the VFF and HFF units were collected once a week and analyzed for pH, EC, Tot-N, NH4-N, NO3-N, COD, Salmonella spp. and E. coli. The incoming wastewater and the filter effluents were analyzed using Spectroquant® cell kits number 14772–14773 for determination of COD, 00683 for NH4, 09713 for NO3 and 14963 for Tot-N (Merck KGaA, Darmstadt, Germany). Concentrations were determined colorimetrically using a Nova 60 photometer (Merck KGaA). The pH was measured using WTW pH/ion 340i meter and the electrical conductivity (EC) was measured using a Condi 330i conductivity meter (WTW, Weilheim Germany). The cultivation of Salmonella spp. was performed by incubating a single colony of Salmonella spp. in unselective microbial growth medium (nutrient broth, Swedish Veterinary Institute, Uppsala, Sweden) for 24 ± 7 h at 37 °C under continuous mixing of the bacteria and nutrient broth. For analysis of E. coli and Salmonella spp., 0.1 mL samples were taken from sterile tubes containing series of dilutions of influent and effluents, and added to Petri dishes with Chromocult agar (VWR International, Helsinki, Finland) for E. coli or XRD for Salmonella spp. The dishes were incubated at 37 °C for 24 ± 5 h and visible colonies of E. coli and Salmonella spp. were counted.
Removal efficiency (E) was calculated as the difference in concentration between influent and effluent of the filters:
E = 100   [ C i n ] [ C o u t ] [ C i n ]
where E is the removal efficiency (%), [Cin] is the concentration in influent (mg L−1) and [Cout] is the concentration in effluent (mg L−1). Log10 reduction in E. coli and Salmonella spp. was calculated as:
Log10 reduction = Log10 [Cin] − Log10 [Cout]
where [Cin] is the concentration of the microorganism in influent and [Cout] is the concentration in effluent (CFU mL−1). For Salmonella spp., [Cout] was the concentration in the effluent collected 24–48 h after feeding the filters with the wastewater spiked with Salmonella spp. Nitrification and denitrification efficiency was calculated as:
N i t r i f i c a t i o n   e f f i c i e n c y   = 100   [ N O 3 N ] V F F [ N O 3 N ] i n f l o w [ T o t N ] i n f l o w
where [NO3-N]VFF is the concentration of nitrate-nitrogen in the effluent from the vertical flow filter, [NO3-N]inflow is the concentration of nitrate–nitrogen in the incoming wastewater and Tot-Ninflow is the total nitrogen in the incoming wastewater and:
D e n i t r i f i c a t i o n   e f f i c i e n c y =   100   [ N O 3 N ] V F F [ N O 3 N ] H F F [ T o t N ] i n f l o w
where [NO3-N]HFF is the concentration of nitrate-nitrogen in the effluent from the horizontal flow filter.
Analysis of variance (ANOVA) at 95% confidence level was used to assess the difference in mean nitrification, denitrification and Tot-N removal between the (i) VFF and HFF filters and (ii) the different HLR. The relationship between OLR and removal of Tot-N in the entire filter system was evaluated using a generalized linear regression (GLM) model. The coefficient of determination (R2) and regression coefficient (b) were used to assess the significance of the correlation. The relationship was considered significant at p < 0.05. All statistical analyses were performed using STATISTICA ver. 10 (Statsoft Inc., Tulsa, OK, USA).

3. Results

3.1. Removal of Organic Matter

Over the whole experimental period (126 weeks), the average concentration of COD applied to the system was 144 ± 171 mg L−1 in the VFF and 39 ± 33 mg L−1 in the HFF (Figure 2). On average, removal of COD in the entire system during the 126-week period was high (91 ± 11%), with most of the removal (72%) occurring in the VFF. The long-term removal of COD in the entire system, measured as average removal during the last 52 weeks of operation, was 93 ± 3%, with most of the removal (87 ± 5%) occurring in the VFF. The effluent of the VFF and HFF contained 61 ± 21 and 30 ± 12 mg COD L−1, respectively. Changing the HLR from 23 to 31 to 39 L m−2 day−1 did not influence COD removal in the VFF and HFF, and overall removal in the system varied within 90–93% at the different HLR (p > 0.05).

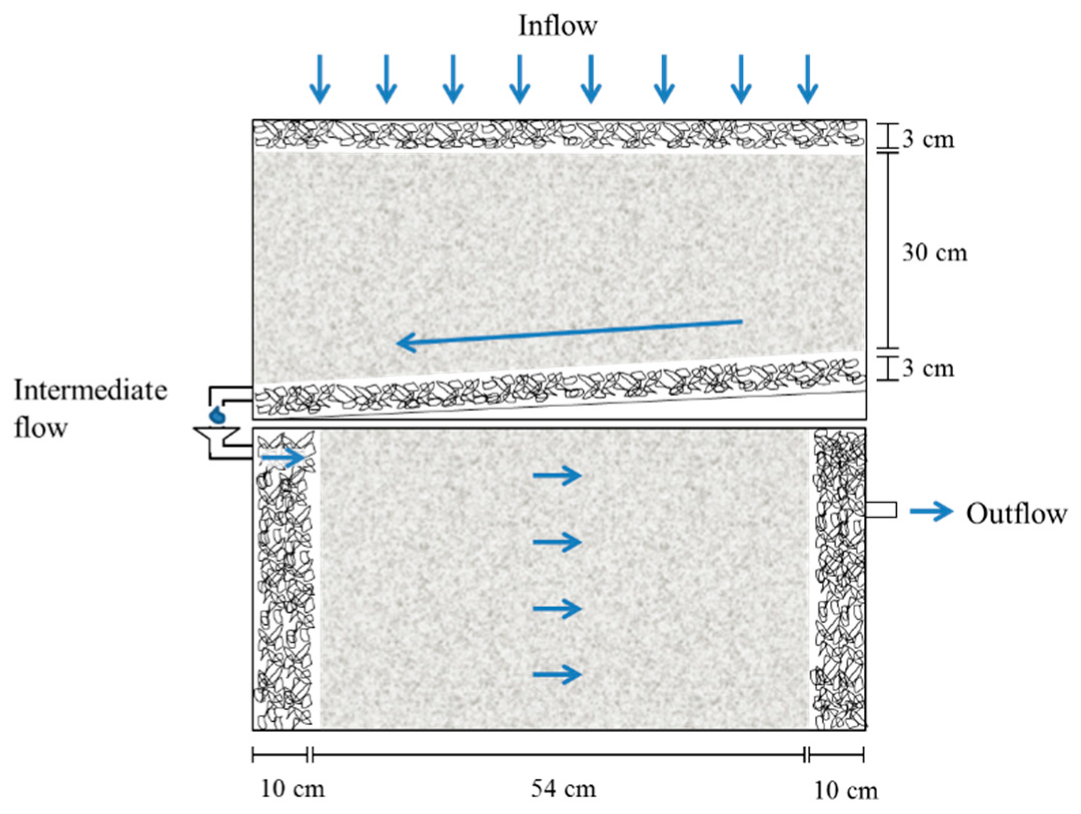
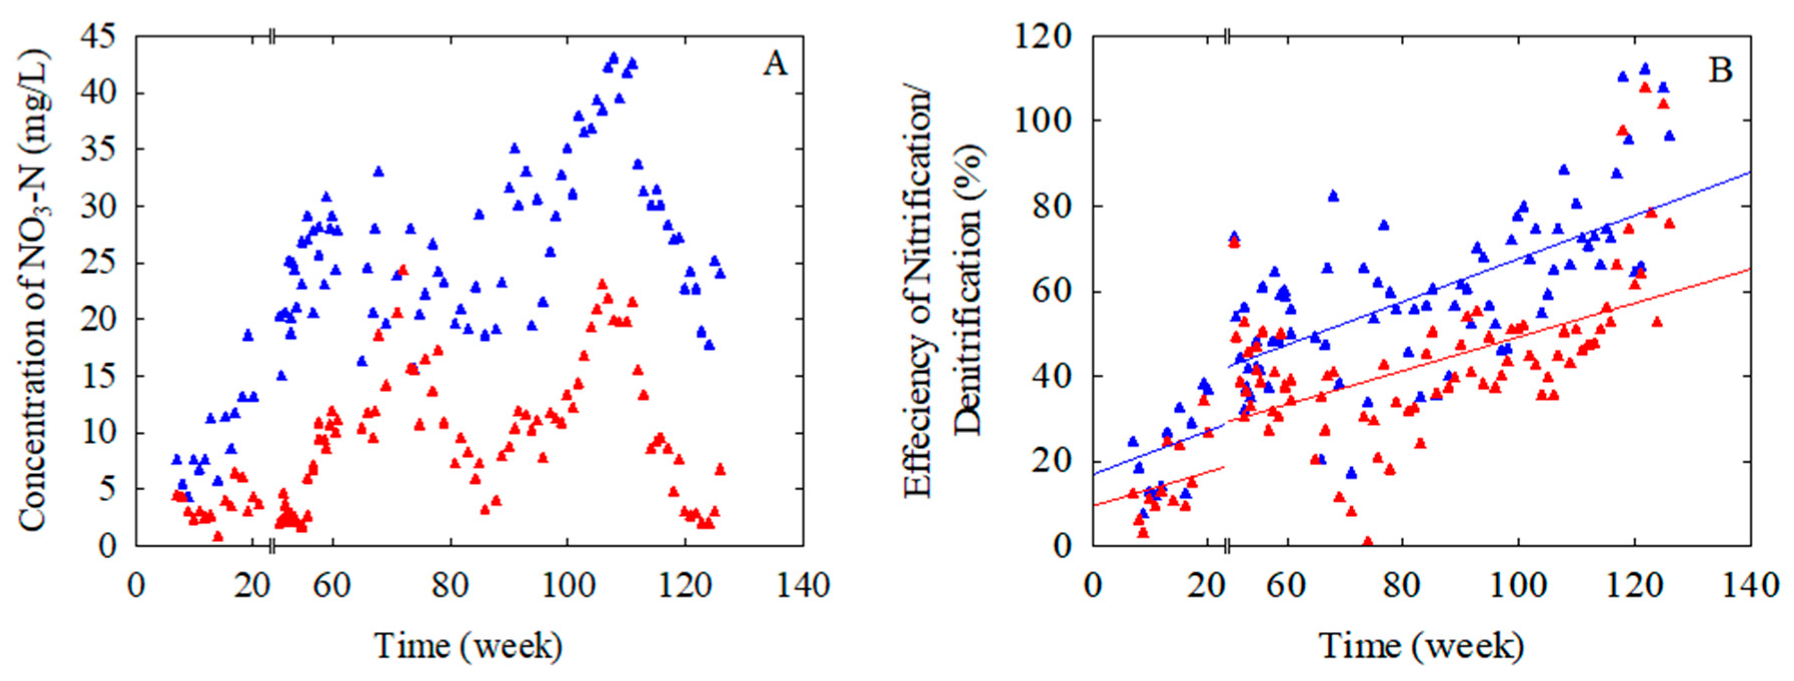
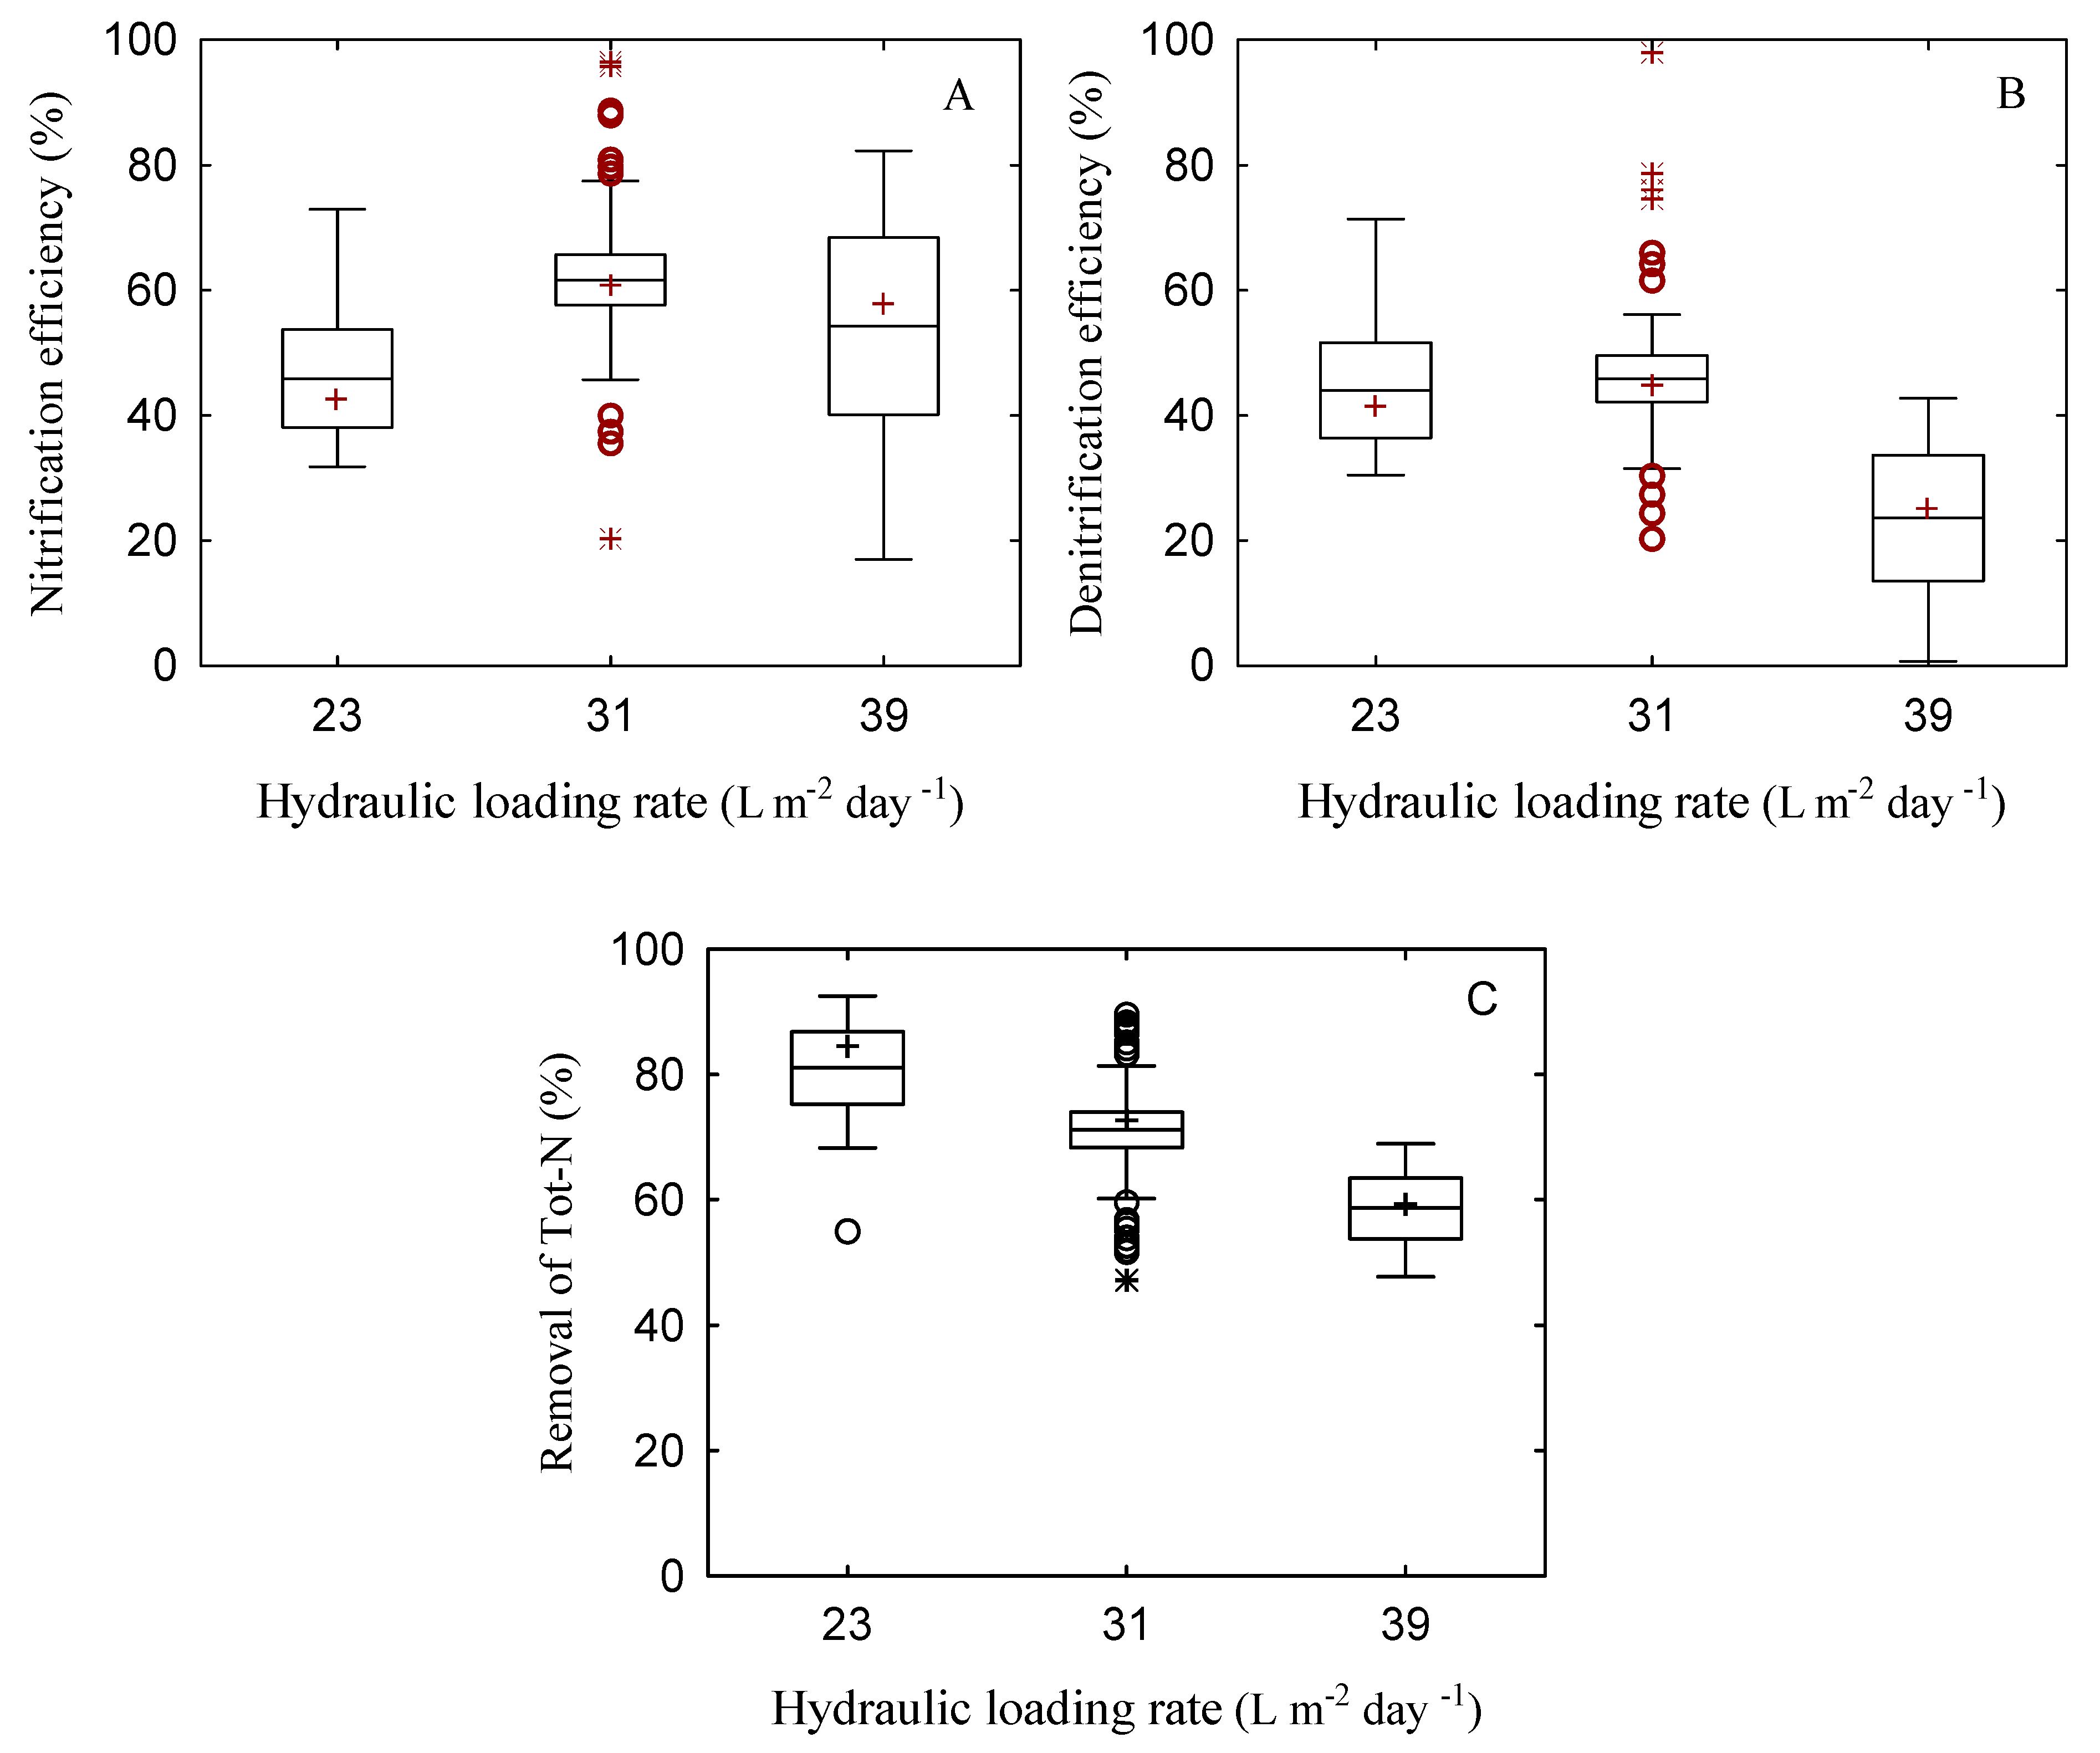
3.2. Long-Term Removal of Nitrogen and Effects of Hydraulic Loading Rate

Concentration of Tot-N showed frequent fluctuations and the average during the last 52 weeks of the experiment was 38 ± 8 mg L−1, with maximum concentration 53 mg L−1 and minimum concentration 18 mg L−1. The average concentration of Tot-N in the effluent of the entire system, i.e., effluent from the HFF, was 12 ± 6 mg L−1, with minimum concentration 2.8 mg/L and maximum concentration 23 mg L−1 (Figure 3). The long-term removal of Tot-N in the entire system was 71 ± 12%, with maximum removal 89.5% and minimum removal 47% (Figure 3). Overall, 60% of the samples analyzed during the last 52 weeks showed ≥70% removal of Tot-N and 44% of samples showed Tot-N removal ≥ 80%. Most of the Tot-N removal was achieved by the HFF, with average removal of 61 ± 14%.
The long-term removal of ammonium (NH4-N) was 93 ± 2%, with almost all the removal occurring in the VFF. The concentration of NH4-N in effluent from the VFF and HFF was 4.5 ± 4.3 mg L−1 and <2.0 ± 0.1 mg L−1, respectively. Nitrification in the VFF and denitrification in the HFF showed increasing trends during the entire experimental period, including the last 52 weeks (Figure 4). The long-term average nitrification efficiency was 65 ± 15%, with maximum efficiency 97%. The long-term denitrification efficiency was 49 ± 14%, with maximum efficiency 98%. The effluent from the VFF and HFF showed periodic variations, represented by a decreasing trend in NO3-N concentration followed by an increasing trend (Figure 4). The average concentration of NO3-N in the effluent of the VFF and HFF was 29.3 ± 7.5 and 10.7 ± 6.0 mg L−1, respectively.
Increasing the HLR from 23 to 31 L m−2 day−1 increased the nitrification efficiency from 42 to 61% (Figure 5). When the HLR was increased from 31 to 39 L m−2 day−1, the denitrification efficiency decreased from 45 to 25% (Figure 5). The stepwise increase in HLR from 23 to 31 and then 39 L m−2 day−1 decreased the overall removal of Tot-N in the entire system from 81% to 71% to 59% (p < 0.05). With respect to the effects of OLR, regression analysis showed a significant direct relationship between OLR and removal of Tot-N in the entire VFF and HFF system (b = 0.35, R2 = 0.105, p < 0.05; see Table S1 in Supplementary Information).

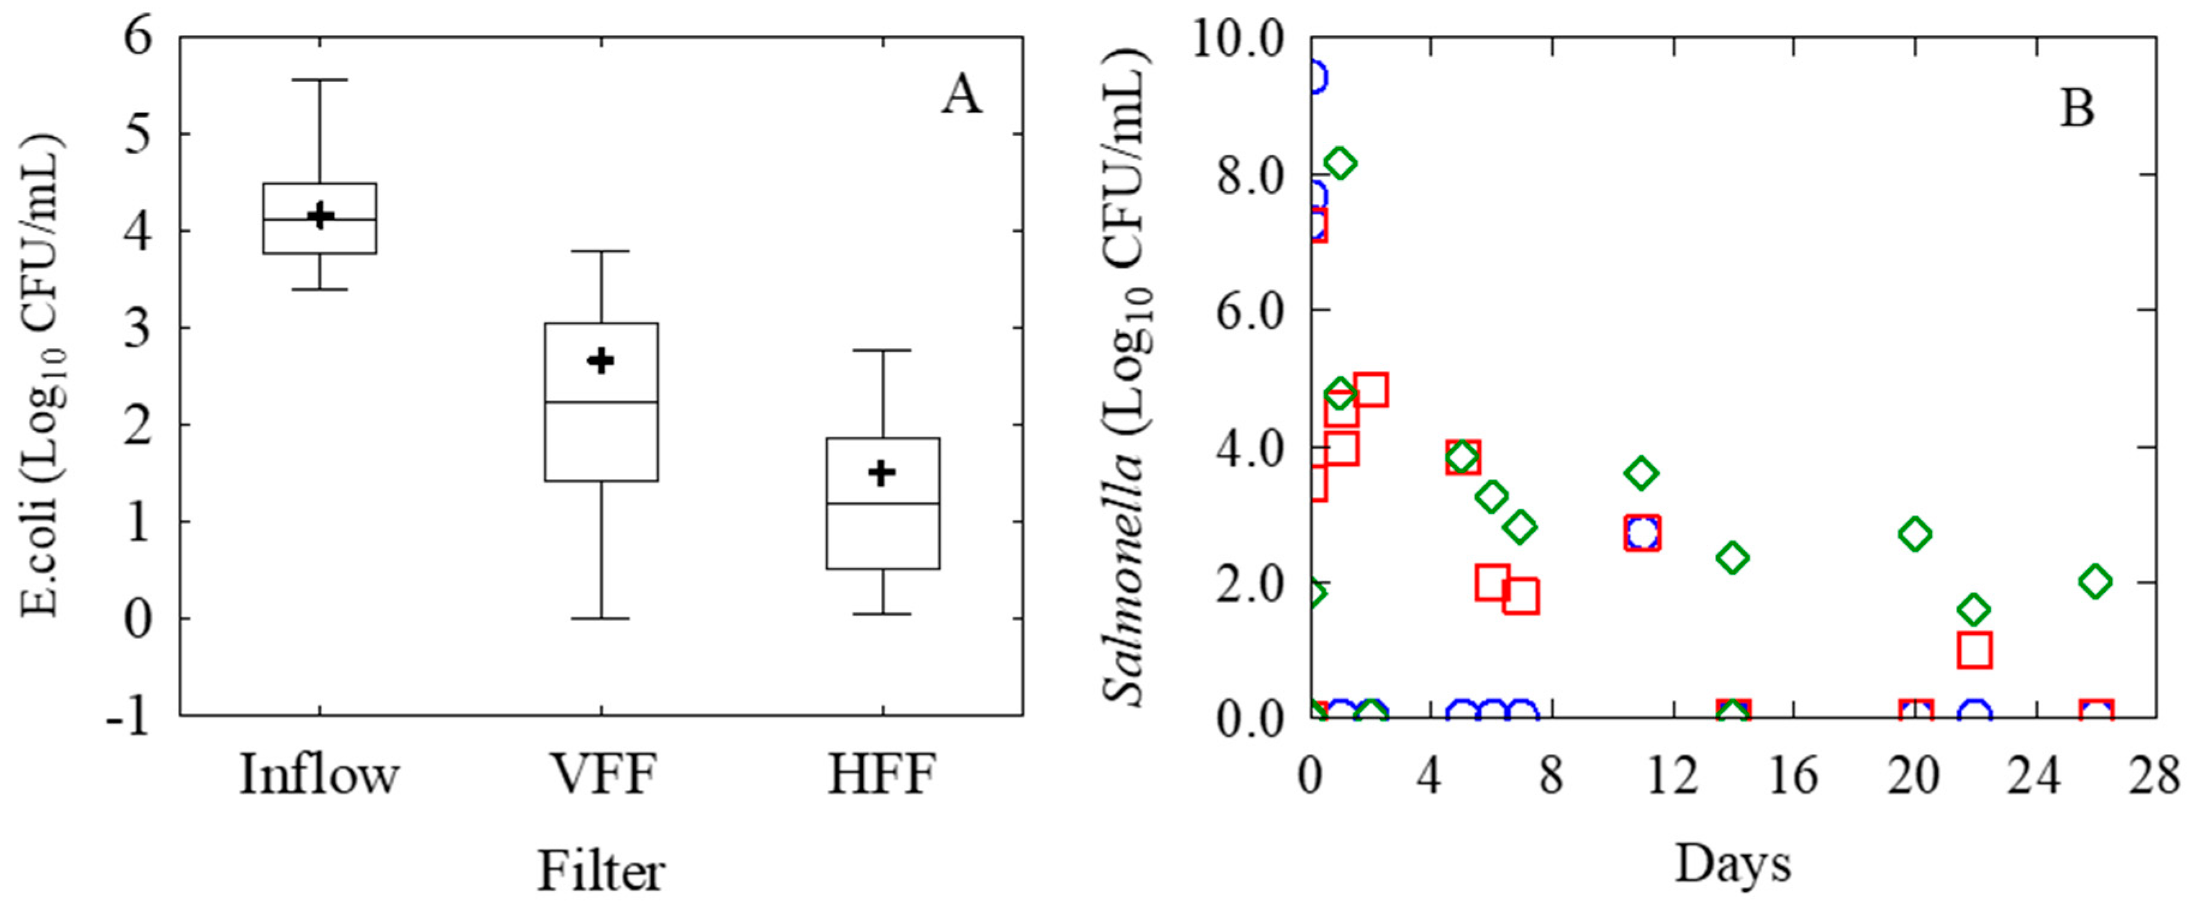
3.3. Pathogen Removal

The concentration of E. coli in the incoming wastewater was 3.75–4.49 log10 CFU mL−1 (Figure 6). The HFF effluent contained lower numbers of E. coli (1.35–2.97 log10 CFU mL−1) than the VFF effluent (0.49–1.86 log10 CFU mL−1) (Figure 6A). On average, the reduction in E. coli in the VFF was 1.53 log10 units, while the overall reduction in the entire system was 2.95 log10 units. With increasing HLR from 23 to 31 and then 39 L m−2 day−1, no significant effects were observed on the performance of the VFF and HFF in terms of E. coli removal. The VFF achieved a 1.09–2.1 log10 unit reduction (p > 0.05) and the HFF achieved a 2.48–3.39 log10 unit reduction (p > 0.05) at the HLR values investigated.
After spiking with Salmonella spp., the wastewater contained 7.29–9.40 log10 CFU mL−1. The VFF and HFF did not effectively remove Salmonella spp., but rather attenuated the concentration of this microorganism and slowly released it over time (Figure 6B). Following addition of Salmonella spp. to the wastewater at HLR-23, the effluent of HFF released Salmonella spp. for 20, 5 and 21 days at HLR 23, 31 and 39 L m−2 day−1, respectively, and the effluent contained 1.6 log10 CFU mL−1 at HLR 39 L m−2 day−1.

4. Discussion

4.1. Removal of Organic Matter

In general, the combined VFF-HFF system achieved efficient removal of organic matter (91 ± 11%) over the entire period of operation (126 weeks). The biochar used in the filter units was characterized by large surface area (170–200 m2/g) and high porosity, which provided a suitable surface for biofilm attachment. Removal of organic matter in the VFF was initially low and increased with time (Figure 2). This can be explained by wash-out of carbon dust from the biochar at the beginning of operation. The long-term removal of organic matter was 93 ± 3%.
Despite its shallow depth (30 cm), the VFF removed 87% of COD, i.e., most of the organic matter removal in the system, and did not show any sign of clogging or failure. Biodegradation of the organic matter under the aerobic conditions in the VFF led to this high removal of COD. It should be pointed out the incoming wastewater was distributed over the whole area of the VFF and that the filter received raw wastewater on an intermittent basis (four to six times per day). The uniform distribution of the wastewater probably led to better utilization of the infiltration area and the intermittent loading gave the biofilm on the biochar particles the chance to consume the applied organic matter before the next loading, which prevented accumulation of organics and hence clogging. In the HFF, only a minor proportion of the COD was removed. We believe that the COD removed in the HFF was consumed by denitrifying bacteria, which reduced the NO3-N to nitrogen gas. According to Daigger [25], the amount of COD required to reduce nitrate to nitrogen is about 2.85 mg O2 mg−1 N. The effluent of VFF contained on average 29 mg NO3-N L−1, which required about 83 mg COD L−1 to be available for denitrification. The effluent of the VFF and HFF contained 61 ± 21 and 30 ± 12 mg COD L−1, respectively. Increasing the HLR from 23 to 31 to 39 L m−2 day−1 did not influence the efficiency of the system in terms of COD removal. Removal of organic matter in filter media is achieved by adsorption and biological degradation by active biofilm and adsorption [26,27]. The combination of processes in the VFF-HFF system provided back-up capacity for the system to maintain stable removal of organic matter despite the changes in loading conditions. In addition, the HFF worked as a buffering zone and used its capacity (biofilm) to degrade additional organic matter which escaped from the VFF without treatment.

4.2. Removal of Nitrogen and Effects of Hydraulic Loading Rate on Nitrogen Removal

Initially, ammonium was adsorbed to the surface of the biochar in the VFF. High capacity of biochar for adsorption of NH4-N has been reported previously [22]. As the biofilm of the VFF gradually expanded, the adsorbed ammonium slowly started to be oxidized to nitrate by nitrifying bacteria under the aerobic conditions within the VFF. Nitrifying bacteria are autotrophic and use inorganic carbon sources, e.g., CO2, to obtain energy, resulting in slow growth rates of nitrifying bacteria [28]. Due to this nitrification process, most of the NH4-N in the incoming wastewater (34.2 ± 9.1 mg L−1) was removed (93 ± 2%), which left only 4.5 ± 4.3 mg L−1 in the effluent from the VFF. In parallel with NH4-N removal, the VFF effluent showed an increase in NO3-N concentration (29.3 ± 7.5 mg L−1). The VFF was a critical component of the system, since without it, nitrification would have not been achieved. This was proven by the good nitrification capacity in the VFF (65 ± 15%). The NO3-N concentration decreased in the HFF. In fact, after stabilization of the combined HFF-VFF system, most of the nitrogen removal (61 ± 14%) occurred in the HFF (saturated section) and only a small proportion of Tot-N removal (10 ± 12%) occurred in the VFF. Through denitrification in the HFF, NO3-N developed in the VFF was converted to nitrogen gas by facultative heterotrophic bacteria under anoxic conditions in the presence of adequate decomposable carbon. This indicates that addition of a saturated flow filter, i.e., the HFF, was crucial to achieving acceptable levels of denitrification. It appears that conditions favoring the growth of denitrifying bacteria (i.e., development of anoxic zones and anaerobic biofilm) developed over time in the biochar particles in the HFF, and therefore the denitrification efficiency increased (Figure 4). On a long-term basis, the combined VFF-HFF system achieved good removal of Tot-N (71 ± 12%) (Figure 3). During the last 52 weeks of operation, only one measurement showed Tot-N removal < 50%.
Wastewater production in households varies on a daily, weekly and seasonal basis, which leads to variability in HLR and OLR to OWTS. Under peak conditions, this can lead to a temporary breakdown of the infiltration system, so-called episodic failure [29]. Thus, it is necessary for the infiltration bed to have the capacity to withstand variations in HLR and OLR and maintain resilient and consistent treatment performance. Increasing the HLR from 23 to 31 L m−2 day−1 increased the nitrification efficiency from 42 to 61%. The specific surface of the biochar used in the system was large (200 m2 g−1). Thus, when the HLR was increased more surfaces were reached by the wastewater and hence more contact between nitrifying bacteria and NH4 occurred, which led to increased nitrification. Another explanation is that HLR 23 L m−2 day−1 was low and not all the infiltrative surface of the VFF was used. Thus, when the HLR was increased, the infiltrative surface of the biochar was effectively utilized and nitrification was enhanced. An increase in HLR usually leads to washout of NH4-N without nitrification, owing to shorter contact time between nitrifying bacteria and NH4-N [30]. Increasing the HLR from 31 to 39 L m−2 day−1 decreased the denitrification efficiency, which was reflected in high concentrations of NO3-N in the effluent from the HFF (16.1 ± 4.0 mg L−1) compared with in the influent (23.7 ± 4.8 mg L−1). In parallel with the decrease in denitrification efficiency, the overall removal of Tot-N in the system decreased. This is because at HLR-39, more nitrate escaped from the HFF before it was reduced to nitrogen gas by the bacteria. It is likely that the hydraulic retention time in the HFF decreased in response to the increase in HLR. Despite the decline, the system still removed 59 ± 7% of Tot-N, which was acceptable and in line with the 50% nitrogen removal required by the Swedish Agency for Marine and Water Management for areas with a sensitive recipient [16].

4.3. Pathogen Removal

The overall reduction in E. coli in the VFF and HFF system was 2.95 log10 units, compared with 3.75–4.49 log10 CFU mL−1 in the incoming wastewater. This means that substantial numbers of E. coli were present in the effluent from the system. Removal of E. coli in the VFF and HFF was only achieved by filtration and straining in the pores of the biochar, and conditions for inactivation of bacteria (e.g., high or low pH, high temperature) were not present. Similarly, the VFF and HFF did not achieve effective removal of Salmonella spp., but rather attenuated its concentration and released it gradually. It should be pointed out that the levels of Salmonella spp. spiked in the wastewater were very high (7.29–9.40 log10 CFU mL−1) compared with those expected to be found in wastewater. Previous studies report that wastewater can contain 0.001–100 CFU mL−1 [31], which is much lower than the level in the present study. However, if wastewater contains up to 3.0 log10 CFU mL−1, a combined VFF-HFF biochar system might be able to remove Salmonella spp. and the effluent would be considered safe for disposal.
Other studies have reported similar removal of bacteria using biochar filters. For example, Perez-Mercado, Lalander [20] reported 1.6–4.5 log10 unit removal of E. coli and enterococci bacteria from vertical flow biochar filters treating irrigation water. The efficiency of removal of microbes from wastewater by passage through filters depends on the adsorption capacity of the filter material, the characteristics of the biofilm formed on filter surfaces and physical entrapment (straining) in small pore spaces [32,33,34]. Adsorption is the dominant mechanism when the microbes are smaller than the pore size. It depends on several characteristics of the filter material, some of which (e.g., surface area, total porosity, size and distribution of pores) show more suitable values in biochar than in sand [35,36].

5. Concluding Remarks

-
The long-term performance of the combined VFF-HFF system developed in this study was satisfactory in terms of organic matter and nitrogen removal (>90% and >70%, respectively). No signs of clogging or deterioration in either organic matter or Tot-N removal were observed during the 126 weeks of operation.
-
Under increasing HLR, the combined VFF-HFF filter system still achieved high removal of organic matter (90–93%) and nitrogen (>50% removal), which showed robustness of the system.
-
The combined VFF-HFF system achieved substantial removal rates of E. coli and Salmonella spp. (3.0 log10 units), but the safety of the effluent will depend on the initial concentration of these microorganisms in the incoming wastewater. At higher levels of microbial contamination, playing or bathing in water close to points where the effluent is released should be avoided. Protective measures, e.g., wearing gloves and mask and washing hands, are recommended for at least three weeks when handling filters after cases of infection.
-
The design of the filter system with respect to depth: width: length of the horizontal flow system has not yet been investigated and more research is needed on this aspect. The system also needs to be investigated at extreme HLR, e.g., 200 L m−2 day−1.
-
Multi-criteria analysis to assess the sustainability of the biochar filters in terms of technical performance, environmental impacts and social and economic aspects is needed.

Supplementary Materials

The following are available online at https://0-www-mdpi-com.brum.beds.ac.uk/2076-3417/9/24/5386/s1, Figure S1.

Author Contributions

S.S.D., Y.S. and A.A. collected the data, S.S.D. carried out the data analysis and wrote the manuscript. A.A. revised it.

Funding

This project was funded by Swedish Marine Agency grant number [1:11 Åtgärder för havs- och vattenmiljö] and the Swedish Foundation for international cooperation in research and education grant number [PT2016-6875].

Acknowledgments

We gratefully acknowledge Anas Al-Mustafa for his efforts in the laboratory work. Thanks for Swedish Marine Agency and the Swedish Foundation for international cooperation in research and education for their financial support.

Conflicts of Interest

The authors declare no conflict of interest.

References

  1. Steiner, C. Considerations in Biochar Characterization. In Agricultural and Environmental Applications of Biochar: Advances and Barriers; Guo, M., He, Z., Uchimiya, S.M., Eds.; Soil Science Society of America, Inc.: Madison, WI, USA, 2016. [Google Scholar]
  2. Dalahmeh, S.; Alziq, N.; Ahrens, L. Potential of biochar filters for on-site wastewater treatment: Effects of active and inactive biofilms on adsorption of per-and polyfluoroalkyl substances in laboratory column experiments. Environ. Pollut. 2019, 247, 155–164. [Google Scholar] [CrossRef] [PubMed]
  3. Perez-Mercado, F.L.; Lalander, C.; Berger, C.; Dalahmeh, S.S. Potential of Biochar Filters for Onsite Wastewater Treatment: Effects of Biochar Type, Physical Properties and Operating Conditions. Water 2018, 10, 1835. [Google Scholar] [CrossRef] [Green Version]
  4. Bradley, B.R.; Daigger, G.T.; Rubin, R.; Tchobanoglous, G. Evaluation of onsite wastewater treatment technologies using sustainable development criteria. Clean Technol. Environ. Policy 2002, 4, 87–99. [Google Scholar] [CrossRef]
  5. Massoud, M.A.; Tarhini, A.; Nasr, J.A. Decentralized approaches to wastewater treatment and management: Applicability in developing countries. J. Environ. Manag. 2009, 90, 652–659. [Google Scholar] [CrossRef]
  6. Libralato, G.; Volpi Ghirardini, A.; Avezzù, F. To centralise or to decentralise: An overview of the most recent trends in wastewater treatment management. J. Environ. Manag. 2012, 94, 61–68. [Google Scholar] [CrossRef]
  7. US EPA. Onsite Wastewater Treatment Systems Manual; EPA/625/R-00/008; US EPA: Washington, DC, USA, 2002.
  8. Beggs, R.A.; Hills, D.J.; Tchobanoglous, G.; Hopmans, J.W. Fate of nitrogen for subsurface drip dispersal of effluent from small wastewater systems. J. Contam. Hydrol. 2011, 126, 19–28. [Google Scholar] [CrossRef]
  9. Kristiansen, R. Sand-Filter Trenches for Purification of Septic Tank Effluent: II. The Fate of Nitrogen1. J. Environ. Qual. 1981, 10, 358–361. [Google Scholar] [CrossRef]
  10. Baer, S.; Robertson, W.; Spoelstra, J.; Schiff, S. Phosphorus and nitrogen loading to Lake Huron from septic systems at Grand Bend, ON. J. Gt. Lakes Res. 2019, 45, 642–650. [Google Scholar] [CrossRef]
  11. Suhogusoff, A.V.; Hirata, R.; Ferrari, L.C.K.; Robertson, W.D.; Stimson, J.; Forbes, D.; Blowes, D.W. Field performance of two on-site wastewater treatment systems using reactive media layers for nutrient and pathogen removal. J. Water Process Eng. 2019, 32, 100905. [Google Scholar] [CrossRef]
  12. Blaschke, A.P.; Derx, J.; Zessner, M.; Kirnbauer, R.; Kavka, G.; Strelec, H.; Farnleitner, A.H.; Pang, L. Setback distances between small biological wastewater treatment systems and drinking water wells against virus contamination in alluvial aquifers. Sci. Total Environ. 2016, 573, 278–289. [Google Scholar] [CrossRef] [Green Version]
  13. Humphrey, C.; O’Driscoll, M.; Harris, J. Spatial distribution of fecal indicator bacteria in groundwater beneath two large on-site wastewater treatment systems. Water 2014, 6, 602–619. [Google Scholar] [CrossRef] [Green Version]
  14. Herrmann, I.; Vidal, B.; Hedström, A. Discharge of indicator bacteria from on-site wastewater treatment systems. Desalin. Water Treat. 2017, 91, 365–373. [Google Scholar] [CrossRef] [Green Version]
  15. Lindberg, R.H.; Wennberg, P.; Johansson, M.I.; Tysklind, M.; Andersson, B.A.V. Screening of Human Antibiotic Substances and Determination of Weekly Mass Flows in Five Sewage Treatment Plants in Sweden. Environ. Sci. Technol. 2005, 39, 3421–3429. [Google Scholar] [CrossRef] [PubMed]
  16. Havs-Och Vattenmyndighetens. Havs-Och Vattenmyndighetens Allmänna råd om små Avloppsanordningar för Hushållsspillvatten; Havs-Och Vattenmyndigheten: Göteborg, Sweden, 2016; Volume 2016, p. 17. [Google Scholar]
  17. Kholoma, E.; Renman, A.; Renman, G. Filter media-packed bed reactor fortification with biochar to enhance wastewater treatment.
  18. Yin, Q.; Zhang, B.; Wang, R.; Zhao, Z. Biochar as an adsorbent for inorganic nitrogen and phosphorus removal from water: A review. Environ. Sci. Pollut. Res. Int. 2017, 24, 26297–26309. [Google Scholar] [CrossRef] [PubMed]
  19. Huggins, T.M.; Haeger, A.; Biffinger, J.C.; Ren, Z.J. Granular biochar compared with activated carbon for wastewater treatment and resource recovery. Water Res. 2016, 94, 225–232. [Google Scholar] [CrossRef] [PubMed] [Green Version]
  20. Perez-Mercado, L.F.; Lalander, C.; Joel, A.; Ottoson, J.; Dalahmeh, S.; Vinnerås, B. Biochar filters as an on-farm treatment to reduce pathogens when irrigating with wastewater-polluted sources. J. Environ. Manag. 2019, 248, 109295. [Google Scholar] [CrossRef]
  21. Gupta, P.; Taewoong, A.; SeungMok, L. Use of biochar to enhance constructed wetland performance in wastewater reclamation. Environ. Eng. Res. 2016, 21, 36–44. [Google Scholar] [CrossRef] [Green Version]
  22. Zhou, X.; Wang, R.; Liu, H.; Wu, S.; Wu, H. Nitrogen removal responses to biochar addition in intermittent-aerated subsurface flow constructed wetland microcosms: Enhancing role and mechanism. Ecol. Eng. 2019, 128, 57–65. [Google Scholar] [CrossRef]
  23. Kizito, S.; Wu, S.; Kipkemoi Kirui, W.; Lei, M.; Lu, Q.; Bah, H.; Dong, R. Evaluation of slow pyrolyzed wood and rice husks biochar for adsorption of ammonium nitrogen from piggery manure anaerobic digestate slurry. Sci. Total Environ. 2015, 505, 102–112. [Google Scholar] [CrossRef]
  24. Brunauer, S.; Emmett, P.H.; Teller, E.J. Adsorption of gases in multimolecular layers. Am. Chem. Soc. 1938, 60, 309–319. [Google Scholar] [CrossRef]
  25. Daigger, G.T. Oxygen and carbon requirements for biological nitrogen removal processes accomplishing nitrification, nitritation, and anammox. Water Environ. Res. 2014, 86, 204–209. [Google Scholar] [CrossRef] [PubMed]
  26. Dalahmeh, S. Capacity of Biochar Filters for Wastewater Treatment in Onsite Systems—Technical Report; Report 2016-90; Havs Och Vattenmyndighet and Swedish University of Agricultural Sciences, 2016; ISBN 978-91-576-9398-3. [Google Scholar]
  27. He, Z.; Uchimiya, S.M.; Guo, M. Production and Characterization of Biochar from Agricultural By-Products: Overview and Use of Cotton Biomass Residues. In Agricultural and Environmental Applications of Biochar: Advances and Barriers; Guo, M., He, Z., Uchimiya, S.M., Eds.; Soil Science Society of America, Inc.: Madison, WI, USA, 2016. [Google Scholar]
  28. Bassin, J.P.; Kleerebezem, R.; Rosado, A.S.; van Loosdrecht, M.M.; Dezotti, M. Effect of different operational conditions on biofilm development, nitrification, and nitrifying microbial population in moving-bed biofilm reactors. Environ. Sci. Technol. 2012, 46, 1546–1555. [Google Scholar] [CrossRef] [PubMed]
  29. Beal, C.D.; Rassam, D.W.; Gardner, E.A.; Kirchhof, G.; Menzies, N.W. Influence of hydraulic loading and effluent flux on surface surcharging in soil absorption systems. J. Hydrol. Eng. 2008, 13, 681–692. [Google Scholar] [CrossRef] [Green Version]
  30. Dalahmeh, S.S.; Pell, M.; Hylander, L.D.; Lalander, C.; Vinnerås, B.; Jönsson, H. Effects of changing hydraulic and organic loading rates on pollutant reduction in bark, charcoal and sand filters treating greywater. J. Environ. Manag. 2014, 132, 338–345. [Google Scholar] [CrossRef] [PubMed]
  31. WHO. Excreta and Greywater in Agriculture. In Guidelines for the Safe Use of Wastewater, Excreta and Greywater; World Health organization: Geneva, Switzerland, 2006; Volume 4, p. 182. [Google Scholar]
  32. Çeçen, F.; Aktaş, Ö. Integration of Activated Carbon Adsorption and Biological Processes in Wastewater Treatment. In Activated Carbon for Water and Wastewater Treatment: Integration of Adsorption and Biological Treatment; Çeçen, F., Aktaş, Ö., Eds.; Wiley-VCH: Weinheim, Germany, 2011; pp. 43–93. [Google Scholar]
  33. Bradford, S.A.; Morales, V.L.; Zhang, W.; Harvey, R.W.; Packman, A.I.; Mohanram, A.; Welty, C. Transport and fate of microbial pathogens in agricultural settings. Crit. Rev. Environ. Sci. Technol. 2013, 43, 775–893. [Google Scholar]
  34. Sasidharan, S.; Torkzaban, S.; Bradford, S.A.; Kookana, R.; Page, D.; Cook, P.G. Transport and retention of bacteria and viruses in biochar-amended sand. Sci. Total Environ. 2016, 548, 100–109. [Google Scholar] [CrossRef] [PubMed]
  35. Stevik, T.K.; Aa, K.; Ausland, G.; Hanssen, J.F. Retention and removal of pathogenic bacteria in wastewater percolating through porous media: A review. Water Res. 2004, 38, 1355–1367. [Google Scholar] [CrossRef]
  36. Lalander, C.; Dalahmeh, S.; Jönsson, H.; Vinnerås, B. Hygienic quality of artificial greywater subjected to aerobic treatment: A comparison of three filter media at increasing organic loading rates. Environ. Technol. 2013, 34, 2657–2662. [Google Scholar] [CrossRef] [Green Version]
Figure 1. Combined aerobic vertical flow filter (VFF) and anaerobic horizontal flow filter (HFF) system for nitrogen removal from wastewater. The material in the filter was biochar made from pine and spruce wood biomass.
Applsci 09 05386 g001
Figure 2. Scatter plots of (A) concentration of chemical oxygen demand (COD) in the influent (♦) and effluent of the vertical flow filter () and horizontal flow filter () during 126 weeks of operation, and (B) percentage removal of COD in the vertical flow filter (), horizontal flow filter () and entire system (vertical + horizontal filters; ♦).
Applsci 09 05386 g002
Figure 3. Scatter plots of (A) concentration of total nitrogen (Tot-N) in the influent (▲) and effluent of the vertical flow filter () and horizontal flow filter (), and (B) percentage removal of Tot-N in the vertical flow filter (), horizontal flow filter (▲) and entire system (vertical + horizontal filters; ▲) during 126 weeks of operation.
Applsci 09 05386 g003
Figure 4. Scatter plots of (A) concentration of nitrate (NO3-N) in effluent of the vertical flow filter () and horizontal flow filter (), and (B) efficiency of nitrification in the vertical flow filter () and denitrification in the horizontal flow filter; () during 126 weeks of operation.
Applsci 09 05386 g004
Figure 5. Boxplots of (A) nitrification efficiency in the vertical flow filter (VFF), (B) denitrification efficiency in the horizontal flow filter (HFF) and (C) overall removal of total nitrogen (Tot-N) in the entire system (combined VFF and HFF sections). The middle line (−) of the box is the mean, the cross (+) is the median, the box is the confidence interval, the whiskers are the non-outlier range and the red dots are the outliers and extreme values.
Applsci 09 05386 g005
Figure 6. (A) Boxplots of Escherichia coli concentration in influent and effluent of the vertical flow filter (VFF) and horizontal flow filter (HFF). The middle line (−) of the box is the mean, the cross (+) is the median, the box is the confidence interval and the whiskers are the non-outlier range. (B) Concentration of Salmonella spp. in influent (blue) and effluent of the VFF (red) and HFF (green) following spiking of the wastewater with Salmonella spp.
Applsci 09 05386 g006
Table 1. Loading conditions in the experiment investigating the effects of changes in hydraulic loading rate (HLR). OLR = organic loading rate, COD = chemical oxygen demand, NLR = nitrogen loading rate. Values shown are mean ± SD.
IDDuration (Weeks)HLR (L m−2 day−1)OLR (g COD m−2 day−1)NLR (mg Tot-N m−2 day−1)Parameters Investigated
HLR-23 1312311.0 ± 4.8878 ± 284Tot-N, NH4-N, NO3-N, COD, pH, electrical conductivity (EC), Salmonella spp. and E. coli
HLR31-1123114.4 ± 8.32323 ± 187Tot-N, NH4-N, NO3-N, COD, pH and EC
HLR-39123918.9 ± 5.91403 ± 203Tot-N, NH4-N, NO3-N, COD, pH, EC, Salmonella spp. and E. coli
HLR31-2463115.5 ± 4.21206 ± 269
1 This loading period included the start-up and restart of the filter after reaching steady state.

