Prediction of Load-Bearing Capacity of Composite Parts with Low-Velocity Impact Damage: Identification of Intra- and Inter-Ply Constitutive Models

Abstract
:1. Introduction
2. Materials and Manufacturing
3. Experimental Methods
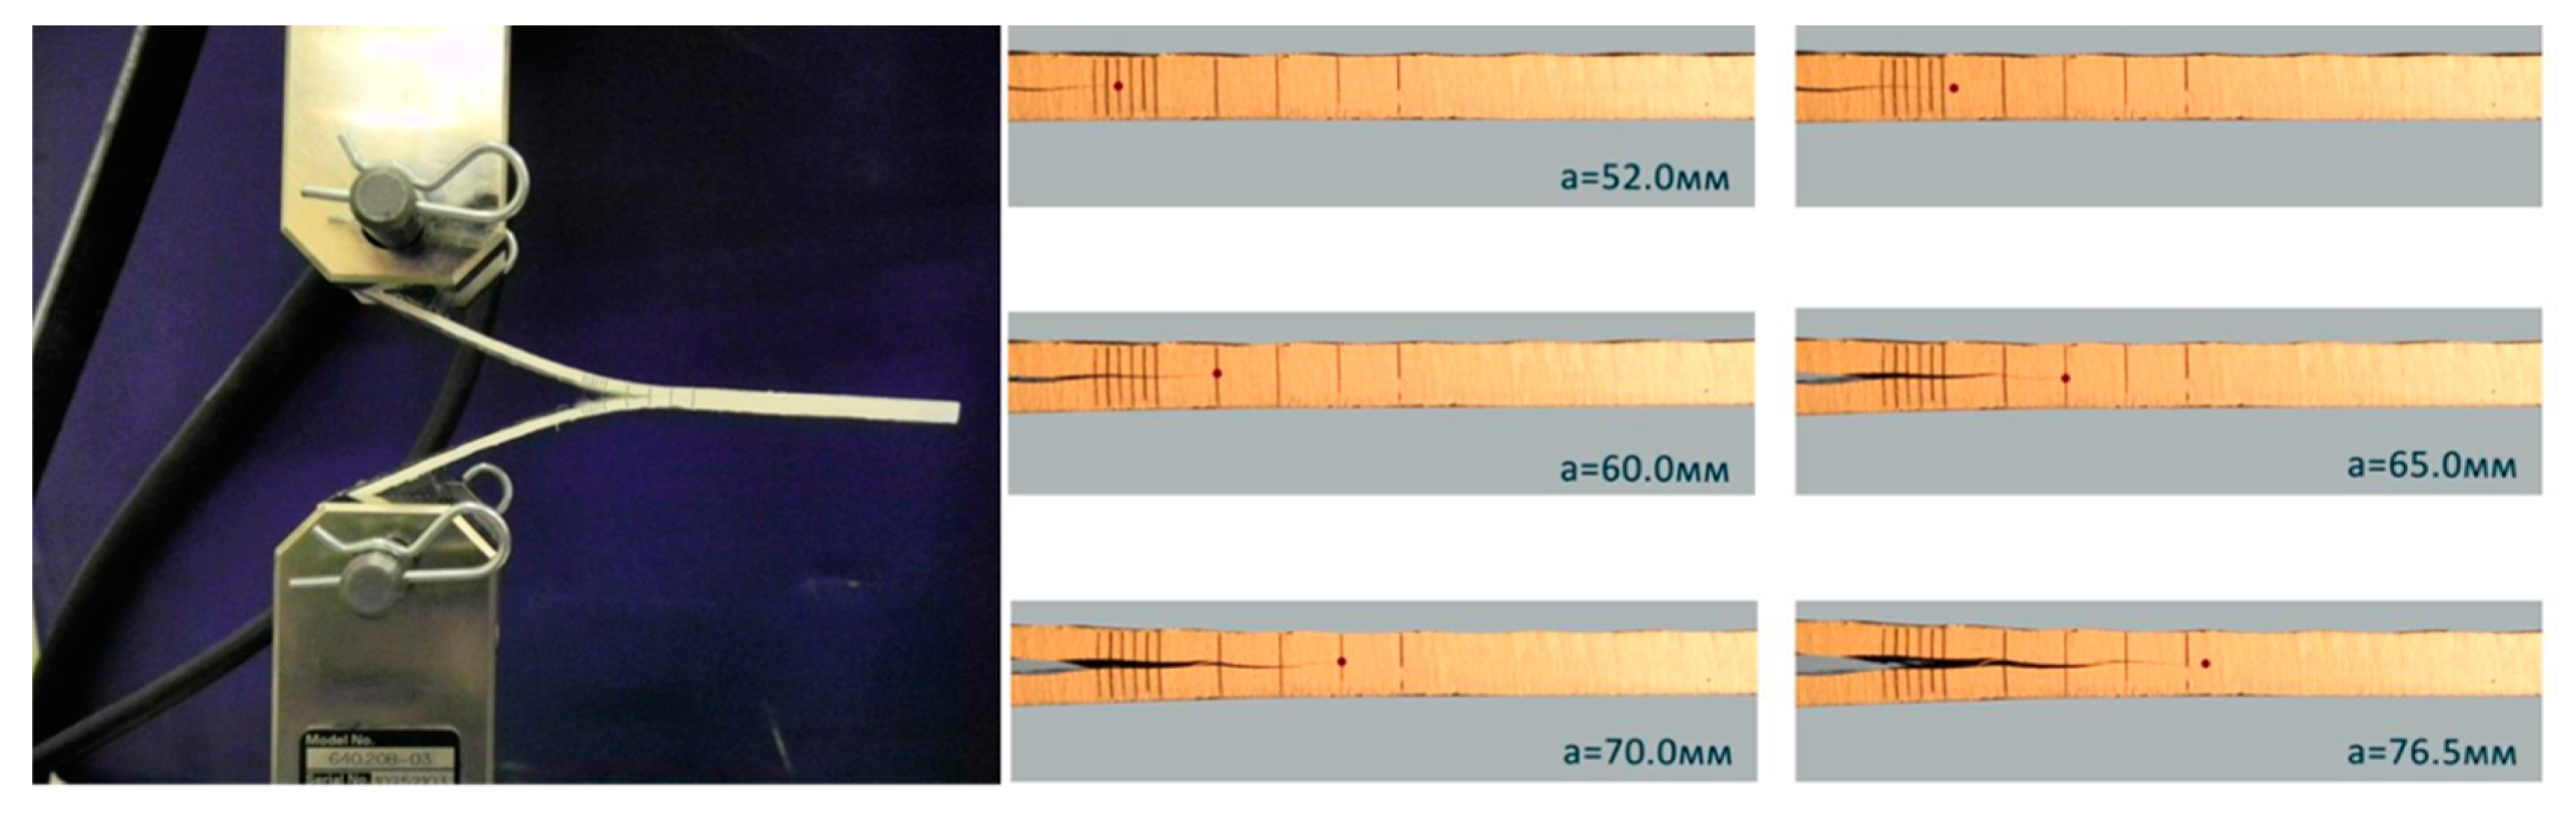
3.1. Material Characterization
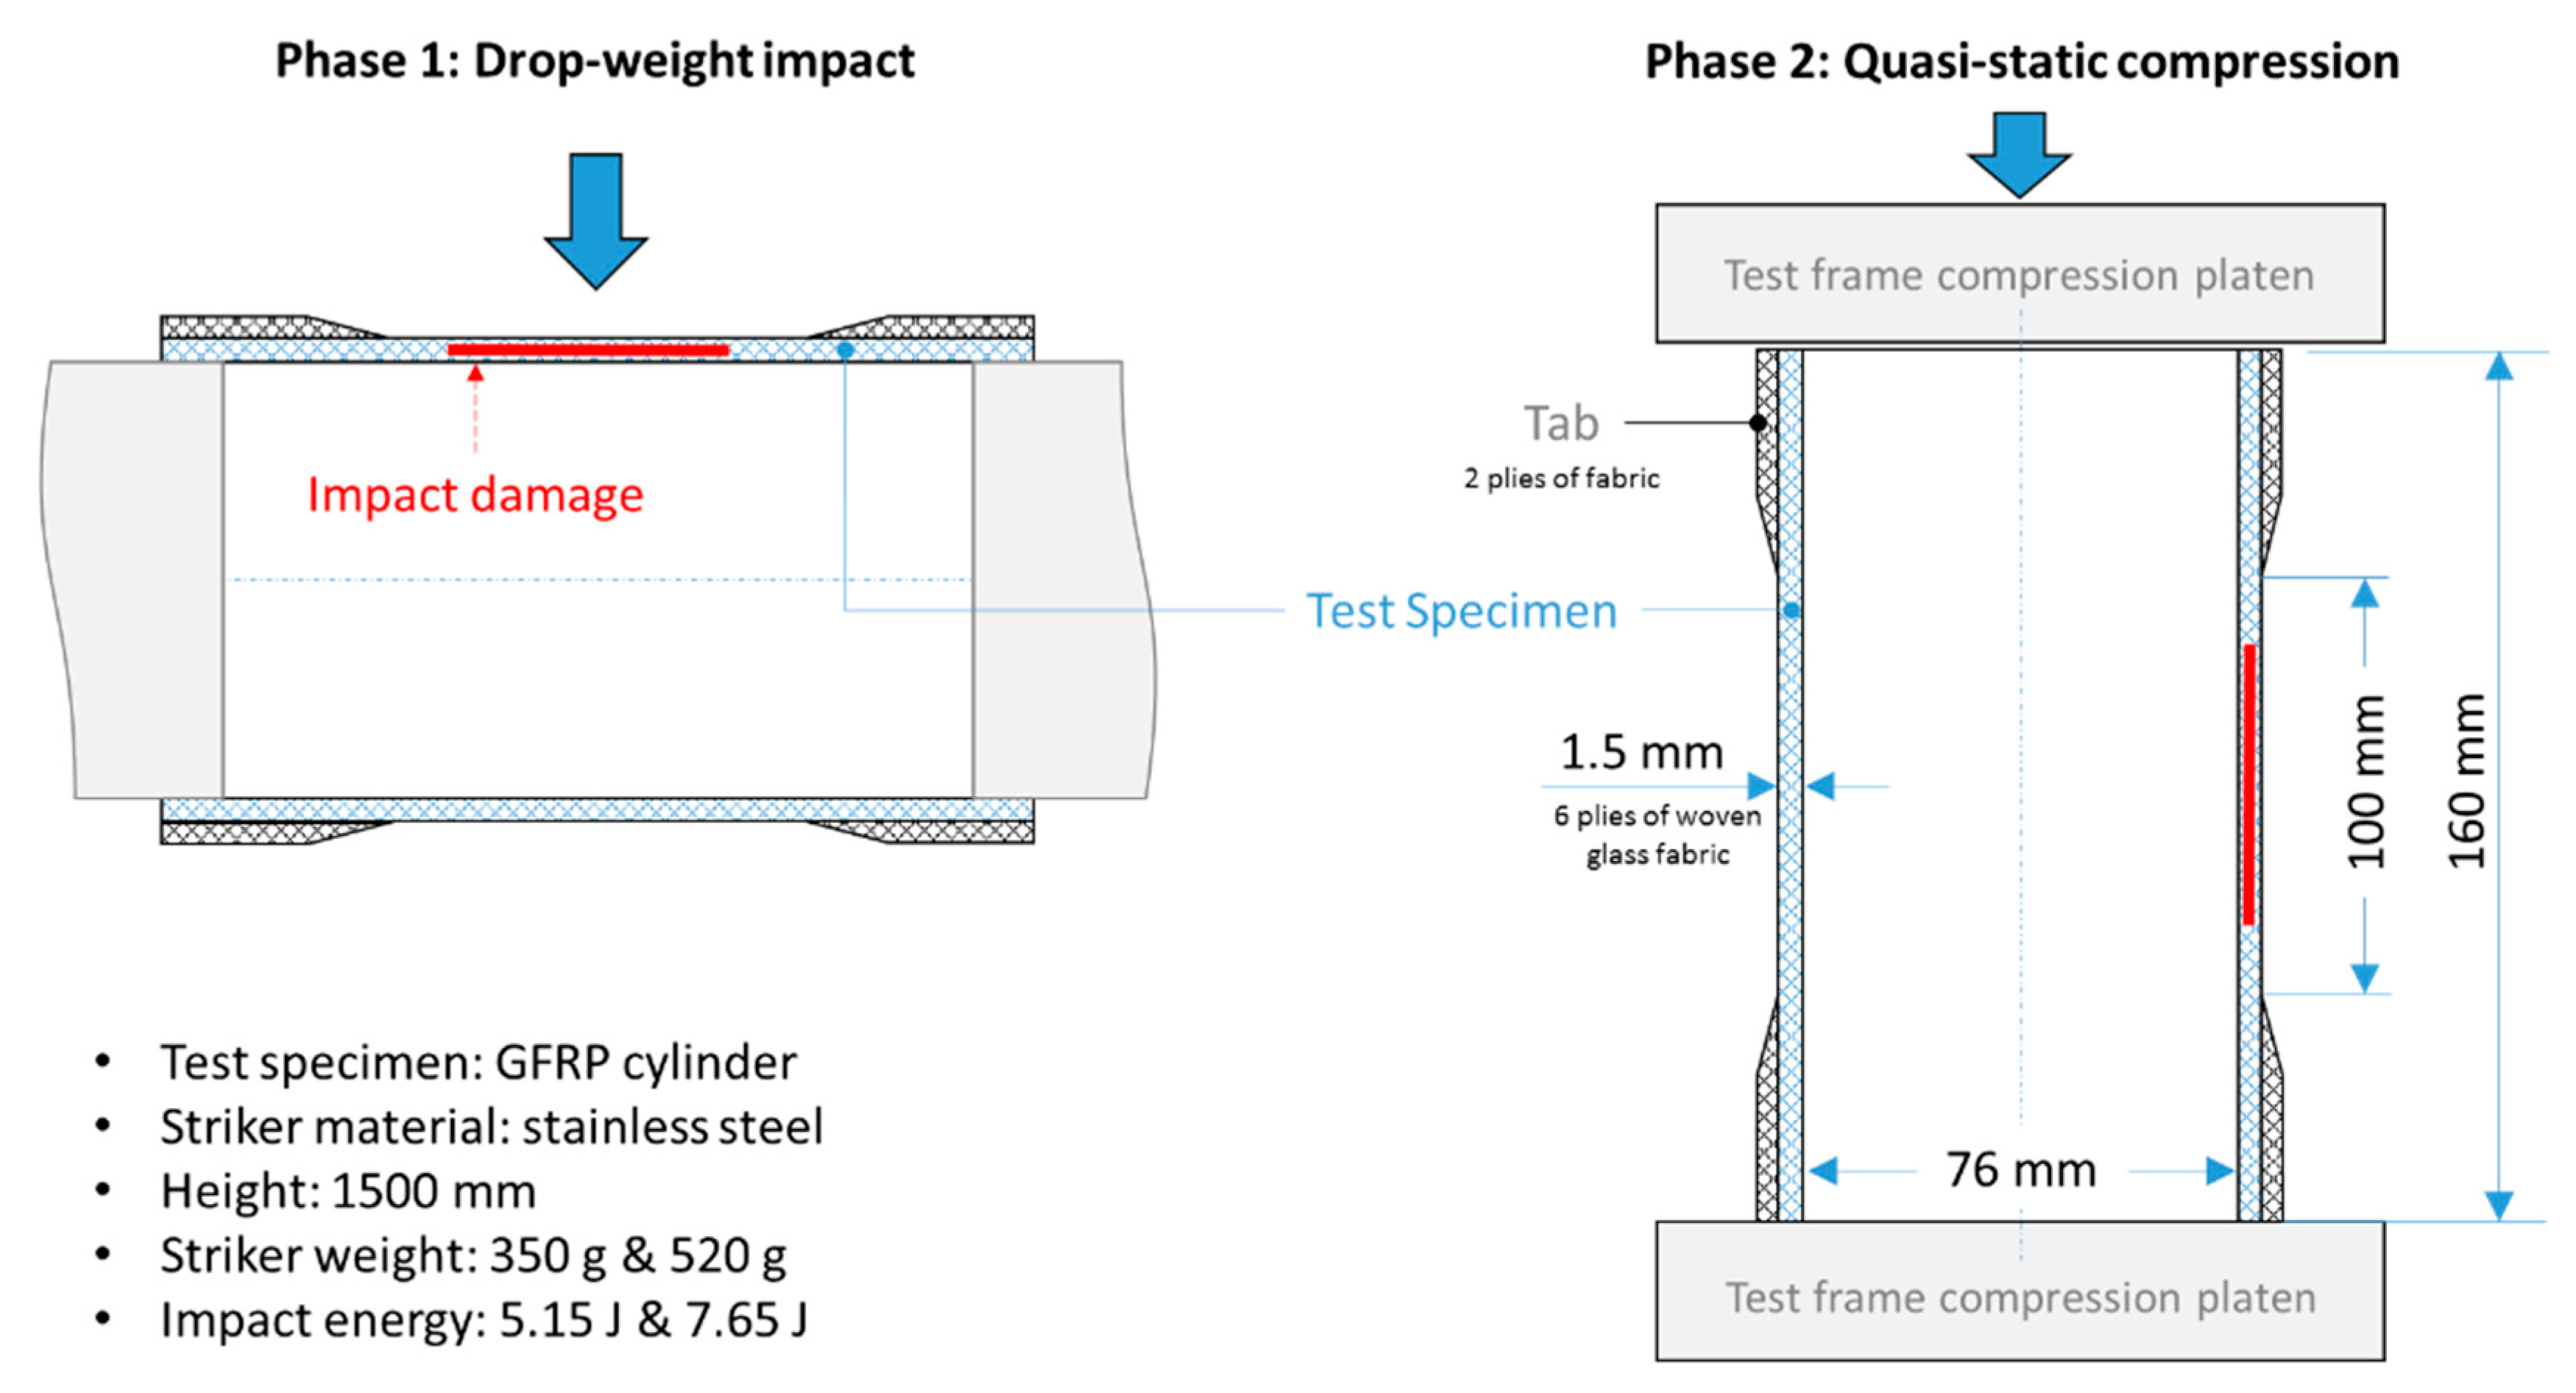
3.2. Testing of Composite Cylinders
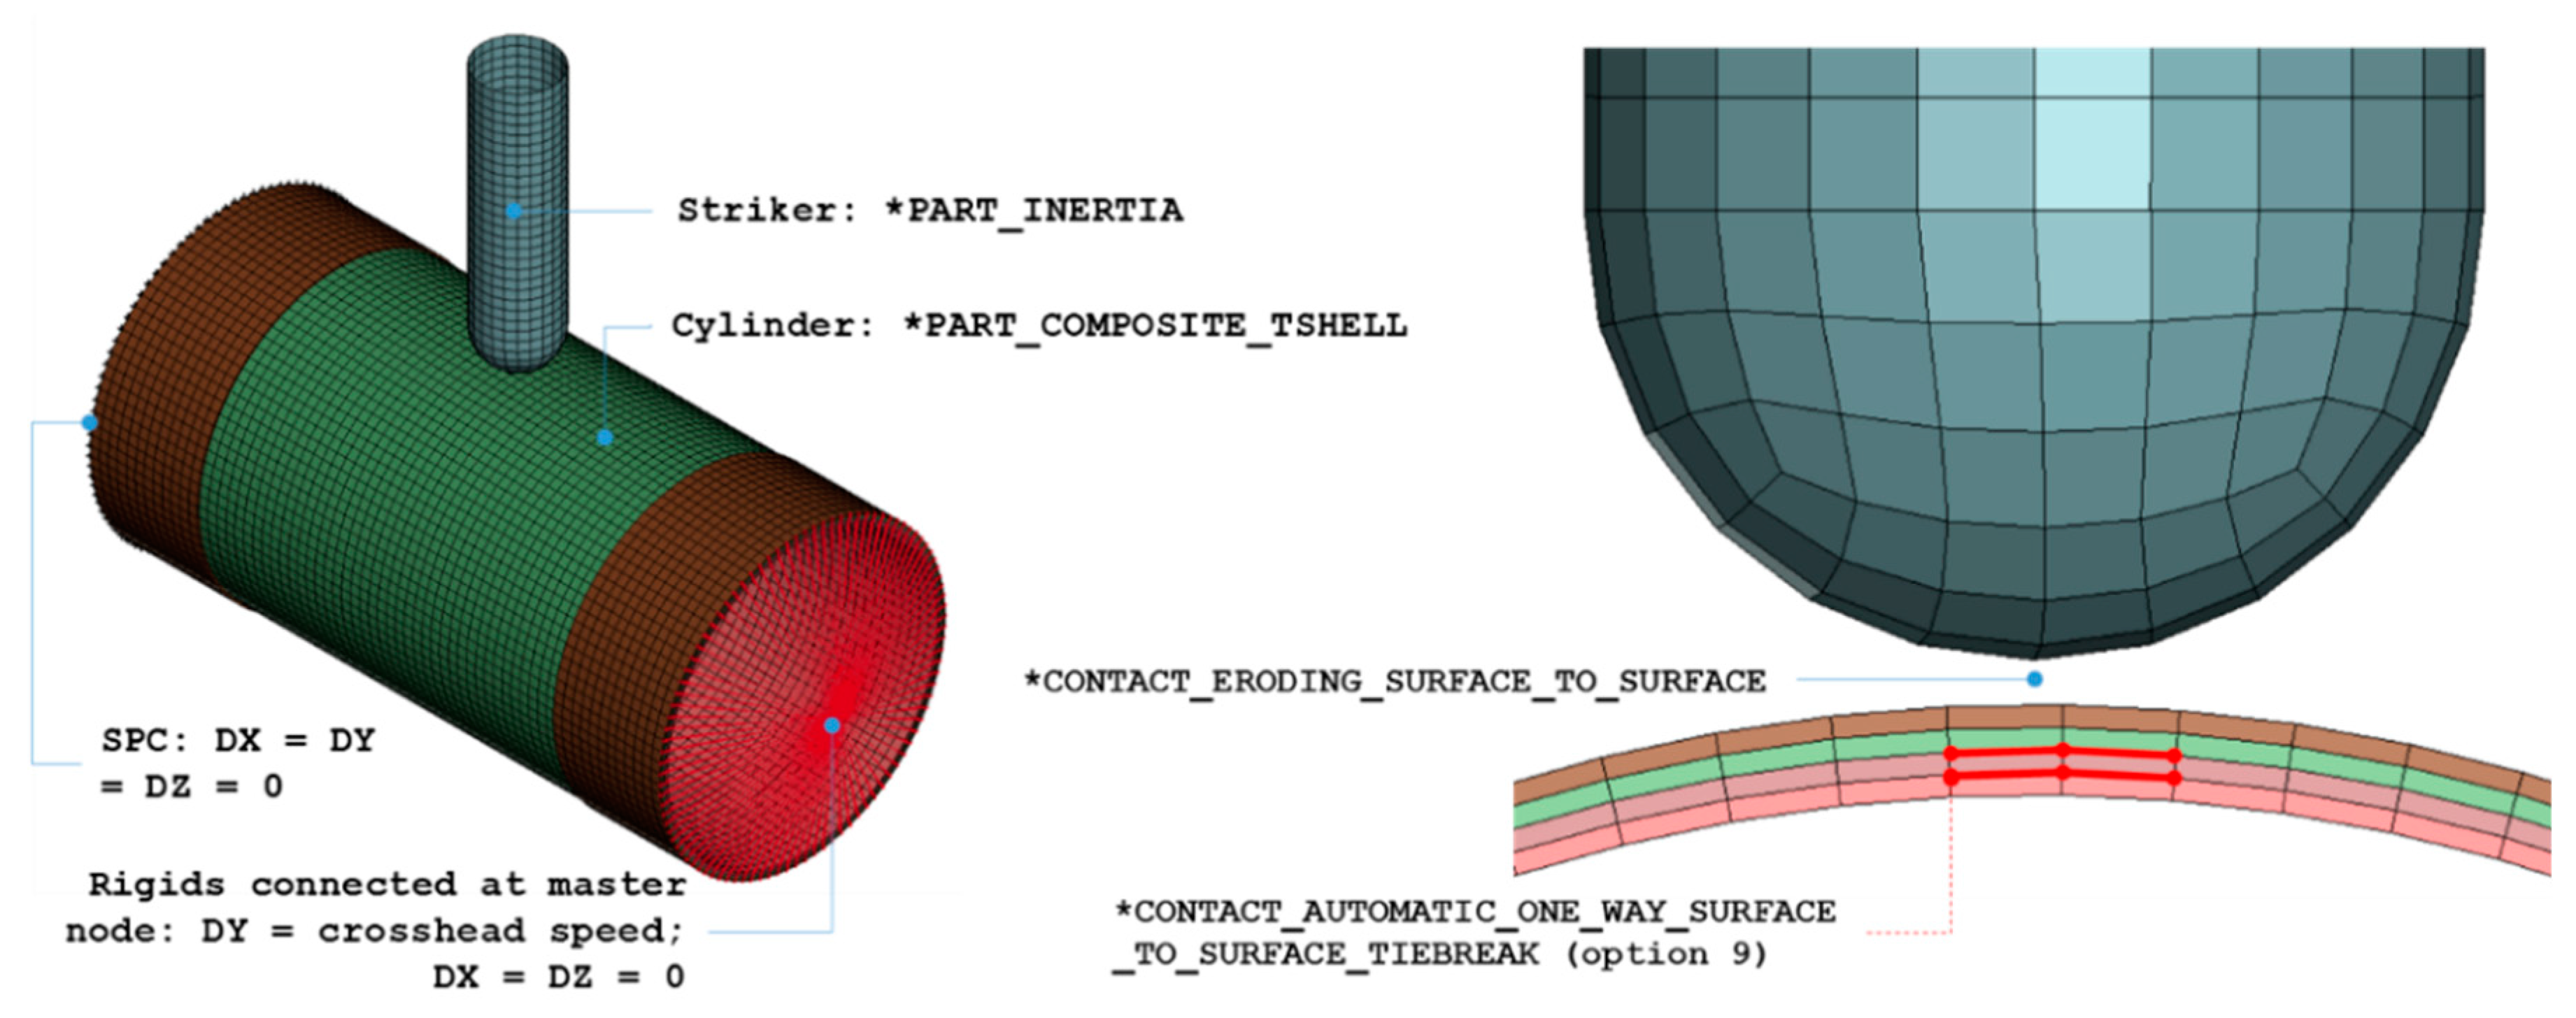
4. Modeling Techniques
5. Results and Discussion
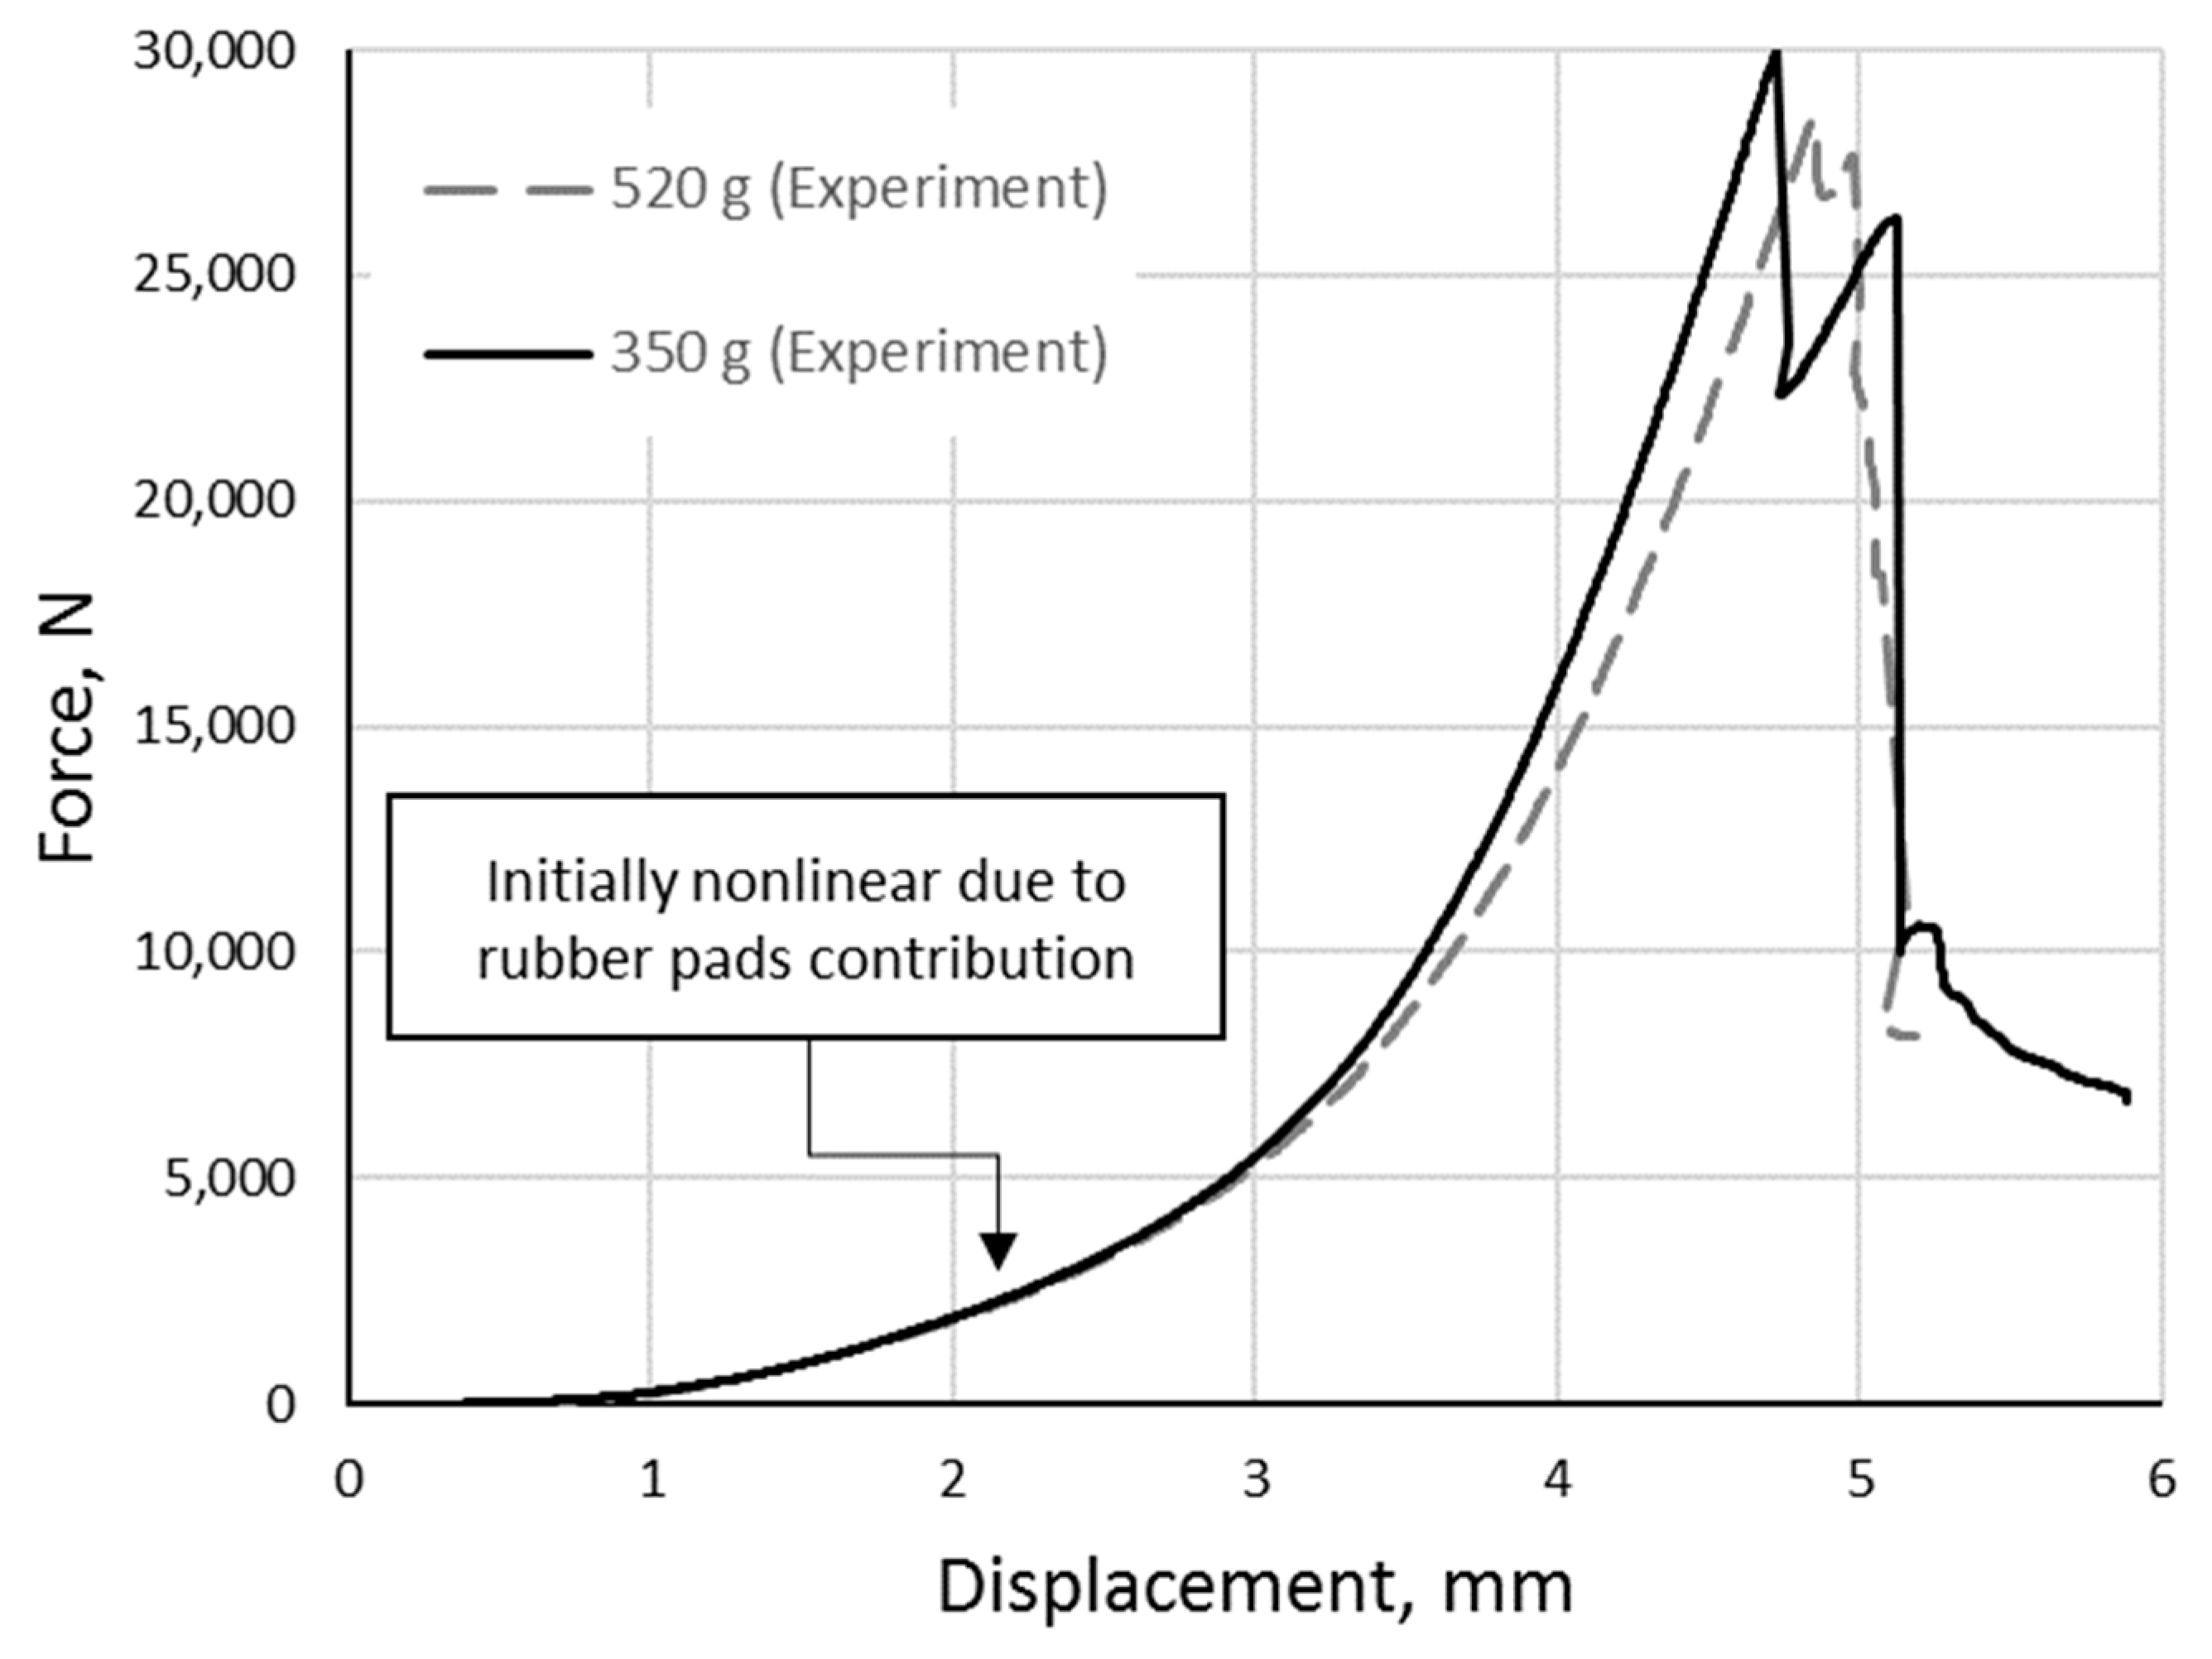
5.1. Experimental Results
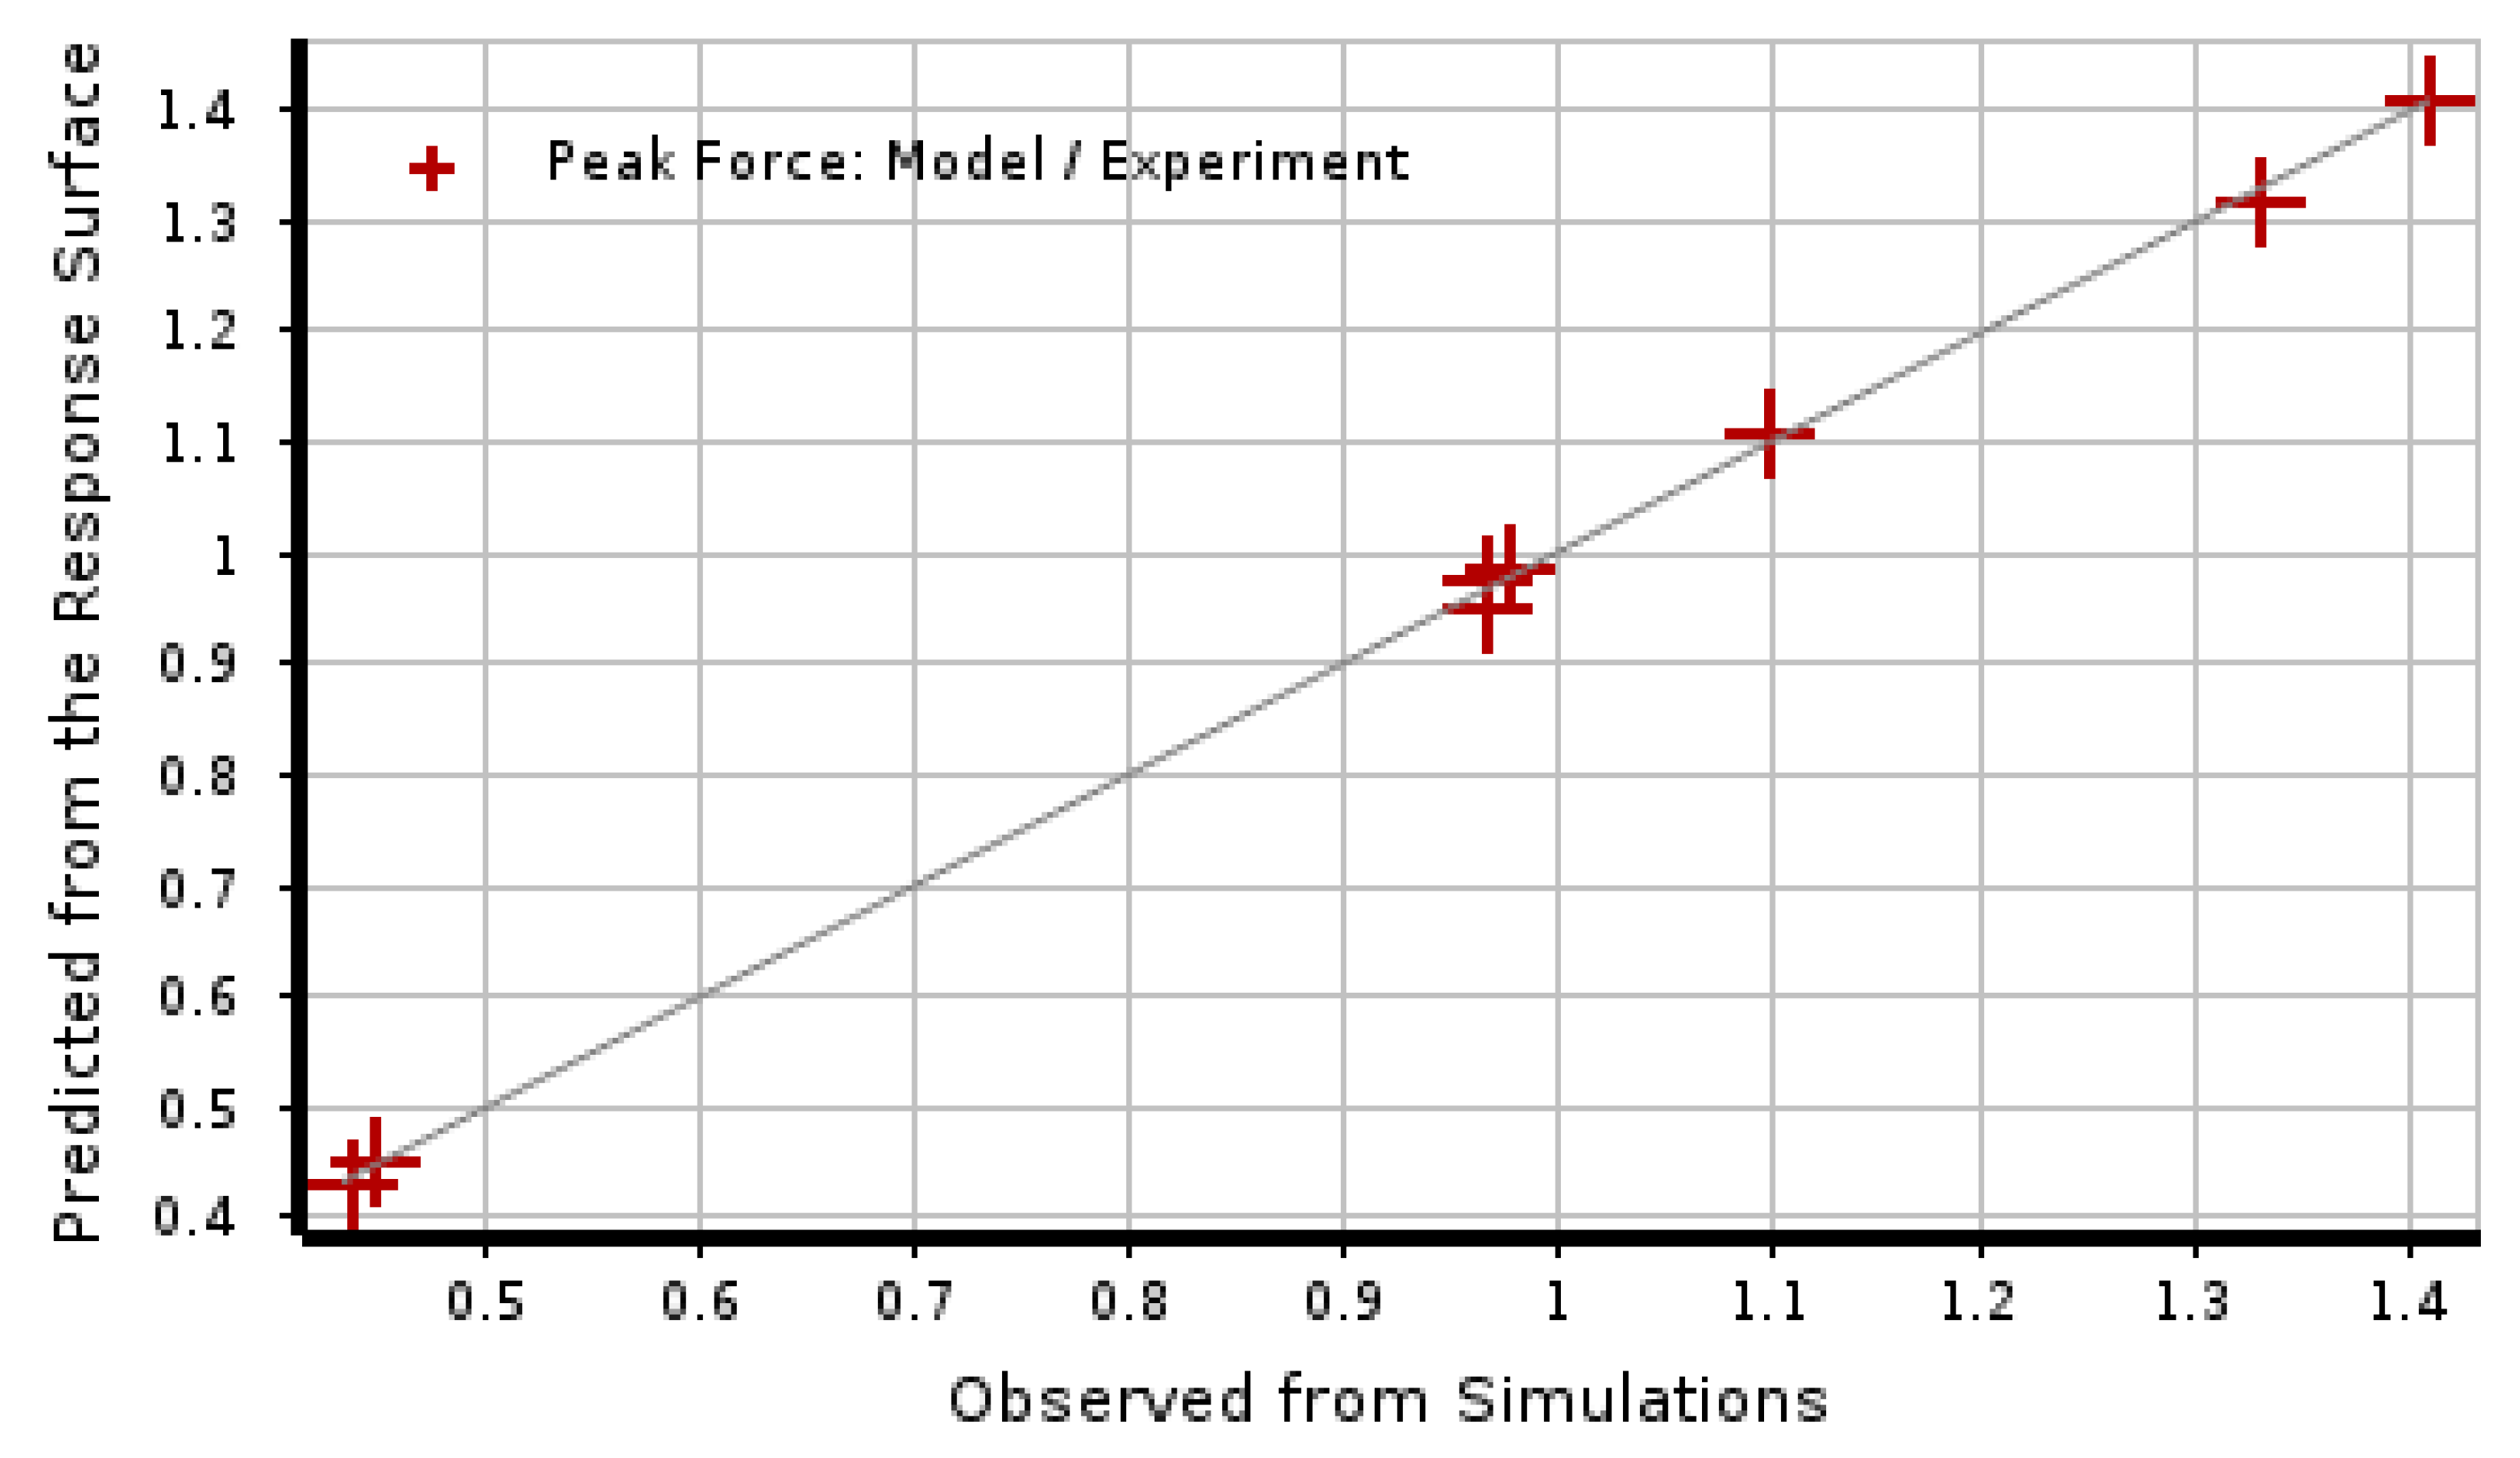
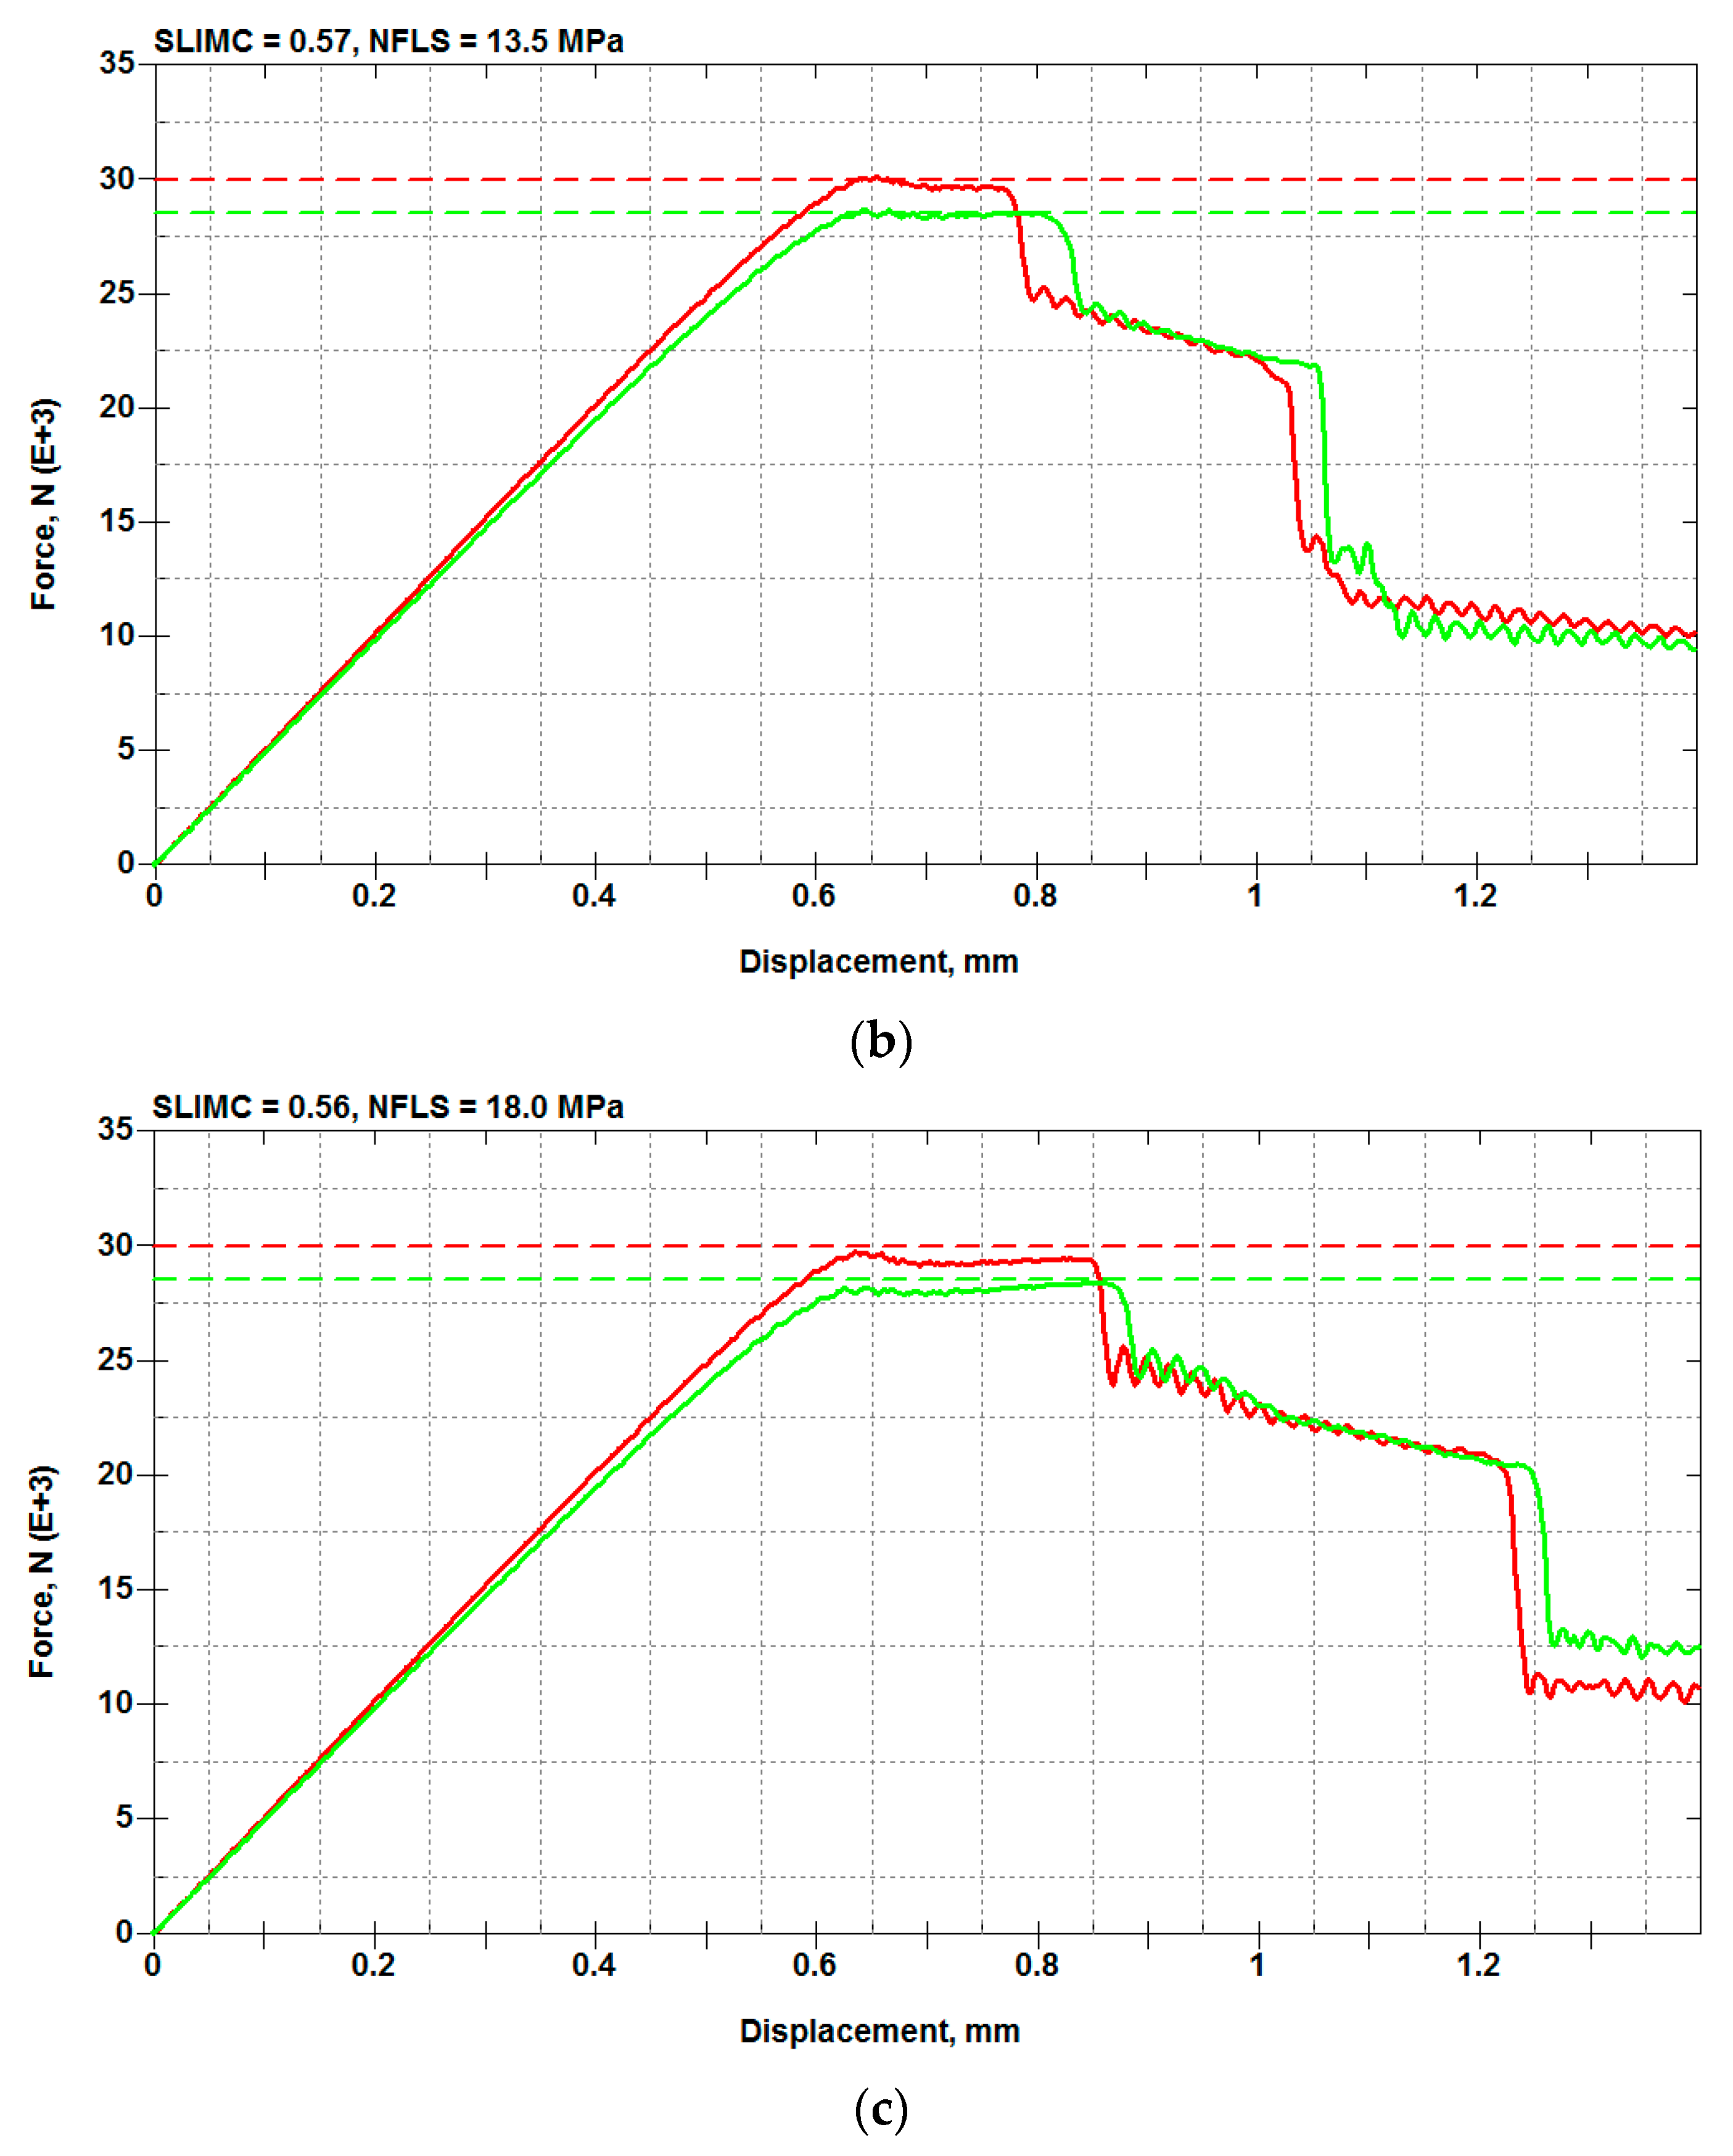
5.2. Load-Bearing Capacity: Calibration of SLIMC and NFLS Parameters
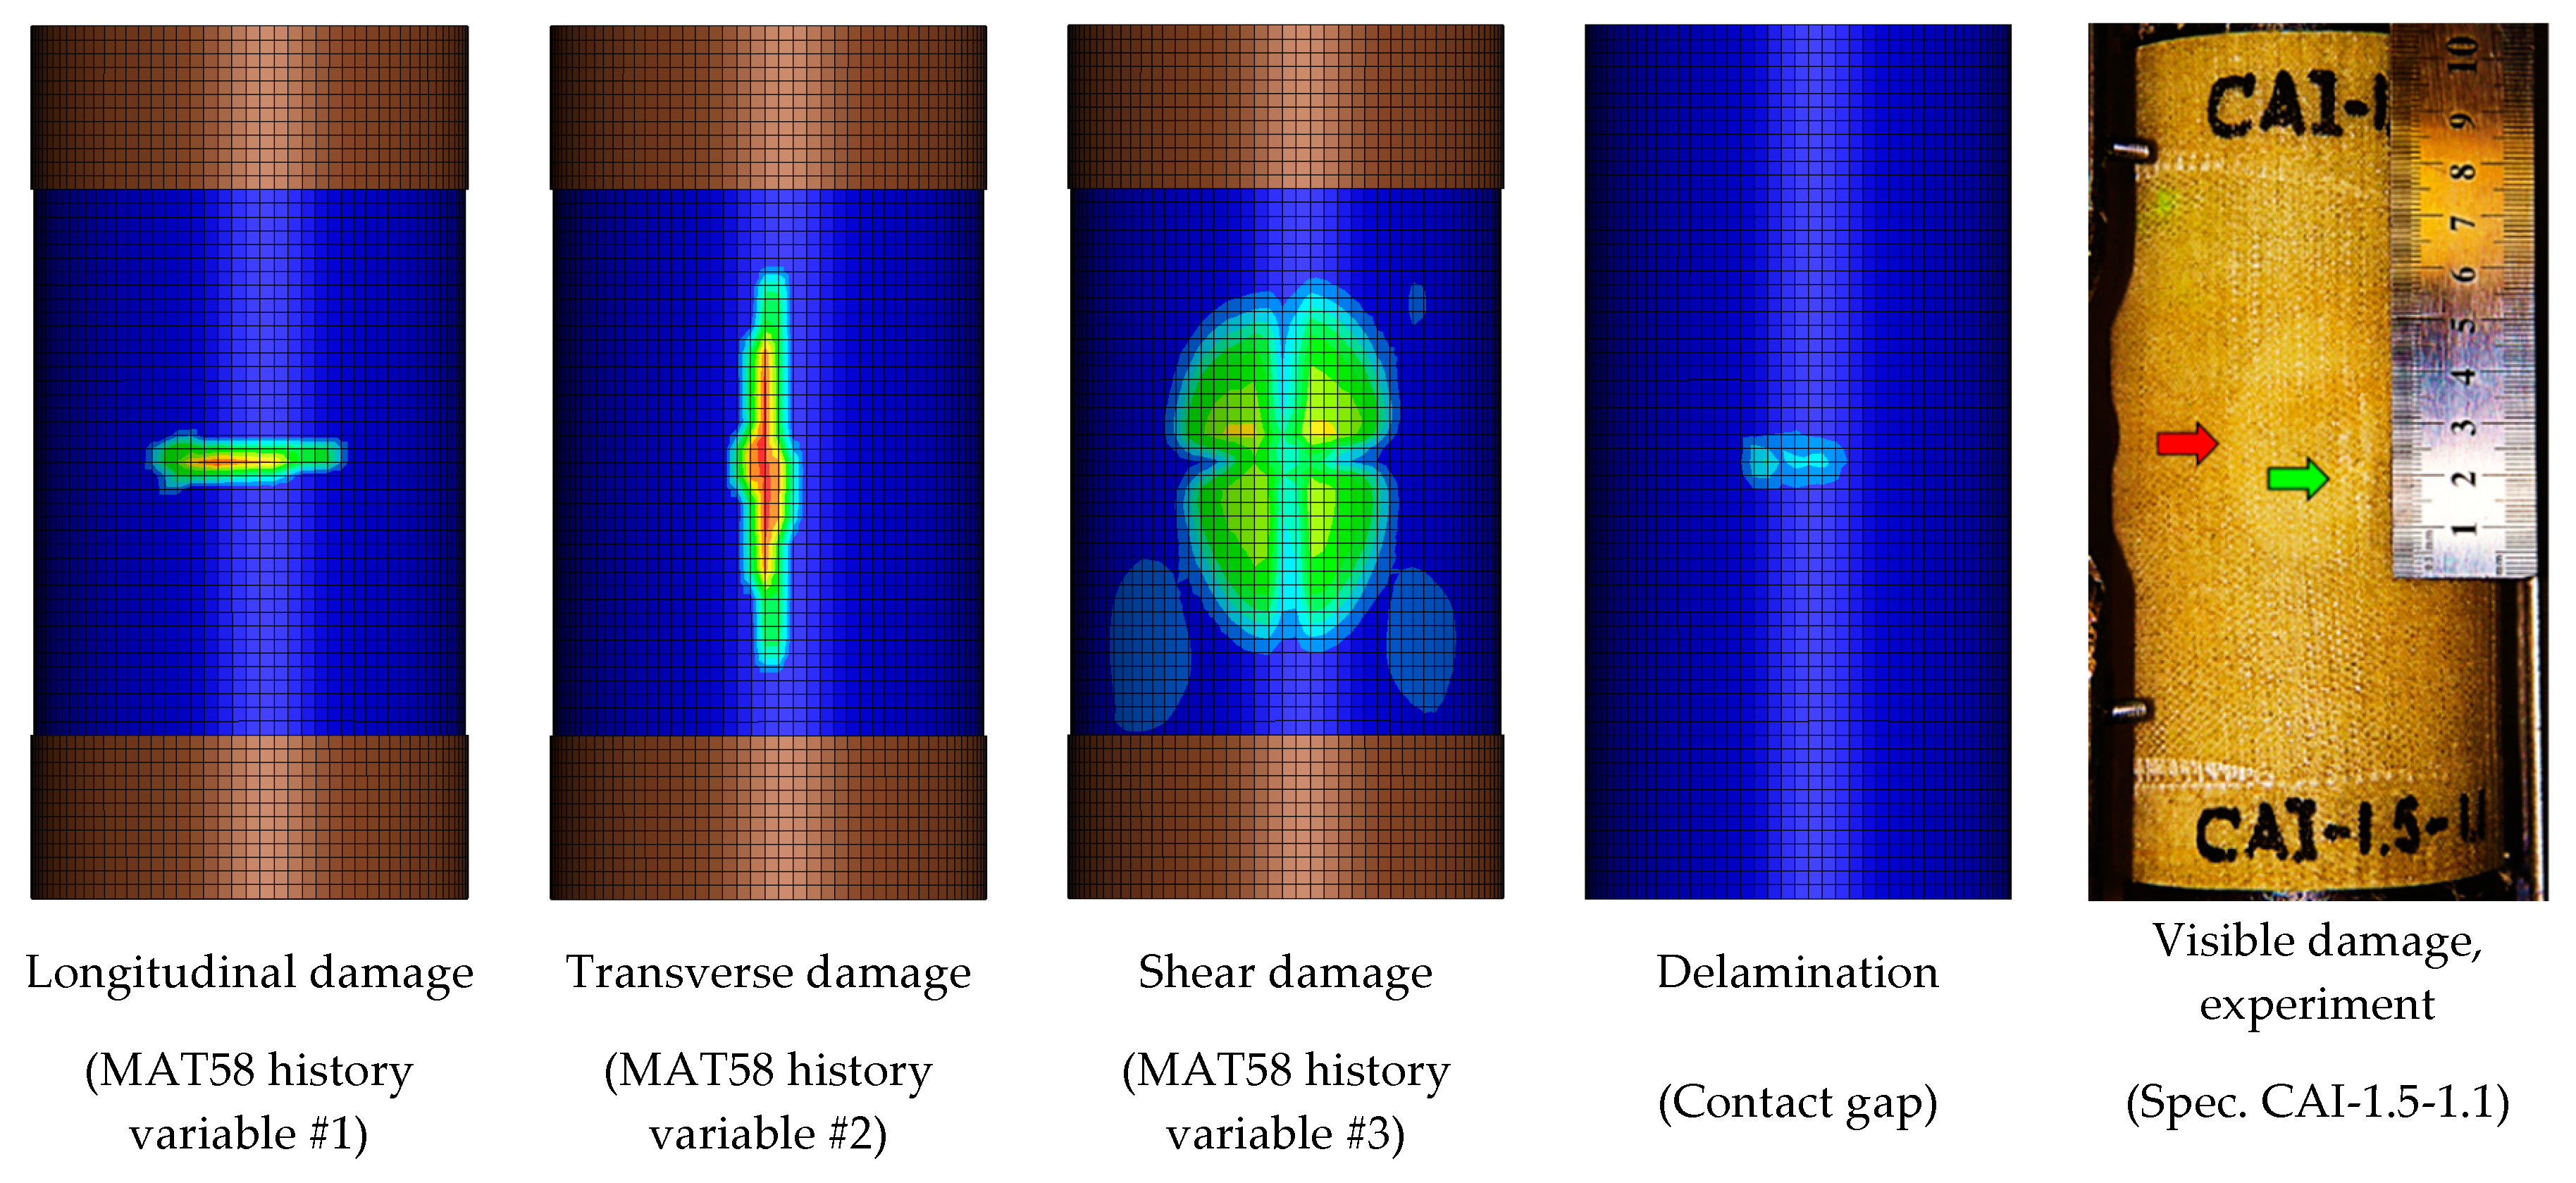
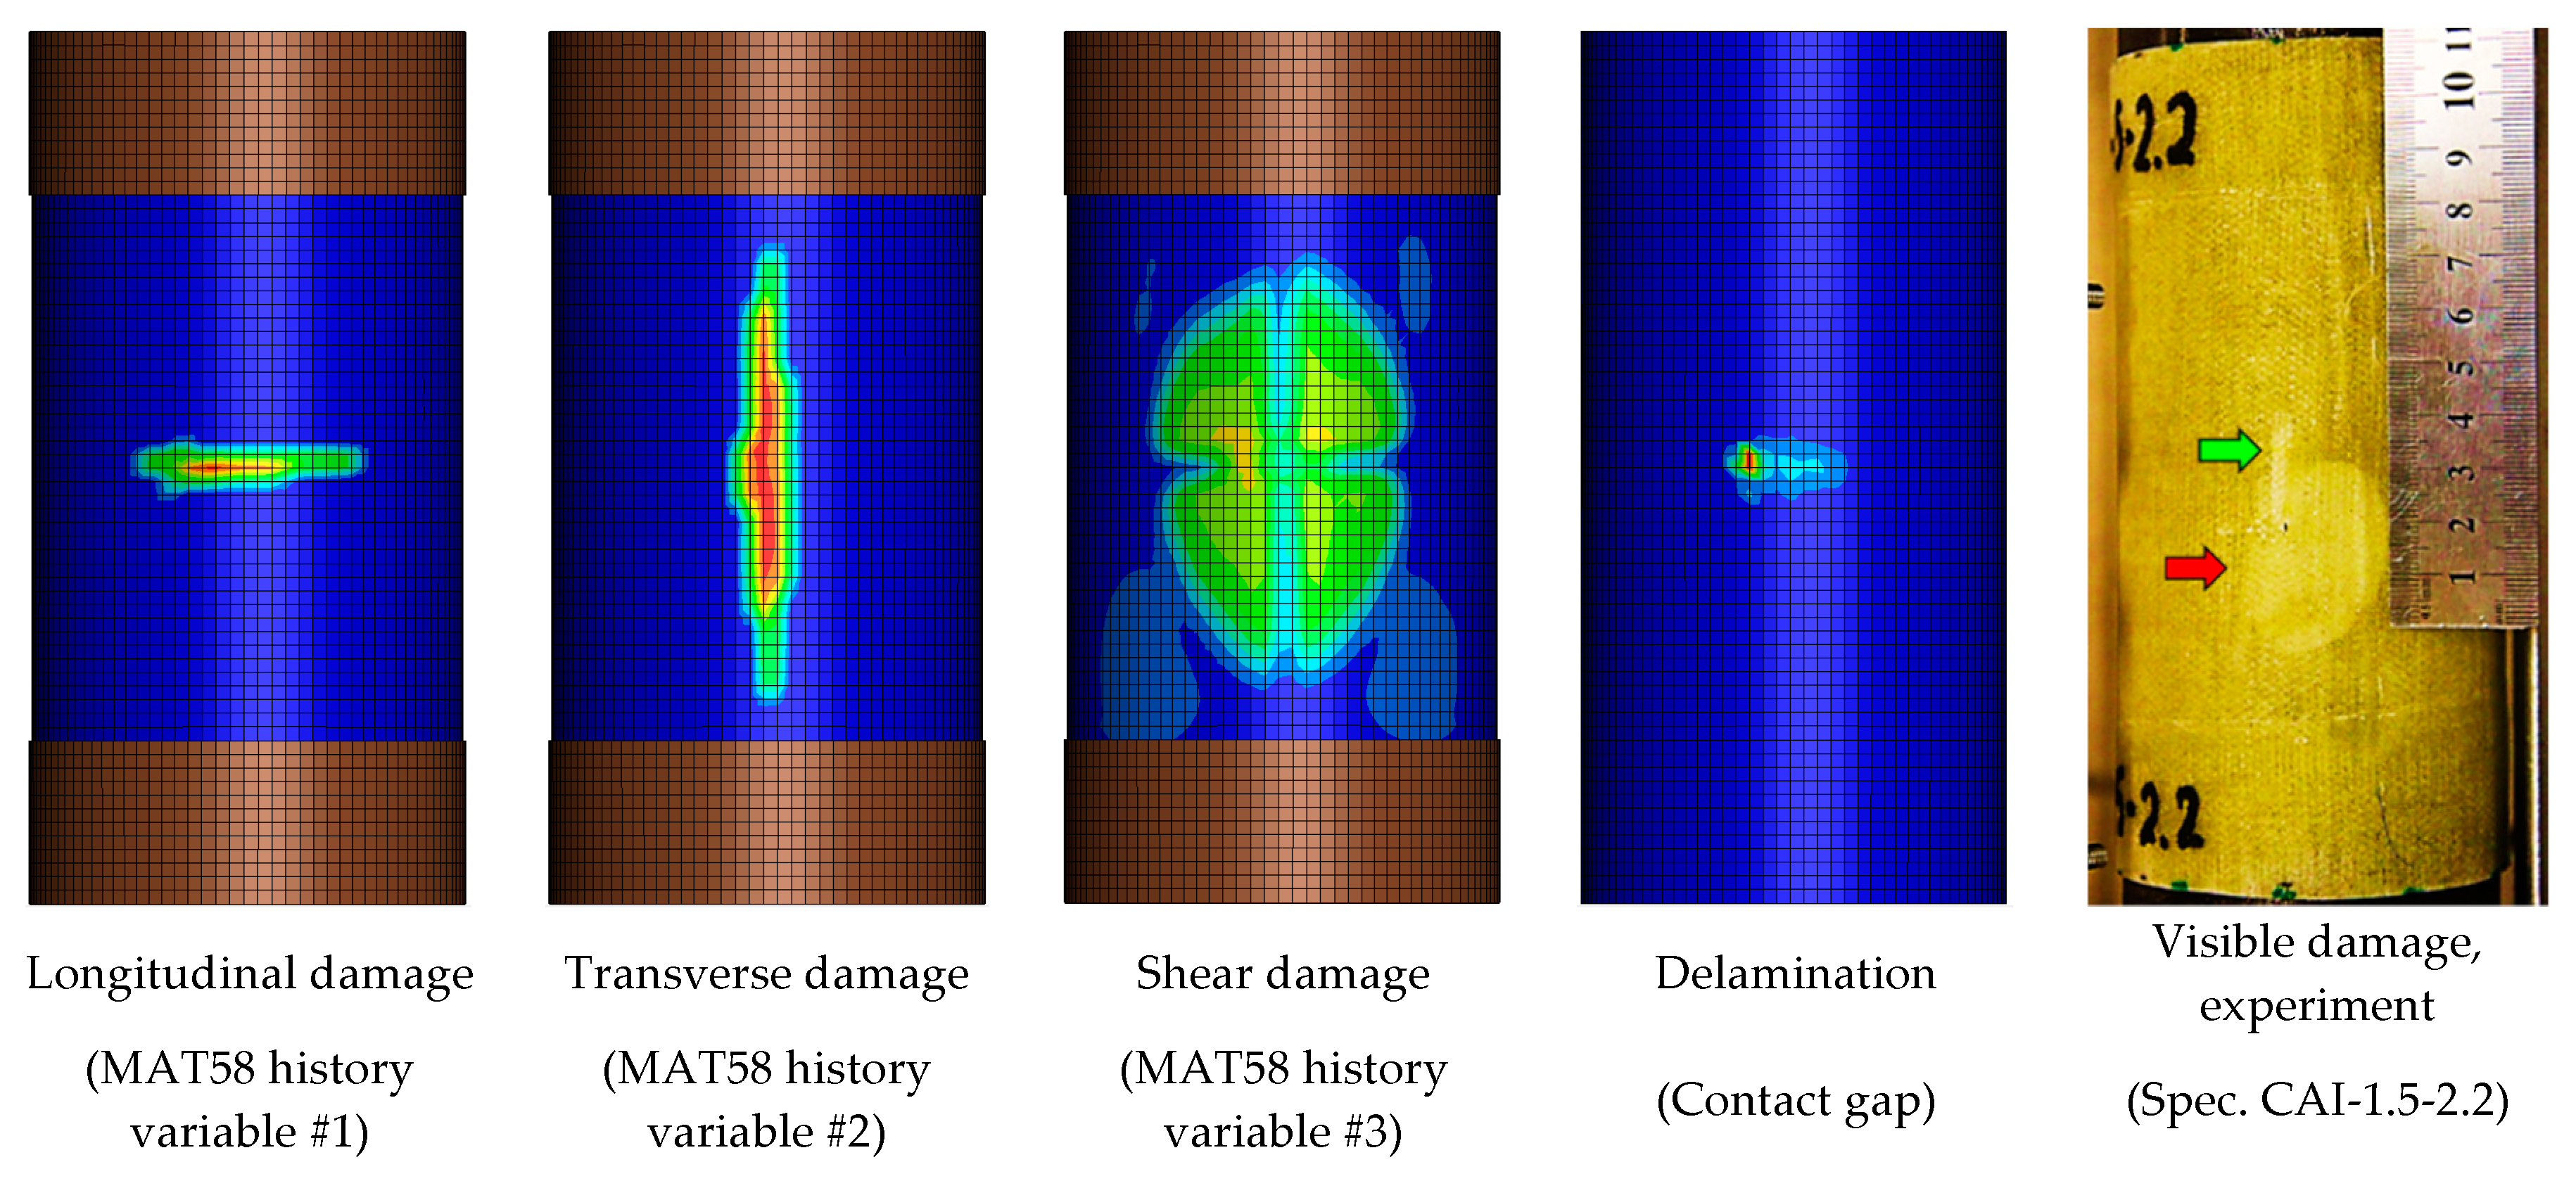
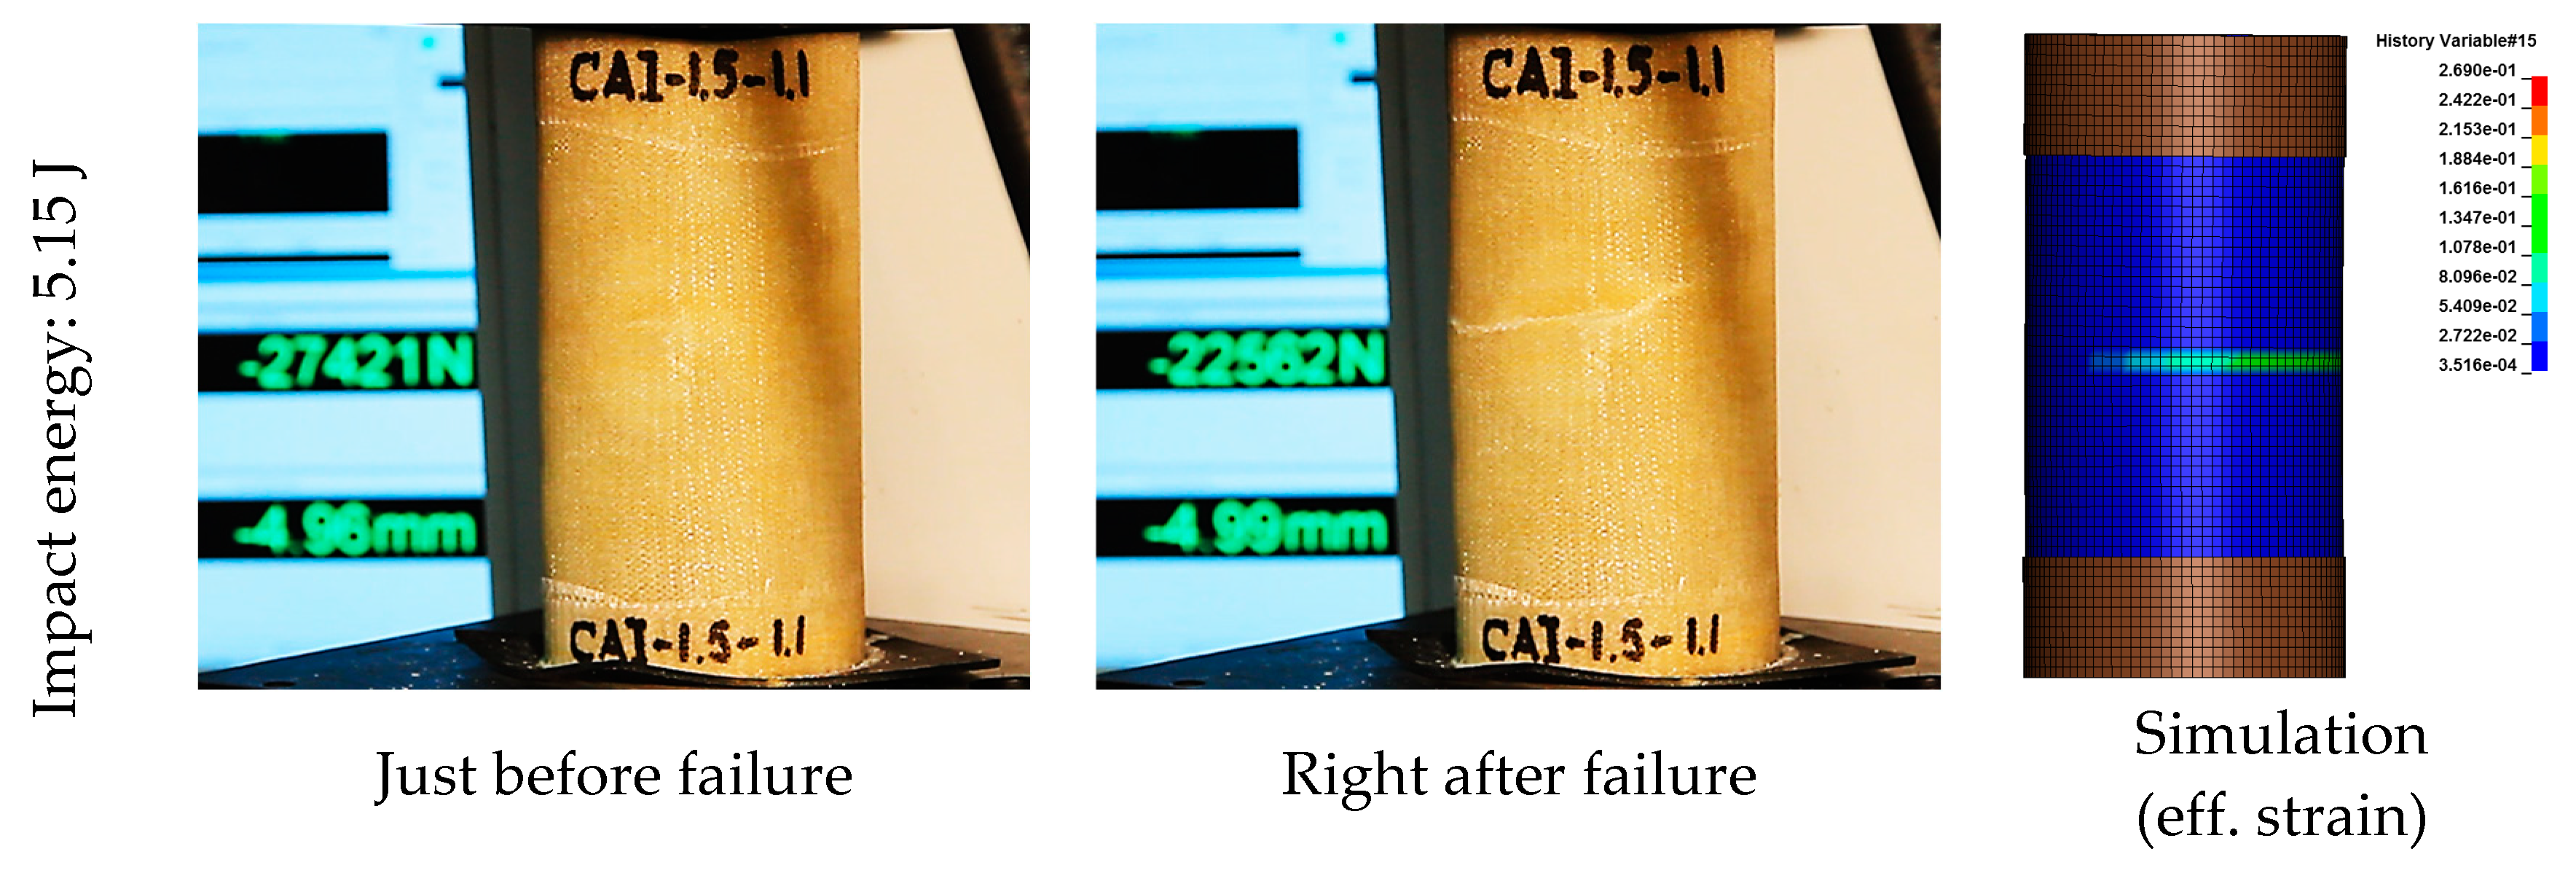
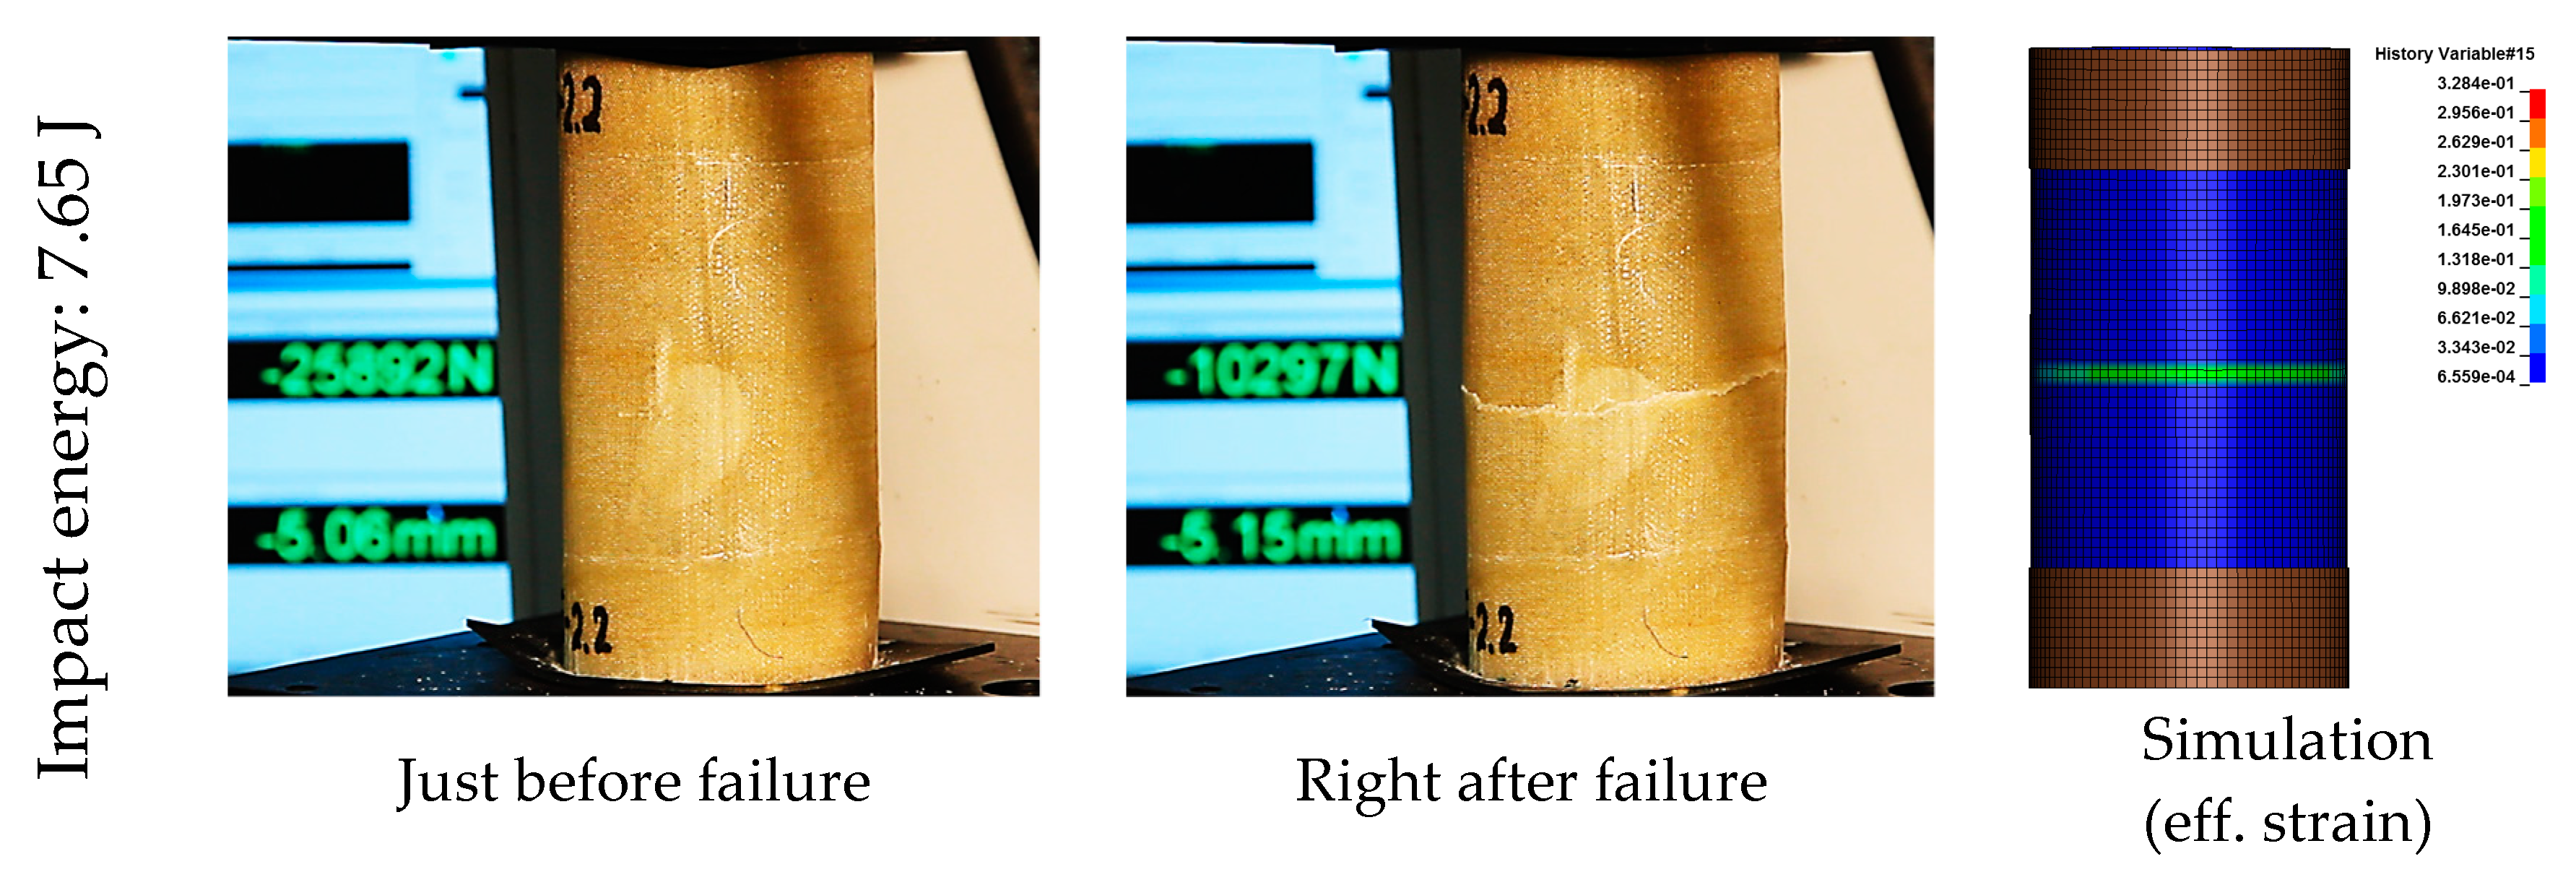
5.3. Predicted and Experimentally Observed Damage
6. Conclusions
Author Contributions
Funding
Conflicts of Interest
References
- Mouli, Y.S.C.; Upadhyay, C.S.; Mohite, P.M. Intra-ply Damage Modeling of Low-Velocity Impact on Composite Laminates. In International Conference on Emerging Trends in Engineering (ICETE); Springer: Berlin/Heidelberg, Germany, 2020; pp. 731–738. [Google Scholar]
- Moncayo, E.D.; Wagner, H.; Drechsler, K. Benchmarks for composite delamination using LS-DYNA: Low velocity impact. In Proceedings of the 6th LS-DYNA Anwenderforum, Frankenthal, Germany, 12–13 October 2007. [Google Scholar]
- Aymerich, F.; Dore, F.; Priolo, P. Prediction of impact-induced delamination in cross-ply composite laminates using cohesive interface elements. Compos. Sci. Technol. 2008, 68, 2383–2390. [Google Scholar] [CrossRef] [Green Version]
- Di Caprio, F.; Langella, A.; Lopresto, V.; Caprino, G. Numerical, Experimental and analytical correlation for predicting the structural behavior of composite structures under impact. Procedia Eng. 2016, 167, 80–87. [Google Scholar] [CrossRef]
- Long, S.; Yao, X.; Zhang, X. Delamination prediction in composite laminates under low-velocity impact. Compos. Struct. 2015, 132, 290–298. [Google Scholar] [CrossRef]
- Zhang, J.; Li, Z.; Zhang, Q.; Huili, Y. Study of fiber modulus effect on impact energy absorption characteristics of composite laminates at normal and oblique impacts. Mater. Res. Express 2019, 6, 085610. [Google Scholar] [CrossRef]
- Cherniaev, A.; Butcher, C.; Montesano, J. Predicting the axial crush response of CFRP tubes using three damage-based constitutive models. Thin-Walled Struct. 2018, 129, 349–364. [Google Scholar] [CrossRef]
- De Luca, A.; Caputo, F. A review on analytical failure criteria for composite materials. AIMS Mater. Sci. 2017, 4, 1165–1185. [Google Scholar] [CrossRef]
- Lin, S.; Waas, A.M. Experimental and high-fidelity computational investigations on the low velocity impact damage of laminated composite materials. In Proceedings of the AIAA Scitech 2020 Forum, Orlando, FL, USA, 6–10 January 2020; p. 724. [Google Scholar]
- Borkowski, L.; Kumar, R.S.; Palliyaguru, U.R. Mechanics-based modeling approach for rapid prediction of low velocity impact damage in composite laminates. In Proceedings of the AIAA Scitech 2020 Forum, Orlando, FL, USA, 6–10 January 2020; p. 726. [Google Scholar]
- James, R.; Mei, H.; Haider, M.F.; Giurgiutiu, V. Challenges of generating controlled one-inch impact damage in thick CFRP composites. In Proceedings of the AIAA Scitech 2020 Forum, Orlando, FL, USA, 6–10 January 2020; p. 723. [Google Scholar]
- Heimbs, S.; Heller, S.; Middendorf, P. Simulation of low velocity impact on composite plates with compressive preload. In Proceedings of the 7th LS-DYNA Anwenderforum, Frankenthal, Germany, 10–12 October 2008. [Google Scholar]
- Dang, T.D.; Hallet, S.R.; Kim, B.C.; Cahain, Y.L.; Butler, R.; Liu, W. Modelling of as manufactured geometry for prediction of impact and compression after impact behaviour of variable angle tow laminates. J. Compos. Mater. 2014, 49, 1423–1438. [Google Scholar] [CrossRef] [Green Version]
- McQuigg, T.D. Compression after Impact Experiments and Analysis on Honeycomb Core Sandwich Panels with Thin Facesheets. Ph.D. Thesis, Virginia Polytechnic Institute and State University, Blacksburg, VA, USA, 2011. [Google Scholar]
- James, C.T.; Watson, A.; Cunningham, P.R. Numerical modelling of the compression-after-impact performance of a composite sandwich panel. J. Sandw. Struct. Mater. 2015, 17, 376–398. [Google Scholar] [CrossRef] [Green Version]
- ASTM Test Method D3039/D3039M-17, Test Method for Tensile Properties of Polymer Matrix Composite Materials; ASTM International: West Conshohocken, PA, USA, 2017.
- ASTM Test Method D3518/D3518M-13, Standard Test Method for In-Plane Shear Response of Polymer Matrix Composite Materials by Tensile Test of a ±45° Laminate; ASTM International: West Conshohocken, PA, USA, 2013.
- ASTM Test Method D3410/D3410M-16, Standard Test Method for Compressive Properties of Polymer Matrix Composite Materials with Unsupported Gage Section by Shear Loading; ASTM International: West Conshohocken, PA, USA, 2016.
- ASTM Test Method D5528-13, Standard Test Method for Mode I Interlaminar Fracture Toughness of Unidirectional Fiber-Reinforced Polymer Matrix Composites; ASTM International: West Conshohocken, PA, USA, 2013.
- Carlsson, L.A.; Adams, D.F.; Pipes, R.B. Experimental Characterization of Advanced Composite Materials, 4th ed.; CRC Press: Boca Raton, FL, USA, 2014. [Google Scholar]
- Ls-Dyna, Keyword User’s Manual, Volume II: Material Models; Livermore Software Technology Corporation: Livermore, CA, USA, 2013.
- Schweizerhof, K.; Weimar, K.; Münz, T.; Rottner, T. Crashworthiness analysis with enhanced composite material models in LS-DYNA—Merits and limits. In Proceedings of the LS-DYNA Conference, Detroit, MI, USA, 21–22 September 1998. [Google Scholar]
- de Moura, M.F.S.F.; Gongalves, J.P.M.; Marques, A.T.; Castro, P.M.S.T. Prediction of compressive strength of carbon-epoxy laminates containing delamination by using a mixed-mode damage model. Compos. Struct. 2000, 50, 151–161. [Google Scholar] [CrossRef]
- Davila, C.G.; Camanho, P.P. Decohesion elements using two and three-parameter mixed-mode criteria. In Proceedings of the American Helicopter Society Conference, Williamsburg, VA, USA, 29 October–1 November 2001. [Google Scholar]
- Graf, T.; Haufe, A.; Andrade, F. Adhesives modeling with LS-DYNA: Recent developments and future work. In Proceedings of the Nordic LS-DYNA Forum, Stuttgart, Germany, 12–13 October 2014. [Google Scholar]


| Parameter | Meaning | Units | Value or Range | Comment for the Chosen Initial Value |
|---|---|---|---|---|
| TSIZE | Time step for automatic element deletion. | s | 1E-10 | Disabled by choosing a very small time step value for element deletion. |
| ERODS | Maximum effective strain for element failure. If lower than zero, the element fails when effective strain calculated from the full strain tensor exceeds ERODS. | mm/mm | −2.00 | Chosen to be significantly higher than any directional strain at failure initiation. |
| SLIMT1 | Factor to determine the minimum stress limit after stress maximum (fiber tension). | - | 0.10 | A recommended value [21] |
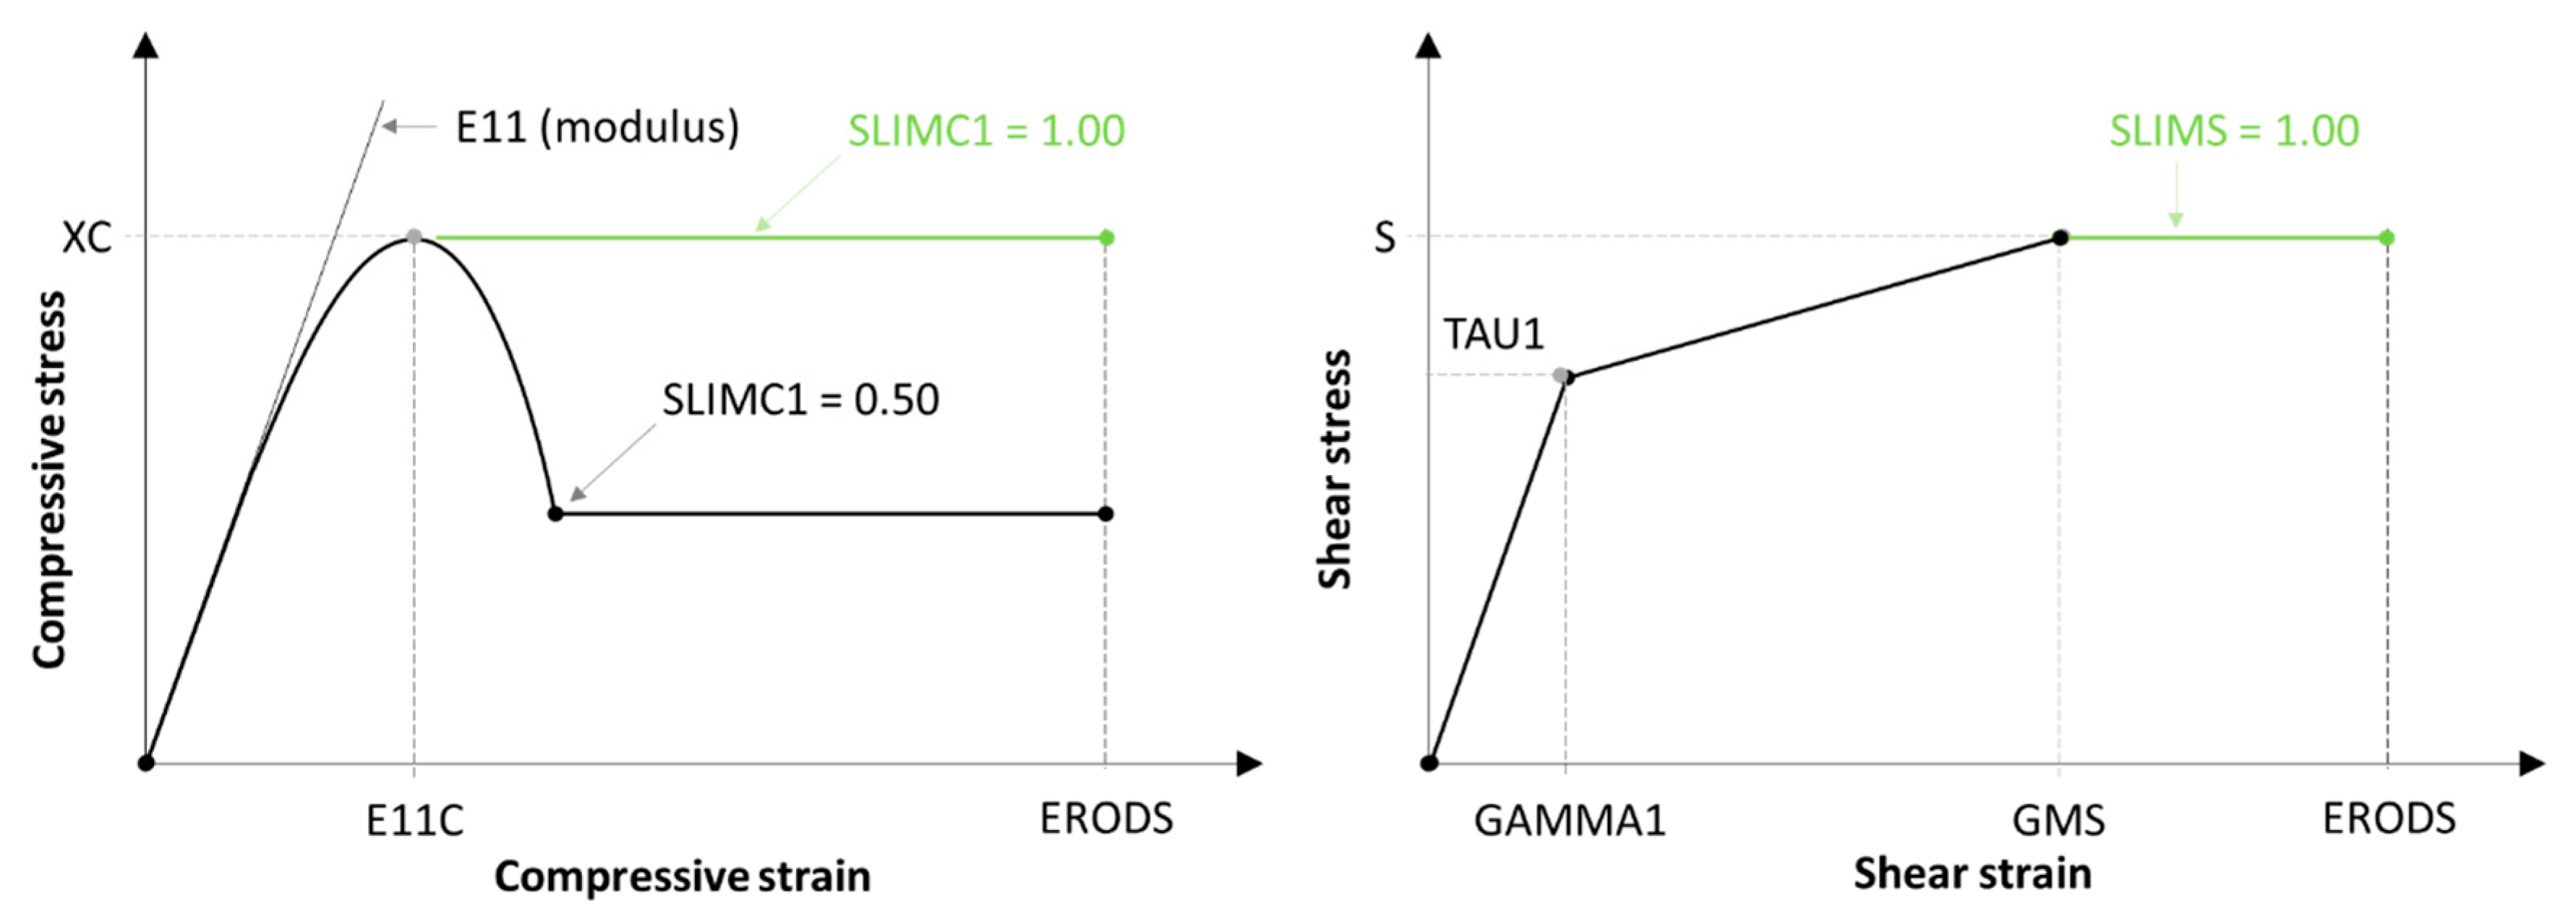
| SLIMC1 | Factor to determine the minimum stress limit after stress maximum (fiber compression). | - | 0.1–1.0 | See discussion in Section 4. |
| SLIMT2 | Factor to determine the minimum stress limit after stress maximum (matrix tension). | - | 0.10 | A recommended value [21] |
| SLIMC2 | Factor to determine the minimum stress limit after stress maximum (matrix compression). | - | 0.1–1.0 | See discussion in Section 4. |
| SLIMS | Factor to determine the minimum stress limit after stress maximum (shear). | - | 1.00 | A recommended value [21] |
| Property | Value or Range | Rationale |
|---|---|---|
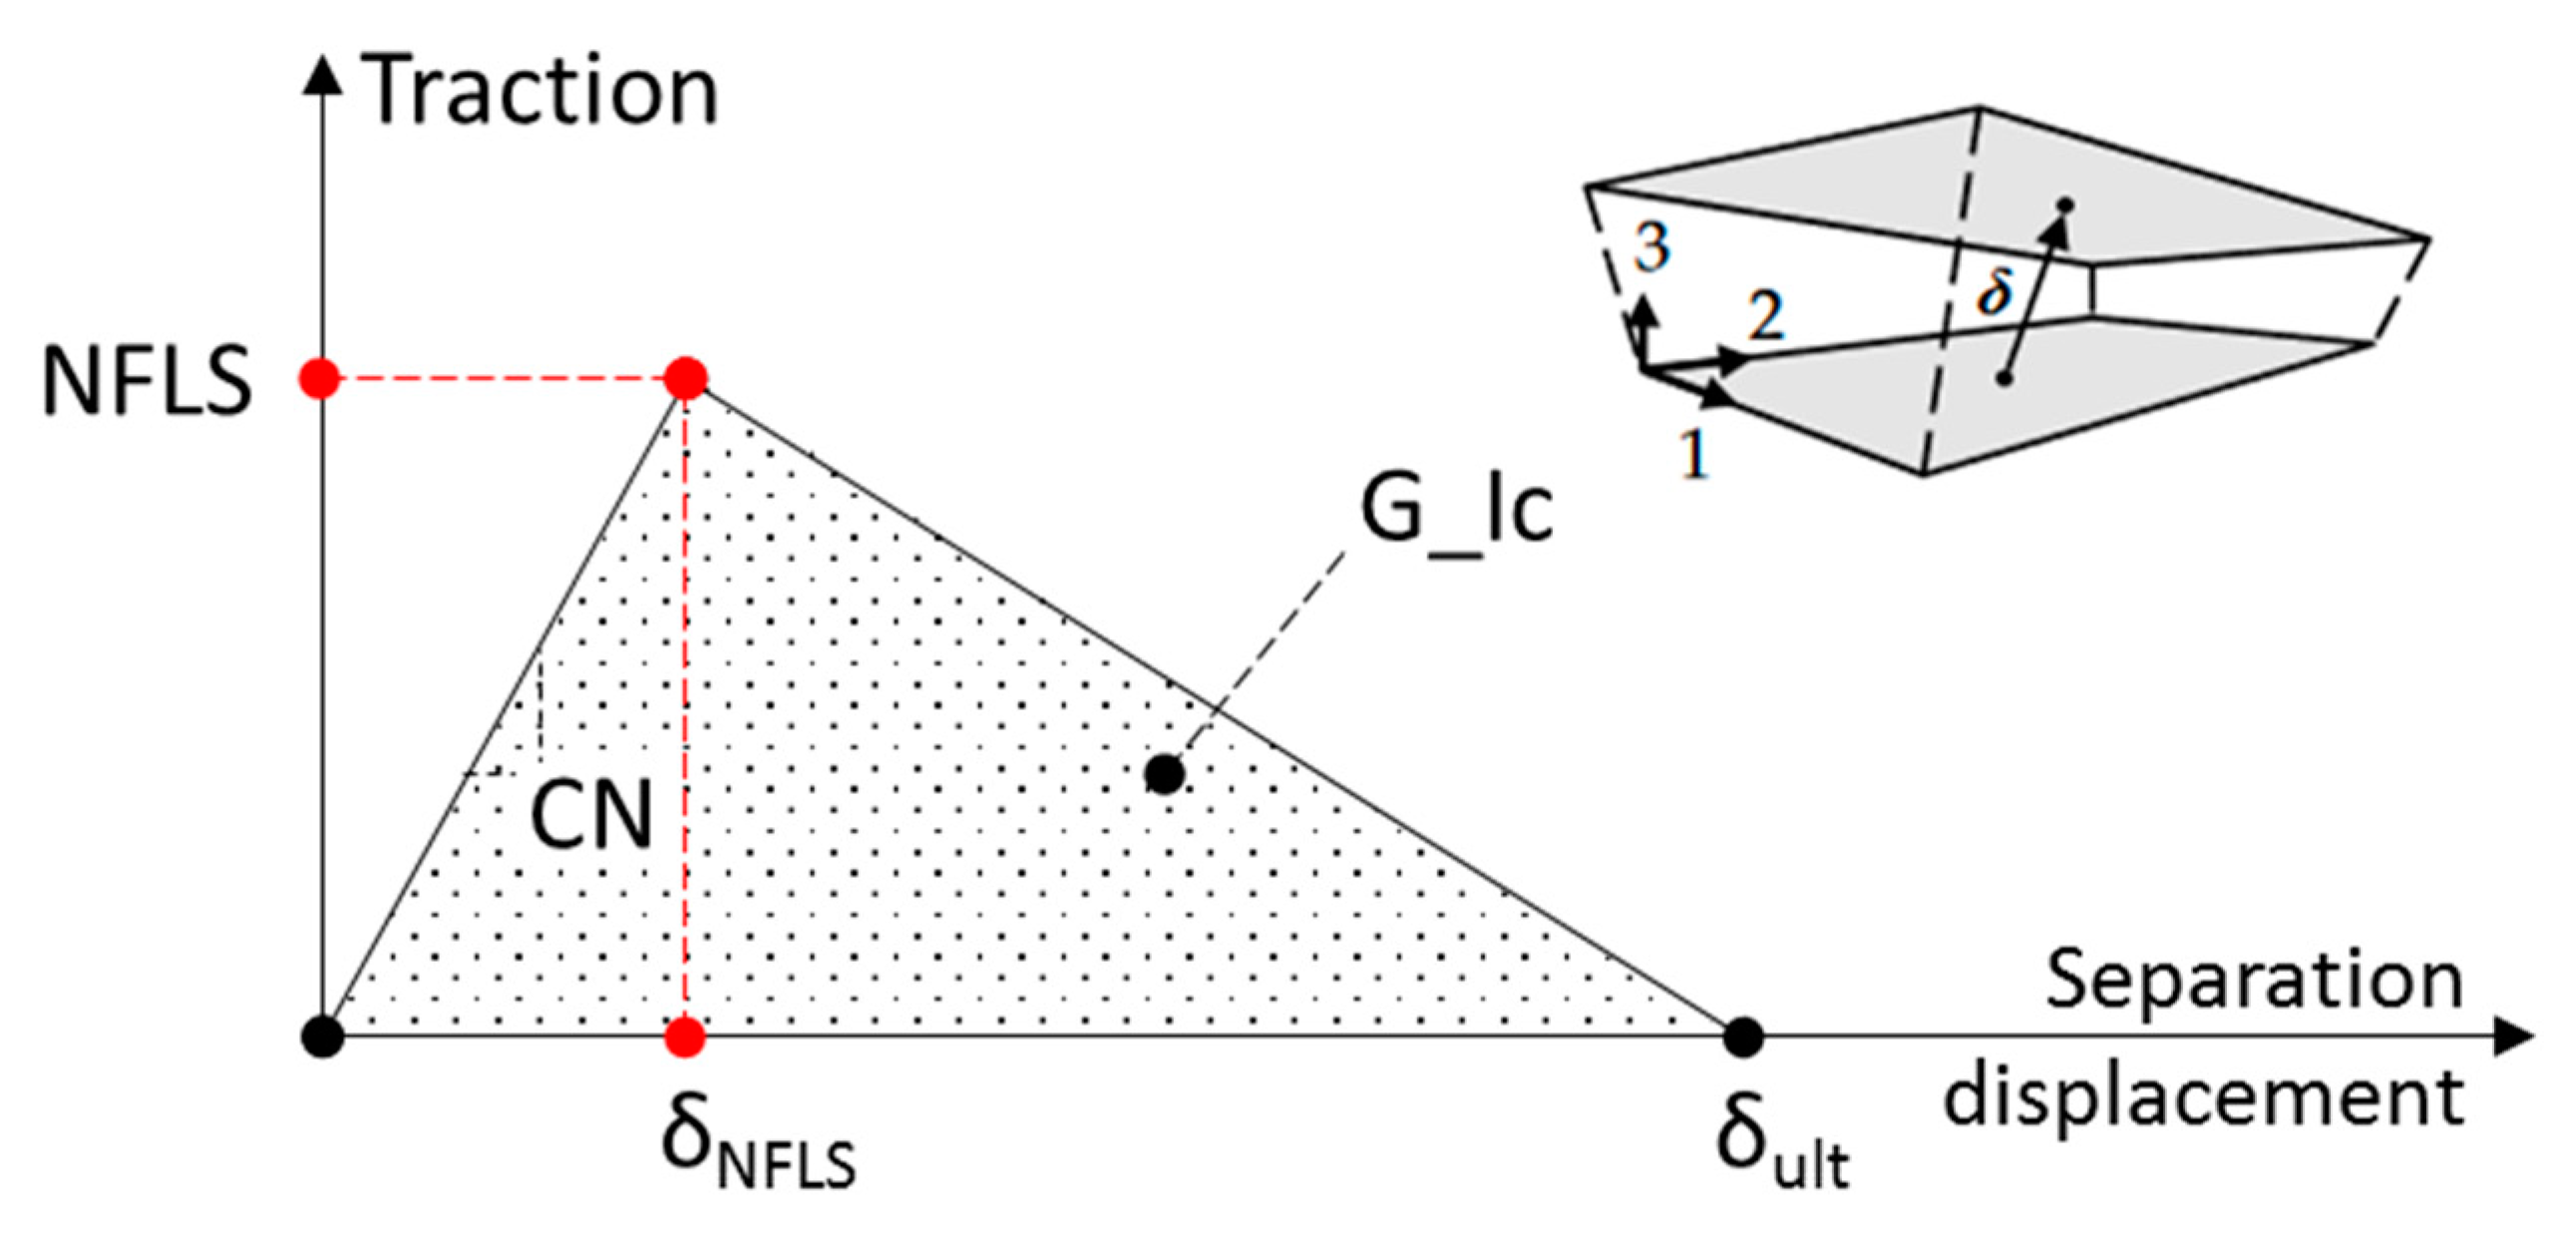
| NFLS, MPa | 9.00–18.00 | NFLS can be bound by the following values: lower bound—the transverse strength of a typical unidirectional GFRP (~30 MPa), which would be a reasonable estimate in the case of interlaminar failure by adhesive mechanism (cracks formed at the interface between the epoxy in the interlaminar resin-rich region and fibers in the layer adjacent to it). upper bound—the ultimate strength of bulk epoxy resin (~60 MPa), which would be a reasonable estimate in the case of interlaminar failure by cohesive mechanism. In addition, a scaling factor of 0.30 was used to account for the mesh dependency observed for this delamination model (see the recommendation provided in [25] for meshes with element sizes between 2 and 3 mm). A particular value from the specified range was chosen via calibration with experimental data, as will be discussed in Section 5.2. |
| SFLS/NFLS, - | 0.58 | Assumed as SFLS = NFLS/ (von Mises criterion) |
| G_Ic, kJ/m2 | 0.24 | Measured experimentally, see Table 3 in Section 5.1 |
| G_IIc, kJ/m2 | 1.96 | Measured experimentally, see Table 3 in Section 5.1 |
| CN, MPa/mm | 200,000.00 | CN = Eepoxy/δRRR, where Eepoxy is the Young’s modulus of epoxy matrix (~3650 MPa) and δRRR is the thickness of the interlaminar resin-rich region (typically within 0.01 and 0.10 mm). Thus, the lower and upper bounds for CN correspond to 36,500 MPa/mm and 365,000 MPa/mm, accordingly. This averages to 200,000 MPa/mm as an estimate for the CN parameter. In addition, the condition for CN > CNmin must be ensured (see [15]), where CNmin = (1/2) × (NFLS2)/(G_Ic). This condition is satisfied for the listed set of parameters of the delamination model. |
| CT2CN, - | 0.37 | CT2CN = CT/CN = Gepoxy/Eepoxy = 1/2 × (1 + νepoxy), where Gepoxy and νepoxy are the shear modulus and the Poisson’s ratio (~0.35) of epoxy resin, correspondingly. |
| Property | Value | Standard Deviation | Test Method |
|---|---|---|---|
| Longitudinal Young’s modulus (E1), MPa | 20,800 | 1600 | ASTM D 3039 |
| Transverse Young’s modulus (E2), MPa | 12,200 | 740 | ASTM D 3039 |
| Poisson’s ratio (nu21) | 0.079 | n/a | ASTM D 3039 |
| Shear modulus (G12), MPa | 2950 | 53.12 | ASTM D 3518 |
| Tensile strength in warp direction (Xt), MPa | 397 | 22.64 | ASTM D 3039 |
| Compressive strength in warp direction (Xc), MPa | 153 | 5.76 | ASTM D 3410 |
| Tensile strength in fill direction (Yt), MPa | 240 | 14.59 | ASTM D 3039 |
| Compressive strength in fill direction (Yc), MPa | 101 | 5.32 | ASTM D 3410 |
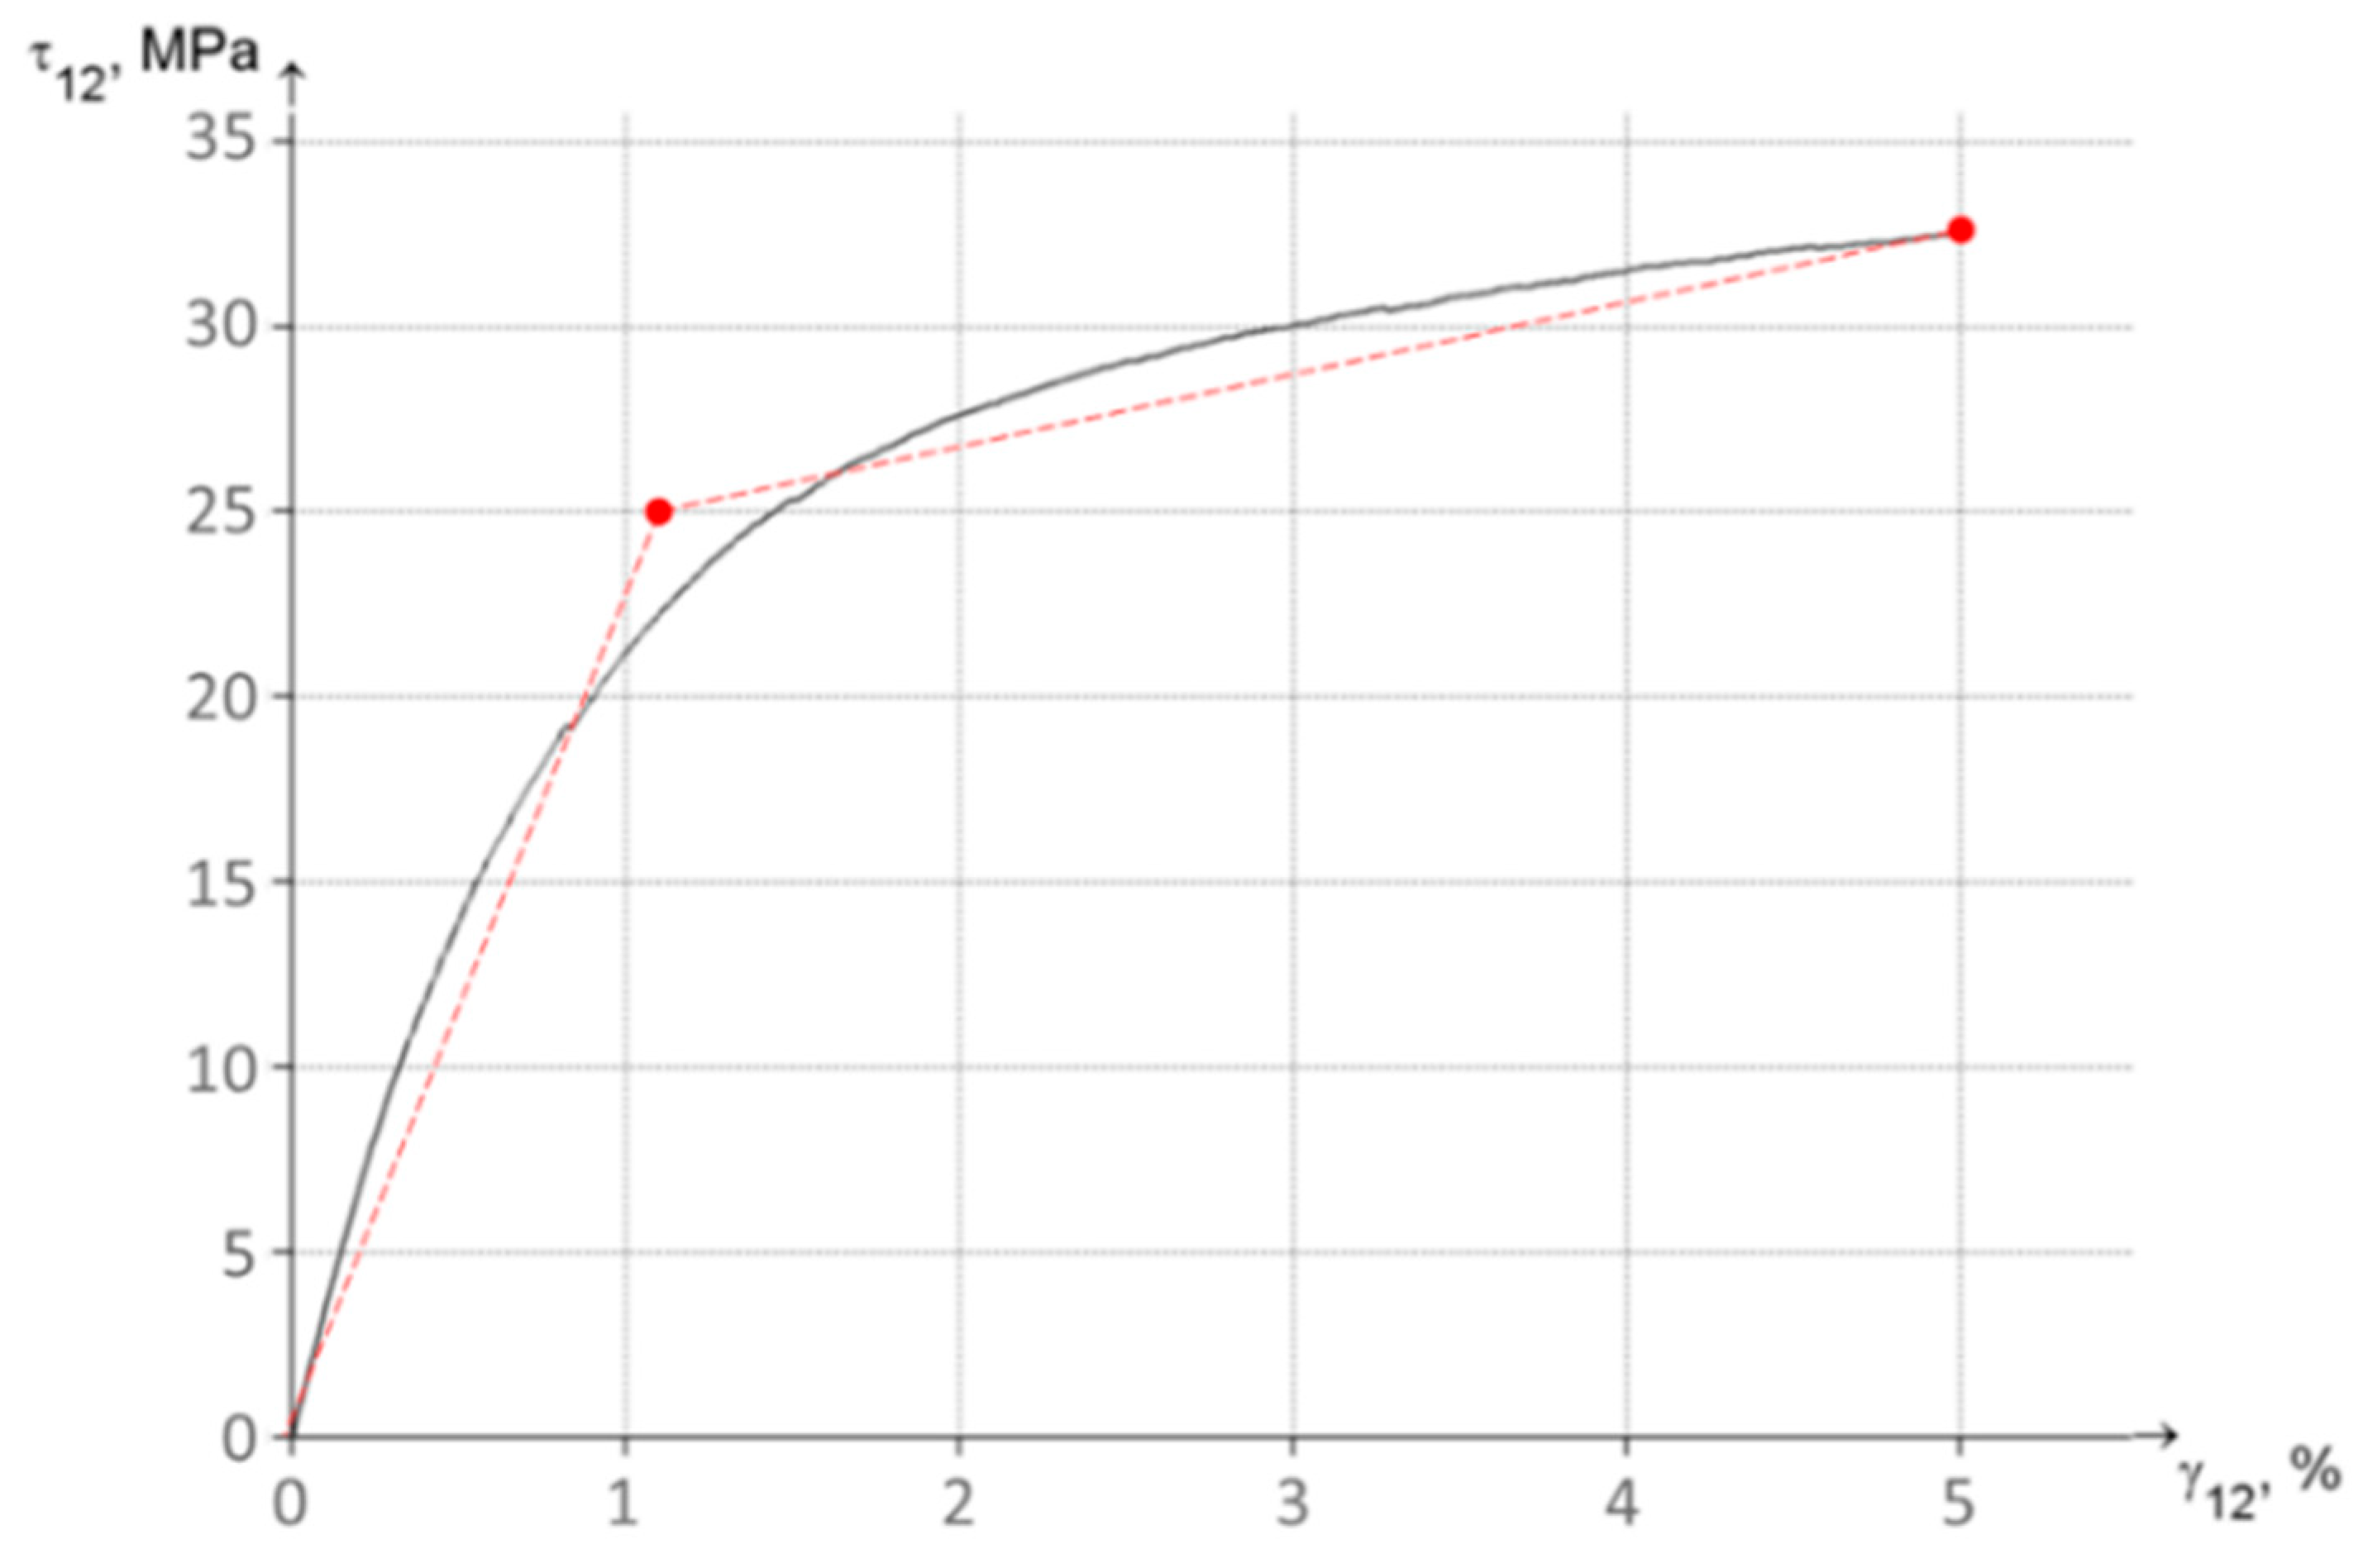
| Shear stress at onset of nonlinearity, MPa | 25 (see Figure 11) | n/a | ASTM D 3518 |
| Shear stress at 5% shear strain, MPa | 33 | 1.87 | ASTM D 3518 |
| Mode I critical strain energy release rate (G_Ic), kJ/m2 | 0.24 | 0.02 | ASTM D 5528-01 |
| Mode II critical strain energy release rate (G_IIc), kJ/m2 | 1.96 | 0.50 | End-notched flexure |
© 2020 by the authors. Licensee MDPI, Basel, Switzerland. This article is an open access article distributed under the terms and conditions of the Creative Commons Attribution (CC BY) license (http://creativecommons.org/licenses/by/4.0/).
Share and Cite
Cherniaev, A.; Pavlova, S.; Pavlov, A.; Komarov, V. Prediction of Load-Bearing Capacity of Composite Parts with Low-Velocity Impact Damage: Identification of Intra- and Inter-Ply Constitutive Models. Appl. Mech. 2020, 1, 59-78. https://0-doi-org.brum.beds.ac.uk/10.3390/applmech1010005
Cherniaev A, Pavlova S, Pavlov A, Komarov V. Prediction of Load-Bearing Capacity of Composite Parts with Low-Velocity Impact Damage: Identification of Intra- and Inter-Ply Constitutive Models. Applied Mechanics. 2020; 1(1):59-78. https://0-doi-org.brum.beds.ac.uk/10.3390/applmech1010005
Chicago/Turabian StyleCherniaev, Aleksandr, Svetlana Pavlova, Aleksandr Pavlov, and Valeriy Komarov. 2020. "Prediction of Load-Bearing Capacity of Composite Parts with Low-Velocity Impact Damage: Identification of Intra- and Inter-Ply Constitutive Models" Applied Mechanics 1, no. 1: 59-78. https://0-doi-org.brum.beds.ac.uk/10.3390/applmech1010005