Measuring Foot Progression Angle during Walking Using Force-Plate Data


1
Laboratoire IRISSE—EA 4075, UFR des Sciences de l’Homme et de l’Environnement, Université de La Réunion, 97430 Le Tampon, La Réunion, France
2
Movement-Interactions-Performance, MIP, EA 4334, Le Mans Université, 72000 Le Mans, Maine, France
*
Author to whom correspondence should be addressed.
Appl. Mech. 2022, 3(1), 174-181; https://0-doi-org.brum.beds.ac.uk/10.3390/applmech3010013
Submission received: 20 December 2021
/
Revised: 26 January 2022
/
Accepted: 8 February 2022
/
Published: 11 February 2022
Abstract
:Foot progression angle (FPA) is a gait-related clinical measurement commonly used for assessing the rotational profile of the lower extremity. This study examined the accuracy of two methods based on force-plate data for estimating FPA during walking by comparing them with a reference method using a motion capture system. Ten healthy adults performed a series of overground walking trials at three different speeds: slow, preferred and fast. FPA was estimated from two methods using data on center of pressure—one method previously reported in the literature, and a novel method proposed here. The FPA estimated by each of these two force-plate methods were compared with the reference FPA determined from kinematic data. Results showed that the novel force-plate method was more accurate and precise when measuring the FPA in the three speed conditions than the force-plate method previously reported in the literature. The mean absolute error obtained with this novel method was 3.3° ± 2.1° at slow speed, 2.0° ± 1.2° at preferred speed and 2.0° ± 1.2° at fast speed, with no significant effect of gait speed (p > 0.05). These findings suggest that the novel force-plate method proposed here is valid for determining FPA during walking at various speeds. In the absence of kinematic data, this method constitutes an attractive alternative for measuring FPA.
1. Introduction
Foot progression angle (FPA) is an important gait-related clinical measurement. This parameter, which describes the foot orientation in the transverse plane during walking, is classically measured in clinical gait analysis in order to evaluate the rotational profile of the lower extremity and thus identify deformities of the latter [1,2]. FPA is related to several indicators of mechanical stress on the lower limb, such as the knee adduction moment [3,4], ankle internal-external rotation moments [5], hip internal-external rotation moments [6] and foot pressure distribution [7]. Recently, FPA alteration has been proposed as a strategy for reducing knee loading and pain in patients with knee osteoarthritis [8,9], and also as a potential solution for reducing regional plantar stress [7].
Traditionally, FPA is measured in a laboratory setting using a motion capture system. Specifically, FPA is determined during the stance phase of gait as the angle between the forward progression axis of the laboratory and the long axis of the foot, defined by reflective markers placed on the second metatarsal head and the calcaneum [4,10]. Although motion capture systems are considered as the “gold standard” [11], this technology has some limitations, such as its cost, the time required to prepare the participant and the complexity of collecting measurements [12]. Furthermore, these systems are also prone to the problem of marker occlusions [13]. To overcome these limitations, alternative approaches have recently been developed to measure FPA, such as methods using inertial measurement units [11,14,15,16], plantar pressure measurement systems [17] or video cameras [18].
Force-plate is a tool classically used, alone or in combination with a motion capture system, to assess gait in both clinical and research applications. Force-plate measures the ground reaction forces when walking, and is also frequently employed to determine the temporal-spatial parameters of gait and the course of the application point of the ground reaction force, i.e., the center of pressure (COP). During walking, it is well known that the COP passes through the heel pad at the onset of the stance phase and through the second phalangeal at the terminal stance phase [19]. Based on these observations, Chang et al. [9] used COP position data to estimate FPA during walking. This approach could constitute an attractive alternative to measure FPA when faced with the problem of marker occlusion or even when a motion capture system is not available. However, to the best of our knowledge, the validity of this approach has not been examined. Indeed, although a study [20] showed that plantar pressure measurements can be used to reliably determine the long axis of foot during walking, it remains unclear how the force-plate method previously reported in the literature compares with the gold standard method.
Specifically, in the force-plate method previously used in the literature [9], the long axis of the foot was determined as the line connecting the COP at the time of heel strike with the COP at toe-off time. Yet, the findings of the literature indicate that the COP progresses to the first metatarsal-phalangeal at the time of toe-off (i.e., at the end of stance) [19,21]. This suggests that this force-plate method could give a more internally rotated FPA as compared with the reference method. Now, several studies have reported that the COP passes through the second metatarsal at the time of the onset of the push-off phase (i.e., 80% of the stance phase) [21,22]. Although this remains to be verified, these results suggest that the use of the latter event could provide a higher accuracy when estimating FPA from force-plate data.
The aim of this study was to compare a method previously reported in the literature and a novel method introduced here to estimate FPA from force-plate data against the reference method using kinematic data.
2. Materials and Methods
2.1. Subjects
Ten healthy subjects (5 males and 5 females; age: 23.1 ± 2.2 years, height: 171 ± 9 cm, body mass: 66.4 ± 8.6 kg) participated in this experiment. Subjects were volunteers selected from the Physical activity department of the University of La Réunion. All participants were physically active and had no recent history of neurological, musculoskeletal or other disorders that could affect their gait. All gave written consent after being fully informed of the test procedure. The study was conducted in accordance with the Declaration of Helsinki, and the protocol was approved by the local institutional review board (IRISSE, EA4075).
2.2. Material and Experimental Protocol
Subjects were asked to walk barefoot along a 10-m walkway, in the middle of which was embedded a force-plate (60 × 40 cm, AMTI, Watertown, NY, USA). The force-plate measured ground reaction forces and moments. Reflective skin markers of 14-mm diameter were fixed bilaterally on subject’s lower limb bony landmarks according to the Vicon’s Plug-in-Gait lower-body model [23]: anterior and posterior superior iliac spines, thigh, knee, tibia, ankle, heel and second metatarsal head. A motion capture system equipped with six infrared cameras (Bonita, Vicon, Oxford, UK) was used to collect simultaneously the kinematic data at 200 Hz and force-plate data at 1000 Hz.
Subjects performed a series of gait trials in three speed conditions: Slow, Preferred and Fast. These speeds corresponded, respectively, to 60%, 100% and 140% of the preferred walking speed, which was determined before the onset of the experiment by asking subjects to walk at their comfortable speed over a total distance of 100 m (average of 4 trials of 25 m) [24]. During the experiment, the walking speed was controlled a posteriori by two pairs of photoelectric cells, which were placed two meters in front and two meters behind the force-plate. For each speed condition, the trials were validated only if the speed of progression was within ± 2.5% of the target speed and the foot of the subject’s dominant leg (the preferred leg used for kicking a ball) was fully in contact with the force-plate during the trial. This procedure was repeated until three valid trials were obtained. The presentation order of the speed conditions was randomized for all subjects.
2.3. Data Analysis
Before analysis, both the kinetic and kinematic data were low-pass filtered using a second-order Butterworth filter with a 10-Hz cut-off frequency [25]. COP coordinates along the anteroposterior (COPx) and mediolateral (COPy) directions were computed from force-plate data in accordance with manufacturer instructions:
where Mx and My are the moments about the anteroposterior and mediolateral axes measured at the center of the force-plate, respectively; where Fx, Fy and Fz are, respectively, the anteroposterior, mediolateral and vertical ground reaction forces; and where dz, dx and dy are, respectively, the vertical, anteroposterior and mediolateral distances between the geometric center of the force-plate and its origin, as provided by the manufacturer.
Reference FPA was calculated from the motion capture system. The reference FPA represented precisely the mean angle projected in the horizontal plane between the forward progression axis of the laboratory and the long axis of the foot, defined by the reflective markers placed on the calcaneum and second metatarsal head, during the foot-flat phase [10]. The foot-flat phase corresponded to the phase between 15% and 50% of the stance phase. The gait stance phase was determined from the vertical ground reaction force with a threshold of 10 N [26]. A positive FPA indicated an externally rotated foot (out-toeing), and a negative FPA an internally rotated foot (in-toeing).
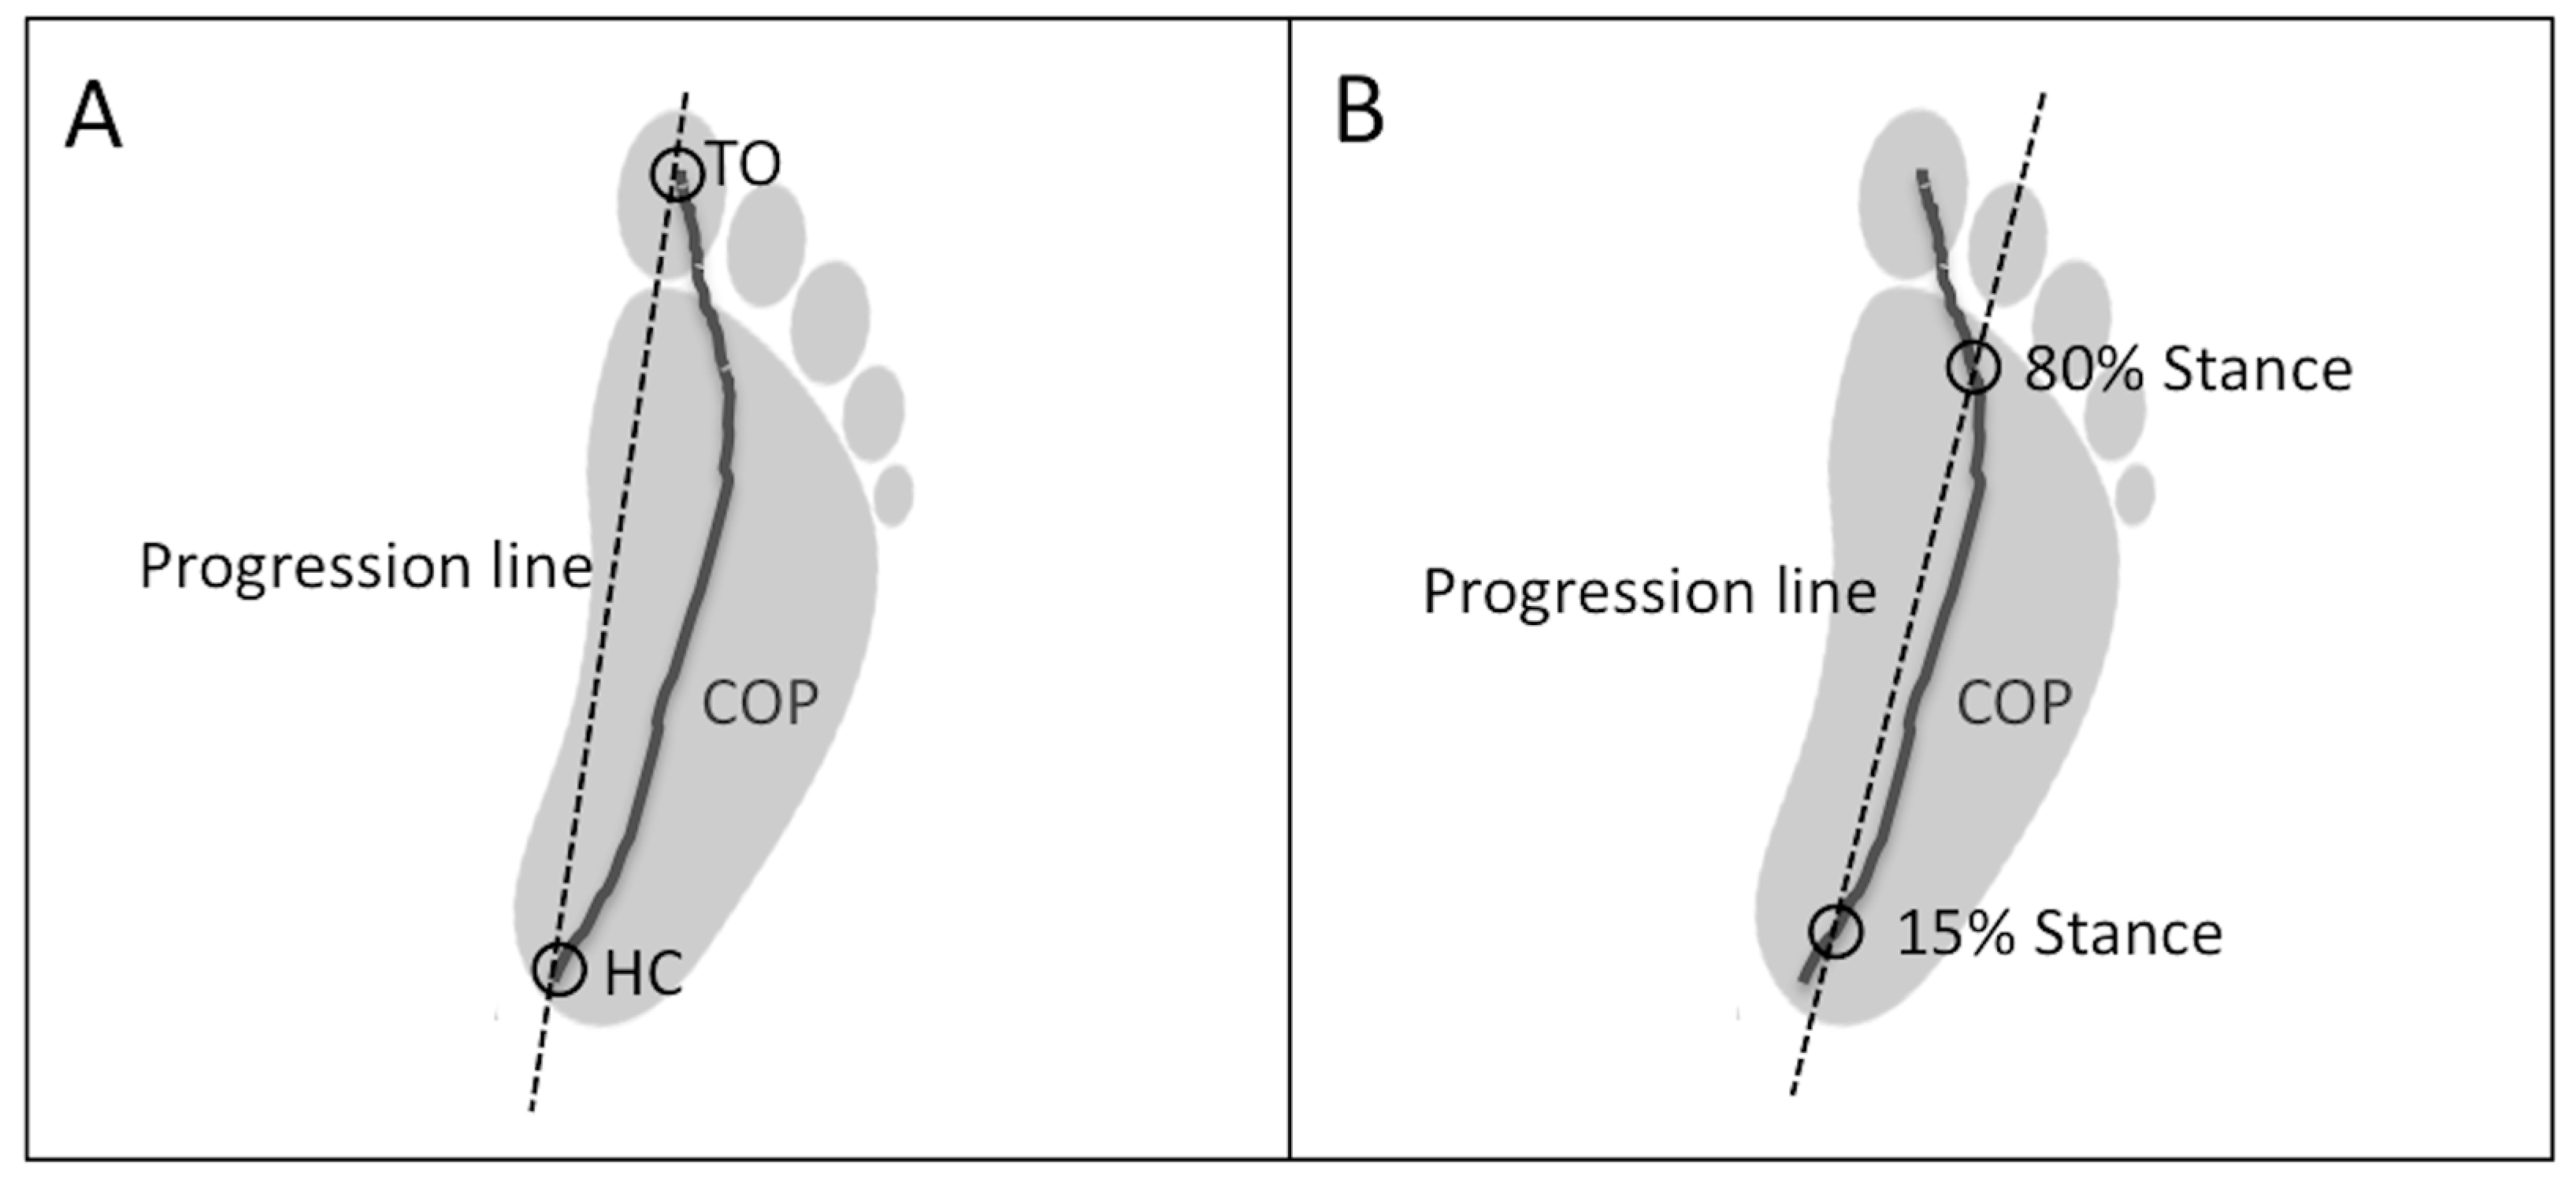
Two force-plate methods were used to estimate FPA. Method 1 estimated FPA from COP data as previously described in the study by Chang et al. [9]. FPA was precisely calculated as the angle formed by the progression line of the COP and the progression axis of the laboratory. The progression line of the COP corresponded to the line connecting the COP at the time of heel-contact (onset of the stance phase) with the COP at the time of the toe-off (end of the stance phase; Figure 1A).
Method 2 is the novel method introduced here and also used the progression line of the COP to estimate FPA. In Method 2, the progression line of the COP was defined as the line joining the COP at the time of onset of the foot-flat phase (i.e., 15% of the stance phase) with COP at the time of the end of the terminal stance (i.e., 80% of the stance phase; Figure 1B). These two instances (i.e., 15% and 80% of the stance phase) were chosen because they correspond to instances where COP is approximately located under the central heel and the second metatarsal head [21,22], respectively.
2.4. Statistical Analysis
Parameters were calculated for each trial and averaged over the three trials. After checking for data normality and homoscedasticity, a two-way (3 methods × 3 speeds) analysis of variance (ANOVA) with repeated measures was conducted to determine if there were any differences in the FPA obtained from the three methods or between the three speed conditions. Bonferroni post hoc analysis was performed when a statistical difference was found. Mean relative and absolute errors ± standard deviation, Pearson’s correlation coefficient (r) and Bland and Altman analyses [27] were used to assess the degree of agreement between both force-plate methods and the reference method. Finally, a two-way (2 methods × 3 speeds) ANOVA with repeated measures was conducted to determine if there was any difference in the mean relative and absolute errors between the two force-plate methods and to assess the effect of gait speed on these parameters. The level of statistical significance was set at α = 0.05.
3. Results
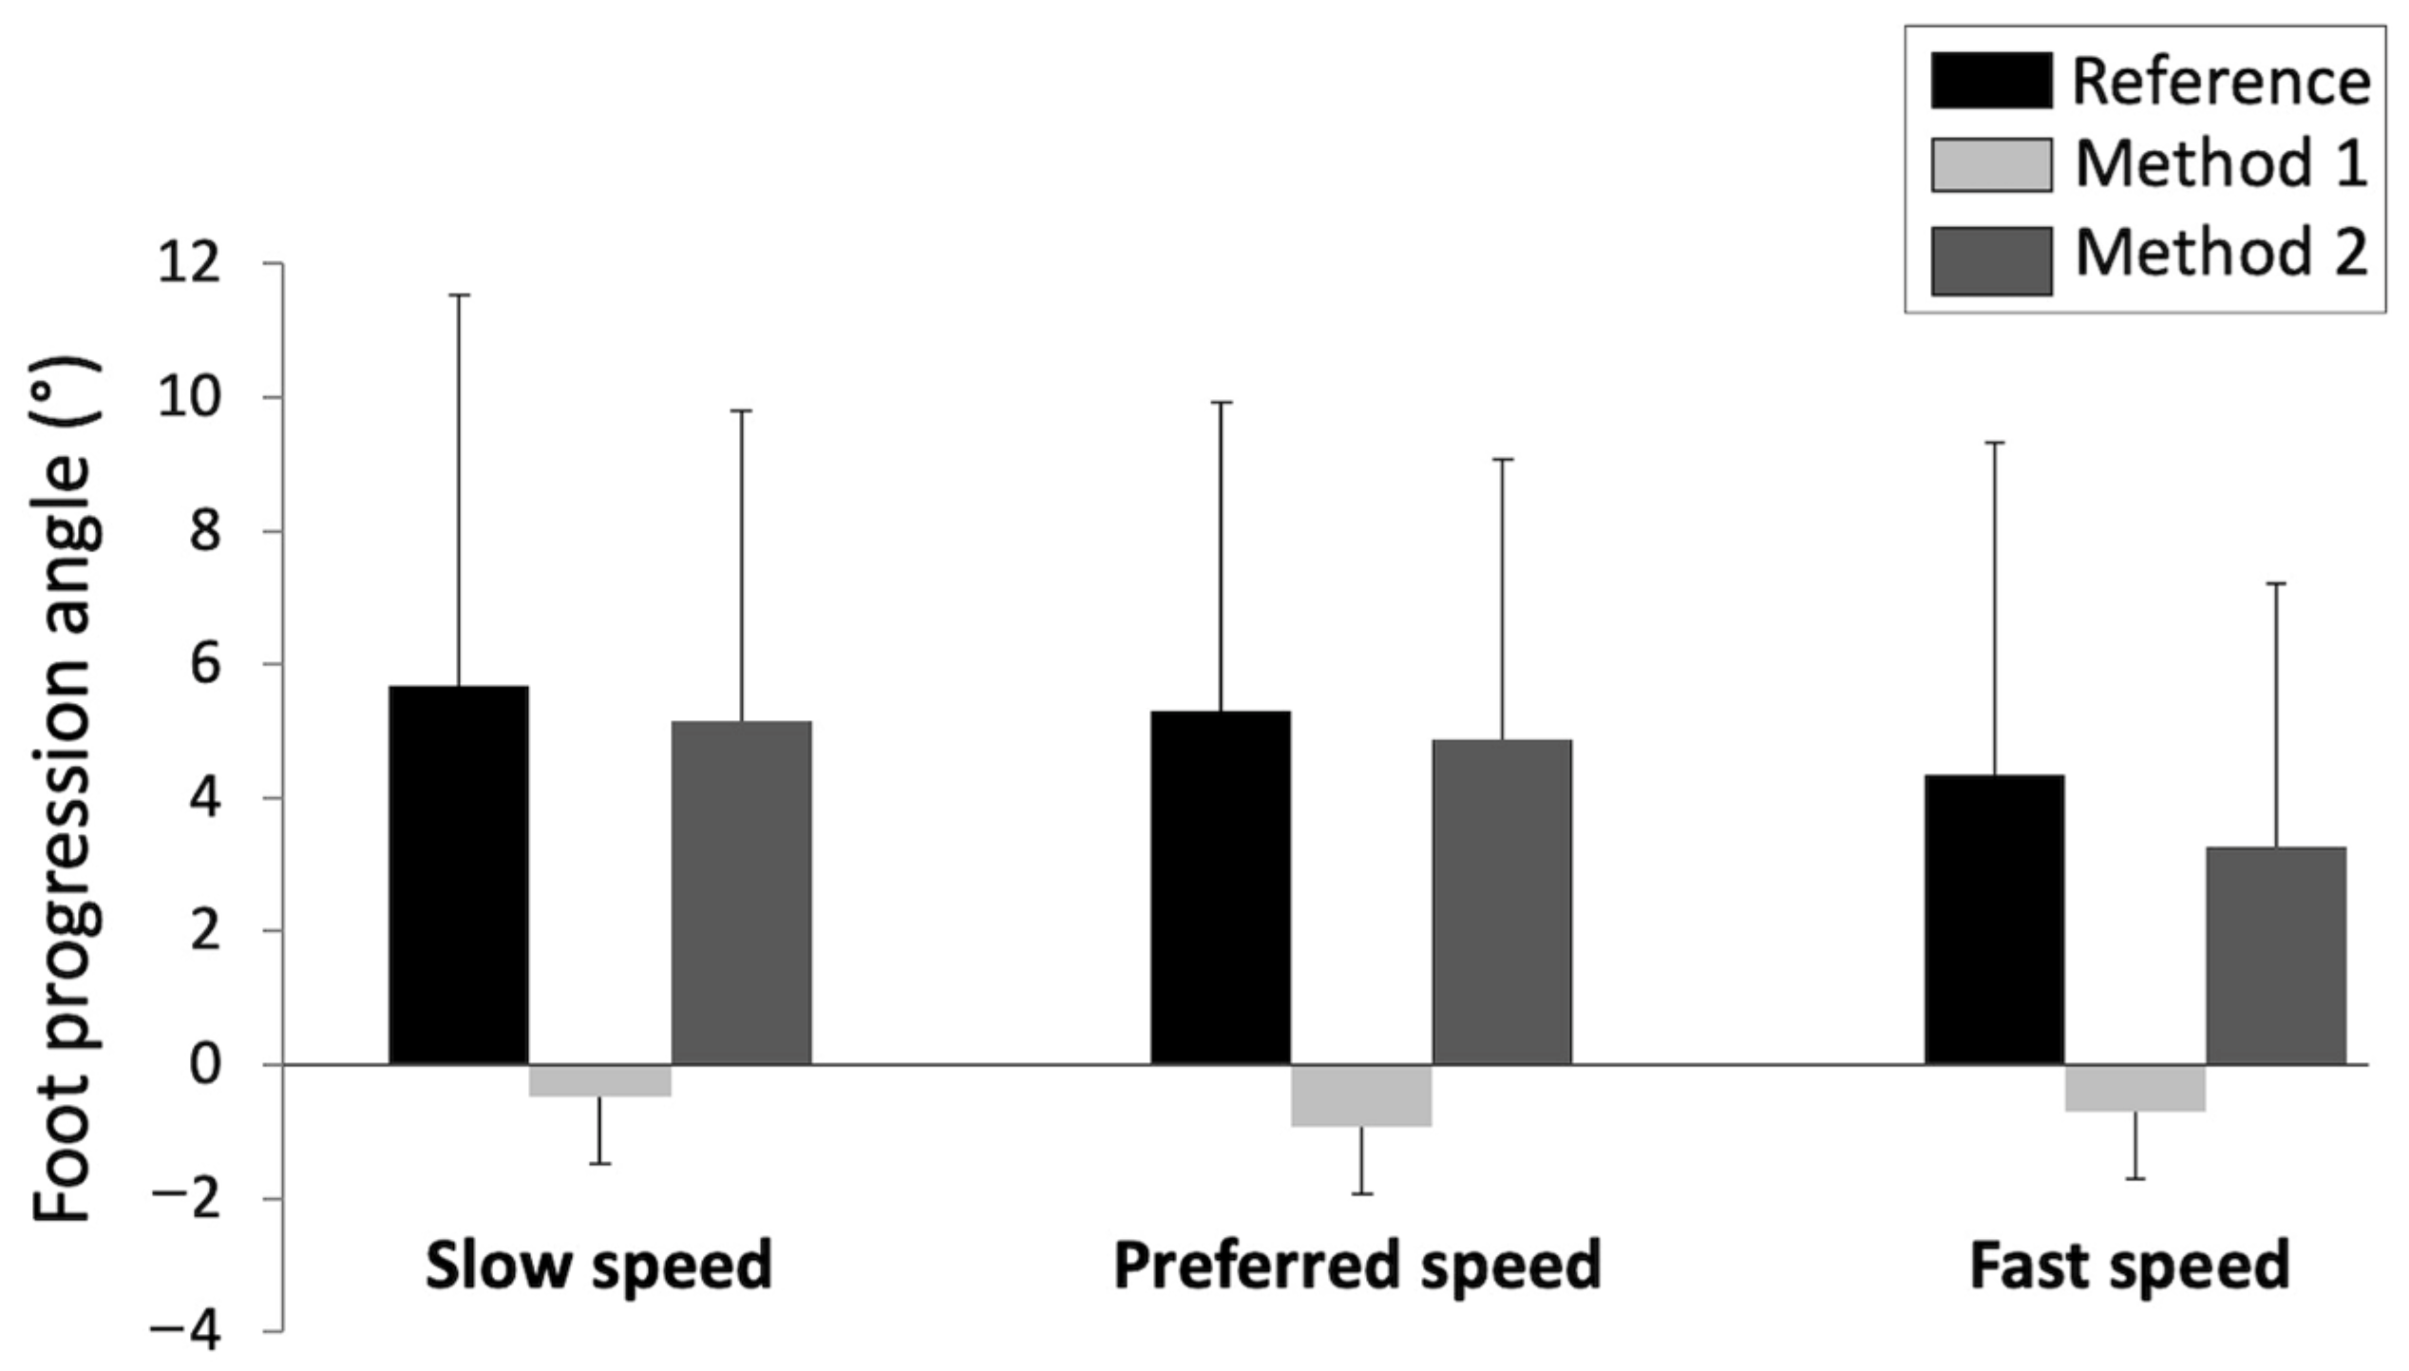
The subjects walked on average at 0.86 ± 0.19 m·s−1 in the slow speed condition, at 1.28 ± 0.23 m·s−1 in the preferred speed condition and at 1.83 ± 0.19 m·s−1 in the fast speed condition (p < 0.001). The FPA values obtained from the reference method and both force-plate methods in each speed condition are illustrated in Figure 2. An ANOVA indicated that there was no significant effect of method × speed interaction on FPA (p > 0.05). In contrast, ANOVA indicated a significant effect of the method on FPA (F = 6.37; p < 0.01). Bonferroni post hoc tests revealed a significant difference between Method 1 and both the reference method (p < 0.01) and Method 2 (p < 0.05). Precisely, we noted that Method 1 underestimated the FPA compared to the other two methods (Figure 2). In contrast, no significant difference was found between the reference FPA and the FPA estimated from Method 2 (p > 0.05). Furthermore, ANOVA indicated an effect of gait speed on FPA (F = 3.50; p < 0.05). Bonferroni post hoc analysis only revealed a significant difference in the FPA between the slow and fast speed conditions (p < 0.05). FPA was higher in the slow speed condition than in the fast condition. A significant strong correlation was found between the reference FPA and FPA estimated by both Method 1 (r = 0.73; p < 0.001) and Method 2 (r = 0.85; p < 0.001).
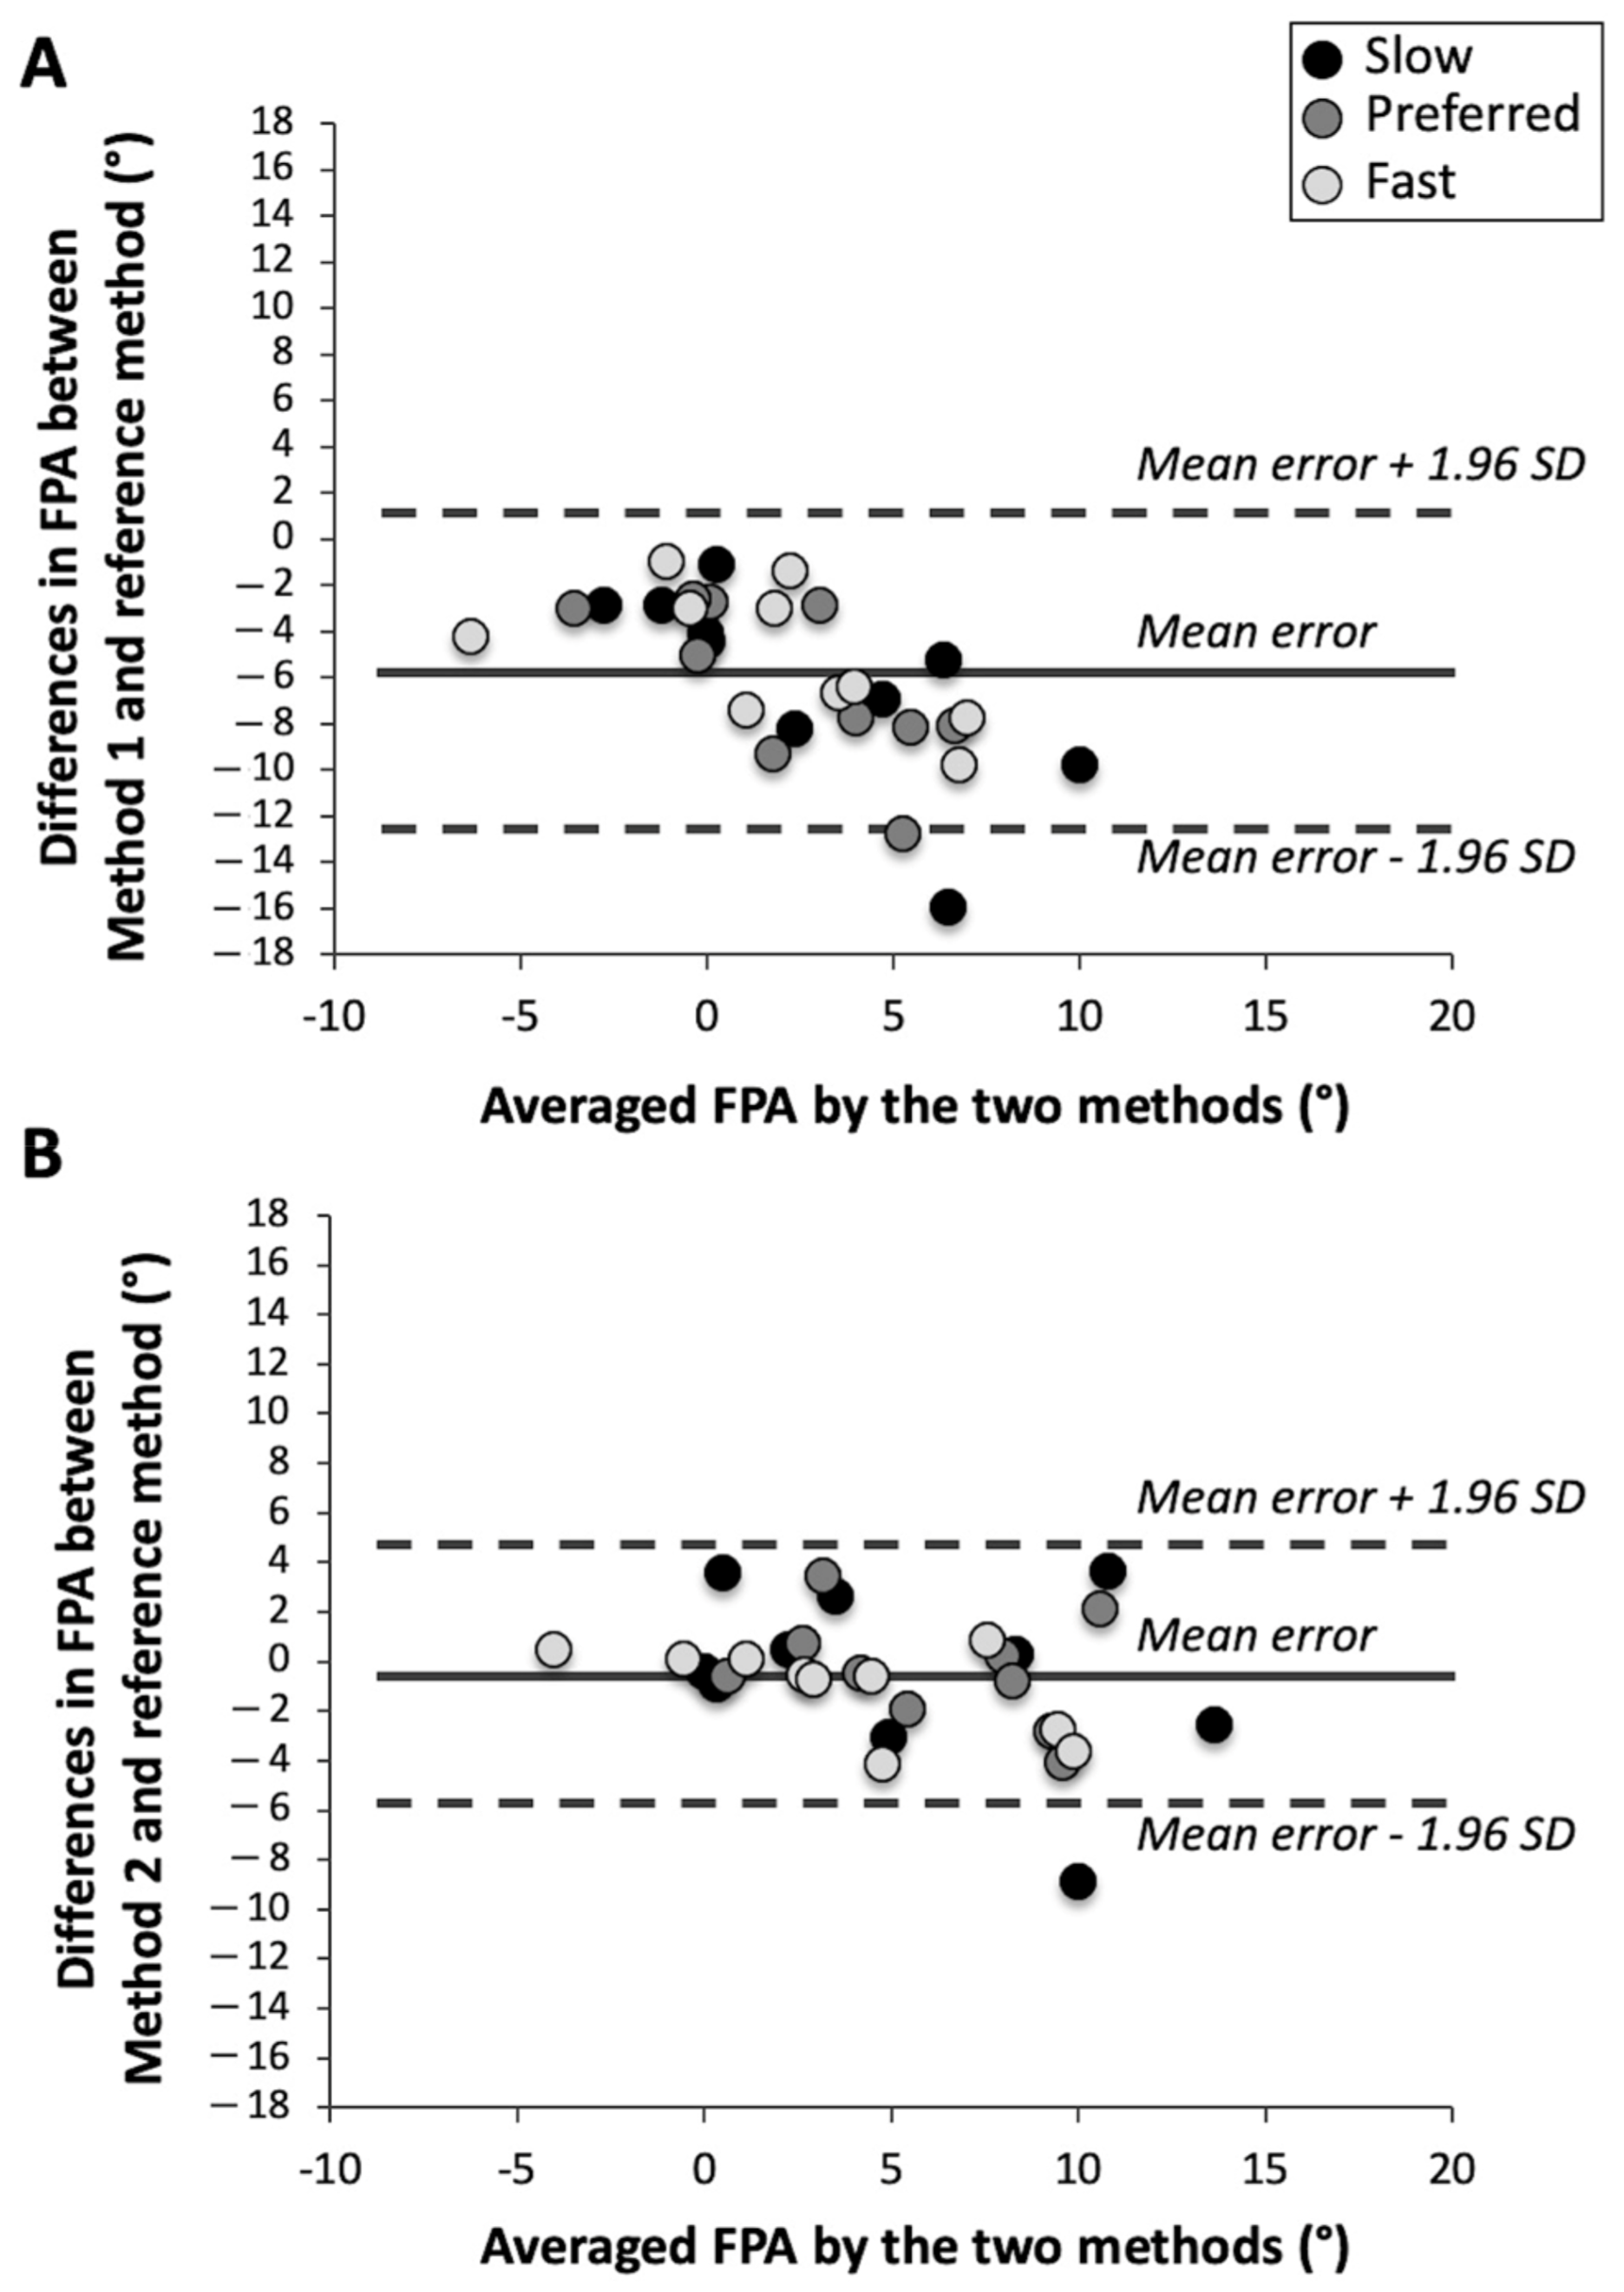
The Bland and Altman plots for Method 1 (A) and Method 2 (B) are illustrated in Figure 3. The mean relative and absolute errors for both force-plate methods are summarized in Table 1. There was no significant effect of method × speed interaction and gait speed on these latter parameters (p > 0.05). In contrast, ANOVA revealed a significant effect of the method on mean relative error (F = 14.76; p < 0.01) and mean absolute error (F = 8.83; p < 0.01). These parameters were smaller for Method 2 than for Method 1 (Table 1).
4. Discussion
The aim of this study was to compare two methods that utilize force-plate data to estimate FPA during walking against a reference method based on kinematic data. Method 1 is a method previously used in the literature [9] and Method 2 is the novel method introduced here. Our results showed that Method 1 provided FPA values significantly different from the reference method. In particular, we noted that Method 1 systematically gave a more internally rotated FPA as compared with the reference method, probably due to the progression of COP to the first metatarsal-phalangeal at the end of stance [19,21]. This finding should be considered when using this method, especially when applied in a clinical setting. Conversely, FPA values estimated by Method 2 were not significantly different from those measured by the reference method. A very strong correlation was found between the FPA measured by Method 2 and the reference FPA (r = 0.85). This correlation was stronger than those observed between the FPA estimated by Method 1 and the reference FPA (r = 0.73). Furthermore, we found that the mean relative and absolute errors and the standard deviations for these parameters were significantly smaller for Method 2 than for Method 1 in all speed conditions (Table 1). These results indicate that Method 2 was more accurate and precise than Method 1 for estimating FPA during walking, whatever the gait speed. The better performance of Method 2 compared with Method 1 may probably be ascribed to the fact that the instants selected in Method 2 (i.e., 15% and 80% of the stance duration) allowed one to obtain a COP progression line that was more aligned with the long axis of the foot as defined by the heel and second metatarsal head markers.
Our results are in agreement with the previous study by Jameson et al. [20] showing that the long axis of the foot during walking may be reliably estimated from pedobarograph data. In this previous study, the long axis of the foot was visually estimated by experimented analysts from plantar pressure measurements in a cohort of healthy children. These authors found a mean absolute error of 2.3° (±1.6°) as compared with the reference method based on kinematic data. This result is comparable with the mean absolute error obtained in our study for Method 2, which was 2.0° (±1.2°) at preferred speed and 2.4° (±1.6°) when all speed conditions were combined (5.8° ± 3.5° for Method 1). According to Jameson et al. [20], errors of this magnitude have not affected clinical decision-making and have been therefore determined as not clinically significant. Nevertheless, it is noteworthy that these authors evaluated only the validity of their method in only one condition of walking speed, precisely in a self-selected speed condition.
In the present study, we observed that there was no significant effect of gait speed on the mean relative and absolute errors for each force-plate method. These results indicate that the performance of these force-plate methods was not influenced by gait speed. In addition, compared to the method validated by Jameson et al. [20], the force-plate methods studied here have the advantage being of automated and therefore do not depend on the experience of the experimenter. It should nevertheless be noted that there are plantar pressure measurement systems specially developed for gait analysis that automatically determine the FPA during walking (e.g., GAITRite®, Footscan® or Zebris® systems). However, it is unknown how these systems compare with the reference method using kinematic data. Furthermore, other methods based on shoe-worn sensors have been recently developed to measure FPA during walking [11,14,15,16]. These methods have been shown to provide a relatively accurate estimation of FPA with error magnitudes of around 2° (e.g., mean absolute error of 1.7° ± 1° in [11] or root-mean-square of errors of 2.2° for all speeds combined [14]), as found for Method 2 in the present study. These measurement errors have been considered as clinically acceptable, as they are typically found in conventional optical motion capture systems due to marker placement, computational method, measurement system accuracy and resolution, or observer’s experience and skills [15]. Thus, as a result, it is now possible for a researcher or physician to accurately measure FPA from different validated tools such as force-plates or shoe-worn sensors.
The current results underline that Method 2 could be used in clinical applications requiring FPA measurements, such as clinical gait analysis and gait retraining. In particular, it is considered that gait retraining focused on FPA alteration constitutes an important conservative treatment for individuals with knee osteoarthritis [8,9]. Indeed, it has been shown that weekly gait retraining sessions based on FPA alteration can reduce knee loading, reduce knee pain and improve function for subjects with knee osteoarthritis [8]. Specifically, this previous study reported that a 7° decrease in FPA (i.e., increased internal foot rotation) after gait retraining led to a reduction in the first peak of the external knee adduction moment by 20% and a decrease in knee pain by 29%. The accuracy obtained with Method 2 in the current study suggests that this method could potentially be used for gait retraining in patients with knee osteoarthritis. Nevertheless, it should be noted that this method has only been tested in healthy participants without any neuromuscular disorders. Further investigation is required to confirm the validity of this method in people with gait abnormalities, particularly in persons with abnormal foot function, such as those with neuromuscular disorders or foot deformities.
5. Conclusions
The present findings indicate that the novel method proposed here based on force-plate data is a valid approach for measuring foot progression angle during walking at different speeds. This approach constitutes an attractive alternative for measuring FPA in the absence of kinematic data.
Author Contributions
Conceptualization, T.C., J.B., G.D. and N.P.; methodology, T.C., J.B., G.D. and N.P.; software, T.C. and J.B.; validation, T.C., J.B., G.D. and N.P.; formal analysis, T.C. and J.B.; investigation, T.C. and J.B.; resources, T.C., J.B., G.D. and N.P.; data curation, T.C. and J.B.; writing—original draft preparation, T.C., J.B., G.D. and N.P.; writing—review and editing, T.C., J.B., G.D. and N.P.; visualization, T.C., J.B., G.D. and N.P.; supervision, T.C., G.D. and N.P.; project administration, T.C., G.D. and N.P.; funding acquisition, T.C., G.D. and N.P. All authors have read and agreed to the published version of the manuscript.
Funding
This work was supported by a Regional Research Grant (grant DIRED/20171380) from the Réunion Region and from the European Regional Development Fund (FEDER).
Institutional Review Board Statement
The study was conducted in accordance with the Declaration of Helsinki, and the protocol was approved by the institutional review board of the IRISSE research unit (EA4075, March 2018).
Informed Consent Statement
Informed consent was obtained from all subjects involved in the study.
Data Availability Statement
Data available on request from the authors.
Acknowledgments
The authors wish to thank Laurent Maranget for his technical assistance during the experiments.
Conflicts of Interest
The authors declare no conflict of interest.
References
- Cibulka, M.T.; Winters, K.; Kampwerth, T.; McAfee, B.; Payne, L.; Roeckenhaus, T.; Ross, S.A. Predicting Foot Progression Angle during Gait Using Two Clinical Measures in Healthy Adults, a Preliminary Study. Int. J. Sports Phys. Ther. 2016, 11, 400–408. [Google Scholar] [PubMed]
- Hudson, D. The rotational profile: A study of lower limb axial torsion, hip rotation, and the foot progression angle in healthy adults. Gait Posture 2016, 49, 426–430. [Google Scholar] [CrossRef] [PubMed]
- Rutherford, D.J.; Hubley-Kozey, C.L.; Deluzio, K.J.; Stanish, W.D.; Dunbar, M. Foot progression angle and the knee adduction moment: A cross-sectional investigation in knee osteoarthritis. Osteoarthr. Cartil. 2008, 16, 883–889. [Google Scholar] [CrossRef] [PubMed] [Green Version]
- Shull, P.B.; Shultz, R.; Silder, A.; Dragoo, J.L.; Besier, T.F.; Cutkosky, M.R.; Delp, S.L. Toe-in gait reduces the first peak knee adduction moment in patients with medial compartment knee osteoarthritis. J. Biomech. 2013, 46, 122–128. [Google Scholar] [CrossRef]
- Ho, C.S.; Lin, C.J.; Chou, Y.L.; Su, F.C.; Lin, S.C. Foot progression angle and ankle joint complex in preschool children. Clin. Biomech. 2000, 15, 271–277. [Google Scholar] [CrossRef]
- Bowsher, K.A.; Vaughan, C.L. Effect of foot-progression angle on hip joint moments during gait. J. Biomech. 1995, 28, 759–762. [Google Scholar] [CrossRef]
- Rosenbaum, D. Foot loading patterns can be changed by deliberately walking with in-toeing or out-toeing gait modifications. Gait Posture 2013, 38, 1067–1069. [Google Scholar] [CrossRef]
- Shull, P.B.; Silder, A.; Shultz, R.; Dragoo, J.L.; Besier, T.F.; Delp, S.L.; Cutkosky, M.R. Six-week gait retraining program reduces knee adduction moment, reduces pain, and improves function for individuals with medial compartment knee osteoarthritis. J. Orthop. Res. 2013, 31, 1020–1025. [Google Scholar] [CrossRef]
- Chang, A.; Hurwitz, D.; Dunlop, D.; Song, J.; Cahue, S.; Hayes, K.; Sharma, L. The relationship between toe-out angle during gait and progression of medial tibiofemoral osteoarthritis. Ann. Rheum Dis. 2007, 66, 1271–1275. [Google Scholar] [CrossRef]
- Simic, M.; Wrigley, T.V.; Hinman, R.S.; Hunt, M.A.; Bennell, K.L. Altering foot progression angle in people with medial knee osteoarthritis: The effects of varying toe-in and toe-out angles are mediated by pain and malalignment. Osteoarthr. Cartil. 2013, 21, 1272–1280. [Google Scholar] [CrossRef] [Green Version]
- Xia, H.; Xu, J.; Wang, J.; Hunt, M.A.; Shull, P.B. Validation of a smart shoe for estimating foot progression angle during walking gait. J. Biomech. 2017, 61, 193–198. [Google Scholar] [CrossRef] [PubMed]
- Caderby, T.; Yiou, E.; Peyrot, N.; Bonazzi, B.; Dalleau, G. Detection of swing heel-off event in gait initiation using force-plate data. Gait Posture 2013, 37, 463–466. [Google Scholar] [CrossRef] [PubMed] [Green Version]
- Colyer, S.L.; Evans, M.; Cosker, D.P.; Salo, A.I.T. A Review of the Evolution of Vision-Based Motion Analysis and the Integration of Advanced Computer Vision Methods towards Developing a Markerless System. Sports Med. Open 2018, 4, 24. [Google Scholar] [CrossRef] [PubMed] [Green Version]
- Huang, Y.; Jirattigalachote, W.; Cutkosky, M.R.; Zhu, X.; Shull, P.B. Novel Foot Progression Angle Algorithm Estimation via Foot-Worn, Magneto-Inertial Sensing. IEEE Trans. Biomed. Eng. 2016, 63, 2278–2285. [Google Scholar] [CrossRef]
- Karatsidis, A.; Richards, R.E.; Konrath, J.M.; van den Noort, J.C.; Schepers, H.M.; Bellusci, G.; Harlaar, J.; Veltink, P.H. Validation of wearable visual feedback for retraining foot progression angle using inertial sensors and an augmented reality headset. J. Neuroeng. Rehabil. 2018, 15, 78. [Google Scholar] [CrossRef]
- Wouda, F.J.; Jaspar, S.; Harlaar, J.; van Beijnum, B.F.; Veltink, P.H. Foot progression angle estimation using a single foot-worn inertial sensor. J. Neuroeng. Rehabil. 2021, 18, 37. [Google Scholar] [CrossRef]
- Ziagkas, E.; Loukovitis, A.; Zekakos, D.X.; Chau, T.D.; Petrelis, A.; Grouios, G.A. Novel Tool for Gait Analysis: Validation Study of the Smart Insole PODOSmart®. Sensors 2021, 21, 5972. [Google Scholar] [CrossRef]
- Young, J.; Simic, M.; Simic, M. A Novel Foot Progression Angle Detection Method. In Computer Vision in Control Systems-4; Favorskaya, M., Jain, L., Eds.; Springer: Cham, Switzerland, 2018; Volume 136, pp. 299–317. [Google Scholar]
- Ledoux, W.R.; Hillstrom, H.J. The distributed plantar vertical force of neutrally aligned and pes planus feet. Gait Posture 2002, 15, 1–9. [Google Scholar] [CrossRef]
- Jameson, E.G.; Davids, J.R.; Anderson, J.P.; Davis, R.B.; Blackhurst, D.W.; Christopher, L.M. Dynamic pedobarography for children: Use of the center of pressure progression. J. Pediatr. Orthop. 2008, 28, 254–258. [Google Scholar] [CrossRef]
- Hagins, M.; Pappas, E. Biomechanics of the foot and ankle. In Biomechanics of the Foot and Ankle; Nordin, M., Frankel, V.H., Eds.; LWW: Philadelphia, PA, USA, 2012; pp. 206–253. [Google Scholar]
- Gefen, A.; Megido-Ravid, M.; Itzchak, Y.; Arcan, M. Biomechanical analysis of the three-dimensional foot structure during gait: A basic tool for clinical applications. J. Biomech. Eng. 2000, 122, 630–639. [Google Scholar] [CrossRef]
- Kadaba, M.P.; Ramakrishnan, H.K.; Wootten, M.E. Measurement of lower extremity kinematics during level walking. J. Orthop. Res. 1990, 8, 383–392. [Google Scholar] [CrossRef] [PubMed]
- Malatesta, D.; Canepa, M.; Menendez Fernandez, A. The effect of treadmill and overground walking on preferred walking speed and gait kinematics in healthy, physically active older adults. Eur. J. Appl. Physiol. 2017, 117, 1833–1843. [Google Scholar] [CrossRef] [PubMed]
- Winter, D.A. Biomechanics and Motor Control of Human Movement, 2nd ed.; Wiley: New York, NY, USA, 1990. [Google Scholar]
- Ghoussayni, S.; Stevens, C.; Durham, S.; Ewins, D. Assessment and validation of a simple automated method for the detection of gait events and intervals. Gait Posture 2004, 20, 266–272. [Google Scholar] [CrossRef]
- Bland, J.M.; Altman, D.G. Statistical methods for assessing agreement between two methods of clinical measurement. Lancet 1986, 1, 307–310. [Google Scholar] [CrossRef]
Figure 1.
Illustration of the two force-plate methods for estimating the foot progression angle: Method 1 (A) and Method 2 (B). TO and HC indicate toe-off and heel-contact, respectively.
Figure 1.
Illustration of the two force-plate methods for estimating the foot progression angle: Method 1 (A) and Method 2 (B). TO and HC indicate toe-off and heel-contact, respectively.

Figure 2.
Means and standard deviations of foot progression angle obtained from the reference method and both force-plate methods in the three speed conditions.
Figure 2.
Means and standard deviations of foot progression angle obtained from the reference method and both force-plate methods in the three speed conditions.

Figure 3.
Bland and Altman plot of differences between the reference method and both force-plate methods: Method 1 (A) and Method 2 (B). Solid line represents the mean error. Upper and lower horizontal dotted lines represent the limits of agreement (mean ± 1.96 standard deviation (SD) of the error between methods).


Table 1.
Means and standard deviations (SD) of relative errors (RE) and absolute errors (AE) obtained for each force-plate method in the three speed conditions. NS: non-significant difference (p > 0.05).
Table 1.
Means and standard deviations (SD) of relative errors (RE) and absolute errors (AE) obtained for each force-plate method in the three speed conditions. NS: non-significant difference (p > 0.05).
| Slow Speed | Preferred Speed | Fast Speed | Effects | ||||||
|---|---|---|---|---|---|---|---|---|---|
| Method 1 | Method 2 | Method 1 | Method 2 | Method 1 | Method 2 | Method | Speed | Interaction | |
| RE(°) | −6.1 ± 4.3 | −0.5 ± 3.7 | −6.2 ± 3.5 | −0.4 ± 2.2 | −5.1 ± 3.0 | −1.1 ± 1.8 | p < 0.01 | NS | NS |
| AE (°) | 6.2 ± 4.2 | 3.3 ± 2.1 | 6.2 ± 3.5 | 2.0 ± 1.2 | 5.1 ± 2.9 | 2.0 ± 1.2 | p < 0.01 | NS | NS |
Publisher’s Note: MDPI stays neutral with regard to jurisdictional claims in published maps and institutional affiliations. |
© 2022 by the authors. Licensee MDPI, Basel, Switzerland. This article is an open access article distributed under the terms and conditions of the Creative Commons Attribution (CC BY) license (https://creativecommons.org/licenses/by/4.0/).
Share and Cite
MDPI and ACS Style
Caderby, T.; Begue, J.; Dalleau, G.; Peyrot, N. Measuring Foot Progression Angle during Walking Using Force-Plate Data. Appl. Mech. 2022, 3, 174-181. https://0-doi-org.brum.beds.ac.uk/10.3390/applmech3010013
AMA Style
Caderby T, Begue J, Dalleau G, Peyrot N. Measuring Foot Progression Angle during Walking Using Force-Plate Data. Applied Mechanics. 2022; 3(1):174-181. https://0-doi-org.brum.beds.ac.uk/10.3390/applmech3010013
Chicago/Turabian StyleCaderby, Teddy, Jérémie Begue, Georges Dalleau, and Nicolas Peyrot. 2022. "Measuring Foot Progression Angle during Walking Using Force-Plate Data" Applied Mechanics 3, no. 1: 174-181. https://0-doi-org.brum.beds.ac.uk/10.3390/applmech3010013