
Developing a Decision-Making Framework to Improve Healthcare Service Quality during a Pandemic


1
Industrial Systems Engineering, Faculty of Engineering and Applied Science, University of Regina, Regina, SK S4S 0A2, Canada
2
Faculty of Business Administration, University of Regina, Regina, SK S4S 0A2, Canada
*
Author to whom correspondence should be addressed.
Appl. Syst. Innov. 2022, 5(1), 3; https://0-doi-org.brum.beds.ac.uk/10.3390/asi5010003
Submission received: 30 November 2021
/
Revised: 17 December 2021
/
Accepted: 21 December 2021
/
Published: 23 December 2021
Abstract
:The COVID-19 pandemic has significantly impacted almost every sector. This impact has been especially felt in the healthcare sector, as the pandemic has affected its stability, which has highlighted the need for improvements in service. As such, we propose a collaborative decision-making framework that is capable of accounting for the goals of multiple stakeholders, which consequently enables an optimal, consensus decision to be identified. The proposed framework utilizes the best–worst method (BWM) and the Multi-Actor Multi-Criteria Analysis (MAMCA) methodology to capture and rank each stakeholder’s preferences, followed by the application of a Multi-Objective Linear Programming (MOLP) model to identify the consensus solution. To demonstrate the applicability of the framework, two hypothetical scenarios involving improving patient care in an intensive care unit (ICU) are considered. Scenario 1 reflects all selected criteria under each stakeholder, whereas in Scenario 2, every stakeholder identifies their preferred set of criteria based on their experience and work background. The results for both scenarios indicate that hiring part-time physicians and medical staff can be the effective solution for improving service quality in the ICU. The developed integrated framework will help the decision makers to identify optimal courses of action in real-time and to select sustainable and effective strategies for improving service quality in the healthcare sector.
1. Introduction
Healthcare is a complex service sector that requires the involvement of multiple stakeholders with different preferences and values in the decision-making process [1]. For the past three decades, researchers have solved real-time problems in healthcare settings using a different multi-criteria decision making (MCDM) methods including Analytic Hierarchy Method (AHP) and hybrid methods [1,2]. The MCDM method has become widely used due to its use of quantitative and qualitative data, as this allows researchers to reach trustworthy, consensus decisions in situations with contradicting evidence. Glaize et al. [2] suggested the use of MCDM tools for different areas in healthcare service improvement. Although the inclusion of multiple stakeholders in the decision-making process is critical for yielding more sustainable solutions, it can make it much more difficult to achieve consensus, as each stakeholder may have their own preferences and values. As such, each stakeholder may be more focused on their own objectives rather than finding the best solution for the organization overall. For example, in the healthcare sector, physicians aim to improve their equipment resources, but the administrative staff may be focused on improving the quality of service received by patients; this divergence in viewpoints thus makes it difficult to reach a consensus solution. Fortunately, the application of a hybrid decision-making framework can help stakeholders overcome these conflicting aims and find a consensus solution.
The need for MCDM in healthcare has peaked during the current Novel Coronavirus (COVID-19) pandemic, as it has required governments to make frequent real-time changes to health policies and priorities in response to this rapidly developing situation. Given the complexities that arise from having to include multiple stakeholders in the decision-making process, the real challenge for hospital management is selecting an appropriate decision-making tool. Although different group decision-making tools are available, achieving consensus among a diverse group of stakeholders in a short period will always be difficult. The pandemic has caused the whole healthcare system to become congested, but this problem has become especially critical for Intensive Care Units (ICU), which have become severely congested due to limited capacity and increased demand [3,4]. While the MCDM framework developed in this paper is general in nature, we apply it to an ICU ward, as it treats high-priority patients who require the highest quality of service at all times [4]. Another reason for considering an ICU ward is that the medical staff and physicians have a relatively higher chance of making errors due to work fatigue [5,6].
Our work aims to answer the following research questions:
- What are the important criteria involved to enhance service quality in the ICU during this pandemic?
- What are the effective solutions that can be applied to improve the quality of service received by ICU patients during this pandemic?
- How can multiple stakeholders and their preferences be included in the decision-making process?
In order to answer these questions, this study proposes a collaborative multi-stakeholder decision-making framework that, when implemented, can improve the quality of service received by patients during this pandemic. The majority of previous studies like this one have focused on finding the best solutions by combining different MCDM methods [7,8]. Most existing MCDM methods provide results based on a single stakeholder group opinion. However, including stakeholders in the decision-making process is a critical task for the health care sector, even though their various preferences can make it difficult to achieve a consensus solution. Indeed, lack of consensus among stakeholders causes many solutions obtained through the collective decision-making process to ultimately become unsustainable [9]. Stakeholders normally favor solutions that will improve their department, even if these solutions do not always advance overall system improvement. Similarly, decisions related to improving ICU service require unanimous support among stakeholders, which entails either full agreement or some level of compromise.
This proposed framework integrates the best–worst method (BWM) and Multi-Actor Multi-Criteria Analysis (MAMCA) with a Multi-Objective Linear Programming (MOLP) optimization model. Specifically, the BWM first assigns weights to all the criteria based on stakeholder input, and MAMCA is then used to identify the best alternative for each stakeholder group. Since the integrated BWM–MAMCA results only show the best-ranked alternative for each stakeholder group, but not the best common solution among all groups, an MOLP model is utilized to obtain a consensus solution.
This research makes the following key contributions:
- i)
- It identifies a comprehensive list of factors for improving service quality in ICUs based on a detailed review of the relevant COVID-19-related literature.
- ii)
- It presents the development of a systematic decision-making framework that integrates the BWM, MAMCA, and MOLP methods.
- iii)
- The proposed framework can guide decision makers in situations where there are competing demands and enable them to select the best option for improving the quality of patient service within the context of COVID-19.
This paper is structured as follows: Section 2 provides a brief explanation about the criteria, alternatives, stakeholders, and method along with the rationale behind their selection. Section 3 details the development of the proposed integrated framework (BWM–MAMCA–MOLP) for finding consensus solutions in group decision-making scenarios. Section 4 documents the implementation of the proposed framework in two different scenarios, with the results being discussed in Section 5. Finally, the concluding section summarizes the overall framework, discusses its limitations, and outlines some future research directions.
2. Literature Review
This paper proposes a tool that integrates the BWM–MAMCA–MOLP models in order to support decision making and improve service quality for patients in ICUs. In this section, we first provide a brief explanation of each MCDM method and the rationale for selecting it, followed by a review of selected literature related to ICU service quality improvement. Finally, we provide the rationale for the selected criteria, alternatives, and stakeholders based on the results of the literature review.
2.1. Decision-Making Methods Used
There are numerous decision-making tools that can be implemented to improve service quality in a healthcare setting. For example, Altuntas and Kansu [7] integrated quality function deployment (QFD), service quality measurement (SERVQUAL), and failure modes and effects analysis (FMEA) approaches for service quality improvement in a public hospital in Turkey. Afkham et al. [8] combined the analytic hierarchy process (AHP), Technique for Order of Preference by Similarity to Ideal Solution (TOPSIS), and fuzzy theory to form a framework for evaluating and comparing quality of service in different hospitals. Lu et al. [10] constructed a general hybrid framework for adopting Radio Frequency Identification (RFID) equipment into the healthcare sector. Their framework integrated the decision-making trial and valuation laboratory (DEMATEL), DEMATEL-based analytic network process (DANP), and multi-criteria optimization and compromise solution (VIKOR) methods. Researchers continue to explore new MCDM methods. For example, Sałabun [11] proposed a new intuitionistic distance-based approach COMET (characteristic objects method). Pamučar and Ćirović [12] used MABAC (Multi-Attributive Border Approximation Area Comparison) method for the selection of transport and handling resources in logistics centers. Rezaei [13] proposed the best–worst method (BWM) method. Recently, Dezert et al. [14] developed the Stable Preference Ordering Towards Ideal Solution method (SPOTIS) method, which is a rank reversal free method. However, Kizielewicz et al. [15] demonstrated that the determination of the weights of the attribute plays a vital role in these MCDM methods. While a myriad other methods has been developed, the remainder of this section will focus on the BWM, MAMCA, and MOLP methods, as these methods comprise the decision-making framework proposed in this paper.
The BWM method is a structural procedure for solving multi-criteria decision-making problems with selected criteria and alternatives. The BWM method has two unique advantages over other MCDM methods: (1) it is simple procedure that requires less information, and (2) it is more reliable, as it provides more consistent results [13]. In the BWM method, stakeholders rank criteria from best to worst, and weights are then assigned to these criteria based on the rankings. This feature is especially helpful when multiple stakeholders are involved in the decision-making process, as it allows decision makers to identify criteria that are perceived as important to multiple stakeholder groups. Recently, researchers in other fields have become interested in BWM. For example, to evaluate overall manufacturing performance, Khan et al. [16] developed a performance evaluation framework. Fartaj et al. [17] combined BWM with rough strength-relation for predicting transportation disruption factors in order to allow managers to focus on the particular issue instead trying to address all of the related factors. In another study, Moktadir et al. [18] used BWM to determine that “lack of technological infrastructure” was the biggest challenges to implementing Industry 4.0 in the leather industry. Despite these successful applications, BWM has some limitations, such as: (1) it is incapable of considering the ordinal consistency, and (2) there is not consistency of the threshold limit in determining the reliability of the results [19].
Traditional MCDM methods are limited by the fact that they require all stakeholders to consider the same set of criteria. Thus, they are unable to accommodate multiple stakeholders with their own set of criteria or decision trees. To address this issue, and to allow the inclusion of multiple stakeholders, we utilize a new interactive tool called MAMCA to evaluate alternatives to the selected criteria. MAMCA is a multi-actor decision-making tool that can predict the best solution for each involved stakeholder group based on their respective sets of criteria [20]. Although most decision-making tools can rank alternatives, none can assure a sustainable solution; this is only possible when all of the stakeholders have agreed upon the best common alternative. Huang et al. [9] used MAMCA to find a consensus solution among multiple stakeholders in the area of modern transportation and logistics. However, MAMCA has some limitations; for example, it is unable to provide a consensus solution by itself.
As MacHaris et al. [20] note, MAMCA is not designed to provide the best solution based on the rankings; rather, it is intended to help the decision-maker visualize the interests of each stakeholder. To overcome this limitation, and to attain a consensus solution among stakeholders, we utilize Multi-Objective Linear Programming (MOLP). MOLP is a branch of mathematical optimization that finds an optimal solution by considering more than one objective function. The results obtained through this method are Pareto-efficient, which does not violate the fundamentals of decision theory. Furthermore, its flexibility allows it to be integrated with other MCDM methods and enables multiple stakeholders to be included in the decision-making process [21]. MOLP can be performed using a tool called Sequential Interactive Modelling for Urban Systems (SIMUS), which has a long history in the decision-making field. Nigim et al. [22] used AHP and SIMUS to determine the suitable application of renewable energy sources for a particular site. The AHP method uses pairwise comparison provided by the decision-makers (which is more subjective), while SIMUS consider actual or quantitative data. However, both methods provided the same ranking of alternatives in that study. In another study, Stoilova [23] explored the feasibility of integrating the SIMUS with the Technique for Order of Preference by Similarity to Ideal Solution method (TOPSIS) and VIKOR to find the best alternative for an intercity passenger train. A comparison of the results showed that SIMUS–TOPSIS is a better-integrated approach than SIMUS–VIKOR [23]. However, the integration of SIMUS with other MCDM methods has not been studied extensively.
2.2. Research Related to ICU Service Quality Improvement
Improving ICU service quality is a crucial task in any hospital that requires input from multiple stakeholders, and such decisions have become especially important during the COVID-19 pandemic. Fitzsimons [24] suggested the use of multiple lean tools, improvement science, behavioural science, and other techniques to improve the quality of patient service in response to the COVID-19 pandemic. Similarly, in their study of the Cleveland Clinic (Ohio), Oesterreich et al. [25] suggested that the management team could improve patient care by implementing managerial changes in response to changes in the pandemic situation.
Researchers have been studying ICU service improvement since well before the COVID-19 pandemic struck. In one such study, Chaboyer et al. [26] implemented a series of managerial changes to redesign the operation of an ICU at an Australian hospital, including appointing a lead nurse to discharge patients from the ICU and developing a patient handover sheet containing the patient’s critical medical information. Their findings showed that these changes reduced the ICU patient discharge delay time from 4.6 to 3.2 h, while not affecting patient mortality rate [26]. In another study, McWilliams et al. [27] addressed the negative impact of using mechanical ventilators on ICU patients for prolonged periods by adding a supportive rehabilitation team to the ICU’s operations. Their findings showed that these changes improved ICU mobility and reduced both the number of ventilator days per patient and the mortality rate [27]. This sub-section clearly shows that ICUs are constantly in need of service improvements, and that these improvements require input from professionals from numerous different disciplines. A structured MCDM framework is one of the most effective tools for arriving at sustainable conclusions in group decision-making processes. In the next subsection, we identify the main inputs used in our model.
2.3. ICU Service Quality Improvement Criteria, Alternatives, and Stakeholders
All the criteria, alternatives, and stakeholders used in our model were identified and selected based on an extensive literature review. In this section, we present the criteria, alternatives, and stakeholders used as inputs for our model.
2.3.1. Criteria
Table 1 lists the selected criteria for improving quality of patient service in an ICU. Multiple studies expressed that the patients’ health and service quality directly correlated to inadequate staffing levels [28,29]. According to Powell et al. [30], inadequate staff can produce less revenue per patient, while overstaffing leads to high operational and capital costs. For this, the determination of optimal staffing level is an important task in the healthcare sector [31]. Moreover, the ICU staff can be more prone to make mistakes due to the high level of stress and work fatigue due to the pandemic [32]. Before admitting the patient to the ICU, the severity of patients is generally determined using the appropriate scale. For example, the Canadian Triage and Acuity Scale (CTAS) classifies the patients to Level 1—Resuscitation, 2—Emergent, 3—Urgent, 4—Less urgent, and 5—Non-urgent based on the severity. These prioritizations help to identify high-risk patients and balance the staff workload and hospital revenue. To determine the patient’s length of stay in the ICU, Pérez et al. [33] performed the Markov chain analysis. This type of analysis can be helpful to forecast the number of expected patients in any specific period and to take effective action to prevent congestion [34,35].
Many ICU patients need regular follow-up after discharge and require home care treatment. ICU discharge patients may need walkers, oxygen, and other medical equipment to monitor their health condition. For this, personal home care procedures including post-discharge activities such as drug consumption procedures; regular doctor consulting plans; and additional service from a social worker, physiotherapist, or nurse can play a vital role [35,36]. All these personal care procedures can reduce the possibility of re-admission and reduce the workload of ICU physicians and staff and overall ICU operations. Many hospitals gather after-treatment feedback from the patient on hospital standards, quality of the personal care providers (e.g., physician, nurse, other staff), hospitality, and other topics. Henrich et al. [37] and Al-Abri and Al-Balushi [38] demonstrated that using a patient satisfaction survey can deliver continuous and steady quality improvement in the healthcare sector.
2.3.2. Alternatives
Alternatives were selected based on the extensive literature review and the suggestions of an anonymous expert, with the “best” alternatives satisfying the greatest number of criteria. All the alternatives were selected with the goal of improving the quality of service received by ICU patients during the COVID-19 pandemic, which can only be achieved by reducing the workloads of physicians and other medical staff [40]. Determining the best alternative was one of the most challenging aspects of this study, especially given the involvement of multiple stakeholders. The selected alternatives are listed in Table 2.
2.3.3. Identification of Stakeholders
Stakeholders—which include staff from bottom-level workers to top-level management and external groups who are indirectly involved in the organization’s growth—are an integral part of any organization. In this study, stakeholders are divided into the three categories as defined by Fottler et al. [47].
- a)
- Internal Stakeholders: people who are responsible for tending to the organization’s everyday business. In a hospital context, internal stakeholders include physicians, nurses, management teams, and other professional staff.
- b)
- Interface Stakeholders: people who work between the hospital and the external environment. Fottler et al. [47] have argued that, compared to internal and external stakeholders, interface stakeholders are the major driving stakeholders in hospital management. This group includes some of the medical staff, corporate office, board of trustees, and others.
- c)
- External Stakeholders: can be broken down into three subcategories based on their relationship with the hospital sector. The first sub-category includes patients, medical suppliers, and others who provide input to the hospital. The second sub-category includes competitors (i.e., other hospitals) who focus on revenue and other experienced staff. The third sub-category consists of special interest groups who have a direct relation to hospital operations (i.e., policymakers, professional associations, labour unions, and others) [47].
As Glaize et al. [2] note, it is critical to select the appropriate stakeholders involved in healthcare decision-making processes, as the final ranking of alternatives depends on the stakeholders’ opinions. After an in-depth literature review, five key stakeholders in hospital management were identified: STKH 1 (Stakeholder 1)—Physicians, STKH 2—Patients, STKH 3—Medical Staff, STKH 4—Insurance Providers, and STKH 5—Policy Makers. Figure 1 highlights the criteria, alternatives, and stakeholders selected for this study.
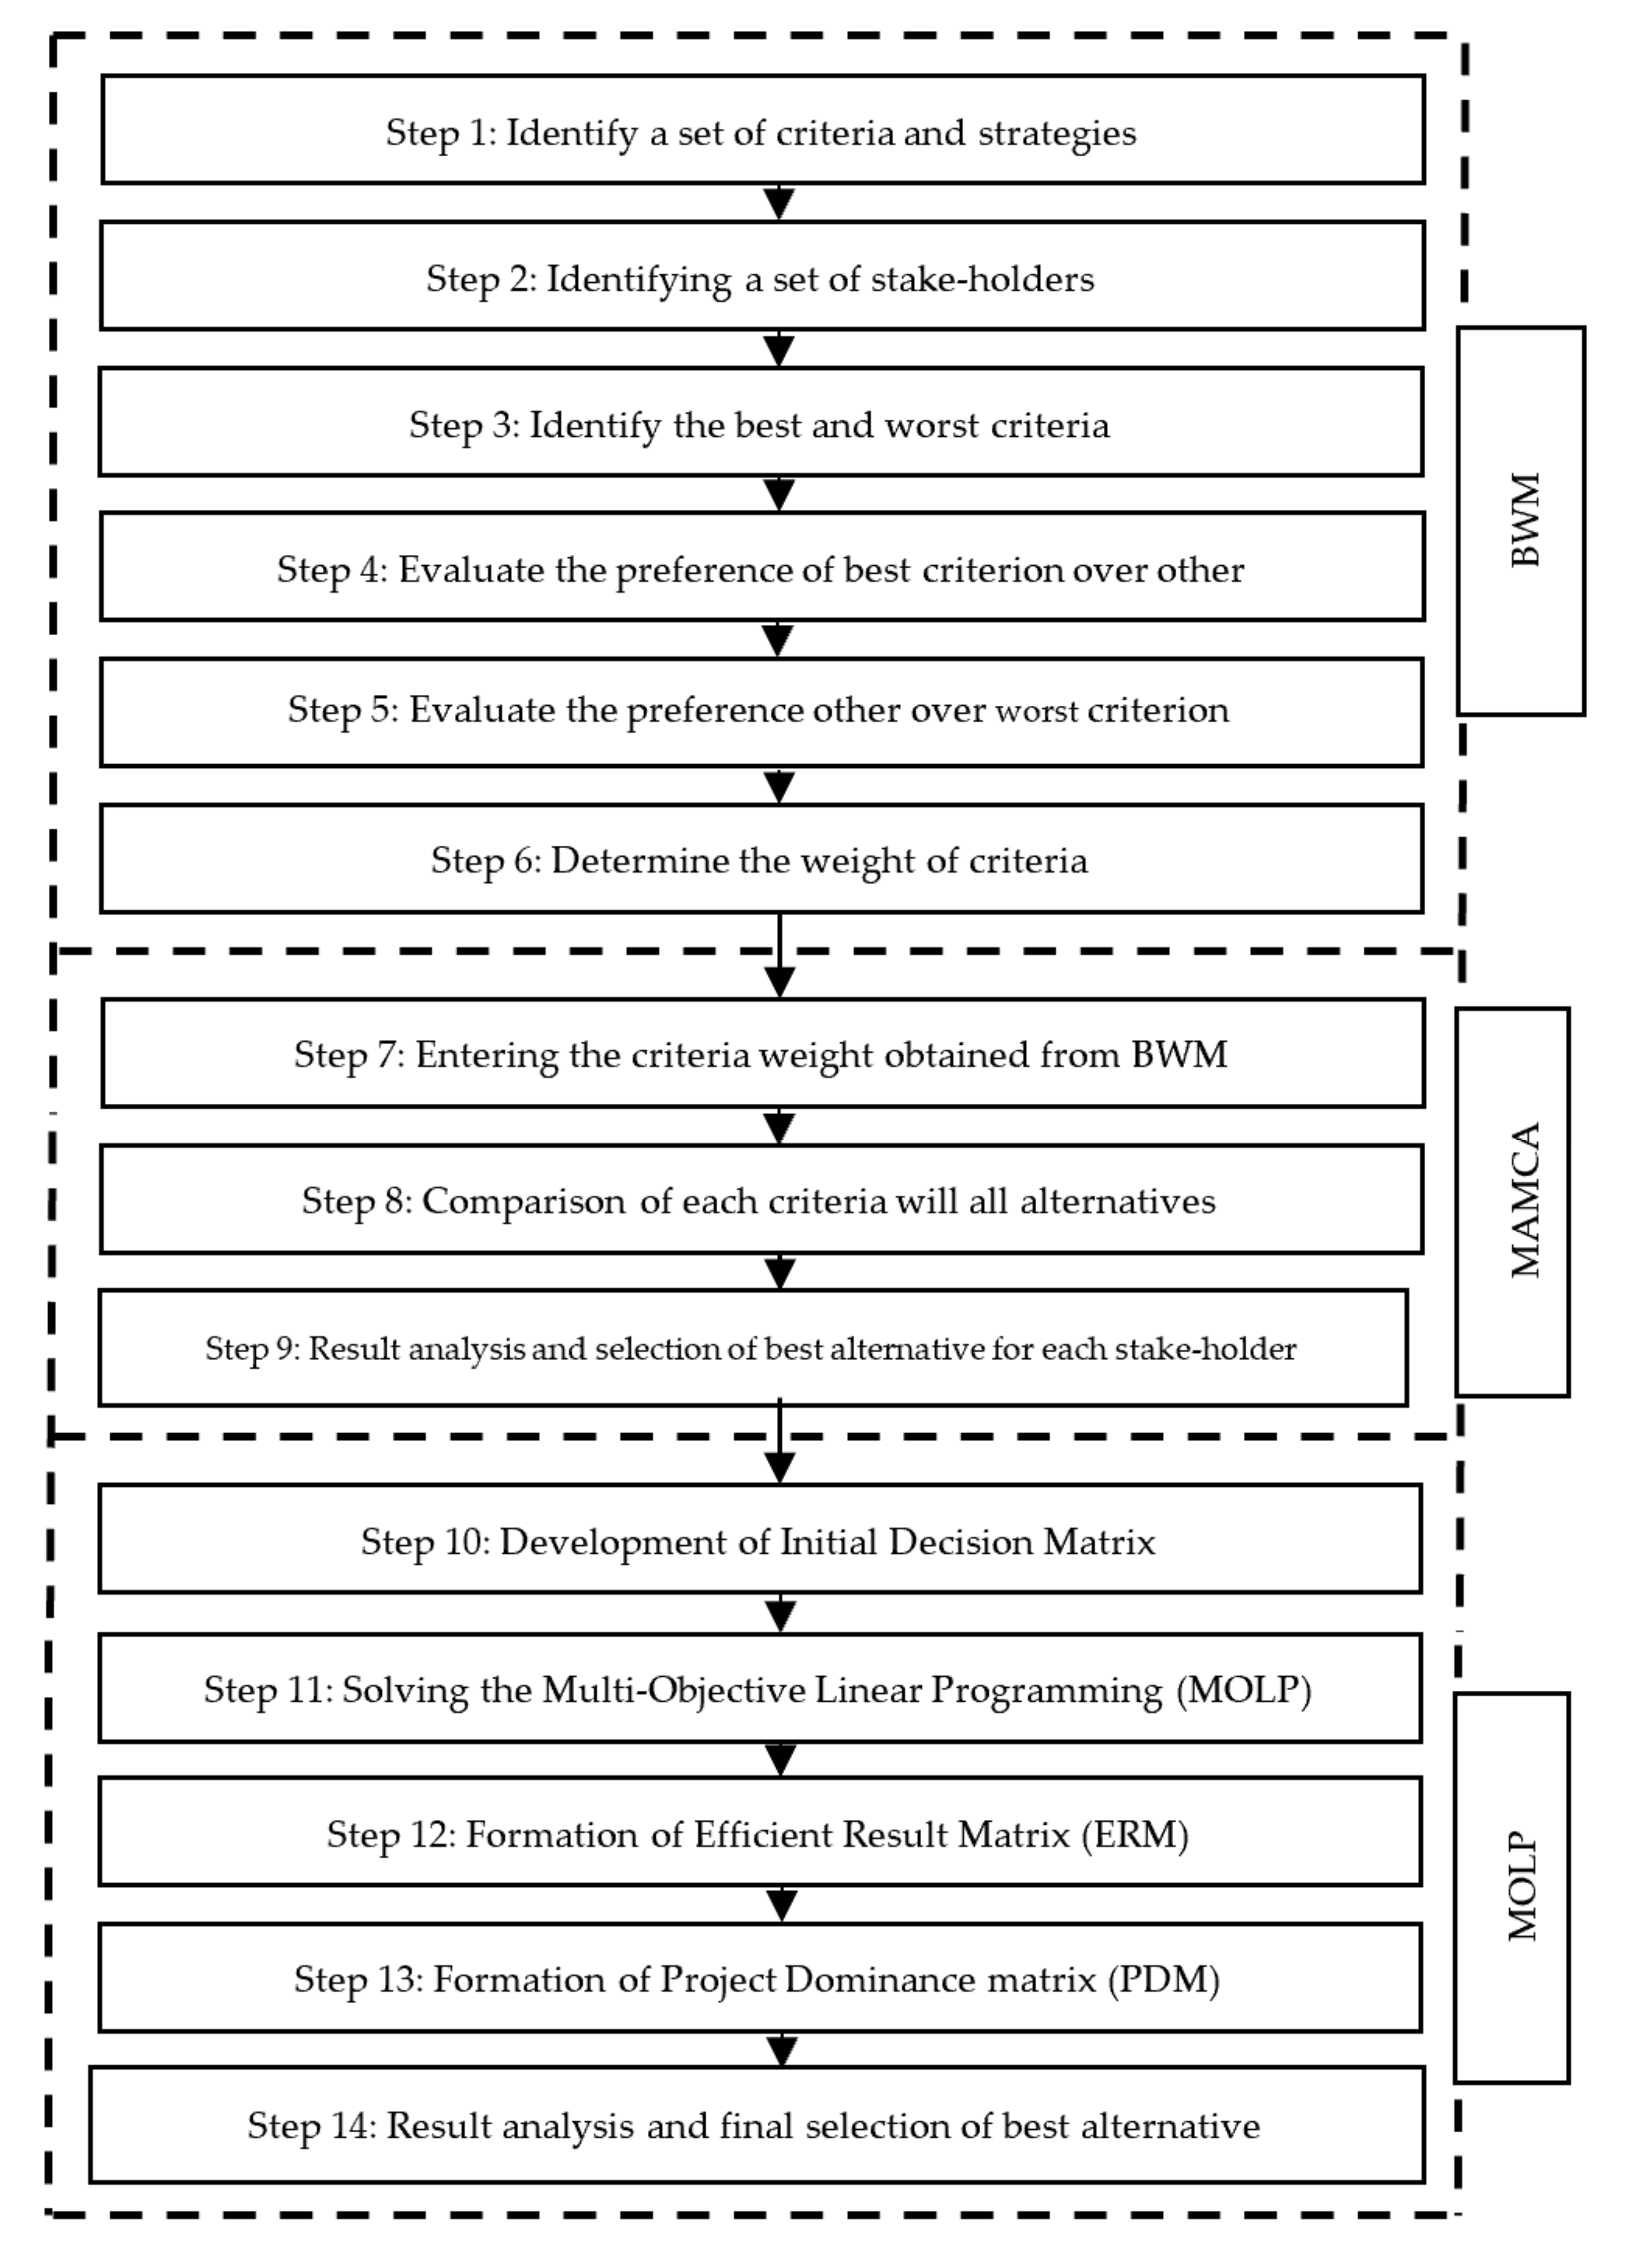
3. Method
In this work, we develop an MCDM framework and use it to improve the quality of service in an ICU during the COVID-19 pandemic. The general framework (BWM–MAMCA–MOLP) was developed to enable the selection of the optimal solution and to highlight the importance of reaching consensus among stakeholders. This general framework (Figure 2) can be applied to any department in a hospital simply by selecting the relevant criteria, alternatives, and stakeholders. BWM and MAMCA were developed based on Rezaei [13], MacHaris et al. [20], Sivakumar et al. [48], and Huang et al. [9], whereas the MOLP (SIMUS) is based on Munier et al. [21] and Stoilova [23].
3.1. Best-Worst Method (BWM)
Step 1: Identifying Criteria and Strategies.
The appropriate criteria {CR1, CR2, CR3, …, CRm} for improving quality of service in the ICU were identified based on the literature. Table 1 lists and describes the selected criteria along with their corresponding references. The appropriate alternatives or strategies {A1, A2, A3, …, An} for improving service quality in the ICU are listed in Table 2.
Step 2: Identifying Key Stakeholders.
Five potential key stakeholders were identified: physicians, patients, medical staff, insurance providers, and policymakers. To demonstrate the applicability of the proposed framework, all of these stakeholders were considered.
Step 3: Determining the Best and Worst Criteria.
All stakeholders were asked to select the best (B) and worst criteria (W) from the general list of identified criteria. This process was naturally dependent on each stakeholder’s background and preference to achieve the common goal.
Step 4: Rating the Best Criterion over the Other Criteria.
In this step, the stakeholders were asked to rate the degree to which they preferred their best criteria over the other criteria on a 9-point scale, where 1 indicates equal preference and 9 indicates the highest preference. This process can be written as:
where AB represents the pairwise comparison of best criteria, aBj represents the preference of best criterion over the other criterion j, and aBB = 1.
AB = (aB1, aB2, aB3, aB4, …, aBn)
Step 5: Rating the Other Criteria over the Worst Criterion.
In this step, each stakeholder was asked to rate all of the other criteria compared to their selected worst criterion using the same 9-point scale as step 4. This can be represented as:
where AW indicates the pairwise comparison of worst criteria, ajW represents the preference of j criteria over the worst criterion, and aWW = 1.
AW = (a1W, a2W, a3W, a4W, …, anW)
Step 6: Determining the Optimal Weights of the Selected Criteria.
The optimal weights of the criteria (k1*, k2*, k3*,…, kn*) must be determined to satisfy the following requirements. Each pair of kB/kj and kj/kw has a possible solution of kB/kj = aBj and kj/kw = ajW. To achieve a better solution, the maximum among the set, {|kB − aBjkj|,|kj − ajW kW|}, is minimized, and the problem is formulated as:
Equation (3) can then be transformed into a linear program:
subject to,
After finding the weights (k1*, k2*, k3*, …, kn*), the can be determined. Note that the reliability and consistency of the results increase as the value nears zero.
3.2. Multi-Actor Multi-Criteria Analysis (MAMCA)
Step 7: Enter the Criteria Weight Obtained from BWM.
The stakeholder criteria weights obtained via BWM are entered into MAMCA in order to obtain the best alternative for each stakeholder.
Step 8: Comparing Each Criterion with All Alternatives.
Once the decision maker reaches the evaluation tab in MAMCA, each STKH must perform the SMART (Specific, Measurable, Achievable, Realistic, and Timely) evaluation by ranking each alternative’s suitability for each criterion on a 10-point scale, where 1 is the least preferred and 10 is the most preferred.
Step 9: Result Analysis and Selection of Best Alternatives for Each Stakeholder.
In this step, the MAMCA provides overall visual results showing each stakeholder’s highest-ranked alternatives. In addition, the MAMCA provides the sensitivity analysis results, which show the variation in the final ranking with respect to changes in criteria weight, as well as the average actor group result. It also shows the best-ranked alternative for each stakeholder group. According to the considered criteria and weights, each stakeholder gets their desired alternative independently (i.e., without consensus).
3.3. Multi-Objective Linear Programming
Step 10: Development of an Initial Decision Matrix (IDM).
In this stage, every stakeholder compares their criteria with all of the alternatives on a 10-point scale, where 1 is the least preferred and 10 is the most preferred. The main advantage of using SIMUS is its capability to group stakeholders’ preference values into a single IDM in order to evaluate the alternatives with consensus. Since this study also wants to show the differences in the ranking of alternatives with and without consensus, the SMART evaluation values obtained in MAMCA were used as inputs for the IDM.
Step 11: Solving the Multi-Objective Linear Programming (MOLP).
This study considered nine criteria, with all being considered objective functions. For instance, if Criteria 1 was considered as the objective function, it was removed from the IDM, and the remaining criteria (2–9) were considered as constraints. Similarly, Criteria 2 would be removed from the IDM (as the objective function) in the second iteration, and Criteria 1 would be re-inserted and considered as a constant along with the rest of the criteria (Criteria 1, 3, …, 9). This process is repeated until SIMUS has considered every criterion as an objective function. Equation (5) shows a general representation of the first criteria optimization, where an, bn, cn, dn, en are the variables that represent the stakeholders preference values, and Zn represents the RHS threshold value. Equation (6) shows the ninth criteria optimization problem.
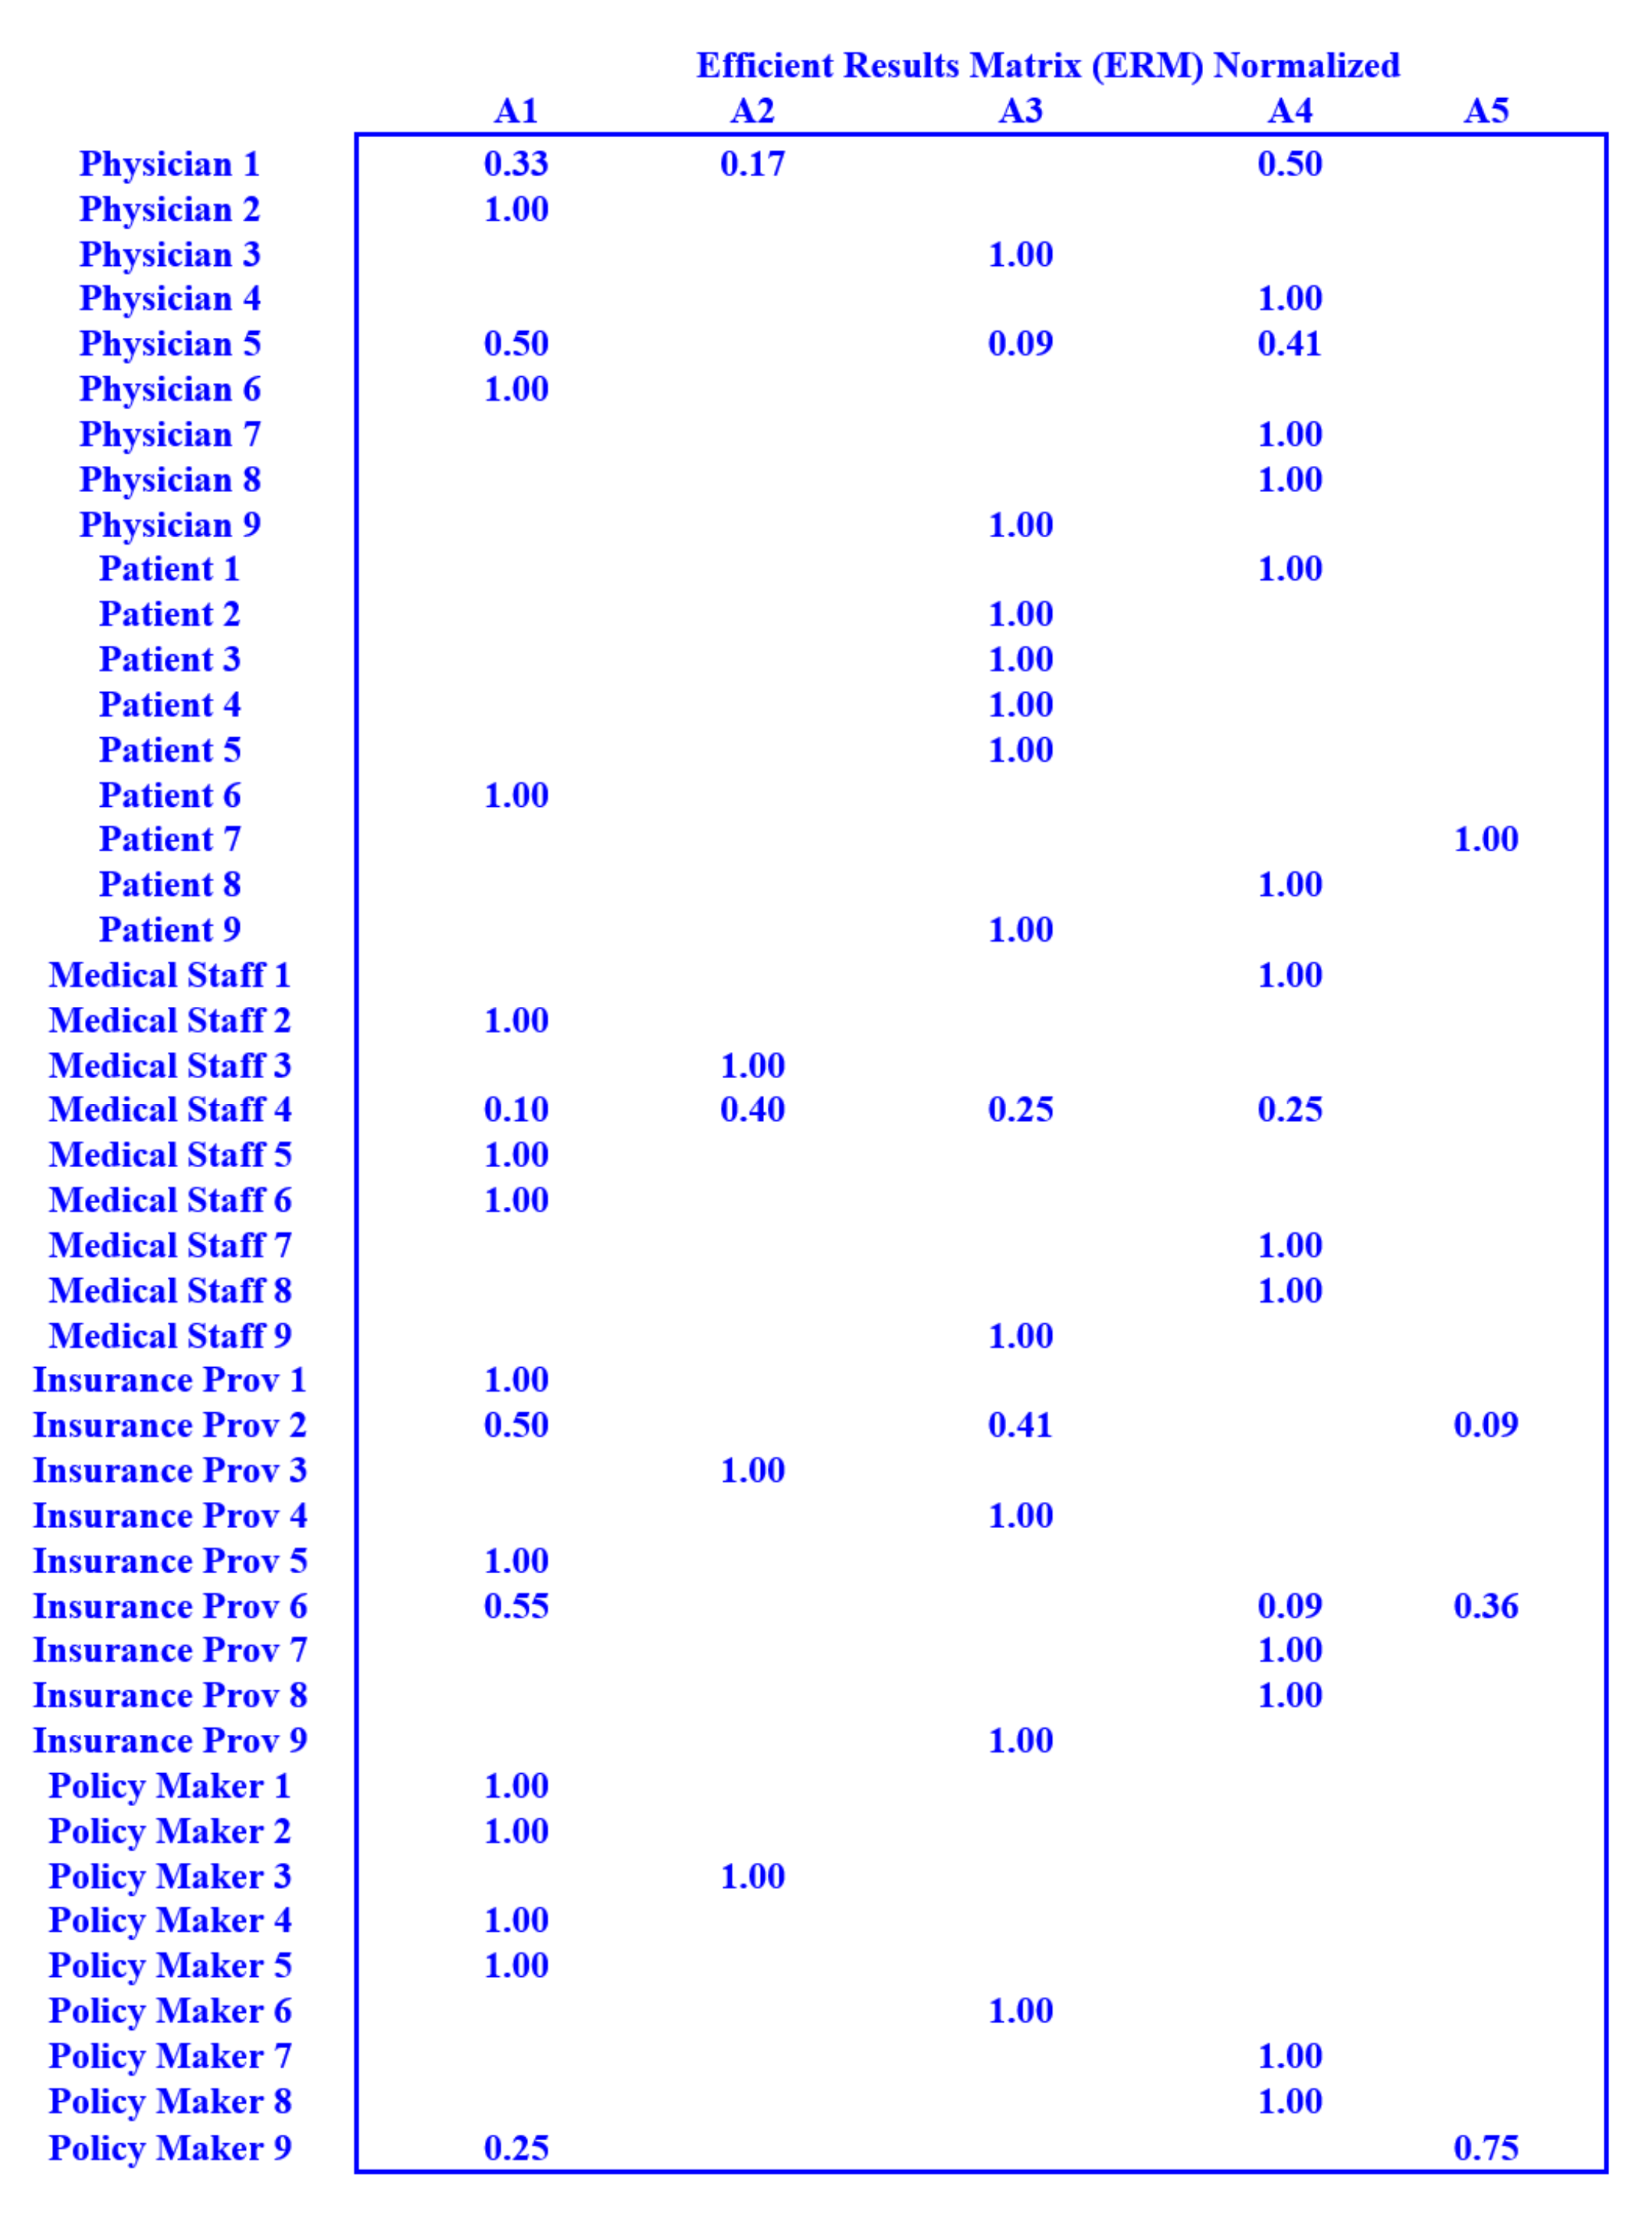
Step 12: Forming an Efficient Result Matrix (ERM).
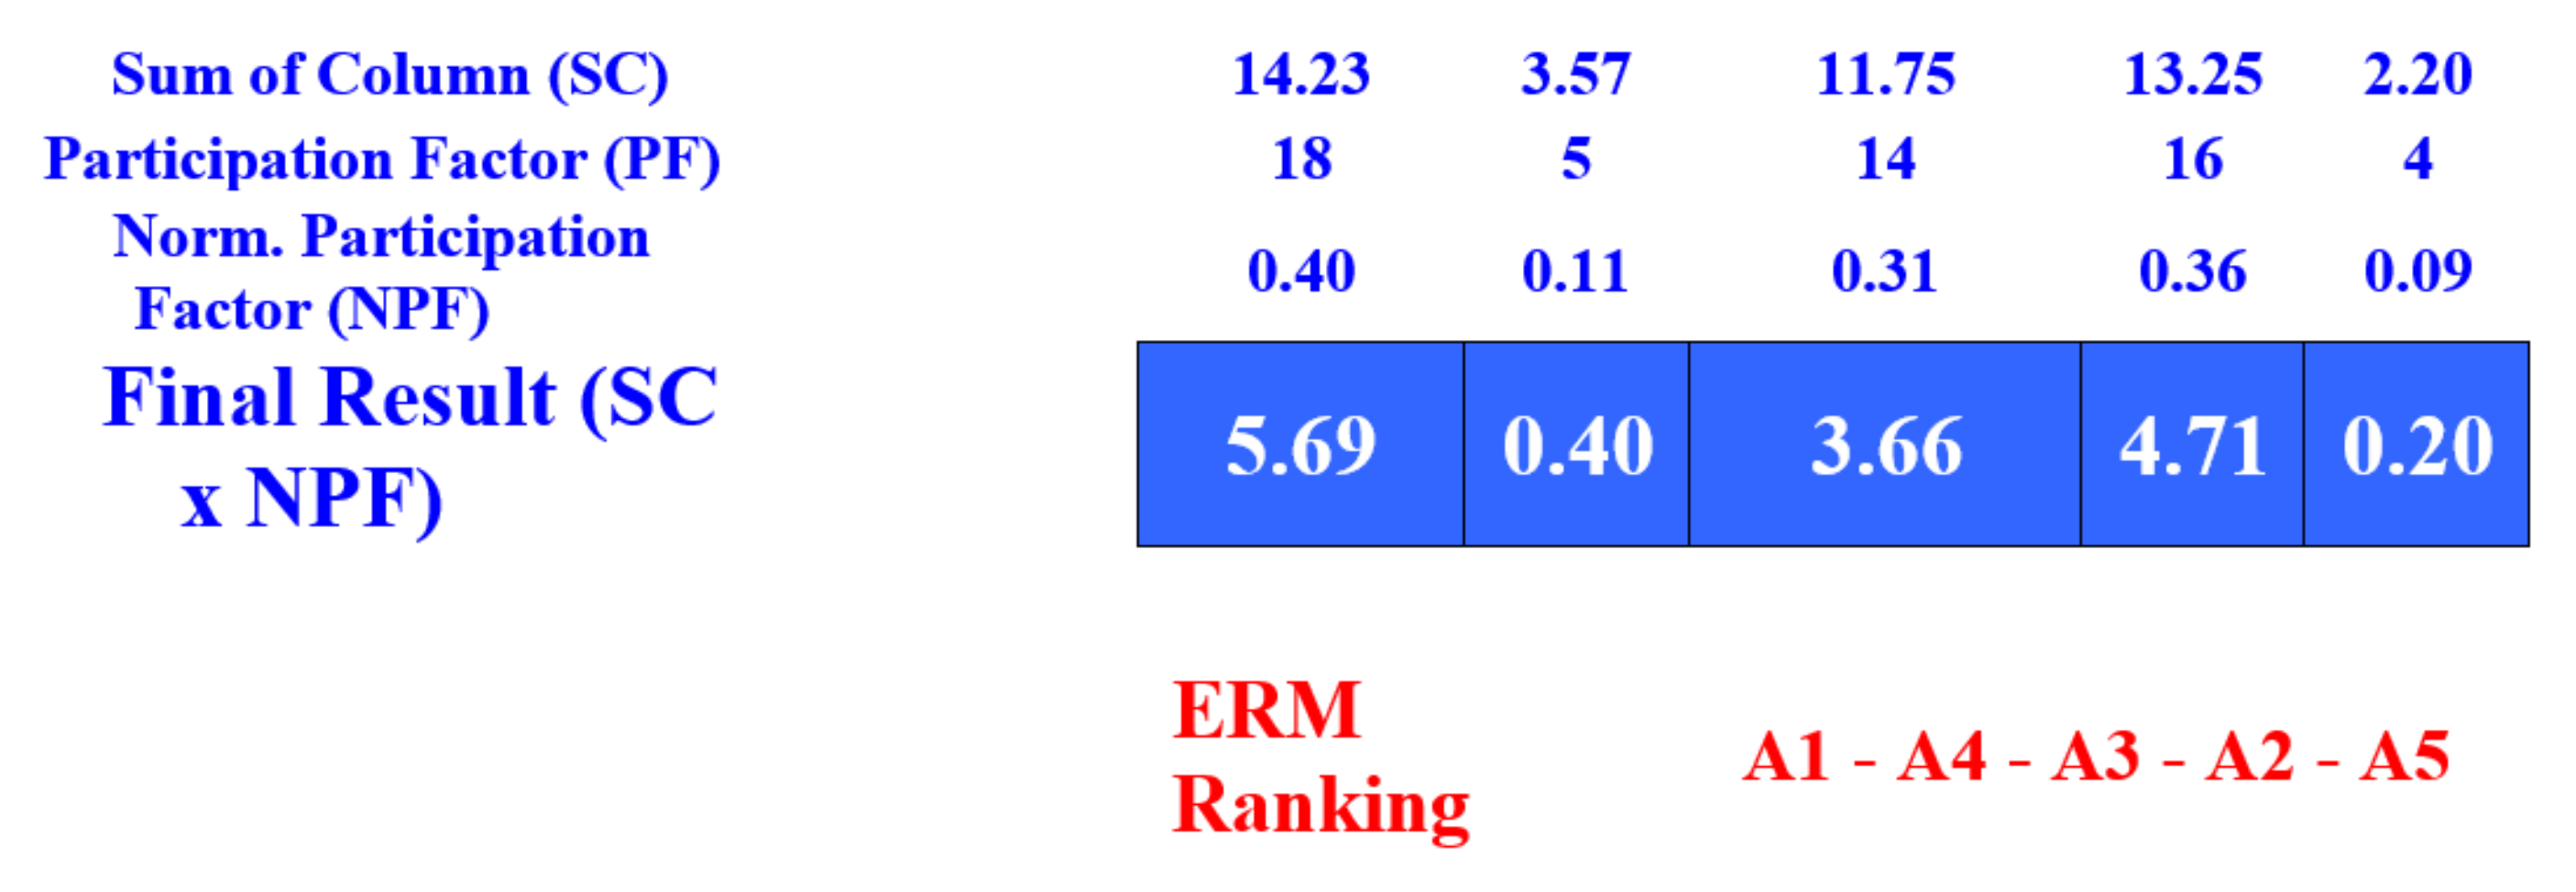
In this step, the solutions are arranged to form a Pareto Efficient Matrix (PEM) and Efficient Result Matrix (ERM), since the obtained values were optimal [21]. The grouped values are then normalized, and the participating factor (PF) is determined based on how many objectives an alternative is able to satisfy. Next, the normalized participating factor (NPF) is calculated by dividing the PF by the number of criteria considered [21]. Once this has been done, the final results are achieved by multiplying SC × PF, which enables the determination of the ERM alternative ranking.
Step 13: Forming a Project Dominance Matrix (PDM).
In this step, the alternatives are ranked to cross-verify the ERM results, as this helps the decision maker to compare or cross-verify the results obtained through SIMUS. The differences in value between each alternative and the other alternatives are grouped to form a PDM matrix. Next the final ranking is determined based on the difference between the dominant (rows) and subordinate (columns) values. Naturally, the alternative rankings produced by the ERM and PDM will be exactly matched with each other, and there will be no deviation in the result.
Step 14: Result Analysis and Final Selection of Best Alternative with Consensus.
Finally, the alternative rankings based on the PDM and ERM are compared with the BWM–MAMCA results. The DM can choose the best alternative by comparing their respective results. In the next section, the proposed framework is implemented in two different scenarios.
4. Results
The developed integrated framework was implemented in two hypothetical scenarios designed to demonstrate its feasibility for yielding consensus solutions for improving ICU service quality during the COVID-19 pandemic. One stakeholder from each group was selected. The proposed framework is also capable to handle multiple stakeholders from each stakeholder group. The average values can be considered in that situation.
4.1. Scenario 1
In Scenario 1, all nine criteria (Figure A1) are assigned to all stakeholders irrespective of their work background or preferences. Every stakeholder provides a preference value to each criterion in order to find the consensus solution.
Step 1: Determining Best and Worst Criteria: Table 3 shows the selected best and worst criteria for all stakeholders.
Step 2: Rating the Best Criterion over the Other Criteria, and the Other Criteria over the Worst Criterion: The stakeholders’ preference values for the best criterion versus the others are listed in Table A1, and the preference values for the other criteria over the worst criterion is listed in Table A2.
Step 3: Determining the Optimal Weights of the Selected Criteria: The optimal weights of the selected criteria were calculated using Equation (4). The results are summarized in Table 4.
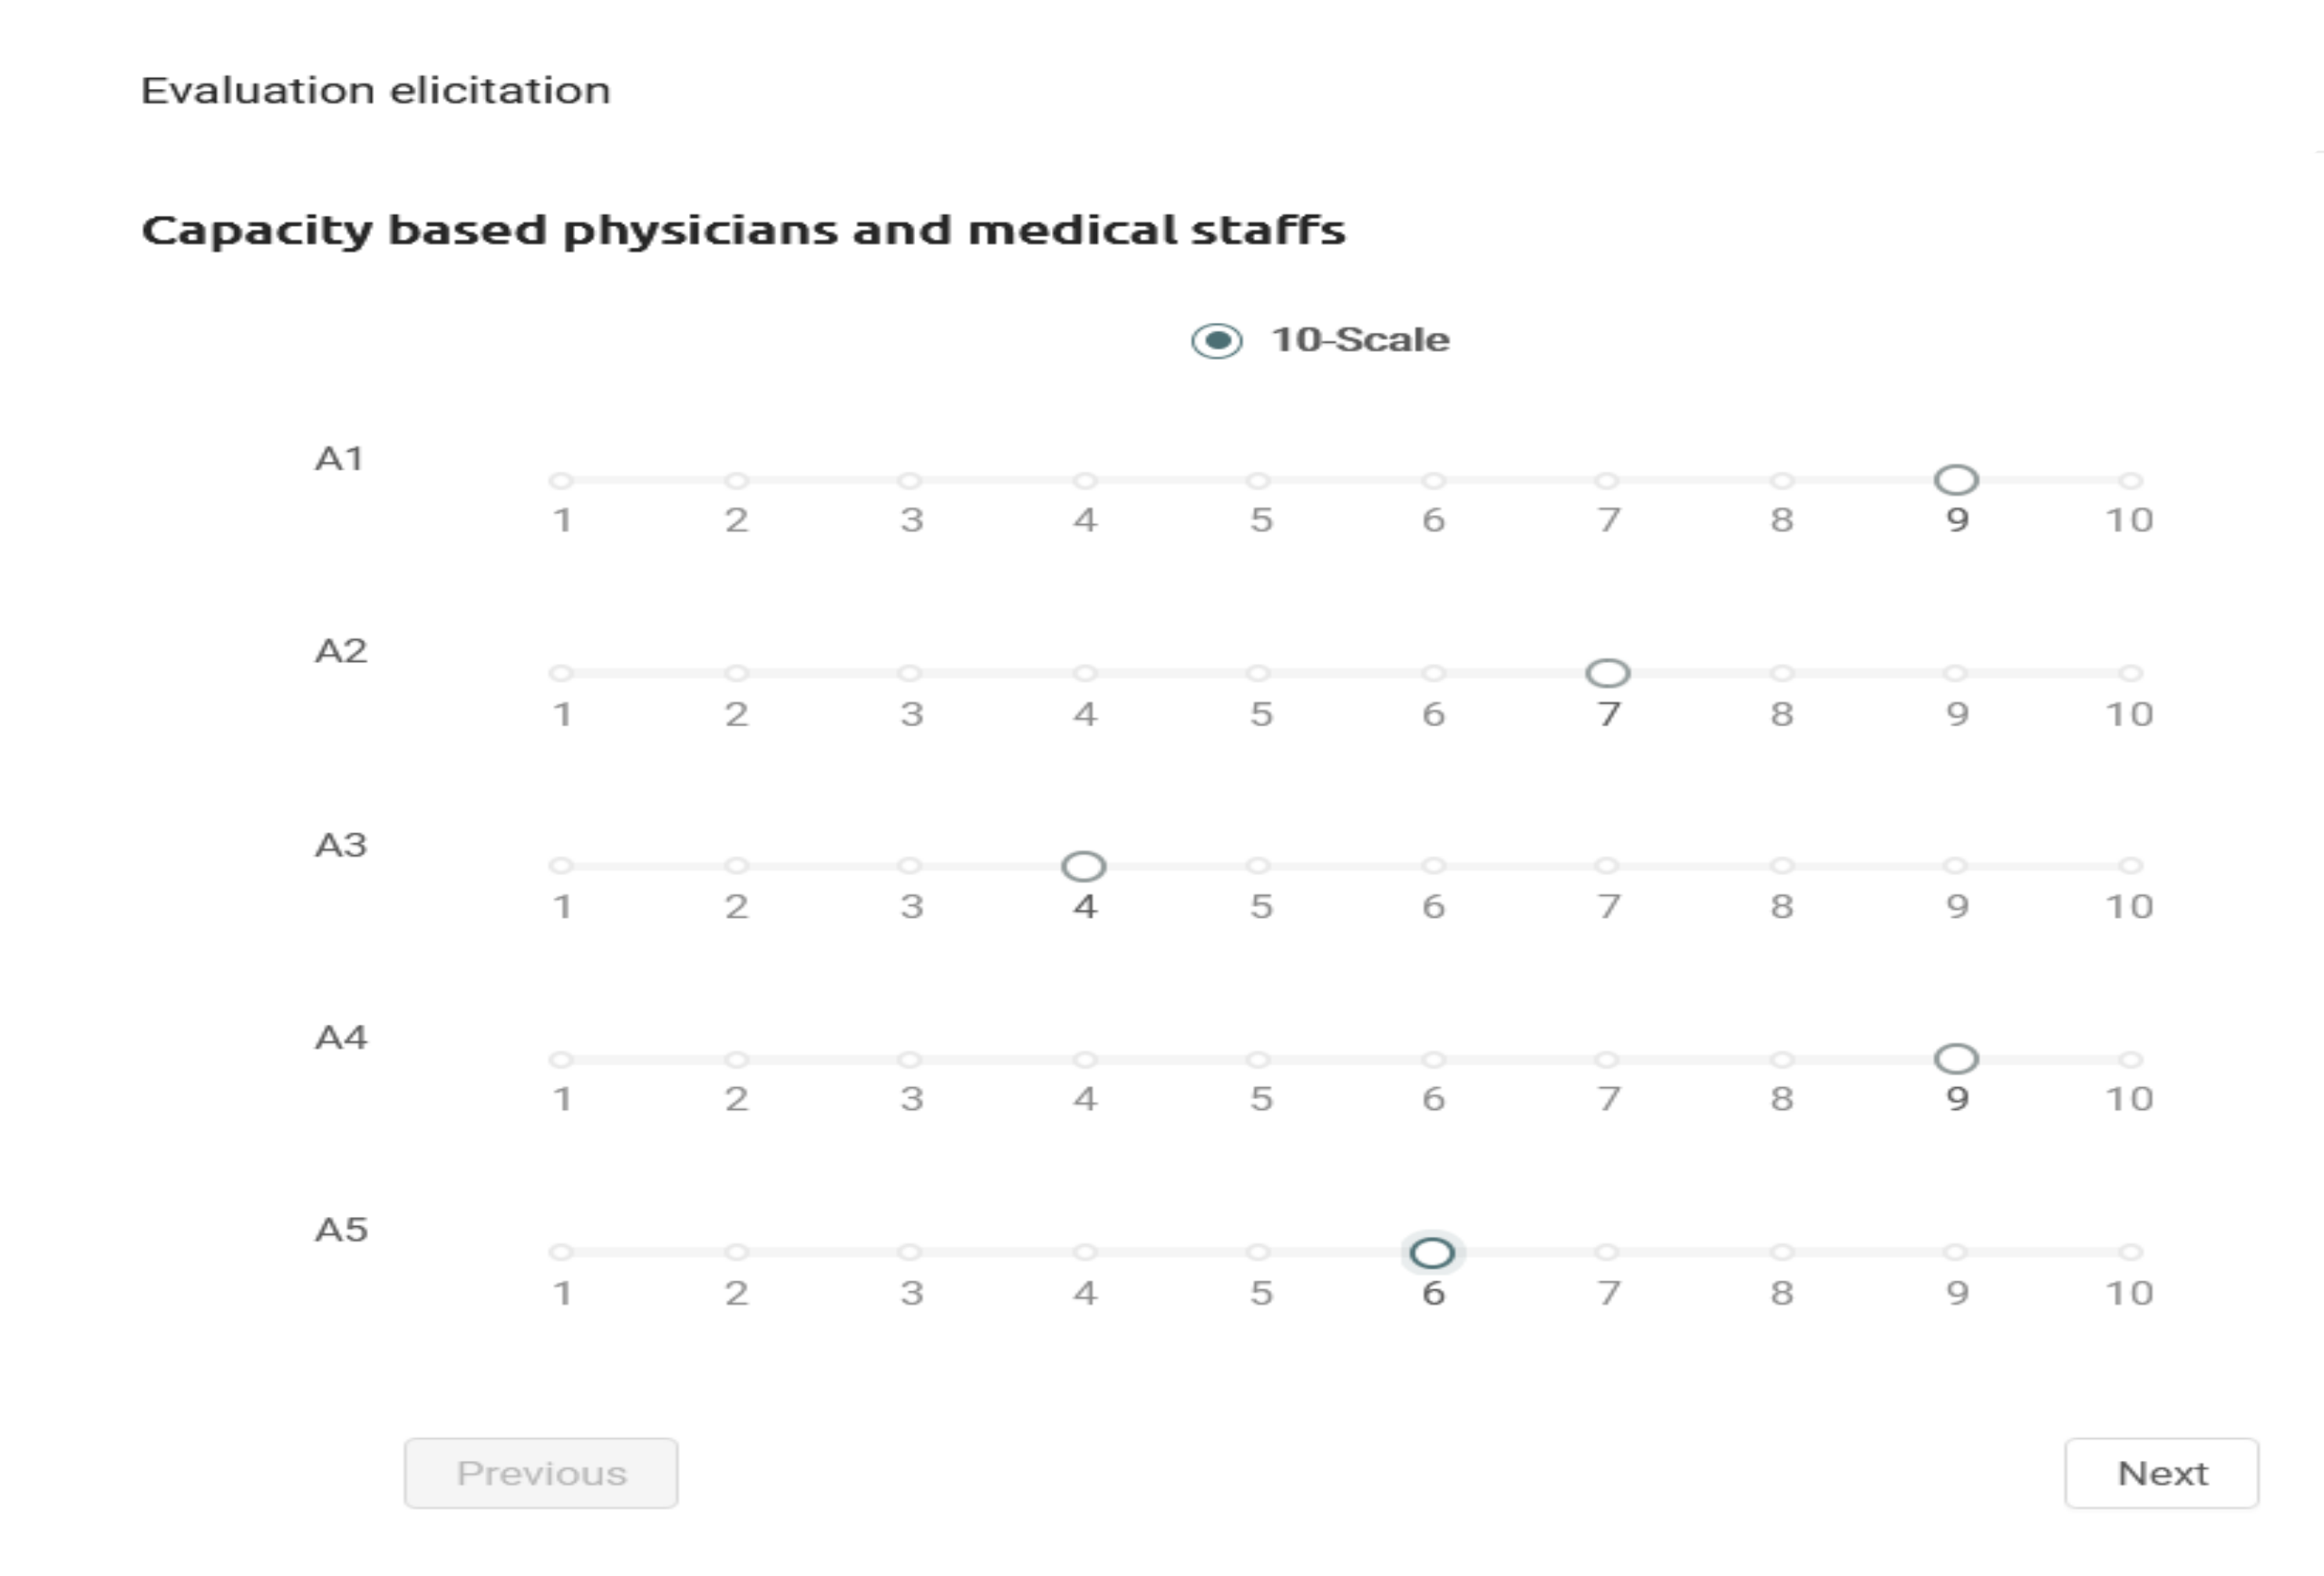
Step 4: Comparison of Each Criterion with All Alternatives: Figure A2 shows the SMART evaluation performed by STKH1 for criterion CR1.
Step 5: Selection of the Best Alternatives for Each Stakeholder: Figure A3 shows the sensitivity analysis result for STKH 1. The alternative ranking varies based on the stakeholder’s weight value; for example, in Figure A3, the top-ranked alternatives for CR1 are A1 and A4, with a weight value of 0.281. These changes in the alternative rankings are grouped, and an average value is obtained, which serves as the overall result.
Figure A4 provides a graphic rendering of the overall result of Scenario 1, while Table A3 and Table 5 show the calculated alternative weights and their rankings, respectively. As the ranking of alternatives shows, each STKH selects their preferred alternatives (no consensus), even though the criteria are the same. The obtained results (Table 5) show that there is no consensus among the stakeholders since everyone has a different highest-ranked alternative. To deal this issue, and to predict the best alternative, the MOLP is implemented with the help of SIMUS.
Step 6: Solving the Multi-Objective Linear Programming (MOLP) Model: As per Equations (5) and (6), each criterion is considered as an objective function to determine the consensus solution for Scenario 1.
Step 7: Forming an Efficient Result Matrix (ERM): The ranking of alternatives for Scenario 1 was A1 > A4 > A3 > A2 > A5. Figure A5 shows the MOLP results situated within a normalized ERM matrix, and Figure A6 shows the ERM ranking of alternatives.
Step 8: Forming a Project Dominance Matrix (PDM): Figure A7 shows the actual PDM results with the ranking of alternatives.
Step 9: Result Analysis and Final Selection of the Best Alternative with Consensus: At this step, the final ranking of alternatives can be obtained for Scenario 1 (A1 > A4 > A3 > A2 > A5). The obtained results show that the ERM and PDM rankings match exactly and that there is no difference in the results. The alternative A1 (hiring part-time physicians and medical staff) ranks top in both rankings. Thus, the obtained results could be an effective solution for improving the quality of service in this particular ICU, especially during this pandemic.
4.2. Scenario 2
In this scenario, every stakeholder is asked to select their preferred set of criteria (Figure A8) based on their work background and preference. This analysis allows the DM to see how changing the criteria can affect the final ranking of the solution. Table 6 shows the selected best and worst criteria for all stakeholders, while Table 7 summarizes the ranking of alternatives. The stakeholders’ pairwise comparisons of best and worst criteria are listed in Table A4 and Table A5.
The same ERM and PDM rankings were obtained for Scenario 2, namely, A1 > A3 > A4 > A5 > A2. Alternative A1 (hiring part-time physicians and medical staff) ranked at the top of both sets of rankings, with alternative A3 (hiring full-time physicians and medical staff) placing second. Consensus among stakeholders can be achieved by utilizing the MOLP. The MOLP results suggest that alternative A1 could be a suitable solution for Scenario 2, as the majority of stakeholders would deem it a suitable option; however, this would also require compromise on the part of the other two stakeholders (STKH 2 and STKH 4).
5. Discussion
The proposed integrated framework was successfully implemented to find a consensus solution in Scenarios 1 and 2. Although the stakeholders’ preferences and the associated criteria combined to play an important role in their ranking of alternatives [2], their selection of criteria had the biggest influence on their ranking of alternatives. Indeed, the selected criteria were integral in obtaining the weights and preference values. Therefore, it is recommended that stakeholders review the criteria carefully before selection. Since each criterion is considered as an objective function in MOLP, every criterion and its preference value must be accurate and relevant to each stakeholder.
The BWM–MAMCA and MOLP rankings of alternatives varied between Scenario 1 and Scenario 2 (Table 8). The MOLP results indicated that alternative A1 (hiring part-time physicians and medical staff) was the best solution for improving ICU service quality in both scenarios. The second-ranked MOLP alternatives for Scenarios 1 and 2 were A4 and A3, respectively. Similarly, the third-ranked MOLP alternatives for Scenarios 1 and 2 were A3 and A4, respectively. The stakeholders’ criteria and their ranking of alternatives were associated with BWM–MAMCA methods (individual decision making); in contrast, the MOLP ranking of alternatives was obtained via group decision making (including all stakeholders in a single decision tree). Most of the service sector needs a decision or solution that reaches the concord among the stakeholders. The ranking of the MOLP method is more reliable in that case. However, in some situations, the DM will be forced to implement a solution without consensus; that is, the preferences of some stakeholders will have disproportionate influence of dominance over those of the others. In that case, BWM–MAMCA is one of the best methods for attaining such results. However, in most of the real-time scenarios, DMs search for a consensus solution, as assigning priority to stakeholders has become an outdated practice.
Implications of This Study
Natural and man-made disasters cause many acute disruptions to the healthcare sector, but it is likely that the COVID-19 pandemic will have a longer-lasting effect. After estimating the impacts of COVID-19, researchers have turned their attention to exploring new possible strategies for mitigating the pandemic-related issues. One of the main objectives of this study is to consider the issues related to the hospital’s strategic, tactical, and operational levels so that appropriate strategies can be developed to improve the service quality of the patients. This paper presents a framework that allows managers to identify optimal courses of action in real-time that will improve quality of service in the healthcare sector during the present COVID-19 pandemic. This study examined two hypothetical scenarios dealing with service quality improvements in the healthcare sector during the COVID-19 pandemic.
The identified criteria will help decision makers to proactively select the right initiatives or strategies to increase not only patient service quality but also proper use of resources and minimization of financial loss. The results of the two hypothetical scenarios indicate that hiring part-time physicians and medical staff is the most favorable solution for improving service quality in the ICU during the pandemic.
During this pandemic, governmental policies, medical standards, working hours, precautionary measures, and treatment methods have all frequently changed with little to no notice. The dynamic nature of this situation requires decisions to be made quickly and efficiently, as doing so will provide the greatest benefits for patients and healthcare professionals. The proposed integrated framework is an excellent tool that can provide sustainable solutions quickly. Although an ICU was selected due to the level of complexity, participation of multiple stakeholders, and need for quick and sustainable decisions, the developed framework can be implemented in any hospital department within the context. Managers who wish to implement this decision-making tool in real-time should consider the following suggestions. First, in order to reach a sustainable solution in any case, the managers must select appropriate criteria, alternatives, and stakeholders [2]. Second, more highly refined results can be achieved by including multiple participants in each stakeholder group. Third, managers should pay more attention to the stakeholders’ selection of criteria, as it directly influences the ranking of alternatives. Finally, since the framework default provides a consensus solution, the managers will not need to engage in rounds of negotiation with the stakeholders. This could prove very helpful within a pandemic context, as it facilitates the selection of sustainable solutions in short periods of time.
6. Conclusions
The uncertainty brought about by the COVID-19 pandemic has made it more important than ever for the healthcare sector to be able to make prompt and effective decisions regarding improvements in patient service quality. According to the literature review, an increase in physician and medical staff workload is one of the key issues for the degradation of service quality. For this, a systematic decision-making framework is developed integrating BWM–MAMCA–MOLP to improve the patient service quality in the ICU. In particular, the proposed framework ensures that solutions will be consensus-based, and therefore sustainable, due to its ability to consider the preferences of multiple stakeholders. Although the proposed framework was successful in identifying a suitable solution for improving the quality of service in an ICU during the COVID-19 pandemic, it nevertheless has some limitations. The first limitation concerns the selection of criteria, alternatives, preferences, and stakeholders, which was exclusively done based on a literature review and not with the input of actual healthcare professionals or actual stakeholders. Another limitation to this study is that it only considered a single stakeholder under each stakeholder group, despite the framework’s ability to accommodate multiple participants within each group. Thus, attention is required while interpreting the outcome of this study. Future studies could include multiple participants within each stakeholder group to see whether doing so yields more accurate or refined results. The developed framework can be used in any service industry such as banking, insurance, and hospitality, as decision makers need only to select the relevant criteria, alternatives, and stakeholders. Finally, future research might consider and compare the use of other MCDM methods (e.g., AHP and Fuzzy AHP) for calculating the criteria weight, as well as the possibility of including non-linear optimization.
Author Contributions
Conceptualization, G.S., E.A. and G.K.; methodology, G.S., E.A. and G.K.; software, G.S.; validation, G.S., E.A. and G.K.; formal analysis, G.S.; investigation, G.S.; resources, G.S., E.A. and G.K.; data curation, G.S.; writing—original draft preparation, G.S.; writing—review and editing, E.A. and G.K.; visualization, G.S.; supervision, E.A. and G.K.; project administration, E.A. and G.K.; funding acquisition, E.A. and G.K. All authors have read and agreed to the published version of the manuscript.
Funding
The authors acknowledge the financial support through Mitacs Research Training award.
Institutional Review Board Statement
Not applicable.
Informed Consent Statement
Not applicable.
Data Availability Statement
The anonymized data are available from the corresponding author.
Acknowledgments
The authors would like to thank the reviewers in providing their feedback for improving the manuscript.
Conflicts of Interest
The authors declare no conflict of interest.
Appendix A
Figure A1.
Schematic flowchart of stakeholders and their associated criteria and alternatives for Scenario 1.
Figure A1.
Schematic flowchart of stakeholders and their associated criteria and alternatives for Scenario 1.


Table A1.
Preference values assigned to criteria by stakeholders.
| Best | CR 1 | CR 2 | CR 3 | CR 4 | CR 5 | CR 6 | CR 7 | CR 8 | CR 9 | |
|---|---|---|---|---|---|---|---|---|---|---|
| STKH1 | CR 1 | 1 | 5 | 4 | 5 | 3 | 2 | 7 | 8 | 4 |
| STKH2 | CR 6 | 3 | 8 | 6 | 5 | 1 | 3 | 6 | 6 | 5 |
| STKH3 | CR 1 | 1 | 7 | 6 | 4 | 3 | 2 | 6 | 7 | 5 |
| STKH4 | CR 1 | 2 | 2 | 3 | 2 | 1 | 3 | 7 | 8 | 3 |
| STKH5 | CR 2 | 3 | 1 | 4 | 4 | 2 | 3 | 6 | 8 | 5 |
Table A2.
Preference values of other criteria over worst criteria by all stakeholders.
| Others to Worst | STKH 1 (CR 8) | STKH (CR 2) | STKH (CR 2) | STKH (CR 7) | STKH (CR 8) |
|---|---|---|---|---|---|
| CR 1 | 8 | 5 | 6 | 9 | 8 |
| CR 2 | 6 | 1 | 1 | 7 | 9 |
| CR 3 | 7 | 3 | 4 | 5 | 7 |
| CR 4 | 7 | 6 | 7 | 6 | 7 |
| CR 5 | 8 | 6 | 8 | 8 | 8 |
| CR 6 | 8 | 4 | 8 | 7 | 8 |
| CR 7 | 3 | 2 | 9 | 1 | 3 |
| CR 8 | 1 | 2 | 9 | 2 | 1 |
| CR 9 | 5 | 6 | 7 | 4 | 4 |
Figure A2.
CR 1 compared by STKH1 with all five alternatives.

Figure A3.
STKH 1 Sensitivity Analysis result.

Figure A4.
Overall result (ranking of alternatives for each stakeholder).

Table A3.
Alternative weights.
| STKH 1 | STKH 2 | STKH 3 | STKH 4 | STKH 5 | |
|---|---|---|---|---|---|
| Alternatives | Alternative Weight | ||||
| A1 | 0.869 | 0.723 | 0.855 | 0.774 | 0.840 |
| A2 | 0.778 | 0.703 | 0.828 | 0.787 | 0.840 |
| A3 | 0.715 | 0.846 | 0.748 | 0.825 | 0.747 |
| A4 | 0.898 | 0.810 | 0.847 | 0.668 | 0.793 |
| A5 | 0.573 | 0.651 | 0.633 | 0.516 | 0.599 |
Figure A5.
Normalized Efficient Resultant Matrix (ERM).

Figure A6.
ERM ranking of alternatives.

Figure A7.
PDM ranking of alternatives.

Figure A8.
ERM ranking of alternatives.

Table A4.
Preference values assigned to criteria by stakeholders.
| Best | CR 1 | CR 2 | CR 3 | CR 4 | CR 5 | CR 6 | CR 7 | CR 8 | CR 9 | |
|---|---|---|---|---|---|---|---|---|---|---|
| STKH 1 | CR 1 | 1 | 6 | 4 | 3 | 2 | 4 | |||
| STKH 2 | CR 6 | 2 | 1 | 6 | 5 | 7 | ||||
| STKH 3 | CR 1 | 1 | 5 | 2 | 3 | 3 | 6 | 6 | 5 | |
| STKH 4 | CR 1 | 1 | 5 | 6 | ||||||
| STKH 5 | CR 2 | 2 | 1 | 4 | 3 | 8 | 4 | 5 |
Table A5.
Preference values of other criteria over worst criteria by all stakeholders.
| Others to Worst | STKH 1 (CR 3) | STKH 2 (CR 8) | STKH 3 (CR 3) | STKH 4 (CR 4) | STKH 5 (CR 5) |
|---|---|---|---|---|---|
| CR 1 | 6 | 5 | 5 | 7 | |
| CR 2 | 8 | ||||
| CR 3 | 1 | 1 | 6 | ||
| CR 4 | 7 | 7 | 3 | 1 | 7 |
| CR 5 | 6 | 4 | 4 | 1 | |
| CR 6 | 8 | 9 | 2 | 5 | |
| CR 7 | 5 | 6 | |||
| CR 8 | 1 | 7 | |||
| CR 9 | 3 | 5 | 5 | 3 |
References
- Adunlin, G.; Diaby, V.; Xiao, H. Application of multicriteria decision analysis in health care: A systematic review and bibliometric analysis. Health Expect. 2015, 18, 1894–1905. [Google Scholar] [CrossRef] [PubMed] [Green Version]
- Glaize, A.; Duenas, A.; Di Martinelly, C.; Fagnot, I. Healthcare decision-making applications using multicriteria decision analysis: A scoping review. J. Multi-Criteria Decis. Anal. 2019, 26, 62–83. [Google Scholar] [CrossRef] [Green Version]
- Alban, A.; Chick, S.E.; Dongelmans, D.A.; Vlaar AP, J.; Sent, D.; van der Sluijs, A.F.; Wiersinga, W.J. ICU capacity management during the COVID-19 pandemic using a process simulation. Intensive Care Med. 2020, 46, 1624–1626. [Google Scholar] [CrossRef] [PubMed]
- Phua, J.; Weng, L.; Ling, L.; Egi, M.; Lim, C.M.; Divatia, J.V. Intensive care management of coronavirus disease 2019 (COVID-19): Challenges and recommendations. Lancet Respir. Med. 2020, 8, 506–517. [Google Scholar] [CrossRef]
- Nelson, B.; Kaminsky, D.B. COVID-19′s Crushing Mental Health Toll on Health Care Workers. Cancer Cytopathol. 2020, 128, 597–598. [Google Scholar] [CrossRef] [PubMed]
- Shaukat, N.; Ali, D.M.; Razzak, J. Physical and mental health impacts of COVID-19 on healthcare workers: A scoping review. Int. J. Emerg. Med. 2020, 96, 40. [Google Scholar] [CrossRef] [PubMed]
- Altuntas, S.; Kansu, S. An innovative and integrated approach based on SERVQUAL, QFD and FMEA for service quality improvement: A case study. Kybernetes 2019, 49, 2419–2453. [Google Scholar] [CrossRef]
- Afkham, L.; Abdi, F.; Rashidi, A. Evaluation of service quality by using fuzzy MCDM: A case study in Iranian health-care centers. Manag. Sci. Lett. 2012, 2, 291–300. [Google Scholar] [CrossRef]
- Huang, H.; De Smet, Y.; Macharis, C.; Doan, N.A.V. Collaborative decision-making in sustainable mobility: Identifying possible consensuses in the multi-actor multi-criteria analysis based on inverse mixed-integer linear optimization. Int. J. Sustain. Dev. World Ecol. 2020, 28, 64–74. [Google Scholar] [CrossRef]
- Lu, M.T.; Lin, S.W.; Tzeng, G.H. Improving RFID adoption in Taiwan’s healthcare industry based on a DEMATEL technique with a hybrid MCDM model. Decis. Support Syst. 2013, 56, 259–269. [Google Scholar] [CrossRef]
- Sałabun, W. The Characteristic Objects Method: A New Distance-based Approach to Multicriteria Decision-making Problems. J. Multi-Criteria Decis. Anal. 2015, 22, 37–50. [Google Scholar] [CrossRef]
- Pamučar, D.; Ćirović, G. The selection of transport and handling resources in logistics centers using Multi-Attributive Border Approximation area Comparison (MABAC). Expert Syst. Appl. 2015, 42, 3016–3028. [Google Scholar] [CrossRef]
- Rezaei, J. Best-worst multi-criteria decision-making method. Omega 2015, 53, 49–57. [Google Scholar] [CrossRef]
- Dezert, J.; Tchamova, A.; Han, D.; Tacnet, J.M. The SPOTIS rank reversal free method for multi-criteria decision-making support. In Proceedings of the 2020 IEEE 23rd International Conference on Information Fusion (FUSION), Rustenburg, South Africa, 6–9 July 2020. [Google Scholar]
- Kizielewicz, B.; Wątróbski, J.; Sałabun, W. Identification of relevant criteria set in the MCDA process—Wind farm location case study. Energies 2020, 13, 6548. [Google Scholar] [CrossRef]
- Khan, S.A.; Kusi-Sarpong, S.; Naim, I.; Ahmadi, H.B.; Oyedijo, A. A best-worst-method-based performance evaluation framework for manufacturing industry. Kybernetes 2021. [Google Scholar] [CrossRef]
- Fartaj, S.R.; Kabir, G.; Eghujovbo, V.; Ali, S.M.; Paul, S.K. Modeling transportation disruptions in the supply chain of automotive parts manufacturing company. Int. J. Prod. Econ. 2020, 222, 107511. [Google Scholar] [CrossRef]
- Moktadir, M.A.; Ali, S.M.; Kusi-Sarpong, S.; Shaikh, M.A.A. Assessing challenges for implementing Industry 4.0: Implications for process safety and environmental protection. Process Saf. Environ. Prot. 2018, 117, 730–741. [Google Scholar] [CrossRef]
- Liang, F.; Brunelli, M.; Rezaei, J. Consistency issues in the best worst method: Measurements and thresholds. Omega 2020, 96, 102175. [Google Scholar] [CrossRef]
- MacHaris, C.; Turcksin, L.; Lebeau, K. Multi actor multi criteria analysis (MAMCA) as a tool to support sustainable decisions: State of use. Decis. Support Syst. 2012, 54, 610–620. [Google Scholar] [CrossRef]
- Munier, N.; Hontoria, E.; Jiménez-Saez, F. Strategic Approach in Multi-Criteria Decision Making; Springer International Publishing: Berlin/Heidelberg, Germany, 2019. [Google Scholar]
- Nigim, K.; Munier, N.; Green, J. Pre-feasibility MCDM tools to aid communities in prioritizing local viable renewable energy sources. Renew. Energy 2004, 29, 1775–1791. [Google Scholar] [CrossRef]
- Stoilova, S.D. A multi-criteria selection of the transport plan of intercity passenger trains. IOP Conf. Ser. Mater. Sci. Eng. 2019, 664, 012031. [Google Scholar] [CrossRef]
- Fitzsimons, J. Quality and safety in the time of Coronavirus: Design better, learn faster. Int. J. Qual. Health Care 2020, 33, 1–5. [Google Scholar] [CrossRef]
- Oesterreich, S.; Cywinski, J.B.; Elo, B.; Geube, M.; Mathur, P. Quality improvement during the COVID-19 pandemic. Clevel. Clin. J. Med. 2020, 10–12. [Google Scholar] [CrossRef]
- Chaboyer, W.; Lin, F.; Foster, M.; Retallick, L.; Panuwatwanich, K.; Richards, B. Redesigning the ICU Nursing Discharge Process: A Quality Improvement Study. Worldviews Evid. Based Nurs. 2012, 9, 40–48. [Google Scholar] [CrossRef] [Green Version]
- McWilliams, D.; Weblin, J.; Atkins, G.; Bion, J.; Williams, J.; Elliott, C.; Whitehouse, T.; Snelson, C. Enhancing rehabilitation of mechanically ventilated patients in the intensive care unit: A quality improvement project. J. Crit. Care 2015, 30, 13–18. [Google Scholar] [CrossRef] [Green Version]
- Needleman, J.; Buerhaus, P.; Mattke, S.; Stewart, M.; Zelevinsky, K. Nurse-staffing levels and the quality of care in hospitals. N. Engl. J. Med. 2002, 346, 1715–1722. [Google Scholar] [CrossRef]
- Weissman, J.S.; Rothschild, J.M.; Bendavid, E.; Sprivulis, P.; Cook, E.F.; Evans, R.S.; Kaganova, Y.; Bender, M.; David-Kasdan, J.; Haug, P.; et al. Hospital workload and adverse events. Med. Care 2007, 45, 448–455. [Google Scholar] [CrossRef]
- Powell, A.; Savin, S.; Savva, N. Physician workload and hospital reimbursement: Overworked physicians generate less revenue per patient. Manuf. Serv. Oper. Manag. 2012, 14, 512–528. [Google Scholar] [CrossRef] [Green Version]
- Weiss, A.J.; Elixhauser, A. Overview of Hospital Stays in the United States. 2014; pp. 1–14. Available online: http://meps.ahrq.gov/data_files/publications/st425/stat425.pdf (accessed on 4 March 2019).
- COVID-19 Pandemic Guidance for the Health Care Sector. 2020; Retrieved from Public Health Agency of Canada Website. Available online: https://www.canada.ca/en/public-health/services/diseases/2019-novel-coronavirus-infection/health-professionals/covid-19-pandemic-guidance-health-care-sector.html (accessed on 29 October 2020).
- Pérez, A.; Chan, W.; Dennis, R.J. Predicting the length of stay of patients admitted for intensive care using a first step analysis. Health Serv. Outcomes Res. Methodol. 2006, 6, 127–138. [Google Scholar] [CrossRef] [PubMed] [Green Version]
- Krinsley, J.S.; Wasser, T.; Kang, G.; Bagshaw, S.M. Pre-admission functional status impacts the performance of the APACHE IV model of mortality prediction in critically ill patients. Crit. Care 2017, 21, 1–9. [Google Scholar] [CrossRef] [PubMed] [Green Version]
- Wassef, M.; Trépanier, M.-O.; Mayrand, J.; Martine Habra, M.; Beauchamp, S. Effectiveness of discharge planning and transitional care interventions in reducing hospital readmissions for the elderly. In HTA Report; 2018. Available online: www.ciusss-ouestmtl.gouv.qc.ca (accessed on 2 August 2020).
- How To: Discharge Summaries—McMaster PA Student Resource. (n.d.) Available online: http://mcmasterpa.weebly.com/how-to-discharge-summaries.html (accessed on 28 August 2020).
- Henrich, N.J.; Dodek, P.; Heyland, D.; Cook, D.; Rocker, G.; Kutsogiannis, D.; Ayas, N. Qualitative analysis of an intensive care unit family satisfaction survey. Crit. Care Med. 2011, 39, 1000–1005. [Google Scholar] [CrossRef] [PubMed]
- Al-Abri, R.; Al-Balushi, A. Patient satisfaction survey as a tool towards quality improvement. Oman Med. J. 2014, 29, 3–7. [Google Scholar] [CrossRef] [PubMed]
- Bin Traiki, T.A.; AlShammari, S.A.; AlAli, M.N.; Aljomah, N.A.; Alhassan, N.S.; Alkhayal, K.A.; Zubaidi, A.M. Impact of COVID-19 pandemic on patient satisfaction and surgical outcomes: A retrospective and cross sectional study. Ann. Med. Surg. 2020, 58, 14–19. [Google Scholar] [CrossRef] [PubMed]
- Kc, D.S.; Terwiesch, C. Impact of workload on service time and patient safety: An econometric analysis of hospital operations. Manag. Sci. 2009, 55, 1486–1498. [Google Scholar] [CrossRef] [Green Version]
- Part-Time Doctors Defend Their Work: “It Doesn’t Make Us Any Less Valuable”|CBC Radio. 2020. Available online: https://www.cbc.ca/radio/whitecoat/part-time-doctors-defend-their-work-it-doesn-t-make-us-any-less-valuable-1.5030656 (accessed on 3 September 2020).
- Ho, W.H.; Chang, C.S.; Shih, Y.L.; Liang, R.D. Effects of job rotation and role stress among nurses on job satisfaction and organizational commitment. BMC Health Serv. Res. 2009, 9, 8. [Google Scholar] [CrossRef] [Green Version]
- Gaba, D.M.; Howard, S.K. Fatigue among clinicians and the safety of patients. N. Engl. J. Med. 2002, 347, 1249–1255. [Google Scholar] [CrossRef]
- Van De Haar, J.; Hoes, L.R.; Coles, C.E.; Seamon, K.; Fröhling, S.; Jäger, D.; Valenza, F.; De Braud, F.; De Petris, L.; Bergh, J.; et al. Caring for patients with cancer in the COVID-19 era. Nat. Med. 2020, 26, 665–671. [Google Scholar] [CrossRef] [Green Version]
- Kutney-Lee, A.; Sloane, D.M.; Aiken, L.H. An increase in the number of nurses with baccalaureate degrees is linked to lower rates of postsurgery mortality. Health Aff. 2013, 32, 579–586. [Google Scholar] [CrossRef] [Green Version]
- Seeing an Allied Health Professional—Better Health Channel. (n.d.). Available online: https://www.betterhealth.vic.gov.au/health/servicesandsupport/seeing-an-allied-health-professional (accessed on 3 September 2020).
- Fottler, M.D.; Blair, J.D.; Whitehead, C.J.; Laus, M.D.; Savage, G.T. Assessing key stakeholders: Who matters to hospitals and why? Hosp. Health Serv. Adm. 1989, 34, 525–546. [Google Scholar]
- Sivakumar, G.; Almehdawe, E.; Kabir, G. Development of a Collaborative Decision-Making Framework to Improve the Patients’ Service Quality in the Intensive Care Unit. In Proceedings of the 2020 International Conference on Decision Aid Sciences and Applications (DASA’20), Sakheer, Bahrain, 8–9 November 2020; pp. 597–600. [Google Scholar]
Figure 1.
Schematic flowchart of selected criteria and alternatives.

Figure 2.
BWM–MAMCA–MOLP framework for improving service quality in an ICU during the COVID-19 pandemic.
Figure 2.
BWM–MAMCA–MOLP framework for improving service quality in an ICU during the COVID-19 pandemic.

Table 1.
Selected criteria for improving quality of patient service in an ICU.
| Notation | Criteria | Explanation | Reference |
|---|---|---|---|
| CR1 | Physicians and medical staff capacity | Identifying an optimal number of physicians and staff is a critical task. Physicians and other medical staff need to be hired based on the unit’s capacity (i.e., number of beds). | [24,28,29] |
| CR2 | Operational cost | The cost incurred to run the facility, including the cost to operate the equipment, wages for staff, power sources, and other miscellaneous associated costs. | [30,31] |
| CR3 | Extra capacity | It is difficult for ICUs to accommodate all incoming patients during peak periods. The trauma department provides extra capacity where high-risk patients can be held until a bed becomes available in the ICU. | [4,25,30,32] |
| CR4 | Severity of patients | Severity is determined based on the patients’ medical complications and CTAS score. | [30,32] |
| CR5 | Estimation of patient length of stay | Patient length of stay is approximated based on the severity of their condition. | [32,33] |
| CR6 | Scheduling admission | Scheduling admission performed based on the severity of the patient is one of the key approaches to reduce congestion in the ICU. | [24,32,34] |
| CR7 | Required equipment for home care | Necessary medical equipment is required to treat patients safely in their homes. | [35] |
| CR8 | Personal home care procedures | Procedures to be followed after discharge, including emergency preparedness, drug consumption regimens, regular monitoring of body condition, and consulting appointments with physicians and others. | [32,33,36] |
| CR9 | Patient satisfaction | Feedback is an invaluable tool for improving treatment quality. Patients and their families are requested to provide feedback regarding the service that they received, as it provides an index of patient satisfaction. | [37,38,39] |
Table 2.
List of alternatives or strategies for improving ICU service quality.
| Notation | Alternative | Reference |
|---|---|---|
| A1 | Hire part-time physicians and medical staff | [3,41] |
| A2 | Job rotation between ICU and step-down unit | [4,42] |
| A3 | Hire full-time physicians and medical staff | [43,44] |
| A4 | Increase the number of registered nurses | [24,45] |
| A5 | Increase the number of allied health professionals | [32,46] |
Table 3.
Best and worst criteria by stakeholder.
| Stakeholder | Best Criteria | Worst Criteria |
|---|---|---|
| STKH 1 | CR 1 | CR 8 |
| STKH 2 | CR 5 | CR 2 |
| STKH 3 | CR 1 | CR 2 |
| STKH 4 | CR 5 | CR 7 |
| STKH 5 | CR 2 | CR 8 |
Table 4.
Optimal weights of each criterion for each stakeholder.
| CR 1 | CR 2 | CR 3 | CR 4 | CR 5 | CR 6 | CR 7 | CR 8 | CR 9 | |
|---|---|---|---|---|---|---|---|---|---|
| STKH1 | 0.280 | 0.074 | 0.092 | 0.074 | 0.123 | 0.185 | 0.053 | 0.023 | 0.092 |
| STKH2 | 0.140 | 0.032 | 0.070 | 0.084 | 0.308 | 0.140 | 0.070 | 0.070 | 0.084 |
| STKH3 | 0.267 | 0.021 | 0.067 | 0.101 | 0.134 | 0.202 | 0.067 | 0.057 | 0.080 |
| STKH4 | 0.143 | 0.143 | 0.095 | 0.143 | 0.223 | 0.095 | 0.022 | 0.035 | 0.095 |
| STKH5 | 0.115 | 0.268 | 0.086 | 0.086 | 0.173 | 0.115 | 0.057 | 0.023 | 0.069 |
Table 5.
Ranking of alternatives.
| STKH 1 | STKH 2 | STKH 3 | STKH 4 | STKH 5 | |
|---|---|---|---|---|---|
| Alternatives | Ranking of Alternatives | ||||
| A1 | 2 | 3 | 1 | 3 | 1 |
| A2 | 3 | 4 | 3 | 2 | 1 |
| A3 | 4 | 1 | 4 | 1 | 3 |
| A4 | 1 | 2 | 2 | 4 | 2 |
| A5 | 5 | 5 | 5 | 5 | 4 |
Table 6.
Best and worst criteria selected by stakeholders.
| Decision Makers | Best Criteria | Worst Criteria |
|---|---|---|
| STKH 1 | CR 1 | CR 3 |
| STKH 2 | CR 6 | CR 8 |
| STKH 3 | CR 1 | CR 3 |
| STKH 4 | CR 1 | CR 4 |
| STKH 5 | CR 2 | CR 5 |
Table 7.
Ranking of alternatives.
| STKH 1 | STKH 2 | STKH 3 | STKH 4 | STKH 5 | |
|---|---|---|---|---|---|
| Alternatives | Ranking of Alternatives | ||||
| A1 | 1 | 4 | 1 | 2 | 1 |
| A2 | 3 | 3 | 4 | 3 | 2 |
| A3 | 4 | 1 | 3 | 4 | 3 |
| A4 | 2 | 2 | 2 | 1 | 4 |
| A5 | 5 | 5 | 5 | 5 | 5 |
Table 8.
Comparison of Scenario 1 and Scenario 2 results.
| Scenario 1 | Scenario 2 | ||||
|---|---|---|---|---|---|
| BWM–MAMCA | MOLP | BWM–MAMCA | MOLP | ||
| Stakeholder | Rank | Rank | Stakeholder | Rank | Rank |
| STKH 1 | A4 | A1 | STKH 1 | A1 | A1 |
| STKH 2 | A3 | A4 | STKH 2 | A3 | A3 |
| STKH 3 | A1 | A3 | STKH 3 | A1 | A4 |
| STKH 4 | A3 | A2 | STKH 4 | A4 | A5 |
| STKH 5 | A1 and A2 | A5 | STKH 5 | A1 | A2 |
Publisher’s Note: MDPI stays neutral with regard to jurisdictional claims in published maps and institutional affiliations. |
© 2021 by the authors. Licensee MDPI, Basel, Switzerland. This article is an open access article distributed under the terms and conditions of the Creative Commons Attribution (CC BY) license (https://creativecommons.org/licenses/by/4.0/).
Share and Cite
MDPI and ACS Style
Sivakumar, G.; Almehdawe, E.; Kabir, G. Developing a Decision-Making Framework to Improve Healthcare Service Quality during a Pandemic. Appl. Syst. Innov. 2022, 5, 3. https://0-doi-org.brum.beds.ac.uk/10.3390/asi5010003
AMA Style
Sivakumar G, Almehdawe E, Kabir G. Developing a Decision-Making Framework to Improve Healthcare Service Quality during a Pandemic. Applied System Innovation. 2022; 5(1):3. https://0-doi-org.brum.beds.ac.uk/10.3390/asi5010003
Chicago/Turabian StyleSivakumar, Gowthaman, Eman Almehdawe, and Golam Kabir. 2022. "Developing a Decision-Making Framework to Improve Healthcare Service Quality during a Pandemic" Applied System Innovation 5, no. 1: 3. https://0-doi-org.brum.beds.ac.uk/10.3390/asi5010003