Indoor Air Quality and Health in Newly Constructed Apartments in Developing Countries: A Case Study of Surabaya, Indonesia


Abstract
:1. Introduction
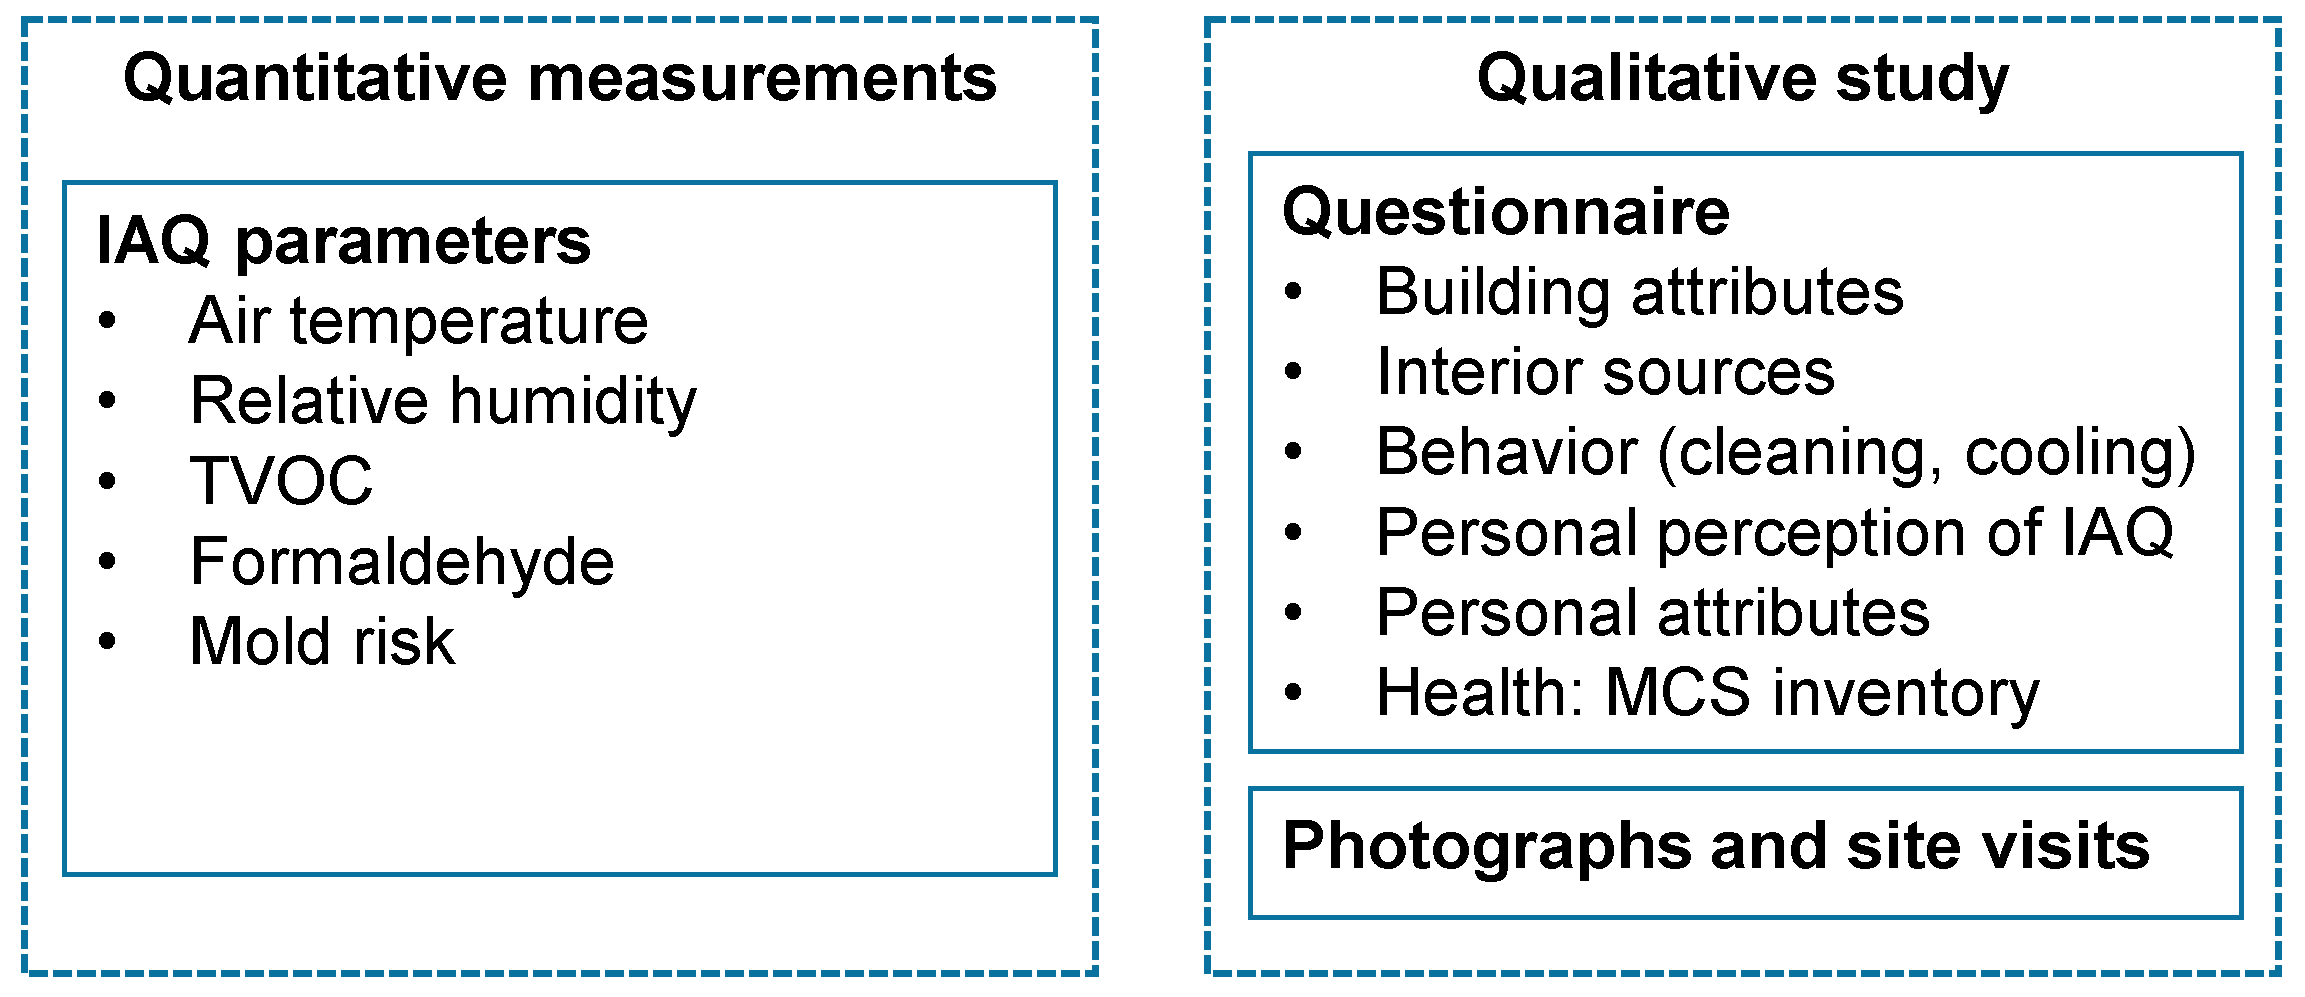
2. Methods
3. Results and Discussion
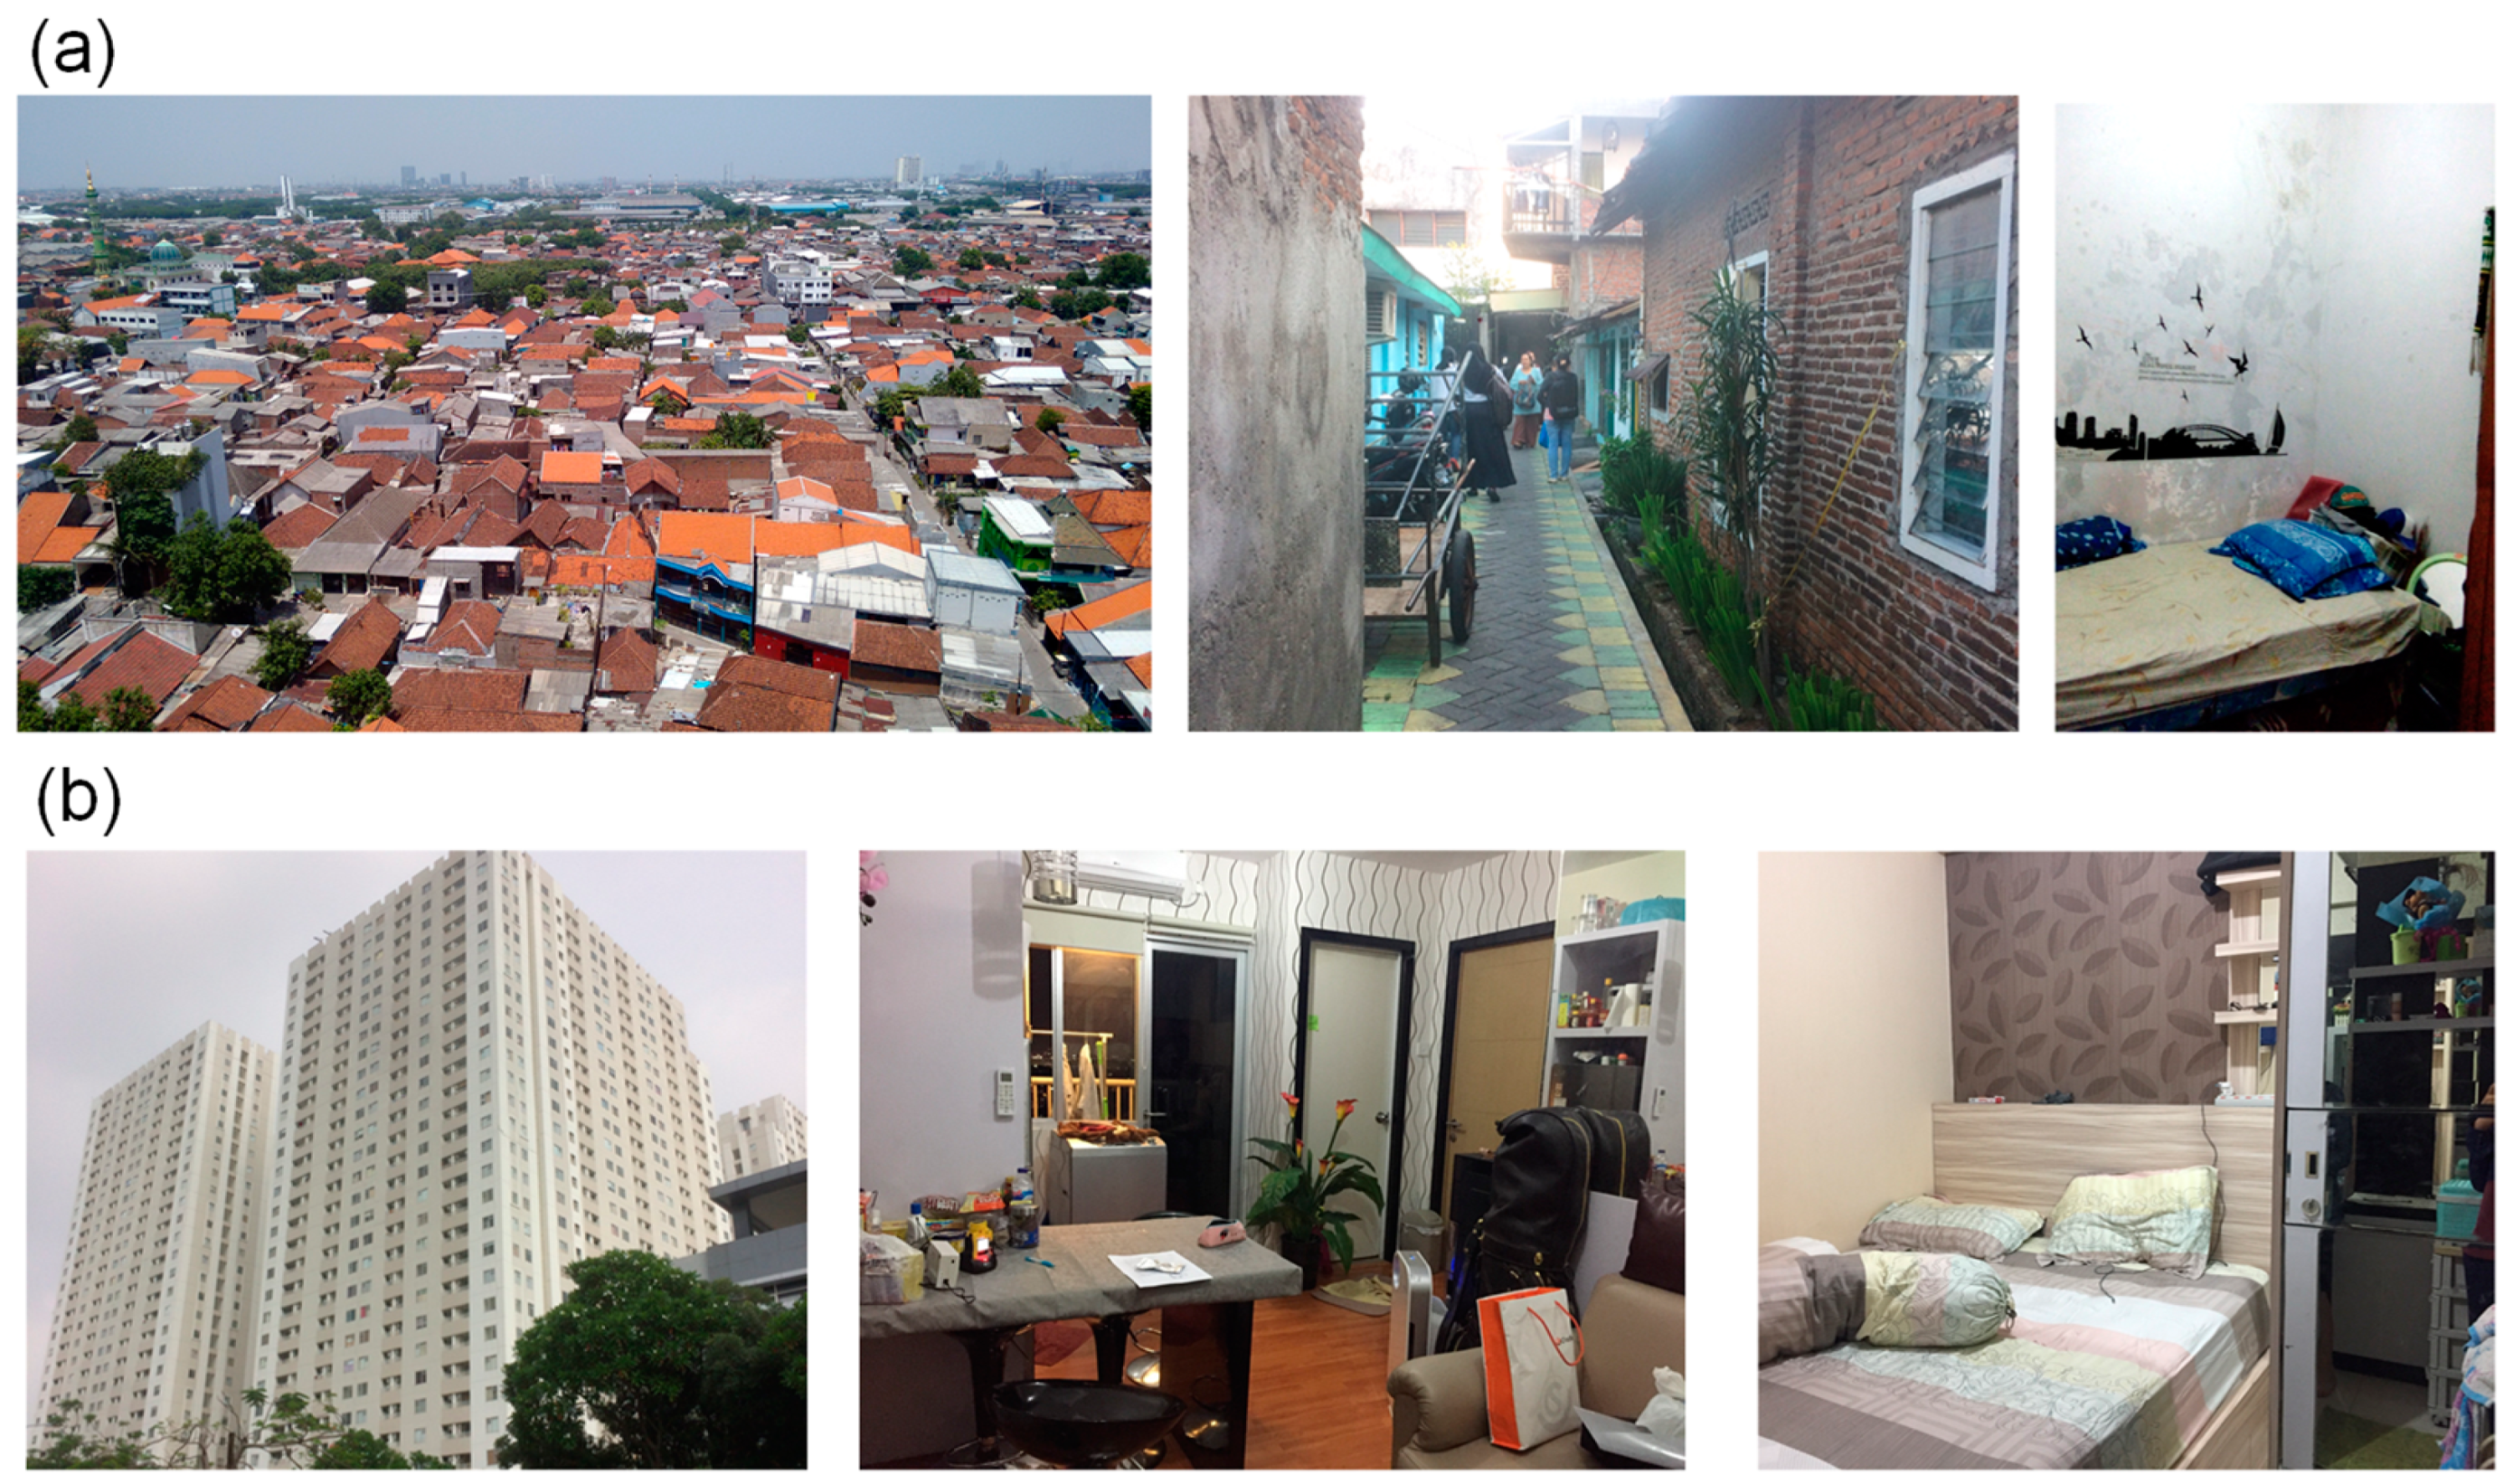
3.1. Profile of Apartment Units and Kampong Houses
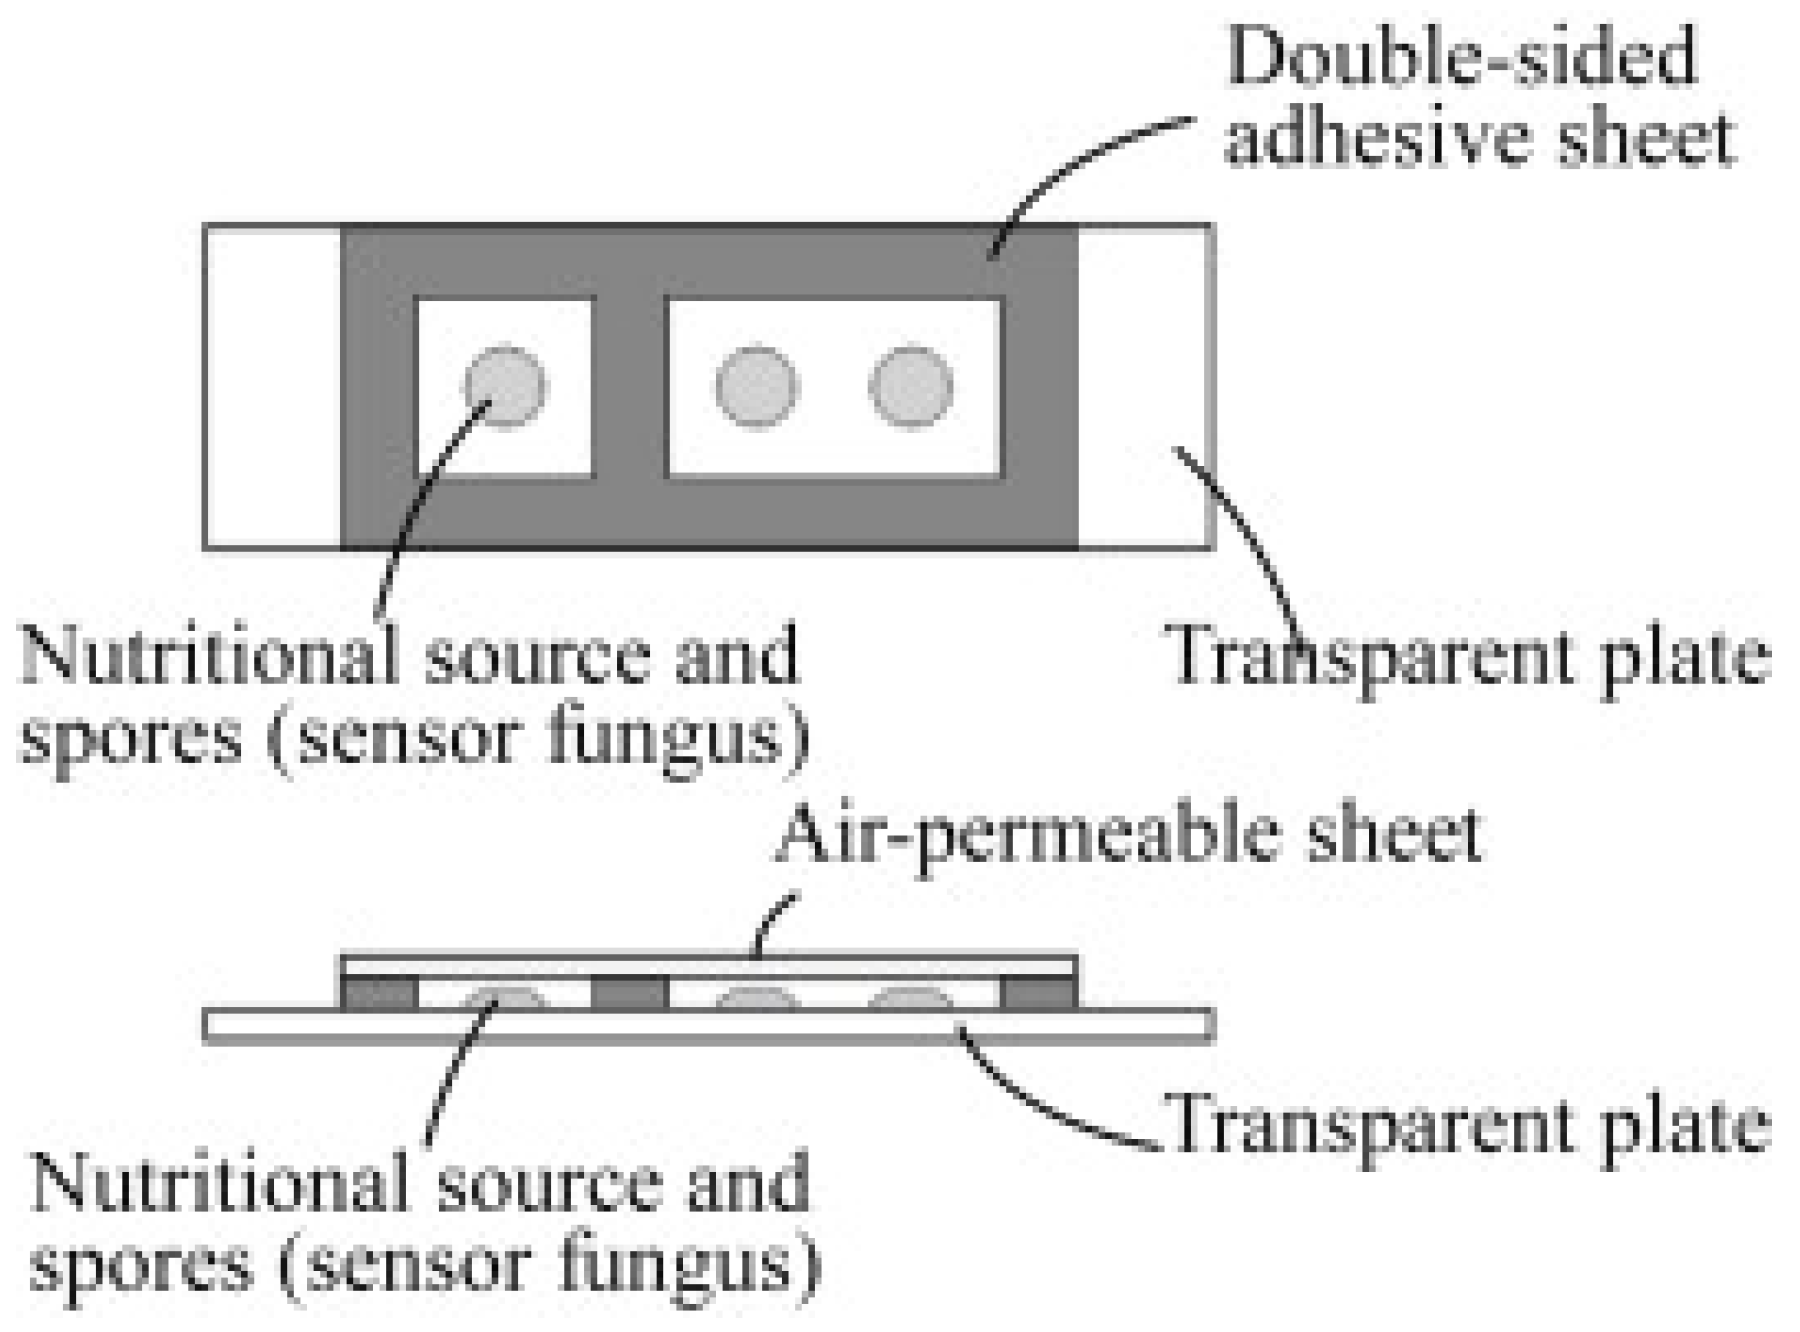
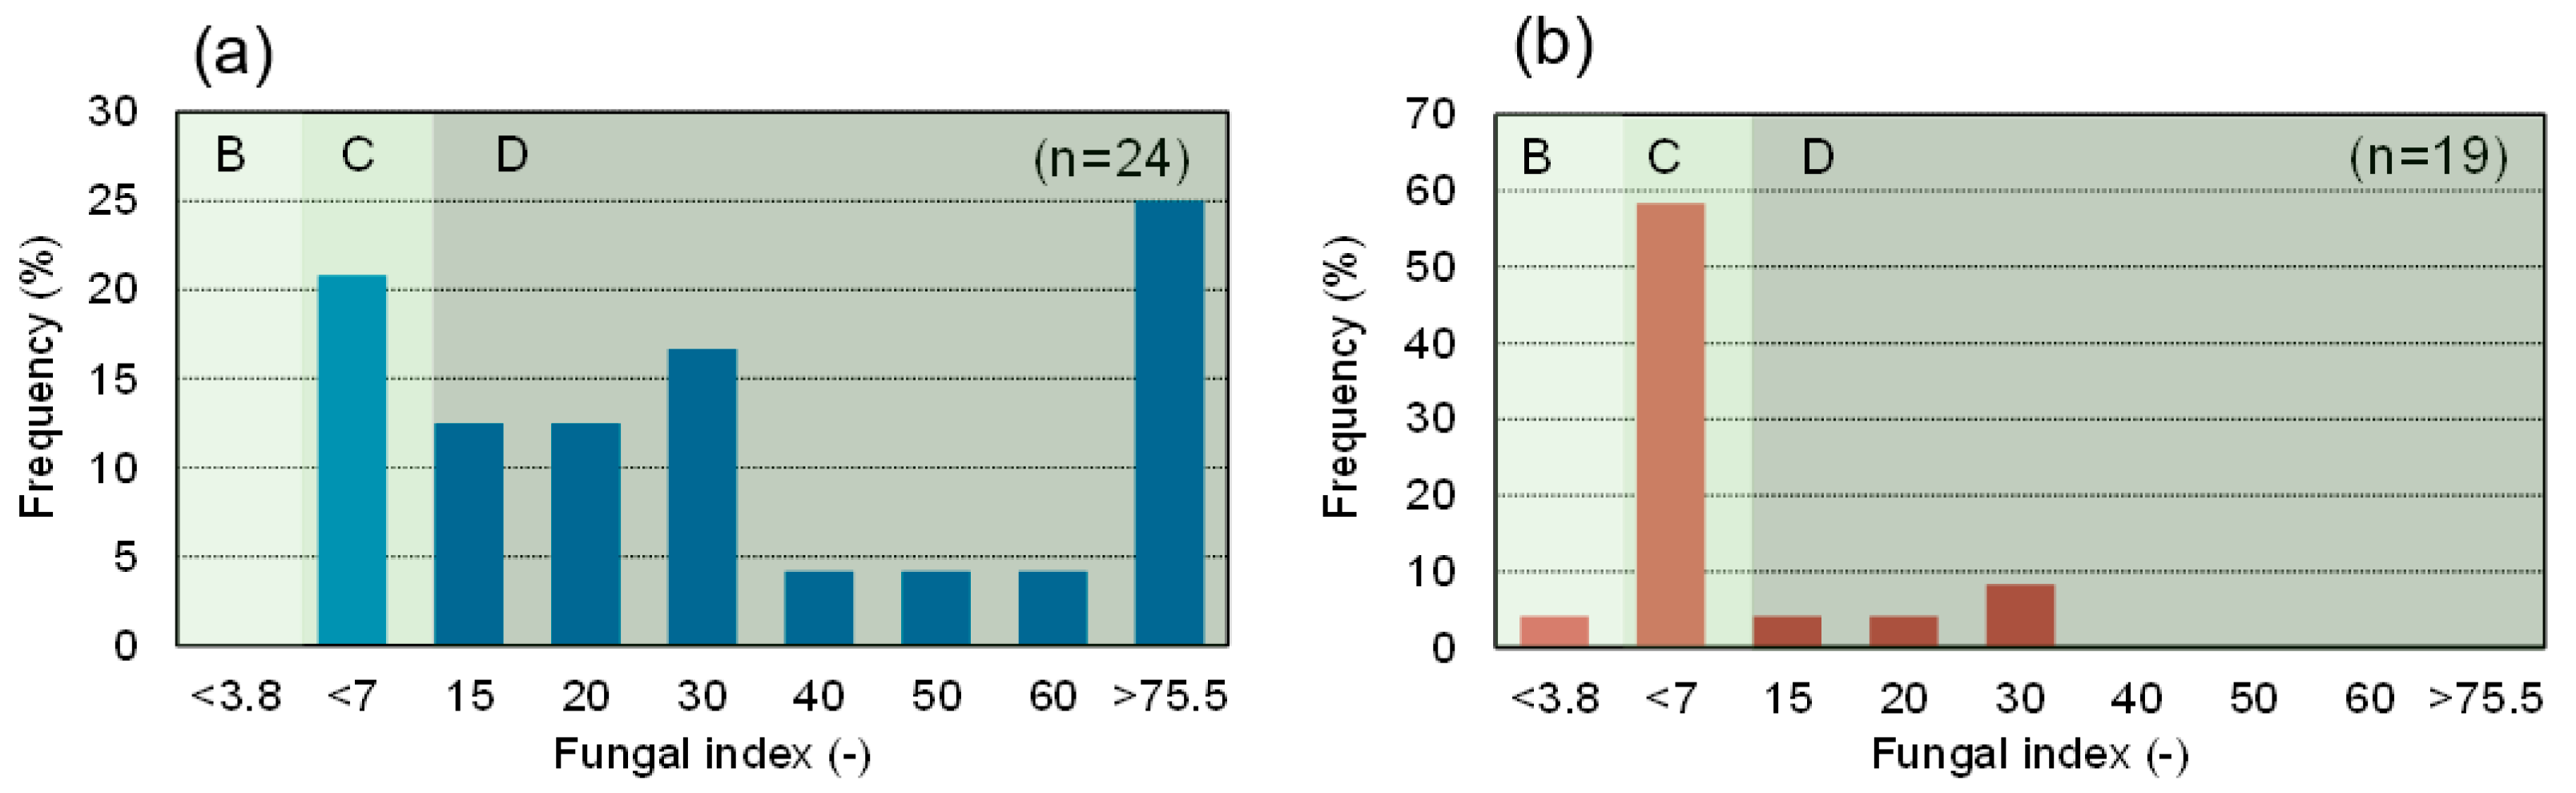
3.2. Mold Risk, Mites, and Smells
3.3. Health Status
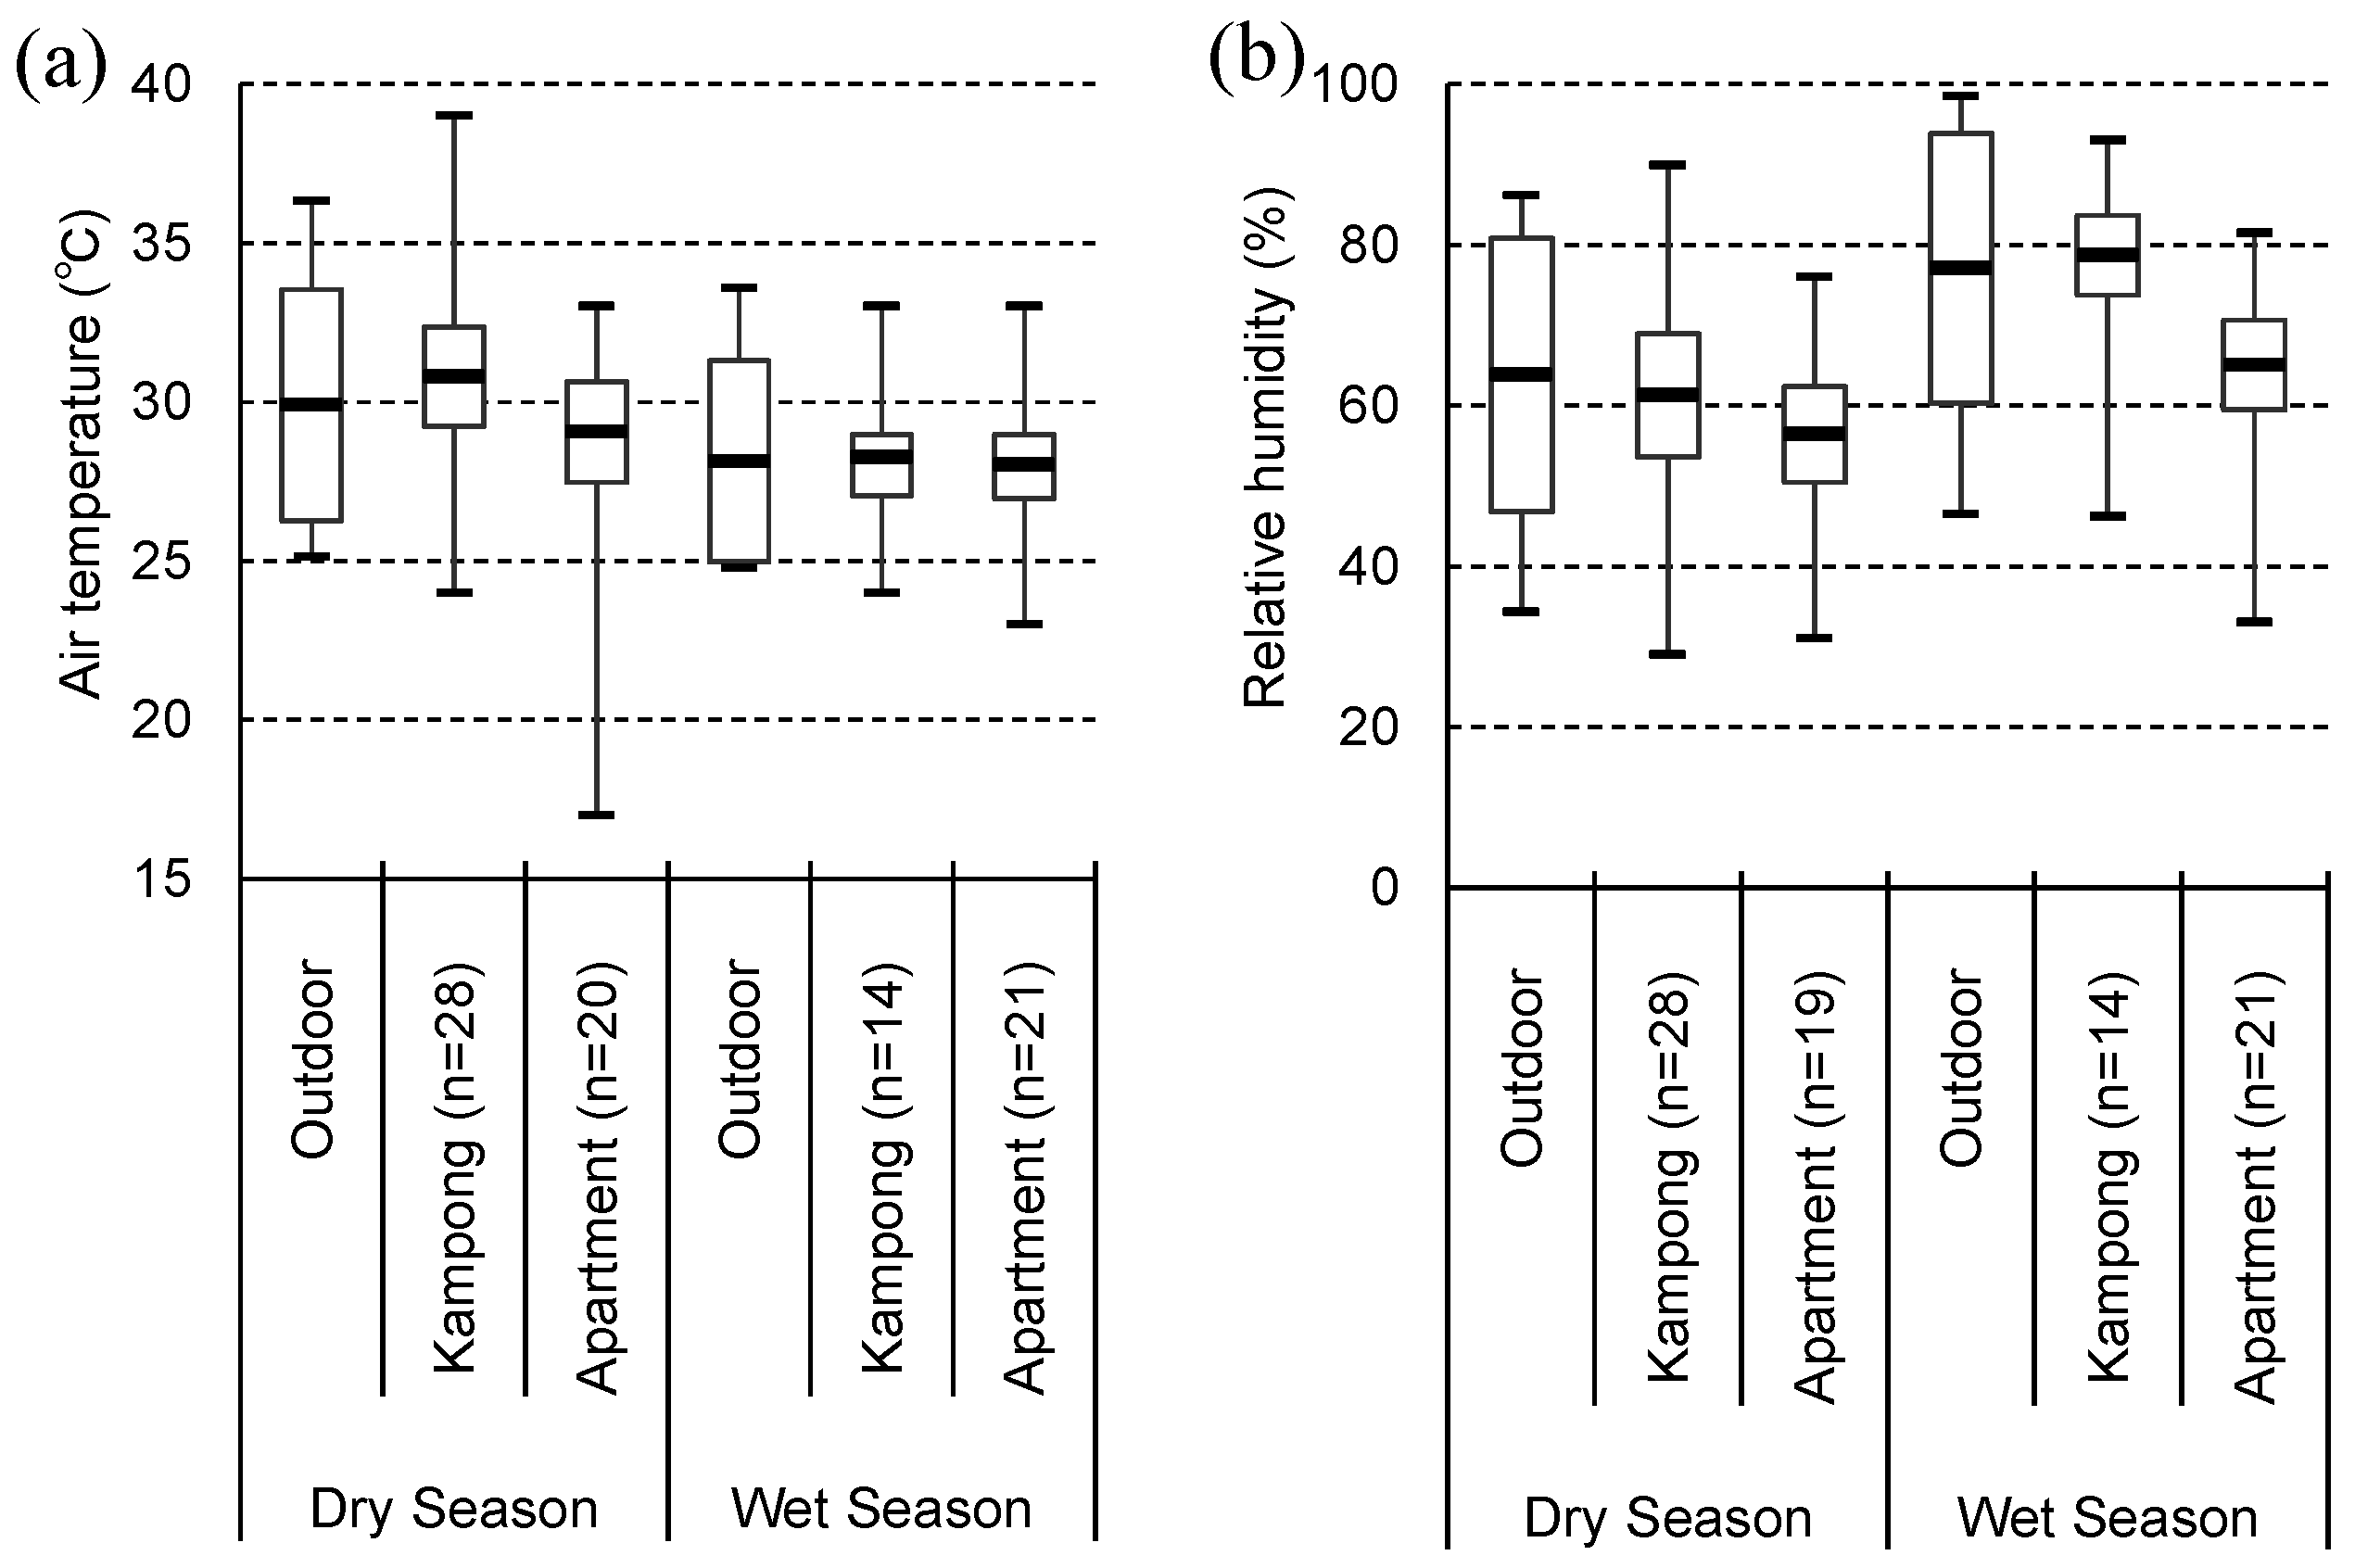
3.4. Indoor Air Temperature and Relative Humidity
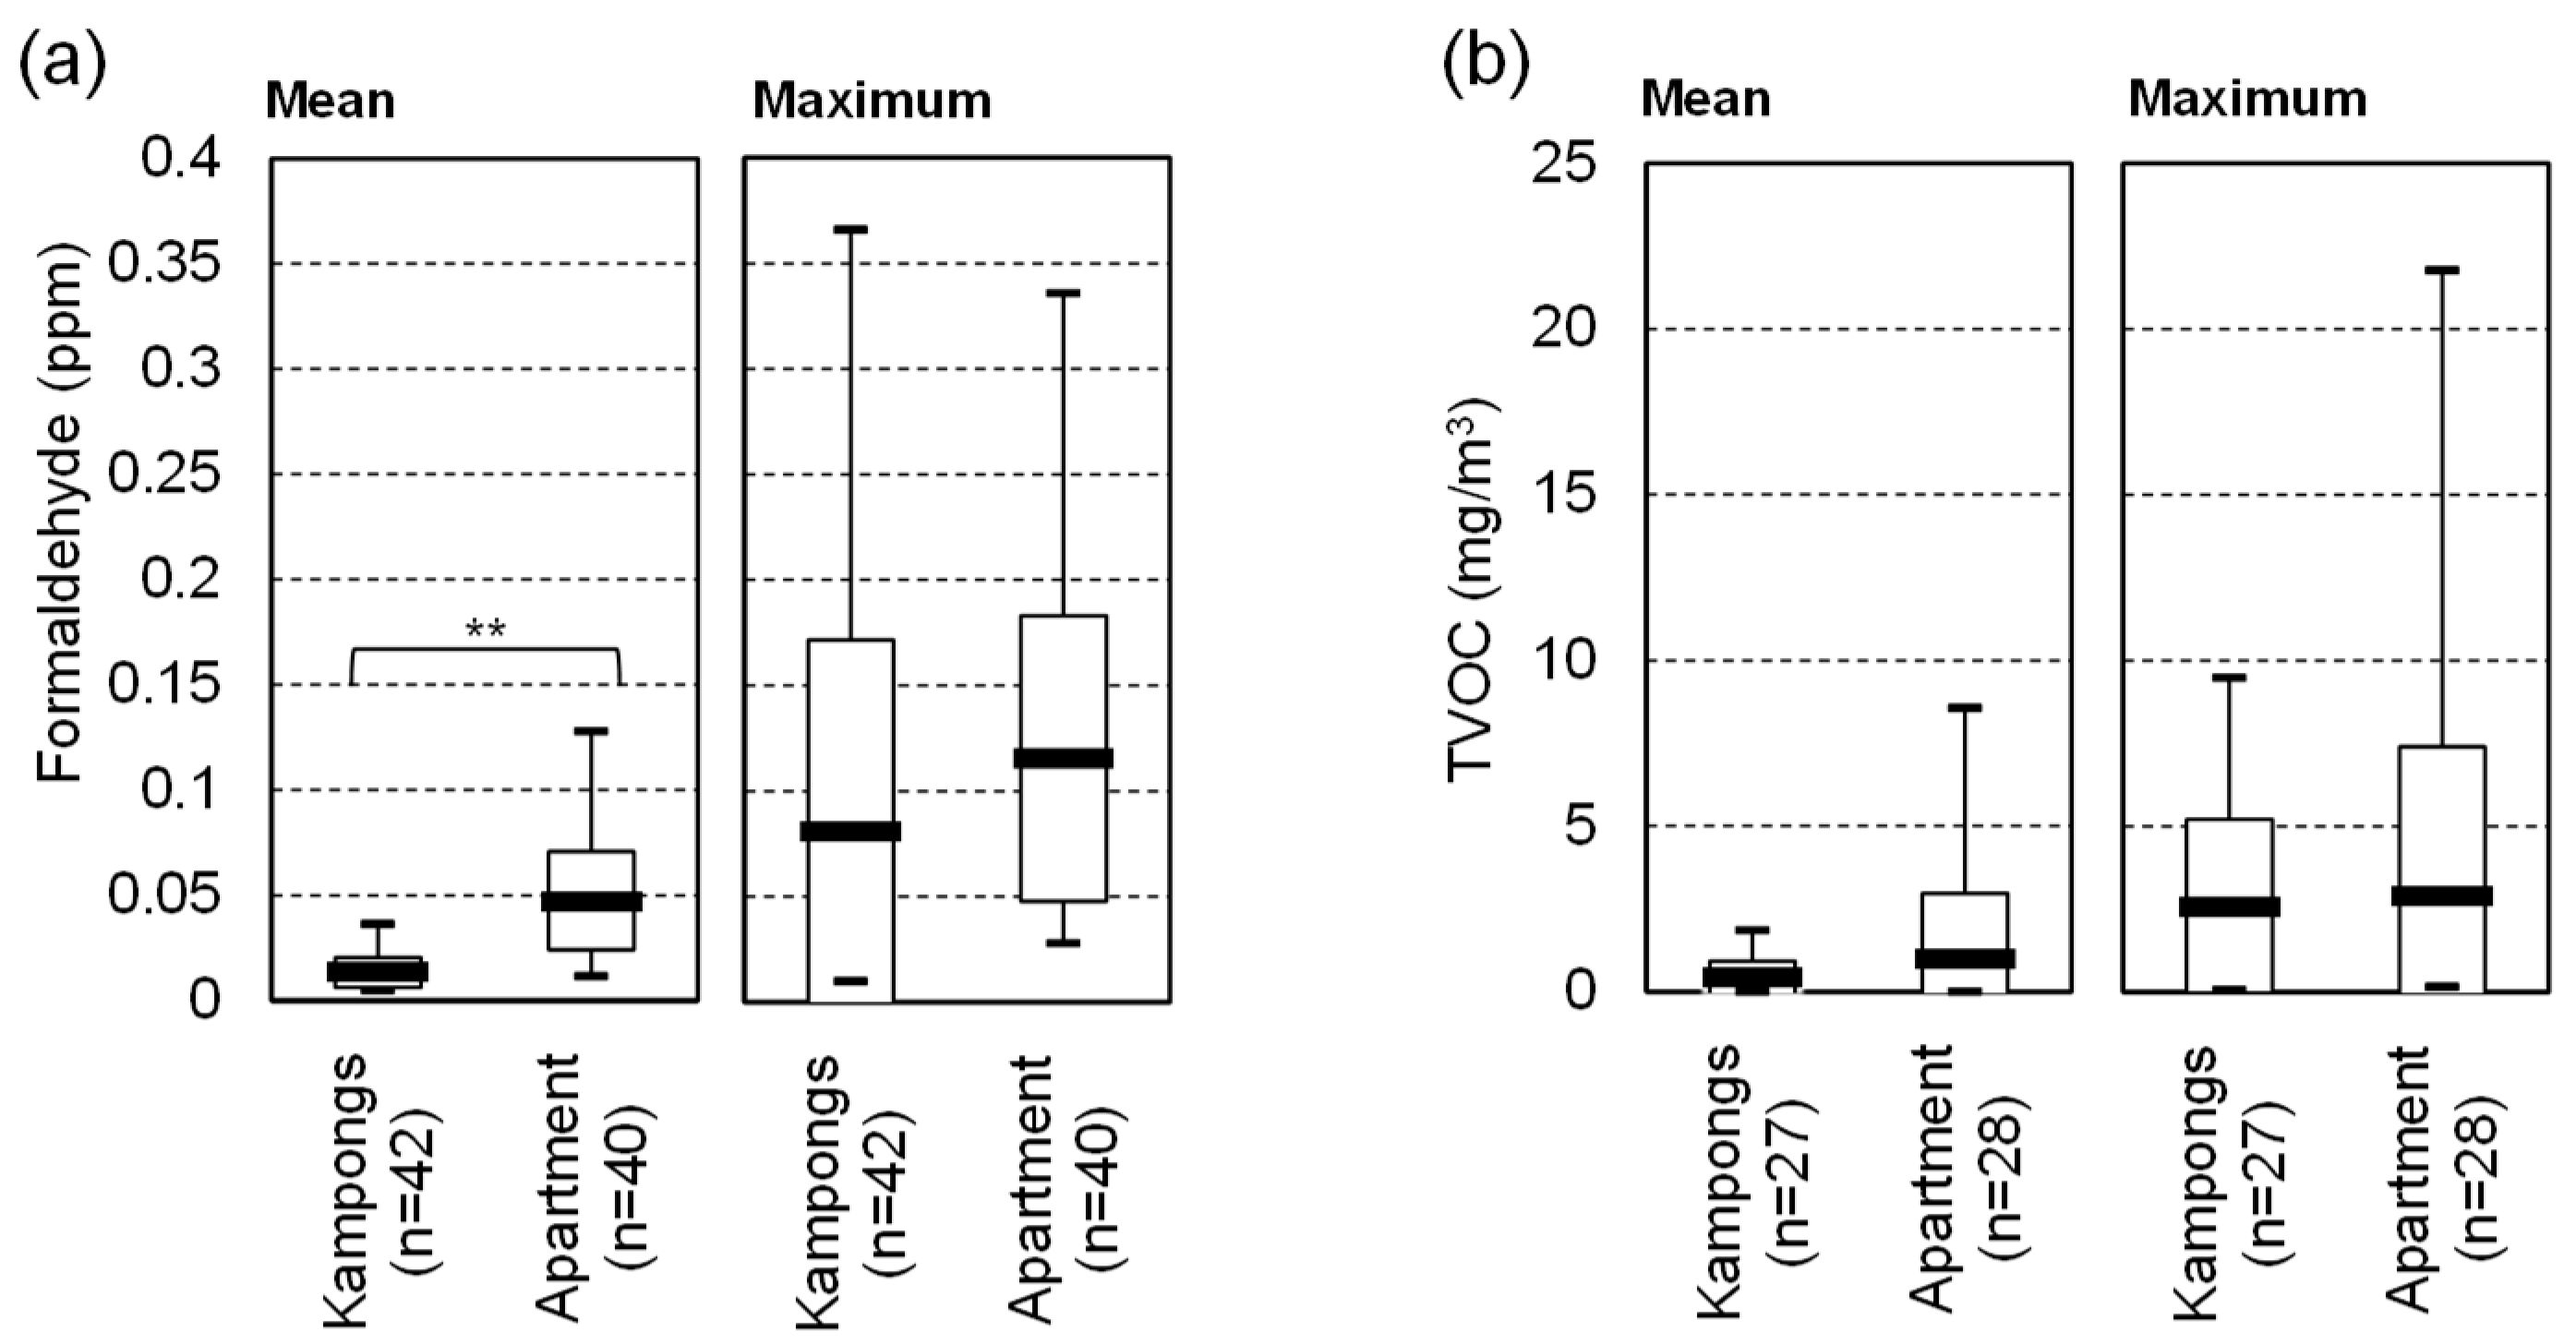
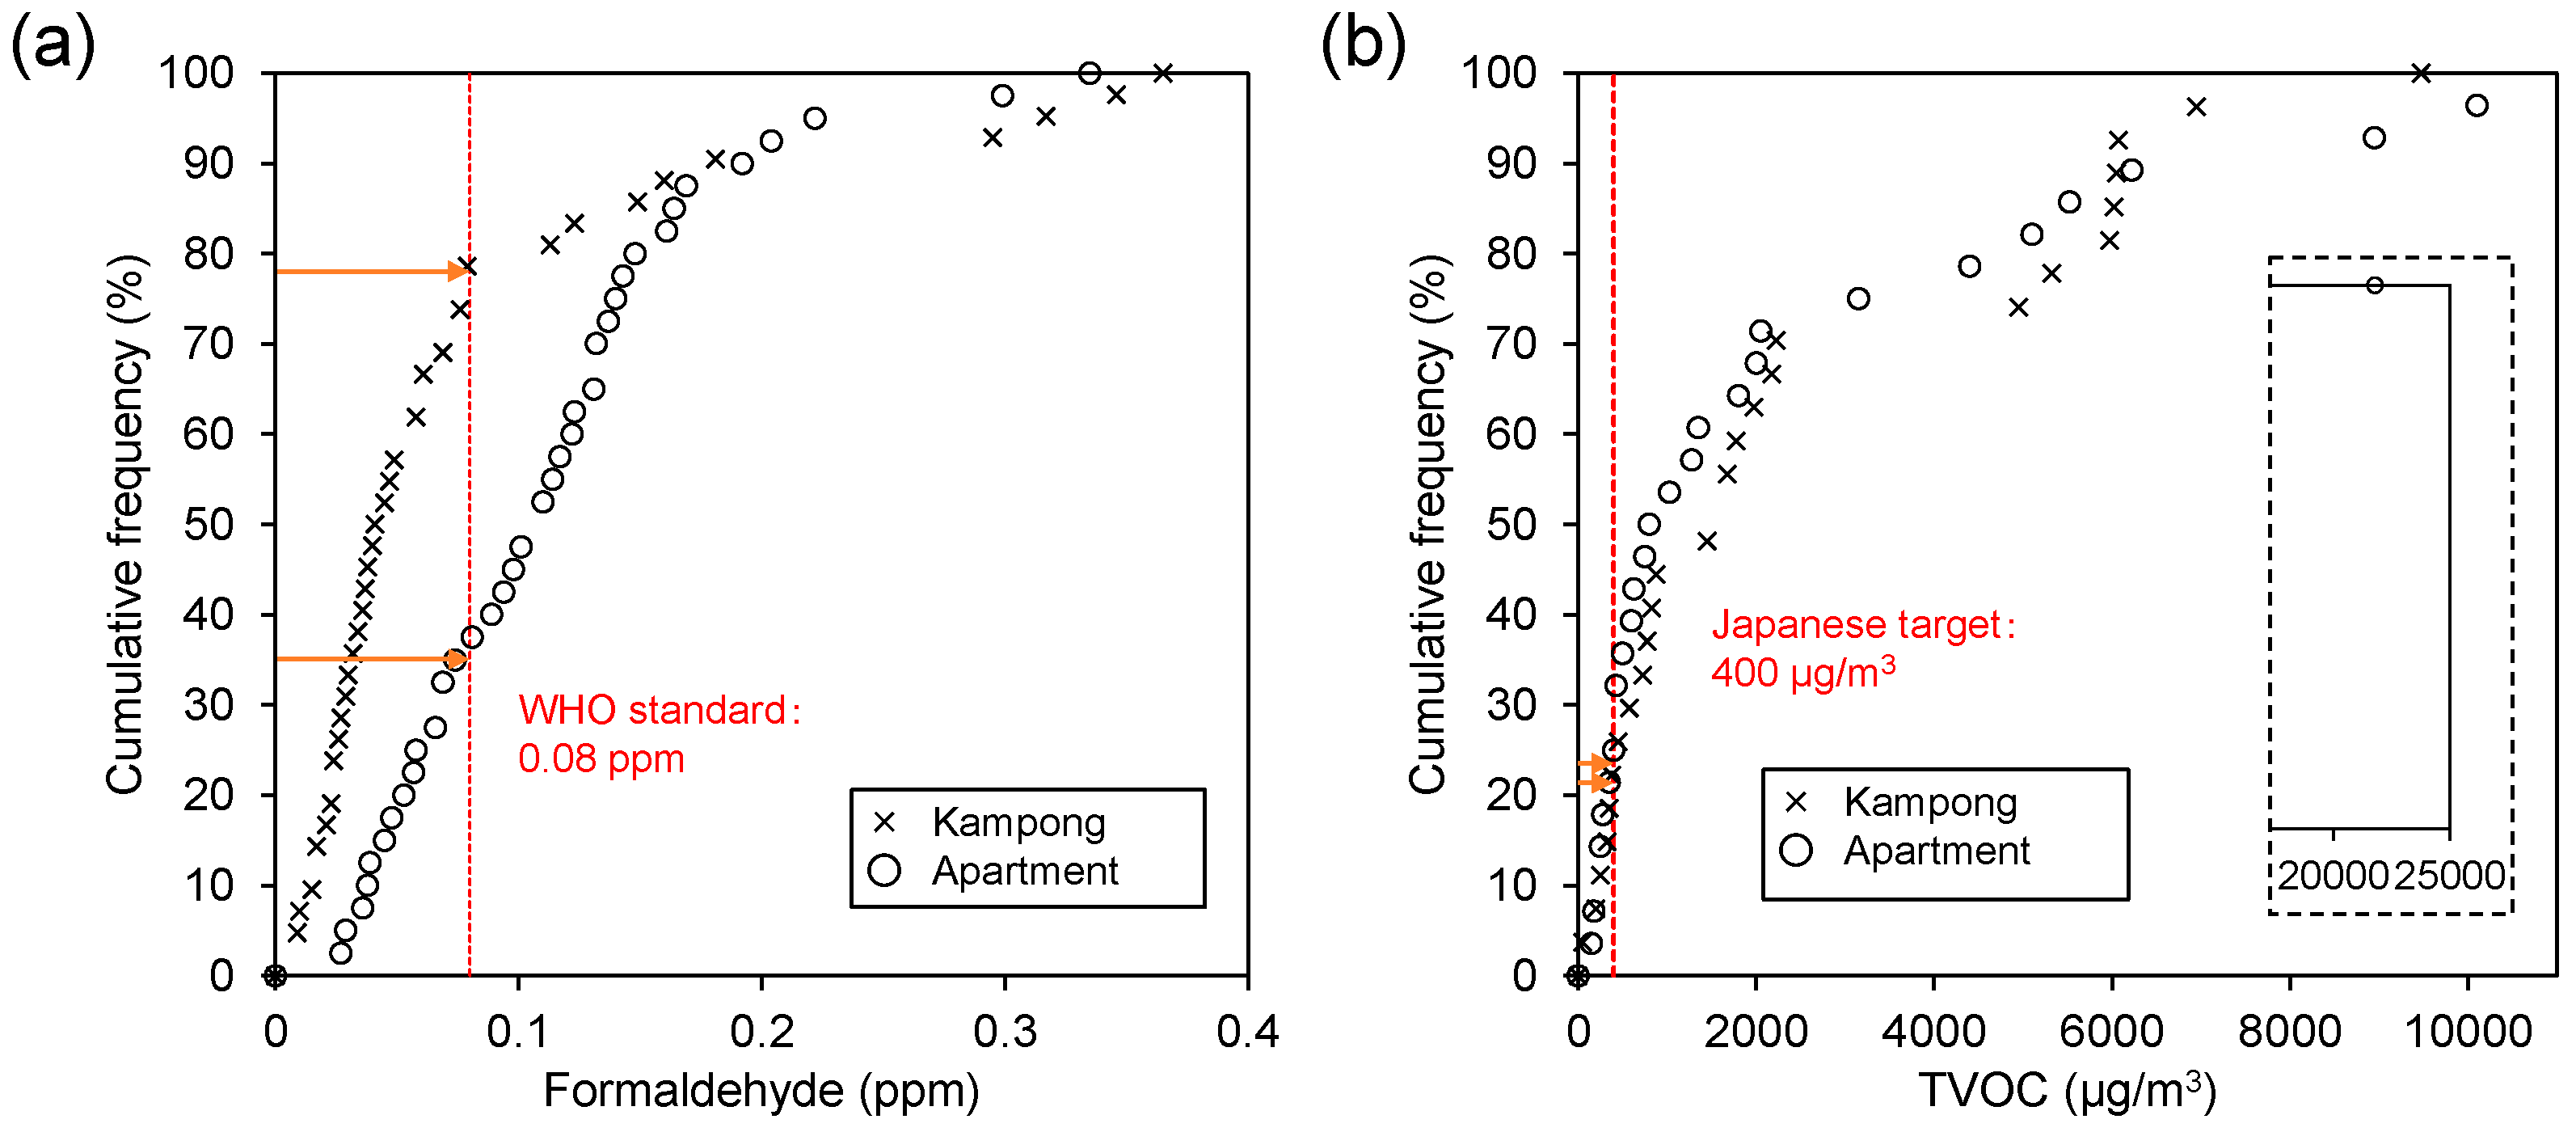
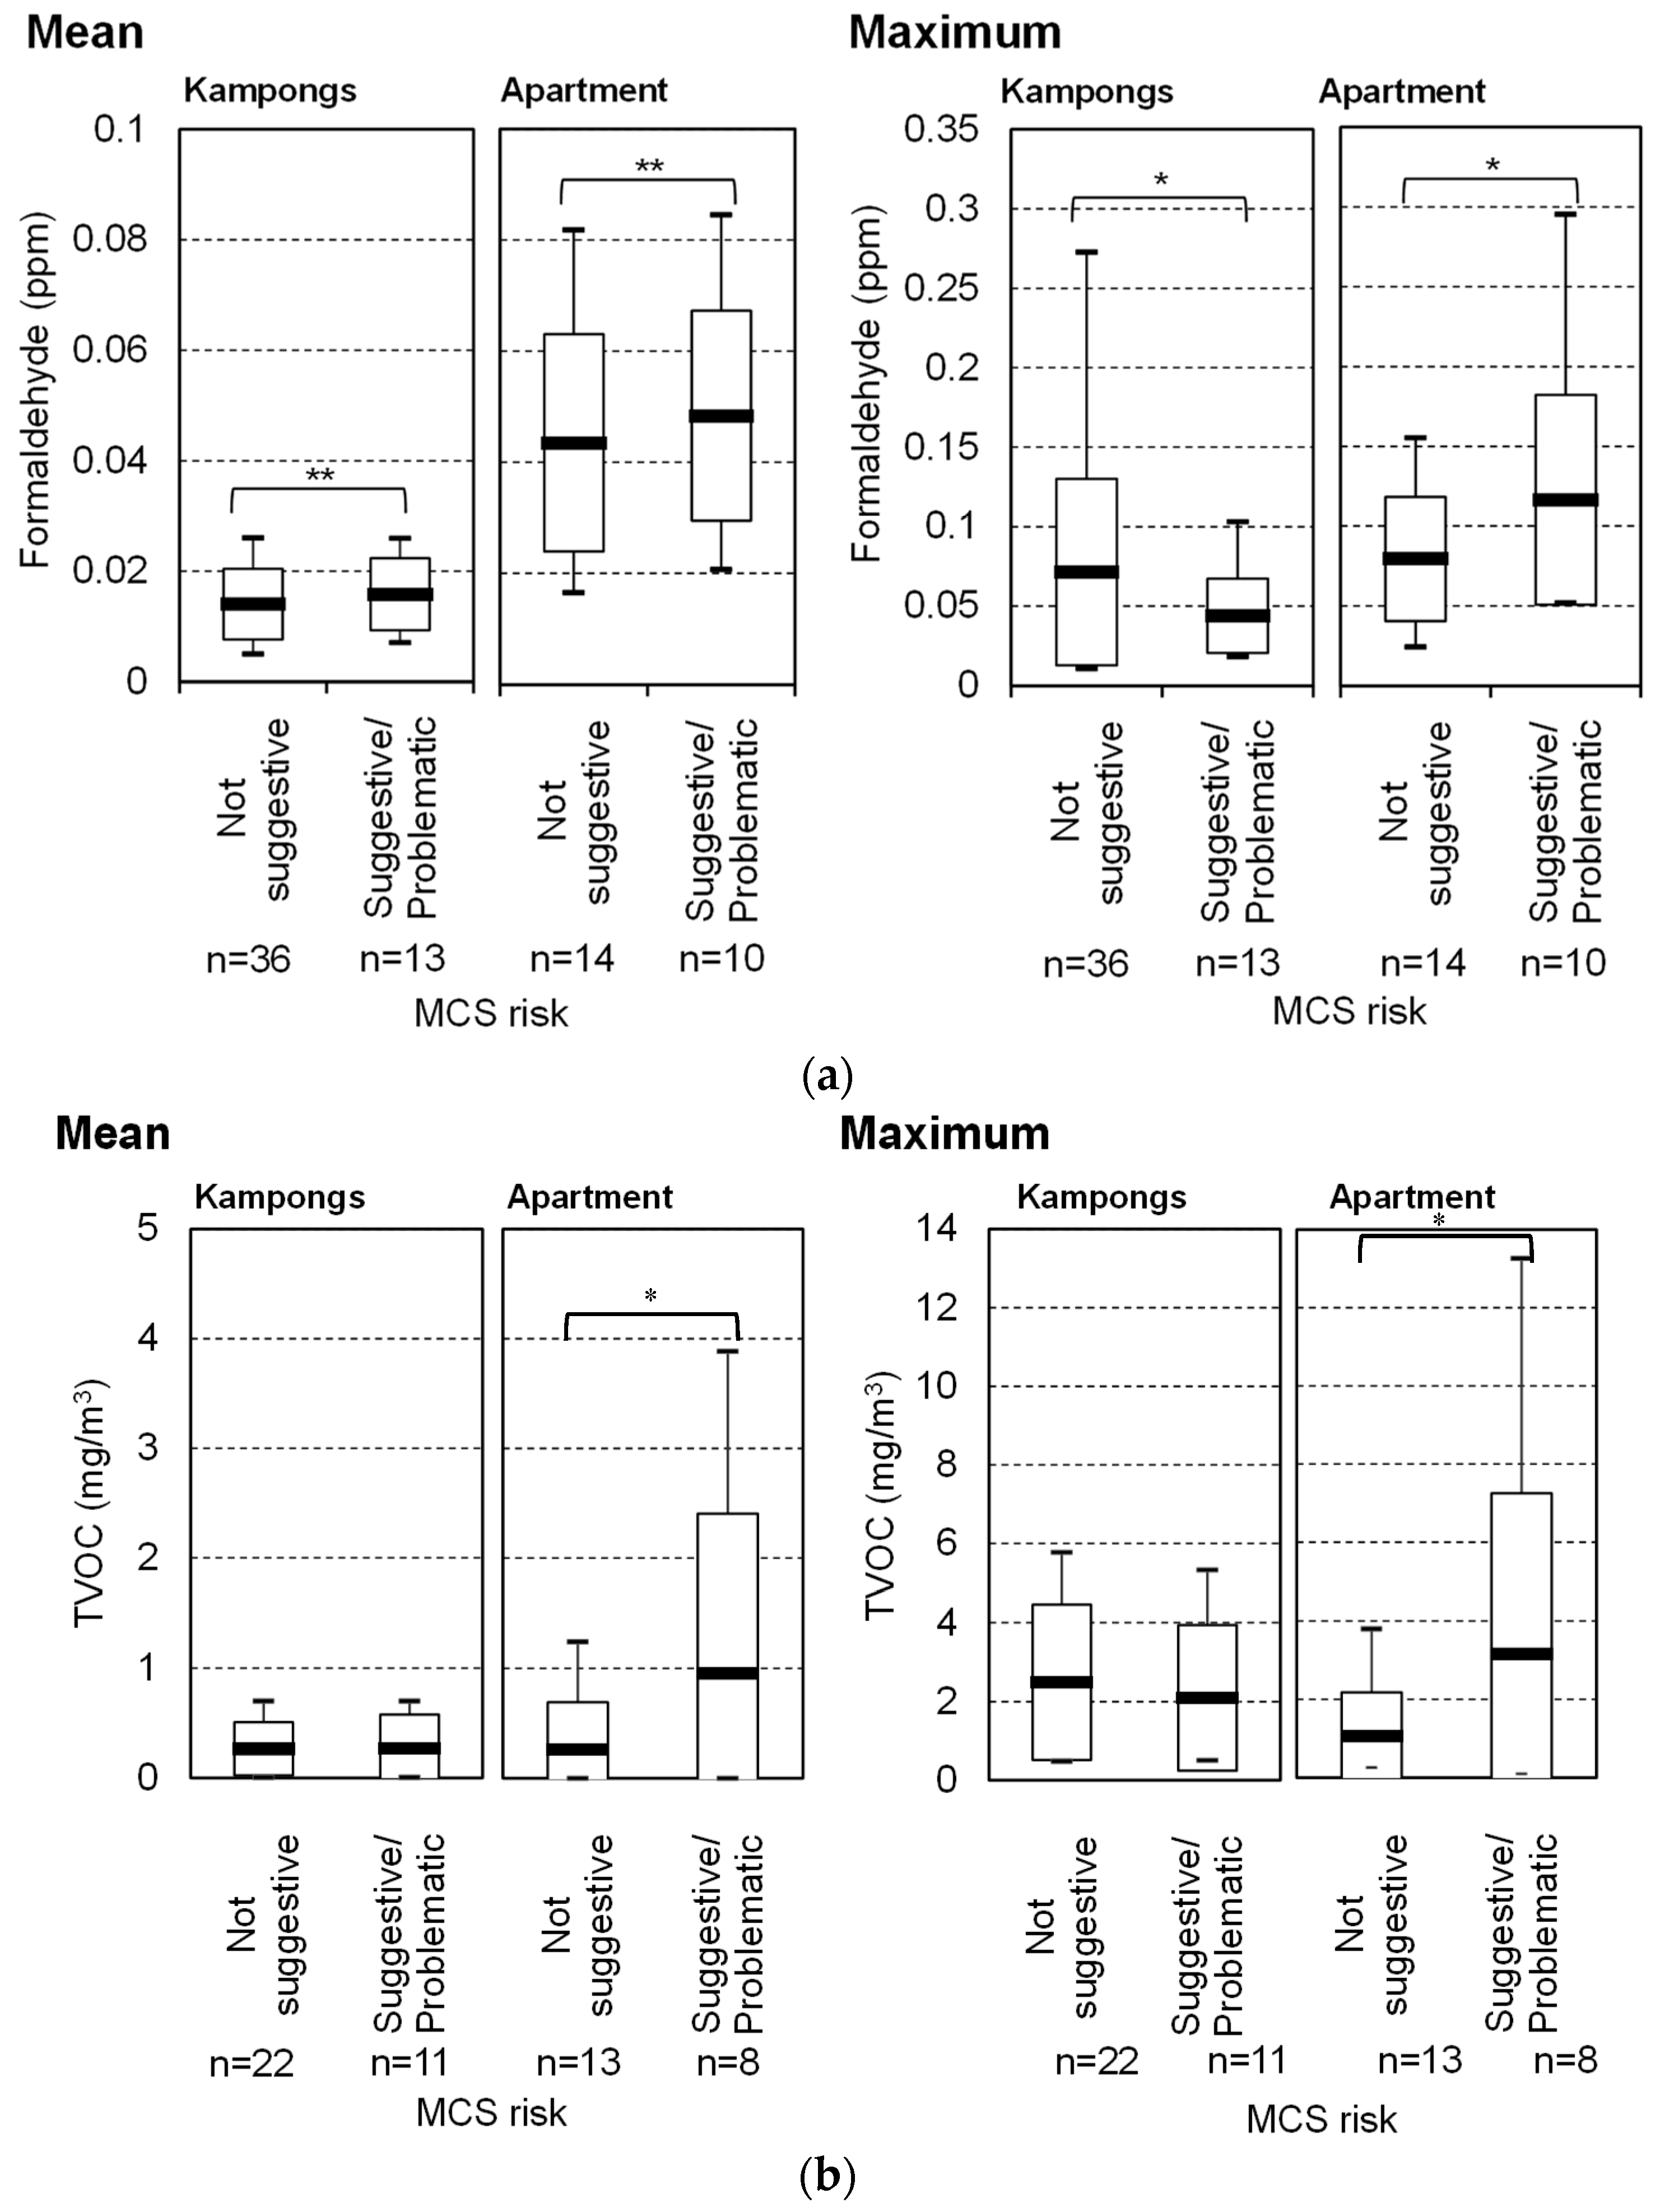
3.5. IAQ Measurements
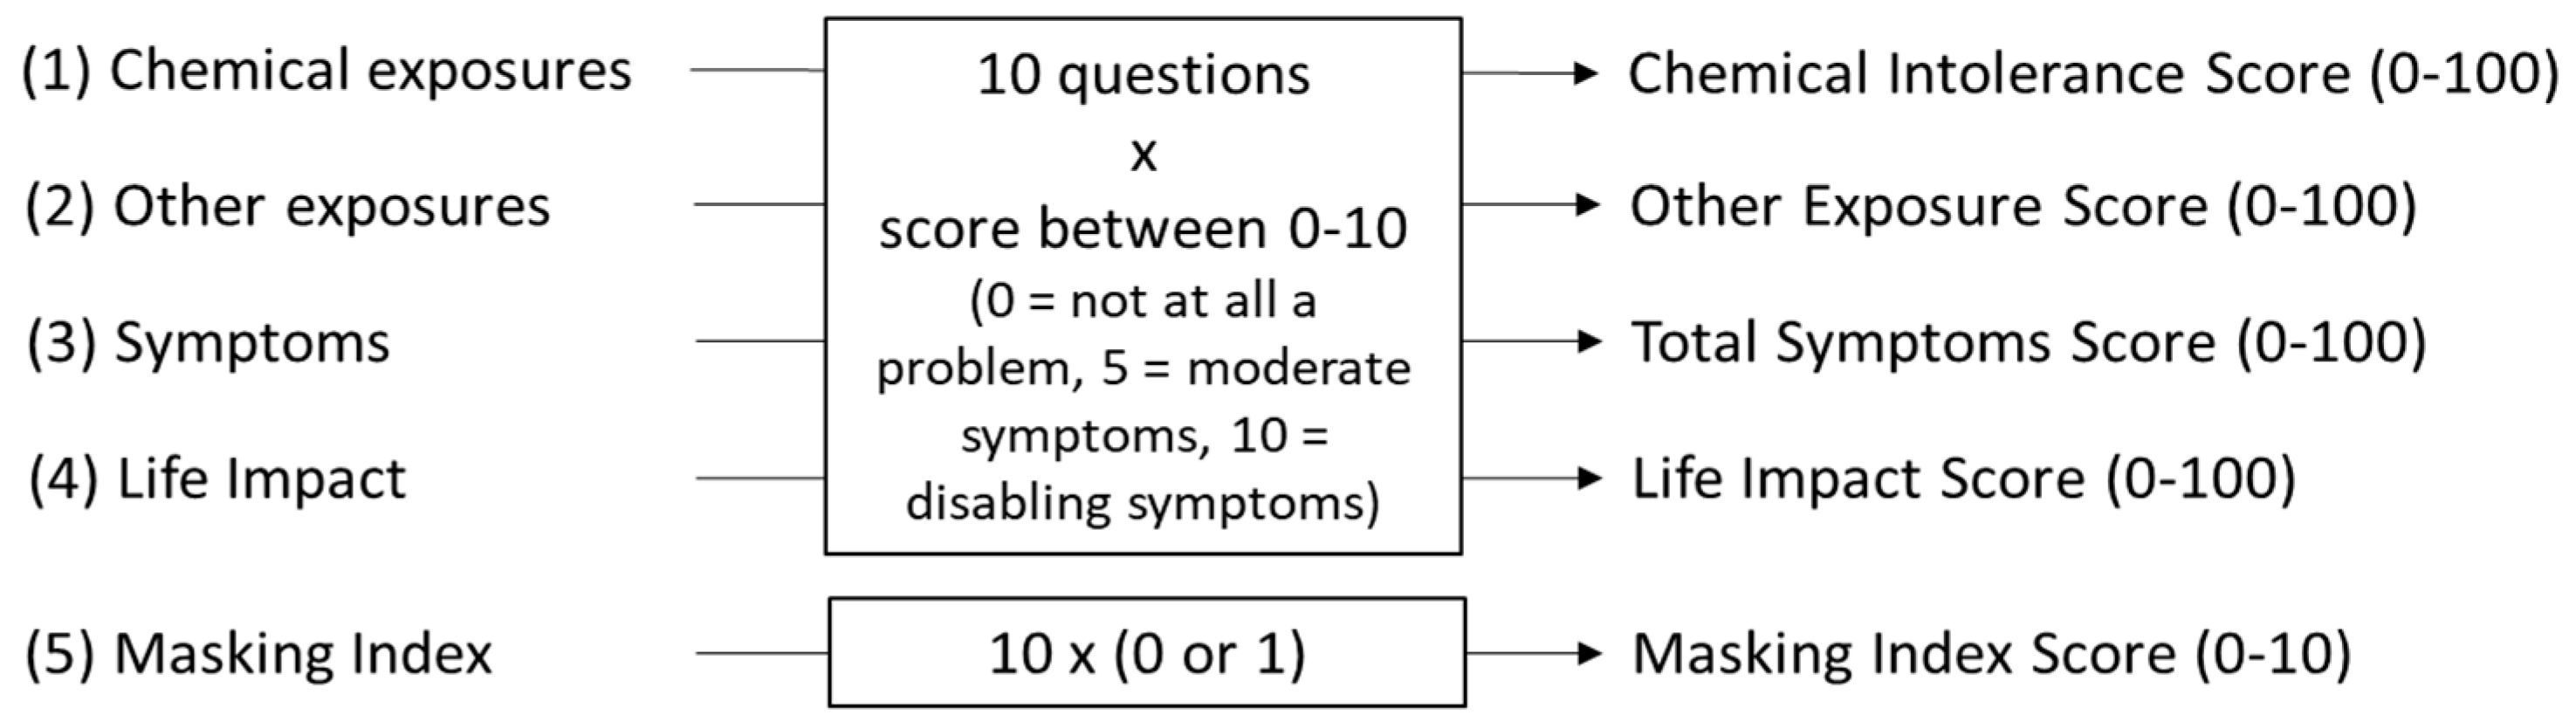
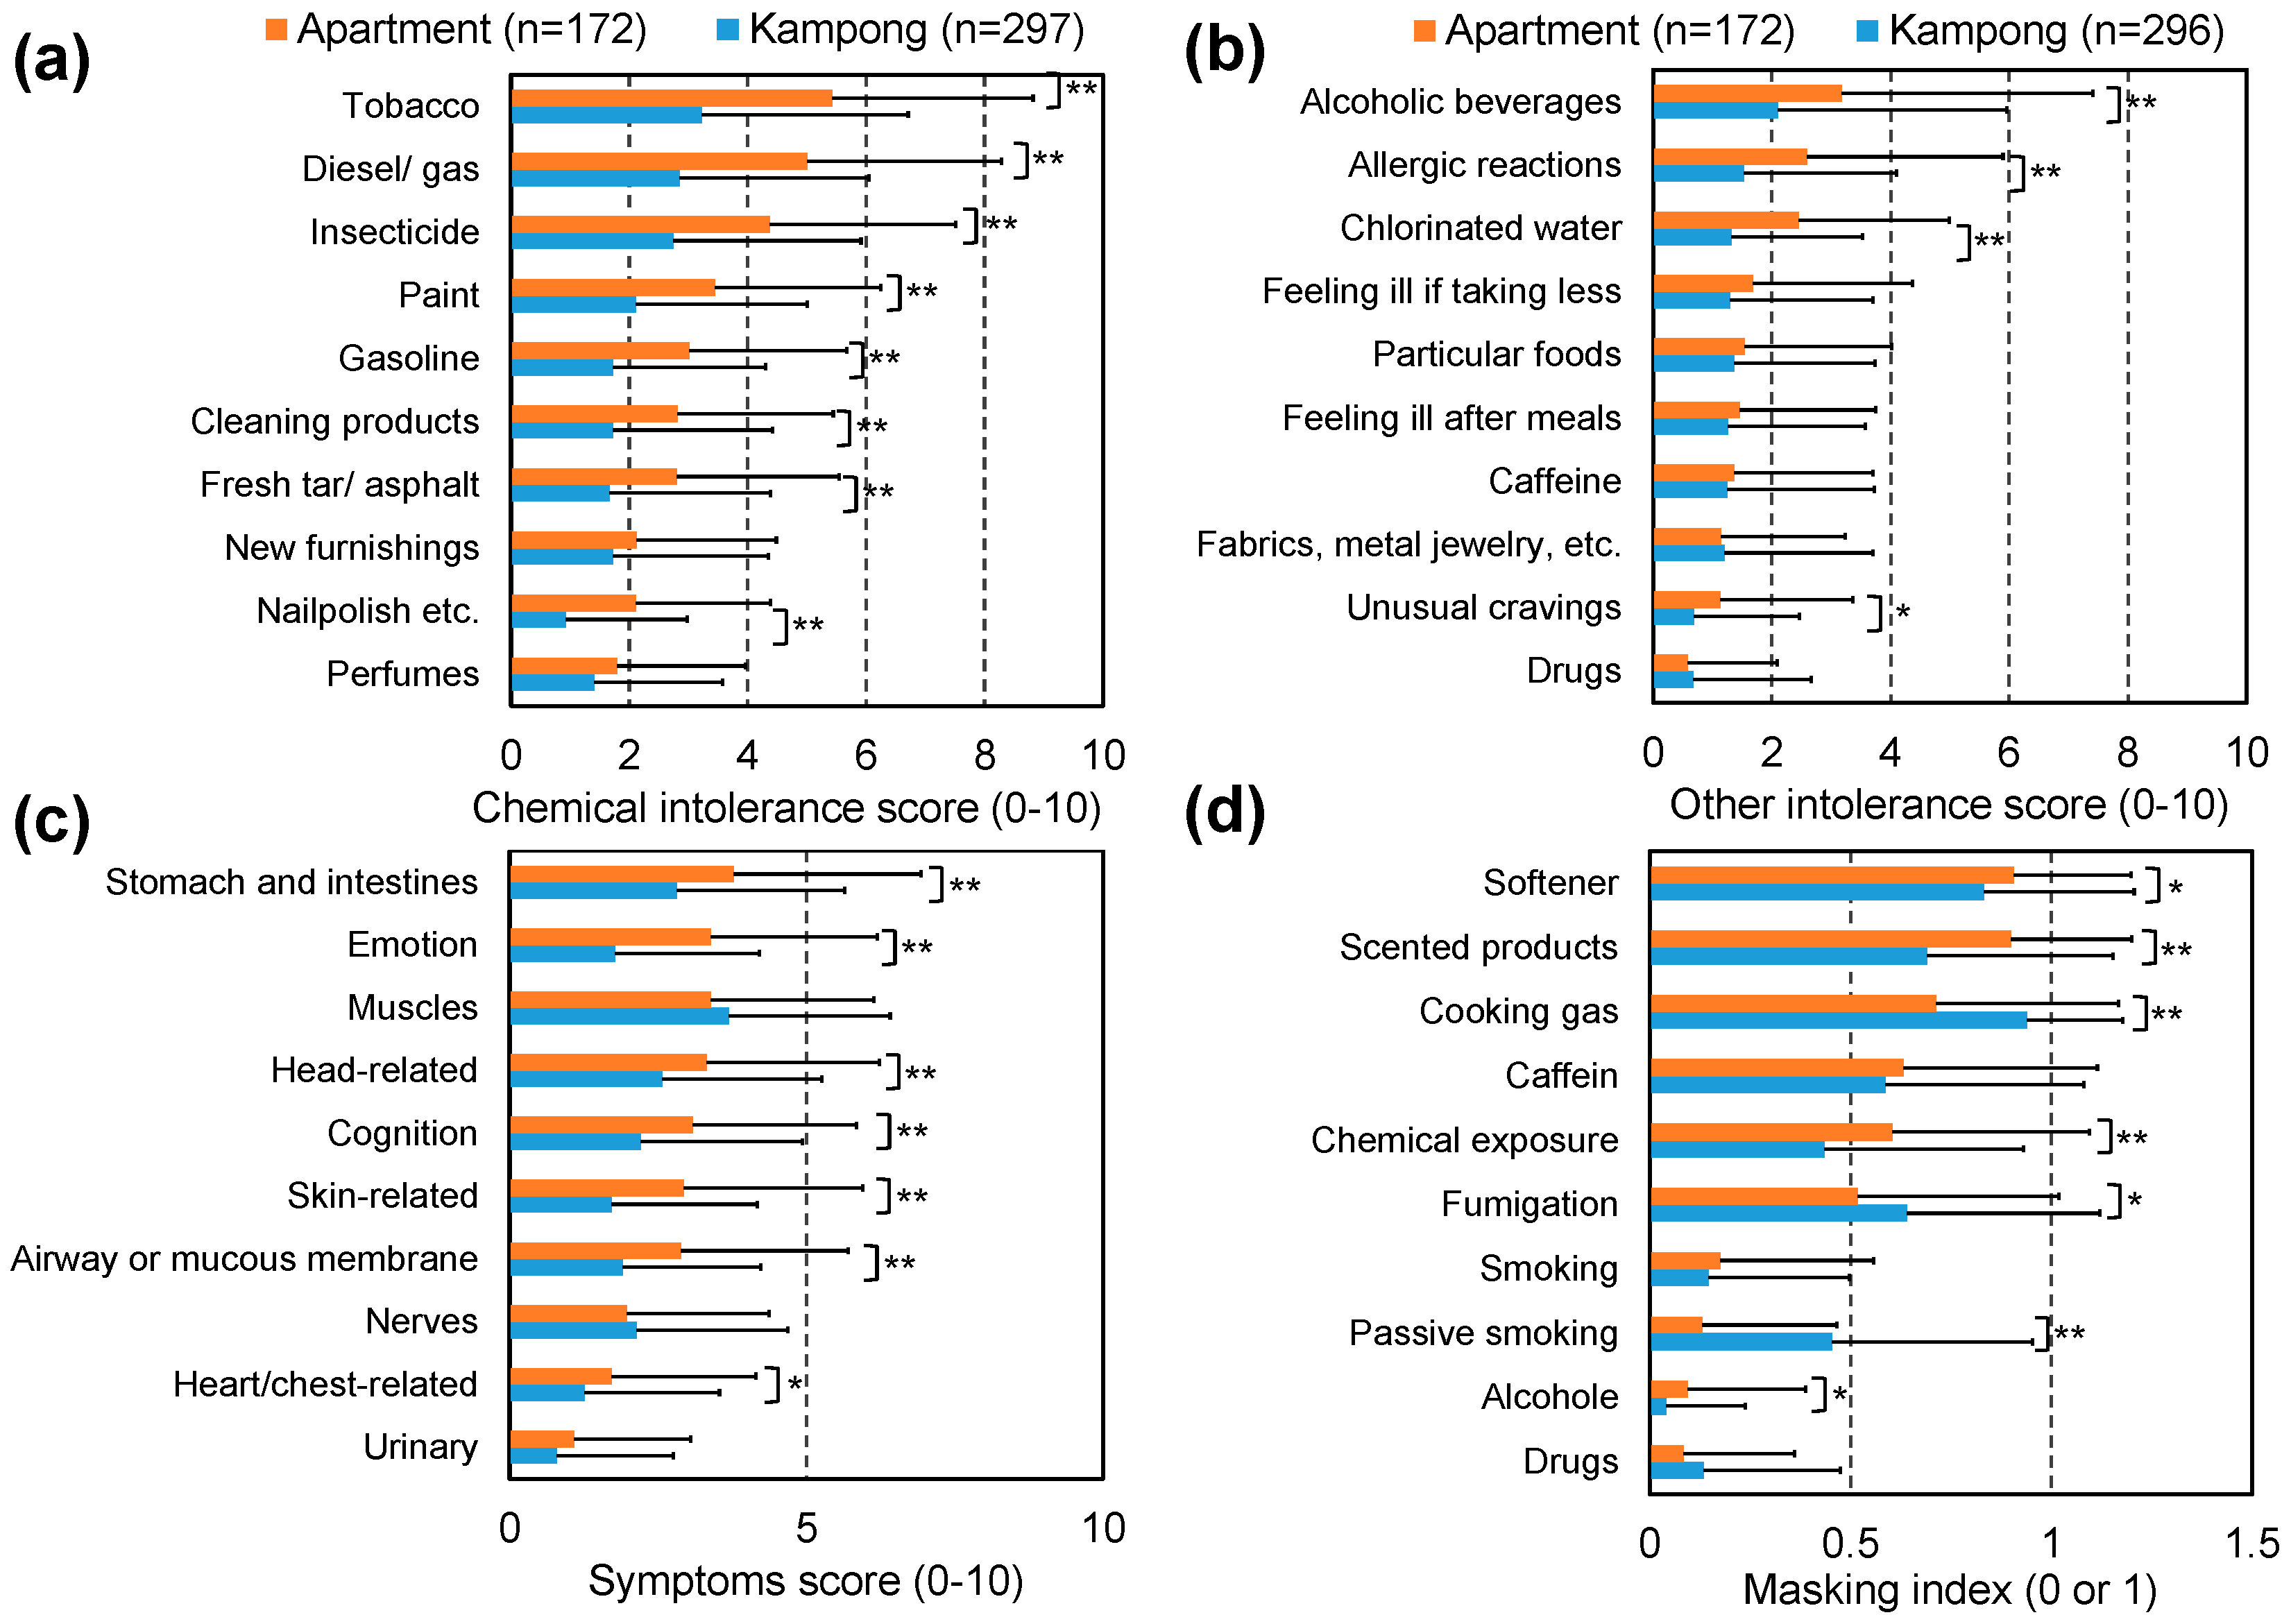
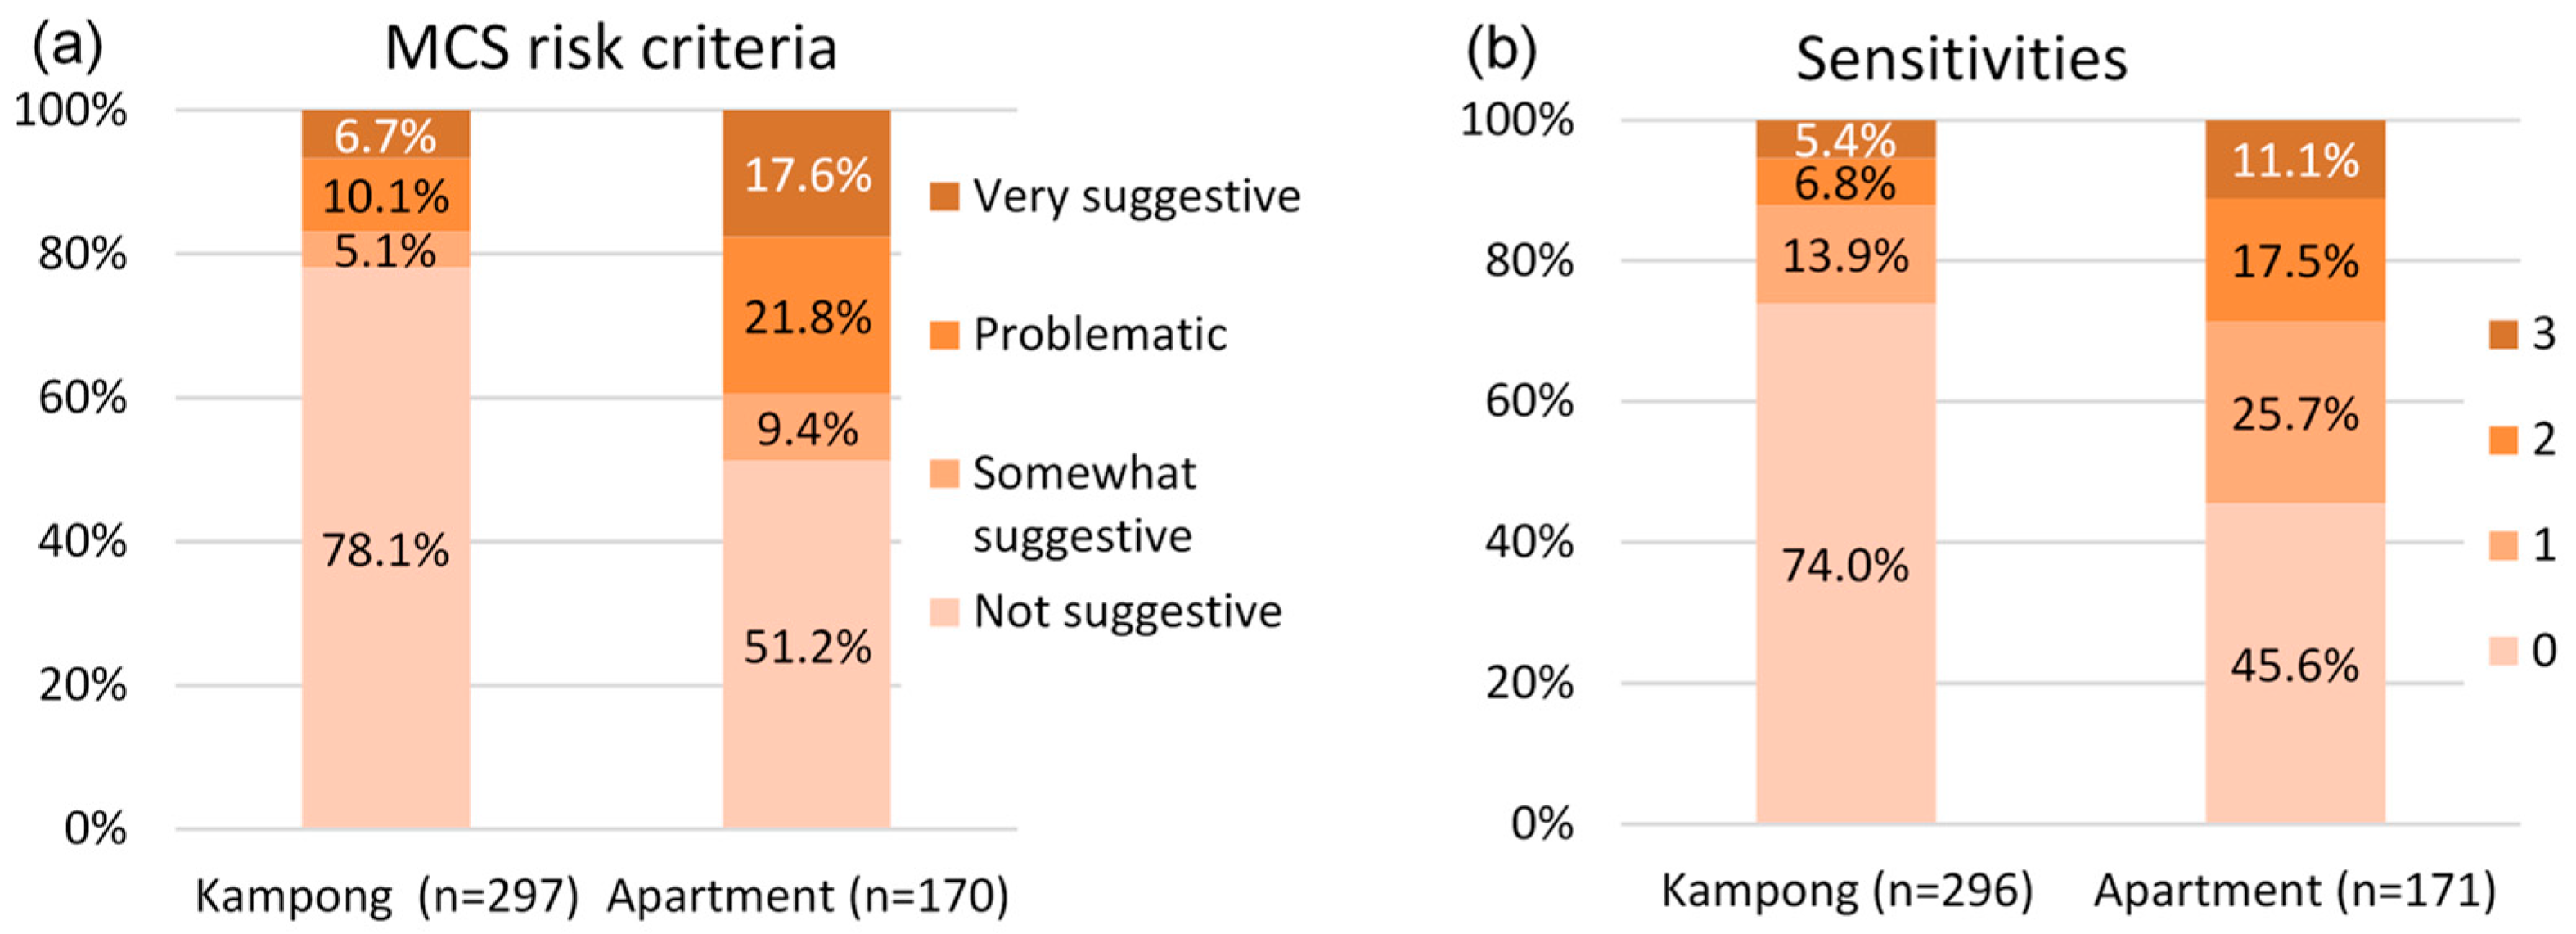
3.6. QEESI
3.7. Factors Influencing MCS
4. Conclusions
Author Contributions
Funding
Acknowledgments
Conflicts of Interest
References
- Institute of Medicine. Climate Change, the Indoor Environment, and Health; National Academies Press: Washington, DC, USA, 2011. [Google Scholar]
- Norbäck, D. An update on sick building syndrome. Curr. Opin. Allergy Clin. Immunol. 2009, 9, 55–59. [Google Scholar] [CrossRef] [PubMed]
- Engvall, K.; Norrby, C.; Norbäck, D. Sick building syndrome in relation to building dampness in multi-family residential buildings in Stockholm. Int. Arch. Occup. Environ. Health 2001, 74, 270–278. [Google Scholar] [CrossRef]
- Kishi, R.; Saijo, Y.; Kanazawa, A.; Tanaka, M.; Yoshimura, T.; Chikara, H.; Takigawa, T.; Morimoto, K.; Nakayama, K.; Shibata, E. Regional differences in residential environments and the association of dwellings and residential factors with the sick house syndrome: A nationwide cross-sectional questionnaire study in Japan. Indoor Air 2009, 19, 243–254. [Google Scholar] [CrossRef] [PubMed]
- Sundell, J. On the history of indoor air quality and health. Indoor Air 2004, 14, 51–58. [Google Scholar] [CrossRef] [PubMed]
- Sundell, J. Reflections on the history of indoor air science, focusing on the last 50 years. Indoor Air 2017, 27, 708–724. [Google Scholar] [CrossRef] [PubMed]
- Gebefügi, I. Biologisch aktive Chemikalien in Innenräumen: Kontamination durch Baustoffe. In Sick Building Syndrome: Forschung und Erkenntnisumsetzung: eine Dokumentation zum Workshop in Erfurt am 18.05.1993, 1st ed.; Bischof, W., Dompke, M., Schmid, W., Eds.; C.F. Müller: Karlsruhe, Germany, 1993; pp. 78–82. [Google Scholar]
- Goldstein, W.E. Introduction. In Sick Building Syndrome and Related Illness: Prevention and Remediation of Mold Contamination; Goldstein, W.E., Ed.; CRC Press: Boca Raton, FL, USA, 2011. [Google Scholar]
- Smith, K.R.; Mehta, S. The burden of disease from indoor air pollution in developing countries: comparison of estimates. Int. J. Hyg. Environ. Health 2003, 206, 279–289. [Google Scholar] [CrossRef]
- Tham, K.W. Indoor air quality and its effects on humans—A review of challenges and developments in the past 30 years. Energy Build. 2016, 130, 637–650. [Google Scholar] [CrossRef]
- UN DESA. World Urbanization Prospects: The 2014 Revision (No. ST/ESA/SER.A/366). Available online: https://esa.un.org/unpd/wup/Publications/Files/WUP2014-Report.pdf (accessed on 8 July 2018).
- WBGU—German Advisory Council on Global Change. Humanity on the Move: Unlocking the Transformative Power of Cities. Flagship Report; Wissenschaftlicher Beirat d. Bundesregierung Globale Umweltveränderungen: Berlin, Germany, 2016. [Google Scholar]
- UN DESA. World Population Prospects: The 2017 Revision, Key Findings and Advance Tables. Working Paper No. ESA/P/WP/248. 2017. Available online: https://www.un.org/development/desa/publications/world-population-prospects-the-2017-revision.html (accessed on 21 June 2017).
- Lamudi. Cara dan Syarat Membeli Rusunami. Lamudi. Available online: http://www.lamudi.co.id/journal/cara-dan-syarat-membeli-rusunami (accessed on 8 July 2018).
- The Jakarta Post. Jakarta Governor to Build 50,000 Apartments by 2017. The Jakarta Post. Available online: http://www.thejakartapost.com/news/2015/09/16/ahok-build-50000-apartments-2017.html (accessed on 8 July 2018).
- Rachmawati, F.; Soemitro, R.A.A.; Adi, T.J.W.; Susilawati, C. Low-cost Apartment Program Implementation in Surabaya Metropolitan Area. Procedia Eng. 2015, 125, 75–82. [Google Scholar] [CrossRef] [Green Version]
- Kisnarini, R.; Post, J.; van Egmond de Wilde de Ligny, E.; Mohammadi, M. Providing Adaptability of Space to Ensure Sustainable Living in Low Cost Housing in Indonesia. Procedia Soc. Behav. Sci. 2015, 179, 222–229. [Google Scholar] [CrossRef] [Green Version]
- Alfata, M.N.F.; Hirata, N.; Kubota, T.; Nugroho, A.M.; Uno, T.; Ekasiwi, S.N.N.; Antaryama, I.G.N. Field Investigation of Indoor Thermal Environments in Apartments of Surabaya, Indonesia: Potential Passive Cooling Strategies for Middle-class Apartments. Energy Procedia 2015, 78, 2947–2952. [Google Scholar] [CrossRef] [Green Version]
- Winarti, M.; Basuki, B.; Hamid, A. Air movement, gender and risk of sick building syndrome headache among employees in a Jakarta office. Med. J. Indones. 2003, 12, 171–177. [Google Scholar] [CrossRef]
- Maharani, D. Lingkungan Kantor Juga Bisa Timbulkan Penyakit. Kompas. Available online: https://entertainment.kompas.com/read/2015/03/27/071300223/Lingkungan.Kantor.Juga.Bisa.Timbulkan.Penyakit (accessed on 8 July 2018).
- Wardhani, D.A. Perumnas, Jakpro to build 40 low-cost apartment towers. The Jakarta Post. Available online: http://www.thejakartapost.com/news/2015/10/09/perumnas-jakpro-build-40-low-cost-apartment-towers.html (accessed on 8 July 2018).
- Susilawati, C.; Sutoto, Y. New affordable strata title housing solutions: A case study in Surabaya, Indonesia. In Proceedings of the 2010 International Conference on Construction & Real Estate Management, Brisbane, Australia, 1–3 December 2010. [Google Scholar]
- Al-Horr, Y.; Arif, M.; Katafygiotou, M.; Mazroei, A.; Kaushik, A.; Elsarrag, E. Impact of indoor environmental quality on occupant well-being and comfort: A review of the literature. Int. J. Sus. Built Environ. 2016, 5, 1–11. [Google Scholar] [CrossRef] [Green Version]
- Hulin, M.; Simoni, M.; Viegi, G.; Annesi-Maesano, I. Respiratory health and indoor air pollutants based on quantitative exposure assessments. Eur. Respir. J. 2012, 40, 1033–1045. [Google Scholar] [CrossRef] [Green Version]
- Mendell, M.J. Indoor Residential Chemical Emissions as Risk Factors for Respiratory and Allergic Effects in Children: A Review. Indoor Air 2007, 17, 259–277. [Google Scholar] [CrossRef] [PubMed]
- Spinelle, L.; Gerboles, M.; Kok, G.; Persijn, S.; Sauerwald, T. Review of portable and low-cost sensors for the ambient air monitoring of benzene and other volatile organic compounds. Sensors 2017, 17, 1520. [Google Scholar] [CrossRef] [PubMed]
- RAE Systems. Sensor Specifications and Cross-Sensitivities; Technical Note TN-114; RAE Systems: Sunnyvale, CA, USA, 2018. [Google Scholar]
- Abe, K. A method for numerical characterization of indoor climates by a biosensor using a xerophilic fungus. Indoor Air 1993, 3, 344–348. [Google Scholar] [CrossRef]
- Vereecken, E.; Roels, S. Review of mould prediction models and their influence on mould risk evaluation. Building and Environment 2012, 51, 296–310. [Google Scholar] [CrossRef] [Green Version]
- Abe, K. Assessment of home environments with a fungal index using hydrophilic and xerophilic fungi as biologic sensors. Indoor Air 2012, 22, 173–185. [Google Scholar] [CrossRef]
- Abe, K. Assessment of the environmental conditions in a museum storehouse by use of a fungal index. Int. Biodeterior. Biodegradation 2010, 64, 32–40. [Google Scholar] [CrossRef]
- Laboratory for Mold Prediction. Additional Guidelines for Fungal Detector; Laboratory for Mold Prediction: Tokyo, Japan, 2004. (In Japanese) (unpublished) [Google Scholar]
- Walker, T.T.; Prihoda, T.J.; Miller, C.S. Is it the Building, the Occupant, or Both? Using the QEESI to Investigate Indoor Air Concerns. Available online: http://drclaudiamiller.com/wp-content/uploads/2012/03/indoor-air-concerns-2011.pdf (accessed on 8 July 2018).
- Huang, L.L.; Ikeda, K.; Chiang, C.M.; Kagi, N.; Hojo, S.; Yanagi, U. Field Survey on the Relation between IAQ and Occupants’ Health in 40 Houses in Southern Taiwan. J. Asian Archit. Build. Eng. 2011, 10, 249–256. [Google Scholar] [CrossRef]
- Nakaoka, H.; Todaka, E.; Seto, H.; Saito, I.; Hanazato, M.; Watanabe, M.; Mori, C. Correlating the symptoms of sick-building syndrome to indoor VOCs concentration levels and odour. Indoor Built Environ. 2014, 23, 804–813. [Google Scholar] [CrossRef]
- Hojo, S.; Kumano, H.; Yoshino, H.; Kakuta, K.; Ishikawa, S. Application of Quick Environment Exposure Sensitivity Inventory (QEESI) for Japanese population: Study of reliability and validity of the questionnaire. Toxicol. Ind. Health 2003, 19, 41–49. [Google Scholar] [CrossRef] [PubMed]
- Nordin, M.; Andersson, L.; Nordin, S. Coping strategies, social support and responsibility in chemical intolerance. J. Clin. Nurs. 2010, 19, 2162–2173. [Google Scholar] [CrossRef] [PubMed]
- Skovbjerg, S.; Berg, N.D.; Elberling, J.; Christensen, K.B. Evaluation of the quick environmental exposure and sensitivity inventory in a Danish population. J. Environ. Public Health 2012, 2012, 304–314. [Google Scholar] [CrossRef] [PubMed]
- Miller, C.S. QEESI. Available online: http://familymed.uthscsa.edu/qeesi.pdf (accessed on 8 July 2018).
- Miller, C.S.; Prihoda, T.J. The Environmental Exposure and Sensitivity Inventory (EESI): A standardized approach for measuring chemical intolerances for research and clinical applications. Toxicol. Ind. Health 1999, 15, 370–385. [Google Scholar] [CrossRef] [PubMed]
- Pirhonen, I.; Nevalainen, A.; Husman, T.; Pekkanen, J. Home dampness, moulds and their influence on respiratory infections and symptoms in adults in Finland. Eur. Respir. J. 1996, 9, 2618–2622. [Google Scholar] [CrossRef] [Green Version]
- Wang, J.; Engvall, K.; Smedje, G.; Norbäck, D. Rhinitis, asthma and respiratory infections among adults in relation to the home environment in multi-family buildings in Sweden. PLoS ONE 2014, 9, e105125. [Google Scholar] [CrossRef]
- Wang, J.; Li, B.; Yang, Q.; Wang, H.; Norbäck, D.; Sundell, J. Sick building syndrome among parents of preschool children in relation to home environment in Chongqing, China. Chin. Sci. Bull. 2013, 58, 4267–4276. [Google Scholar] [CrossRef] [Green Version]
- Seo, S.; Kim, D.; Paul, C.; Yoo, Y.; Choung, J.T. Exploring Household-level Risk Factors for Self-reported Prevalence of Allergic Diseases Among Low-income Households in Seoul, Korea. Allergy Asthma Immunol. Res. 2014, 6, 421–427. [Google Scholar] [CrossRef] [Green Version]
- Wang, J.; Li, B.; Yang, Q.; Yu, W.; Wang, H.; Norbäck, D.; Sundell, J. Odors and sensations of humidity and dryness in relation to sick building syndrome and home environment in Chongqing, China. PLoS ONE 2013, 8, e72385. [Google Scholar] [CrossRef]
- Norbäck, D.; Bjornsson, E.; Jansson, C.; Widstrom, J.; Boman, G. Asthmatic symptoms and volatile organic compounds, formaldehyde, and carbon dioxide in dwellings. Occup. Environ. Med. 1995, 52, 388–395. [Google Scholar] [CrossRef] [PubMed]
- Dallongeville, A.; Le Cann, P.; Zmirou-Navier, D.; Chevrier, C.; Costet, N.; Annesi-Maesano, I.; Blanchard, O. Concentration and determinants of molds and allergens in indoor air and house dust of French dwellings. Sci. Total Environ. 2015, 536, 964–972. [Google Scholar] [CrossRef] [PubMed] [Green Version]
- To, T.; Stanojevic, S.; Moores, G.; Gershon, A.S.; Bateman, E.D.; Cruz, A.A.; Boulet, L.P. Global asthma prevalence in adults: Findings from the cross-sectional world health survey. BMC Public Health 2012, 12, 1–8. [Google Scholar] [CrossRef] [PubMed]
- Kanazawa, A.; Saito, I.; Araki, A.; Takeda, M.; Ma, M.; Saijo, Y.; Kishi, R. Association between indoor exposure to semi-volatile organic compounds and building-related symptoms among the occupants of residential dwellings. Indoor Air 2010, 20, 72–84. [Google Scholar] [CrossRef] [PubMed]
- Norbäck, D.; Lampa, E.; Engvall, K. Asthma, allergy and eczema among adults in multifamily houses in Stockholm (3-HE study)—Associations with building characteristics, home environment and energy use for heating. PLoS ONE 2014, 9, e112960. [Google Scholar] [CrossRef] [PubMed]
- Sahlberg, B.; Gunnbjörnsdottir, M.; Soon, A.; Jogi, R.; Gislason, T.; Wieslander, G.; Janson, C.; Norbäck, D. Airborne molds and bacteria, microbial volatile organic compounds (MVOC), plasticizers and formaldehyde in dwellings in three North European cities in relation to sick building syndrome (SBS). Sci. Total Environ. 2013, 444, 433–440. [Google Scholar] [CrossRef] [PubMed]
- Takigawa, T.; Wang, B.L.; Saijo, Y.; Morimoto, K.; Nakayama, K.; Tanaka, M.; Shibata, E.; Yoshimura, T.; Chikara, H.; Ogino, K.; et al. Relationship between indoor chemical concentrations and subjective symptoms associated with sick building syndrome in newly built houses in Japan. Int. Arch. Occup. Environ. Health 2010, 83, 225–235. [Google Scholar] [CrossRef] [PubMed]
- Sun, C.; Guo, Y.; Huang, C.; Zou, Z.; Hu, Y.; Liu, W. Associations of Building Characteristics and Lifestyle Behaviors with Allergic Disease for Adults in Shanghai: From a Cross-sectional Survey. Procedia Eng. 2017, 205, 1130–1137. [Google Scholar] [CrossRef]
- Smedje, G.; Wang, J.; Norbäck, D.; Nilsson, H.; Engvall, K. SBS symptoms in relation to dampness and ventilation in inspected single-family houses in Sweden. Int. Arch. Occup. Environ. Health 2017, 90, 703–711. [Google Scholar] [CrossRef] [Green Version]
- Saijo, Y.; Kishi, R.; Sata, F.; Katakura, Y.; Urashima, Y.; Hatakeyama, A.; Kobayashi, S.; Jun, K.; Kurahashi, N.; Kondo, T.; et al. Symptoms in relation to chemicals and dampness in newly built dwellings. Int. Arch. Occup. Environ. Health 2004, 77, 461–470. [Google Scholar] [CrossRef]
- Saijo, Y.; Kanazawa, A.; Araki, A.; Morimoto, K.; Nakayama, K.; Takigawa, T.; Tanaka, M.; Shibata, E.; Yoshimura, T.; Chikara, H.; et al. Relationships between mite allergen levels, mold concentrations, and sick building syndrome symptoms in newly built dwellings in Japan. Indoor Air 2011, 21, 253–263. [Google Scholar] [CrossRef] [PubMed]
- Alfata, M.N.F. Fundamental study on indoor thermal environments in high-rise apartments in hot-humid climates of Indonesia. Ph.D. Thesis, Hiroshima University, Hiroshima, Japan, 2018, (unpublished). [Google Scholar]
- Budiaková, M. Influence of Reconstructed Residential Building on Indoor Climate. Procedia Eng. 2016, 161, 825–832. [Google Scholar] [CrossRef] [Green Version]
- Bentayeb, M.; Billionnet, C.; Baiz, N.; Derbez, M.; Kirchner, S.; Annesi-Maesano, I. Higher prevalence of breathlessness in elderly exposed to indoor aldehydes and VOCs in a representative sample of French dwellings. Respir. Med. 2013, 107, 1598–1607. [Google Scholar] [CrossRef] [PubMed] [Green Version]
- Araki, A.; Kawai, T.; Eitaki, Y.; Kanazawa, A.; Morimoto, K.; Nakayama, K.; Shibata, E.; Tanaka, M.; Takigawa, T.; Yoshimura, T.; et al. Relationship between selected indoor volatile organic compounds, so-called microbial VOC, and the prevalence of mucous membrane symptoms in single family homes. Sci. Total Environ. 2010, 408, 2208–2215. [Google Scholar] [CrossRef] [PubMed] [Green Version]
- Yeatts, K.B.; El-Sadig, M.; Leith, D.; Kalsbeek, W.; Al-Maskari, F.; Couper, D.; Funk, W.; Zoubeidi, T.; Chan, R.L.; Trent, C.B.; et al. Indoor air pollutants and health in the United Arab Emirates. Environ. Health Perspect. 2012, 120, 687–694. [Google Scholar] [CrossRef] [PubMed]
- Guo, P.; Yokoyama, K.; Piao, F.; Sakai, K.; Khalequzzaman, M.; Kamijima, M.; Nakajima, T.; Kitamura, F. Sick building syndrome by indoor air pollution in Dalian, China. Int. J. Environ. Res. Public Health 2013, 10, 1489–1504. [Google Scholar] [CrossRef] [PubMed]
- Hojo, S.; Yoshino, H.; Kumano, H.; Kakuta, K.; Miyata, M.; Sakabe, K.; Matsui, T.; Ikeda, K.; Nozaki, A.; Ishikawa, S. Use of QEESI© questionnaire for a screening study in Japan. Toxicol. Ind. Health 2016, 21, 113–124. [Google Scholar] [CrossRef]
- ASHRAE. 2017 ASHRAE Handbook: Fundamentals: SI Edition; Inch-Pound Edition; ASHRAE: Atlanta, GA, USA, 2017. [Google Scholar]
- Jeong, I.; Kim, I.; Park, H.J.; Roh, J.; Park, J.W.; Lee, J.H. Allergic diseases and multiple chemical sensitivity in korean adults. Allergy Asthma Immunol. Res. 2014, 6, 409–414. [Google Scholar] [CrossRef] [PubMed]
- Robert Koch-Institut. Berliner Studie zu umweltbezogenen Erkrankungen. Available online: https://www.bundesgesundheitsministerium.de/fileadmin/redaktion/pdf_publikationen/forschungsberichte/rki-berliner-studie.pdf (accessed on 8 July 2018).
- Cui, X.; Lu, X.; Hisada, A.; Fujiwara, Y.; Katoh, T. The correlation between mental health and multiple chemical sensitivity: A survey study in Japanese workers. Environ. Health Prev. Med. 2015, 20, 123–129. [Google Scholar] [CrossRef] [PubMed]
- Mendelson, M.B.; Catano, V.M.; Kelloway, K. The role of stress and social support in Sick Building Syndrome. Work Stress 2000, 14, 137–155. [Google Scholar] [CrossRef]
- Runeson-Broberg, R.; Norbäck, D. Sick building syndrome (SBS) and sick house syndrome (SHS) in relation to psychosocial stress at work in the Swedish workforce. Int. Arch. Occup. Environ. Health 2013, 86, 915–922. [Google Scholar] [CrossRef] [PubMed]
- Sandel, M.; Wright, R.J. When home is where the stress is: Expanding the dimensions of housing that influence asthma morbidity. Arch. Dis. Child. 2006, 91, 942–948. [Google Scholar] [CrossRef] [PubMed]
- Lee, J.H.; Sohn, Y.S. A Comparative Study on Sick Building Syndrome by Apartment Unit Plan with and without Cross Ventilation. J. Asian Archit. Build. Eng. 2014, 13, 63–70. [Google Scholar] [CrossRef] [Green Version]
- Sahlberg, B.; Mi, Y.H.; Norbäck, D. Indoor environment in dwellings, asthma, allergies, and sick building syndrome in the Swedish population: A longitudinal cohort study from 1989 to 1997. Int. Arch. Occup. Environ. Health 2009, 82, 1211–1218. [Google Scholar] [CrossRef] [PubMed]
- Cleaning at Home and at Work in Relation to Lung Function Decline and Airway Obstruction. Available online: https://0-doi-org.brum.beds.ac.uk/10.1164/rccm.201706-1311OC (accessed on 8 July 2018).
- Kamaruzzaman, S.N.; Razali, A.; Zawawi, E.M.A.; Basir, S.A.; Riley, M. Residents’ Satisfaction Towards the Indoor Environmental Quality of Re-engineered Affordable Housing Scheme in Malaysia. Int. J. Technol. 2018, 9, 501. [Google Scholar] [CrossRef]


| Level | Fungal Index | Predicted Propagation of Fungi | Remarks |
|---|---|---|---|
| A | <2 | No propagation | Good environment |
| B | 2–5 | Low possibility of propagation | There is no problem in terms of fungi, but there is a possibility of propagation of mites, which requires countermeasures. Dehumidification is recommended. |
| C | 5–15 | Possibility of propagation | Fungi prevention measures are recommended. Dehumidification is recommended. |
| D | >15 | High possibility of propagation | Fungi prevention measures are required. Dehumidification is needed for living rooms and regular cleaning is needed for wet areas, such as bathroom. |
| Scale/Index | Score | ||
|---|---|---|---|
| Low | Medium | High | |
| Symptom Severity | 0–19 | 20–39 | 40–100 |
| Chemical Intolerance | 0–19 | 20–39 | 40–100 |
| Other Intolerance | 0–11 | 12–24 | 25–100 |
| Life Impact | 0–11 | 12–24 | 25–100 |
| Masking Index | 0–3 | 4–5 | 6–10 |
| Degree to which MCS Is Suggested | Symptom Severity Score | Chemical Intolerance Score | Masking Score |
|---|---|---|---|
| Not suggestive | <40 | <40 | <4 |
| Not suggestive | <40 | <40 | ≥4 |
| Not suggestive | ≥40 | <40 | <4 |
| Somewhat suggestive | ≥40 | <40 | ≥4 |
| Problematic | <40 | ≥40 | <4 |
| Problematic | <40 | ≥40 | ≥4 |
| Very suggestive | ≥40 | ≥40 | <4 |
| Very suggestive | ≥40 | ≥40 | ≥4 |
| Samples | Kampong | Apartment | Total | |
|---|---|---|---|---|
| Questionnaires | 298 (63%) | 173 (37%) | 471 | |
| Measurements | IAQ parameters | 36 | 40 | 76 |
| Mold risk | 14 | 16 | 30 | |
| K = Kampong, A = Apartment | K | A | Total | n | p-Value | ||
|---|---|---|---|---|---|---|---|
| Personal attributes | Age [%] | Years [mean] | 39.7 | 25.1 | 34.4 | 462 | <0.001 a |
| <20 | 14.3 | 16.0 | 14.9 | ||||
| 20–29 | 13.0 | 68.0 | 33.1 | ||||
| 30–39 | 17.7 | 5.9 | 13.4 | ||||
| 40–49 | 27.0 | 4.7 | 18.8 | ||||
| >50 | 28.0 | 5.3 | 19.7 | ||||
| Gender [%] | Male/Female | 35.5/64.5 | 42.1/57.9 | 37.9/62.1 | 467 | 155 b | |
| Living time in house/flat [%] | Years [mean] | 25.3 | 1.9 | 15.2 | 260 | <0.001 a | |
| Income (US$) [%] | <150 | 24.8 | 10.5 | 18.3 | 273 | <0.001 b | |
| 150–450 | 56.4 | 49.2 | 53.1 | ||||
| 450–750 | 9.4 | 14.5 | 12.1 | ||||
| >750 | 9.4 | 25.8 | 16.5 | ||||
| Occupation [%] | Government | 4.0 | 7.0 | 5.1 | 469 | <0.001 b | |
| Private | 21.9 | 14.5 | 19.2 | ||||
| Entrepreneur | 21.5 | 6.4 | 16.0 | ||||
| Student | 19.2 | 66.3 | 36.5 | ||||
| Housewife | 24.6 | 3.5 | 16.8 | ||||
| Retired | 6.7 | 0.6 | 4.5 | ||||
| Other | 2.0 | 1.7 | 1.9 | ||||
| Building attributes | Homes covered by questionnaire | 155 (54%) | 132 (46%) | 287.0 | |||
| Average age a [years] | 31.7 | 4.5 | 25.2 | 176 | <0.001 a | ||
| Establishment [%] | <5 years | 3.7 | 61.9 | 17.6 | |||
| 5–10 years | 11.9 | 38.1 | 18.2 | ||||
| 11–50 years | 63.4 | 0.0 | 48.3 | ||||
| >50 years | 20.9 | 0.0 | 15.9 | ||||
| No. of windows in master bedroom [%] | 0 | 14.9 | 5.5 | 10.0 | 211 | 0.066 b | |
| 1 | 66.3 | 76.4 | 71.6 | ||||
| >1 | 18.8 | 18.2 | 18.5 | ||||
| No. of windows in living room [%] | 0 | 3.8 | 7.1 | 5.3 | 190 | 0.002 b | |
| 1 | 74.3 | 49.4 | 63.2 | ||||
| >1 | 21.9 | 43.5 | 31.6 | ||||
| HVAC system [%] | AC | 20.9 | 99.2 | 57.6 | 278 | <0.001 b | |
| Ceiling/stand fan | 99.3 | 29.5 | 66.9 | 278 | <0.001 b | ||
| Exhaust fan | 10.6 | 51.6 | 29.9 | 268 | <0.001 b | ||
| Modification(s) | [%] | 71.1 | 25.2 | 50.2 | 279 | <0.001 b | |
| Water leakage | [%] | 69.8 | 27.6 | 50.4 | 276 | <0.001 b | |
| Interior sources | Mold | [%] | 42.4 | 37.0 | 39.9 | 278 | 0.362 b |
| Mite | [%] | 6.0 | 18.1 | 11.5 | 278 | 0.002 b | |
| Mattresses [%] | Kapok | 30.7 | 1.6 | 18.7 | 300 | ||
| Spring bed | 40.9 | 91.9 | 62.0 | ||||
| Sponge | 27.3 | 4.8 | 18.0 | ||||
| Bedclothes [%] | Cotton | 93.5 | 89.7 | 91.8 | 291 | ||
| Silk | 2.6 | 8.1 | 5.2 | ||||
| Furniture (units) | Living room [mean] | 3.8 | 5.1 | 4.4 | 219 | <001 a | |
| Bedroom [mean] | 3.1 | 3.3 | 3.2 | 225 | 0.453 a | ||
| Perceived IAQ | Smell/Odor | [%] | 51.0 | 60.5 | 55.4 | 280 | 0.112 b |
| IAQ [%] | 0–3: (rather) clean | 42.1 | 42.3 | 42.2 | 282 | 0.748 a | |
| 4–6: neutral | 46.7 | 43.8 | 45.4 | ||||
| 7–10: (rather) dirty | 11.2 | 13.8 | 12.4 | ||||
| OAQ [%] | 0–3: (rather) clean | 38.8 | 33.8 | 36.5 | 282 | 0.387 a | |
| 4–6: neutral | 43.4 | 54.6 | 48.6 | ||||
| 7–10: (rather) dirty | 17.8 | 11.5 | 14.9 | ||||
| Humidity [%] | 0–3: (rather) dry | 15.8 | 22.5 | 18.3 | 277 | 0.578 b | |
| 4–6: neutral | 21.5 | 35.3 | 26.5 | ||||
| 7–10: (rather) humid | 13.1 | 15.6 | 14.0 | ||||
| Kampong | Apartment | Total | n | p-Value | ||
|---|---|---|---|---|---|---|
| Asthma | [%] | 12.8 | 17.4 | 14.5 | 469 | 0.168 a |
| Eczema | [%] | 25.3 | 36.0 | 29.3 | 468 | 0.014 a |
| Allergy | [%] | 31.6 | 36.5 | 33.4 | 464 | 0.287 a |
| Stress [mean: 0 = no stress, 10 = very stressful] | 2.1 | 4.3 | 2.9 | 464 | <0.001 b | |
| R = MCS Risk S = Sensitivities f = female m = male | All | Kampongs | Apartments | |||||||
|---|---|---|---|---|---|---|---|---|---|---|
| R | S | R | S | All | Controlling for gender | |||||
| R | S | R | S | |||||||
| f | m | f | m | |||||||
| Personal attributes | ||||||||||
| Age group a | 0.004 | 0.004 | 0.047 | 0.047 | 0.312 | 0.312 | 0.402 | 0.435 | 0.561 | 0.241 |
| Sex a | 0.146 | 0.179 | 0.474 | 0.885 | 0.032 | 0.009 | ||||
| Income b | 0.000 | 0.000 | 0.000 | 0.000 | 0.496 | 0.372 | 0.209 | 0.723 | 0.223 | 0.495 |
| Occupation a | 0.001 | 0.002 | 0.001 | 0.001 | 0.778 | 0.936 | 0.730 | 0.723 | 0.732 | 0.304 |
| Psychology Stress b | 0.000 | 0.000 | 0.000 | 0.000 | 0.004 | 0.000 | 0.031 | .217 | 0.001 | 0.034 |
| Health | ||||||||||
| Asthma a | 0.080 | 0.004 | 0.041 | 0.012 | 0.740 | 0.309 | 0.444 | 0.289 | 0.321 | 0.008 |
| Eczema a | 0.000 | 0.000 | 0.000 | 0.000 | 0.055 | 0.012 | 0.113 | 0.518 | 0.018 | 0.138 |
| Allergy a | 0.007 | 0.003 | 0.031 | 0.053 | 0.117 | 0.076 | 0.302 | 0.205 | 0.193 | 0.541 |
| Masking index | ||||||||||
| Smoking and/or ETS a | 0.004 | 0.001 | 0.022 | 0.201 | 0.488 | 0.126 | 0.865 | 0.516 | 0.750 | 0.277 |
| Fumigation a | 0.257 | 0.239 | 0.947 | 0.535 | 0.015 | 0.108 | 0.371 | 0.004 | 0.531 | 0.002 |
| Exposure other chemicals a | 0.004 | 0.001 | 0.046 | 0.030 | 0.475 | 0.150 | 0.291 | 0.862 | 0.562 | 0.174 |
| Scented products a | 0.052 | 0.079 | 0.472 | 0.722 | 0.682 | 0.394 | 0.551 | 0.924 | 0.436 | 0.229 |
| Fabric Softener a | 0.197 | 0.010 | 0.239 | 0.045 | 0.492 | 0.263 | 0.321 | 0.207 | 0.018 | 0.805 |
| Building attributes | ||||||||||
| Living in home [years] b | 0.000 | 0.000 | 0.405 | 0.804 | 0.474 | 0.701 | 0.663 | 0.187 | 0.246 | 0.081 |
| Windows_masterbedroom b | 0.049 | 0.041 | 0.004 | 0.002 | 0.924 | 0.827 | 0.868 | 0.260 | 0.114 | 0.839 |
| Windows_living room b | 0.000 | 0.000 | 0.000 | 0.000 | 0.280 | 0.077 | 0.173 | 0.670 | 0.558 | 0.891 |
| AC a | 0.000 | 0.000 | 0.007 | 0.000 | 0.608 | 0.147 | - | - | - | - |
| Fan a | 0.001 | 0.001 | 0.509 | 0.351 | 0.526 | 0.716 | - | - | - | - |
| Modifications a | 0.394 | 0.290 | 0.017 | 0.123 | 0.987 | 0.942 | 0.360 | 0.231 | 0.609 | 0.396 |
| Water leakage a | 0.065 | 0.151 | 0.387 | 0.161 | 0.143 | 0.152 | 0.013 | 0.601 | 0.069 | 0.832 |
| Interior | ||||||||||
| Mold a | 0.296 | 0.579 | 0.005 | 0.010 | 0.660 | 0.772 | 0.842 | 0.809 | 0.624 | 0.667 |
| Mite a | 0.007 | 0.030 | 0.921 | 0.919 | 0.107 | 0.238 | 0.263 | 0.064 | 0.718 | 0.224 |
| Furniture_living room b | 0.257 | 0.154 | 0.014 | 0.015 | 0.177 | 0.317 | 0.461 | 0.228 | 0.253 | 0.592 |
| IAQ | ||||||||||
| Smell a | 0.064 | 0.043 | 0.024 | 0.029 | 0.160 | 0.551 | 0.032 | 0.430 | 0.674 | 0.007 |
| IAQ rating b | 0.324 | 0.302 | 0.893 | 0.998 | 0.056 | 0.024 | 0.111 | 0.196 | 0.159 | 0.029 |
| OAQ rating b | 0.027 | 0.022 | 0.089 | 0.106 | 0.148 | 0.095 | 0.057 | 0.906 | 0.135 | 0.399 |
| Behavior | ||||||||||
| Window-opening_bedroom b | 0.000 | 0.001 | 0.416 | 0.696 | 0.063 | 0.141 | 0.341 | 0.926 | 0.121 | 0.522 |
| Window-opening_livingroom b | 0.008 | 0.005 | 0.773 | 0.959 | 0.457 | 0.853 | 0.185 | 0.886 | 0.644 | 0.639 |
| Cleaning of rooms b | 0.000 | 0.000 | 0.012 | 0.001 | 0.060 | 0.354 | 0.922 | 0.031 | 0.658 | 0.681 |
| Cleaning of bathroom b | 0.030 | 0.001 | 0.976 | 0.570 | 0.280 | 0.030 | 0.922 | 0.042 | 0.348 | 0.001 |
© 2019 by the authors. Licensee MDPI, Basel, Switzerland. This article is an open access article distributed under the terms and conditions of the Creative Commons Attribution (CC BY) license (http://creativecommons.org/licenses/by/4.0/).
Share and Cite
Hildebrandt, S.; Kubota, T.; Sani, H.A.; Surahman, U. Indoor Air Quality and Health in Newly Constructed Apartments in Developing Countries: A Case Study of Surabaya, Indonesia. Atmosphere 2019, 10, 182. https://0-doi-org.brum.beds.ac.uk/10.3390/atmos10040182
Hildebrandt S, Kubota T, Sani HA, Surahman U. Indoor Air Quality and Health in Newly Constructed Apartments in Developing Countries: A Case Study of Surabaya, Indonesia. Atmosphere. 2019; 10(4):182. https://0-doi-org.brum.beds.ac.uk/10.3390/atmos10040182
Chicago/Turabian StyleHildebrandt, Sophia, Tetsu Kubota, Hanief Ariefman Sani, and Usep Surahman. 2019. "Indoor Air Quality and Health in Newly Constructed Apartments in Developing Countries: A Case Study of Surabaya, Indonesia" Atmosphere 10, no. 4: 182. https://0-doi-org.brum.beds.ac.uk/10.3390/atmos10040182