Article

Aerosol Optical Thickness over Large Urban Environments of the Arabian Peninsula—Speciation, Variability, and Distributions

by
Dillan Raymond Roshan
1,*,
Muammer Koc
1,
Rima Isaifan
1,2,
Muhammad Zeeshaan Shahid
2,3 and
Christos Fountoukis
1,2,*
1
Division of Sustainable Development (DSD), College of Science and Engineering (CSE), Hamad Bin Khalifa University (HBKU), Qatar Foundation (QF), Education City, Doha 34110, Qatar
2
Qatar Environment and Energy Research Institute, Hamad Bin Khalifa University (HBKU), Qatar Foundation (QF), Education City, Doha 34110, Qatar
3
College of Earth and Environmental Sciences, University of the Punjab, Lahore 54590, Pakistan
*
Authors to whom correspondence should be addressed.
Submission received: 3 April 2019 / Revised: 23 April 2019 / Accepted: 26 April 2019 / Published: 29 April 2019
(This article belongs to the Special Issue Remote Sensing of Aerosols)

Abstract

:
The Arabian Peninsula is one of the world’s largest sources of mineral dust that includes several major population hotspots. However, until now, few studies have performed a comprehensive quantification of the long-term variability of aerosol species in this region. In this study, the speciation, variability, and distribution of aerosol optical depth over the Arabian Peninsula during 2005–2015 is analyzed by using the modern-era retrospective analysis for research and applications, Version 2 (MERRA-2) model together with satellite retrieved data and AERONET observations and focusing on nine large cities in the region (Dammam, Doha, Dubai, Jeddah, Kuwait, Manama, Muscat, Riyadh, and Sanaa). Over the past decade, the mean annual aerosol optical thickness (AOT) values were in the range of 0.3–0.5, which is attributed to both mineral dust (60–70%) and anthropogenic activities (20–30%). An increase in AOT values between 2005 and 2009 is attributed to increased dust generation from the Sahel region in Northern Africa, and the Fertile Crescent (Syria, Iraq, Jordan) due to an extended dry period. Reductions in local urban emissions are still considered to be efficient measures to improve air quality in these population centers despite the significant contribution of desert dust in the total particulate matter levels in the region.

1. Introduction

Aerosols play a major role in regulating global climate by scattering and absorbing radiation, affecting cloud formation and precipitation, and, hence, the earth’s radiation budget [1]. Depending on their chemical composition, they also have negative effects on human health, can affect agricultural yields, and play an important role in transferring nutrients to phytoplankton in the oceans due to their iron (Fe) content [2,3]. Understanding aerosol distribution, speciation, and trends, thus, becomes particularly important on a regional and local scale [1].
Over the previous few decades, several advancements in ground-based and satellite-based measurements have improved the performance of large-scale air quality models and have helped better understand the spatial and temporal variability of aerosols and aerosol optical properties. There are, however, still major assumptions and data variability between multiple data retrieval methods and different modeling platforms.
The Middle East, in particular, is one of the regions that requires additional studies to improve the understanding of the role of aerosols as very few measurement campaigns have been conducted and continuous aerosol observations have been scarce. The Arabian Peninsula is one of the world’s largest sources of mineral dust, and a large emitter of anthropogenic pollution. The region is surrounded by several sources of natural (mineral) dust emissions such as the Sahara Desert to the west, and the Syrian and Iraqi deserts to the North. Al Katheeri et al. [4] used MODIS (moderate resolution imaging spectra radiometer) to analyze the distribution of PM10 (particulate matter with a diameter of 10 µm or less) over the United Arab Emirates (UAE) and showed that elevated levels of PM10 (>1000 μg m−3) observed during the study period of 2007–2009 were associated with regional dust and sand storms that affect the Arabian Gulf. AOT distributions over the Red Sea were analyzed using MODIS for an 11-year period and found July mean AOT at 630 nm between 0.48 and 1.45 on the Southern Red sea, and 0.22–0.66 in the Northern part, while the MODIS results were well correlated with ship-based AERONET measurements [5]. Correlations were found using AERONET, MODIS, and MISR when dust storms were analyzed in 2008, 2009, and 2012 [6]. While the Arabian Peninsula in general is loosely populated, its major cities are dense population hotspots, with several metropolitan areas with populations over a million people. Therefore, the study of aerosol properties over these population centers becomes particularly important from a human health perspective. To date, there has not been an adequate number of studies to assess the seasonal (monthly) and annual (and inter-annual) variation in aerosol loading of dust, sulfate, sea salt, and carbonaceous aerosols over the large population centers of the Arabian Peninsula. Moreover, tools to monitor aerosol properties such as ground-based AERONET stations are limited, especially when looking into long-term periods of several years. One of them is located at Solar Village, Saudi Arabia (24.907° N, 54.617° E) with data available from 1999, and the other in Mezaira, UAE. (23.105° N, 55.755° E), with data available from 2004 [5,7]. It is also noteworthy that within the Arabian Peninsula, the eastern region of the Peninsula has not been studied much compared to the western region [3,8,9], even though previous studies have shown that the eastern part receives more frequent dust outbreaks and is affected by more intense industrial pollution [5,10,11,12].
This study presents an integrated analysis of the aerosol optical thickness (AOT) at 550 nm wavelength and total extinction (scattering and absorption) of five major aerosol species in nine major population centers in the region—Dammam, Doha, Dubai, Kuwait, Jeddah, Manama, Muscat, Riyadh, and Sanaa—for an 11-year period 2005–2015 using NASA’s MERRA-2 model (modern-era retrospective analysis for research and applications, Version 2). The AOT parameter is chosen as opposed to other optical properties as it is frequently recorded by satellites, is used as the basis in a number of relevant atmospheric aerosol studies, and provides a comprehensive representation of the aerosol’s impact on the radiation budget [13]. The modeling data was compared with NASA’s MODIS satellite data, and with two ground-based AERONET stations in the region, in Solar Village, Saudi Arabia, and Mezaira, UAE, as well as with existing literature on aerosol trends in the region.
To the best of our knowledge, the present study is the first that combines (i) an analysis of AOT trends of aerosol speciation in nine of the most populated cities in the Arabian Peninsula, (ii) the utilization of a decade-long distribution of the aerosol optical thickness to identify the monthly and seasonal variability of the aerosols over these cities, and (iii) a comparison of the aerosol properties in cities on the eastern coast of the Arabian Peninsula with those on its western coast.

2. Methodology

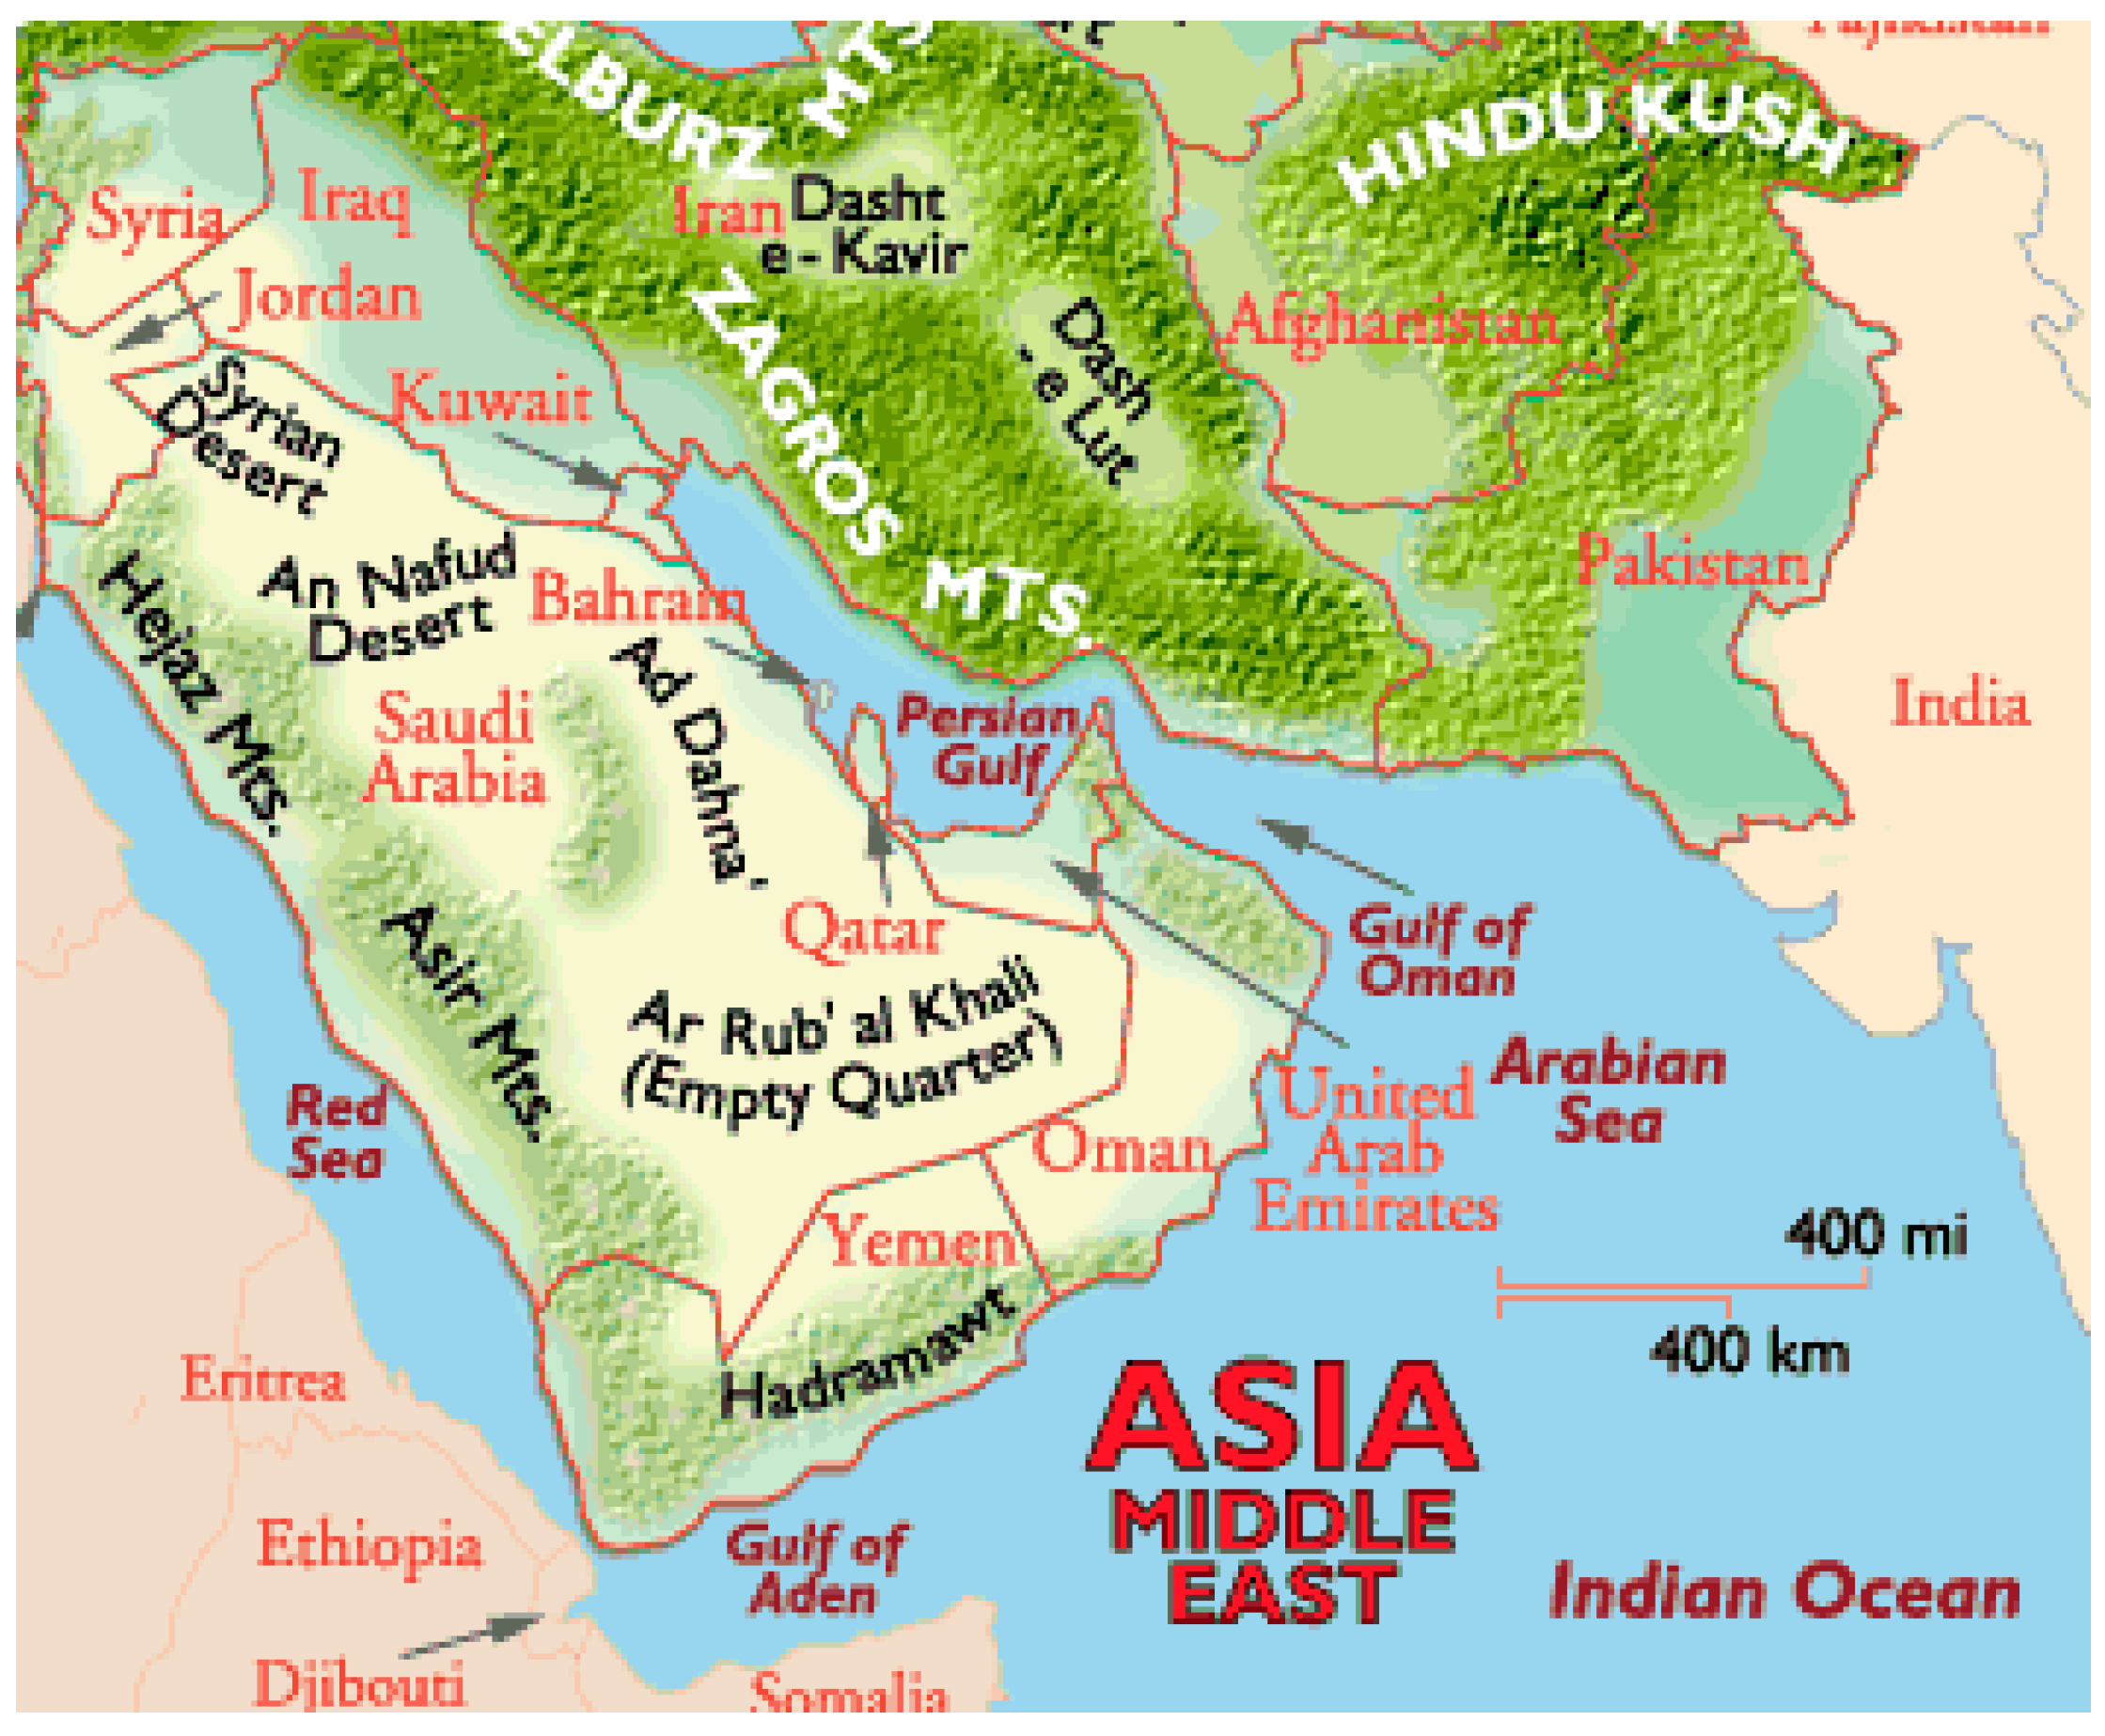
2.1. Review of the Climatology of the Arabian Peninsula

The Arabian Peninsula has an arid climate, with dry and hot summers, limited precipitation occurring mostly during the winter months (less than 150 mm of rainfall in the region on average per year) [14]. As a result of the high temperatures and reduced precipitation, the Arabian Peninsula region has sustained periods of low pressure which drives winds predominantly from the west (Northern Africa), the North-West (Mediterranean), and the North (Iraqi and Syrian deserts). As the region’s land is mostly desert, the prevailing wind patterns pick up dust that can be transported into population centers of the Arabian Peninsula increasing their total aerosol mass. Wind also transports sea salt particles across the region, from the water bodies that surround it such as the Red Sea, the Arabian Gulf, and the Mediterranean. In Kuwait, lower wind speeds in winter were responsible for reduced re-suspended dust concentrations [15]. In a study of wind patterns over the UAE, using ground stations and radiosonde data, northwesterly winds of about 3 m/s over the Arabian Peninsula were found to be prominent during the summer months due to the southwest Indian monsoon and the presence of a low pressure region over the Arabian Peninsula [16].
The AOT over the Arabian Peninsula are affected by annual meteorological activities such as the Shamal winds, and multi-decadal global weather patterns such as the El Nino Southern Oscillation, the Pacific Decadal oscillation, and the weather patterns over the Mediterranean. The main sources of dust transport are the summer and winter Shamal winds. During summer, a belt of low pressure known as the Inter Tropical Convergence Zone (ITCZ) develops over the Arabian Peninsula creating wind patterns, the summer Shamal, that blow over dusty regions of the Rub Al Kahli, Ad Dahna, and An Nafud deserts, picking up and transporting dust towards the Arabian Gulf [2]. These winds are also complemented by the dusty winds originating from Northern Africa. The spring and summer months are thus particularly dusty for the region [10,17]. During winter, the shift of the ITCZ below the equator, develops high pressure over the Mediterranean, which blows north westerly winds, the winter Shamal, which flows across the Arabian Peninsula from north western Saudi Arabia, and the Fertile Crescent regions of Syria, Jordan, and Iraq, towards the Arabian Gulf and the Indian Ocean [18]. These wind streams are associated with a cold front triggering thunderstorms and gale force winds. The winter Shamal is a significant dust carrier but not as strong or as long-lasting as the summer Shamal [19].
In addition to the annual meteorological activity, multi-decadal global weather activity also affects the region’s climate and aerosol loading. The El Nino Southern Oscillation (ENSO) affects global weather and rainfall circulation and leads to relatively wetter than usual weather during El Nino years and relatively drier than usual weather during La Nina years. A study on the relationship of ENSO with the rainfall patterns over the Arabian Peninsula showed that rainfall in the region increases during El Nino periods while drought increases during La Nina periods [20]. An increasing trend in dust activity over the region is due to drought conditions in the semi-arid regions of Syria and Iraq, aggravated by extended La Nina period over the region [2]. La Nina-induced changes of divergence of moisture and advection of dry air lead to anomalous circulations that enhance drought conditions [21]. The Pacific Decadal Oscillation (PDO) is a similar phenomenon to the ENSO but occurs over a larger period, usually 20–30 years. It has a positive phase, similar to the El Nino, and a negative phase, similar to La Nina. Over the Middle East, an extended period of La Nina, which coincided with the negative phase of the PDO, aggravated drought conditions leading to increased dust levels in the region.
The Mediterranean Sea surface temperature also plays a role in the air quality patterns of the Arabian Peninsula. An increase in the Mediterranean Sea surface temperature is associated with a reduction in Shamal winds and reduced dust activity in the Arabian Peninsula [2]. The formation of circulations moves the North African monsoon rain belt northward [22], limiting drying and consequent dust generation from the dust source regions in Northern Africa. The increased precipitation that advects into the Arabian Peninsula [23] leads to an increase in vegetation in northern Arabian Peninsula, which reduces dust flow southward from the Syrian and Iraqi deserts.

2.2. Region of Interest

The study area consists of 9 major population centers in the Arabian Peninsula, namely Dammam, Doha, Dubai, Kuwait, Jeddah, Manama, Muscat, Riyadh, and Sanaa and the period of study includes an 11-year period (2005–2015).

2.2.1. Topography of the Study Area

Figure 1 shows some of the key topographic features that play a key role in the distribution of aerosol properties in the region, such as:
  • Asir and Hejaz mountain ranges: They run along the western edge of Saudi Arabia, and Yemen, parallel to the Red sea. Their height ranges from 1800 m to 2100 m.
  • Hadramawt mountain range: Low mountain range along Yemen with an average height of 1000 m.
  • Zagros mountain range: Runs along western and south western Iran. One of the highest peaks in the region with many peaks exceeding 2700 m.
  • Rub al Khali desert (Saudi Arabia): Also known as the Empty Quarter, this desert is the world’s largest sand-only desert. The northern expanse of this desert is called the Ad Dahna desert and connects to An Nafud desert.
  • An Nafud desert: This desert is in north western Saudi Arabia.
  • Syrian Desert: Approximately 518,000 km2, is an arid region that extends through Syria, Jordan, Saudi Arabia, and western Iraq.
  • Fertile Crescent: An ancient term given to the area with the largest cultivated areas in the region north of the Syrian desert extending from Syria, Jordan, and Iraq, down along the Tigris and Euphrates river valleys of Iraq. This region has been subjected to extended drought periods from 2008, and due to reduced soil moisture, is the largest sources of Aeolian dust in the Arabian Gulf.
Table 1 shows the location coordinates used for retrieving the data from MERRA-2.

2.2.2. Overview of Aerosol Speciation over the Study Area

Dust

Dust is a significant contributor to total aerosol mass in the region with the Arabian Peninsula being one of the largest dust source regions, as part of the global dust belt. Most of the smaller dust particles (less than 60 μm) arise from western Iraq, northern Jordan, and eastern Syria. Larger sized particles (150 µm to 300 µm in diameter) are frequent but are not transported by suspension in storm winds as they rarely reach above 15 m in altitude, and instead are transported by saltation and some by surface creep. Most of these larger particles originate from the dust storms from Rub Al Khali and Iraqi deserts [24]. In general, dust activity peaks in April–June in Northern and central Arabian Peninsula, and during February–March, and July–August over the south western Arabian Peninsula due to the Sahara dust flows [3].

Sulfate

Sulfate is the predominant aerosol of anthropogenic origin in the region from fossil fuel emissions such as power plants, desalination plants, flares from oil and gas production platforms, and vehicular emissions. The Arabian Peninsula, by virtue of its location is surrounded by the heavy shipping route along the Red sea on the west, and the Strait of Hormuz and the Arabian Gulf on the east. Ships plying along these routes are significant sources of sulfate [25,26]. Volcanic activity is another significant source of sulfate emissions, especially with the recent activity over the last decade, which has been the first in over a century [27].

Sea Salt

Sea salt spray is emitted from the open sea, at the surf zone on the coast, and by wave breaking at high wind speeds of 3 to 4 ms−1 and higher [28]. Sea spray aerosols are produced as a film and jet droplets when bubbles entrained in water by breaking waves, disrupt the sea surface [28]. Sea Salt spray emissions are prevalent during the summer time with high sea surface temperatures [29] in the Arabian Peninsula. In the summer time, the monsoon winds carry a significant amount of sea salt towards the peninsula from the Indian Ocean and the Arabian Gulf [29]. Currently there are limited studies of the impact of sea salt on the weather in the Arabian Peninsula.

Organic Carbon and Black Carbon

In the Arabian Peninsula, due to the absence of vegetation and biomass, anthropogenic sources play a dominant role in emissions of organic and black carbon [14]. Automobile emissions, road and tire wear, resuspension of dust and emissions from heavy industries in the region such as oil and gas powered power plants, petrochemicals processing plants, desalination plants, cement, steel, aluminum, and fertilizer plants, are some of the major anthropogenic activities emitting organic and black carbon [14,30,31].

2.3. Research Tools

In the present work, aerosol optical properties are primarily inferred from three sources; ground-based sun photometer network known as the aerosol robotic network (AERONET), imaging spectra radiometer (MODIS) installed on NASA satellites Terra and Aqua, and finally NASA’s MERRA (version 2) model.
The aerosol robotic network (AERONET) includes a series of ground-based sky radiometers and sun photometers that measure aerosol optical properties [6]. It started in 1993 and has quickly grown to include over 300 sites around the world [32]. However, in the Arabian Peninsula, there are currently only two AERONET stations (one in Solar Village, Saudi Arabia, and the other in Mezaira, UAE) that provide data over the study period of 2005–2015 [5,7]. AERONET stations provide column-integrated aerosol optical properties at eight different wavelengths (340, 380, 440, 500, 675, 870, 940, and 1020 nm) and have been primarily used to validate satellites and large-scale models [33]. The AERONET sun photometers utilize 340–1020 nm and 440–1020 nm spectral ranges for direct sun and diffuse sky radiances, respectively. The AOT values from AERONET are with ±0.01 uncertainty for wavelength >440 nm and ±0.02 for shorter wavelengths [6]. AERONET algorithms have recently been upgraded to Version 3, with real-time quality screening for clouds, and a quicker processing of AOT data [34]. AERONET data products for the present study were downloaded from http://aeronet.gsfc.nasa.gov.
NASA’s MODIS instrument is the most commonly used source of satellite data for air quality studies. It observes spectral radiance across 36 spectral bands (from 440 nm to 14,200 nm) [33]. It was launched by NASA in 1999 on board of the Terra satellite, and another one in 2002 on board of the Aqua satellite and has its algorithms repeatedly updated. MODIS provides spatial resolution of 250 m, 500 m, and 1 km. A ± 55° scanning pattern of the earth observing satellite (EOS) orbit at 705 km altitude achieves a 2,330 km swath and provides global coverage every 1 to 2 days. The MODIS daily Level-2 (quality and cloud-screened) AOT data are produced at the spatial resolution of a 10 km × 10 km [35]. To maximize the observation coverage, AOT retrievals over land and sea are derived from the dark target algorithm [36] and the deep blue algorithm (measurements over bright surfaces such as deserts and urban areas), respectively. Over land, the MODIS uncertainty in AOT is 0.05 ± 0.15 [6].
Pollutant transport models such as MERRA-2 are often used to investigate the distribution of gaseous and aerosol species in large areas. MERRA-2 replaced the original MERRA model by using an upgraded version of the Goddard earth observing system model, Version 5 data assimilation system produced by NASA’s GMAO (global modeling and assimilation office). Aerosols in MERRA-2 are simulated by using the Goddard chemistry, aerosol, radiation, and transport model (GOCART) [32]. The model has a horizontal resolution of 2° latitude by 2.5° longitude and 20–30 vertical sigma layers and uses the Goddard earth observing system data assimilation system (GEOS DAS) assimilated meteorological data [33]. These modeled data are constrained by meteorological observations, with extensive prognostic and diagnostic fields such as winds, pressure, convective cloud mass flux, temperature, specific humidity, boundary layer depth, precipitation, surface winds, and surface wetness [33].

3. Results

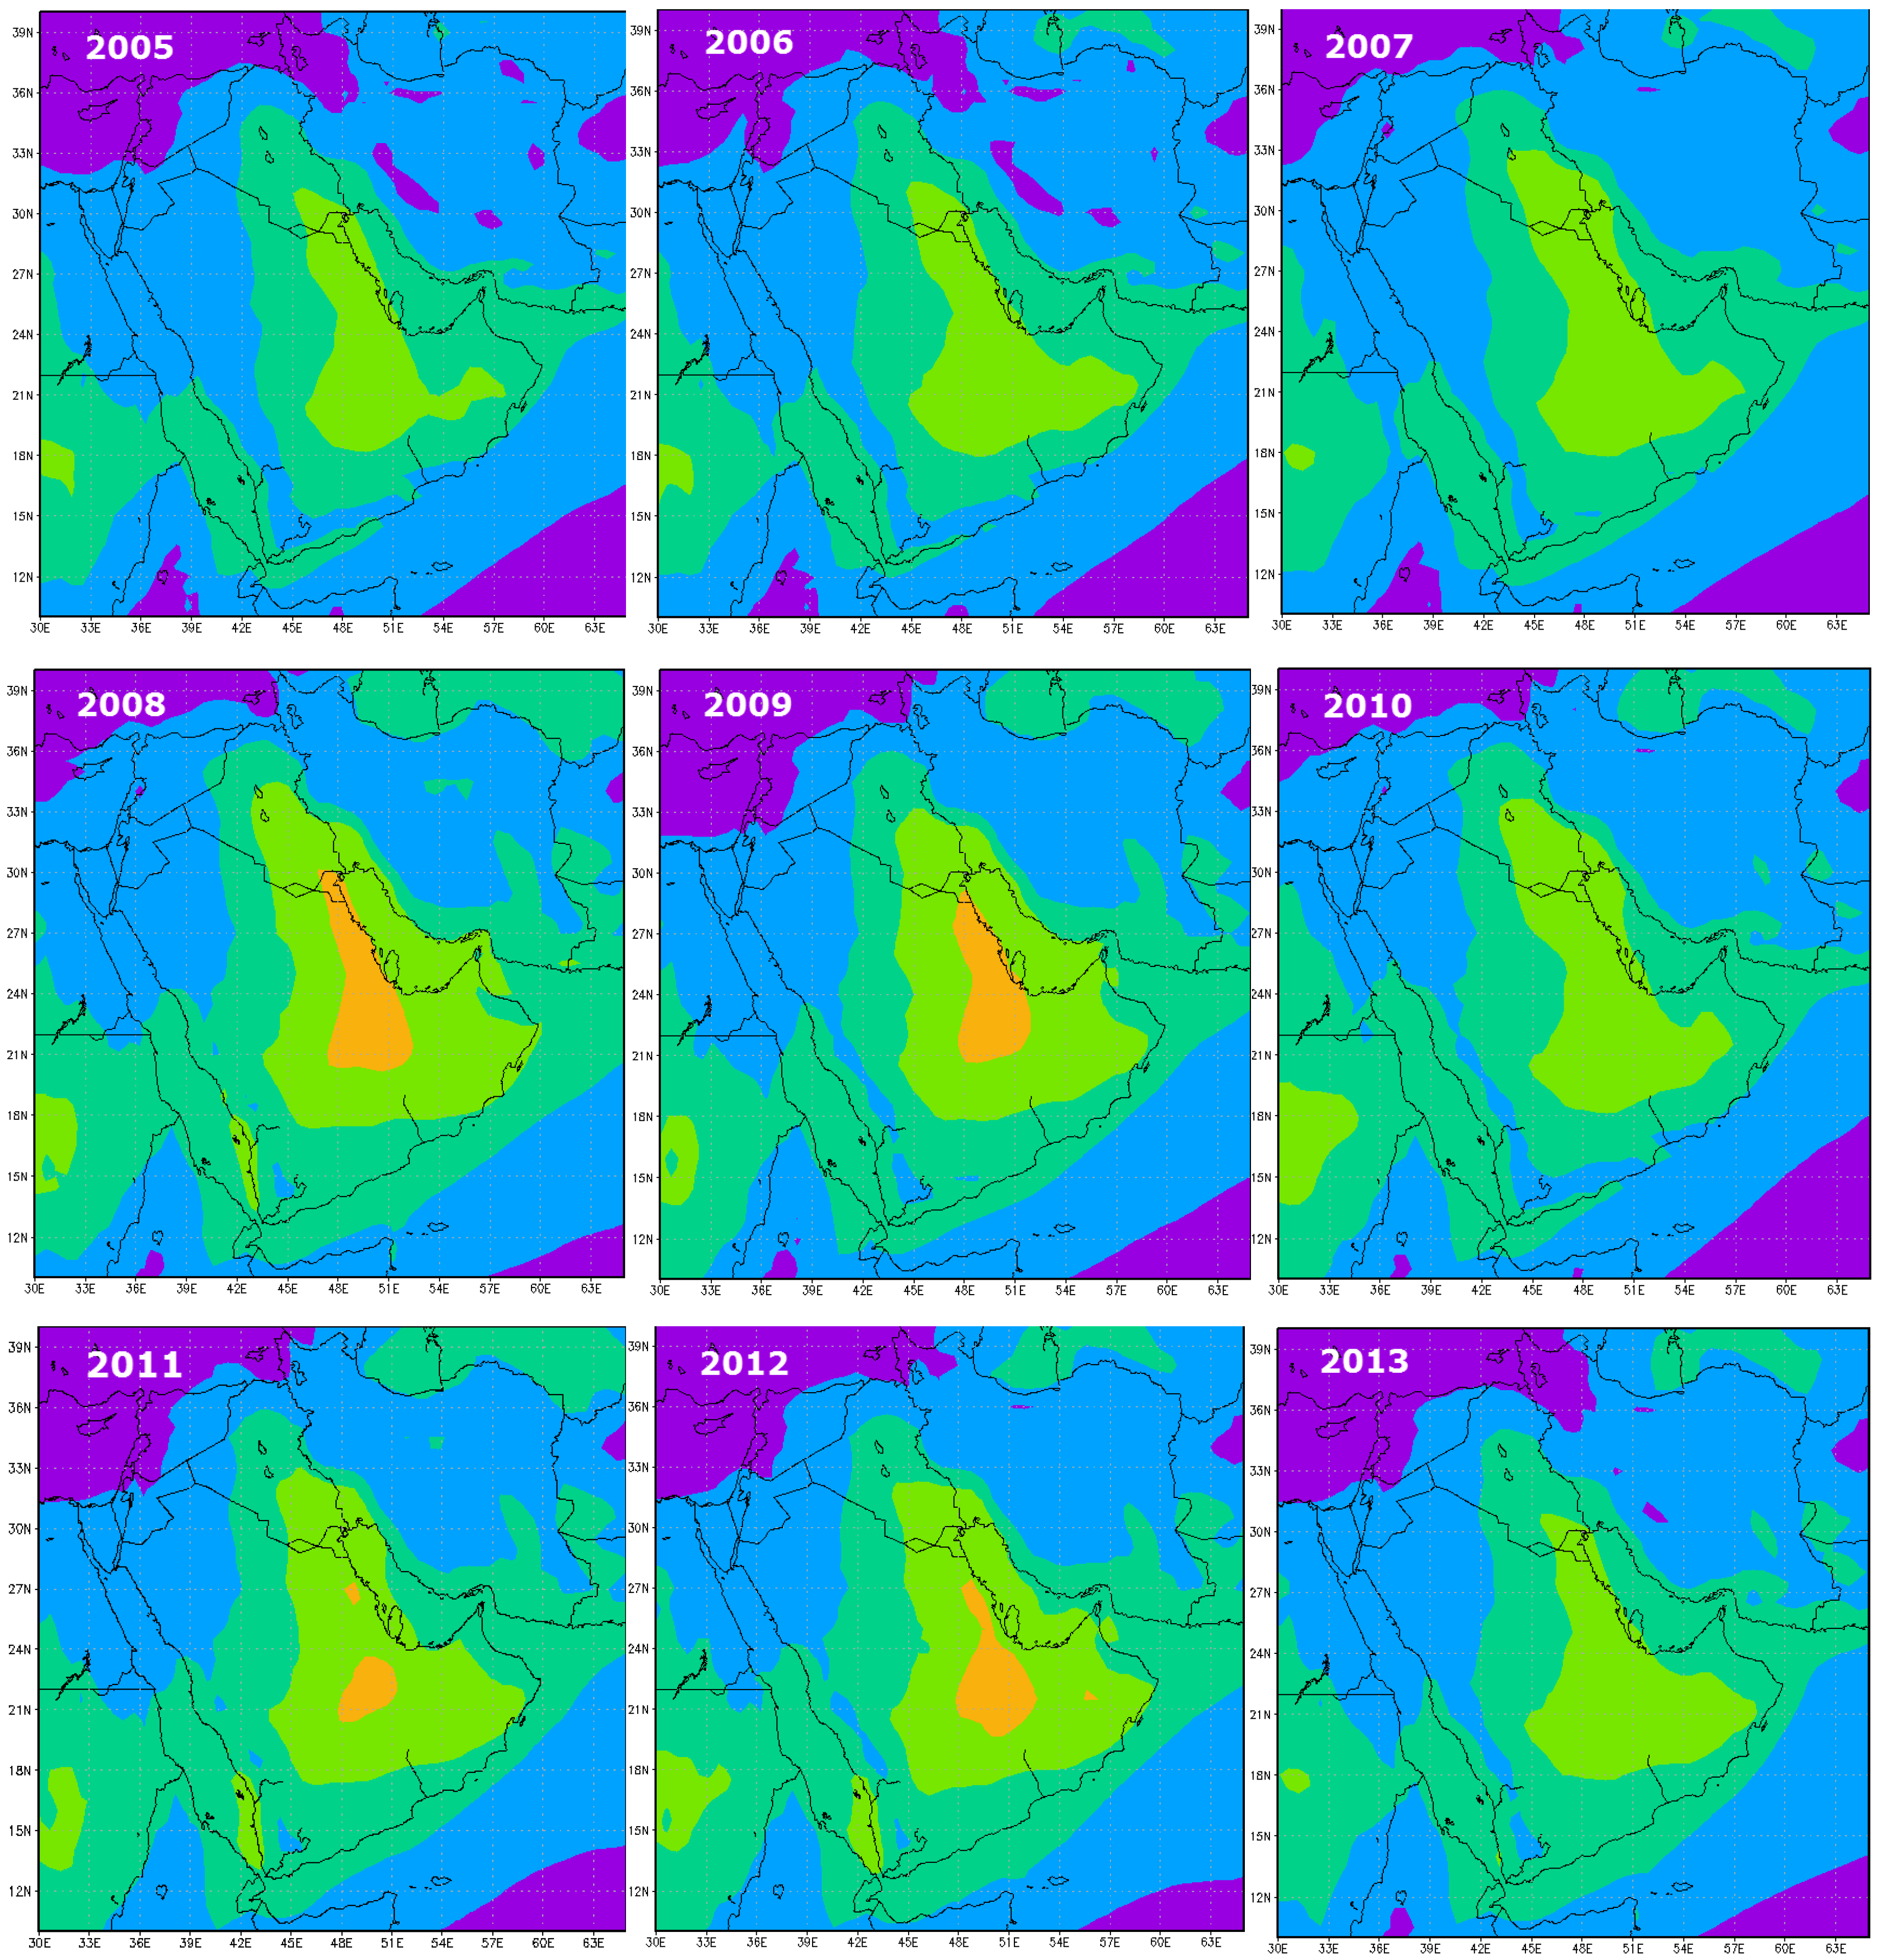
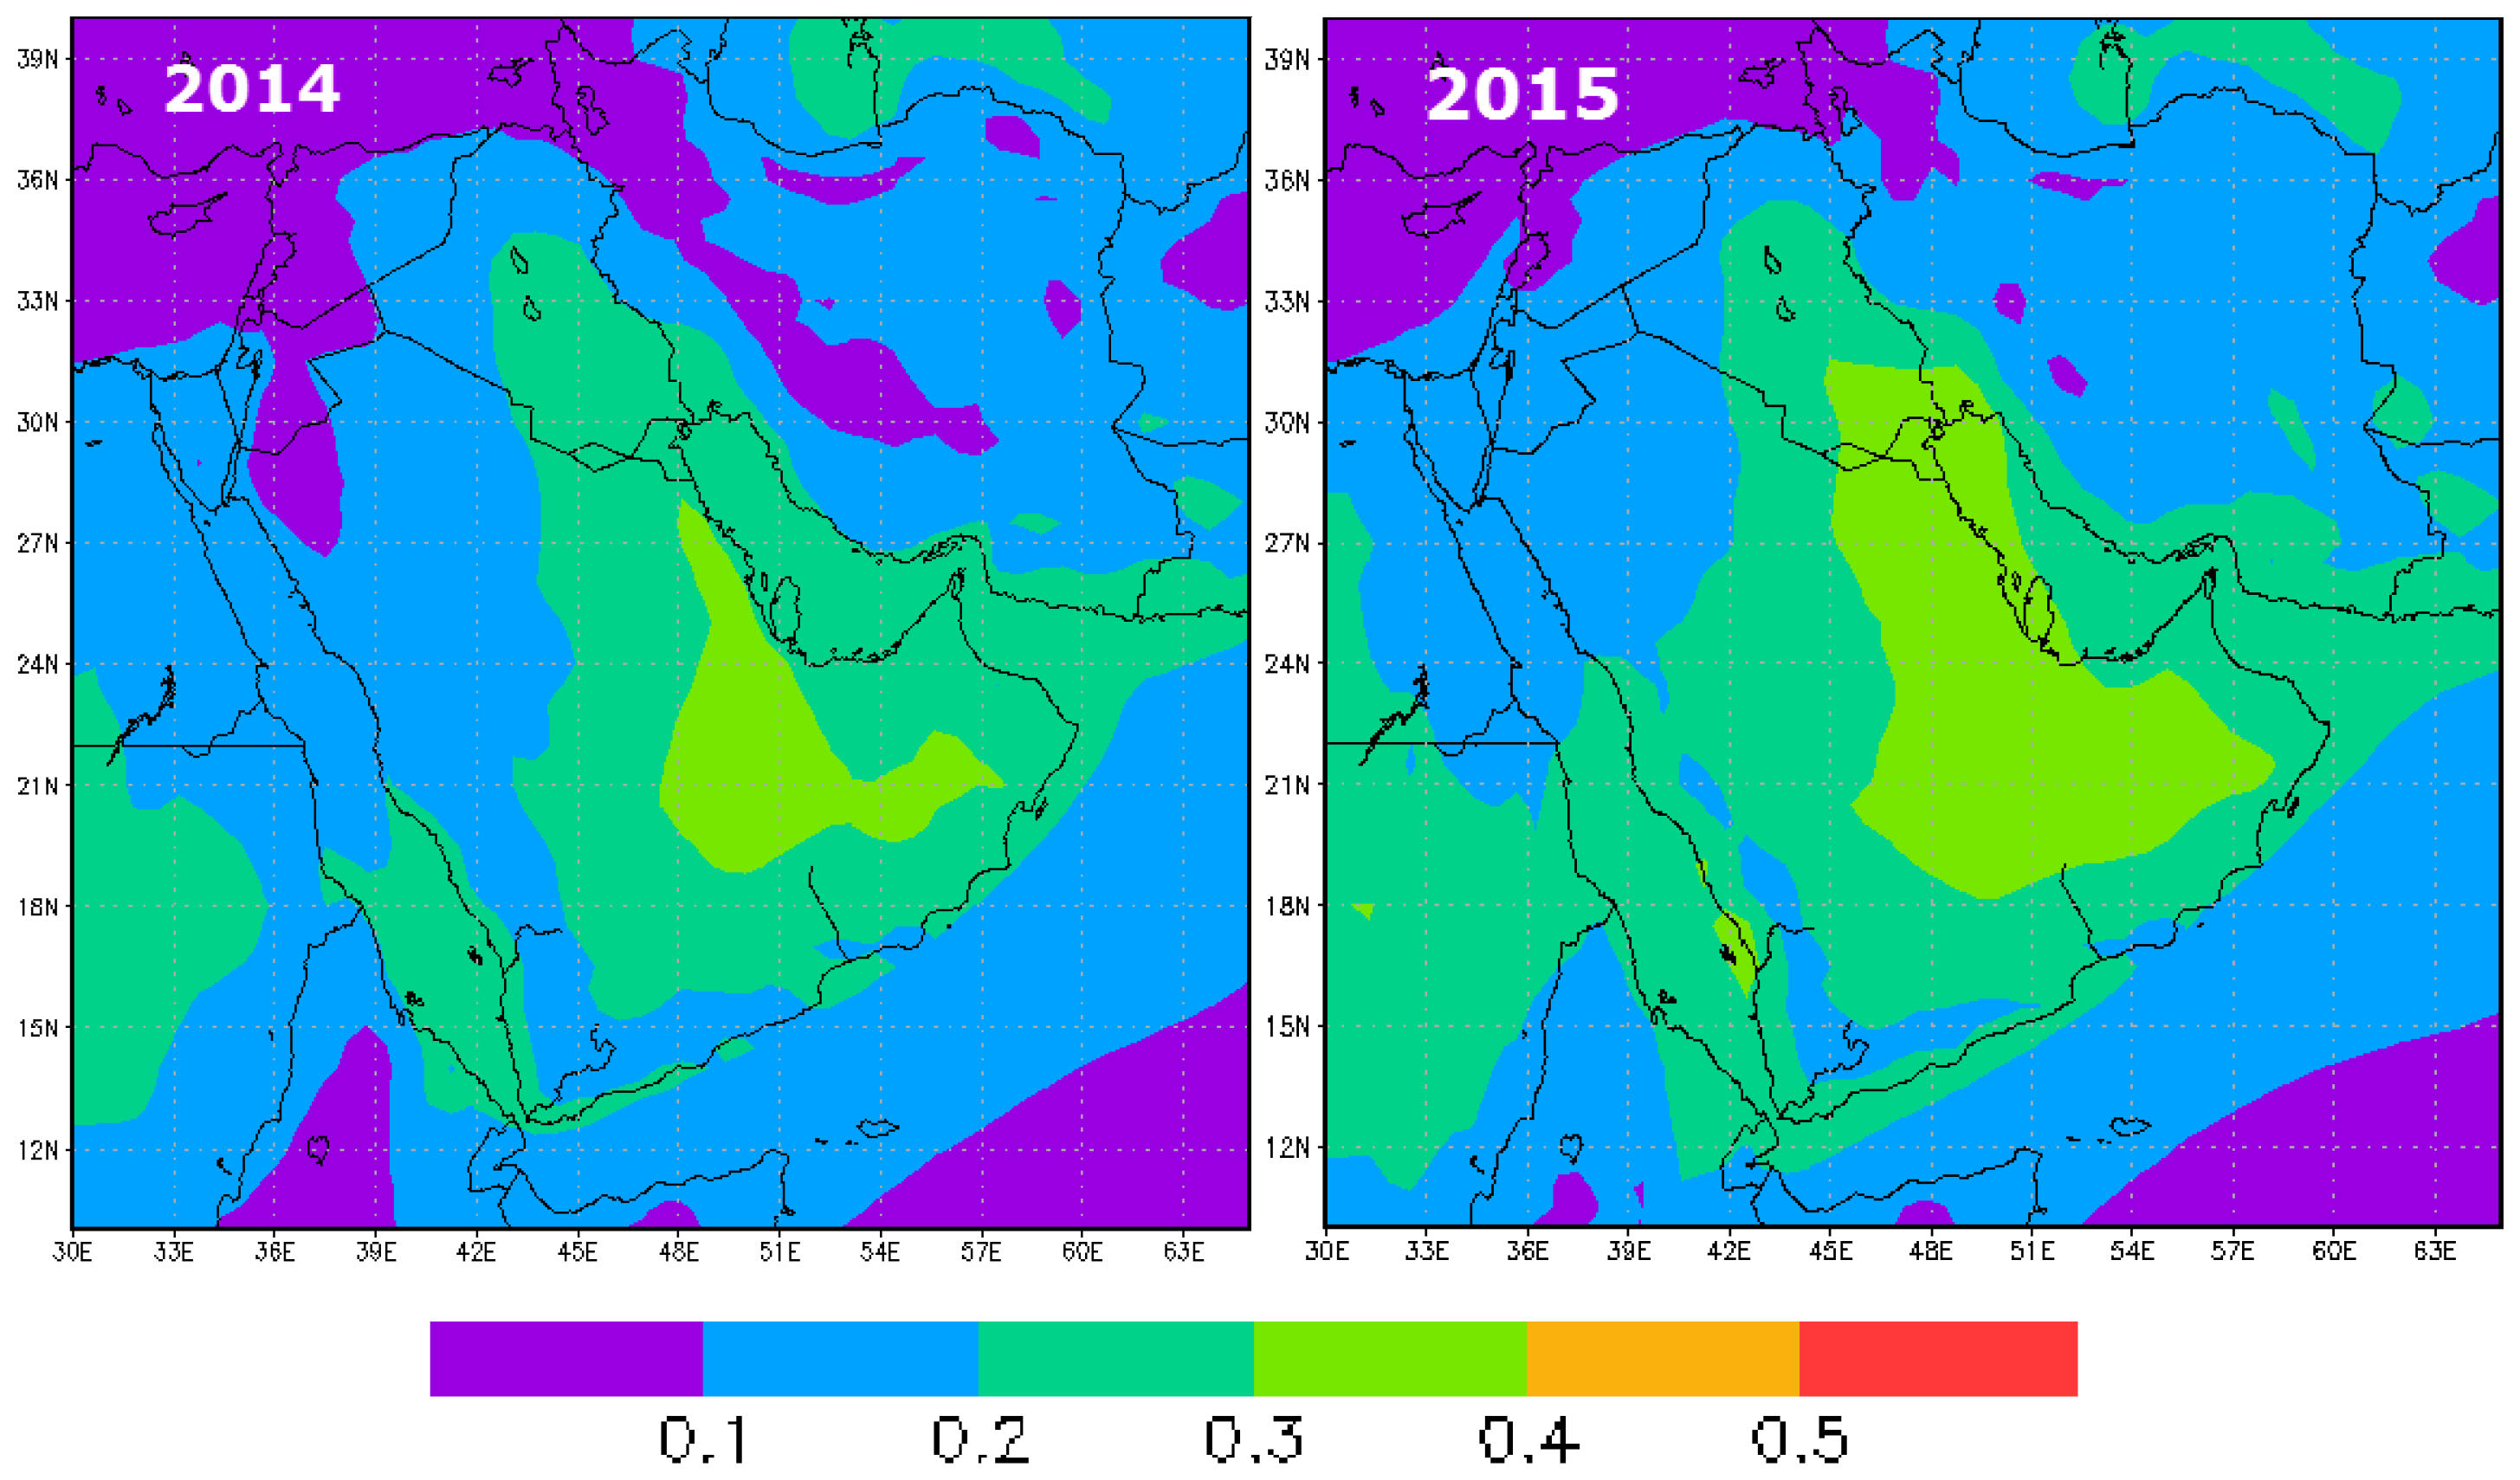
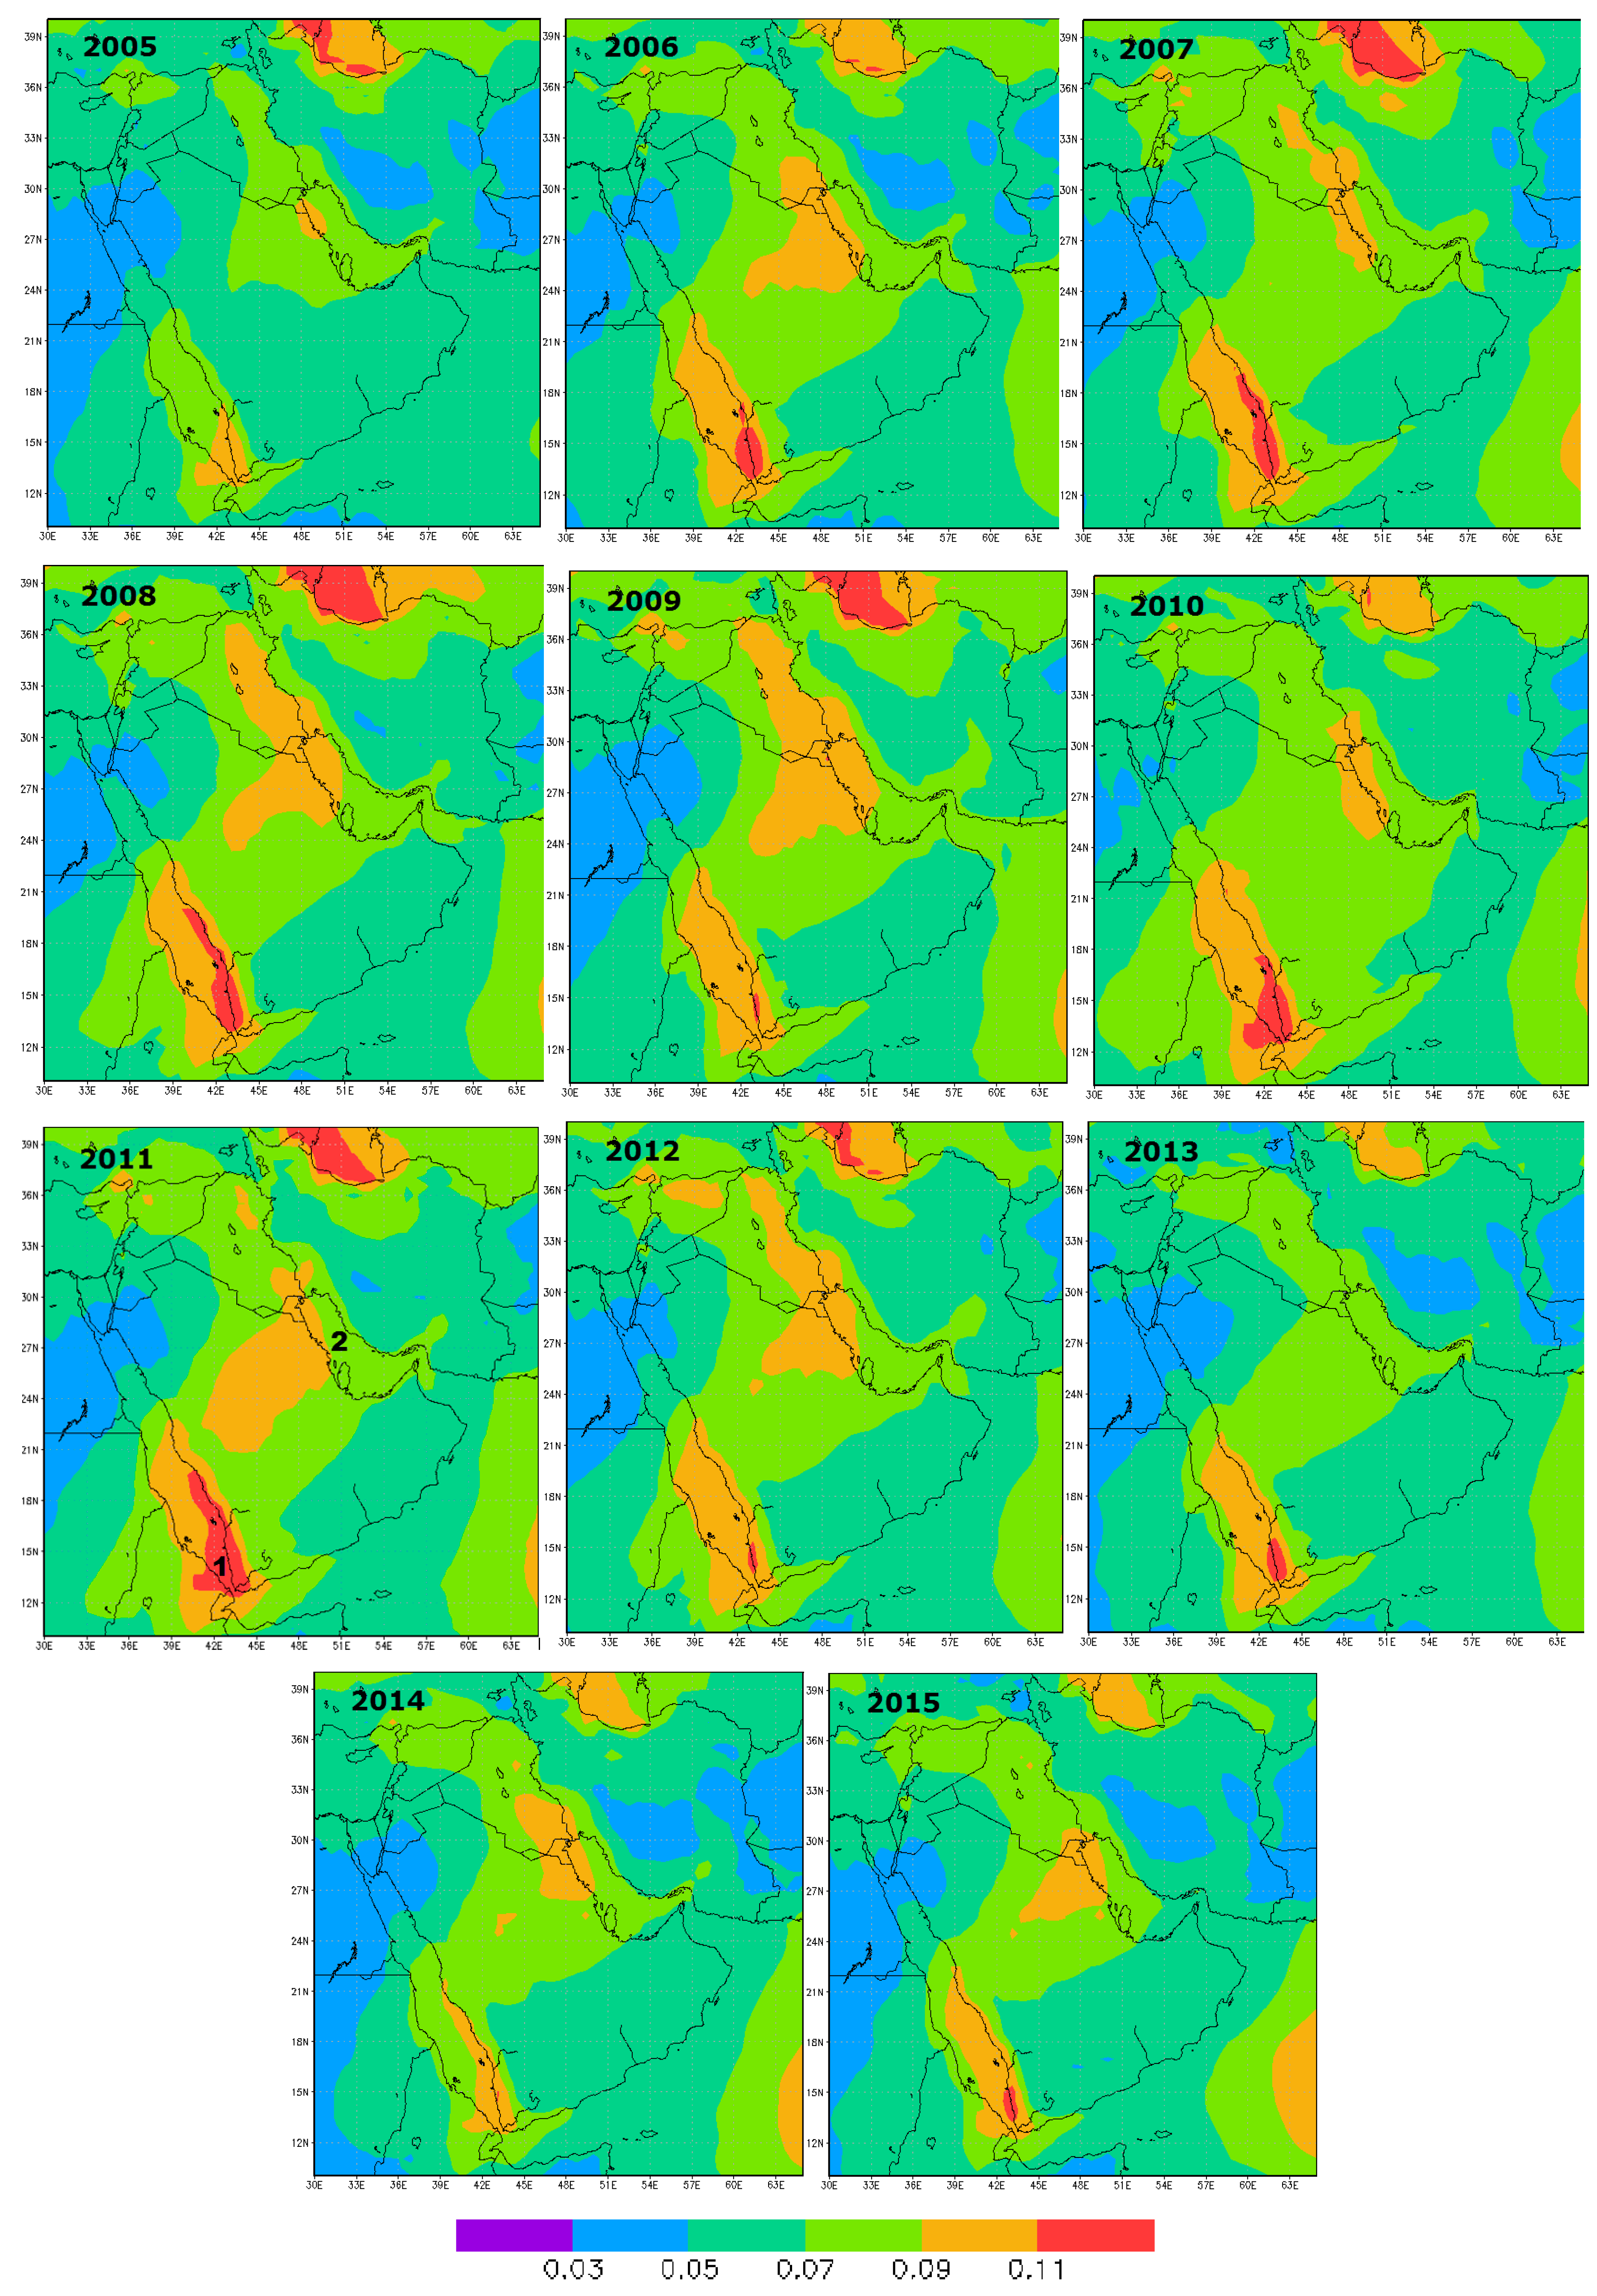
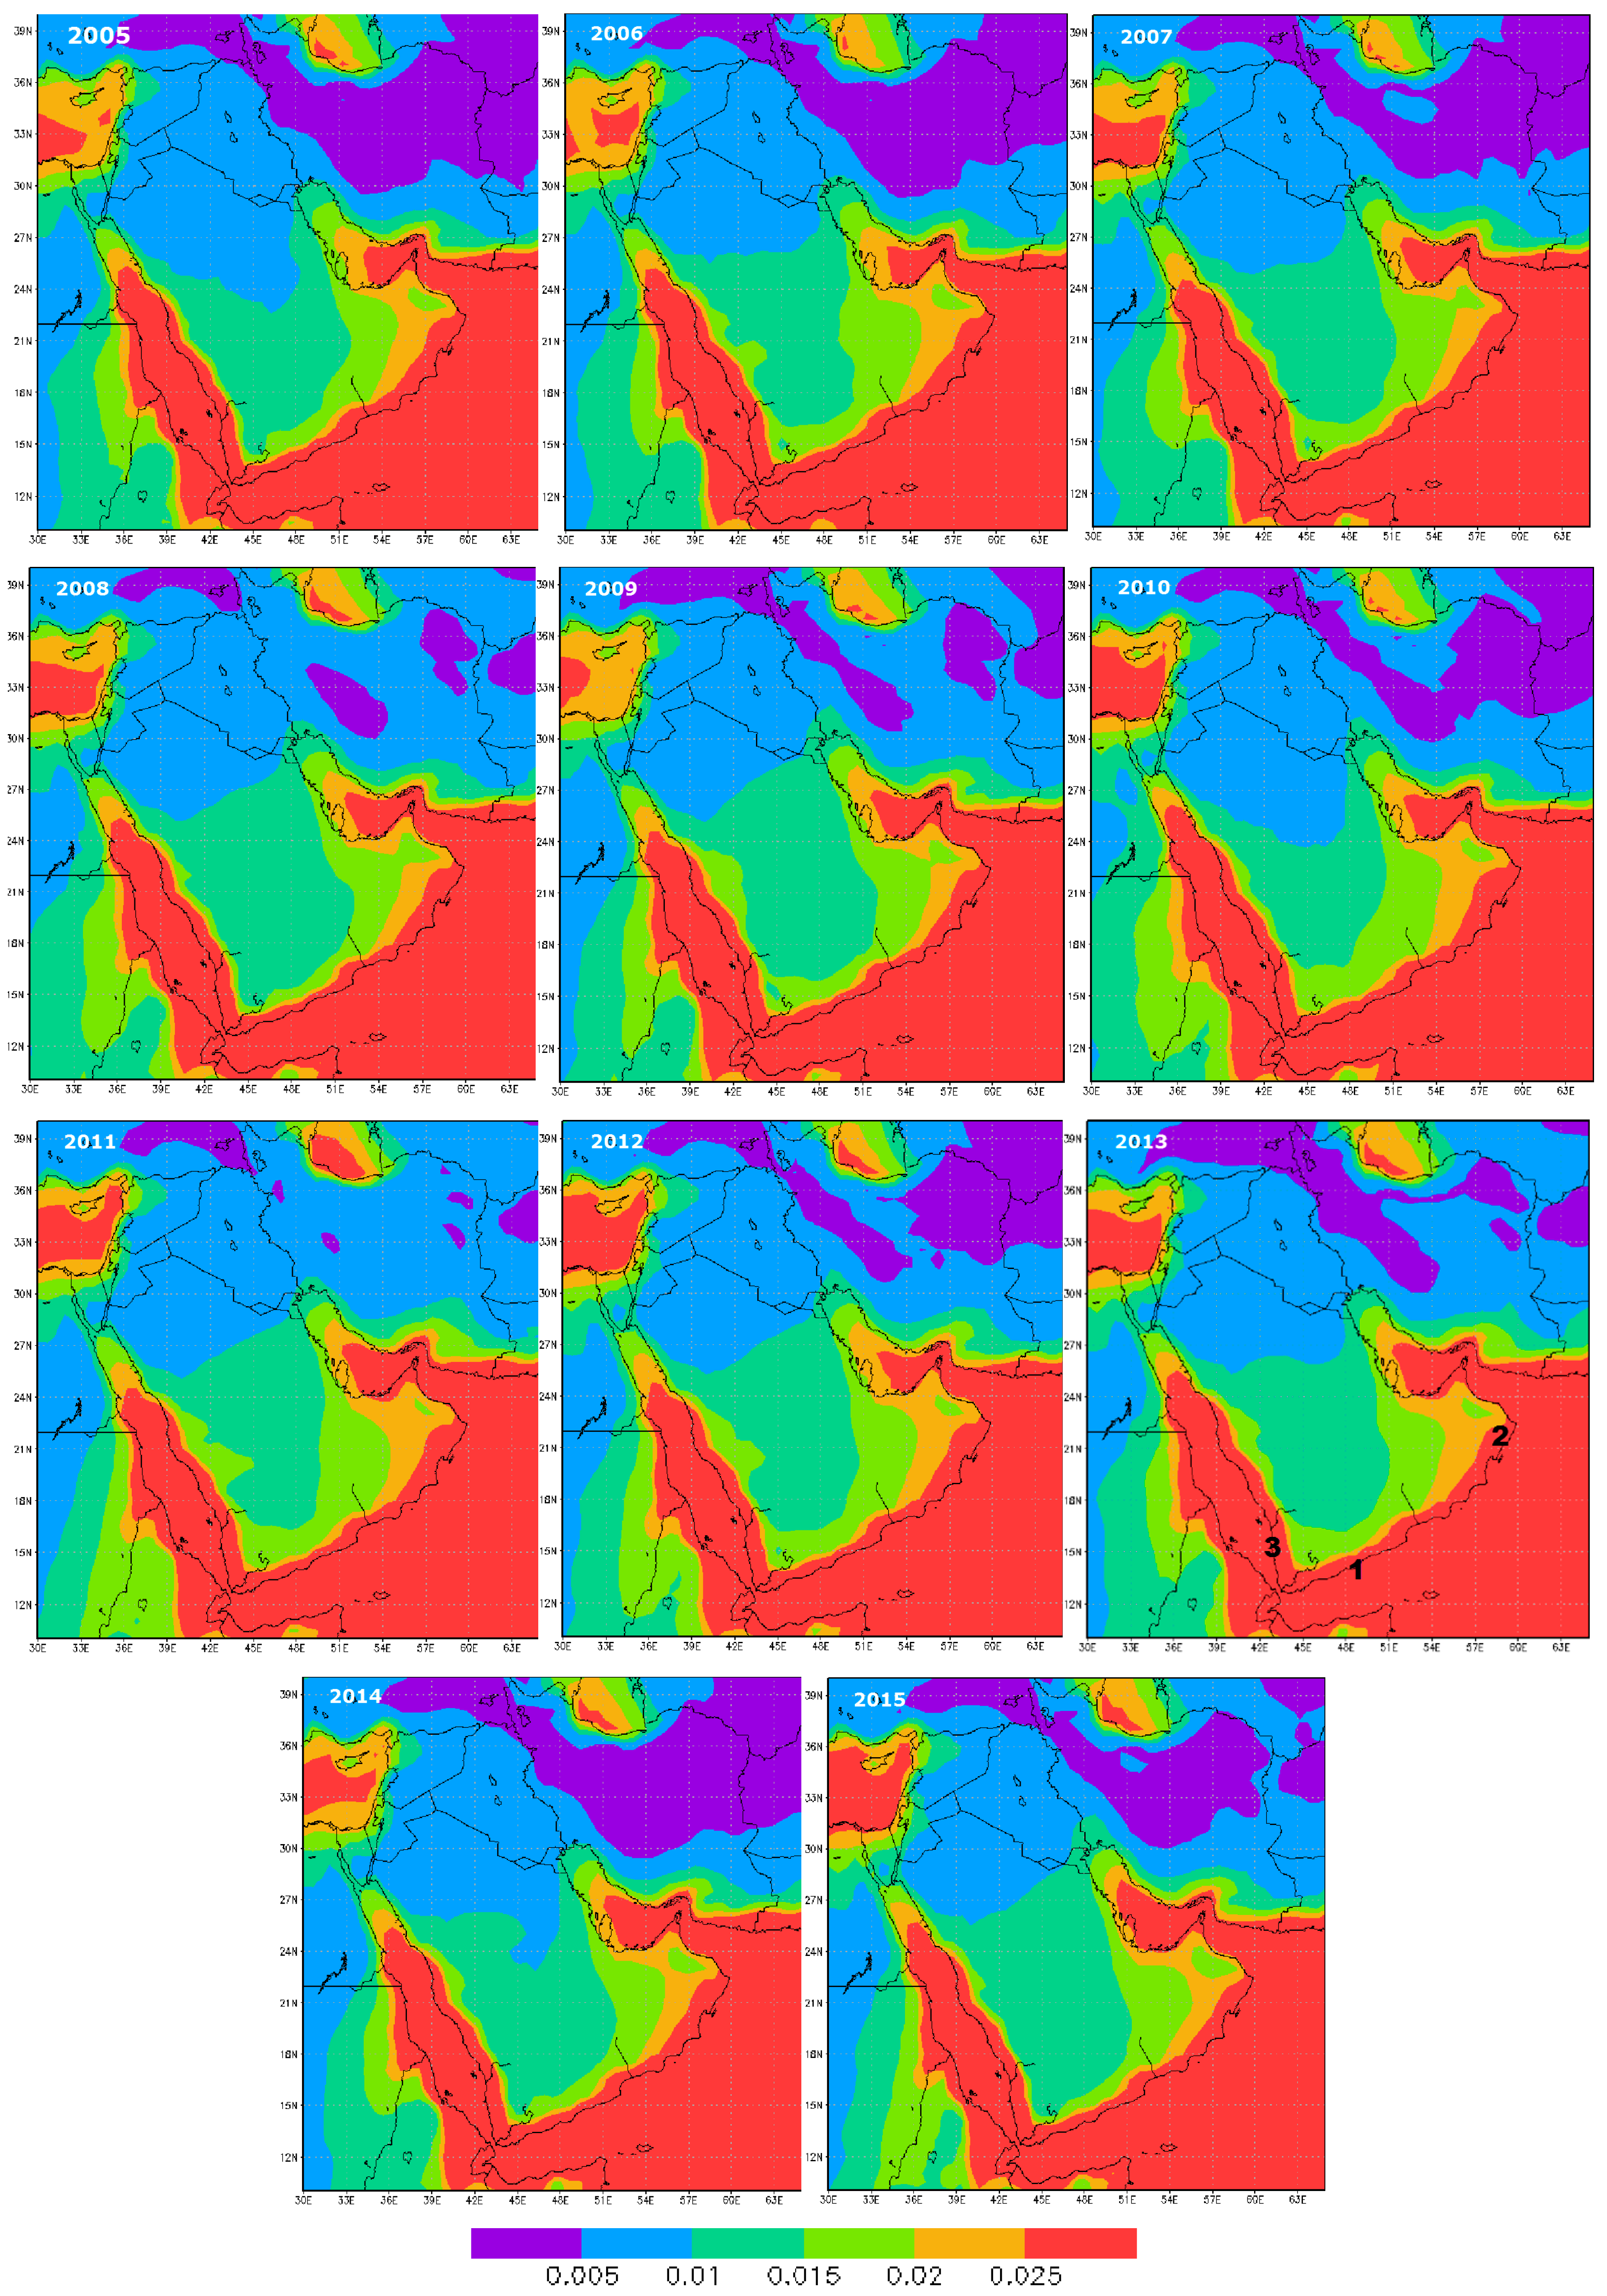
3.1. AOT Distribution over the Arabian Peninsula

Figure 2 shows the inter-annual spatial variability of dust AOT over the region of interest. The years 2008, 2009, and 2012 witnessed the highest dust AOT in the region. These results are in agreement with the studies by Yu et al. and Klingmüller et al. [2,37] that showed that in 2008 and 2009, there was a regime shift in dust generation with excess dust being generated from the Fertile Crescent region, which had been in an extended drought period since 2005. In 2012, the region experienced one of the largest sandstorms in March of that year affecting Iran, Kuwait, Iraq, the Rub Al Khali desert, UAE, Oman, and Yemen [3]. During this 11-year period of the simulation, about 20% of the Middle Eastern area was affected by 20 dust plumes annually [3,10,17]. Assuming a dust deposition of 1.2 metric tons of dust per storm, the annual dust deposition in the Middle East over this period can be estimated at 24 Mt [3].
Dust distribution across the Arabian Peninsula is the highest over the Arabian Gulf with the highest average annual AOT estimated in Dammam, Doha, Kuwait, and Manama. These cities are located downstream of the winds that blow over the Arabian Peninsula, the North Westerly winds (Shamal) that scoop up dust from the Fertile Crescent region of Iraq and Syria, and Saudi Arabian deserts, and blow across this region towards the Arabian Gulf [3,5]. The Asir Mountains in south-western Saudi Arabia, parallel to the Red Sea, play a significant role in the dust distribution over the Arabian Peninsula. Due to their height, they increase the dust load blowing over and to the east of the mountains into the Arabian Peninsula. The planetary boundary layer (PBL) is usually about 3 km, however it increases above the mountains as the higher altitudes heats the atmosphere at higher elevations and thereby, increasing the height of PBL, projecting dust into the free-moving troposphere, which then spreads towards the eastern part of the Arabian Peninsula [3]. Due to this movement of the dust across the mountains, higher dust AOT is observed in the leeward side of the mountains, while the mountain regions themselves bypass the dust, thereby resulting in the observed lower AOT values of 0.1–0.2 on average over this region (Figure 2). For the northwestern part of the Arabian Peninsula, the dust AOT is less as this is the green-belt part of the region and vegetation helps limit the dust erosion process [38]. Most of the dust that blows into the Arabian Gulf is limited to within the gulf due to the presence of the Zagros mountain range in western Iran [18]. These results correlate well with findings by Banks et al., Prakash et al., Kalenderski et al., and Leon and Legrand [3,5,8,26].
The second most prevalent aerosol species in the Arabian Peninsula is sulfate, contributing to an average of 20% of the total AOT. The concentration of sulfate in the region has been around the same range throughout the decade with a high concentration over the water bodies of the Red Sea, and the Arabian Gulf (Figure 3). On the Arabian Gulf, high sulfate emissions are primarily due to the large number of oil and gas industries in the Ghawar field (Saudi Arabian), Qatar, Kuwait, and the UAE. Moreover, several desalination plants, and other heavy industries along the coastal regions of the Arabian Gulf are contributing to this. Shipping vessels are also a significant source of sulfate in the Arabian Gulf and the Red Sea. The hotspot for sulfate on the Red sea is towards the south western region of the Arabian Peninsula to the west of Asir Mountains in Yemen where there are active volcanoes that are a significant source of sulfate. Recently volcanic activity in the southern Red Sea has increased due to a rifting episode in Afar (Ethiopia) in 2005. Following this, volcanic eruptions have occurred in the region in 2007, 2011–2012, and in late 2013. These were the first known volcanic eruptions in more than a century [39]. Other activities that contribute to sulfate emissions in the region include the anthropogenic emissions from the presence of industrial cities such as Jeddah, and population centers such as Mekkah, and Sanaa [38]. The region near Sanaa in Yemen also has several livestock and agricultural establishments that contribute further to enhanced sulfate levels.
Sea salt AOT contributes an average 5% to total AOT. The concentrations of sea salt in general are high along the coastal regions of eastern Saudi Arabia, Qatar, UAE, and Oman, and mainly prevalent in the coastal cities of Jeddah, Muscat, and Dubai (Figure 4). Muscat and Dubai receive higher sea salt levels during the summer from monsoon winds coming from the Indian Ocean and the Arabian gulf, while Jeddah receives its share of sea salt aerosols with winds blowing over the Red sea in the summer [16]. The inner Arabian Peninsula region is less affected by sea salt primarily due to the distance from the sea, but also because of the presence of mountain ranges—the Asir mountain range on the south west, the Hadramawt mountain range in the south, and the Al Hajjar mountain range in Oman, which increase the precipitation in the area and prevent the inflow of sea salt aerosols [29]. Sea salt AOT is also less in the inner apex of the Red sea and the Arabian Gulf regions due to the predominant wind directions that blow towards the Arabian Peninsula over the Red sea, and towards the southern part of the Arabian Gulf [29].
Organic carbon and black carbon contribute 4% and 2% to the total AOT, respectively. Concentrations of black carbon over the Arabian Peninsula from 2005 through 2015 were predicted by MERRA-2 as constant, without much variation, except for a sharp and dense increase in concentrations around Kuwait from 2009, which continued every year up to 2015 (Figure S1). The increase in black carbon over Kuwait is due to increased consumption of fossil fuels for its rapidly increasing electricity and power demand (Source: https://www.eia.gov/todayinenergy/detail.php?id=2310). Emission of primary organic carbon are generally low across the Middle East. However, similar to the black carbon trend, the concentration of organic carbon increased considerably around the Kuwait, Iraqi regions of the Tigris, Euphrates delta from 2009 through 2012, saw a slight decrease in 2013, and an increase again in 2014 and 2015 (Figure S2). These patterns can be attributed to the large presence of fossil fuel consuming industries in the region and an increase in the consumption of fossil fuels for local energy and power production in Kuwait from 2009.

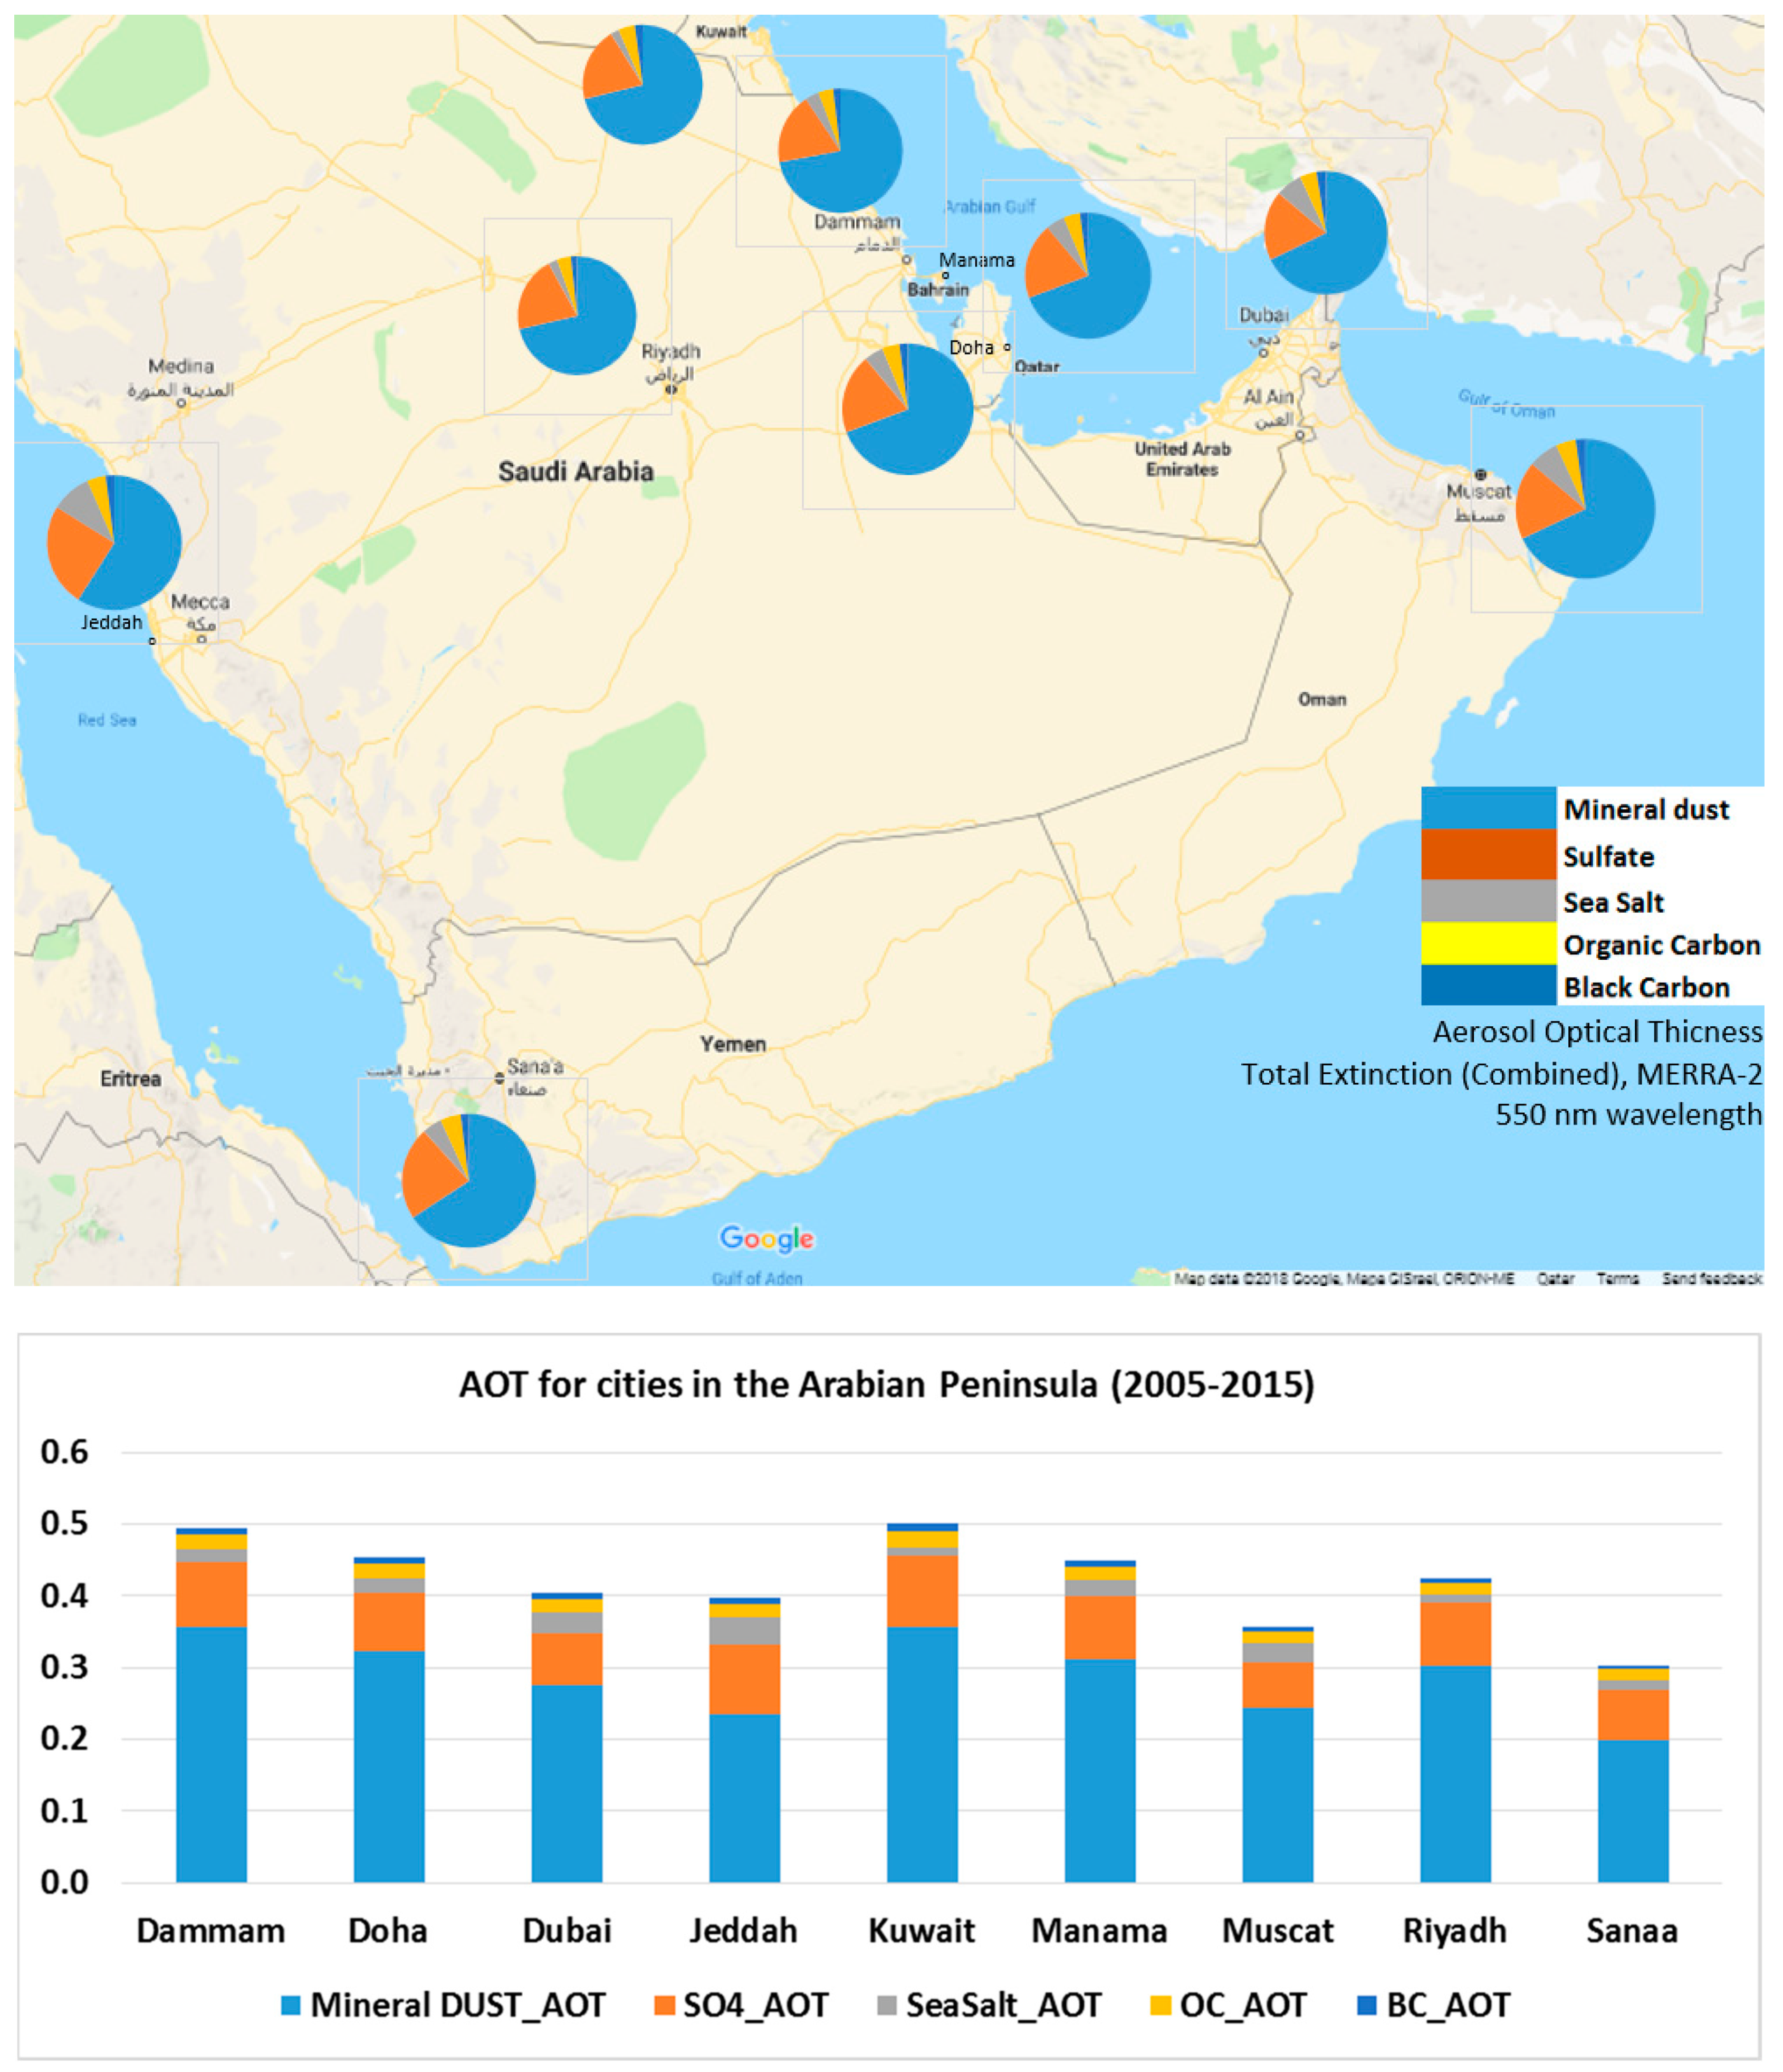
3.2. AOT Speciation in Major Population Centers of the Arabian Peninsula

Aerosol profiles over population centers in the Arabian Peninsula are quantified through the aerosol optical thickness parameter at 550 nm wavelength for five aerosol species—dust, sulfate, sea salt, black, and organic carbon. The analysis is performed in nine major population centers in the region—Dammam, Doha, Dubai, Kuwait, Jeddah, Manama, Muscat, Riyadh, and Sanaa—for an 11-year period (2005–2015) (Figure 5).
The cities with the highest total AOT are Kuwait (0.5), Dammam (0.49), Doha (0.45), and Manama (0.45) (Table 2). This is attributed to the high industrial (oil and gas) activity in these cities in addition to the high concentrations of mineral dust. The cities with the lowest total AOT are Sanaa (0.3), Muscat (0.35), Dubai (0.4), and Jeddah (0.4). Dust and sulfate contribute to about 90% of the total AOT in these cities of the Arabian Peninsula. The AOT values obtained via MERRA-2 fell within the same ranges in similar studies on AOT measurements in the region such as Banks et al., Shalaby et al., Satheesh and Moorthy, Klingmuller et al., Munir et al., Yu at al., and Provencal et al. [5,12,31,37,38,40,41].
The majority of the AOT in the region is attributed to mineral dust (about 70%). Lower contribution (in %) is observed in cities of the western coast of the Arabian Peninsula along the Red sea (i.e., Jeddah and Sanaa), while the highest percentages are observed in all the major populated cities along the eastern coast of the Arabian Peninsula along the coast of the Arabian Gulf (i.e., Dammam, Doha, Kuwait, Riyadh, Manama, Muscat, and Dubai).
Cities on the western coast of the Arabian Peninsula get most of their dust that blows southward from the Mediterranean and the Sahel in North Africa [10,17]. However, for cities on the eastern coast of the Arabian Peninsula, additional dust from the prevalent Shamal northwesterly winds, which picks up dust from the Fertile Crescent (Syria, Tigris-Euphrates delta) also affects the region. These winds move south westward towards the Northern Saudi Arabian deserts of An Nafud and Ad Dahna, and then move eastward along the Saudi Arabian desert of Rub Al Khali, picking up more dust over the Arabian Peninsula.
Sulfate is the second most prevalent aerosol species in the Arabian Peninsula contributing about 18–25% to total AOT. This is a result of shipping vessels, motor vehicles, and oil and gas industrial activity in the region. The cities with the highest sulfate AOT are Jeddah, Kuwait, Dammam, and Riyadh, all of which are major industrial cities that are powered by burning fossil fuels. All these major cities also have some of the highest numbers of vehicles per unit population, explaining the high sulfate values [14]. The Red Sea has significantly more shipping vessels traffic than the Arabian Gulf, and the western Arabian Peninsula region has a number of volcanoes. This explains the relatively high sulfate contribution in cities along the Red Sea such as Sanaa (23%) and Jeddah (25%) as compared to the eastern coast, such as Doha (18%), Kuwait (20%), and Muscat (18%).
Sea salt particles contribute 4–10% to total AOT. In the present study, almost all major populated cities (with exception of Riyadh) are along the coast and thus significantly affected by sea salt aerosol. Jeddah has the highest sea salt AOT (0.04) as well as the highest contribution to total AOT (10%) while all other major cities along the coast average between 4% and 7% contribution. Riyadh, due to its inland location (about 400 km from the Arabian Gulf) has a slightly less sea salt contribution (3%). However, Kuwait City has the lowest sea salt percentage contribution to total AOT, due to its location at the Northern apex of the Arabian Gulf, which makes the movement of windblown sea salt towards inland Kuwait unfavorable.
Carbonaceous aerosols are a small contributor to total AOT in the region. The lack of biomass and associated burning in the region is a likely a reason for its reduced contribution to total AOT although other sources (e.g., traffic) are also significant contributors to carbonaceous aerosol [14].
These results are consistent with other studies that also found AOT values between 0.3 and 0.5 for the region [3,10,17,37]. The results are also similar to other source apportionment studies in the region. For example, Massoud et al. [42] used PMF (positive matrix factorization) in Lebanon in 2009–2010 to show that dust resuspension, markers from tires and brakes, and biogenic crustal emissions contributed a significant portion to PM10. A study by Engelbrecht et al. [43] in Iraq modeled the chemical signature for sources of PM10 and PM2.5 (particulate matter with a dimeter of 2.5 µm or less) and found that desert dust, gasoline vehicle emissions, and battery smelting operations were the main sources of PM10. In a study by Gupta et al. [44], the PMF model apportioned the sources of total suspended particles (TSP) in Ahwaz (SW of Iran) to crustal dust (41.5%), road dust (5.5%), vehicular emissions (11.5%), marine aerosols (8%), petrochemical plants and fossil fuel combustions (13%), secondary aerosols (9.5%), vegetative burning (5%), and metallurgical plants (6%). In a study by Alolayan et al. [45], major sources of PM2.5 in Kuwait from February to October 2005 using PMF were found to be 54% from crustal material, 18% from power plants that used oil for combustion, 12% from petrochemical factories, and 11% from road traffic and road dust resuspension. In Jeddah, Khodeir et al. [46] found chemical composition of PM using varimax orthogonal rotation from June to September 2011 showed heavy oil combustion, resuspended soil, and industrial emissions as the main contributors to PM10 and PM2.5.

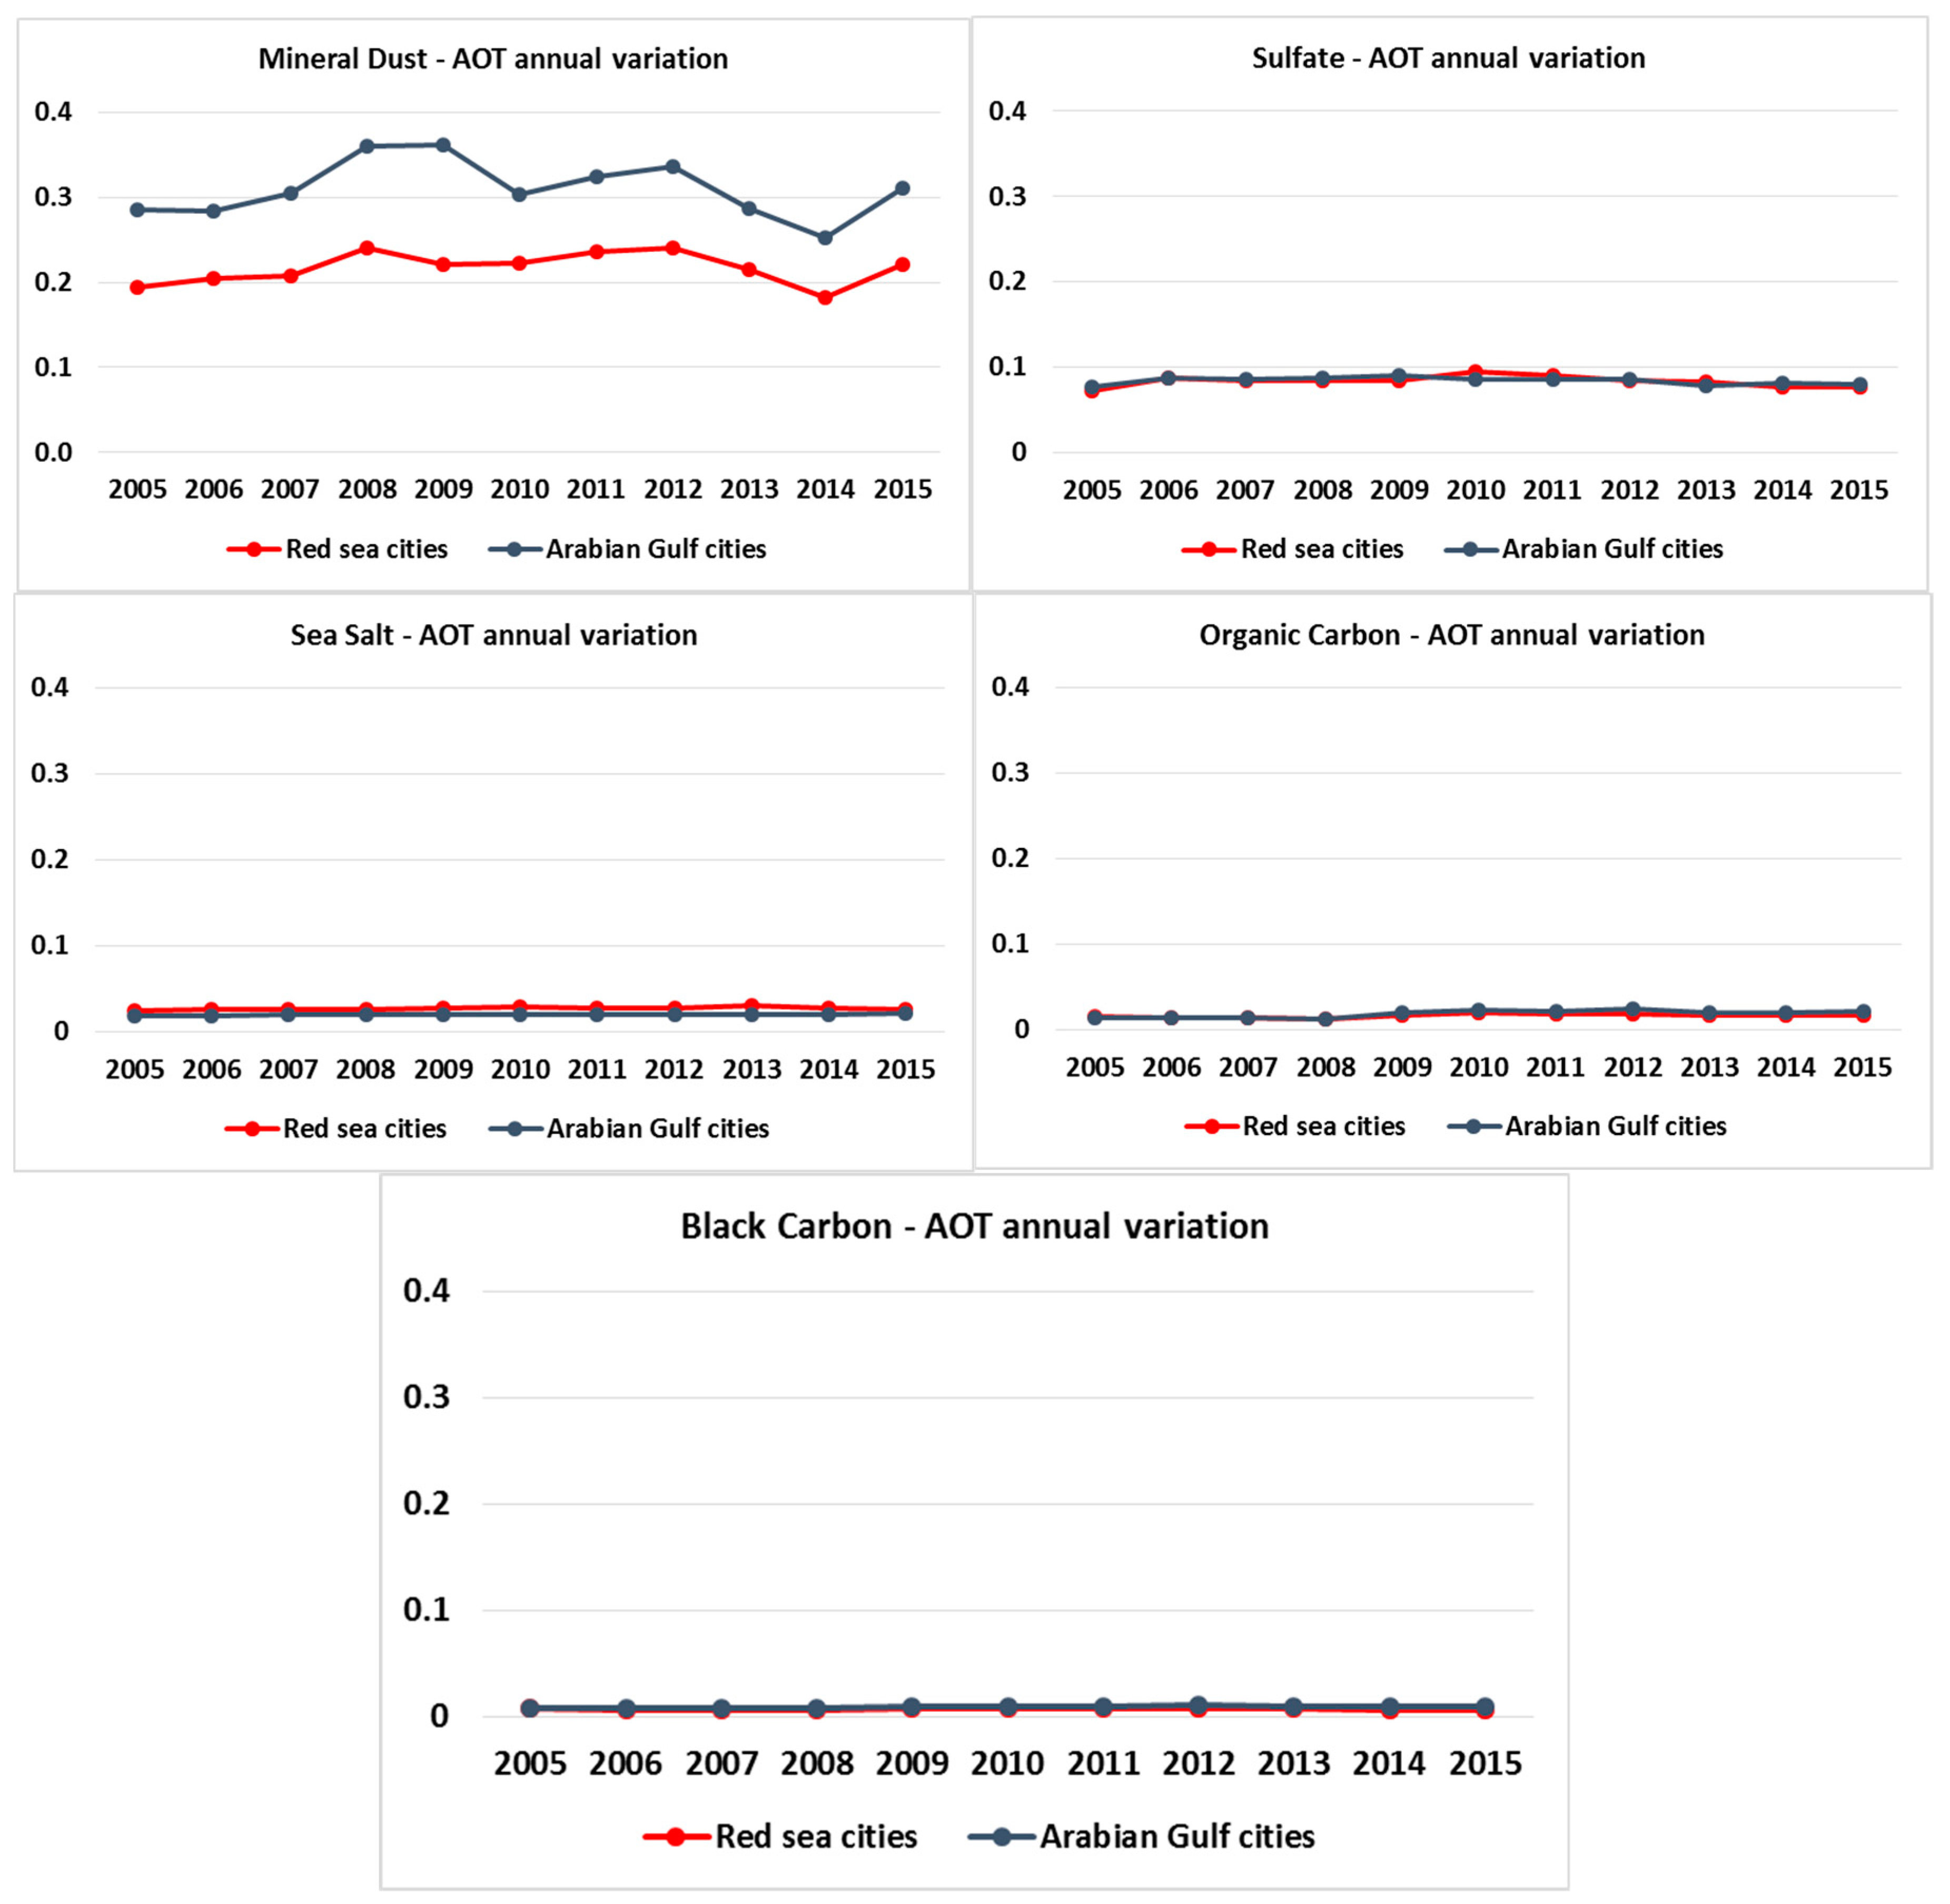
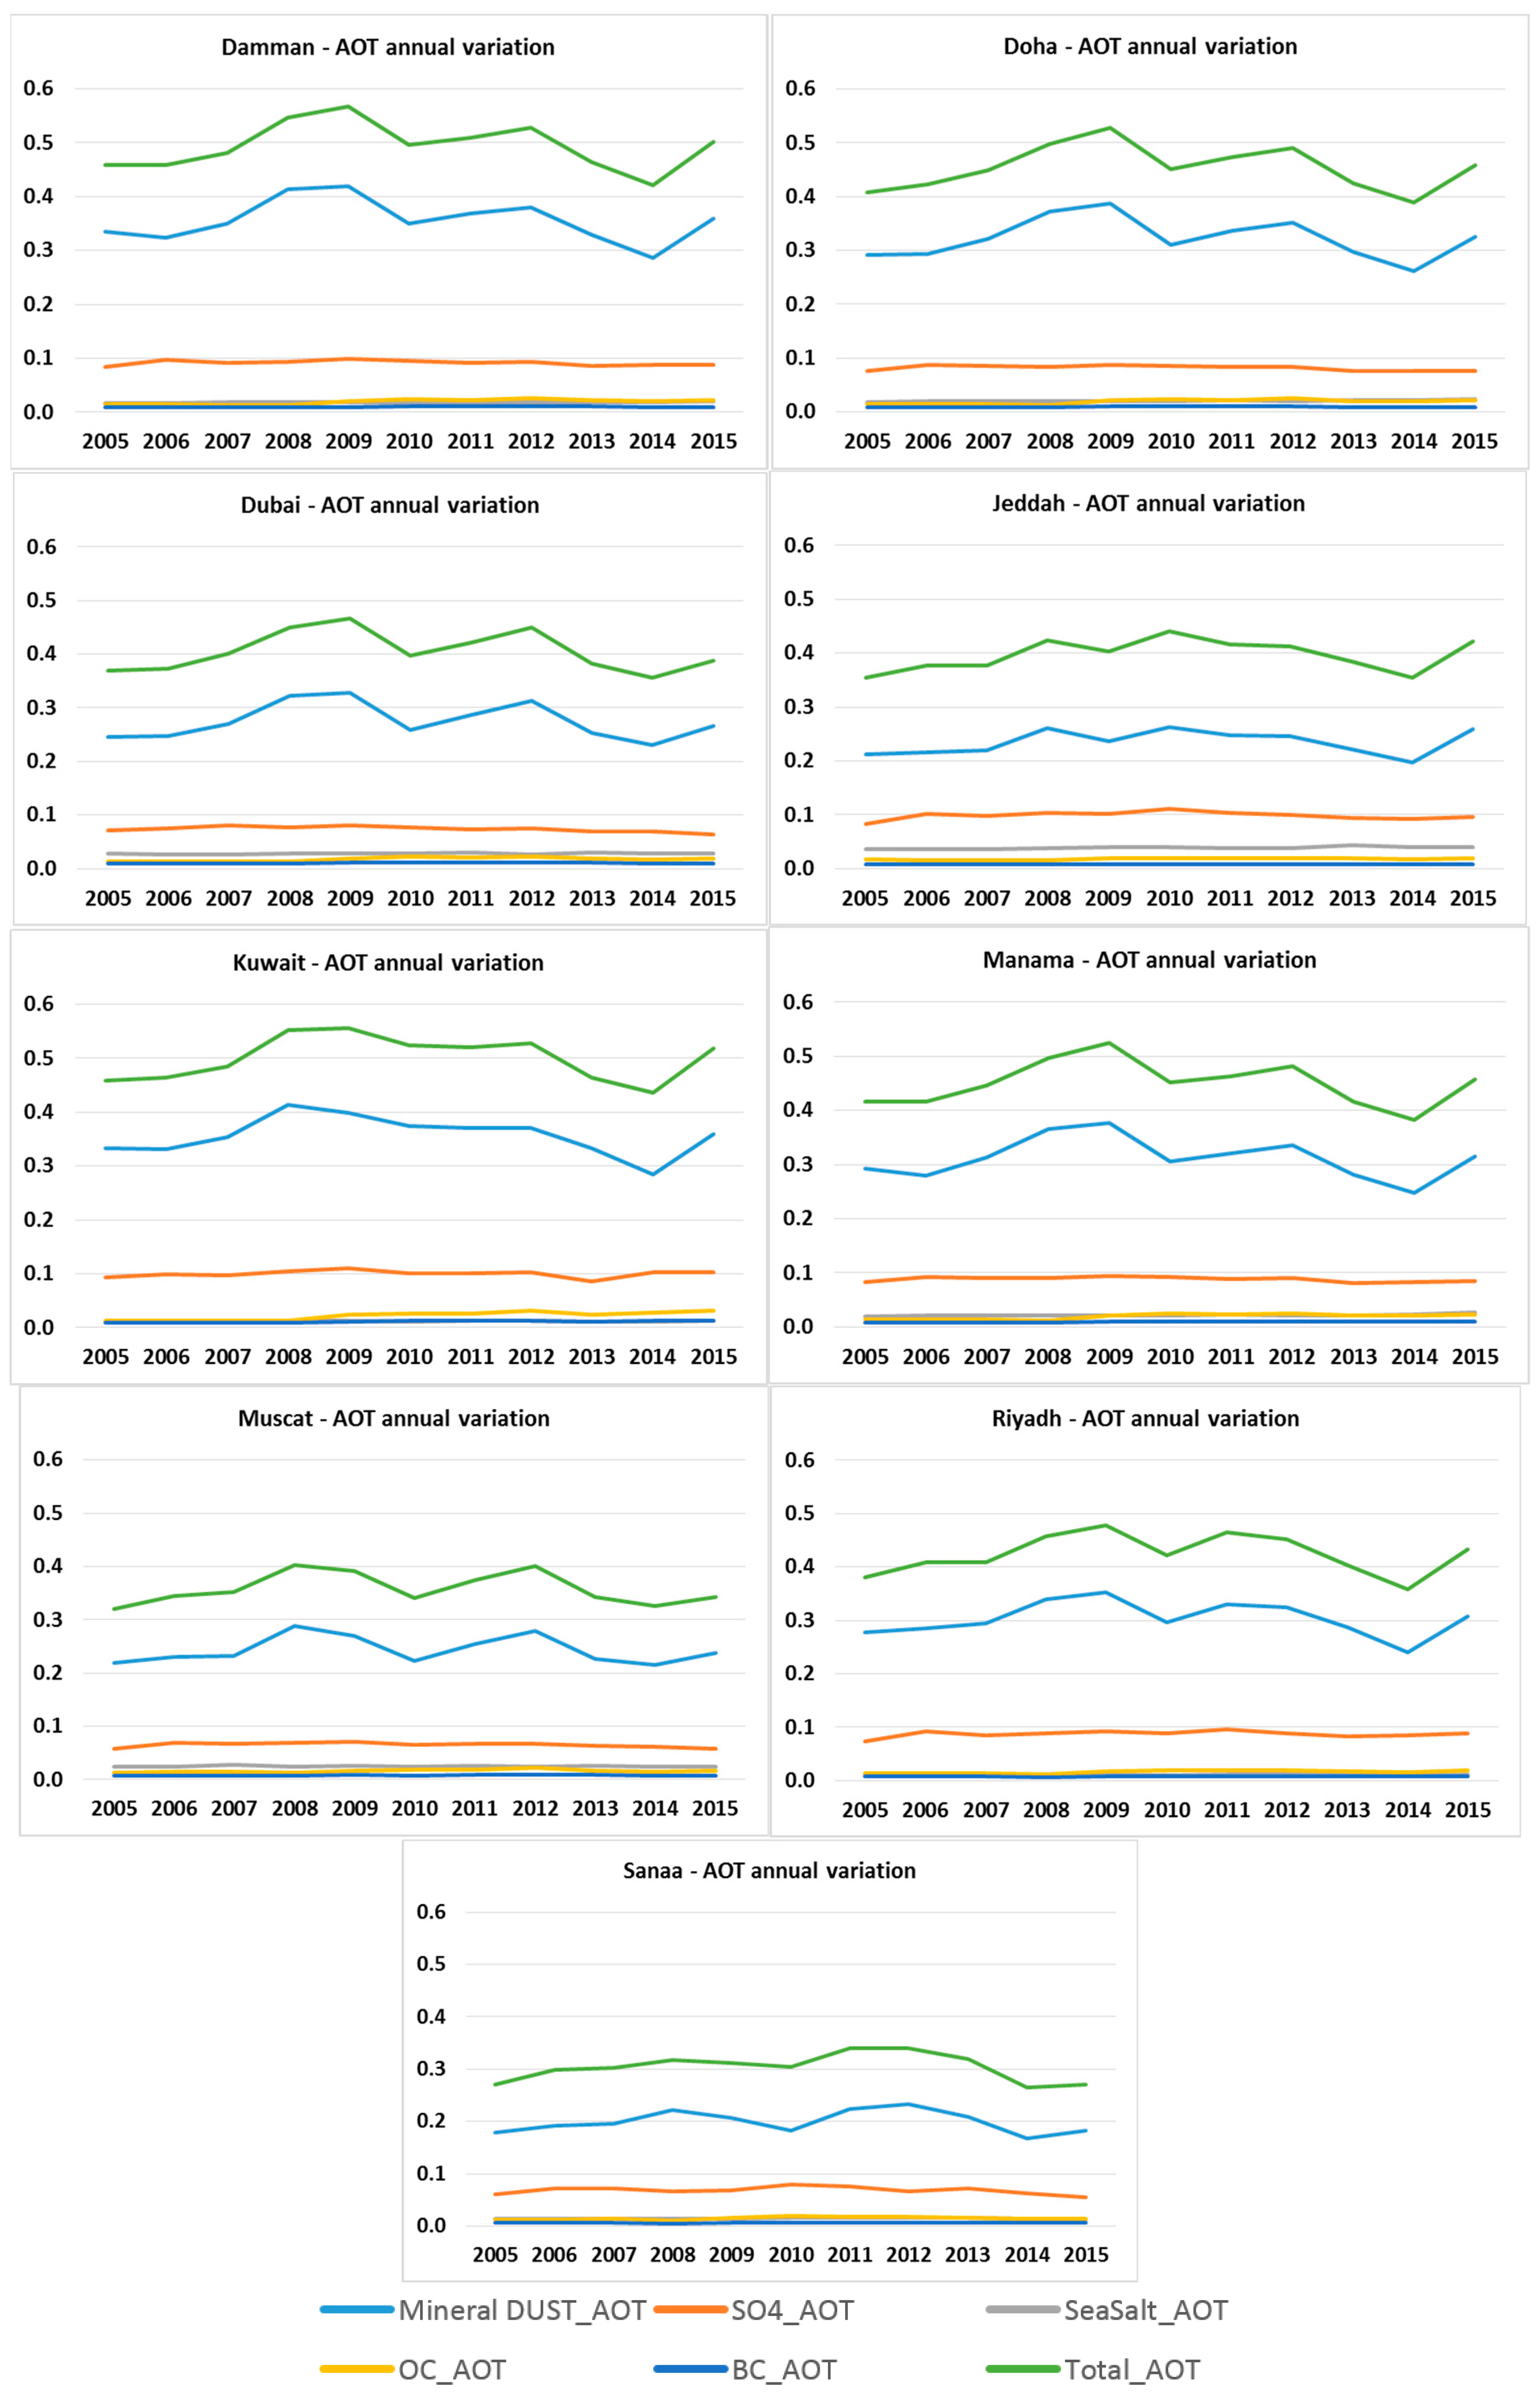
3.3. Annual Variation and Trends in the Urban Environments

The average dust AOT trend increased until 2009 (especially over the Arabian Gulf cities) and then decreased from 2010 through 2014 with an increase in 2012 (Figure 6 and Figure 7). This result is in agreement with other similar studies. Between 2007 and 2012, the high dust AOT over the entire Arabian Peninsula is attributed to a decrease in relative humidity and a reduction in soil moisture due to the increasing temperature trend in the Arabian Peninsula. This period was characterized by La Nina and negative phase of the pacific decadal oscillation (PDO), which resulted in a period of extended drought conditions. Dried soils and diminished vegetation cover were prevalent in the Fertile Crescent region from Syria to Iraq. The drying Tigris-Euphrates river delta became the primary source of dust in the region in this period [2,20,21,37]. The decreasing soil moisture content led to generation of loose soil, which can be more easily scooped up into the air by prevailing wind patterns. In 2009–2010, the onset of the El Nino along with the shift in the PDO from negative to positive phase led to a decrease in dust generation which continued until 2015 [2].
The exception to this decreasing trend was in 2012 when high AOT was observed [3,6]. From 2015, there is an increasing trend in dust emissions due to shift back to La Nina, associated with a drier period in the Arabian Peninsula (Figure 6 and Figure 7). The average sulfate AOT has been nearly constant through the decade in these urban centers, showing a slightly decreasing trend from 2012 through 2015. There has been little variation in the AOT between the Red Sea region and the Arabian Gulf cities. Organic and black carbon AOT are slightly higher in the Arabian Gulf cities due to a higher density of industrialized centers in the region. Sea salt AOT has been relatively stable over the study period and is the only aerosol that has a higher AOT over cities on the Red Sea than cities on the Arabian Gulf.

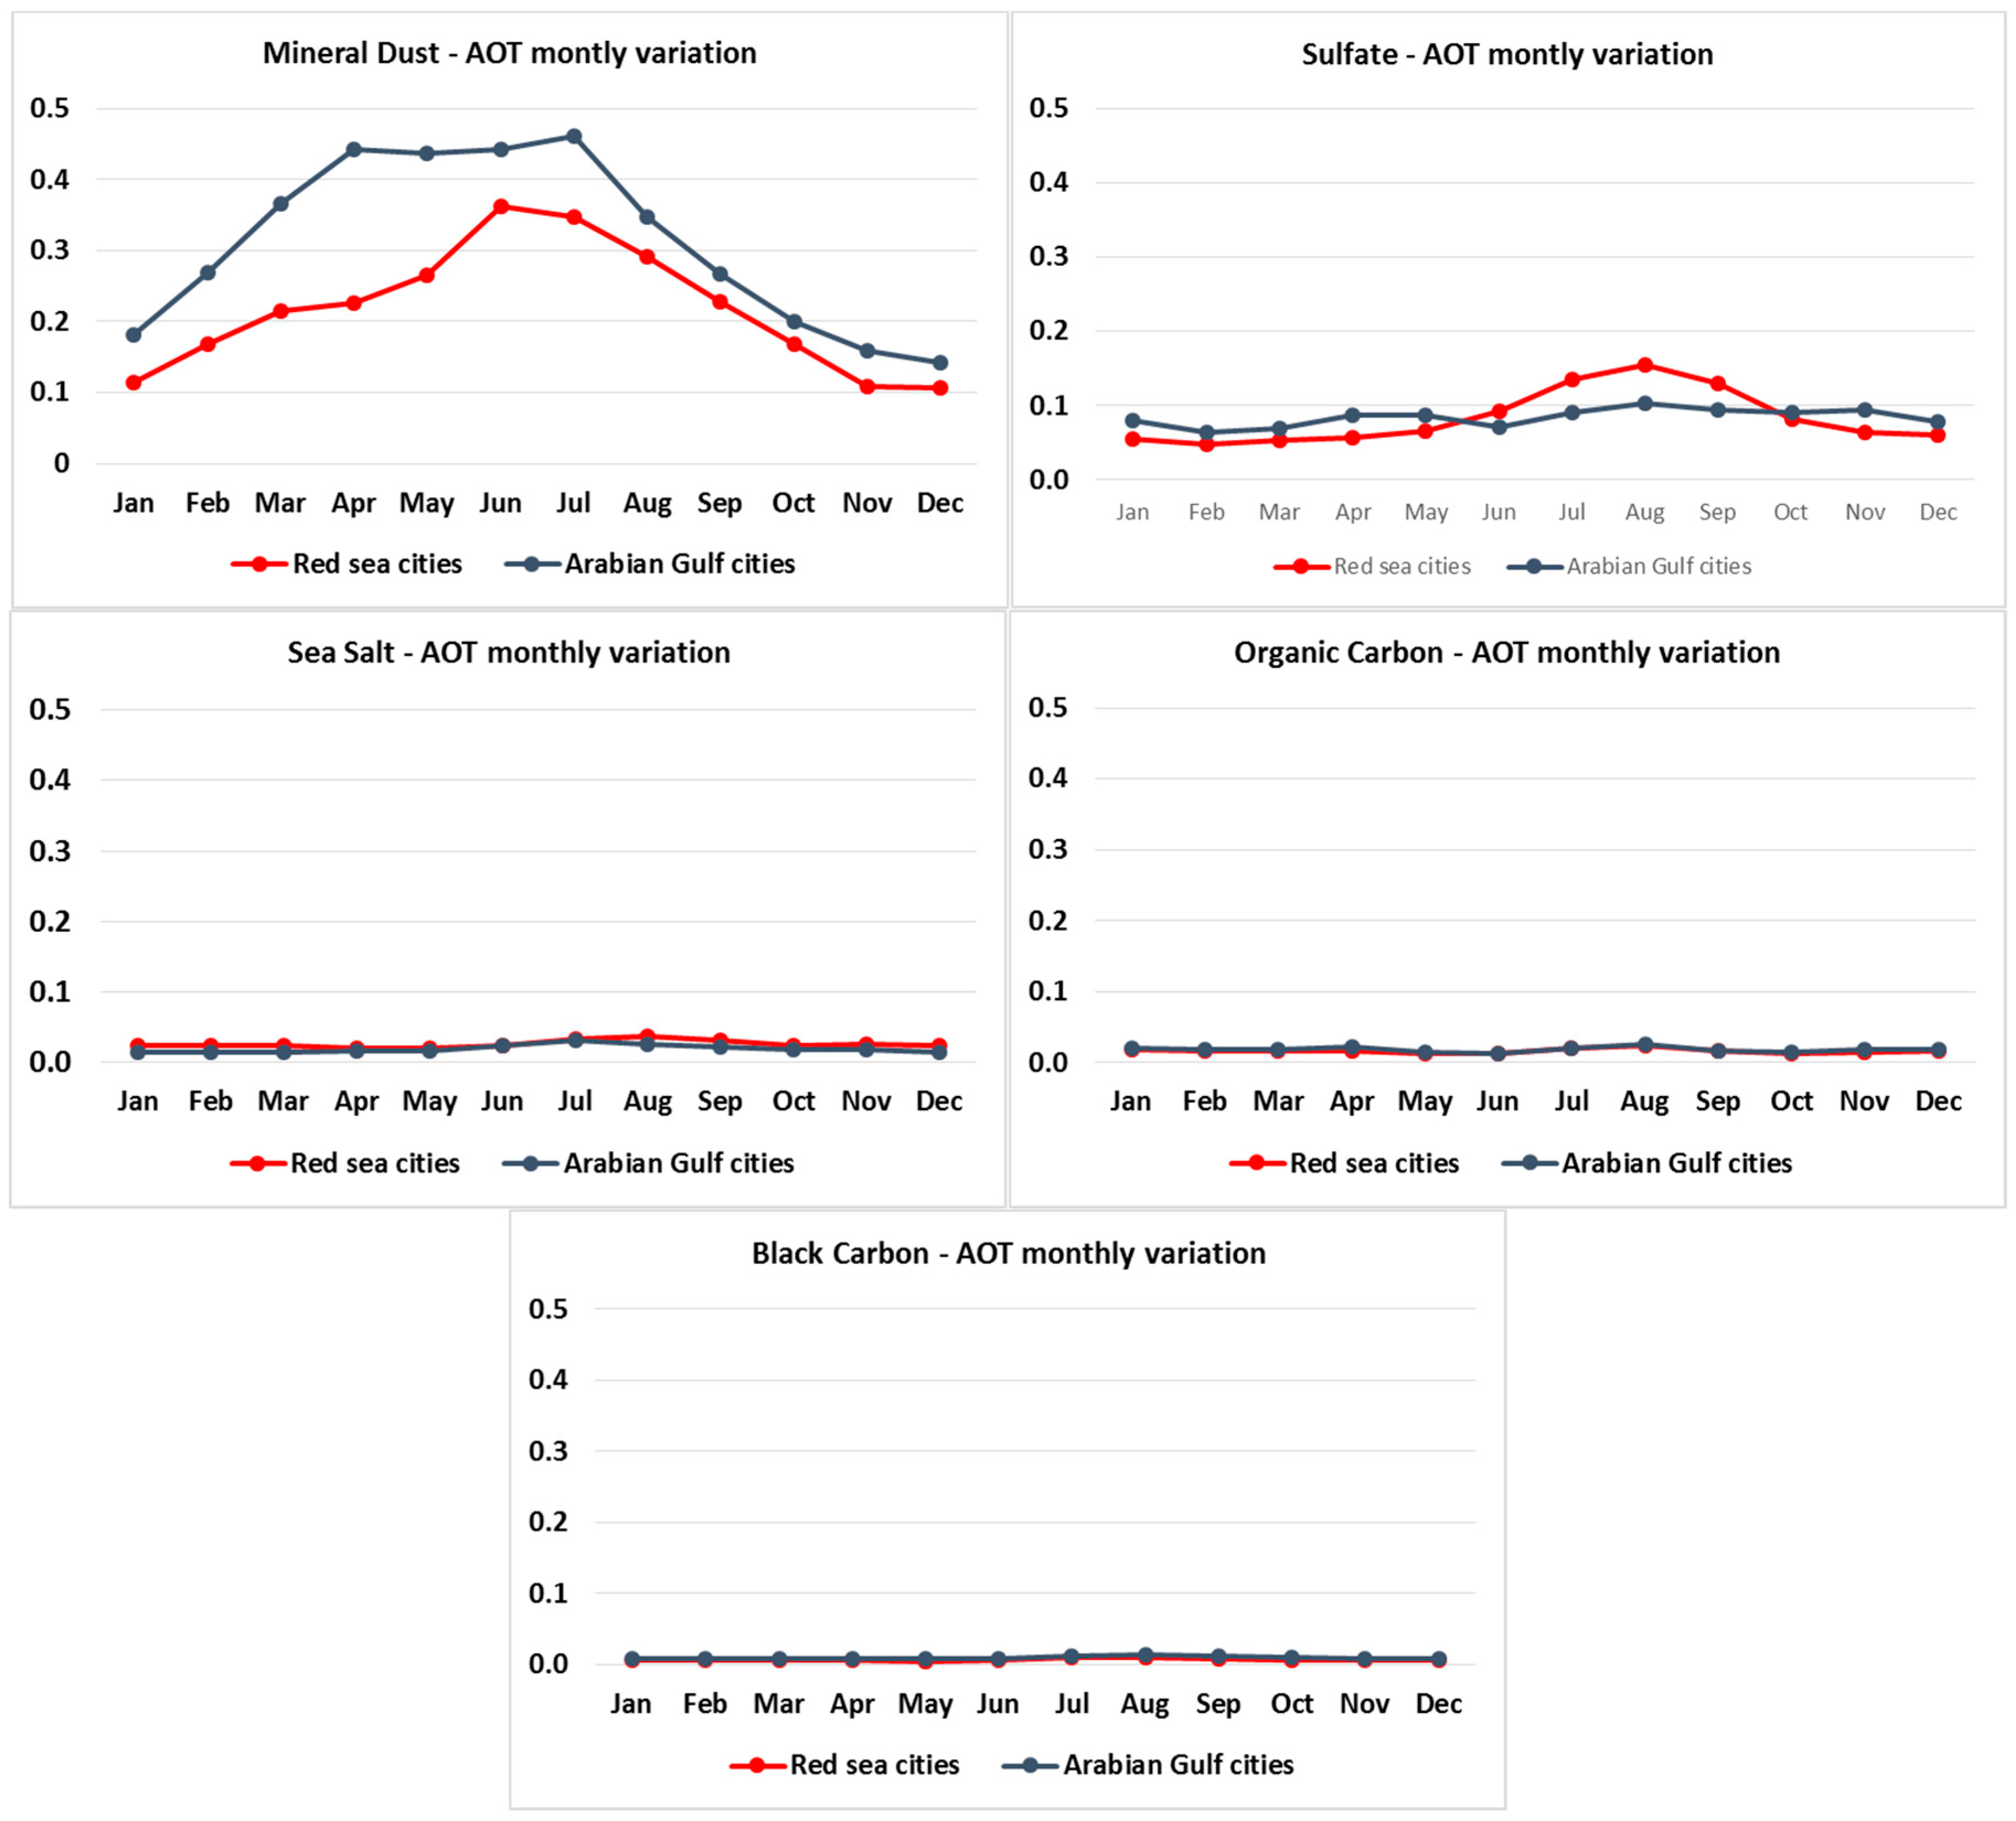
3.4. Monthly Variation and Trends in the Urban Environments

An analysis of the monthly variation of AOT across all cities in the region shows that the highest AOT for dust occurs in the spring and summer months from March through August, with a low period during the winter months from October through February (Figure 8 and Figure S3). This is due to the prevailing Shamal wind patterns in the region. These findings are consistent with other studies conducted in the region [2,10,17,37]. The spring peak is associated with the Sharav cyclones (Saharan depressions) across the northern Sahara and Mediterranean Sea [2]. Cold fronts associated with Mediterranean cyclones and northwesterly Shamal winds are triggers of dust during the winter–spring season and the summer. These data are in good agreement with the AERONET stations in Solar Village, Saudi Arabia, and Mezaira, United Arab Emirates. Dust generated from the Northern Africa region and the desert regions of the Arabian Peninsula are the main contributors to the dust AOT of these urban environments, especially during the spring and summer months [10].
Over the Arabian Gulf, high dust activity is related to the summer Shamal, which picks up dust from Iraq and Syria and blow constantly during the summer months. Dust AOT peaks in April–June across the northern and central Arabian Peninsula [2] and this is reflected in the peak dust AOT over Jeddah and Riyadh. The cities on the Arabian Gulf have peaks in dust AOT during April–May and July–August. These results are consistent with the observations of Yu et al [40]. Sulfate, organic, and black carbon AOT attain their peak during the summer months between May and August when demand for power and electricity for cooling increases. Sea salt AOT increases with higher sea surface temperature and are thus at their maxima during the summer months [47].
These results are similar to observations in Shalaby et al., Banks et al., Yu et al., Klingmuller et al., and Kutiel et al. [5,12,37,40,48].

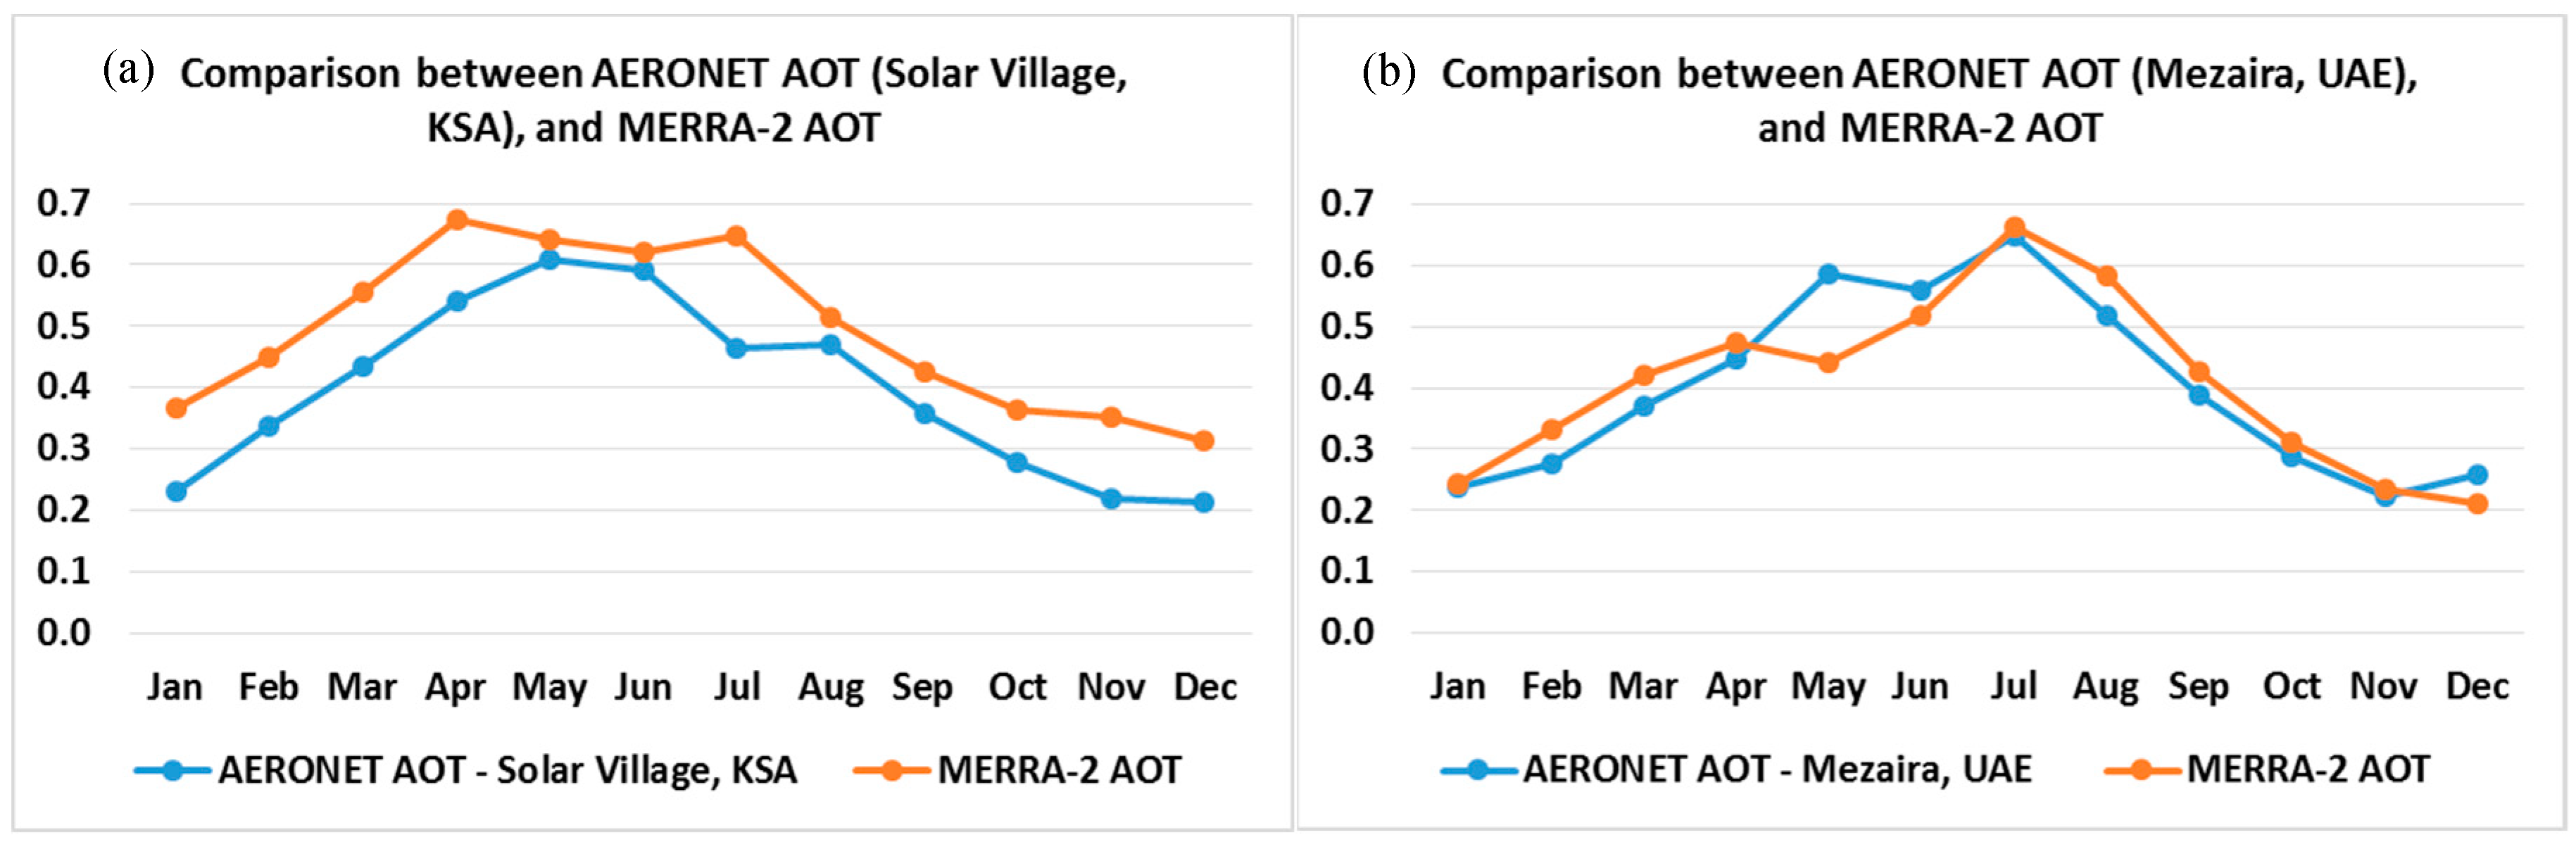
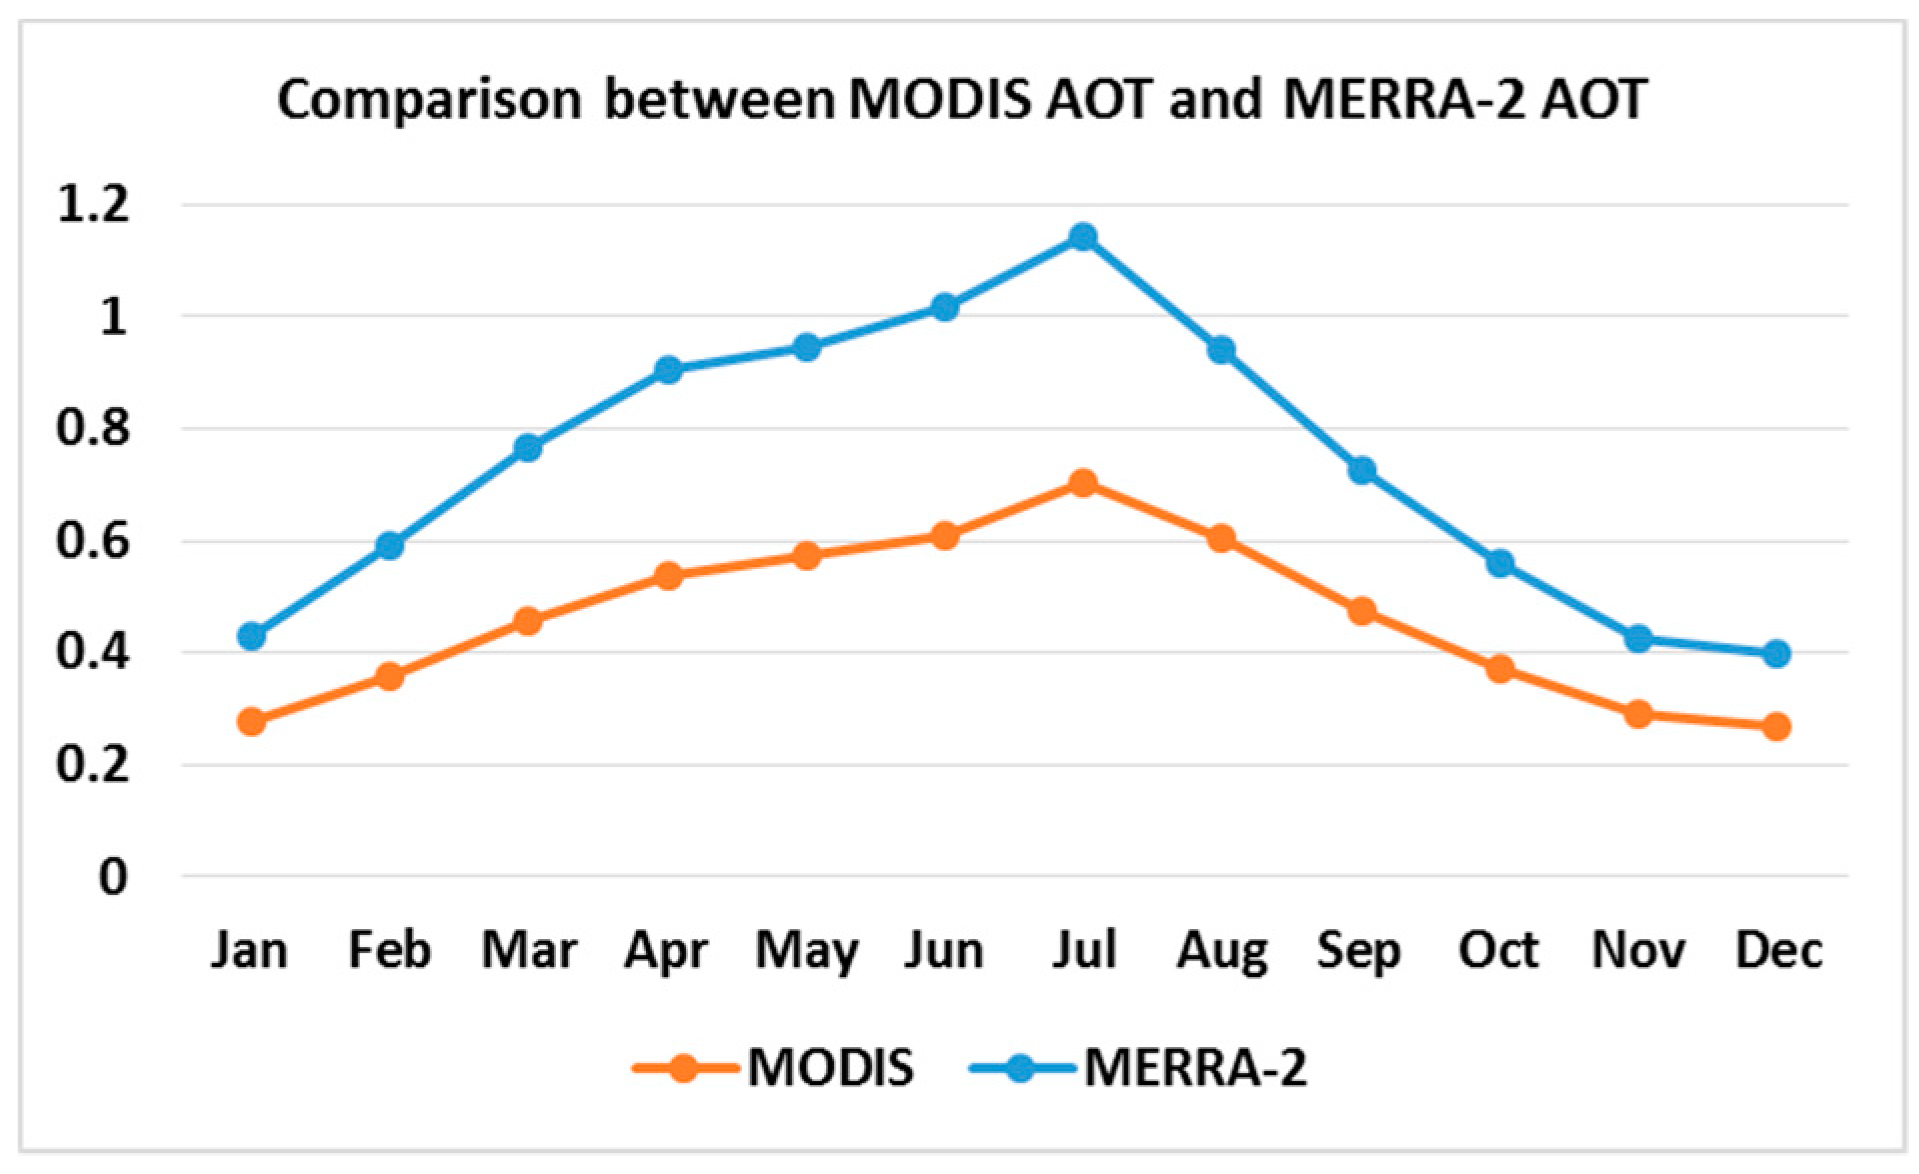
3.5. Comparison of MERRA-2 Results with AERONET and MODIS

The total AOT values from MERRA-2 were compared with available ground-based AERONET measurements. As MERRA-2 AOT were only available for 550 nm wavelength, the closest wavelength from AERONET AOT data, i.e., at 500 nm was used to find the AERONET AOT at 550 nm using the following equations
AOT(550 nm) = AOT(500 nm) × (550/500)−α
where the Ångstrom exponent, α = ln(AOT(440 nm)/AOT(675 nm))/ln(675/440).
The AOT from the two AERONET stations i.e., Solar Village in Saudi Arabia, and Mezaira in the UAE, were compared with MERRA-2 data over the same locations. Figure 9 shows that the monthly average AOT from MERRA-2 over the 11-year period between 2005 and 2015 was in good agreement with the AERONET observations. Level 2 data were used for both AERONET and MERRA-2 AOT.
The total AOT values from MERRA-2 were compared with available satellite-based MODIS measurements at 550 nm wavelength. Figure 10 shows a similar trend and seasonal variation between MERRA-2 and MODIS with, however, a discrepancy in absolute values by often a factor of 2. This is probably due to the large uncertainties involved in deriving the AOTs from model and satellite measurements, accompanied by the low spatial resolution. Moreover, there is inconsistency in the physical and optical parameters used between the model and the satellite retrievals. When comparing the model (MERRA-2) and satellite (MODIS) retrieved data, it is found that the model provides a better presentation of the seasonal variations at most sites when compared with the ground-based sun photometer network (AERONET) as evidenced in Figure 9. The comparisons in this section agree with the conclusions in Yu et al., Habib et al., Chin et al., Banks et al., Remer et al., and Pozzer et al. [2,5,6,32,36,40,49].

4. Conclusions

Population centers in the Arabian Peninsula have been experiencing strong urbanization and industrialization over the past few decades in addition to frequent dust storms, which makes the analysis of long-term air pollution trends of particular importance from a human health perspective. In this work, we investigate the distribution, speciation, and trends of aerosol optical depth at 550 nm wavelength in nine major population centers (Dammam, Doha, Dubai, Jeddah, Kuwait, Manama, Muscat, Riyadh, and Sanaa) as well as over the greater region during a period of 11 years (2005–2015).
Recently, NASA’s MERRA model was extended with an atmospheric aerosol reanalysis component, which includes five particulate matter species (organic and black carbon, sulfate, mineral dust, and sea salt), which are being used in this study. Annual mean AOT values are predicted in the range of 0.3–0.5 throughout this period mainly due to contribution from mineral dust (60–70%) and sulfate aerosols (20–30%). Dust and sulfate contribute to about 90% of the total AOT in these cities of the Arabian Peninsula. A lower percentage of dust AOT contribution is observed in cities of the western coast of the Arabian Peninsula compared to the eastern part. A review of the climate variability, prevailing winds, and major desert dust sources is conducted to better explain the variability and spatial distribution patterns of AOT.
As projections of global warming predict a collapse of the Fertile Crescent by the turn of the 21st century, more dust generation and a deterioration of air quality in the region is expected. Intense photochemistry is responsible for an additional number of secondary aerosols in addition to the significant contribution of desert dust in the total particulate matter levels that the model predicts. Thus, controlling and mitigating the local urban emissions is considered to be an efficient measure to improve air quality in these largely affected urban environments.

Supplementary Materials

The following are available online at https://0-www-mdpi-com.brum.beds.ac.uk/2073-4433/10/5/228/s1, Figure S1: Inter-annual variation of Black carbon AOT over the Arabian Peninsula from 2005 through 2015. Figure S2: Inter-annual variation of Organic Carbon AOT over the Arabian Peninsula from 2005 through 2015. Figure S3: Monthly variation in aerosol AOT over the Arabian Peninsula cities.

Author Contributions

Conceptualization, M.Z.S. and C.F.; data curation, D.R.R.; formal analysis, D.R.R.; funding acquisition, M.K.; methodology, D.R.R., M.Z.S., and C.F.; project administration, M.K. and C.F.; resources, M.K.; software, M.Z.S.; supervision, M.K., R.I., and C.F.; visualization, D.R.R. and M.Z.S.; writing—original draft, D.R.R.; writing—review and editing, M.K., R.I., and C.F.

Funding

This research received no external funding. The APC was funded by the Qatar National Library.

Acknowledgments

We very much acknowledge the logistic support of Hamad Bin Khalifa University and Qatar Foundation for making this study possible. We thank Brent Holden and his staff for establishing and maintaining the Solar Village and Mezaira sites used in this investigation.

Conflicts of Interest

The authors declare no conflict of interest.

References

  1. Al-Thani, H.; Koc, M.; Isaifan, R.J. Investigations on Deposited Dust Fallout in Urban Doha: Characterization, Source Apportionment and Mitigation. Environ. Ecol. Res. 2018, 6, 493–506. [Google Scholar] [CrossRef]
  2. Yu, Y.; Notaro, M.; Kalashnikova, O.V.; Garay, M.J. Climatology of Summer Shamal Wind in the Middle East. J. Geophys. Res. Atmos. 2015, 121. [Google Scholar] [CrossRef]
  3. Prakash, P.J.; Stenchikov, G.; Kalenderski, S.; Osipov, S.; Bangalath, H. The Impact of Dust Storms on the Arabian Peninsula and the Red Sea. Atmos. Chem. Phys. 2015, 15, 199–222. [Google Scholar] [CrossRef]
  4. Al Katheeri, E.; Al Jallad, F.; Al Omar, M. Assessment of Gaseous and Particulate Pollutants in the Ambient Air in Al Mirfa City, United Arab Emirates. J. Environ. Prot. 2012, 3, 640–647. [Google Scholar] [CrossRef]
  5. Banks, J.R.; Brindley, H.E.; Stenchikov, G.; Schepanski, K. Satellite Retrievals of Dust Aerosol over the Red Sea, 2005–2015. Atmos. Chem. Phys. 2016. [Google Scholar] [CrossRef]
  6. Habib, A.; Chen, B.; Khalid, B.; Tan, S.; Che, H.; Mahmood, T.; Shi, G.; Butt, M.T. Estimation and Inter-Comparison of Dust Aerosols Based on MODIS, MISR and AERONET Retrievals over Asian Desert Regions. J. Environ. Sci. 2019, 76, 154–266. [Google Scholar] [CrossRef]
  7. Farahat, A. Air Pollution in the Arabian Peninsula (Saudi Arabia, the United Arab Emirates, Kuwait, Qatar, Bahrain, and Oman): Causes, Effects, and Aerosol Categorization. Arab J. Geosci. 2016, 9, 1–17. [Google Scholar] [CrossRef]
  8. Kalenderski, S.; Stenchikov, G.; Zhou, C. Modeling a Typical Winter-Time Dust Event over the Arabian Peninsula and the Red Sea. Atmos. Chem. Phys. 2013, 13, 1999–2014. [Google Scholar] [CrossRef]
  9. Anisimov, A.; Tao, W.; Stenchikov, G.; Kalenderski, S.; Prakash, P.J. Quantifying Local-Scale Dust Emission from the Arabian Red Sea Coastal Plain. Atmos. Chem. Phys. 2017, 17, 993–1015. [Google Scholar] [CrossRef]
  10. Prospero, J.M.; Ginoux, P.; Torres, O.; Nicholson, S.E.; Gill, T.E. Environmental Characterization of Global Sources of Atmospheric Soil Dust Identified with the NIMBUS 7 Total Ozone Mapping Spectrometer (TOMS) Absorbing Aerosol Product. Rev. Geophys. 2002, 40, 1–31. [Google Scholar] [CrossRef]
  11. Goudie, A.S.; Middleton, N.J. Saharan Dust Storms: Nature and Consequences. Earth-Sci. Rev. 2001, 56, 179–204. [Google Scholar] [CrossRef]
  12. Shalaby, A.; Rappenglueck, R.; Eltahir, E.A.B. The Climatology of Dust Aerosol over the Arabian Peninsula. Atmos. Chem. Phys. 2015, 15, 1523–1571. [Google Scholar] [CrossRef]
  13. Highwood, E.J.; Ryder, C.L. Mineral Dust: A Key Player in the Earth System; Knippertz, P., Stout, J.-B.W., Eds.; Springer: Dordrecht, The Netherlands, 2014; pp. 267–283. [Google Scholar]
  14. Tsiouri, V.; Kakosimos, K.E. Concentrations, Sources and Exposure Risks Associated with Particulate Matter in the Middle East Area—A Review. Air Qual. Atmos. Health 2015, 8, 67–80. [Google Scholar] [CrossRef]
  15. Brown, K.W.; Bouhamra, W.; Lamoureux, D.P.; John, S.; Koutrakis, P. Characterization of Particulate Matter for Three Sites in Kuwait. J. Air Waste Manag. Assoc. 2012, 58, 994–1003. [Google Scholar] [CrossRef]
  16. Eager, R.E.; Raman, S.; Wootten, A.; Westphal, D.L.; Reid, J.S.; Al Mandoos, A. A Climatological Study of the Sea and Land Breezes in the Arabian Gulf Region. J. Geophys. Res. 2008, 113, 1–12. [Google Scholar] [CrossRef]
  17. Rezazadeh, M.; Irannejad, P.; Shao, Y. Climatology of the Middle East Dust Events. Aeolian Res. 2013, 10, 103–109. [Google Scholar] [CrossRef]
  18. Walters, K.R.; Sjoberg, W.F. The Persian Gulf Region: A Climatological Study; FMFRP 0-54; Department of the Navy, United States Marine Corps: Washington, DC, USA, 1990. [Google Scholar]
  19. Rao, P.G.; Al-Sulaiti, M.; Al-Mulla, A.H. Winter Shamals in Qatar, Arabian Gulf. Weather 2001, 56, 444–451. [Google Scholar] [CrossRef]
  20. Abid, M.A.; Almazroui, M.; Kucharski, F.; Brien, E.O.; Yousef, A.E. ENSO Relationship to Summer Rainfall Variability and Its Potential Predictability over Arabian Peninsula Region. Npj Clim. Atmos. Sci. 2018, 1, 1–7. [Google Scholar] [CrossRef]
  21. Hoell, A.; Funk, C.; Barlow, M. The Regional Forcing of Northern Hemisphere Drought Recent Warm Tropical West Pacific Ocean La Nina Events. Clim. Dyn. 2014, 42, 3289–3311. [Google Scholar] [CrossRef]
  22. Peyrille, P.; Lafore, J.-P.; Redelsperger, J.-L. An Idealized Two-Dimensional Framework to Study the West African Monsoon. Part 1: Validation and Key Controlling Factors. J. Atmos. Sci. 2007, 64, 2765–2782. [Google Scholar] [CrossRef]
  23. Romanou, A.; Tselioudis, G.; Zerefos, C.S.; Clayson, C.A.; Curry, J.A.; Anderson, A. Evaporation—Precipitation Variability over the Mediterranean and the Black Seas from Satellite and Reanalysis Estimates. J. Clim. 2010, 23, 5268–5287. [Google Scholar] [CrossRef]
  24. Notaro, M.; Yu, Y.; Kalashnikova, O.V. Regime Shift in Arabian Dust Activity, Triggered by Persistent Fertile Crescent Drought. J. Geophys. Res. Atmos. 2015, 229–249. [Google Scholar] [CrossRef]
  25. Draxler, R.R.; Gillette, D.A.; Kirkpatrick, J.S.; Heller, J. Estimating PM 10 Air Concentrations from Dust Storms in Iraq, Kuwait and Saudi Arabia. Atmos. Environ. 2001, 35, 4315–4330. [Google Scholar] [CrossRef]
  26. Leon, J.-F.; Legrand, M. Mineral Dust Sources in the Surroundings of the North Indian Ocean. Geophys. Res. Lett. 2003, 30. [Google Scholar] [CrossRef]
  27. Phillips, M.J.; Smith, E.A.; Mosquin, P.L.; Chartier, R.; Nandasena, S.; Bronstein, K.; Elledge, M.F.; Thornburg, V.; Thornburg, J.; Brown, L.M. Sri Lanka Pilot Study to Examine Respiratory Health Effects and Personal PM2.5 Exposures from Cooking Indoors. Int. J. Environ. Res. Public. Health 2016, 13, 791. [Google Scholar] [CrossRef]
  28. Vignati, E.; de Leeuw, G.; Berkowicz, R. Modeling Coastal Aerosol Transport and Effects of Surf-Produced Aerosols on Processes in the Marine Atmospheric Boundary Layer. J. Geophys. Res. 2001, 106, 20225–20238. [Google Scholar] [CrossRef]
  29. Salazar, V.; Bruintjes, R.T.; Breed, D.; Jensen, T.; Piketh, S.; Ross, K.; Al Mangoosh, A.; Al Mandoos, A. Aerosol-Cloud Interactions in the United Arab Emirates. In Proceedings of the 5th Conference on Atmospheric Chemistry: Gases, Aerosols, and Clouds, Long Beach, CA, USA, 8–13 February 2003. [Google Scholar]
  30. Kam, W.; Liacos, J.W.; Schauer, J.J.; Del, R.J.; Sioutas, C. Size-Segregated Composition of Particulate Matter (PM) in Major Roadways and Surface Streets. Atmos. Environ. 2012, 55, 90–97. [Google Scholar] [CrossRef]
  31. Satheesh, S.K.; Krishna Moorthy, K. Radiative Effects of Natural Aerosols: A Review. Atmos. Environ. 2005, 39, 2089–2110. [Google Scholar] [CrossRef]
  32. Chin, M.; Ginoux, P.; Kinne, S.; Torres, O.; Holben, B.N.; Duncan, B.N.; Martin, R.V.; Logan, J.A.; Higurashi, A.; Nakajima, T. Tropospheric Aerosol Optical Thickness from the GOCART Model and Comparisons with Satellite and Sun Photometer Measurements. Am. Meteorol. Soc. 2002, 461–483. [Google Scholar] [CrossRef]
  33. Cheng, T.; Chen, H.; Gu, X.; Yu, T.; Guo, J.; Guo, H. The Inter-Comparison of MODIS, MISR and GOCART Aerosol Products against AERONET Data over China. J. Quant. Spectrosc. Radiat. Transf. 2012, 113, 2135–2145. [Google Scholar] [CrossRef]
  34. Giles, D.M.; Sinyuk, A.; Sorokin, M.S.; Schafer, J.S.; Slutsker, I.; Eck, T.F.; Holben, B.N.; Lewis, J.; Campbell, J. Advancements in the Aerosol Robotic Network (AERONET) Version 3 Database—Automated near Real-Time Quality Control Algorithm with Improved Cloud Screening for Sun Photometer Aerosol Optical Depth (AOD) Measurements. Atmos. Meas. Tech. 2019, 12, 169–209. [Google Scholar] [CrossRef]
  35. Hsu, N.C.; Tsay, S.; King, M.D.; Member, S.; Herman, J.R. Aerosol Properties over Bright-Reflecting Source Regions. IEEE Trans. Geosci. Remote Sens. 2004, 42, 557–569. [Google Scholar] [CrossRef]
  36. Remer, L.A.; Kleidman, R.G.; Levy, R.C.; Kaufman, Y.J.; Mattoo, S.; Martins, J.V.; Ichoku, C.; Koren, I.; Yu, H.; Holben, B.N. Global Aerosol Climatology from the MODIS Satellite Sensors. J. Geophys. Res. Atmos. 2008, 113, 1–18. [Google Scholar] [CrossRef]
  37. Klingmüller, K.; Pozzer, A.; Metzger, S.; Stenchikov, G.L.; Lelieveld, J. Aerosol Optical Depth Trend over the Middle East. Atmos. Chem. Phys. 2016, 16, 5063–5073. [Google Scholar] [CrossRef]
  38. Munir, S.; Gabr, S.; Habeebullah, T.M.; Janajrah, M.A. Spatiotemporal Analysis of Fine Particulate Matter (PM2.5) in Saudi Arabia Using Remote Sensing Data. Egypt. J. Remote Sens. Space Sci. 2016, 19, 195–205. [Google Scholar] [CrossRef]
  39. Jonsson, S.; Xu, W. Volcanic Eruptions in the Southern Red Sea during 2007–2013. In The Red Sea; Springer Earth System Sciences; Springer: Berlin/Heidelberg, Germany, 2015; pp. 175–186. [Google Scholar] [CrossRef]
  40. Yu, Y.; Notaro, M.; Liu, Z.; Kalashnikova, O.; Alkolibi, F.; Fadda, E.; Bakhrjy, F. Assessing Temporal and Spatial Variations in Atmospheric Dust over Saudi Arabia through Satellite, Radiometric, and Station Data. J. Geophys. Res. Atmos. 2013, 118, 253–264. [Google Scholar] [CrossRef]
  41. Provençal, S.; Kishcha, P.; Arlindo, M.; Elhacham, E. Urban Climate AOD Distributions and Trends of Major Aerosol Species over a Selection of the World’s Most Populated Cities Based on the 1st Version of NASA’s MERRA Aerosol Reanalysis. Urban Clim. 2017. [Google Scholar] [CrossRef]
  42. Massoud, R.; Shihadeh, A.L.; Roumié, M.; Youness, M.; Gerard, J.; Saliba, N.; Zaarour, R.; Abboud, M.; Farah, W.; Aoun, N. Intraurban Variability of PM10 and PM2.5 in an Eastern Mediterranean City. Atmos. Res. 2011, 101, 893–901. [Google Scholar] [CrossRef]
  43. Engelbrecht, J.P.; Jayanty, R.K.M. Assessing Sources of Airborne Mineral Dust and Other Aerosols, in Iraq. Aeolian Res. 2013, 9, 153–160. [Google Scholar] [CrossRef]
  44. Gupta, I.; Salunkhe, A.; Kumar, R. Source Apportionment of PM10 by Positive Matrix Factorization in Urban Area of Mumbai, India. Sci. World J. 2012, 2012, 1–13. [Google Scholar] [CrossRef]
  45. Alolayan, M.A.; Brown, K.W.; Evans, J.S.; Bouhamra, W.S.; Koutrakis, P. Source Apportionment of Fine Particles in Kuwait City. Sci. Total Environ. 2013, 448, 14–25. [Google Scholar] [CrossRef]
  46. Khodeir, M.; Shamy, M.; Alghamdi, M.; Zhong, M.; Sun, H.; Costa, M.; Lung-Chi, C.; Maciejczjk, P. Source Apportionment and Elemental Composition of PM2.5 and PM10 in Jeddah City, Saudi Arabia. Atmos. Pollut. Res. 2012, 3, 331–340. [Google Scholar] [CrossRef] [PubMed]
  47. Guo, J.; Yin, Y.; Wu, J.; Zhao, D. Numerical Study of Natural Sea Salt Aerosol and Its Radiative Effects on Climate and Sea Surface Temperature over East Asia. Atmos. Environ. 2015, 106, 110–119. [Google Scholar] [CrossRef]
  48. Kutiel, H.; Furman, H. Dust Storms in the Middle East: Sources of Origin and Their Temporal Characteristics. Indoor Built Environ. 2014. [Google Scholar] [CrossRef]
  49. Pozzer, A.; Meij, A.D.; Yoon, J.; Tost, H.; Georgoulias, A.K.; Astitha, M. AOD Trends during 2001–2010 from Observations and Model Simulations. Atmos. Chem. Phys. 2015, 15, 5521–5535. [Google Scholar] [CrossRef]
Figure 1. Topography of the Arabian Peninsula [17].
Atmosphere 10 00228 g001
Figure 2. Inter-annual variation of dust AOT over the Arabian Peninsula from 2005 through 2015.
Atmosphere 10 00228 g002aAtmosphere 10 00228 g002b
Figure 3. Inter-annual variation of Sulfate AOT over the Arabian Peninsula from 2005 through 2015. Also shown in the 2011 figure panel: (1) The region of shipping and volcanic activity in south western Arabian Peninsula (Yemen and Saudi Arabia), including the industrial region of Jeddah and population centers of Sanaa; (2) the industrial region in the Arabian gulf region that includes Dammam, Kuwait, Bahrain, and Qatar.
Atmosphere 10 00228 g003
Figure 4. Inter-annual variation of sea salt AOT over the Arabian Peninsula from 2005 through 2015. Also shown in the 2013 panel: (1) The region of southern Yemen with the Hadramawt mountain range, (2) the Al Hajjar mountainous region of Oman that is also the wettest part of the Arabian Peninsula, and (3) the Asir mountains in the western and south western Arabian Peninsula.
Atmosphere 10 00228 g004
Figure 5. (Top) Map of the Arabian Peninsula showing the location of the nine urban environments and the contribution of the various aerosol components; (Bottom) total and speciated AOT among the nine cities in the Arabian Peninsula (average from 2005–2015).
Atmosphere 10 00228 g005
Figure 6. Annual variation in aerosol AOT over the Arabian Peninsula cities—cities on the Red Sea vs. cities on the Arabian Gulf.
Atmosphere 10 00228 g006
Figure 7. Annual variation in AOT over the Arabian Peninsula population centers.
Atmosphere 10 00228 g007
Figure 8. Monthly variation in aerosol AOT over the Arabian Peninsula cities—cities on the Red Sea vs. cities on the Arabian Gulf.
Atmosphere 10 00228 g008
Figure 9. Comparison between AERONET AOT and MERRA-2 AOT in (a) Solar Village, Saudi Arabia (left), and (b) Mezaira, UAE (right).
Atmosphere 10 00228 g009
Figure 10. Comparison between MODIS AOT and MERRA-2 AOT.
Atmosphere 10 00228 g010
Table 1. Latitude and longitude used to retrieve modern-era retrospective analysis for research and applications (MERRA-2) aerosol optical thickness (AOT) data.
Latitude-LongitudeWSEN
Dammam49.7526.0050.2526.50
Doha51.2525.0051.7525.50
Dubai55.0025.0055.5025.50
Jeddah39.0021.2539.5021.75
Kuwait47.7529.0048.2529.50
Manama50.2526.0050.7526.50
Muscat58.2523.3558.7523.85
Riyadh46.5024.5047.0025.00
Sanaa44.5015.0045.0015.50
Table 2. Total and speciated AOT for the 2005–2015 period from MERRA-2.
CityTotal AOTMineral Dust AOTMineral Dust %SO4 AOTSO4 %Sea Salt AOTSea Salt %OC AOTOC %BC AOTBC %
Dammam0.490.3672%0.0919%0.024%0.024%0.012%
Doha0.450.3271%0.0818%0.025%0.024%0.012%
Dubai0.400.2768%0.0718%0.037%0.024%0.013%
Jeddah0.400.2359%0.1025%0.0410%0.024%0.012%
Kuwait0.500.3671%0.1020%0.012%0.024%0.012%
Manama0.450.3169%0.0920%0.025%0.024%0.012%
Muscat0.350.2468%0.0618%0.027%0.025%0.012%
Riyadh0.430.3071%0.0921%0.013%0.024%0.012%
Sanaa0.300.2066%0.0723%0.015%0.015%0.012%

