Biases in the Measurement of Ambient Nitrogen Dioxide (NO2) by Palmes Passive Diffusion Tube: A Review of Current Understanding


Abstract
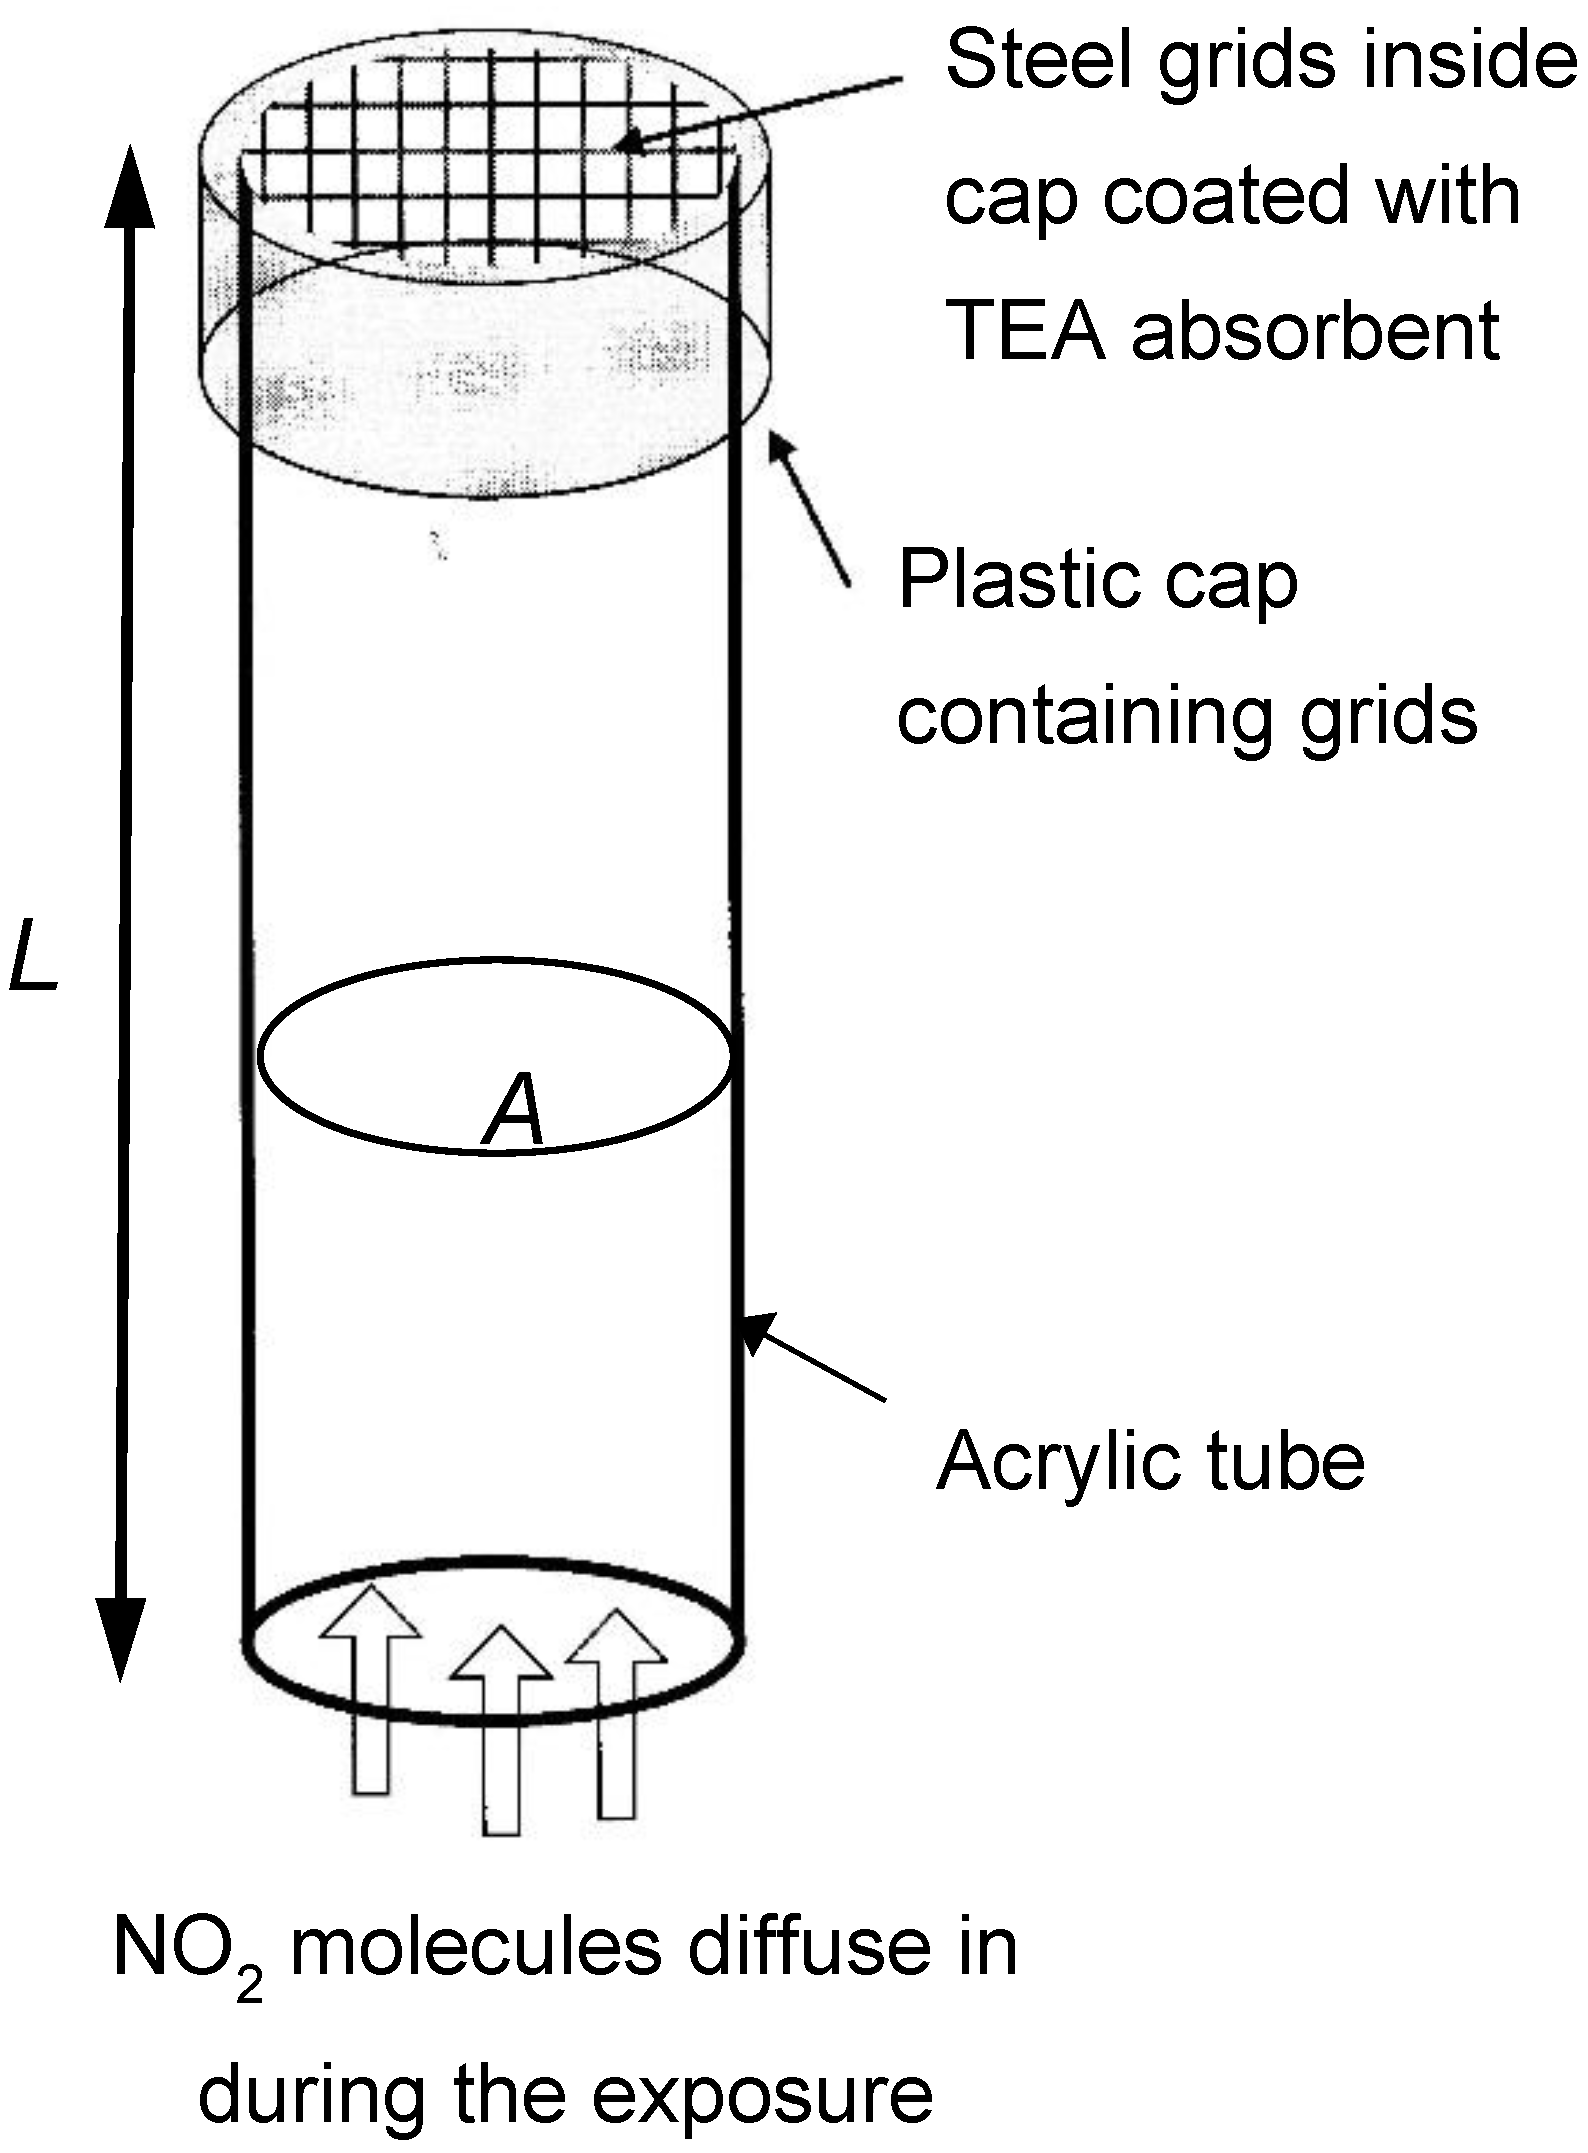
:1. Introduction
2. Conclusions from the Review of the Evidence
2.1. Bias in Preparation of the PDT
2.2. Bias in Quantification of Absorbed Nitrite (NO2−)
2.3. Bias through the Influence of Factors during PDT Exposure
2.3.1. Interference from Co-Pollutants
2.3.2. Variability in Ambient NO2 Concentrations
2.3.3. Effect of Humidity on Stoichiometric Conversion of NO2 to NO2−
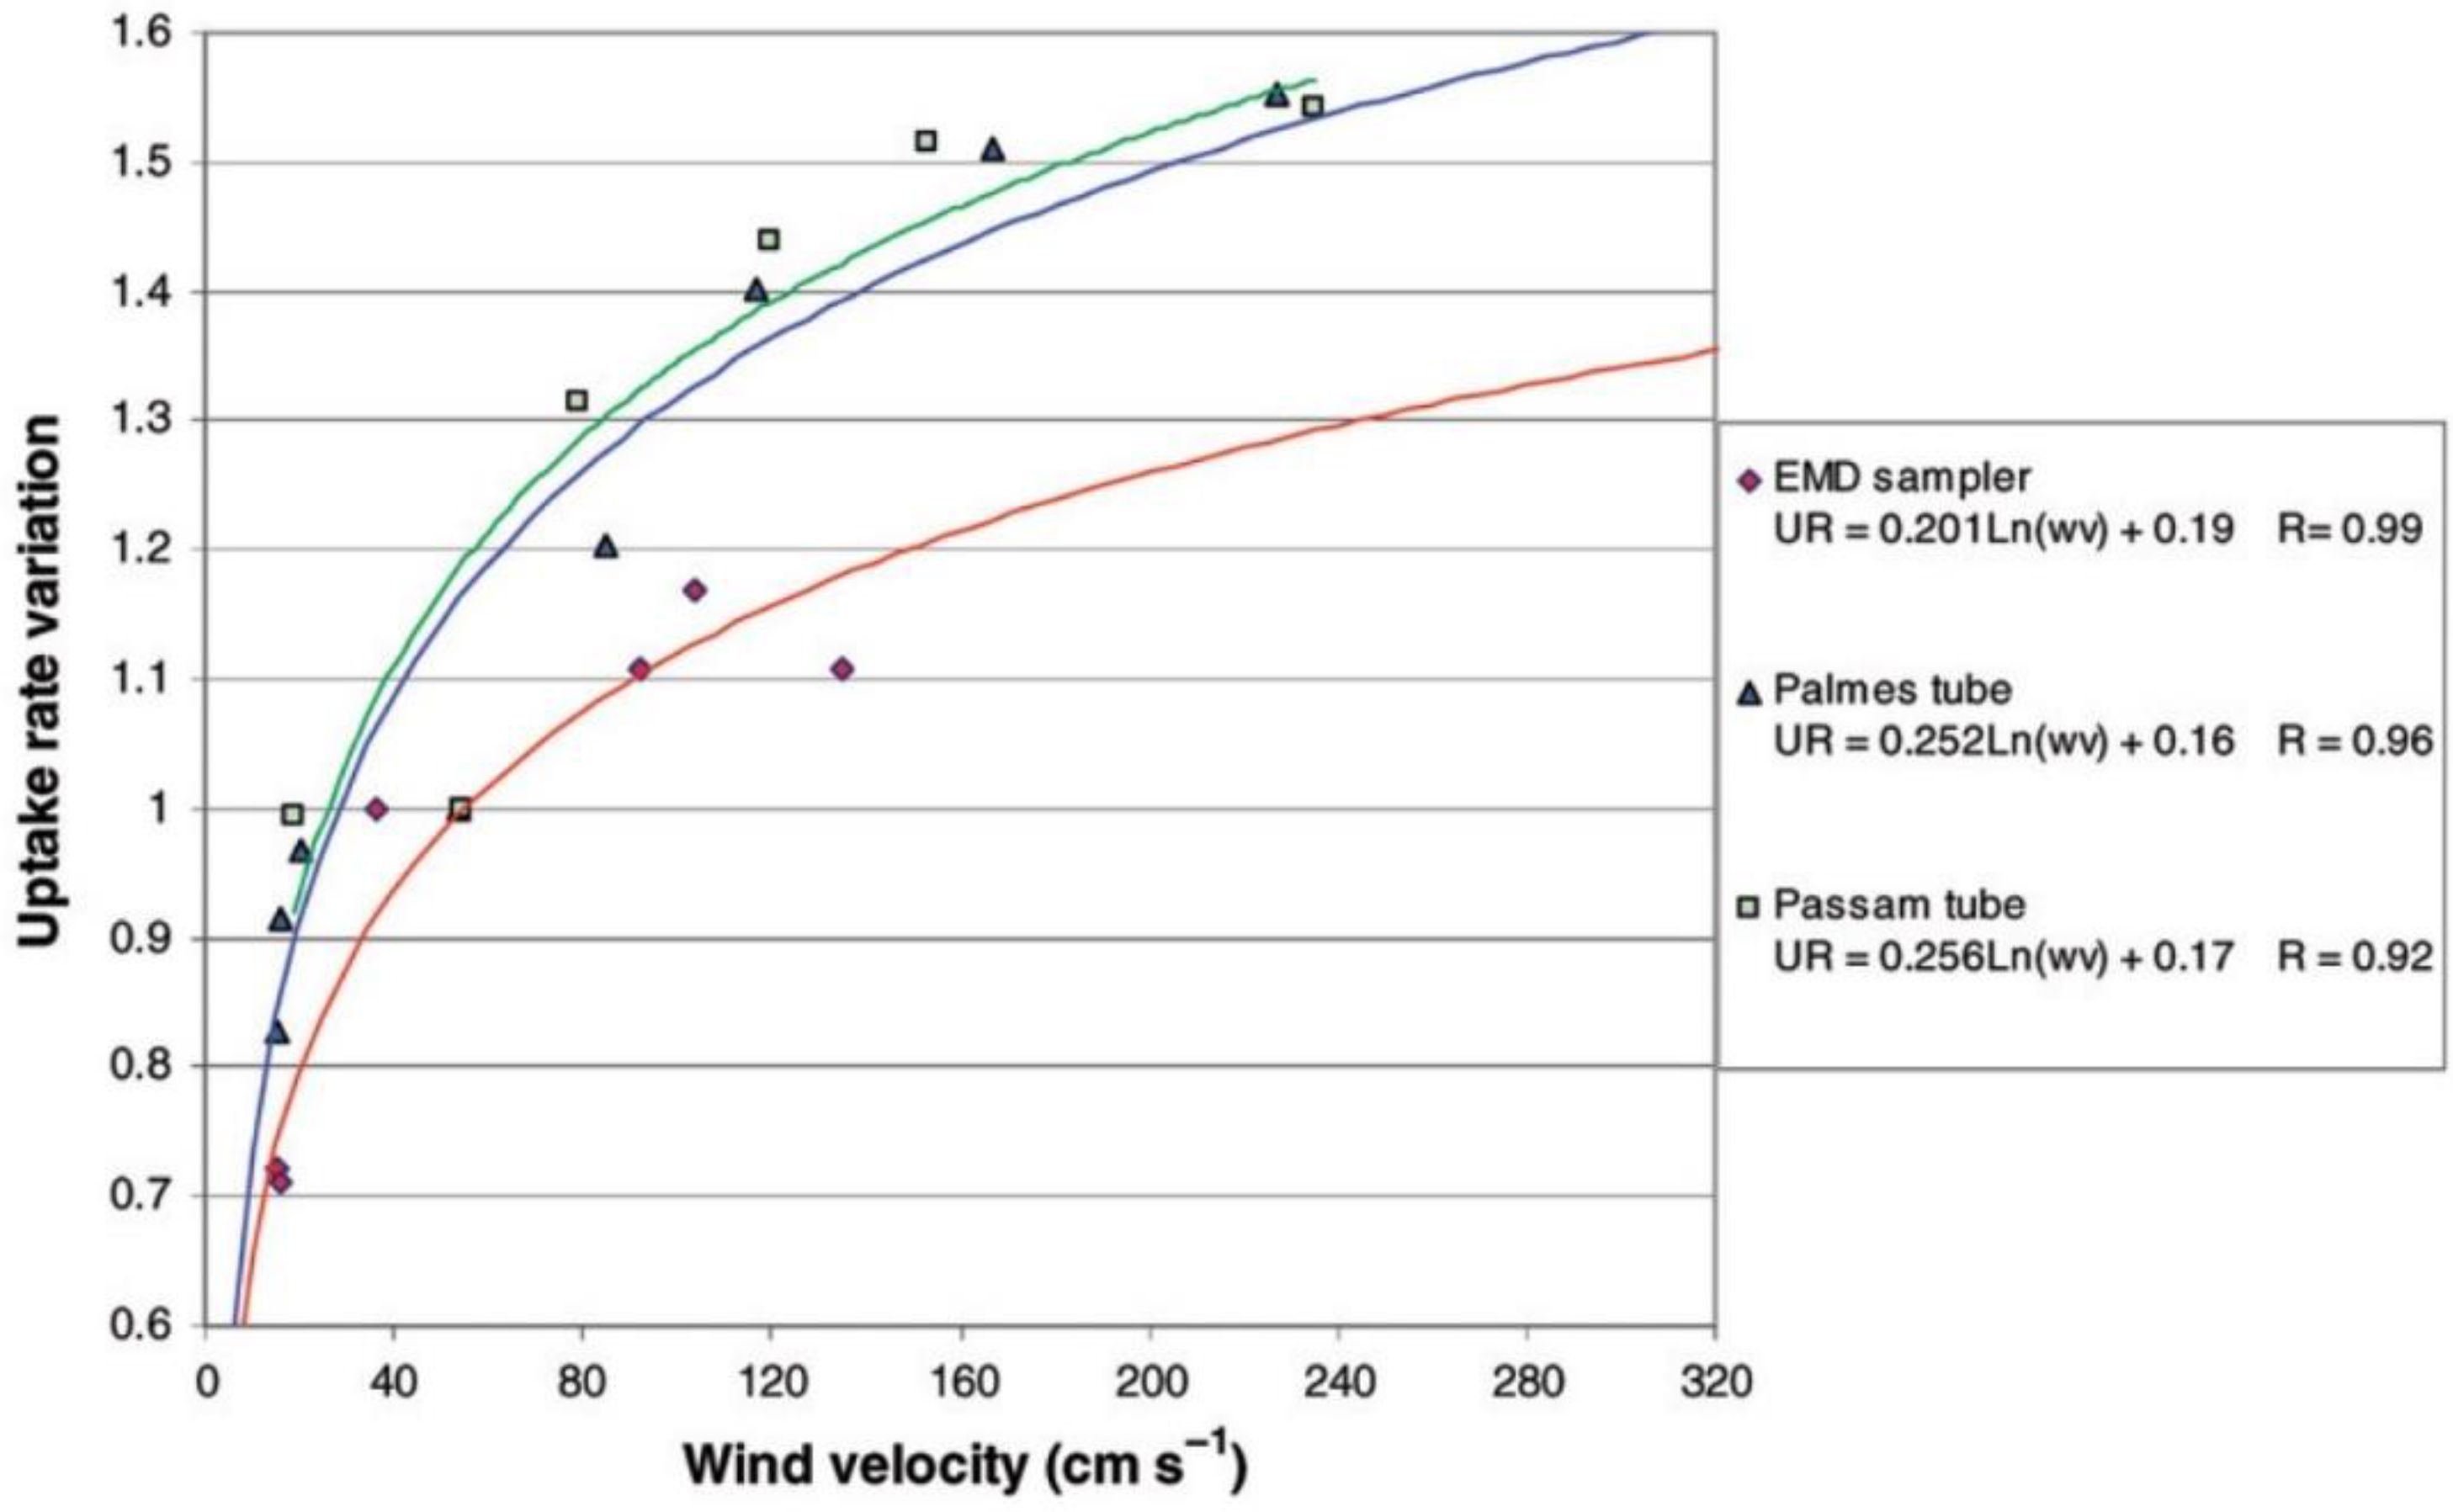
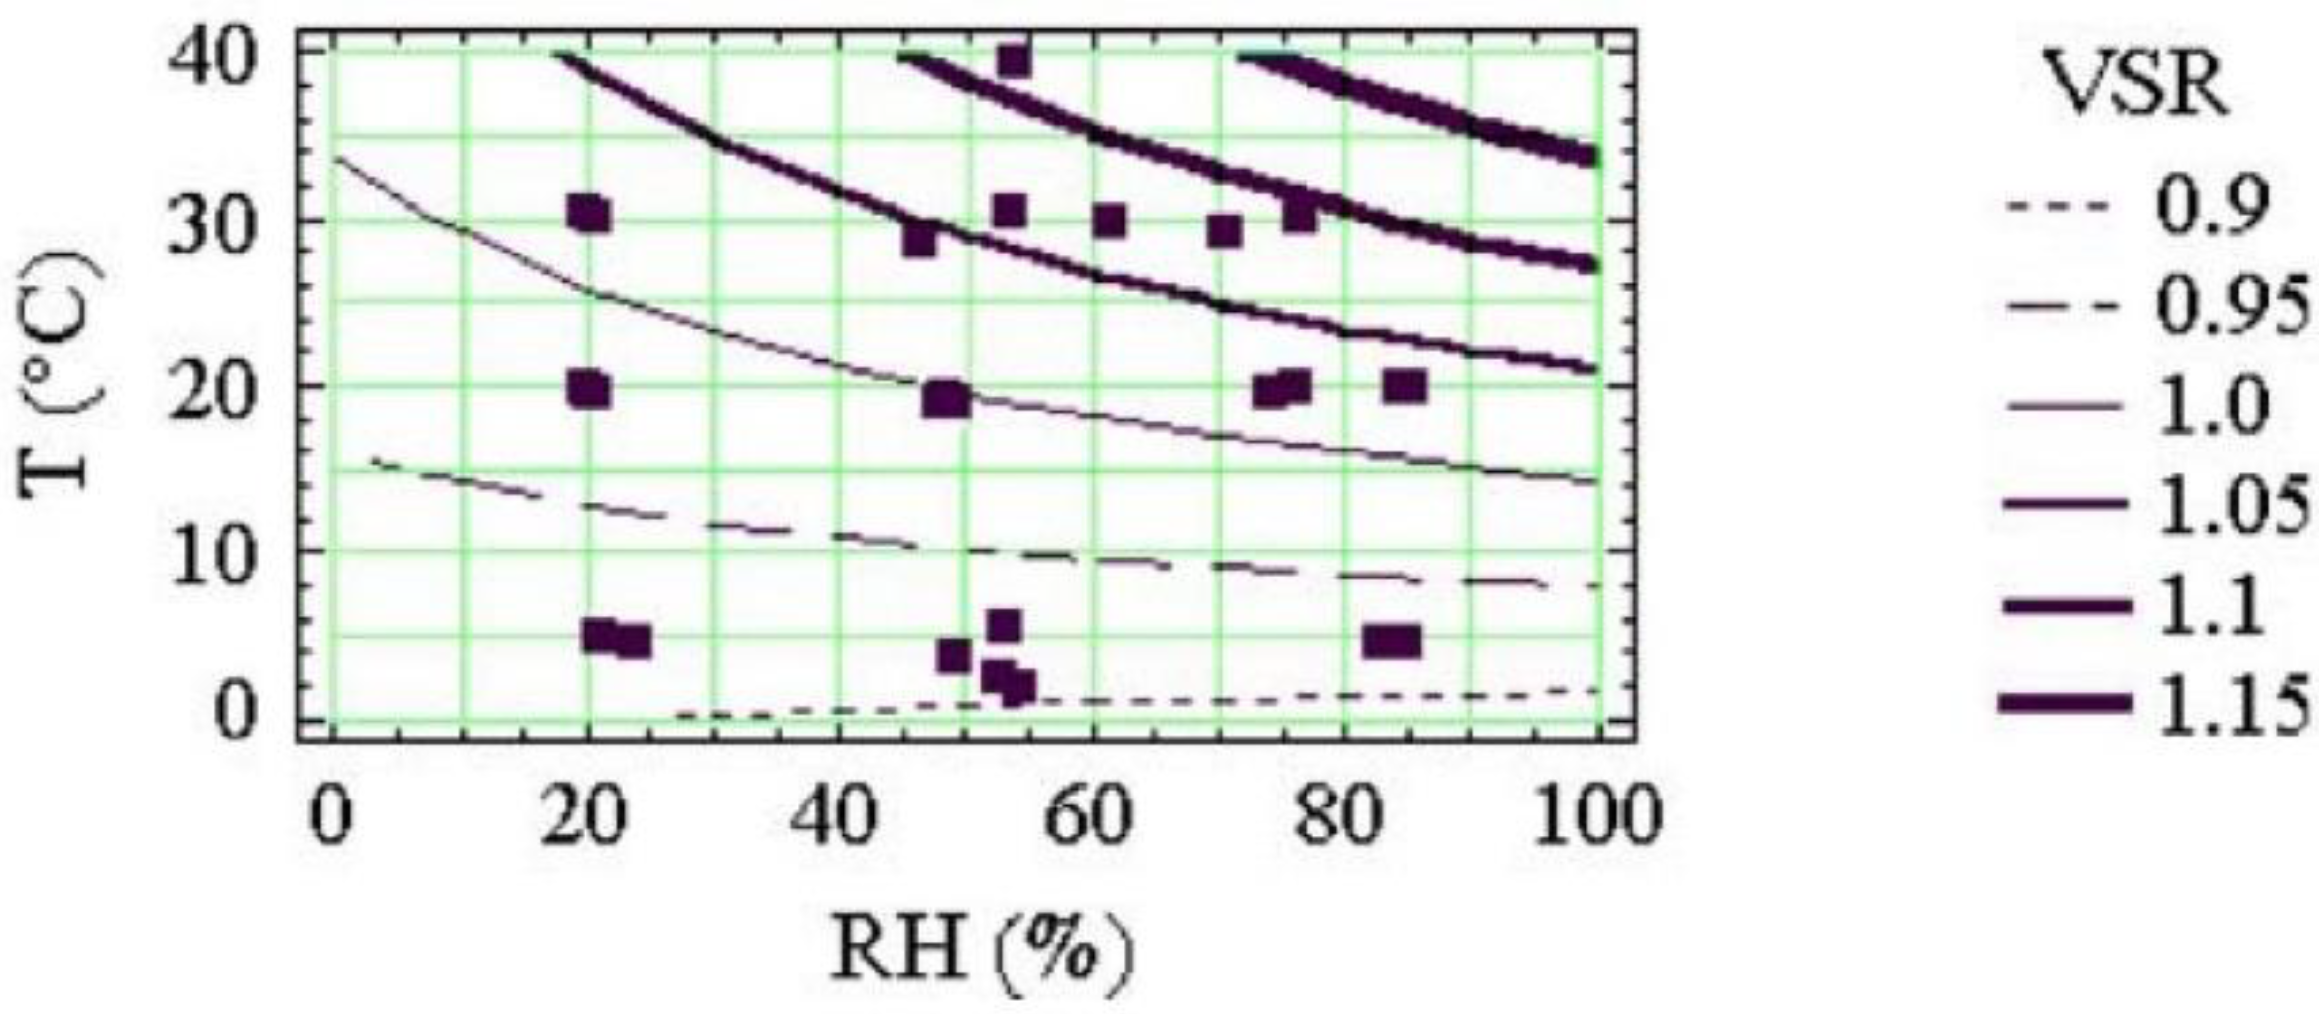
2.3.4. Effect of Ambient Wind Speed, Humidity and Temperature on Uptake Rate
2.3.5. Within-Tube Chemical Generation of Additional NO2
2.3.6. Exposure-Duration “Loss” of Absorbed NO2−
2.4. Bias in Calculation of Average Ambient NO2 from the Quantified NO2−: Uncertainty in the Value of the NO2 Diffusion Coefficient
2.5. Bias in Comparison of PDT NO2 with Chemiluminescence Analyser NO2
3. Overall Conclusions
Author Contributions
Funding
Conflicts of Interest
Appendix A. Review and Discussion of the Evidence for Bias
Appendix A.1. Bias in PDT Preparation
Appendix A.2. Bias in Quantification of Absorbed Nitrite
Appendix A.3. Bias through the Influence of Factors during PDT Exposure
Appendix A.3.1. Interference from Co-Pollutants
Appendix A.3.2. Variability in Ambient NO2 Concentrations
Appendix A.3.3. Effect of Humidity on Stoichiometric Conversion of NO2 to NO2−
Appendix A.3.4. Effect of Ambient Wind Speed, Humidity and Temperature on Uptake Rate
Chamber Studies


Field Studies
Appendix A.3.5. Within-Tube Chemical Generation of Additional NO2
Appendix A.3.6. Exposure-Duration “Loss” of Trapped NO2−
Appendix A.4. Bias in Calculation of Average NO2 from the Quantified NO2−: Uncertainty in the Value of the NO2 Diffusion Coefficient
| Experimental value from Chambers and Sherwood: | 0.129 cm2 s−1; |
| Palmes et al. (using Massman T dependence): | 0.146 cm2 s−1; |
| Massman recommendation (using Massman T dependence): | 0.148 ± 0.015 cm2 s−1; |
| Tang et al. recommendation (using “Fuller” T dependence): | 0.130 ± 0.045 cm2 s−1; |
| Tang et al. “Fuller” estimate (using “Fuller” T dependence): | 0.175 cm2 s−1. |
Appendix A.5. Bias in Comparison of PDT NO2 with Chemiluminescence Analyser NO2
References
- WHO. Air Quality Guidelines. Global Update 2005. Particulate Matter, Ozone, Nitrogen Dioxide and Sulfur Dioxide; World Health Organisation Regional Office for Europe: Copenhagen, Denmark, 2006; ISBN 92-890-2192-6. Available online: http://www.euro.who.int/__data/assets/pdf_file/0005/78638/E90038.pdf (accessed on 5 June 2019).
- WHO. Review of Evidence on Health Aspects of Air Pollution—REVIHAAP Project: Technical Report; World Health Organisation: Copenhagen, Denmark, 2013; Available online: http://www.euro.who.int/ __data/assets/pdf_file/0004/193108/REVIHAAP-Final-technical-report-final-version.pdf (accessed on 5 June 2019).
- EEA. Air Quality in Europe—2018 Report; EEA Report No 12/2018; European Environment Agency: København, Denmark, 2018; ISSN 1977-8449. Available online: https://www.eea.europa.eu//publications/air-quality-in-europe-2018 (accessed on 5 June 2019).
- Baldasano, J.M.; Valera, E.; Jimenez, P. Air quality data from large cities. Sci. Total Environ. 2003, 307, 141–165. [Google Scholar] [CrossRef]
- Larkin, A.; Geddes, J.A.; Martin, R.V.; Xiao, Q.; Liu, Y.; Marshall, J.D.; Brauer, M.; Hystad, P. Global land use regression model for nitrogen dioxide air pollution. Environ. Sci. Technol. 2017, 51, 6957–6964. [Google Scholar] [CrossRef] [PubMed]
- Cyrys, J.; Eeftens, M.; Heinrich, J.; Ampe, C.; Armengaud, A.; Beelen, R.; Bellander, T.; Beregszaszi, T.; Birk, M.; Cesaroni, G.; et al. Variation of NO2 and NOx concentrations between and within 36 European study areas: Results from the ESCAPE study. Atmos. Environ. 2012, 62, 374–390. [Google Scholar] [CrossRef]
- Lin, C.; Feng, X.; Heal, M.R. Temporal persistence of intra-urban spatial contrasts in ambient NO2, O3 and Ox in Edinburgh, UK. Atmos. Pollut. Res. 2016, 7, 734–741. [Google Scholar] [CrossRef]
- Weissert, L.F.; Salmond, J.A.; Miskell, G.; Alavi-Shoshtari, M.; Williams, D.E. Development of a microscale land use regression model for predicting NO2 concentrations at a heavy trafficked suburban area in Auckland, NZ. Sci. Total Environ. 2018, 619–620, 112–119. [Google Scholar] [CrossRef] [PubMed]
- Palmes, E.D.; Gunnison, A.F.; DiMattio, J.; Tomczyk, C. Personal sampler for nitrogen dioxide. Am. Ind. Hyg. Assoc. J. 1976, 37, 570–577. [Google Scholar] [CrossRef] [PubMed]
- Cape, J.N. The use of passive diffusion tubes for measuring concentrations of nitrogen dioxide in air. Crit. Rev. Anal. Chem. 2009, 39, 289–310. [Google Scholar] [CrossRef]
- COMEAP. Associations of Long-Term Average Nitrogen Dioxide with Mortality; PHE Report No. 2018238; UK Department of Health Committee on the Medical Effects of Air Pollutants: London, UK, 2018. Available online: https://assets.publishing.service.gov.uk/government/uploads/system/uploads/attachment_data/file/734799/COMEAP_NO2_Report.pdf (accessed on 5 June 2019).
- EC Directive. Directive 2008/50/EC of the European Parliament and of the Council of 21 May 2008 on Ambient Air Quality and Cleaner Air for Europe; European Parliament, Council of the European Union: Bruxelles, Belgium, 2008; Available online: http://eur-lex.europa.eu/LexUriServ/LexUriServ.do?uri=CELEX:32008L0050:EN:NOT (accessed on 5 June 2019).
- Hafkenscheid, T.; Fromage-Mariette, A.; Goelen, E.; Hangartner, M.; Pfeffer, U.; Plaisance, H.; De Santis, F.; Saunders, K.; Swaans, W.; Tang, Y.S.; et al. Review of the Application of Diffusive Samplers in the European Union for the Monitoring of Nitrogen Dioxide in Ambient Air; JRC Scientific and Technical Report EUR23793; Office for Official Publications of the European Communities: Luxembourg, 2010; ISBN 978-92-79-12052-7. [Google Scholar]
- Defra Working Group (WG). Diffusion Tubes for Ambient NO2 Monitoring: Practical Guidance for Laboratories and Users. A Report by the Defra Working Group on Harmonisation of Diffusion Tube Methods; Report No. AEAT/ENV/R/2504; AEA Energy & Environment: Didcot, UK, 2008; Available online: www.airquality.co.uk/ archive/reports/cat05/0802141004_NO2_WG_PracticalGuidance_Issue1a.pdf (accessed on 5 June 2019).
- AEAT, Summary Results from the UK NO2 Network Field Intercomparison Exercise 1999; AEA Technology Environment: Culham, UK, 2000. Available online: https://uk-air.defra.gov.uk/assets/documents/reports/empire/no2rep2/no2comp.htm (accessed on 25 June 2019).
- Loader, A.; Mooney, D.; Bush, T. UK Nitrogen Dioxide Network 2000; AEAT/ENV/R/0669; AEA Technology Environment: Culham, UK, 2001. Available online: https://uk-air.defra.gov.uk/assets/documents/reports/empire/no2_report_2000.pdf (accessed on 25 June 2019).
- Loader, A. Investigation of the Effects of Preparation Technique on Performance of Nitrogen Dioxide Diffusion Tubes; Report No. AEAT/ENV/R/0563; AEA Technology: Harwell, UK, 2001. [Google Scholar]
- Laxen, D.H.P.; Wilson, P. Compilation of diffusion tube collocation studies carried out by local authorities. In UK Air Quality Archive; Air Quality Consultants: Bristol, UK, 2002; Available online: http://www.airquality.co.uk/archive/reports/cat06/NO2DiffusionTubePerformance(Final).pdf (accessed on 5 June 2019).
- Kirby, C.; Fox, M.; Waterhouse, J. Reliability of nitrogen dioxide passive diffusion tubes for ambient measurement: In situ properties of the triethanolamine absorbent. J. Environ. Monit. 2000, 2, 307–312. [Google Scholar] [CrossRef]
- Hamilton, R.P.; Heal, M.R. Evaluation of method of preparation of passive diffusion tubes for measurement of ambient nitrogen dioxide. J. Environ. Monit. 2004, 6, 12–17. [Google Scholar] [CrossRef]
- Heal, M.R. The effect of absorbent grid preparation method on precision and accuracy of ambient nitrogen dioxide measurement using Palmes passive diffusion tubes. J. Environ. Monit. 2008, 10, 1363–1369. [Google Scholar] [CrossRef]
- Laxen, D.H.P.; Marner, B.; Donovan, S. Analysis of Factors Influencing Diffusion Tube Performance. A Report Prepared for Defra and the Devolved Administrations by Air Quality Consultants Ltd.; Report No. 504/2/F1; AEA Energy & Environment: Defra, UK, 2008. Available online: http://www.airquality.co.uk /archive/reports/cat05/0807101007_Factors_Influencing_Diff_Tube_Performance.pdf (accessed on 25 June 2019).
- Tarvydaite, J.; Kazlauskiene, A. Research of effectiveness of diffusive samplers determining nitrogen dioxide in air. In Proceedings of the ICEE International Conference on Environmental Engineering, Vilnius, Lithuania, 22–23 May 2014. [Google Scholar]
- Bootdee, S.; Chalemrom, P.; Chantara, S. Validation and field application of tailor-made nitrogen dioxide passive samplers. Int. J. Environ. Sci. Technol. 2012, 9, 515–526. [Google Scholar] [CrossRef] [Green Version]
- Vardoulakis, S.; Lumbreras, J.; Solazzo, E. Comparative evaluation of nitrogen oxides and ozone passive diffusion tubes for exposure studies. Atmos. Environ. 2009, 43, 2509–2517. [Google Scholar] [CrossRef]
- Sickles, J.E.; Grohse, P.M.; Hodson, L.L.; Salmons, C.A.; Cox, K.W.; Turner, A.R.; Estes, E.D. Development of a method for the sampling and analysis of sulfur dioxide and nitrogen dioxide from ambient air. Anal. Chem. 1990, 62, 338–346. [Google Scholar] [CrossRef]
- Hisham, M.W.M.; Grosjean, D. Sampling of atmospheric nitrogen dioxide using triethanolamine: Interference from peroxyacetyl nitrate. Atmos. Environ. Part. A Gen. Top. 1990, 24, 2523–2525. [Google Scholar] [CrossRef]
- Gair, A.J.; Penkett, S.A.; Oyola, P. Development of a simple passive technique for the determination of nitrogen dioxide in remote continental locations. Atmos. Environ. 1991, 25, 1927–1939. [Google Scholar] [CrossRef]
- Plaisance, H. Response of a Palmes tube at various fluctuations of concentration in ambient air. Atmos. Environ. 2004, 38, 6115–6120. [Google Scholar] [CrossRef]
- Hearl, F.J.; Manning, M.P. Transient response of diffusion dosimeters. Am. Ind. Hyg. Assoc. J. 1980, 41, 778–783. [Google Scholar] [CrossRef]
- Palmes, E.D.; Johnson, E.R. Explanation of pressure effects on a nitrogen dioxide (NO2) sampler. Am. Ind. Hyg. Assoc. J. 1987, 48, 73–76. [Google Scholar] [CrossRef]
- Glasius, M.; Carlsen, M.F.; Hansen, T.S.; Lohse, C. Measurements of nitrogen dioxide on Funen using diffusion tubes. Atmos. Environ. 1999, 33, 1177–1185. [Google Scholar] [CrossRef]
- Aoyama, T.; Yashiro, T. Analytical study of low-concentration gases: IV. Investigation of the reaction by trapping nitrogen dioxide in air using the triethanolamine method. J. Chromatogr. A 1983, 265, 69–78. [Google Scholar] [CrossRef]
- Poddubny, V.A.; Yushketova, N.A. A physicochemical model of sorption processes in NO2 passive sampling with air humidity effects. Environ. Monit. Assess. 2013, 185, 3819–3829. [Google Scholar] [CrossRef] [PubMed]
- Martin, N.A.; Helmore, J.J.; White, S.; Barker Snook, I.L.; Parish, A.; Gates, L.S. Measurement of nitrogen dioxide diffusive sampling rates for Palmes diffusion tubes using a controlled atmosphere test facility (CATFAC). Atmos. Environ. 2014, 94, 529–537. [Google Scholar] [CrossRef]
- Plaisance, H. The effect of the wind velocity on the uptake rates of various diffusive samplers. Int. J. Environ. Anal. Chem. 2011, 91, 1341–1352. [Google Scholar] [CrossRef]
- Gerboles, M.; Buzica, D.; Amantini, L. Modification of the Palmes diffusion tube and semi-empirical modelling of the uptake rate for monitoring nitrogen dioxide. Atmos. Environ. 2005, 39, 2579–2592. [Google Scholar] [CrossRef]
- Sekine, Y.; Watts, S.F.; Rendell, A.; Butsugan, M. Development of highly sensitive passive sampler for nitrogen dioxide using porous polyethylene membrane filter as turbulence limiting diffuser. Atmos. Environ. 2008, 42, 4079–4088. [Google Scholar] [CrossRef]
- Plaisance, H.; Plechocki-Minguy, A.; Garcia-Fouque, S.; Galloo, J.C. Influence of meteorological factors on the NO2 measurements by passive diffusion tube. Atmos. Environ. 2004, 38, 573–580. [Google Scholar] [CrossRef]
- Buzica, D.; Gerboles, M.; Amantini, L.; Ballesta, P.P.; de Saeger, E. Modelling of the uptake rate of the nitrogen dioxide Palmes diffusive sampler based on the effect of environmental factors. J. Environ. Monit. 2005, 7, 169–174. [Google Scholar] [CrossRef] [PubMed]
- Gerboles, M.; Buzica, D.; Amantini, L.; Lagler, F. Laboratory and field comparison of measurements obtained using the available diffusive samplers for ozone and nitrogen dioxide in ambient air. J. Environ. Monit. 2006, 8, 112–119. [Google Scholar] [CrossRef] [PubMed]
- De Santis, F.; Fino, A.; Tiwari, S.; Vazzana, C.; Allegrini, I. Advances in Air Pollution Series; Wit Press: Southampton, UK, 2000; ISBN 1-85312-822-8. [Google Scholar]
- Masey, N.; Gillespie, J.; Heal, M.R.; Hamilton, S.; Beverland, I.J. Influence of wind-speed on short-duration NO2 measurements using Palmes and Ogawa passive diffusion samplers. Atmos. Environ. 2017, 160, 70–76. [Google Scholar] [CrossRef]
- Sánchez Jiménez, A.; Heal, M.R.; Beverland, I.J. Intercomparison study of NOx passive diffusion tubes with chemiluminescence analysers and evaluation of bias factors. Atmos. Environ. 2011, 45, 3062–3068. [Google Scholar]
- Heal, M.R.; Cape, J.N. A numerical evaluation of chemical interferences in the measurement of ambient nitrogen dioxide by passive diffusion samplers. Atmos. Environ. 1997, 31, 1911–1923. [Google Scholar] [CrossRef]
- Heal, M.R.; O’Donoghue, M.A.; Cape, J.N. Overestimation of urban nitrogen dioxide by passive diffusion tubes: A comparative exposure and model study. Atmos. Environ. 1999, 33, 513–524. [Google Scholar] [CrossRef]
- Heal, M.R.; Kirby, C.; Cape, J.N. Systematic biases in measurement of urban nitrogen dioxide using passive diffusion samplers. Environ. Monit. Assess. 2000, 62, 39–54. [Google Scholar] [CrossRef]
- Swaans, W.; Goelen, E.; De Fre, R.; Damen, E.; Van Avermaet, P.; Roekens, E.; Keppens, V. Laboratory and field validation of a combined NO2-SO2 Radiello passive sampler. J. Environ. Monit. 2007, 9, 1231–1240. [Google Scholar] [CrossRef] [PubMed]
- Ozden, O.; Dogeroglu, T. Field evaluation of a tailor-made new passive sampler for the determination of NO2 levels in ambient air. Environ. Monit. Assess. 2008, 142, 243–253. [Google Scholar] [CrossRef] [PubMed]
- Kirby, C.; Fox, M.; Waterhouse, J.; Drye, T. Influence of environmental parameters on the accuracy of nitrogen dioxide passive diffusion tubes for ambient measurement. J. Environ. Monit. 2001, 3, 150–158. [Google Scholar] [CrossRef]
- Laxen, D.H.P.; Marner, B. The Relationship Between Diffusion Tube Bias and Distance from the Road. A Report Prepared for Defra and the Devolved Administrations by Air Quality Consultants Ltd; Air Quality Consultants Ltd: Bristol, UK, 2006; Available online: http://www.aqconsultants.co.uk/AQC/media/Reports/Bias-Adj-Dist-Road-Rept-Final.pdf (accessed on 5 June 2019).
- Bush, T.; Jenkin, M.E.; Banham, J.; Loader, A. Investigation of NO2 Diffusion Tube Over-Read Resulting from Reduced Photolysis by UV Light; AEA Technology Report AEAT/ENV/R/0562; AEA Technology: Harwell, UK, 2001. [Google Scholar]
- Massman, W.J. A review of the molecular diffusivities of H2O, CO2, CH4, CO, O3, SO2, NH3, N2O, NO and NO2 in air, O2 and N2 near STP. Atmos. Environ. 1998, 32, 1111–1127. [Google Scholar] [CrossRef]
- Chambers, F.S.; Sherwood, T.K. Absorption of nitrogen dioxide by aqueous solutions. Ind. Eng. Chem. 1937, 29, 1415–1422. [Google Scholar] [CrossRef]
- Sviridenko, Y.; Makhin, V.A.; Shandorov, G.S. Determining the diffusivity of nitrogen tetroxide. J. Eng. Phys. 1973, 24, 351–353. [Google Scholar] [CrossRef]
- Tang, M.J.; Cox, R.A.; Kalberer, M. Compilation and evaluation of gas phase diffusion coefficients of reactive trace gases in the atmosphere: Volume 1. Inorganic compounds. Atmos. Chem. Phys. 2014, 14, 9233–9247. [Google Scholar] [CrossRef]
- Fuller, E.N.; Schettler, P.D.; Giddings, J.C. New method for prediction of binary gas-phase diffusion coefficients. Ind. Eng. Chem. 1966, 58, 18–27. [Google Scholar] [CrossRef]
- Fuller, E.N.; Ensley, K.; Giddings, J.C. Diffusion of halogenated hydrocarbons in helium. The effect of structure on collision cross sections. J. Phys. Chem. 1969, 73, 3679–3685. [Google Scholar] [CrossRef]
- Gerboles, M.; Lagler, F.; Rembges, D.; Brun, C. Assessment of uncertainty of NO2 measurements by the chemiluminescence method and discussion of the quality objective of the NO2 European Directive. J. Environ. Monit. 2003, 5, 529–540. [Google Scholar] [CrossRef] [PubMed]
- ISO. Guide to the Expression of Uncertainty in Measurement. International Standards Organisation; ISO: Geneva, Switzerland, 1995; ISBN 92-67-10188-9. [Google Scholar]
- Steinbacher, M.; Zellweger, C.; Schwarzenbach, B.; Bugmann, S.; Buchmann, B.; Ordonez, C.; Prevot, A.S.H.; Hueglin, C. Nitrogen oxide measurements at rural sites in Switzerland: Bias of conventional measurement techniques. J. Geophys. Res. Atmos. 2007, 112. [Google Scholar] [CrossRef] [Green Version]
- Xu, Z.; Wang, T.; Xue, L.K.; Louie, P.K.K.; Luk, C.W.Y.; Gao, J.; Wang, S.L.; Chai, F.H.; Wang, W.X. Evaluating the uncertainties of thermal catalytic conversion in measuring atmospheric nitrogen dioxide at four differently polluted sites in China. Atmos. Environ. 2013, 76, 221–226. [Google Scholar] [CrossRef]
- Jung, J.; Lee, J.; Kim, B.; Oh, S. Seasonal variations in the NO2 artifact from chemiluminescence measurements with a molybdenum converter at a suburban site in Korea (downwind of the Asian continental outflow) during 2015–2016. Atmos. Environ. 2017, 165, 290–300. [Google Scholar] [CrossRef]
- Leston, A.R.; Ollison, W.M. Field evaluations of newly available “interference-free” monitors for nitrogen dioxide and ozone at near-road and conventional National Ambient Air Quality Standards compliance sites. J. Air Waste Manag. Assoc. 2017, 67, 1240–1248. [Google Scholar] [CrossRef] [PubMed]


| Stage in the Methodology | Origin of Potential Bias | Direction of Potential Bias |
|---|---|---|
| PDT preparation | ||
| Choice of solvent for application of triethanolamine (TEA) to grids | −(presumed) a | |
| Application of TEA by pipetting or by dipping grids in solution | −(presumed) a | |
| Insufficient TEA applied to grids leading to saturation of the TEA by absorbed NO2 during exposure | − | |
| Shelf-life of prepared PDT | − | |
| Quantification of absorbed nitrite (NO2−) | ||
| Failure to extract all absorbed NO2− into solution | − | |
| Ratio and absolute concentrations of the sulphanilamide and N-1-naphthyl ethylene diamine dihydrochloride (NEDD) added to the solution of extracted NO2− | −(presumed) a | |
| Pre-mixing or sequential addition of sulphanilamide and NEDD solutions | −(presumed) a | |
| Differential degradation of chromophore intensity because of different times from addition of colour reagent to absorbance measurement between standard and sample solutions | + or − | |
| The influence of factors during PDT exposure | ||
| Ambient nitrous acid (HONO) and peroxyacetyl nitrate (PAN) gases as source of trapped NO2− | + | |
| Variability in ambient NO2 concentrations breaking an assumption in Fick’s first law of diffusion | + | |
| Non-stoichiometric conversion of NO2 to extractable NO2− ion at the absorbent | − | |
| Effects of ambient humidity and temperature during exposure | + or − | |
| Wind at open end of tube leading to turbulent rather than molecular transport of NO2 into the first part of the tube | + | |
| Within-tube chemical reaction (NO + O3 → NO2 + O2) creating additional NO2, the rate of which is determined by the ambient concentrations of NO and O3 during exposure | + | |
| Degradative loss of the absorbed NO2− during exposure | − | |
| Calculation of average ambient NO2 from the quantified NO2− | ||
| Inaccurate value for the diffusion coefficient of NO2 in air | + or − | |
| Comparison of PDT NO2 with chemiluminescence analyser NO2 | ||
| Inaccuracy in the chemiluminescence analyser | + or − | |
| Not reporting PDT and chemiluminescence analyser NO2 concentrations to the same pressure and temperature (p,T) reporting conditions | + or − | |
| Differential interferences from ambient HONO and PAN between PDT and chemiluminescence analyser measurements | + or − | |
© 2019 by the authors. Licensee MDPI, Basel, Switzerland. This article is an open access article distributed under the terms and conditions of the Creative Commons Attribution (CC BY) license (http://creativecommons.org/licenses/by/4.0/).
Share and Cite
Heal, M.R.; Laxen, D.P.H.; Marner, B.B. Biases in the Measurement of Ambient Nitrogen Dioxide (NO2) by Palmes Passive Diffusion Tube: A Review of Current Understanding. Atmosphere 2019, 10, 357. https://0-doi-org.brum.beds.ac.uk/10.3390/atmos10070357
Heal MR, Laxen DPH, Marner BB. Biases in the Measurement of Ambient Nitrogen Dioxide (NO2) by Palmes Passive Diffusion Tube: A Review of Current Understanding. Atmosphere. 2019; 10(7):357. https://0-doi-org.brum.beds.ac.uk/10.3390/atmos10070357
Chicago/Turabian StyleHeal, Mathew R., Duncan P. H. Laxen, and Ben B. Marner. 2019. "Biases in the Measurement of Ambient Nitrogen Dioxide (NO2) by Palmes Passive Diffusion Tube: A Review of Current Understanding" Atmosphere 10, no. 7: 357. https://0-doi-org.brum.beds.ac.uk/10.3390/atmos10070357