Raindrop Size Distribution Characteristics for Tropical Cyclones and Meiyu-Baiu Fronts Impacting Tokyo, Japan

1
State Key Laboratory of Atmospheric Boundary Layer Physics and Atmospheric Chemistry, Institute of Atmospheric Physics, Chinese Academy of Sciences, Beijing 100029, China
2
State Key Laboratory of Severe Weather, Chinese Academy of Meteorological Sciences, Beijing 100081, China
3
Key Laboratory for Cloud Physics of China Meteorological Administration, Chinese Academy of Meteorological Sciences, Beijing 100081, China
*
Author to whom correspondence should be addressed.
Atmosphere 2019, 10(7), 391; https://0-doi-org.brum.beds.ac.uk/10.3390/atmos10070391
Submission received: 6 June 2019
/
Revised: 3 July 2019
/
Accepted: 10 July 2019
/
Published: 12 July 2019
(This article belongs to the Section Meteorology)
Abstract
:Tropical cyclones and meiyu-baiu fronts, as the two main synoptic systems over East Asia, bring heavy rain during summers, but their long-term and vertical raindrop size distribution (RSD) features over the midlatitude Japan Islands are limited. Radar-based quantitative precipitation estimation (QPE) techniques require RSD observations. In this study, five-year observations from Tokyo with a ground-based impact Joss-Waldvogel disdrometer (JWD) and a vertically pointing micro rain radar (MRR) with a vertical range of 0.2–6.0 km were used to study the vertical structures of RSD and QPE parameters. The results showed that the convective rain associated with tropical cyclones had a maritime nature, while the rain associated with the meiyu-baiu front had a continental nature. The rain associated with tropical cyclones had a relatively higher concentration of raindrops and a larger average raindrop diameter than the rain associated with the meiyu-baiu front. The Z–R (radar reflectivity-rain rate) relationships (Z = ARb) based on the JWD data for tropical cyclones, the meiyu-baiu front and total summer rainfall in Tokyo were Z = 189 R1.38, Z = 214 R1.35 and Z = 212 R1.33, respectively. When the Z–R relationships obtained in this study were used to replace the operational relationship of Z = 300 R1.4, the standard deviation of the rain rate was reduced from 5.50 mm/h (2.34 mm/h) to 2.34 mm/h (1.32 mm/h) for typhoon (meiyu-baiu front) rainfall, although the change for total summer rainfall was small. In addition, with increasing height below 4 km, the value of A and b decreased.

1. Introduction
The summer climate of East Asia is strongly influenced by monsoons and tropical cyclones, which produce the major rainy season in the densely populated regions in southeast China and Japan. In the early summer, a quasistationary subtropical front, called the meiyu-baiu front [1,2,3], brings continuous rainfall due to the northward movement of the East Asian summer monsoon, while in the late summer, tropical cyclones, known as typhoons, which are associated with heavy rainfall, reach the midlatitude area of East Asia. Therefore, rainfall characteristic studies of these two synoptic systems are desirable.
Raindrop size distributions (RSDs) are one of the important characteristics of rainfall microphysical processes. Previous studies revealed that the tropical cyclone RSDs varied significantly across different climate regions [4,5,6,7,8,9,10]. Most studies focused on typhoons making landfall on the East Asia continent, such as southeast China [7,9,10], which is strongly influenced by a continental climate, and Wen et al. [9] found that typhoon raindrops in continental China are smaller and have higher concentrations than those in the Pacific and Atlantic. However, few studies have been conducted on the impacts of typhoons in the midlatitude area around the Japan Islands, which is greatly influenced by the ocean climate.
Furthermore, for the meiyu-baiu front, which is another summer rainfall synoptic system in East Asia, the RSD differences also varied between China and southern Japan [11,12,13,14,15,16]. This variation may be caused by the different frontal thermal structures of these systems, with weaker low-level temperature gradients in China than in Japan [17], and by different moisture, aerosol concentrations, storm heights and convective available potential energies [18,19]. However, previously published RSD studies of the meiyu-baiu front have mainly focused on western and central sides [11,12,13,14,15,16], while studies on the eastern side, located in Japan, remain limited.
The RSD varies not only among climate regions and rainfall types but also with height. Most studies have only observed RSD variability using ground measurements [4,19] or only measured the vertical profile of RSDs using vertically pointing Doppler radar with remote sensing methods [20,21,22]. Much of the RSD equipment assumes that there is zero vertical wind. Because the vertical wind is weaker at ground level than at low-level heights, ground RSD measurements are more accurate than RSD profiles measured by radar. More reliable and comprehensive RSD information and evolution can be obtained through observational study, including both direct ground measurements and profiles of radar measurements [23]. The vertically resolved rain parameters from the ground to a low-level height under low-intensity precipitation can be retrieved by a vertically pointing lidar system, a ground-based disdrometer and an analytical model [24,25]. However, comprehensive observational RSD studies under the high-intensity precipitation associated with typhoons and the meiyu-baiu front in East Asia remain limited.
Located in the middle of Japan, Tokyo is one of the largest megacities in the world. Better quantitative precipitation estimation (QPE) for coastal megacities, especially for the two main synoptic systems (typhoons and the meiyu-baiu front) that produce heavy rainfall, is crucial for disaster mitigation and socioeconomic development. Key factors that may help improve QPE include a better understanding of the comprehensive RSD characteristics [5,9]. The microphysics and impacts of typhoon and meiyu-baiu front QPEs in Tokyo have not been compared. In addition, Tokyo is located in the midlatitude area of the Japan Islands, which are impacted by the eastern side of the meiyu-baiu front, but limited studies on the Tokyo region have been reported to our knowledge. Observations of the RSD in Tokyo can improve our understanding of the entire RSD distribution of typhoons and the meiyu-baiu front over East Asia. A useful dataset for this study was provided by a five-year (2005–2009) observation using an impact-type Joss-Waldvogel disdrometer (JWD) and a vertically pointing micro rain radar (MRR) in Tokyo.
This paper is organized as follows: In Section 2, the data and instrumentation are introduced and the rainfall types are classified. In Section 3, the characteristics of ground-based and vertical RSDs and QPE parameters are analyzed for typhoon and meiyu-baiu front rainfall. In Section 4 and Section 5, the results are analyzed, discussed and summarized.
2. Data and Methods
2.1. Instrumentation and Datasets
In this study, rainfall and disdrometer data (http://hydro.iis.u-tokyo.ac.jp/MRR/) were collected in Tokyo, Japan (139.68° E, 35.65° N). The geographic location of the Tokyo site is shown in Figure 1. In this study, a JWD RD-80 [26], a vertically pointing, frequency-modulated, continuous-wave Doppler radar MRR [21] and a tipping bucket rain gauge (RG) were operated on the roof of the Oki-Kanae Laboratory of the Institute of Industrial Science, University of Tokyo. The data covered the summer periods (June–August) of 2005–2009.
The JWD sensor, a widely used ground-based disdrometer, transforms the mechanical momentum of an impacting raindrop into an electrical pulse. The amplitude of the pulse is roughly proportional to the mechanical momentum of the raindrop. From this voltage pulse, the RSD can be inferred. The sampling uncertainty in the rainfall measurement by a JWD is approximately 10–20% [27]. MRR can provide vertical profiles of RSDs of up to 6 km from the measured Doppler reflectivity spectra based on the relationship between the terminal fall velocity and rain drop size [21,28]. Descriptions of both MRR and JWD (RD-80) and their configurations for the datasets used in this study are provided in Table 1. A more detailed description and working principle regarding the JWD and MRR can be found in other studies [21,26,28,29]. The detailed RSD parameter processing, i.e., the mass-weight mean diameter (mm) and the normalized intercept parameter (m−3 mm−1) for both JWD and MRR, can also be found in the Appendix A.
In the estimation of raindrop size, both the JWD and MRR algorithms assume that the raindrops are falling at terminal velocity in still air [21,29], so the JWD and MRR miscalculate the raindrops of certain diameters under heavy rain rates associated with winds [21,29,30]. In addition, the JWD underestimates small drops because of the inherent dead time of the sensor due to mechanical system ringing after a large drop impact [4], while MRR measurements also suffer impacts from turbulence, vertical wind and microwave attenuation during heavy rain [21,28,30]. Tridon et al. [30] noted that strong vertical wind corrupts the MRR retrievals through reflectivity spectrum aliasing and presented a method to correct this problem for vertical wind greater than ~3 m/s. It is difficult to overcome these impacts on RSD measurements from JWD and MRR, so we still used their operation algorithm in this study. To assess the reliability of the JWD and MRR, the 1 h JWD and MRR rainfall measurements were compared with the RG measurements (Figure 2). The JWD on the ground shows a higher correlation (0.98 versus 0.92) and has a slope closer to 1 (0.95 versus 0.82) than the MRR at 600 m. Note that the two lowest range gates are usually omitted from analysis, as they are impacted by near-field effects [21].
2.2. Classification of Rainfall Types
Tokyo represents humid subtropical climate conditions. The mean annual precipitation is 1528.8 mm (1981–2010), as calculated by the Japan Meteorological Agency (JMA) (http://www.data.jma.go.jp/obd/stats/data/en/normal/normal.html). Two types of synoptic-scale systems, i.e., tropical cyclones (four events) and the meiyu-baiu front (10 events), and one type of mesoscale system, i.e., local storms (two events), that brought rainfall to Tokyo during the summers of 2005–2009 were selected based on the official track data of tropical cyclones (http://www.data.jma.go.jp/fcd/yoho/typhoon/index.html) and the weather map (http://www.data.jma.go.jp/fcd/yoho/hibiten/index.html). These systems are listed in Table 2. Most meiyu-baiu fronts impacted Tokyo in June and July, depending on the East Asian monsoon, while tropical cyclones mostly passed Tokyo in July and August. Tropical storms were defined as tropical cyclones with a 10 min maximum sustained wind speed (MSW) of >18 m/s according to the JMA, and typhoons were defined as tropical cyclones with an MSW of >33 m/s.
2.3. Other Data
The precipitation radar (PR) onboard the Tropical Rainfall Measuring Mission (TRMM) has a 13.8 GHz frequency (2.2 cm wavelength), a field-of-view diameter of approximately 5.0 km at nadir and a 0.25 km range resolution [31,32]. TRMM 2A25 products (version 7) used PR reflectivity measurements (https://disc.gsfc.nasa.gov/datasets/TRMM_2A25_V7/summary) to retrieve the rain profiles from 0 to 20 km [31,32,33]. The profile of attenuation-corrected PR reflectivity and rain rate, together with the surface rain rate of TRMM 2A25 products along the TRMM tracks, were used in this study to characterize the 3D rainfall distribution of the three rain types listed in Table 2. Note that only one TRMM scan passes over Tokyo per day. In addition, the radiosonde sounding measurements (http://www.esrl.noaa.gov/raobs) at Tateno (Figure 1) were used to detect the 0 °C isotherm level heights.
3. Results
3.1. Overview of the Three Rain Types
The four selected tropical cyclones had similar tracks, with northeastward movement along the southern coast of Japan (Figure 1). Their intensity all decrease as they approach Tokyo. Those tropical cyclone centers were located south of Tokyo, with two landfalls with IDs 2005-7 and 2005-11 (Figure 1). The nearest tropical cyclone center to the measurement site was ~30 km for typhoon 2005-11, with the lowest sea pressure level and maximal wind speed among the four tropical cyclones (Figure 1). These cyclones produced rainfall amounts of between 62.5 and 106.9 mm in Tokyo, as measured by the RG over the two days (Table 2). The ten meiyu-baiu fronts were also located mostly south of Tokyo and produced rainfall amounts of between 24.8 and 61.8 mm in Tokyo, as measured by RG, and the duration varied from 3 to 9 days (Table 2). The two local rainstorms were located on the west side or bottom of the surface high pressure, with rainfall amounts in Tokyo varying from 10 to 12.1 mm (Table 2). Similar to the 1 h observation comparison in Section 2.1, the slope between the JWD and RG data was higher than that between the MRR and RG data (Table 2). The rainfall during each event measured by the MRR was lower than that by the RG except for typhoon 2005-11, which had a larger aliasing error in the rain rate due to strong vertical winds (Table 2).
Figure 3 presents the time–height cross sections of reflectivity from the MRR of 0.2 to 6 km for the three rainfall types. The tropical cyclone has a higher bright band (0 °C isotherm level) up to ~4.6 km than the meiyu-baiu front (~4.1 km), which is mainly caused by their different occurrence times in the latter and early summer, respectively (Figure 3). The well-defined bright bands existed in the two rain types, meaning that most of the rainfall from the tropical cyclones and the meiyu-baiu fronts is characterized by some stratiform structure and deep cold cloud precipitation (Figure 3a,b). The mixed convective stratiform structure, as a few convective cells, was also found in the two rain types (Figure 3a,b). However, the local rainstorms with near-surface high pressure were convective and had more shallow warm cloud precipitation with the reflectivity of RSD > 25 dBZ up to 3 km (Figure 3c). In addition, the rainfall from the tropical cyclone occurred mostly before the typhoon center and the lowest pressure passed (Figure 3a).
The horizontal rainfall distributions of the three rainfall types based on the PR of TRMM are shown in Figure 4. The spiral rain bands, in which convection and precipitation outside the eyewall of a tropical cyclone is organized into spirally banded structures, are more clearly visible for tropical cyclones 2006-7 and 2005-11 (Figure 4b,d) than for the other two tropical cyclones (Figure 4a,c). From the TRMM overpass observation, tropical cyclone 2005-11 produced the greatest rainfall in the Tokyo area, a finding that differs from the RG observations, indicating that low-frequency, space-borne radar scanning cannot capture the detailed rainfall structure of fast-developing precipitation systems. Frontal rainfall structure can also be found in the meiyu-baiu front (Figure 4e). The precipitating clouds of the local storms were smaller than those of the tropical cyclones and the meiyu-baiu front (Figure 4f).
3.2. Vertical Profiles of Mean Rain Parameters
The mean rain rate (R) and radar reflectivity (Z) profiles from 0.6 to 4.0 km for the tropical cyclones, the meiyu-baiu front and the local storms based on the MRR are shown in Figure 5a,b, with rain rates at 600 m of >2 mm/h. The R of the tropical cyclones and the local storms showed negative gradients, while that of the meiyu-baiu fronts showed a positive gradient (Figure 5a). The Z presented nearly negative gradients for these three rain types (Figure 5b). At low-level heights below 1.8 km, the R and Z generally decreased in the following order: local storm > tropical cyclone > meiyu-baiu front (Figure 5a,b).
The mean R and Z profiles can also be obtained from the PR of TRMM, but only one overpass over the Tokyo area is available per day. Here, the mean R and Z profiles were calculated based on a surface rain rate of >2 mm/h within 33–37° N and 137–142° E to understand the rainfall microphysics characteristics of the three rain types (Figure 5c,d). The R and Z were independent of height, with R and Z values of approximately 6 mm/h and 35 dBZ, respectively. The TRMM and MRR measurements of R were comparable, whereas the TRMM measurement of Z was higher than the MRR measurements (~30 dBZ). The R and Z values of the local storms were larger than those of the other two types between 1.5 and 2.5 km, similar to the MRR measurements. The difference between the MRR and TRMM for these rain types could be caused by differences in the sample data used in this study and in the associated measurement principles. The mean R measured by TRMM below 1.5 km may not be real, as it decreased as height decreased. Note that the MRR observations are from bottom up, while the PR aboard the TRMM satellite is from the top down. The R measured by TRMM at low-level heights was underestimated because it suffered a greater impact of rainfall attenuation under heavy rainfall conditions.
3.3. Distributions of Dm and Nw
Figure 6a shows the scatterplot of Dm versus log10Nw for rainfall from tropical cyclones, the meiyu-baiu fronts and local storms based on the JWD data. The two gray rectangles were the maritime and continental convective clusters reported by Bringi et al. [34]. The tropical cyclone rain data in the Dm–log10Nw scatterplot generally plotted in the maritime-like field defined by Bringi et al. [34] more than in the continental field, while the opposite pattern was true for the meiyu-baiu front and local storms (Figure 6a). This result indicated that the convective rain associated with the tropical cyclone had a maritime nature, while that associated with the meiyu-baiu front and local storms had a continental nature. In addition, both convective and stratiform rain existed for the three rain types, as no remarkable difference was observed in the drop number on the two sides of the dashed line (Figure 6a). The tropical cyclone rainfall had a relatively higher concentration of raindrops and a larger average raindrop diameter than the meiyu-baiu front rainfall, while the tropical cyclone rainfall had a higher concentration of raindrops but a smaller average raindrop diameter than the local storm rainfall (Table 3).
The values of Nw ranged logarithmically from 2 to 5.2, while Dm ranged from 0.3 to 2.3 mm during a low rain rate of R < 5 mm/h (Figure 6b–d). Under the conditions of R < 5 mm/h, the maximal log10Nw of the local storm was 4.7, while those of the tropical cyclone and meiyu-baiu front were 5 and 5.2, respectively. The distribution patterns of log10Nw–Dm for the tropical cyclone and meiyu-baiu front were similar in the categories of R < 5 mm/h and 5 mm/h ≤ R < 10 mm/h. The numbers of tropical cyclone rainfall events in the 10 mm/h ≤ R < 30 mm/h and R > 30 mm/h categories were greater than those of the meiyu-baiu front and local storms (Figure 6b–d). Notably, the rain rate of 5 mm/h could be used as one of the criteria to distinguish convective and stratiform rain, similar to the research of Chen et al. [11], as the results of the stratiform rain cluster were nearly R < 5 mm/h and distributed below the dashed line in Figure 6 [34], as found by Chen et al. [11].
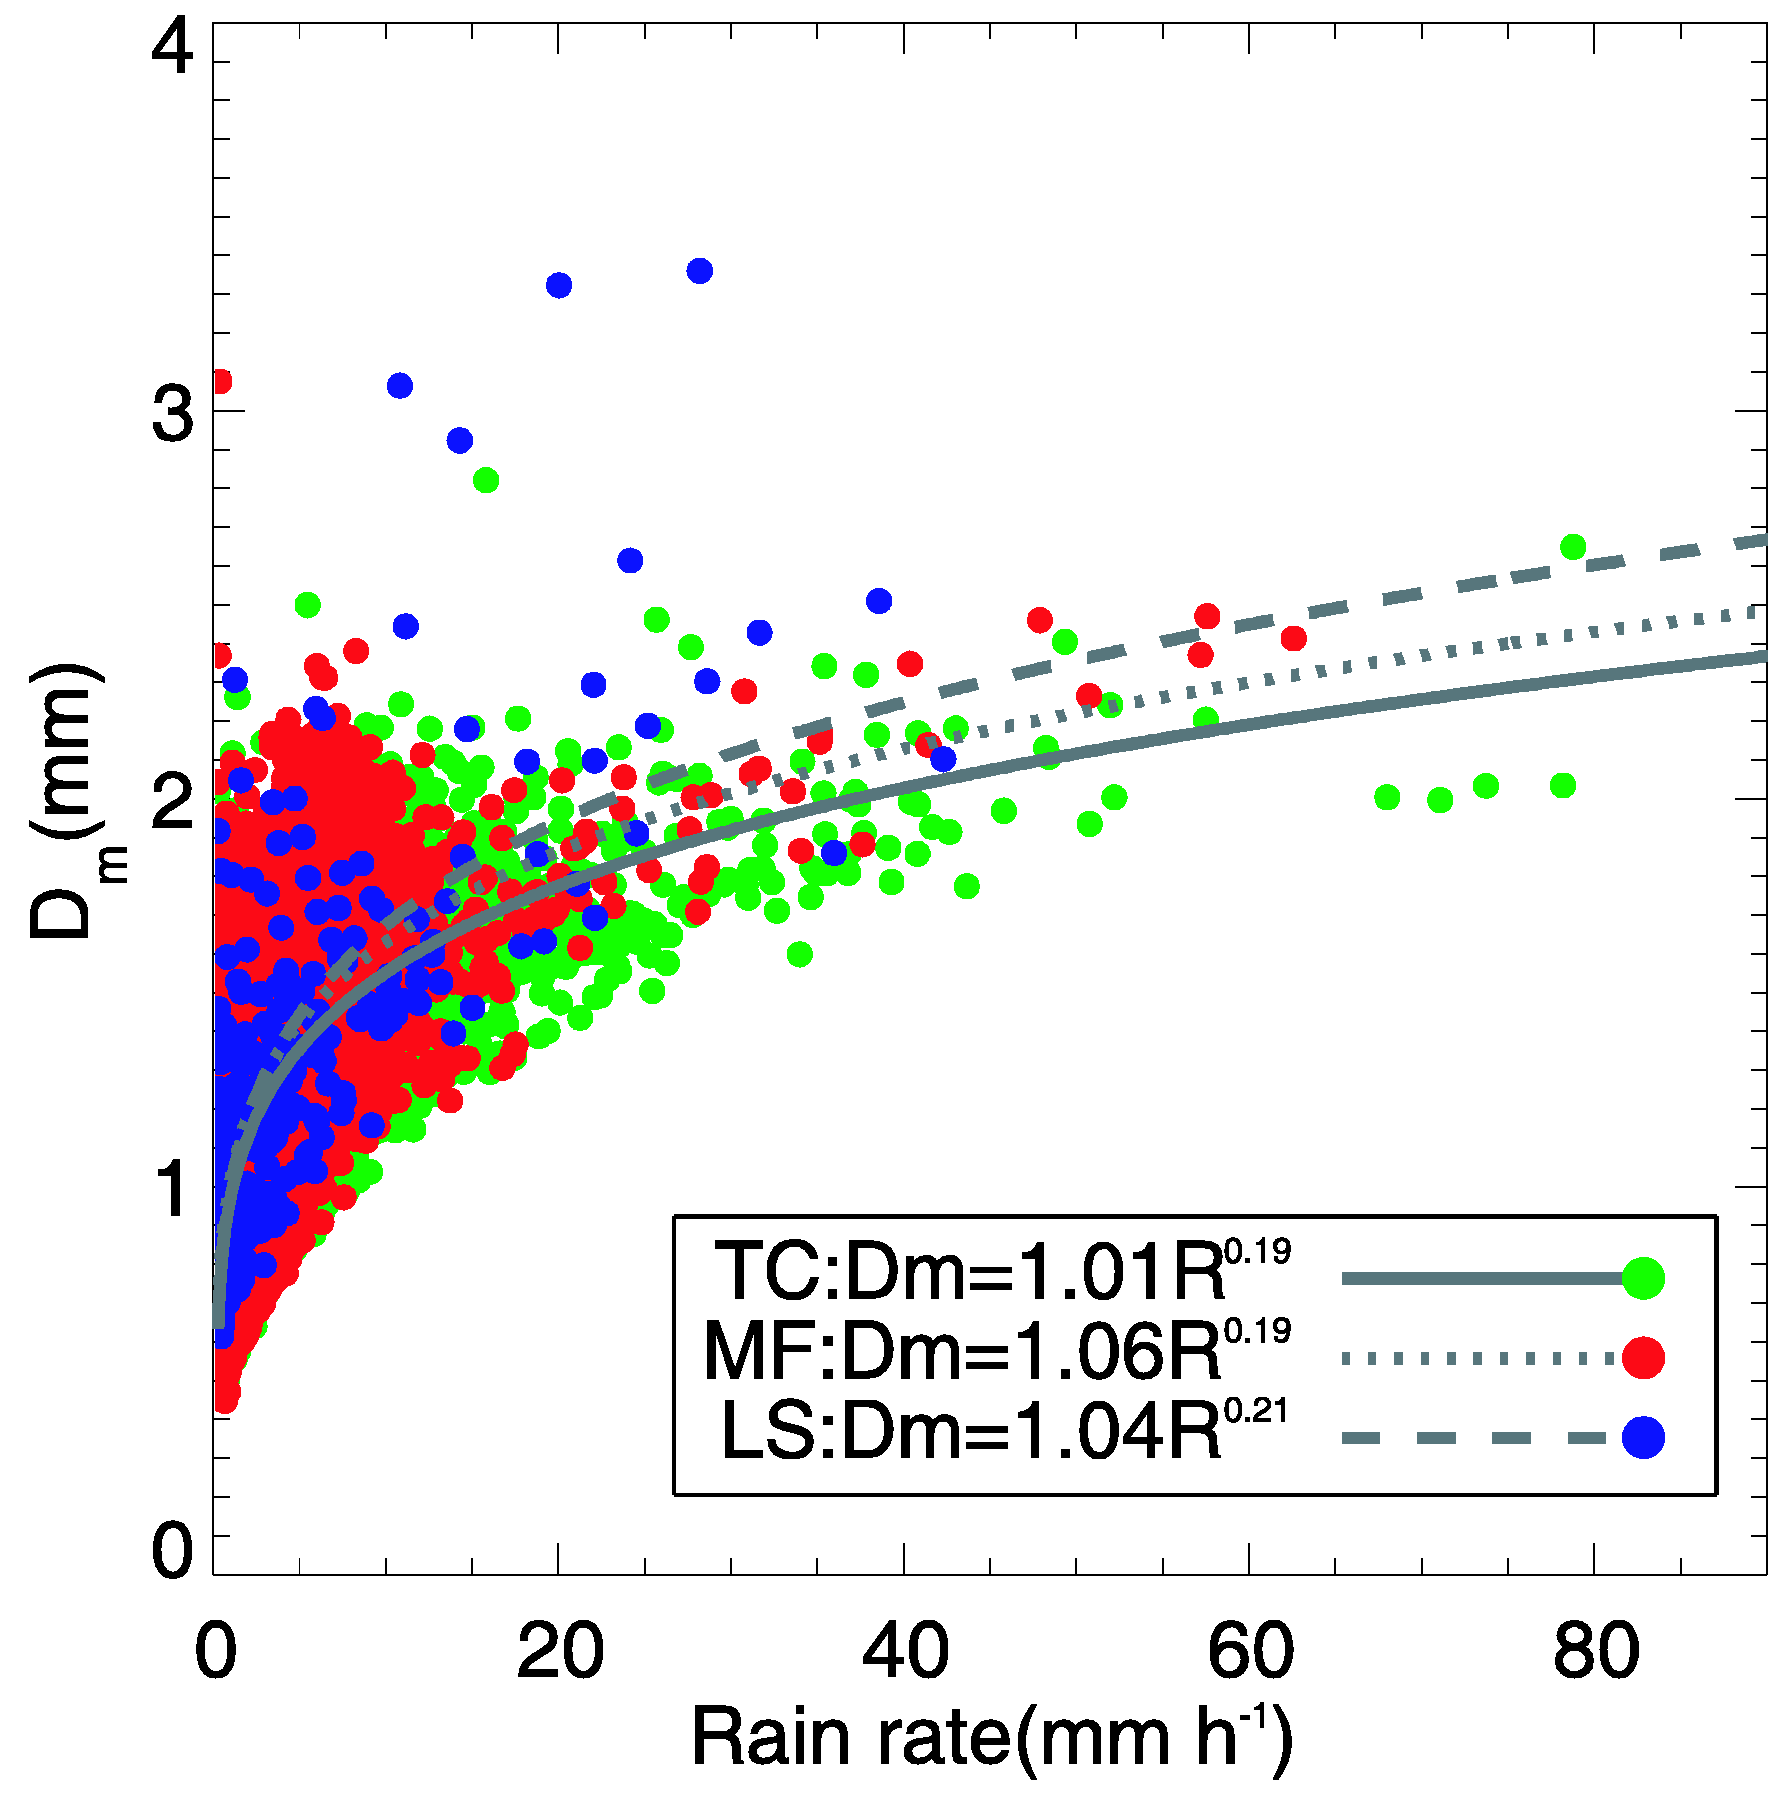
Figure 7 presents a scatterplot of Dm–R and fitted power law relationships with the three rain types to study the variability in the Dm with rain types and R. The positive exponents in the relationships of Dm–R suggested that the Dm values increased with the rain intensity, possibly due to more efficient coalescence mechanisms [11,12]. Notably, at high R, Dm remained at a constant value due to the RSDs reaching an equilibrium state where coalescence and breakup of raindrops were nearly in balance [36]. The local storms had the largest exponent values of the Dm–R relationship among the three rain types. Hence, for a given rain rate, the rain from a local storm had higher Dm values than the tropical cyclone and meiyu-baiu front events.
3.4. Composite Raindrop Spectra
Figure 8 shows the percentage contribution of various diameter raindrops to R and total number concentration (Nt) for tropical cyclones, meiyu-baiu fronts and local storms based on the JWD data. The contributions to R and Nt by drop size were similar for the three rain types, while their proportions varied. The contribution to Nt decreased with the growth of the drop size, while that to R increased and then decreased. The midsize raindrop bins (1 mm ≤ D < 2 mm) contributed the most to the rain rate, while the small raindrop bins (D < 1 mm) contributed the most to the number concentration for the three rain types. Among the three rain types, the rain associated with the meiyu-baiu front had the maximal number of small drops, while that associated with the tropical cyclone had the maximal number of midsize drops. Similar results could be found for the contribution to the rain rate. In other words, the RSDs of the tropical cyclones were more similar to the local storms than those of the meiyu-baiu front. In addition, the small and midsize drops contributed more than 99% of the concentration of raindrops, indicating that the small and midsize drops jointly dominate the summer rainfall in Tokyo. Note that large drops (D > 2 mm) contributed 7–9% of rain rates, especially for the tropical cyclones and local storms, implying the importance of large drops for these two rain types.
To investigate the overall RSD characteristics of the three rain types and the measured difference due to different equipment, Figure 9a presents the composite drop size spectra for the three rain types obtained by averaging all the instant size spectra for each subset by the MRR and JWD. The largest, middle and smallest RSDs corresponded to local storms, tropical cyclones and the meiyu-baiu front, respectively, for both the MRR and the JWD, suggesting that the number of large and midsize raindrops is greater in local storms and tropical cyclones than in meiyu-baiu front events. Smaller RSD measurements from the MRR than those from the JWD were also found in Figure 9a, with more RSD variations in the local storms and tropical cyclones than those in the meiyu-baiu front, indicating that the MRR measurements suffered less impact from vertical wind during the meiyu-baiu front.
Considering the 40 dBZ radar reflectivity, including the physical characteristics of convective rain [4], we grouped together JWD-based RSD with radar reflectivity between 39 and 41 dBZ (approximately 40 dBZ) for each tropical cyclone following Tokay et al. [4], as shown in Figure 9b. In comparison to a typhoon event (2005-11), the RSD of two tropical storms (2005-7 and 2007-4) had a higher concentration at D < 2.4 mm for midsize drops and a lower concentration at D ≥ 2.4 mm for large drops. However, the pattern differed for the tropical storm 2006-7. Notably, the tropical cyclone 2006-7 was initially a typhoon and weakened to a tropical storm when it reached the outskirts of Tokyo (Figure 1), thus indicating that the RSD of convective rain was partly related to the intensity of the tropical cyclone. The RSD variation in Atlantic hurricanes and tropical storms in the 40 dBZ composite raindrop spectra also showed no strict dependence on the intensity of the tropical cyclone according to Tokay et al. [4], which is similar to our results. In addition, Wen et al. [9] noted that the variation in large drop sizes could be attributed to insufficient raindrop samples. Therefore, the variation in RSD could be related to the different stages when the tropical cyclone passed and the insufficiency of raindrop samples used [9].
As mentioned above, the RSD of tropical cyclones varied with their temporal evolution; herein, the typhoon event (2005-11) was investigated in three stages as it passed Tokyo (Figure 3a) to determine the RSD temporal variability in this tropical cyclone. Both stages 1 and 2 were associated with the eyewall before tropical cyclone landfall and exhibited intermittent and continuous rainfall, respectively (Figure 3a). Stage 3 was associated with the eye and eyewall after tropical cyclone landfall (Figure 3a). Note that the classification of these three stages is only based on microphysical variations. Figure 9c presents the JWD-based RSD for the three stages. The RSDs of Stage 1 (S1) and Stage 2 (S2) were highly coincident, while the RSD of Stage 3 (S3) was obviously different from those of S1 and S2, with higher concentrations of midsize and large drops in S1 and S2 than in S3(Figure 9c). The RSDs of S1 and S2 were also similar to the composite JWD-based RSD for the four tropical cyclones, especially for midsize- and large-raindrop RSDs (Figure 9a,c), indicating that the microphysical characteristics of rainfall during the entire tropical cyclone were mostly dominated by those of the eyewall.
3.5. Z–R Relationship
The parameters A and b of the radar rainfall estimation algorithm Z = ARb for these three rain types were different mainly due to their different RSDs. The principles of different disdrometers also introduced variance in the Z = ARb relationship [35,37]. Hence, we examined the degree of variation in the radar rainfall estimation parameters impacted by different rain types and equipment (Table 4). The JWD measurements had larger values of A and b than the MRR measurements, except for A in the meiyu-baiu front; for example, the relationship for the tropical cyclone was Z = 189 R1.38 from the JWD measurement and Z = 186 R1.2 from the MRR measurement. The variation between the disdrometer and the MRR measurements was similar to the results of Wen et al. [35] and Jash et al. [37]. The JWD observed higher concentrations of midsize and larger drops than the MRR (Figure 9). Because the reflectivity depends on the sixth power of the drop diameter, it is reflected very strongly in the value of the power (b = 1.35~1.38 for JWD, b = 1.14~1.23 for MRR) of the Z–R relationship [37].
The coefficient A indicates the size of the drops, and the power b indicates the microphysical processes [8]. For example, a larger A means larger drops, while a larger b (b > 1) means a size or mixed controlled process (collision and coalescence) and b ~ 1 indicates a number-controlled process (collision, coalescence and breakup) that produces an equilibrium RSD [8,38]. The power values (b) of the ground Z–R relationship (approximately 1.37) for the three rain types by JWD represent the RSD spectra that evolved through mixed controlled processes (Table 4). In addition, the larger b for the tropical cyclone and local storm (1.38 and 1.37, respectively) than for the meiyu-baiu front (1.35) based on the JWD data (Table 4) may be related to the abundant content of large drops in the tropical cyclones and local storms [39].
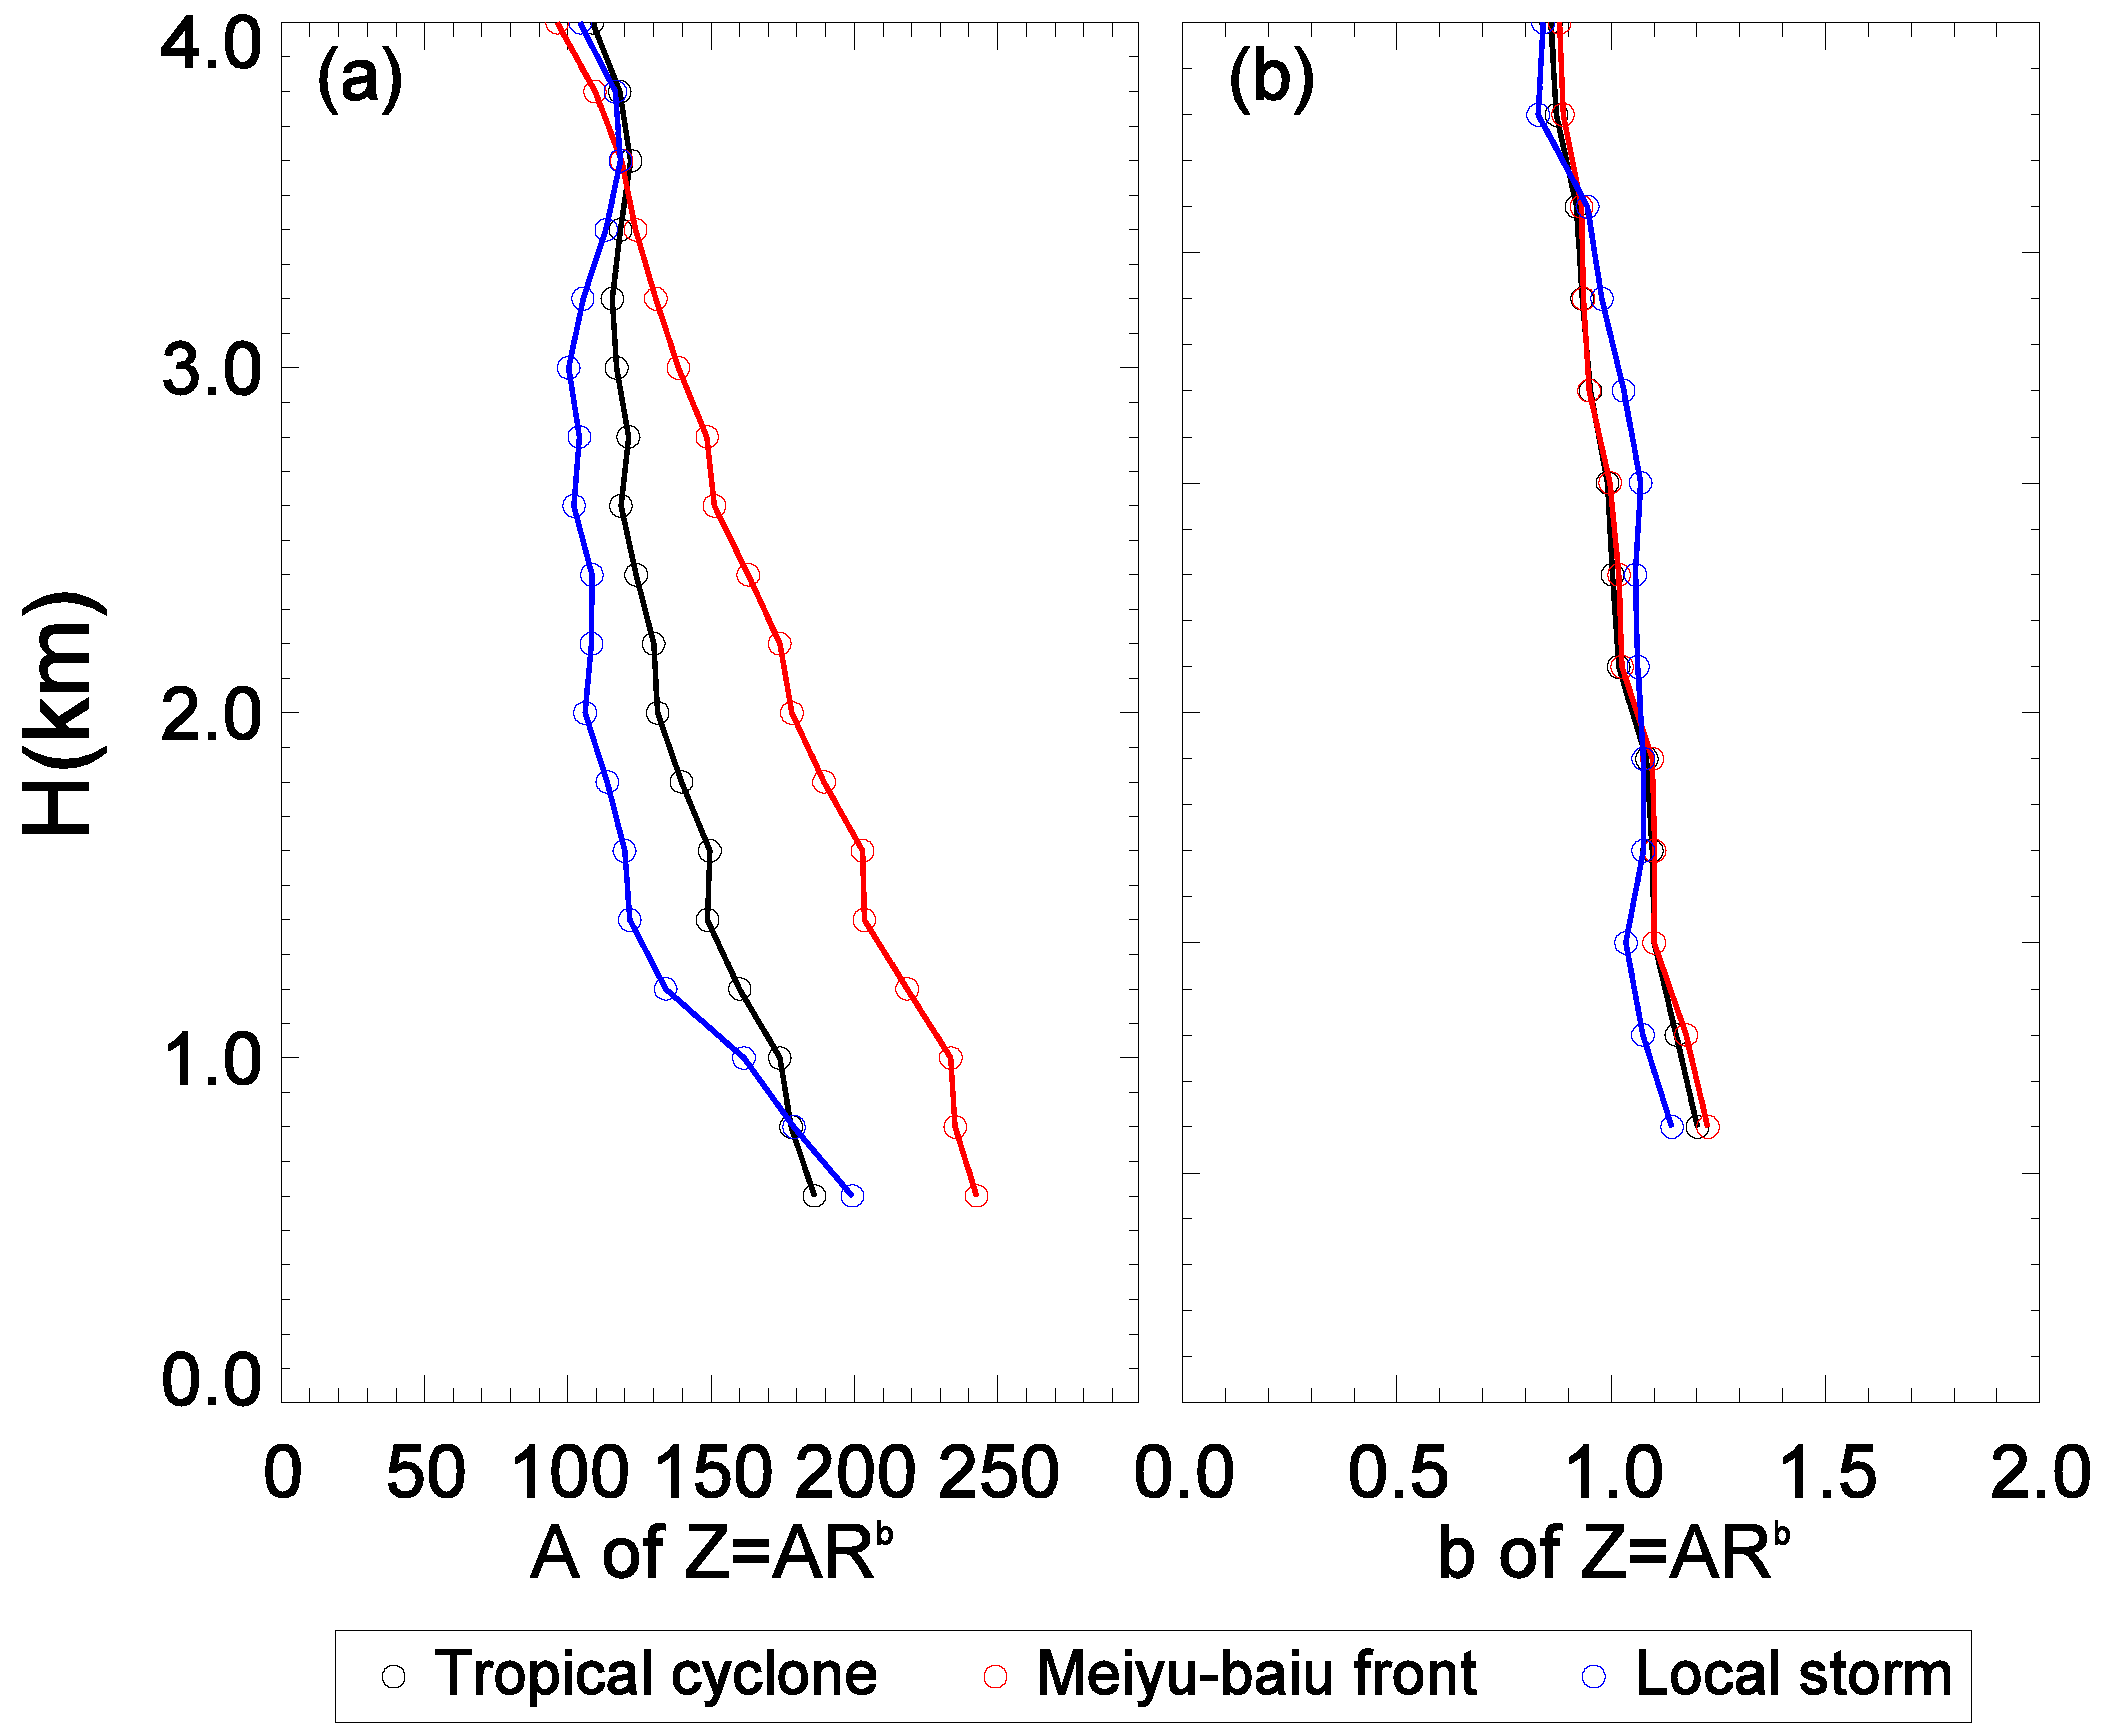
Figure 10 presents the vertical distributions of coefficient A and power b of the Z–R relationship for the tropical cyclone, meiyu-baiu front and local storm based on MRR data. The value of A decreased from 186 to 109 (243~96 and 199~104, respectively) with increasing height (i.e., 0.6 km and 4.0 km, respectively), and simultaneously, the value of b decreased from 1.20 to 0.80 (1.23~0.79 and 1.14~0.72, respectively) at the same heights for the tropical cyclones (the meiyu-baiu front and local storms). The vertical variation in b for both the tropical cyclones and meiyu-baiu front was very similar.
The vertical variability in the Z–R relationship has been reported in Australia [40], USA [23], China [20] and Indonesia [41]. For convective rainfall, the value of A decreased with increasing height, and the value of b increased in the studies [23,40], while the value of b decreased from 0.5 to 2.0 km in the study [41]. For stratiform rainfall, the vertical variability in the Z–R relationship was small, including A and b below the bright band [20,40]. Considering the more convective characteristics of the three rain types in this study, our result was similar to the study of Marzuki et al. [41], but different from other studies, suggesting that considerable variations in the Z–R relationship exist worldwide.
The Z–R relationships of the three stages (Figure 3a) of the typhoon event (2005-11) were calculated to obtain their temporal variability (Table 5). The value of coefficient (A) varied from 131 to 275, and the value of power b varied from 1.29 to 1.39 (Table 5). The Z–R relationships of S1 and S2 were similar to that of the entire event (Z = 236 R1.38, Table 2). In addition, the mean Z and R of S3 were smaller than those of S1 and S2 (Table 5). Note that the temporal variability of the Z–R relationship can cause error in radar-based QPE.
4. Discussion
The results provided detailed RSD features and Z–R relationships for two synoptic systems (typhoon and meiyu-baiu front) and one local rainstorm in Tokyo. Considering that the RSD characteristics and Z–R relationship were dependent on the climate region and rain types, as well as the impact from the instrumentation limitations, we discuss the factors below. Table 3 and Table 4 list the comparison of RSD features and Z–R relationships for the tropical cyclone and meiyu-baiu front rainfall measurements in different climate regions and using different equipment. For rainfall from the tropical cyclone, the mean Dm in Tokyo was 1.25 mm (Table 3), which is larger than that in East China (1.13 mm) and lower than that in the Atlantic tropical cyclones (1.67 mm), indicating that there is a small difference in RSDs between the Pacific tropical cyclones, while a larger difference in RSDs exists between the Pacific tropical cyclones and Atlantic tropical cyclones. The Z–R relationship for Pacific tropical cyclones in Tokyo was Z = 189 R1.38 based on the JWD data, while the value of A varied from 147 to 308 in East China, with b varying from 1.3 to 1.45. The Z–R relationships for the eyewalls of typhoons making landfall in East China and Tokyo corresponded to the equations Z = 308R1.32 and Z = 275R1.39, respectively. If the scope is broadened to outside of East Asia, the Z–R relationships Z = 275R1.39 and Z = 234R1.30 were found for Indian and Australian cyclones, respectively (Table 4). The variation in the power of b (mostly from 1.3~1.4) was relatively small in the tropical cyclones. Different topographic effects (such as landfall, distance from the tropical cyclone center, water vapor, local anthropogenic aerosol effects and entrainment of cold air) could play an important role in the microphysical processes formed by RSD [4,5,8,9,18,42].
For rainfall on the east side of the meiyu-baiu front, the mean Dm and log10Nw in Tokyo were 1.15 mm and 3.59 mm−1 m−3, respectively, while those on the west side in East China were 1.18~1.66 mm and 3.42~3.99 mm−1 m−3, respectively. These values indicate that small raindrops fell in Tokyo and that a considerable number of raindrops fell in both areas. The Z–R relationships of the meiyu-baiu front in Tokyo and East China were Z = 214 R1.35 and Z = 209 R1.39 (Z = 368 R1.21), respectively. The variations in RSDs and the Z–R relationship on both sides of the meiyu-baiu front could be caused by differences in moisture, storm height and convective available potential energy [18,19]. In addition, the variations could be caused by the differences in the datasets used, where the meiyu-baiu fronts in our study were selected from a weather map, while other studies [11,12] used meiyu seasonal data.
For summer rainfall, raindrops of similar sizes but in lower abundance were found in Tokyo (1.15 mm and 3.59 mm−1 m−3) compared to East China (1.15 mm and 4.09 mm−1 m−3). The Z–R relationships of the summer rainfall in Tokyo, East China and Taiwan [18,19] were Z = 212 R1.33, Z = 232 R1.34 and Z = 283 R1.35, respectively, with the value of b varying only from 1.33 to 1.35. Small variations in the Z–R relationship in this area suggest that the same climate region and the same rainfall synoptic systems (e.g., typhoon and meiyu-baiu front) lead to similar RSDs, although their observational periods are different. However, the Z–R relationships were different from Z = 300 R1.4, which is widely adopted in operational weather radar rainfall estimations [43], and some biases in QPEs could be produced if Z = 300 R1.4 was used in the summer for East Asia. Notably, this similar Z–R relationship was found based on the large seasonal or climatological dataset. From the event-by-event perspective, a larger difference in the Z–R relationship still existed (Table 2).
To evaluate the rainfall estimated with local and operational Z–R relationships, the standard deviation (SD) for the rain rate Rc was calculated using the reflectivity with the Z–R relationship and Ro rainfall observed by the JWD within 1 min, which is defined as . Compared with the operational relationship Z = 300 R1.4, if we used the Z–R relationship observed in this study in Tokyo for the typhoon, meiyu-baiu front and all summer data, the SD would decrease from 5.50 mm/h, 2.24 mm/h and 4.10 mm/h to 2.34 mm/h, 1.32 mm/h and 4.06 mm/h, respectively.
The measurement height and retrieval method applied for the disdrometers introduced uncertainties into the results. A height of 600 m was used here for the MRR, whereas a height of 200 m was used in other studies [35], and when compared with the ground rainfall and RSD, this mismatch may produce some uncertainty [23]. Additionally, some uncertainties originate from the retrieval method based on the zero-wind assumption in convective rain due to the aliasing effect, especially for MRR. Therefore, JWD observations were mostly used when we compared these observations with other disdrometer observations over different areas, and the MRR observations were used to understand the vertical RSD profile.
5. Conclusions
In this paper, the vertical structures of RSD features and QPE parameters of two main synoptic systems, typhoons and meiyu-baiu fronts impacting Tokyo, are reported based on five-year summer observations with a ground-based impact disdrometer (JWD) and a vertically pointing radar (MRR). The observed results in Tokyo are useful for understanding the RSD features of typhoons impacting the midlatitude Japan Islands and the east side of the meiyu-baiu front over East Asia. The primary findings can be summarized as follows:
(1) Four tropical cyclones and 10 meiyu-baiu front events that impacted Tokyo were selected and had well-defined bright bands, with higher bright bands (~4.6 km) in the tropical cyclones than in the meiyu-baiu fronts (~4.1 km), and both rainfall events were characterized by some stratiform structures and deep cold cloud precipitation.
(2) The convective rain of the tropical cyclones had a maritime nature, while that of the meiyu-baiu front was continental in nature. The RSDs of the tropical cyclone rain had a relatively higher number concentration (log10Nw: 3.74 vs. 3.59) and a larger average diameter (Dm: 1.25 vs. 1.15) than those of the meiyu-baiu front rain.
(3) The rain associated with the meiyu-baiu front had a large number of small drops, while that associated with the tropical cyclone had a large number of midsize drops. The contribution of larger drops (D > 2 mm) to rain rates in the tropical cyclone (7–9%) was larger than that in the meiyu-baiu front. A greater number of larger drops were found in the 40 dBZ composite raindrop spectra of the typhoon (or ex-typhoon) than in that of the tropical storm, and this difference is partly related to the intensity of the tropical cyclone.
(4) The Z–R relationships based on the JWD data for tropical cyclones, the meiyu-baiu front and total summer rainfall in Tokyo were Z = 189 R1.38, Z = 214 R1.35 and Z = 212 R1.33, respectively. The value of b based on JWD data is larger than that of the MRR data. The value of A and b decreased with increasing height (0.6–4.0 km). The variation in the Z–R relationship in summer in East Asia based on this study and the research of [18,19], is small, especially for the b values, which vary only from 1.33 to 1.35.
(5) When the Z–R relationships obtained in this study were used to replace the operational relationship Z = 300 R1.4, the SD was reduced from 5.50 mm/h (2.34 mm/h) to 2.34 mm/h (1.32 mm/h) for the typhoon (meiyu-baiu front) rainfall, although the SD showed minor variations for all summer rainfall.
Although some interesting findings for researchers of weather radar and cloud physics have been obtained based on the RSD features and Z–R relationships for typhoons and meiyu-baiu fronts impacting Tokyo, the results are still not well addressed due to the limited number of data samples and equipment limitations. The microphysical processes that result in the differences between typhoons and meiyu-baiu fronts are worth further study.
Author Contributions
Y.C. and J.D. contributed to the investigation, methodology, formal analysis, writing, and review of the paper. J.A. and H.L. contributed to the investigation, writing, and review of the paper.
Funding
This work was jointly funded by the National Key R&D Program of China (grant number 2017YFC1501404) and National Natural Science Foundation of China (grant number 41675137).
Acknowledgments
We would like to thank the Oki-Kanae Laboratory of the Institute of Industrial Science, University of Tokyo (http://hydro.iis.u-tokyo.ac.jp/MRR/), for collecting and providing the RSD data in this study. The weather map and tropical cyclone track data were provided by the JMA (http://www.data.jma.go.jp). The TRMM PR products version 7 (2A25) were obtained from the Distributed Active Archive Center at NASA’s Goddard Space Flight Center (https://disc.gsfc.nasa.gov). We also wish to thank the three anonymous reviewers for their constructive comments.
Conflicts of Interest
The authors declare that they have no conflict of interest.
Appendix A
The RSD (m−3 mm−1) obtained from the JWD is based on the following equation [6]:
where is the number of raindrops measured in the size bin i, A (m2) is the sampling area (50 cm2), (s) is the sampling time (60 s), (mm) is the average diameter for the size bin i, is the corresponding diameter interval (mm) and is the fall velocity of a drop using the relation [44].
The RSD (m−3 mm−1) measured by the MRR can be derived from the equation with the Doppler spectra [21]:
where is the spectral volume scattering cross section, is derived via the derivative of Equation (A5), uses the analytic fit from Atlas et al. [45] according to Gunn et al. [44], and is the single particle backscattering cross section calculated by the Mie theory.
where is a constant that reflects radar parameters, is the normalized transfer function, is the attenuation on the two-way propagation path and is the measured Doppler spectrum [21].
where is the MRR wavelength, and m is the complex refraction index of water [28].
From the RSD, drop diameter and terminal velocity, the total number concentration (m−3), radar reflectivity factor Z (mm6 m−3), rain rate R (mm h−1), liquid water content LWC (g m−3), the mass-weight mean diameter (mm) and the normalized intercept parameter (m−3 mm−1) [34] are derived using Equations (A7)–(A12).
where is the water density (1 g cm−3).
References
- Ding, Y.; Chan, J.C.L. The East Asian summer monsoon: an overview. Meteorol. Atmos. Phys. 2005, 89, 117–142. [Google Scholar]
- Sampe, T.; Xie, S.-P. Large-scale dynamics of the meiyu-baiu rainband: Environmental forcing by the westerly jet. J. Climate 2010, 23, 113–134. [Google Scholar] [CrossRef]
- Reid, J.S.; Xian, P.; Holben, B.N.; Hyer, E.J.; Reid, E.A.; Salinas, S.V.; Zhang, J.; Campbell, J.R.; Chew, B.N.; Holz, R.E.; et al. Aerosol meteorology of the maritime continent for the 2012 7SEAS southwest monsoon intensive study—Part 1: Regional-scale phenomena. Atmos. Chem. Phys. 2016, 16, 14041–14056. [Google Scholar] [CrossRef]
- Tokay, A.; Bashor, P.G.; Habib, E.; Kasparis, T. Raindrop size distribution measurements in tropical cyclones. Mon. Wea. Rev. 2008, 136, 1669–1685. [Google Scholar] [CrossRef]
- Chang, W.-Y.; Wang, T.-C.C.; Lin, P.-L. Characteristics of the raindrop size distribution and drop shape relation in typhoon systems in the Western Pacific from the 2D video disdrometer and NCU C-Band polarimetric radar. J. Atmos. Oceanic Technol. 2009, 26, 1973–1993. [Google Scholar] [CrossRef]
- Radhakrishna, B.; Narayana Rao, T. Differences in cyclonic raindrop size distribution from southwest to northeast monsoon season and from that of noncyclonic rain. J. Geophys. Res. 2010, 115, D16205. [Google Scholar] [CrossRef]
- Chen, B.-J.; Wang, Y.; Ming, J. Microphysical characteristics of the raindrop size distribution in Typhoon Morakot (2009). J. Trop. Meteorol. 2012, 18, 162–171. [Google Scholar]
- Deo, A.; Walsh, K.J.E. Contrasting tropical cyclone and non-tropical cyclone related rainfall drop size distribution at Darwin, Australia. Atmos. Res. 2016, 181, 81–94. [Google Scholar] [CrossRef]
- Wen, L.; Zhao, K.; Chen, G.; Wang, M.; Zhou, B.; Huang, H.; Hu, D.; Lee, W.-C.; Hu, H. Drop size distribution characteristics of seven typhoons in China. J. Geophys. Res. Atmos. 2018, 123, 6529–6548. [Google Scholar] [CrossRef]
- Zhang, Y.; Liu, L.; Bi, S.; Wu, Z.; Shen, P.; Ao, Z.; Chen, C.; Zhang, Y. Analysis of dual-polarimetric radar variables and quantitative precipitation estimators for landfall typhoons and squall lines based on disdrometer data in southern China. Atmosphere 2019, 10, 30. [Google Scholar] [CrossRef]
- Chen, B.; Yang, J.; Pu, J. Statistical characteristics of raindrop size distribution in the meiyu season observed in Eastern China. J. Meteor. Soc. Japan 2013, 91, 215–227. [Google Scholar] [CrossRef]
- Wen, L.; Zhao, K.; Zhang, G.; Xue, M.; Zhou, B.; Liu, S.; Chen, X. Statistical characteristics of raindrop size distributions observed in East China during the Asian summer monsoon season using 2-D video disdrometer and micro rain radar data. J. Geophys. Res. Atmos. 2016, 121, 2265–2282. [Google Scholar] [CrossRef]
- Hashimoto, A.; Harimaya, T. Characteristics of the variation of raindrop size distribution in baiu season. J. Meteorol. Soc. Japan 2003, 81, 871–878. [Google Scholar] [CrossRef]
- Hashimoto, A.; Harimaya, T. Characteristics of raindrop size distribution dependent on the life stage of a convective precipitation cloud in the baiu season. J. Meteorol. Soc. Japan 2005, 83, 641–649. [Google Scholar] [CrossRef]
- Oue, M.; Uyeda, H.; Shusse, Y. Two types of precipitation particle distribution in convective cells accompanying a baiu frontal rainband around Okinawa Island, Japan. J. Geophys. Res. Atmos. 2010, 115. [Google Scholar] [CrossRef]
- Shusse, Y.; Nakagawa, K.; Takahashi, N.; Satoh, S.; Iguchi, T. Characteristics of polarimetric radar variables in three types of rainfalls in a baiu front event over the East China Sea. J. Meteorol. Soc. Japan 2009, 87, 865–875. [Google Scholar] [CrossRef]
- Ninomiya, K. Characteristics of baiu front as a predominant subtropical front in the summer Northern Hemisphere. J. Meteorol. Soc. Japan 1984, 62, 880–894. [Google Scholar] [CrossRef]
- Seela, B.K.; Janapati, J.; Lin, P.-L.; Reddy, K.K.; Shirooka, R.; Wang, P.K. A comparison study of summer season raindrop size distribution between Palau and Taiwan, two islands in Western Pacific. J. Geophys. Res. Atmos. 2017, 122, 11787–11805. [Google Scholar] [CrossRef]
- Wen, L.; Zhao, K.; Wang, M.; Zhang, G. Seasonal variations of observed raindrop size distribution in East China. Adv. Atmos. Sci. 2019, 36, 346–362. [Google Scholar] [CrossRef]
- Chen, Y.; An, J.-L.; Liu, H.-Z.; Duan, J. An observational study on vertical raindrop size distributions during stratiform rain in a semiarid plateau climate zone. Atmos. Ocean. Sci. Lett. 2016, 9, 178–184. [Google Scholar] [CrossRef] [Green Version]
- Peters, G.; Fischer, B.; Münster, H.; Clemens, M.; Wagner, A. Profiles of raindrop size distributions as retrieved by microrain radars. J. Appl. Meteorol. 2005, 44, 1930–1949. [Google Scholar] [CrossRef]
- Yoshikawa, E.; Kida, S.; Yoshida, S.; Morimoto, T.; Ushio, T.; Kawasaki, Z. Vertical structure of raindrop size distribution in lower atmospheric boundary layer. Geophys. Res. Lett. 2010, 37. [Google Scholar] [CrossRef]
- Tokay, A.; Hartmann, P.; Battaglia, A.; Gage, K.S.; Clark, W.L.; Williams, C.R. A field study of reflectivity and Z–R relations using vertically pointing radars and disdrometers. J. Atmos. Oceanic Technol. 2009, 26, 1120–1134. [Google Scholar] [CrossRef]
- Lolli, S.; D’Adderio, L.P.; Campbell, J.R.; Sicard, M.; Welton, E.J.; Binci, A.; Rea, A.; Tokay, A.; Comerón, A.; Barragan, R.; et al. Vertically resolved precipitation intensity retrieved through a synergy between the ground-based NASA MPLNET Lidar network measurements, surface disdrometer datasets and an analytical model solution. Remote Sens. 2018, 10, 1102. [Google Scholar] [CrossRef]
- Lolli, S.; Girolamo, P.D.; Demoz, B.; Li, X.; Welton, E.J. Rain evaporation rate estimates from dual-wavelength lidar measurements and intercomparison against a model analytical solution. J. Atmos. Oceanic Technol. 2017, 34, 829–839. [Google Scholar] [CrossRef]
- Joss, J.; Waldvogel, A. Raindrop size distribution and sampling size errors. J. Atmos. Sci. 1969, 26, 566–569. [Google Scholar] [CrossRef]
- Tokay, A.; Wolff, D.B.; Wolff, K.R.; Bashor, P. Rain gauge and disdrometer measurements during the Keys Area Microphysics Project (KAMP). J. Atmos. Oceanic Technol. 2003, 20, 1460–1477. [Google Scholar] [CrossRef]
- Löffler-Mang, M.; Kunz, M.; Schmid, W. On the performance of a low-cost K-band Doppler radar for quantitative rain measurements. J. Atmos. Oceanic Technol. 1999, 16, 379–387. [Google Scholar] [CrossRef]
- Tokay, A.; Kruger, A.; Krajewski, W.F. Comparison of drop size distribution measurements by impact and optical disdrometers. J. Appl. Meteorol. 2001, 40, 2083–2097. [Google Scholar] [CrossRef]
- Tridon, F.; Van Baelen, J.; Pointin, Y. Aliasing in Micro Rain Radar data due to strong vertical winds. Geophys. Res. Lett. 2011, 38, L02804. [Google Scholar] [CrossRef]
- Kawanishi, T.; Kuroiwa, H.; Kojima, M.; Oikawa, K.; Kozu, T.; Kumagai, H.; Okamoto, K.I.; Okumura, M.; Nakatsuka, H.; Nishikawa, K. TRMM precipitation radar. Adv. Space Res. 2000, 25, 969–972. [Google Scholar] [CrossRef]
- Iguchi, T.; Kozu, T.; Meneghini, R.; Awaka, J.; Okamoto, K.I. Rain-profiling algorithm for the TRMM Precipitation Radar. J. Appl. Meteorol. 2000, 39, 2038–2052. [Google Scholar] [CrossRef]
- Kirstetter, P.-E.; Hong, Y.; Gourley, J.J.; Schwaller, M.; Petersen, W.; Zhang, J. Comparison of TRMM 2A25 products, version 6 and version 7, with NOAA/NSSL ground radar–based national mosaic QPE. J. Hydrometeorol. 2013, 14, 661–669. [Google Scholar] [CrossRef]
- Bringi, V.N.; Chandrasekar, V.; Hubbert, J.; Gorgucci, E.; Randeu, W.L.; Schoenhuber, M. Raindrop size distribution in different climatic regimes from disdrometer and dual-polarized radar analysis. J. Atmos. Sci. 2003, 60, 354–365. [Google Scholar] [CrossRef]
- Wen, L.; Zhao, K.; Zhang, G.; Liu, S.; Chen, G. Impacts of instrument limitations on estimated raindrop size distribution, radar parameters, and model microphysics during meiyu season in East China. J. Atmos. Oceanic Technol. 2017, 34, 1021–1037. [Google Scholar] [CrossRef]
- Hu, Z.; Srivastava, R.C. Evolution of raindrop size distribution by coalescence, breakup, and evaporation: Theory and observations. J. Atmos. Sci. 1995, 52, 1761–1783. [Google Scholar] [CrossRef]
- Jash, D.; Resmi, E.A.; Unnikrishnan, C.K.; Sumesh, R.K.; Sreekanth, T.S.; Sukumar, N.; Ramachandran, K.K. Variation in rain drop size distribution and rain integral parameters during southwest monsoon over a tropical station: An inter-comparison of disdrometer and micro rain radar. Atmos. Res. 2019, 217, 24–36. [Google Scholar] [CrossRef]
- Sharma, S.; Konwar, M.; Sarma, D.K.; Kalapureddy, M.C.R.; Jain, A.R. Characteristics of rain integral parameters during tropical convective, transition, and stratiform rain at Gadanki and its application in rain retrieval. J Appl. Meteorol. Climatol. 2009, 48, 1245–1266. [Google Scholar] [CrossRef]
- Wu, Z.; Zhang, Y.; Zhang, L.; Lei, H.; Xie, Y.; Wen, L.; Yang, J. Characteristics of summer season raindrop size distribution in three typical regions of Western Pacific. J. Geophys. Res. Atmos. 2019, 124, 4054–4073. [Google Scholar] [CrossRef]
- Cifelli, R.; Williams, C.R.; Rajopadhyaya, D.K.; Avery, S.K.; Gage, K.S.; May, P.T. Drop-size distribution characteristics in tropical mesoscale convective systems. J. Appl. Meteorol. 2000, 39, 760–777. [Google Scholar] [CrossRef]
- Marzuki; Hashiguchi, H.; Shimomai, T.; Rahayu, I.; Vonnisa, M.; Afdal. Performance evaluation of micro rain radar over Sumatra through comparison with disdrometer and wind profiler. Prog. Electromagn. Res. M 2016, 50, 33–46. [Google Scholar] [CrossRef]
- Nam, J.; Kim, S.W.; Park, R.J.; Park, J.S.; Sang, S.P. Changes in column aerosol optical depth and ground-level particulate matter concentration over East Asia. Air Qual. Atmos. Health 2018, 11, 49–60. [Google Scholar] [CrossRef]
- Fulton, R.A.; Breidenbach, J.P.; Seo, D.-J.; Miller, D.A.; O’Bannon, T. The WSR-88D rainfall algorithm. Weather Forecasting 1998, 13, 377–395. [Google Scholar] [CrossRef]
- Gunn, R.; Kinzer, G.D. The terminal velocity of fall for water droplets in stagnant air. J. Meteorol. 1949, 6, 243–248. [Google Scholar] [CrossRef]
- Atlas, D.; Srivastava, R.C.; Sekhon, R.S. Doppler radar characteristics of precipitation at vertical incidence. Rev. Geophys. 1973, 11, 1–35. [Google Scholar] [CrossRef]
Figure 1.
Location of Tokyo (raindrop size distribution (RSD) measured site), location of Tateno (radiosonde sounding station) and tropical cyclone (TC) paths (gray filled circles denote typhoons, and white open circles denote tropical storms; the sea pressure level and wind speed of the nearest TC center to Tokyo were marked in “1”–“4” and listed in the legend).

Figure 2.
Scatterplots of the 1 h rainfall measured by (a) the rain gauge (RG) and the MRR and (b) the RG and the JWD (RD80) during the summers (June–August) of 2005–2009.
Figure 2.
Scatterplots of the 1 h rainfall measured by (a) the rain gauge (RG) and the MRR and (b) the RG and the JWD (RD80) during the summers (June–August) of 2005–2009.

Figure 3.
The vertical profile of radar reflectivity from the MRR for (a) one tropical cyclone occurring on 25 August 2005, (b) one meiyu-baiu front occurring on 21 June 2005 and (c) one local storm occurring on 1 August 2007. The blue dashed lines denote the 0 °C isotherm level measured by the Tateno radiosonde sounding station, while the grey dashed lines in (a) denote the three rain stages of the tropical cyclone.

Figure 4.
The surface rain rate of four tropical cyclones (TC) (a–d), one meiyu-baiu front (MF) (e) and one local storm (LS) (f) observed by 2A25 data of the precipitation radar (PR) on the Tropical Rainfall Measuring Mission (TRMM) satellite. The “X” denotes the location of Tokyo.
Figure 4.
The surface rain rate of four tropical cyclones (TC) (a–d), one meiyu-baiu front (MF) (e) and one local storm (LS) (f) observed by 2A25 data of the precipitation radar (PR) on the Tropical Rainfall Measuring Mission (TRMM) satellite. The “X” denotes the location of Tokyo.

Figure 5.
The vertical profiles of the mean rain parameters (R and Z) for the three rain types based on MRR data with a rain rate at 600 m of >2 mm/h (a,b) and TRMM (2A25) PR data with a surface rain rate of >2 mm/h for the area 33–37° N and 137–142° E (c,d). TRMM overpasses over Tokyo were used to calculate the tropical cyclones (20050726, 20060809, 20070714 and 20050825), the meiyu-baiu front (20050621, 20050622, 20050703, 20050705, 20060618, 20060717, 20060718, 20070710, 20070711, 20080611, 20080620, 20080621, 20080622, 20080629, 20090623 and 20090629) and local storms (20080811), with a date format of yyyymmdd.

Figure 6.
Scatterplot of Dm versus log10Nw for (a) all three rain types and for different rainfall rates in (b) tropical cyclones, (c) meiyu-baiu fronts and (d) local storms based on JWD data. The two gray rectangles correspond to the maritime and continental convective fields reported by Bringi et al. [34]. The dashed line is that of Bringi et al. [34], which distinguishes stratiform rain from convective rain.

Figure 7.
Dm versus rain rate for the three rain types from the JWD data along with the best fit lines using the least squares method. The exponent values of the Dm–R relationship obtained from the curve estimation by SPSS software with significance level <0.05.
Figure 7.
Dm versus rain rate for the three rain types from the JWD data along with the best fit lines using the least squares method. The exponent values of the Dm–R relationship obtained from the curve estimation by SPSS software with significance level <0.05.

Figure 8.
The percentage contribution of various-diameter raindrops to (a) R and (b) Nt (total number concentration) for the three rain types based on JWD data.
Figure 8.
The percentage contribution of various-diameter raindrops to (a) R and (b) Nt (total number concentration) for the three rain types based on JWD data.

Figure 9.
The composite raindrop spectra for (a) three rain types based on MRR and JWD (RD80) data, (b) the rainfall at 40 dBZ for three tropical storms (TS) and one typhoon (TY) based on JWD data and (c) three raining stages of a typhoon event (2005-11) based on JWD data. S1: Stage 1; S2: Stage 2; S3: Stage 3.

Figure 10.
The vertical distributions of parameters with (a) coefficient A and (b) power b of the Z–R relationship for the three rain types based on MRR data.
Figure 10.
The vertical distributions of parameters with (a) coefficient A and (b) power b of the Z–R relationship for the three rain types based on MRR data.


Table 1.
Characteristics of the micro rain radar (MRR) and Joss-Waldvogel disdrometer (JWD) used in this study.
Table 1.
Characteristics of the micro rain radar (MRR) and Joss-Waldvogel disdrometer (JWD) used in this study.
| MRR | Value/Description |
| Frequency | 24.1 GHz |
| Power | 50 mW |
| Operation mode | FM-CW |
| Beam width | 2° |
| Antenna type | Offset parabolic |
| Height resolution | 200 m |
| Number of range gates | 30 |
| Temporal resolution | 1 min |
| Raindrop range | 0.25–5.03 mm |
| Raindrop size bin | 46 |
| JWD | Value/Description |
| Temporal resolution | 1 min |
| Raindrop range | 0.3–5.3 mm |
| Raindrop size bin | 20 |
Table 2.
The Z–R (radar reflectivity–rain rate) relationship (Z = ARb) coefficient (A) and power (b) and the rainfall for three types of rain events in Tokyo during the summers (June–August) of 2005–2009.
Table 2.
The Z–R (radar reflectivity–rain rate) relationship (Z = ARb) coefficient (A) and power (b) and the rainfall for three types of rain events in Tokyo during the summers (June–August) of 2005–2009.
| Type | Ty-ID 1 | Period (YYYY/MM/DD) | A MRR | b MRR | A JWD | b JWD | RG Rainfall (mm) | MRR Rainfall (mm) | JWD Rainfall (mm) |
|---|---|---|---|---|---|---|---|---|---|
| Tropical cyclone | S-7 | 2005/07/25–26 | 119 | 1.12 | 154 | 1.25 | 94.1 | 64.3 | 91.5 |
| S-7 | 2006/08/08–09 | 281 | 1.21 | 295 | 1.37 | 62.5 | 55.7 | 62.7 | |
| S-4 | 2007/07/14–15 | 176 | 1.31 | 191 | 1.32 | 106.9 | 75.7 | 94.5 | |
| T-11 | 2005/08/25–26 | 189 | 1.21 | 236 | 1.38 | 87.0 | 95.1 | 82.0 | |
| Meiyu-baiu front | - | 2005/06/21–23 | 284 | 1.24 | 258 | 1.36 | 27.2 | 21.7 | 20.3 |
| - | 2005/07/03–06 | 179 | 1.34 | 179 | 1.38 | 61.8 | 48.0 | 63.5 | |
| - | 2006/06/17–19 | 159 | 1.24 | 162 | 1.25 | 24.8 | 15.9 | 25.0 | |
| - | 2006/07/17–25 | 284 | 1.14 | 262 | 1.21 | 41.9 | 32.8 | 41.2 | |
| - | 2007/07/10–12 | 206 | 1.16 | 227 | 1.21 | 26.9 | 24.8 | 23.5 | |
| - | 2008/06/11–13 | 303 | 1.32 | 299 | 1.38 | 27.4 | 25.0 | 27.5 | |
| - | 2008/06/20–23 | 205 | 1.36 | 195 | 1.40 | 56.4 | 34.8 | 52.7 | |
| - | 2008/06/28–30 | 200 | 1.28 | 188 | 1.29 | 42.2 | 30.1 | 38.5 | |
| - | 2009/06/23–25 | 309 | 1.23 | 276 | 1.32 | 27.9 | 23.8 | 26.6 | |
| - | 2009/06/28–30 | 260 | 1.42 | 250 | 1.5 | 27.2 | 24.2 | 26.9 | |
| Local storm | - | 2007/08/01–02 | 114 | 1.22 | 133 | 1.41 | 12.7 | 12.1 | 10.6 |
| - | 2008/08/10–11 | 219 | 1.20 | 235 | 1.40 | 10.0 | 10.0 | 10.2 |
1 Ty: “S” denotes tropical storm, “T” denotes typhoon and “ID” denotes the ID of the tropical cyclone assigned by the JMA.
Table 3.
Mean Dm and log10Nw over different regions.
| Region | Studies | Type/period | Dm (mm) | log10Nw (mm−1 m−3) |
|---|---|---|---|---|
| Tokyo, Japan | JWD—This study | Tropical cyclone | 1.25 ± 0.36 * 1 | 3.74 ± 0.47 ** 1 |
| JWD—This study | Meiyu-baiu front | 1.15 ± 0.30 * | 3.59 ± 0.48 | |
| JWD—This study | Local storm | 1.31 ± 0.48 * | 3.59 ± 0.55 | |
| JWD—This study | Summer 2005–2009 | 1.15 ± 0.36 | 3.59 ± 0.59 | |
| East China | Chen et al. [11] | Meiyu season | 1.66 | 3.42 |
| Wen et al. [35] | Meiyu season | 1.18–1.28 | 3.68–3.99 | |
| Wen et al. [19] | Summer | 1.15 | 4.09 | |
| Wen et al. [9] | Tropical cyclone | 1.13 ± 0.24 | - | |
| Eastern USA | Tokay et al. [4] | Tropical cyclone | 1.67 ± 0.30 | - |
1 * denotes the X and Y (TC-MF, TC-LS and MF-LS) have significantly different means according to a t-test, while ** denotes the X and Y (TC-MF and TC-LS) have significantly different means.
Table 4.
Z–R relationship (Z = ARb) coefficient (A) and power (b) in different regions.
| Region | Studies | RSD Equipment | Type/Period | A | b |
|---|---|---|---|---|---|
| Tokyo, Japan | This study | MRR | Tropical cyclone | 186 | 1.20 |
| This study | MRR | Meiyu-baiu front | 243 | 1.23 | |
| This study | MRR | Local storm | 199 | 1.14 | |
| This study | JWD | Tropical cyclone | 189 | 1.38 | |
| This study | JWD | Meiyu-baiu front | 214 | 1.35 | |
| This study | JWD | Local storm | 221 | 1.37 | |
| This study | JWD | Summer 2005–2009 | 212 | 1.33 | |
| East China | Chen et al. [7] | PARSIVEL 1 | Tropical cyclone | 235 | 1.30 |
| Chen et al. [7] | PARSIVEL | Eyewall of tropical cyclone | 308 | 1.32 | |
| Chen et al. [11] | PARSIVEL | Meiyu convective | 368 | 1.21 | |
| Wen et al. [35] | 2DVD 2 | Meiyu season | 209 | 1.39 | |
| Wen et al. [9] | 2DVD | Tropical cyclone | 147 | 1.38 | |
| Wen et al. [19] | 2DVD | Summer 2014–2015 | 232 | 1.34 | |
| Taiwan, China | Chang et al. [5] | 2DVD | Tropical cyclone | 207 | 1.45 |
| Seela et al. [18] | JWD | Summer 2003–2007 | 283 | 1.35 | |
| India | Radhakrishna and Narayana Rao [6] | JWD | Southwest monsoon | 275 | 1.39 |
| Australia | Deo and Walsh [8] | JWD | Tropical cyclone | 234 | 1.30 |
1 PARSIVEL: Particle size and velocity disdrometer; 2 2DVD: Two-dimensional video disdrometer.
Table 5.
Mean Z, mean R and Z–R relationship (Z = ARb) for the three raining stages of the typhoon event (2005-11).
Table 5.
Mean Z, mean R and Z–R relationship (Z = ARb) for the three raining stages of the typhoon event (2005-11).
| Stage | Z (dBZ) | R (mm/h) | A | b |
|---|---|---|---|---|
| S1 | 35.4 | 6.0 | 233 | 1.29 |
| S2 | 35.3 | 5.6 | 275 | 1.39 |
| S3 | 23.2 | 1.1 | 131 | 1.35 |
© 2019 by the authors. Licensee MDPI, Basel, Switzerland. This article is an open access article distributed under the terms and conditions of the Creative Commons Attribution (CC BY) license (http://creativecommons.org/licenses/by/4.0/).
Share and Cite
MDPI and ACS Style
Chen, Y.; Duan, J.; An, J.; Liu, H. Raindrop Size Distribution Characteristics for Tropical Cyclones and Meiyu-Baiu Fronts Impacting Tokyo, Japan. Atmosphere 2019, 10, 391. https://0-doi-org.brum.beds.ac.uk/10.3390/atmos10070391
AMA Style
Chen Y, Duan J, An J, Liu H. Raindrop Size Distribution Characteristics for Tropical Cyclones and Meiyu-Baiu Fronts Impacting Tokyo, Japan. Atmosphere. 2019; 10(7):391. https://0-doi-org.brum.beds.ac.uk/10.3390/atmos10070391
Chicago/Turabian StyleChen, Yong, Jing Duan, Junling An, and Huizhi Liu. 2019. "Raindrop Size Distribution Characteristics for Tropical Cyclones and Meiyu-Baiu Fronts Impacting Tokyo, Japan" Atmosphere 10, no. 7: 391. https://0-doi-org.brum.beds.ac.uk/10.3390/atmos10070391
Note that from the first issue of 2016, this journal uses article numbers instead of page numbers. See further details here.