Current Status, Challenges and Resilient Response to Air Pollution in Urban Subway


1
Institute of Public Safety Research, Department of Engineering Physics, Tsinghua University, Beijing 100084, China
2
Beijing Key Laboratory of City Integrated Emergency Response Science, Tsinghua University, Beijing 100084, China
3
Rock Environment and Energy Institute, Shunyi, Beijing 101318, China
*
Author to whom correspondence should be addressed.
Atmosphere 2019, 10(8), 472; https://0-doi-org.brum.beds.ac.uk/10.3390/atmos10080472
Submission received: 26 June 2019
/
Revised: 12 August 2019
/
Accepted: 13 August 2019
/
Published: 16 August 2019
(This article belongs to the Special Issue Exposure and Health Impacts Related to Outdoor and Indoor Air Pollutants)
Abstract
:Subway air pollution mainly refers to inhalable particulate matter (PM) pollution, organic pollution, and microbial pollution. Based on the investigation and calculation of the existing researches, this paper summarizes the sources of air pollutants, chemical compositions, and driving factors of PM variations in subway. It evaluates the toxicity and health risks of pollutants. In this paper, the problems and challenges during the deployment of air pollution governance are discussed. Results show that the global PM compliance rate of subway is about 30%. Subway air pollution is endogenous, which means that pollutants mainly come from mechanical wear and building materials erosions. Particles are mainly metal particles, black carbon, and floating dust. The health risks of some chemical elements in the subway have reached critical levels. The variations of PM concentrations show spatial-temporal characteristics, which are mainly controlled by train age, brakes types, and environmental control systems. The authors then analyze the dynamics of interactions among government, companies and public during the air pollution governance by adding the following questions: (a) who pays the bill; (b) how to evaluate the cost-effectiveness of policies; (c) how the public moves from risk perception to actions; (d) how to develop clean air technology better so as to ultimately incentivize stakeholders and to facilitate the implementation of subway clean air programme in a resilient mode.
1. Introduction
The subway has the advantages of alleviating urban pollution and resolving traffic congestion. It is regarded as a green, efficient, convenient, and safe symbol of modern city [1]. However, there are growing signs that subways are replacing other urban emissions activities as new polluting sites [2,3,4]. Through scientific investigation and calculations, this paper reveals an important threat of urban air pollution—the subway air pollution.
Subway air pollution mainly refers to PM2.5 and PM10-based inhalable PM pollution, Polycyclic Aromatic Hydrocarbons (PAHs)-based organic pollution and viruses, fungi-based microbial pollution [5,6]. Among them, inhalable PM pollution is the main contributor of subway air pollution. Our results show that 70% of subway PM concentrations in the world exceed WHO or local air quality standards. The air pollution of subway is mainly endogenous pollution [6]. The pollution source mainly comes from conductive rail and electrode, the chemical composition and morphology of particles are mainly composed of metallic particles, black carbon, and floating dusts, which are produced by mechanical wear between brake pads, rail-wheel interface, and erosion of building materials. Studies have shown that subway particles are significantly different from those of street particles [5], which are mainly composed of metallic particles, black carbon, and floating dusts. Iron-containing particles are the most abundant metallic particles in subway platform [7,8,9]. Subway PM is more toxic than street PM. Some studies show that the damage on DNA and oxidative damage to the lungs caused by Subway PM are 8 times and 4 times as much as those caused by ordinary atmospheric PM respectively [8]. Controlled by pollution source intensity and diffusion conditions, the variation characteristics of Subway PM have certain regularity in site and time. In terms of the site characteristics, the concentration of PM on the ground floor is lower than that on the underground floor, and the concentration on the platform is higher than that in the train compartment. The highest concentration of PM is found on the underground platform and the lowest concentration in the ground train compartment due to the combined action of adverse factors [10,11,12,13]. In terms of time, the variation of PM concentration is related to trains frequency [11,14], seasons [15], and so on [16], as well as other matters which directly or indirectly affect the PM concentration such as the train running age [17], brake types [13], and environmental control systems [18].
It has been clear that the laws and characteristics of PM such as sources, chemical compositions, toxicity, and variation characteristics. However, very few papers are focusing on the governance side of air pollution such as environmental responsibilities, environmental cost-effective modelling, and environment public policy, which lead to delaying action on air pollution governance in subway systems. Through analyzing the key problems and challenges that may be faced by the implementation of relevant measures, we believe that the main reason why the subway air pollution governance measures have not yet been launched is the conflict of essential interests and dynamics among the government, companies, and the public.
The authors focus on modelling the current status of air pollution, bringing discussions on essential mechanisms of air pollution governance. On the basis of discussing the characteristics of subway air pollution sources, chemical composition, toxicity, and concentration variations, this paper tries to introduce different ideas on pollution calculations and models, and to provide sociological and economic analysis to study the concrete forms of interest dynamics among the government, companies, and the public. Discussions focus on four key issues of pollution governance: (a) who pays the bills for pollution governance; (b) how policies interact with environmental willingness; (c) how the public turn risk perception into environmental actions; and (d) what the key clean air technology Research and Development (R&D) issues are.
2. Current Status of Subway Air Pollution
Urban subway generally refers to the rail transit system running below the urban ground level, though sometimes, considering the cost of construction and operation, it may be converted to the ground or elevated track system outside the city center. Because the subway often runs underground, its operating space is relatively independent of the ground space, a large number of trains run back and forth in this space. Although the air quality inside the subway is affected by the outdoor air quality, the endogenous pollution is the main characteristics of subway air pollution. Currently, the main subway air quality management methods are installing screen door systems, developing and upgrading the materials of rails and wheels, and washing and maintaining walls of tunnels, but due to the lack of effective interventions to reduce endogenous pollutants, subway air pollution is still an urgent environmental and public health problem.
At present, there is no unified indoor air quality standard for subway in the world, but only a small number of indoor air standards can be referenced, such as WHO [19], Korea Ministry of Environment (KMOE) [20], National Ambient Air Quality Standard/Environmental Protection Agency(NAAQS/EPA) [21], etc. For example, in June 2018, the KMOE announced amendments to its “Indoor Air Quality Management Regulations for Public Facilities”, targeting public facilities such as subways and department stores, in which the standard limits for PM10 in the Regulation are 1003 and 503 for PM2.5 for a continuous average of more than 24 h.
The current status of subway PM pollution in Asia, Europe, and America was evaluated by WHO and KMOE standard. The data of subway PM pollution were collected from existing cases [6]. The results show that under the standard of KMOE, the compliance rate of subway PM in the world is about 31%~33%. If the more stringent standard is adopted by WHO, the compliance rate will be reduced to about 14%. Taken together, Europe has the lowest compliance rate, about 20% (KMOE standard), followed by Asia and America. The results show that the subway PM pollution in Europe is the most serious, which may be due to the relatively old subway systems, mechanical wear, tunnel erosion, and short station-to-station spacing in Europe; The subway system in Asia is relatively new and the air quality control system is relatively good, so the pollution is relatively light, but there is still only about 40% PM compliance rate (KMOE standard); The PM compliance rate in America is higher than that in Asia and Europe, but due to the small number of case samples, further calculation is required and estimated to be close to that in Asia (see Table 1).
2.1. Sources of Subway Particulate Matter (PM)
A clear map of pollution sources will provide a holistic view for environmentalists and policy-makers on subway air pollution governance. Studies show that there are four main sources of subway PM:
- Mechanical wear. It mainly refers to the wear between rail and electrode, brake pad, and rail and wheel interface. The conductive rail materials of the train are mainly low carbon steel conducting rail and steel-aluminum composite conducting rail [22]. The material of brake pad is mainly asbestos and semi-metal mixture [23], the material of rail is mainly manganese steel [24], and the material of wheel is generally high carbon steel or rubber [25]. When the train accelerates, runs, and brakes, the squeeze and friction among the above-mentioned interfaces cause the wear of the material and lead to the release of PM directly.
- Erosion of building materials. Erosions and destructions are usually found in subway tunnels and tracks of underground water. The underground water is rich in carbon dioxide, part of which acts with calcium carbonate in concrete to form calcium bicarbonate and then dissolves in water, causing the destruction of concrete. In addition, sulfate ions in groundwater react with concrete to form calcium aluminum sulfate or gypsum, which results in concrete cracking after volume expansion. On the other hand, acidic water containing free sulfuric acid or groundwater containing free oxygen has a corrosive effect on iron and steel. Some coastal areas even have higher brine level [26,27] which could lead to more severe erosions to subway buildings.
- Routine maintenance and repair in subway. This kind of emission mainly comes from the tunnel construction activities. For example, engine emission, welding, and others during section examination and repairing.
- PM introduced by subway accidents. For example, sediment deposition caused by subway fire or urban waterlogging, etc.
The air pollution due to mechanical wear and building material erosions accounts for the vast majority of these sources.
2.2. Chemical Composition of Subway Particulate Matter (PM)
Subway PM is mainly composed of metallic particles, black carbon, and floating dust. Iron-containing particles are the most abundant metallic particles in the subway, especially in the subway platform. According to the research results, the contents of Fe, Mn, Cu, Ba, and Pb in subway are all higher than the average contents in streets. The air composition in subway is generally in the order of concentration: Iron-containing particles > Soil/road dust > Carbonaceous > Aluminum > Secondary nitrate/sulfates [28], the major particle type categories of PM2.5–10 are shown in Table 2. The mass fraction of iron-containing particles is about 69% of PM2.5–10 [10,29,30,31]. In addition to inhalable particulates, organic compounds such as PAHs, nicotine, levoglucosan, and aromatic musk compounds and some microbial contaminants such as viruses, fungi, and microorganisms were also identified [10,32,33].
We try to estimate the total mass of pollutants in subway under a dynamic equilibrium that is a state in which the subway pollutants released sources and air quality management system acts together. This state represents the total mass of pollutants existing in the subway. The calculation method for the total mass is:
The mass concentrations data of pollutants were collected from Xu and Hao’s statistics and Byeon and Willis’s work [6,34]. The total length and cross-sectional diameter information were collected from UITP’s (UITP is an International Association of Public Transportation with official name: Union Internationale Des Trasports Publies) report [35], and in order to avoid the potential complexity of total space calculation, we only consider the space of tunnels and ignore the space in stations, and the cross-sectional diameter is considered as an average diameter of 4 m. Here, the method is given to estimate a regional scale pollutants mass:
The regional average of mass concentration is the arithmetic average of all selected cities in a whole region, the reason why we ignore the differences of location and measurement time from different cities is the limitations of sample numbers, here, as an inspiring method of mass calculation, we suggest that a general view of the current status of pollutants emissions should be considered in the above method.
For example, the total mass of PM2.5 in Asia would be:
The data used for calculation are shown in Table A2 of Appendix A, the information on location (e.g., cities, above ground, on the platform or in-cabin), measurement year and duration, pollutant species, and instruments are shown in the table. However, due to the limited samples’ objectivity and representativeness, people who use our conclusions for further researches should be aware of the limitations of this calculation: first, the number limitations, currently only a small share of cities were selected for studies, which means the regional average only stands for the existing studies instead of all cities; second, due to the interest of studies, some preferences or even prejudices on sample selecting (e.g., location selecting, measurement time and duration, different materials of pollutant sources) may exist, which may have impacts on the objectivity of actual pollution status.
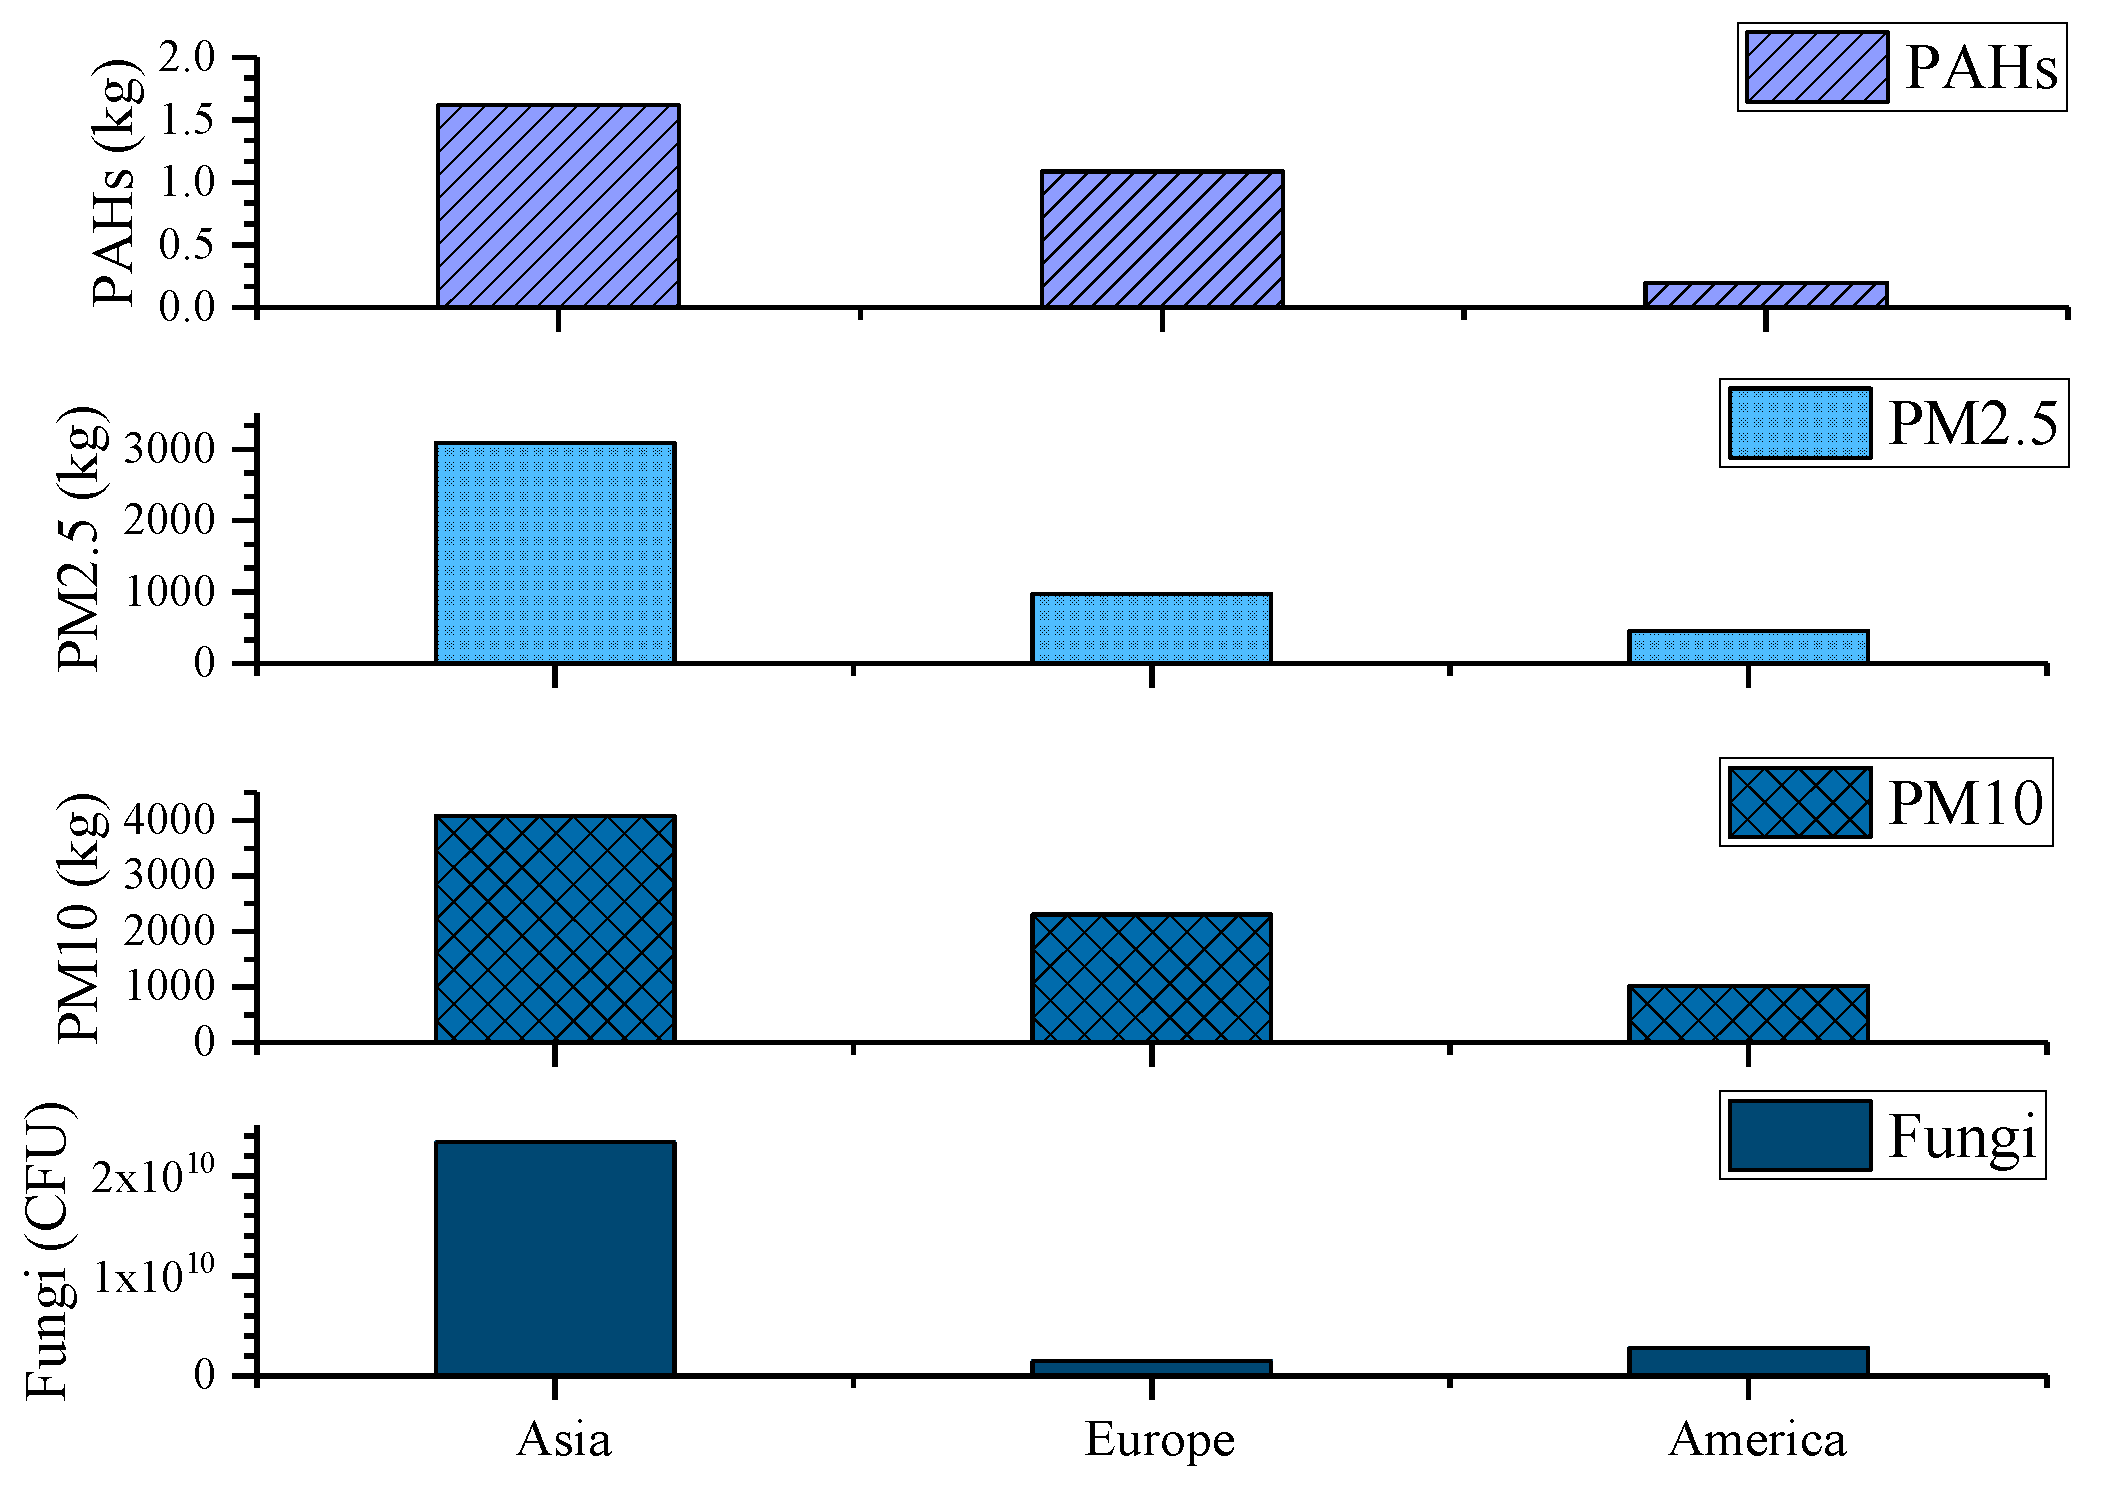
The results show that (see Figure 1), the concentrations of PM10 and PM2.5-based inhalable PM, PAHs-based organic matter or fungi-based microorganisms are at the highest level in the Asian subway systems, probably because Asia has the world’s longest and most densely populated subway lines, which are used more frequently than that elsewhere, and Asia has the greatest potential for air quality improvement in terms of air pollution abatement. The main problems in the European subway are PM10-based inhalable PM pollution and PAHs-based air pollution. The early opening of the subway in Europe, the long service life of the subway system, and the use of rubber wheels in European trains may lead to higher PAHs values in this region. The main problem of subways in America is the pollution of PM10 particles with large particle size.
2.3. Deposition and Toxicity of Subway Particulate Matter (PMs) in Human Body
2.3.1. Toxicity and Injury of Subway PMs
Compared with surface PM, metallic elements in subway PM are more toxic and potentially harmful to human body. The composition of PM determines the degree of harm to human body. The floating PM in the air usually adheres to oxides and heavy metals. The smaller the particles, the richer the substances they adhere to. Studies show that damage on DNA and oxidative damage to lungs caused by PM in subway are 8 times and 4 times as much as those caused by ordinary atmospheric PM, respectively [8]. Metals in PM can even produce secondary pollution in the process of movement and transformation [36]. This kind of PM often invades the human body through mouth, inhalation, and skin, and has chemical interaction with biological tissues, and transforms into methyl compounds which further damage human health and easily causes heavy metal poisoning by long-term accumulation.
For example, Fe leads to a series of free radicals in the body, which aggravates the inflammatory reaction of organisms; Cr mainly causes chronic toxicity to organisms, and to a certain extent, accumulation of Cr will lead to pathological changes of important organs, nervous system, and blood of organisms; Mn is neurotoxic and prolonged exposure can lead to respiratory and nervous disorders. Contemporary epidemiological studies have shown that PM concentrations are one of the main factors leading to respiratory injury and heart disease [37].
2.3.2. Health Risk Assessment of Subway PMs
Long-term human exposure to high concentrations of transition metals is prone to health risks [38]. Using the health risk assessment model recommended by United States Environmental Protection Agency (US EPA), paper calculates the daily intake dose of metallic components via three different ways: Inhalation, dust ingestion and dermal contact.
In the above formula, ADinh, ADing, and ADdec are daily intake doses of nose, mouth, and dermal contact, while the unit is mg·(kg·d). CPMs (ng·m−3) and Cdust (μg·g−1) are the concentration of elements and content in dust, inhalation rate (m3·h−1), inlet rate (mg·d−1), (m2·d−1) is the exposed skin area, (g·m−2) is the adhesion coefficient, and ABS is the skin absorption factor; ET is daily exposure time (h/d), EF is annual exposure frequency d/a; ED (d) is the duration of exposure, BW (kg) represents average body weight, and AT (d) is the averaging exposure time (ED × 365 d for non-carcinogens and 70 × 365 d for carcinogens) (Table 3).
Hazard quotient (HQ) is as follow, where reference doses (RfD) [mg/(kg·d)] represent that daily reference intake dose:
Cancer risk (CR) is as follows, where slope factor (SF) (kg·d/mg) represents the element’s carcinogenic slope factor:
In a given environment, the total non-carcinogenic and carcinogenic health risks caused by pollutants are equal to the sum of the non-carcinogenic and carcinogenic health risks exposed by organisms through all channels. Hazard index (HI) is the sum of the HQs taken in a single mode of ingestion of the calculated element, and more than 1 poses a non-carcinogenic health risk. The PM statistics used in the assessment were derived from Qiao’s investigation in Shanghai, China [39]. There are 3 reasons why we choose Qiao’s statistics: (1) Qiao’s data set is relatively new in which all the samples were collected in 2013; (2) Qiao’s statistics has a classical structure, which shows a standard metal composition distribution in subway; and (3) Qiao has considered the difference in PM concentrations by separating rush hour from normal hours. EPA gives reference values for RfD and SF for different transitional metal elements in different intake pathways to measure health risks, as shown in Table 4. Most of the parameters in this paper uses the recommended values of US EPA [40].

Table 3.
Parameters applied to estimate the intake doses.
| Parameter | IRinh | IRing | SA | AF | ABS | ET | EF | ED | AT | BW |
|---|---|---|---|---|---|---|---|---|---|---|
| Carcinogenic reference value | 9.80 × 10⁻¹ | 5.00 × 101 | 1.60 | 7.00 × 10⁻¹ | 1.00 × 10⁻² | 3.00 | 2.60 × 10² | 5.00 × 101 | 70 × 365 | 6.62 × 101 |
| Non-carcinogenic reference value | 9.80 × 10⁻¹ | 5.00 × 101 | 1.60 | 7.00 × 10⁻¹ | 1.00 × 10⁻² | 3.00 | 2.60 × 10² | 4.00 × 101 | ED × 365 | 6.62 × 101 |
Source: Parameters are derived from US EPA [40].
As can be seen from Table 5, respiratory exposure poses the greatest health risk. For carcinogenic health risks, the acceptable level of CR [41] is 10−6~10−4; For non-carcinogenic health risks, the health risks of certain chemical elements have reached critical levels. For example, the inhalation non-carcinogenic health risk value of Mn reaches 9.56 × 10 − 1 ≈ 1, and the HI risk value reaches 1.02 > 1; Long-term exposure to the subway environment will cause harm to the human body. Admittedly, the study on toxicity of metal elements is not perfect, and there are many uncertainties in the risk value. However, the existence of high concentration of metal particles in the subway environment is an indisputable fact, and it is urgent to launch relevant pollution governance measures.
2.4. Driving Factors of Subway Particulate Matter (PMs) Variations
Controlled by pollution sources severity and diffusion conditions, the variation characteristics of subway PM have certain regularity in site and time.
Vertical structure difference refers to the concentration difference caused by the vertical difference of subway system. Vertical structure can be roughly divided into two types: ground line and underground line. Train boundary refers to the two boundary systems formed by carriages and platforms.
In the current understanding, the concentration of PMs on the ground floor is lower than that on the underground floor, the concentration of PMs on the platform is higher than that on the train compartment, and due to the combination of adverse factors, the concentration of PMs on the underground floor is generally the highest and the concentration of PMs on the ground floor is the lowest [42,43,44]. For example, the concentration difference is four times greater than that in the subway at Los Angeles [45]. Despite the lowest concentrations of PM in overhead carriages, there are still some cities where air quality exceeds standards. For example, studies found that PM2.5 concentrations in ground train compartments reached 67 μg/m3 in Istanbul [46].
The temporal variation of PM concentration can be divided into short, medium, and long-term variations according to the time scale. The short-term variation of PM concentration mainly depends on the variation in time of the train entering and leaving the station, which is counted by seconds or minutes. With the implications of the piston wind in the tunnel, our study shows the train will carry PM in the tunnel to the platform when entering the station, resulting in the short-term increase of the platform concentration. The medium-term variation mainly depends on the daily variation characteristics of the concentration. The concentration of PM in some subway stations will increase with the increase of train operation frequency and reach the peak value during rush hour, which is consistent with the rhythm of urban life and exhibits inhalation effect. The long-term variation mainly depends on the annual variation characteristics of the concentration. Influenced by the local environment and the ground environment, the concentration of subway PM in some areas is higher in autumn and winter when the ground air pollution is more serious, and the microbial content in subway stations is significantly increased in the local florescence [32]. In addition, train operating age [17], brake type [13], and environmental control system [18,47] will also directly or indirectly affect the concentration of PM.
3. Problems, Challenges, and Resilient Responses
At present, the physical and chemical characteristics of subway air pollutants have been gradually clear. However, in the face of the serious pollution situation in the subway, almost no cities are implementing concrete governance measures, as many existing researches on addressing air pollution in subways are hard to change practically. In view of the above embarrassing situations, the authors try to assess the key issues and challenges of subway air pollution governance, so as to incentivize stakeholders through discussions, and to facilitate the early landing of subway clean air programme.
The key parties of air pollution governance in the subway mainly involve the public, government, and companies. Due to the differences of individual interests, the perception and endurance of environmental pollution are not the same. At the same time, rational economic person is also faced with the dual demands of improving environmental quality and obtaining economic benefits, which may lead to multi-party dynamics in the governance process. For example, who pays the bill for pollution governance, how policies interact with environmental actions, how do policy makers assess the cost-effectiveness of subway operation under the new policy, and how the public moves from risk perception to environmental actions.
3.1. Question 1: Who Pays for Pollution Governance—Dynamics of Interests among Three Parties
Urban subway has been considered as a public utility. For subway companies, the benefits are mainly social benefits, i.e., the benefits of facilitating city economic and social development, addressing city transportation problems, and increasing modernization and living standards of city citizens. Therefore, people often consider subways as quasi-operating projects, which are invested, constructed, and subsidized by government [48,49,50,51]. For now, the profit model of subway companies is a world scale problem [52,53,54,55,56,57]. Controlling air pollution is the environmental protection idea to which the government attaches importance, but the improvement of outdoor air quality remains to be the priority. Solving the air pollution problem in the subway has not been placed in the priority agenda of the government’s decision-making. In addition, because of the difference between the interest of central and local governments, local governments are not always active in environmental governance in order to balance economic development goals and reduce marginal costs. The safety and economic operation of public welfare infrastructure such as urban subway is the primary goal of subway company and local government supervision. The vast majority of the subway companies cannot make a profit on prices and ancillary services alone. Government subsidies play an important role. Due to its extremely efficient operation and successful ancillary business services in the subway compartments, the Hong Kong subway operator is probably the only urban subway company in the world that can meet the ends and makes a profit, but we should be aware that Hong Kong has its own circumstances that other cities in the world may not have, i.e., small city size, high population density, economic prosperity, high income level, and stable passenger flow. The Hong Kong model would only be a reference, and the profit model should be designed based on city’s own circumstances. In Question 2, we are going to establish a cost-effectiveness model based on a general subway operation scenario, thus to discuss the government and company responsibilities through economic terms.
Air quality governance in the subway system could require a larger amount of budgets, such as the installation of screen door systems, air conditioning systems, tunnel maintenance, staff competency training, air pollution disclosure and verification, and renovation in the subways which have been put into operation. It may affect the operation time of the subway, cause the passenger flow to drop, increase the shadow cost of the government in the public welfare undertaking. From the perspective of cost-effectiveness, the government may only be willing to shoulder the responsibility of environmental supervision rather than the responsibility of pollution governance or the provision of environmental services and may even shift the responsibility to either companies or the public.
As the existing subway companies generally adopt the government-led or mixed-led mode of operation, under the government-dominated mode, companies are directly controlled by the government’s will to govern. If the government has a strong determination to govern, the companies will face less pressure on operating costs, but because the companies are responsible for the direct management of environmental quality, they will face the pressure from the government to supervise the environment. In hybrid dominant mode, due to the financing and operation of companies according to the market economy rules, affected by the diversity of interest demands of stakeholders, companies are more sensitive to operating costs, their environmental investment determination may weaken, and may shift the governance responsibility to consumers by raising prices or the prices of related resource-based services.
Public has a strong awareness of environmental quality, but the environmental action and environmental responsibility is insufficient. Relevant research points out that public tends to blame the environmental responsibility on the government, companies, and social organizations for environmental responsibility. If the government coordinates improperly, estimates the public’s ability to pay or responsibility preference incorrectly, and lacks information disclosure mechanism, the public may misunderstand the government’s willingness to protect the environment, and think that the government is shirking its responsibility for environmental protection, shifting the cost of environmental governance and service to the public, thus potentially triggering protests.
Therefore, since the subway air pollution governance involves the government, companies, public, and other different stakeholders, the difference in cost perception, environmental pollution perception, and environmental affordability among the stakeholders has led to a multi-interest dynamic. How to coordinate the interests of the three parties and define the boundary of their respective responsibilities is the key to pollution governance.
3.2. Question 2: How Clean Air Policy Interacts with Environmental Action
The launching of the subway clean air programme will directly affect the core interests of the three major groups, triggering dynamics of interests among the three parties. To be more specific, these are the dynamics among government’s environmental ambitions, company’s cost-effectiveness considerations, and public demands. On the one hand, the government formulates and implements policies and companies and the public abide by policies; on the other hand, companies adjust their business strategies according to policies and provide services to the public. The above two parties are the active part of the dynamics. Although the public also participates in the dynamics, they often have less voice than the other two parties and are less powerful in the interest chain. Therefore, it is the key to coordinate the interests of the three parties to deal with the relationship between the middle reaches and the upper reaches of the interest chain.
Since most subway companies are in a state of loss and need a large number of government subsidies, launching the subway clean air programme in subway is bound to further increase government investment in the construction and operation of the subway, which involves the cost-benefit analysis of improving the air quality of the subway. Referring to government policy interventions in improving outdoor air quality, such as formulating new air quality standards and setting five-year quantitative targets for air improvement, we can assume that improving air quality in the subway is also a public decision whose benefits outweigh costs. Based on this, as a regulator and a government with important decision-making power in subway operation, air quality standards for subways should be promulgated step by step. A roadmap and targets on subway air quality compliance shall be established to drive the subway operating companies to work actively with various stakeholder groups, including subway lines builders, subway vehicle manufacturers, subway service recipients, and other stakeholders to find cost-effective solutions to meet government regulatory objectives.
Based on the economics theorem, we try to construct a general cost-effectiveness model for subway companies after launching the clean air programme, and to explore the cost-effectiveness under different policies and operating scenarios. In a general understanding of subway profit model, the main parameters would consist of 4 parts, two income parts of ticket prices and other subway services, and two outcome parts of common expenditure on subway operations and expenditure on environmental measures. The general cost-effectiveness model would be written as the following equation:
In the above formula, the net income of the subway company, the first two terms to the right of the equation are company revenues, and the latter two items are company expenditures. is the subway price, is the number of passengers, represents the income of the enterprise from the sale of subway tickets, and represents the income from the development of subway resources, such as advertising, commerce, communications, real estate project operation, etc. expenses for common expenditure of subway operation, such as up-front expenses, interest, equipment operation expenses, staff expenses, etc. the clean air technology input after clean air programme, clean air technology policy subsidy. Generally speaking, the minimum condition for a business to remain in operation is , i.e.:
Adjust the left and right ends of the inequality to:
If companies have practical actions to invest in clean technology, at least and generally A should not be below a certain threshold. This threshold can be understood as the minimum input to meet air quality standards. At this time, with the increase of the actual action of the company, that is, the increase of the value, the right side of the above formula also needs to be increased. Therefore, the subway company can meet the actual action of pollution control by raising the ticket prices , increasing passenger flow through promotion means , expanding resource development , reducing common operating expenses or improving the clean technology policy subsidies to meet practical pollution governance actions.
However, the first three items on the right end of the above equation are often difficult to change. For example, subway prices are strictly regulated by the government, there are only normal fluctuations in passenger traffic , resource development are limited, common expenditure fluctuates less and so on [58]. Therefore, in the early stages of pollution governance, policy subsidies are an important tool. On the one hand, it can alleviate the pressure of companies’ early investment, on the other hand, it can stimulate companies to carry out clean technology transformation and eliminate backward companies by gradually shrinking the amount of subsidies. However, policy subsidies will undoubtedly increase the budget pressure of the government, and some areas that need a large amount of early investment in clean technology may face financial difficulties. In some subway companies operating in a market-oriented way, subway prices can fluctuate with the operating cost, which can alleviate the cost pressure of company operation, but when the prices are adjusted with the market signal, attention should be paid to the disclosure of relevant price fluctuation information in order to deepen the interaction between consumers and businessmen. As consumers enjoy the relevant better environmental services, consumers should be aware that they have to make contributions to the clean air programme in financial and policy participative manner.
We try to estimate the initial investment and market scale of the clean air programme. We simplify the problem to consider only the construction cost of installing screen doors and air-conditioning systems in substandard stations, while ignoring other costs, such as shadow costs of passenger flows, equipment operating costs, and the cost of installing other technologies, such as exchanging rails and wheels, installing iron particle captures, washing walls of tunnels, and wearing masks. There are at least 4 reasons why this paper suggests to choose installing screen door and air-conditioning systems over other technologies: compared to other methods, installing screen door systems are effective, more convenient, mature in technology, and operational in terms of cost [13]. The method that exchanges or upgrades materials of rails and wheels, and the technology that installs iron particle captures are still under R&D process and its cost and mitigation effectiveness is still unknown. Maintaining or washing tunnels will have a huge impact on the operation schedule and it is a normal process in subway maintenance. Meanwhile, it is not a good suggestion that commuters or life-long workers wear masks in terms of source mitigation, and in one Korean study, compared with no screen door systems, the PM concentrations were 16% lower at the same station that is installed with screen door systems [47]. However, we strongly suggest to mix other methods and technologies with screen door systems, for example, in a Taiwanese study, washing tunnels could reduce 28% of PM2.5 concentrations [59], and one Parisian study shows installing high performance filter could reduce 15% of PM concentrations [60]. Therefore, pollution governance is a mixed method, installing screen door system is an initial process at current stage with many other advantages (energy efficiency, safety concerns), and other mitigation methods should also be implemented and researched in order to maximize the effects of air quality improvement.
According to statistics released by UITP [35], there were approximately 2588 underground stations in Asia, 2122 in Europe, and 1046 in the Americas at the end of 2017.
There are two kinds of ventilation and air conditioning systems in subway. One is screen door system in which installs screen door is installed between station platform and road tunnel, separates the two, air conditioning system is set up in the subway station, and ventilation system is adopted in the section tunnel. The other is a closed system, which is installed with shutter safety door between the station platform and road tunnel. The subway station adopts air-conditioning system, and the cooling of section tunnel is realized by means of the "piston effect" of train operation with a part of station air-conditioning cold air. Since the closed system does not isolate the road tunnel from the platform, trains can directly transport PM in the tunnel to the platform, so the station air pollution with the closed system is often more serious. The initial investment in the implementation of the clean air programme is to replace the closed system with the screen door system. According to statistics [61], the equipment cost and civil construction cost of installing screen door system in subway station are USD 2.7 million and USD 1.4 million, respectively.
Assuming:
Regional Total Cost = Underground Station Quantity × (Screen Door Equipment Cost
+ Screen Door Civil Construction Cost)
+ Screen Door Civil Construction Cost)
If a single city is counted as a subway system, there are:
Individual Subway System Potential Cost = Regional Total Cost/Number of
Cities
Cities
In Asia, for example, there are about 2588 underground stations, 7218 km of subway mileage, and 70 cities counted. Assuming that all stations are equipped with screen door systems, the average cost per city is about USD 151 million:
[2588 × (2.7 + 1.4)]/70 ≈ USD 151 million
In the same way, the potential cost of individual subway system in Europe and America is USD 189 million and USD 115 million, respectively, which shows that the potential cost of air pollution governance in single city is in the range of USD 110~190 million. Based on the regional PM2.5 compliance rate (KMOE standard), it can be roughly estimated that the current pollution governance market size of Asian subway is about USD 6342 million, Europe about USD 6955 million, America about USD 2127 million. Given the small sample size of the Americas, the market size of this region should be comparatively close to that of Asia and Europe, and the global subway clean air market is about USD 15,424 million (Table 6).
It can be seen that there is a large market for subway clean air governance. However, this part of the investment belongs to the environmental protection cost, in the initial stage, the government participates in more, that is, the policy subsidy is larger. Some local governments may have fiscal budget pressure and cannot coordinate funds quickly. If given a certain degree of freedom of price fluctuation, it can alleviate some of the policy pressure, but the price signal may be passed on to consumer interests, triggering consumer dissatisfaction and resistance. The above analysis provides a preliminary assessment of the scale of the clean air programme, considering only the potential cost of installing screen door systems without taking into account the remaining potential costs. It belongs to conservative estimation, and may face more problems in the implementation, such as how to analyze the indirect social benefits of the subway clean air programme from the perspective of Marginal External Cost (MEC), how to coordinate the budget pressure, how to reform the subway price system, and so on. We provide useful assistance for the project landing through open discussion. However, the key to effectively implement the clean air programme in a resilient mode is to coordinate the cost transfer among the government, companies and the public, to manage the interaction between the interests of the three parties, and eventually to build a benign interactive mechanism driven by the cost transfer and the interest exchange, which is an endogenous impetus of the multi-agent complex system’s resilience.
3.3. Question 3: How the Public Moves from Risk Perception to Environmental Action
Although the public is in the downstream of the chain of interests, because it is the main user of the subway, when the air quality of the subway is poor, it is also a direct victim. The public cognition of the environmental risk and their feedback play a significant role in the resilient governance of air pollution. Therefore, from the public point of view, we should focus on risk perception and response actions.
Nowadays, environmental problems have received more and more attention. Although the public’s cognition of air pollution is gradually deepening [62], the cognition of subway air quality is generally insufficient. Because of the differences in the information acquisition, perception approaches, individual characteristics, and socio-economic factors, the cognition of subway air pollution varies from regions. At present, there are many problems in the public interest, such as lack of risk awareness, lack of access to risk information, lack of risk response measures, poor feedback, on environmental protection needs.
A very limited number of studies have shown that [63] public awareness of and response to air pollution in the subway are virtually zero, which presents a key challenge for initiating pollution governance, namely, how to provide effective public education and risk communication to people, and adjust the communication mode according to the cognitive differences in different regions so as to urge people to take positive protective measures to prevent people from entering into cognitive misunderstanding, and how to reduce the cost of policy implementation. It is suggested that the public’s risk awareness should be enhanced in the form of subway air quality data sharing platform, which can collect pollutant concentration information through distributed sensors, disclose relevant data to the public, introduce protective measures, and provide feedback to the public on pollution governance effect.
Due to the large number and wide range of air pollution audiences in the subway, it is urgent for the public to disclose relevant risk information. However, the subway operation department is facing the double pressure of environmental protection and income, and it may have the inertia of active risk disclosure before the implementation of non-mandatory air pollution laws and regulations. Therefore, some pilot cities with environmental preference can be selected to explore the possibility of active governance.
3.4. Question 4: How to Develop Clean Air Technology Better
The R&D of clean air technology is the backbone of pollution governance. Its research and development cost and governance effect directly determine the action power of companies, the intensity of policy subsidies and the public exposure risk in the Formula (9). Clean air technologies can refer to two types of technologies by function:
First, source control technology, such as braking, rail, and wheel contact interface material technology, are applied to improve mechanical wear resistance through the development of new materials; Air quality control technology, such as high performance screen door, High Efficient Particulate Air Filtering Systems integrated in the air conditioning systems in subway and so on [4]. Some research institutions have developed magnetic filter according to the characteristics of iron dust in subway, and the pollution control performance has improved 30%; developing anti-erosion technologies, for example, the new technologies or materials for tunnel repairing and cleaning.
Second, the ability to support technology, such as subway air quality data sharing platform, data collection and analysis technology, staff capacity training, and so on.
Clean air technology is not only a pollution control technology, but also a comprehensive approach to the subway technology tool box, which should be combined with the ideas of energy saving, convenience, safety, and so on.
4. Conclusions
Approximately 70% of the world’s urban subways do not meet the air quality standards, and the PM compliance rate may even be below 15% based on the more stringent WHO standards. Subway air pollution includes inhalable PM pollution, organic pollution, and microbial pollution. PM2.5 and PM10-based inhalable PM pollution is the main problem of air pollution. Subway air pollution is mainly endogenous pollution, which mainly comes from mechanical wear in tunnels and erosions of underground building materials. Subway inhalable PM is mainly composed of iron dust, black carbon, floating dust, and so on, which is different from road PM. Based on our calculation and models, the concentration of some metallic particles in the subway is close to the critical toxicity concentration of human body. Controlled by pollution sources severity and diffusion conditions, pollutants change in a certain site-time regularity. The main driving factors are platform vertical structures, train boundaries, tunnel piston wind, train frequencies, seasons, trains’ operation age, braking types, and environmental control systems.
It has been clear that the physical and chemical mechanism of subway air pollution. However, in the face of the fact that the subway air pollution is more serious, only a few cities are taking measures to control it. Through an analysis of the key issues and challenges that may be faced in initiating relevant governance measures. It is considered that the main reason for the delay of air pollution governance in subway is the conflict of essential interests and dynamics among the government, companies, and the public. Due to the differences in environmental and economic interests among the three parties, it is likely to shirk the responsibility for environmental protection out of self-interest considerations, which will directly affect the deployment of the governance actions. The authors analyze the possible dynamics formed by the three parties through open discussions—who pays the bills for pollution governance, how policies interact with companies’ environmental willingness, how the public moves from risk perception to environmental action, how to evaluate the cost-effectiveness of policy, and key clean air technology research and development issues.
This paper tries to make different contributions to a world scale subway air pollution governance issue, building quantitative models and calculation methods on air pollution status, and making discussion on a general context of environmental responsibilities. However, due to the limited references and potential preferences of samples selection, and the authors’ limited knowledge of different contexts of society and policy, there are certainly several limitations:
- (1)
- Miscalculations on regional pollutants average concentrations and total mass. We think that there are at least 2 reasons for such miscalculations are made. First, the number of reference limitations, currently only a small share of cities, were selected for studies, which means the regional average only stands for the existing studies instead of all cities; Second, it is due to the interest of studies. Some preferences or even prejudices on sample selection may exist, which may have impacts on the objectivity of actual pollution status.
- (2)
- Uncertainties on health risk calculations; for example, we used the US EPA parameters and values to assess the health risks, however, considering the potential differences of parameter values among different countries, some diversities may lose when only one source of parameters is used.
- (3)
- Other situations that our economic model may not see. For example, there might be additional parameters which could have implications to cost-effectiveness assessment, and we did not provide a full quantitative analysis on cost or policy scenarios. Neither did we discuss the uncertainties when calculating the mitigation cost. For example, first, there might be some uncertainties on mitigation cost per unit, i.e., we did not consider the differences of cost when installing screen door systems and labor employment in different regions and countries. Second, the effectiveness and cost of other mitigation technologies remain unclear.
- (4)
- We try to put our game analysis of three parties into a world scale and general model. However, due to the limitations of our knowledge on public policy and social and culture context in different countries, we suggest cautiously implementing our opinions and ideas to a universal context, and a tailored assessment should be developed according to the object’s own circumstances.
Although part of the analysis can only stay in theory, the key issues to be explicit help to incentivize relevant stakeholders. It should be recognized that air pollution governance in subway is different from basic scientific analysis. It is not a technical problem that can be solved only by using physical quantities. It involves the participation of many individuals, and most of urban dwellers are irrational individuals. There are differences in their own interests and value orientation. The problem is complex and relates to many societal factors. There are similarities between subway pollution governance and other environmental governance problems. Addressing this challenge not only requires technological and managerial innovation and experimentation, but also the needs to enhance the public’s environmental risk perception and to cultivate their environmental safety culture. It is important to build a consensus on the sharing of responsibilities and rights through the disclosure of information and the establishment of mechanisms for the active participation of all stakeholder groups. At the same time, from the perspective of the entire social environment and public health governance, rather than that confined to the management of the subway to seek solutions, it is significant to set up a road map to solve the problem of subway air pollution in a resilient mode.
Author Contributions
Conceptualization, R.Z. and W.Z.; methodology, R.Z. and W.Z.; software, H.Z.; validation, H.Z. and W.Z.; formal analysis, W.Z., A.Z. and J.L.; investigation, W.Z., H.Z., A.Z., and J.L.; resources, W.Z., A.Z., and J.L.; data curation, W.Z. and H.Z.; writing—original draft preparation, W.Z., H.Z., A.Z., and J.L.; writing—review and editing, W.Z., H.Z., A.Z., J.L. and R.Z.; visualization, H.Z.; supervision, R.Z.; project administration, R.Z. and W.Z.
Funding
This research was supported by National Key R&D Program of China (Grant No. 2018YFC0809900) and National Natural Science Foundation of China (Grant No. 71741027).
Acknowledgments
We would like to thank Cyril Cassisa, Caroline Lee, Janet Pape, Luca Lore, Andrew Prag, Peter Janoska and China Desk from International Energy Agency (IEA) who kindly supported this research, and who provided great assistance for Weiji’s living and study during his internship in Paris.
Conflicts of Interest
The authors declare no conflict of interest.
Appendix A
Table A1.
Indoor PM standards.
| PM Size | Mandatory Standard | Not Mandatory Standard | |
|---|---|---|---|
| NAAQS/EPA [21] | WHO [19] | KMOE [20] | |
| PM2.5 | 1a: 15 (3) | 1a: 10 (3) | - |
| 24 h: 65 (3) | 24 h: 25 (3) | 24 h: 50 (3) | |
| PM10 | 1a: 50 (3) | 1a: 20 (3) | - |
| 24 h: 150 (3) | 24 h: 50 (3) | 24 h: 100 (3) | |
Table A2.
Measurement information of selected cities.
| Region | City | Measurement Year | Pollutant Species | Location | Measurement Duration | Instrument |
|---|---|---|---|---|---|---|
| Asia | Hong Kong | 2013 | PM2.5 and PM10 | in-cabin | over 45 weekdays between May 27th–September 11th | DustTrak (Model 8520, TSI Inc., USA); Condensation particle counter (CPC, TSI Inc., USA) |
| Beijing | 2004 | Fungi, PM2.5 and PM10, PAHs | in-cabin | summer (July and August) and winter (December) | Dustmate fume and dust detector (Turnkey Instruments Ltd., United Kingdom) | |
| Shanghai | 2008 | PM2.5 and PM10 | Indoor | 10:00–16:00 | DustTrak (Model 8532, TSI Inc., USA) | |
| Guangzhou | 2001 | PM2.5 and PM10 | in-cabin | (Monday–Friday) in May and December | DustTrak (Model 8520, TSI Inc., USA) | |
| Tianjin | 2015 | PM2.5 | platforms and cars | 7:00 a.m.–10:00 a.m. and 4:30 p.m–7:30 p.m. on January 19 to February 1 | Fine particle separating devices (PEM-2000-25AA, SKC Inc., USA) | |
| Taipei | 2011 | PM2.5 and PM10 | outdoor roadside, ticket hall and platform | 06:00–24:00 from August 20 to November 12 | Particle monitors (BAM 1020 beta, Met One Inc., USA) | |
| Seoul | 2007–2008 | Fungi, PM2.5 and PM10 | worker main activity areas and passenger main movement areas | N/A | Mini-volume air sampler (Model PAS 201, Air Metrics., USA) | |
| Delhi | 2014 | PM2.5 | metro carriages | January–May | DustTrak (Model 8533, TSI Inc., USA) | |
| America | New York City | 2007–2008 | PM2.5 | subway riding | 8 h on 3 different days, between October 2007 and February 2008 | Personal monitor (AM510 SidePakTM, TSI Inc., USA) |
| Los Angeles | 2010 | PM2.5 and PM10, PAHs | each station and in-cabin | May 3–August 13 | DustTrak (Model 8520 TSI Inc., USA) | |
| Mexico City | 2002 | Fungi, PM2.5 and PM10 | in-cabin | 6 May–1 June | Gravimetric analysis (DataRAM, MIE Inc., United Kingdom) | |
| Santiago | 2011–2012 | PM2.5 | inside the stations | winter–spring months of 2011 and summer–autumn months of 2012 | DustTrak (Model 8532, TSI Inc., USA) | |
| Europe | London | 1996 | Fungi, PM2.5 | in-cabin | November 1995 and February 1996 | N/A |
| Barcelona | 2013 | PM2.5 and PM10, PAHs | underground stations | 2 April–30 July 2013 and 28 October 2013–10 March 2014 | IAQ monitor (Model 7525, TSI Inc., USA) | |
| Milan | 2010 | PM2.5 and PM10 | stations, platform and in-cabin | July | Condensed particle counter (P-Trak, TSI Inc., USA); optical particle counter (OPC, DustMonit Contec., Italy) | |
| Italian cities | 2014 | PM2.5 and PM10 | in-cabin and platforms | January | PM air sampling device (Aerocet 531, Met One Inc., USA) | |
| Lisbon | 2014 | PM2.5 and PM10 | platform and in-cabin | October 2014–March 2015 | DustTrak (Model 8530, TSI Inc., USA) | |
| Frankfurt | 2013 | PM2.5 and PM10 | platform | August | Laser aerosol spectrometer (PLA spectrometer, Grimm Aerosol Technik, Germany) | |
| Stockholm | 2000 | PM2.5 and PM10 | platform | 19 January–23 February | N/A | |
| Helsinki | 2004 | PM2.5 | 1 km from the tunnel entrance | 5th–21th March | Particle counter (FH62 I-R Eberline Instruments GmbH Inc., Germany) | |
| Prague | 2004 | PM2.5 and PM10 | in-cabin | 1 April–30 September, 1 October–31 March | DustTrak (Model 8520, TSI Inc., USA) | |
| Athens | 2013 | PM2.5 and PM10 | in-cabin | July and February | IAQ monitor (Model 3016 Lighthouse Inc., USA) | |
| Budapest | 2007 | PM10 | platform | 12:00 h on 20 until 15:00 h on 21 April | Tapered-element oscillating microbalance (Model 1400a, Rupprecht and Patashnick, USA) | |
| Istanbul | 2007 | PM10 | station | September 25th and October 31st | Air sampler (Model 20-800, Anderson ACFM, USA) |
* All data were derived from Xu and Hao’s report on world air pollution status.
| Region | Track Length (KM) | Pollutant Species | Average Concentration | Regional Total |
|---|---|---|---|---|
| Asia | 8031 | PAHs | 50.3 | 1.62 kg |
| PM2.5 | 96.09 | 3086.80 kg | ||
| PM10 | 127.14 | 4084.25 kg | ||
| Fungi | 727.6 | 23373422400 CFU | ||
| Europe | 2921 | PAHs | 93 | 1.09 kg |
| PM2.5 | 83.56 | 976.32 kg | ||
| PM10 | 197.4 | 2306.42 kg | ||
| Fungi | 125 | 1460500000 CFU | ||
| America | 2498 | PAHs | 19.7 | 0.20 kg |
| PM2.5 | 45.55 | 0455.14 kg | ||
| PM10 | 102 | 1019.18 kg | ||
| Fungi | 284 | 2837728000 CFU |
* The tunnel cross-sectional diameter was assumed to be about 4 m.
Table A4.
Mass Distribution and Total Weight of Chemicals in Subway—World Average [34].
Table A4.
Mass Distribution and Total Weight of Chemicals in Subway—World Average [34].
| Particle Type | Weight % (Standard Deviation) | Total | |
|---|---|---|---|
| PM2.5 | Soil/road dust | 18 | 811.72 kg |
| Iron-containing | 69 | 3111.61 kg | |
| Carbonaceous | 8 | 360.77 kg | |
| Aluminum | 2 | 90.19 kg | |
| Secondary nitrate/sulfates | 3 | 135.29 kg | |
| Others | 0.3 | 13.53 kg | |
| PM10 | Soil/road dust | 36 | 323.27 kg |
| Iron-containing | 44 | 395.11 kg | |
| Carbonaceous | 8 | 71.84 kg | |
| Aluminum | 5 | 44.90 kg | |
| Secondary nitrate/sulfates | 2 | 17.96 kg | |
| Others | 6 | 53.88 kg |
References
- Da Silva, C.B.P.; Saldiva, P.H.N.; Amato-Lourenço, L.F.; Rodrigues-Silva, F.; Miragliab, S.G.E.K. Evaluation of the air quality benefits of the subway system in Sao Paulo, Brazil. J. Environ. Manag. 2012, 101, 191–196. [Google Scholar] [CrossRef] [PubMed]
- Hwang, S.H.; Park, W.M. Indoor air quality assessment with respect to culturable airborne bacteria, total volatile organic compounds, formaldehyde, PM10, CO2, NO2, and O3 in underground subway stations and parking lots. Air Qual. Atmos. Health 2019, 12, 435–441. [Google Scholar] [CrossRef]
- Loxham, M.; Nieuwenhuijsen, M.J. Health effects of particulate matter air pollution in underground railway systems—A critical review of the evidence. Part. Fibre Toxicol. 2019, 16, 1–24. [Google Scholar] [CrossRef] [PubMed]
- Son, Y.S.; Oh, Y.H.; Choi, I.Y.; Trieu-Vuong, D.; Chung, S.G.; Lee, J.H.; Park, D.; Kim, J.C. Development of a magnetic hybrid filter to reduce PM10 in a subway platform. J. Hazard. Mater. 2019, 368, 197–203. [Google Scholar] [CrossRef] [PubMed]
- Nieuwenhuijsen, M.J.; Gomez-Perales, J.E.; Colvile, R.N. Levels of particulate air pollution, its elemental composition, determinants and health effects in metro systems. Atmos. Environ. 2007, 41, 7995–8006. [Google Scholar] [CrossRef]
- Xu, B.; Hao, J. Air quality inside subway metro indoor environment worldwide: A review. Environ. Int. 2017, 107, 33–46. [Google Scholar] [CrossRef]
- Chillrud, S.N.; Epstein, D.; Ross, J.M.; Sax, S.N.; Pederson, D.; Spengler, J.D.; Kinney, P.L. Elevated airborne exposures of teenagers to manganese, chromium, and iron from steel dust and New York City’s subway system. Environ. Sci. Technol. 2004, 38, 732–737. [Google Scholar] [CrossRef] [PubMed]
- Karlsson, H.L.; Nilsson, L.; Moller, L. Subway particles are more genotoxic than street particles and induce oxidative stress in cultured human lung cells. Chem. Res. Toxicol. 2005, 18, 19–23. [Google Scholar] [CrossRef]
- Aarnio, P.; Yli-Tuomi, T.; Kousa, A.; Makela, T.; Hirsikko, A.; Hameri, K.; Raisanen, M.; Hillamo, R.; Koskentalo, T.; Jantunen, M. The concentrations and composition of and exposure to fine particles (PM2.5) in the Helsinki subway system. Atmos. Environ. 2005, 39, 5059–5066. [Google Scholar] [CrossRef]
- Martins, V.; Moreno, T.; Cruz Minguillon, M.; Van Drooge, B.L.; Reche, C.; Amato, F.; De Miguel, E.; Capdevila, M.; Centelles, S.; Querol, X. Origin of inorganic and organic components of PM2.5 in subway stations of Barcelona, Spain. Environ. Pollut. 2016, 208, 125–136. [Google Scholar] [CrossRef]
- Martins, V.; Moreno, T.; Mendes, L.; Eleftheriadis, K.; Diapouli, E.; Alves, C.A.; Duarte, M.; De Miguel, E.; Capdevila, M.; Querol, X.; et al. Factors controlling air quality in different European subway systems. Environ. Res. 2016, 146, 35–46. [Google Scholar] [CrossRef] [PubMed] [Green Version]
- Moreno, T.; Perez, N.; Reche, C.; Martins, V.; De Miguel, E.; Capdevila, M.; Centelles, S.; Minguillon, M.C.; Amato, F.; Alastuey, A.; et al. Subway platform air quality: Assessing the influences of tunnel ventilation, train piston effect and station design. Atmos. Environ. 2014, 92, 461–468. [Google Scholar] [CrossRef]
- Park, J.H.; Son, Y.S.; Kim, K.H. A review of traditional and advanced technologies for the removal of particulate matter in subway systems. Indoor Air 2019, 29, 177–191. [Google Scholar] [CrossRef] [PubMed]
- Cho, J.H.; Min, K.H.; Paik, N.W. Temporal variation of airborne fungi concentrations and related factors in subway stations in Seoul, Korea. Int. J. Hyg. Environ. Health 2006, 209, 249–255. [Google Scholar] [CrossRef] [PubMed]
- Martins, V.; Moreno, T.; Minguillon, M.C.; Amato, F.; De Miguel, E.; Capdevila, M.; Querol, X. Exposure to airborne particulate matter in the subway system. Sci. Total Environ. 2015, 511, 711–722. [Google Scholar] [CrossRef] [PubMed] [Green Version]
- Li, Z.Y.; Che, W.W.; Frey, H.C.; Lau, A.K.H. Factors affecting variability in PM2.5 exposure concentrations in a metro system. Environ. Res. 2018, 160, 20–26. [Google Scholar] [CrossRef] [PubMed]
- Woo, S.H.; Kim, J.B.; Bae, G.N.; Hwang, M.S.; Tahk, G.H.; Yoon, H.H.; Kwon, S.B.; Park, D.; Yook, S.J. Size-dependent characteristics of diurnal particle concentration variation in an underground subway tunnel. Environ. Monit. Assess. 2018, 190, 740. [Google Scholar] [CrossRef]
- Gu, Y.; Wang, J.; Xie, J.; Liu, J.; Pan, S.; Wang, X. Experimental study of distribution of the particulate matter pollution in different metro environment control systems. J. Xi’an Univ. Technol. (China) 2018, 34, 55–60. [Google Scholar]
- WHO. WHO Air Quality Guidelines for Particulate Matter, Ozone, Nitrogen Dioxide and Sulfur Dioxide—Global update 2005; WHO Regional Office for Europe: Copenhagen, Denmark, 2005. [Google Scholar]
- KMOE. Emission Facility Management System, 2017. Management of Air Pollutant-emitting Facilities. Available online: http://eng.me.go.kr/eng/web/index.do?menuId=221 (accessed on 25 June 2019).
- NAAQS Table. Available online: https://www.epa.gov/criteria-air-pollutants/naaqs-table (accessed on 25 June 2019).
- Han, S.; Luo, R.; Li, M.; Yang, H. Progress in conductive carbon-based composites. Carbon Tech. 2010, 29, 24–31. [Google Scholar]
- Qu, X.; Zhang, L.; Wu, P.; Shijia, C.; Cao, J.; Ren, S.; Liu, T. Development and application of braking materials for modern rail transit vehicles. Mater. Sci. Technol. 2017, 25, 1–9. [Google Scholar]
- He, C.G.; Chen, Y.Z.; Huang, Y.B.; Liu, Q.Y.; Zhu, M.H.; Wang, W.J. On the surface scratch and thermal fatigue damage of wheel material under different braking speed conditions. Eng. Fail. Anal. 2017, 79, 889–901. [Google Scholar] [CrossRef]
- Moreno, T.; Martins, V.; Querol, X.; Jones, T.; BeruBe, K.; Minguillon, M.C.; Amato, F.; Capdevila, M.; De Miguel, E.; Centelles, S.; et al. A new look at inhalable metalliferous airborne particles on rail subway platforms. Sci. Total Environ. 2015, 505, 367–375. [Google Scholar] [CrossRef] [PubMed] [Green Version]
- Cao, Q.; Yang, A.; Li, Q.; Li, Y. Statistic analysis of groundwater corrosion to subway tunnel structure under seawater intrusion. J. Eng. Geol. 2016, 24, 345–351. [Google Scholar]
- Wenjie, S.; Jun, D.; Dehua, L. Studies on the Mechanical Model of Subway Station Structures under the Influence of Changes of Groundwater Level. In Proceedings of the 10th Asia Pacific Transportation Development Conference, Beijing, China, 25–27 May 2014; pp. 413–419. [Google Scholar]
- Jung, H.J.; Kim, B.; Ryu, J.; Maskey, S.; Kim, J.C.; Sohn, J.; Ro, C.U. Source identification of particulate matter collected at underground subway stations in Seoul, Korea using quantitative single-particle analysis. Atmos. Environ. 2010, 44, 2287–2293. [Google Scholar] [CrossRef]
- Colombi, C.; Angius, S.; Gianelle, V.; Lazzarini, M. Particulate matter concentrations, physical characteristics and elemental composition in the Milan underground transport system. Atmos. Environ. 2013, 70, 166–178. [Google Scholar] [CrossRef]
- Jung, H.J.; Kim, B.; Malek, M.A.; Koo, Y.S.; Jung, J.N.; Son, Y.-S.; Kim, J.C.; Kim, H.; Ro, C.U. Chemical speciation of size-segregated floor dusts and airborne magnetic particles collected at underground subway stations in Seoul, Korea. J. Hazard. Mater. 2012, 213, 331–340. [Google Scholar] [CrossRef] [PubMed]
- Lu, S.; Liu, D.; Zhang, W.; Liu, P.; Fei, Y.; Gu, Y.; Wu, M.; Yu, S.; Yonemochi, S.; Wang, X.; et al. Physico-chemical characterization of PM2.5 in the microenvironment of Shanghai subway. Atmos. Res. 2015, 153, 543–552. [Google Scholar] [CrossRef]
- Heo, K.J.; Lee, B.U. Seasonal variation in the concentrations of culturable bacterial and fungal aerosols in underground subway systems. J. Aerosol Sci. 2016, 92, 122–129. [Google Scholar] [CrossRef]
- Hwang, S.H.; Cho, J.H. Evaluation of airborne fungi and the effects of a platform screen door and station depth in 25 underground subway stations in Seoul, South Korea. Air Qual. Atmos. Health 2016, 9, 561–568. [Google Scholar] [CrossRef]
- Byeon, S.H.; Willis, R.; Peters, T.M. Chemical Characterization of Outdoor and Subway Fine (PM2.5-1.0) and Coarse (PM10–2.5) Particulate Matter in Seoul (Korea) by Computer-Controlled Scanning Electron Microscopy (CCSEM). Int. J. Environ. Res. Public Health 2015, 12, 2090–2104. [Google Scholar] [CrossRef]
- Mezghani, M. World metro figures 2018. Available online: https://www.uitp.org/world-metro-figures-2018 (accessed on 14 August 2019).
- Wang, W.H.; Wong, M.H.; Leharne, S.; Fisher, B. Fractionation and biotoxicity of heavy metals in urban dusts collected from Hong Kong and London. Environ. Geochem. Health 1998, 20, 185–198. [Google Scholar] [CrossRef]
- Kunzli, N.; Kaiser, R.; Medina, S.; Studnicka, M.; Chanel, O.; Filliger, P.; Herry, M.; Horak, F.; Puybonnieux-Texier, V.; Quenel, P.; et al. Public-health impact of outdoor and traffic-related air pollution: A European assessment. Lancet 2000, 356, 795–801. [Google Scholar] [CrossRef]
- Dockery, D.W.; Pope, C.A.; Xu, X.P.; Spengler, J.D.; Ware, J.H.; Fay, M.E.; Ferris, B.G.; Speizer, F.E. An association between air-pollution and mortality in 6 united-states cities. N. Engl. J. Med. 1993, 329, 1753–1759. [Google Scholar] [CrossRef] [PubMed]
- Qiao, T.; Xiu, G.; Zheng, Y.; Yang, J.; Wang, L.; Yang, J.; Huang, Z. Preliminary investigation of PM1, PM2.5, PM10 and its metal elemental composition in tunnels at a subway station in Shanghai, China. Transp. Res. Part Transp. Environ. 2015, 41, 136–146. [Google Scholar] [CrossRef]
- U.S. EPA. Exposure Factors Handbook; 2011 Edition (Final Report); U.S. Environmental Protection Agency: Washington, DC, USA, 2011.
- Tao, J.; Gao, J.; Zhang, L.; Zhang, R.; Che, H.; Zhang, Z.; Lin, Z.; Jing, J.; Cao, J.; Hsu, S.C. PM2.5 pollution in a megacity of southwest China: Source apportionment and implication. Atmos. Chem. Phys. 2014, 14, 8679–8699. [Google Scholar] [CrossRef]
- Querol, X.; Moreno, T.; Karanasiou, A.; Reche, C.; Alastuey, A.; Viana, M.; Font, O.; Gil, J.; De Miguel, E.; Capdevila, M. Variability of levels and composition of PM10 and PM2.5 in the Barcelona metro system. Atmos. Chem. Phys. 2012, 12, 5055–5076. [Google Scholar] [CrossRef]
- Cheng, Y.H.; Yan, J.W. Comparisons of particulate matter, CO and CO2 levels in underground and ground-level stations in the Taipei mass rapid transit system. Atmos. Environ. 2011, 45, 4882–4891. [Google Scholar] [CrossRef]
- Cheng, Y.H.; Lin, Y.L.; Liu, C.C. Levels of PM10 and PM2.5 in Taipei Rapid Transit System. Atmos. Environ. 2008, 42, 7242–7249. [Google Scholar] [CrossRef]
- Kam, W.; Cheung, K.; Daher, N.; Sioutas, C. Particulate matter (PM) concentrations in underground and ground-level rail systems of the Los Angeles Metro. Atmos. Environ. 2011, 45, 1506–1516. [Google Scholar] [CrossRef]
- Onat, B.; Stakeeva, B. Assessment of fine particulate matters in the subway system of Istanbul. Indoor Built Environ. 2014, 23, 574–583. [Google Scholar] [CrossRef]
- Kim, K.H.; Ho, D.X.; Jeon, J.S.; Kim, J.C. A noticeable shift in particulate matter levels after platform screen door installation in a Korean subway station. Atmos. Environ. 2012, 49, 219–223. [Google Scholar] [CrossRef]
- McEachern, W.A. Economics: A Contemporary Introduction; Southwest Cengage Learning: Mason, OH, USA, 2009; pp. 332–333. [Google Scholar]
- Hill, M. Everthing you ever wanted to know about Seoul Metro System but were too afraid to ask. Available online: https://www.citymetric.com/transport/everything-you-ever-wanted-know-about-seoul-metro-system-were-too-afraid-ask-3702 (accessed on 23 February 2018).
- MUNRO, S. How Does Toronto’s 2014 Budget Affect the TTC? Available online: https://torontoist.com/2013/11/how-does-torontos-2014-budget-affect-the-ttc/ (accessed on 23 November 2013).
- BRENNAN, J. LIRR’s Heavy Subsidies and the Coming Debate Over MTA Funding. Available online: https://jimbrennanscommentaries.com/2019/01/13/lirrs-heavy-subsidies-and-the-coming-debate-over-mta-funding/ (accessed on 13 January 2019).
- Levy, A. Why Are the NYC Subway’s Operating Costs so High? Available online: https://ny.curbed.com/2017/10/13/16455880/new-york-city-subway-mta-operating-cost-analysis (accessed on 13 October 2017).
- Smith, S. Why China’s Subway Boom Went Bust. Available online: https://www.citylab.com/transportation/2012/09/why-chinas-subway-boom-went-bust/3207/ (accessed on 10 September 2012).
- OTIS, G.A. MTA is losing money and headed to financial disaster, despite attempts to find revenue. Available online: https://www.nydailynews.com/new-york/mta-losing-money-headed-financial-ruin-article-1.2202720 (accessed on 28 April 2015).
- Solomon, L. Subways, profitable subways. Available online: https://business.financialpost.com/opinion/lawrence-solomon-subways-profitable-subways (accessed on 2 October 2014).
- Kurosaki, F. A study of vertical separation in Japanese passenger railways. Case Stud. Transp. Policy 2018, 6, 391–399. [Google Scholar] [CrossRef]
- Kurosaki, F.; Alexandersson, G. Managing unprofitable passenger rail operations in Japan—Lessons from the experience in Sweden. Res. Transp. Econ. 2018, 69, 460–469. [Google Scholar] [CrossRef]
- Vickrey, W. Some implications of marginal cost pricing for public utilities. Am. Econ. Rev. 1955, 45, 605–620. [Google Scholar]
- Chen, Y.Y.; Lu, C.Y.; Chen, P.C.; Mao, I.F.; Chen, M.L. Analysis of Aerosol Composition and Assessment of Tunnel Washing Performance within a Mass Rapid Transit System in Taiwan. Aerosol Air Qual. Res. 2017, 17, 1527–1537. [Google Scholar] [CrossRef]
- Tokarek, S.; Bernis, A. An exemple of particle concentration reduction in Parisian subway stations by electrostatic precipitation. Environ. Technol. 2006, 27, 1279–1287. [Google Scholar] [CrossRef]
- Li, W.; Yin, S. Analysis on Cost of Urban Rail Transit. J. Transp. Syst. Eng. Inf. Technol. 2012, 12, 9–12. [Google Scholar] [CrossRef]
- Grana, M.; Toschi, N.; Vicentini, L.; Pietroiusti, A.; Magrini, A. Exposure to ultrafine particles in different transport modes in the city of Rome. Environ. Pollut. 2017, 228, 201–210. [Google Scholar] [CrossRef]
- Moreno, T.; De Miguel, E. Improving air quality in subway systems: An overview. Environ. Pollut. 2018, 239, 829–831. [Google Scholar] [CrossRef]
Figure 1.
Total Distribution of Pollutants in Subway. Source: Pollutants data are derived from Xu’s and Byeon’s work, information of selected cities on location (e.g., cities, above ground, on the platform or in-cabin), measurement year and duration, pollutant species and instruments are shown in the Table A2 of Appendix A. Subway length and cross-sectional data were from UITP’s report [35].

Table 1.
Statistics on air quality of subway in different regions in the world.
| Region | Pollutants | Average Concentrations (μg/m3) | Number of Samples | Number of Standard Compliant (WHO) | Compliance Rate (WHO) | Number of Standard Compliant (KMOE) | Compliance Rate (KMOE) |
|---|---|---|---|---|---|---|---|
| Asia | PM2.5 | 96.09 | 8 | 1 | 12.50% | 3 | 37.50% |
| PM10 | 127.14 | 7 | 2 | 28.57% | 3 | 42.86% | |
| Europe | PM2.5 | 83.56 | 9 | 1 | 11.11% | 2 | 22.22% |
| PM10 | 197.40 | 10 | 1 | 10.00% | 2 | 20.00% | |
| America | PM2.5 | 45.55 | 4 | 1 | 25.00% | 2 | 50.00% |
| PM10 | 102.00 | 2 | 0 | 0.00% | 1 | 50.00% | |
| Total | PM2.5 | 81.09 | 21 | 3 | 14.29% | 7 | 33.33% |
| PM10 | 161.47 | 19 | 3 | 15.79% | 6 | 31.58% |
Source: The WHO and KMOE standard for particulate matter (PM) compliance calculation are shown in Table A1 in Appendix A. The selected cities for calculation in each region are shown in Table A2 in Appendix A. The average concentration for each region is the arithmetic average concentration of all selected cities in each region, the PM compliance rate is obtained by comparing selected cities with air quality standards, all PM data of selected cities are from Xu and Hao’s contribution on world report [6].
Table 2.
Major particle-type categories of particulate matter (PM)2.5–10.
| Particle Type | Metal/Elements |
|---|---|
| Soil/road dust | Al-Si, Al-Si-K, Al-Si-Mg, Ca/S, Ca/Si, Ca-Mg, Ca-rich, and Si-rich components. |
| Iron-containing | Iron oxides and some iron metal particles. |
| Carbonaceous | Aluminosilicates/C and SiO2/C |
| Aluminum | Absence of silicon compared with Soil/road dust |
| Secondary nitrates/sulfates | Na/Cl, Na-rich and S-rich components. |
Source: major contribution from Jung’s paper [28].
Table 4.
Reference doses (RfD) and slope factor (SF) of metals provided by US EPA.
| Parameter | Cr | Mn | Fe | Ni | Cu | Zn | Pb | Hg |
|---|---|---|---|---|---|---|---|---|
| RfDinh | 2.86 × 10⁻⁵ | 1.43 × 10⁻⁵ | 3.00 × 10⁻¹ | 2.06 × 10⁻² | 4.02 × 10⁻² | 3.00 × 10⁻¹ | 3.52 × 10⁻³ | 9.00 × 10⁻⁵ |
| RfDing | 3.00 × 10⁻³ | 4.60 × 10⁻² | 3.00 × 10⁻¹ | 2.00 × 10⁻² | 4.00 × 10⁻² | 3.00 × 10⁻¹ | 3.50 × 10⁻³ | 3.00 × 10⁻⁴ |
| RfDder | 6.00 × 10⁻⁵ | 1.84 × 10⁻³ | 4. × 10−2 | 5.40 × 10⁻³ | 1.60 × 10⁻² | 6.00 × 10⁻² | 5.25 × 10⁻⁴ | 2.10 × 10⁻⁵ |
| SF | 4.10 × 101 | 8.40 × 10⁻¹ |
Source: Parameters are derived from US EPA [40].
Table 5.
Non-carcinogenic and carcinogenic health risks of heavy metals in particulate matter (PMs).
Table 5.
Non-carcinogenic and carcinogenic health risks of heavy metals in particulate matter (PMs).
| Non-Carcinogenic | Inhalation | Ingestion | Dermal Contact |
| Cr | 3.01 × 10⁻²–5.66 × 10⁻² | 3.81 × 10⁻³–7.17 × 10⁻³ | 4.27 × 10⁻²–8.03 × 10⁻² |
| Mn | 6.02 × 10⁻¹–9.56 × 10⁻¹ | 2.49 × 10⁻³–3.95 × 10⁻³ | 1.39 × 10⁻²–2.21 × 10⁻² |
| Fe | 4.56 × 10⁻³–8.10 × 10⁻³ | 6.05 × 10⁻²–1.08 × 10⁻¹ | 9.04 × 10⁻²–1.61 × 10⁻¹ |
| Ni | 9.09 × 10⁻⁶–1.7 × 10⁻⁵ | 1.24 × 10⁻⁴–2.32 × 10⁻⁴ | 1.03 × 10⁻⁴–1.92 × 10⁻⁴ |
| Cu | 5.54 × 10⁻⁵–7.93 × 10⁻⁵ | 7.40 × 10⁻⁴–1.06 × 10⁻³ | 4.14 × 10⁻⁴–5.93 × 10⁻⁴ |
| Zn | 8.10 × 10⁻⁶–1.40 × 10⁻⁵ | 1.08 × 10⁻⁴–1.86 × 10⁻⁴ | 1.21 × 10⁻⁴–2.08 × 10⁻⁴ |
| Pb | 6.04 × 10⁻⁶–5.46 × 10⁻⁵ | 8.07 × 10⁻⁵–7.30 × 10⁻⁴ | 1.21 × 10⁻⁴–1.09 × 10⁻³ |
| Hg | 9.00 × 10⁻⁶–7.31 × 10⁻⁶ | 3.59 × 10⁻⁵–2.91 × 10⁻⁵ | 1.12 × 10⁻⁴–9.33 × 10⁻⁵ |
| HI | 6.36 × 10⁻¹–1.02 | 6.79 × 10⁻²–1.21 × 10⁻¹ | 1.48 × 10⁻¹–2.65 × 10⁻¹ |
| Carcinogenic | Inhalation | ||
| Cr | 2.52 × 10⁻⁵–4.74 × 10⁻⁵ | ||
| Ni | 1.12 × 10⁻⁷–2.10 × 10⁻⁷ | ||
| Total | 2.53 × 10⁻⁵–4.76 × 10⁻⁵ |
Source: The metal elemental composition statistics were derived from Qiao’s investigation in Shanghai, China [39].
Table 6.
Market Size Estimation of Clean Air Programme.
| Region | Number of Cities | Length (km) | Number of Underground Stations | Clean Air Programme Market Size (Million USD) |
|---|---|---|---|---|
| Asia-Pacific | 70 | 7218 | 2588 | 6342 |
| Europe | 46 | 2921 | 2122 | 6955 |
| America | 37 | 2498 | 1046 | 2127 |
| Total | 153 | 12,637 | 5756 | 15,424 |
© 2019 by the authors. Licensee MDPI, Basel, Switzerland. This article is an open access article distributed under the terms and conditions of the Creative Commons Attribution (CC BY) license (http://creativecommons.org/licenses/by/4.0/).
Share and Cite
MDPI and ACS Style
Zhang, W.; Zhao, H.; Zhao, A.; Lin, J.; Zhou, R. Current Status, Challenges and Resilient Response to Air Pollution in Urban Subway. Atmosphere 2019, 10, 472. https://0-doi-org.brum.beds.ac.uk/10.3390/atmos10080472
AMA Style
Zhang W, Zhao H, Zhao A, Lin J, Zhou R. Current Status, Challenges and Resilient Response to Air Pollution in Urban Subway. Atmosphere. 2019; 10(8):472. https://0-doi-org.brum.beds.ac.uk/10.3390/atmos10080472
Chicago/Turabian StyleZhang, Weiji, Han Zhao, Ang Zhao, Jiaqiao Lin, and Rui Zhou. 2019. "Current Status, Challenges and Resilient Response to Air Pollution in Urban Subway" Atmosphere 10, no. 8: 472. https://0-doi-org.brum.beds.ac.uk/10.3390/atmos10080472
Note that from the first issue of 2016, this journal uses article numbers instead of page numbers. See further details here.