Experience from Integrated Air Quality Management in the Mexico City Metropolitan Area and Singapore


1
Molina Center for Energy and the Environment, La Jolla, CA 92037, USA
2
Independent Research Scientist, Singapore 118719, Singapore
3
Independent Research Scientist, Mexico City 11800, Mexico
*
Author to whom correspondence should be addressed.
Atmosphere 2019, 10(9), 512; https://0-doi-org.brum.beds.ac.uk/10.3390/atmos10090512
Submission received: 15 July 2019
/
Revised: 22 August 2019
/
Accepted: 26 August 2019
/
Published: 31 August 2019
(This article belongs to the Special Issue Air Quality in the Asia-Pacific Region)
Abstract
:More than half of the world’s population now lives in cities as a result of unprecedented urbanization during the second half of the 20th century. The urban population is projected to increase to 68% by 2050, with most of the increase occurring in Asia and Africa. Population growth and increased energy consumption in urban areas lead to high levels of atmospheric pollutants that harm human health, cause regional haze, damage crops, contribute to climate change, and ultimately threaten the society’s sustainability. This article reviews the air quality and compares the policies implemented in the Mexico City Metropolitan Area (MCMA) and Singapore and offers insights into the complexity of managing air pollution to protect public health and the environment. While the differences in the governance, economics, and culture of the two cities greatly influence the decision-making process, both have made much progress in reducing concentrations of harmful pollutants by implementing comprehensive integrated air quality management programs. The experience and the lessons learned from the MCMA and Singapore can be valuable for other urban centers, especially in the fast-growing Asia-Pacific region confronting similar air pollution problems.
1. Introduction
The number, size, and geographical distribution of large urban centers have increased dramatically during the second half of the 20th century. In 2018, 55% of the world’s population (7.6 billion) lived in urban areas and this is projected to increase to 68% by 2050, with most of the increase taking place in Asia and Africa [1]. The growth in urban population and the increased demands for energy by transportation, household activities, power generation, and industry have led to the emissions of large amounts of air pollutants with adverse impacts on human health and the environment. According to World Health Organization (WHO), air pollution is the most pressing environmental health crisis in the world; it was responsible for more than 7 million premature deaths in 2016 of which around 4.2 million were attributed to ambient (outdoor) air pollution [2]. While air pollution affects all regions, socioeconomic groups, and age groups, there are distinct geographical differences in exposure levels, with South East Asia, the Eastern Mediterranean, and the Western Pacific Regions having the highest air pollution levels [3,4].
Cities are the engines of economic growth in many countries of the world; however, many fast-growing cities are also struggling with environmental degradation, traffic congestion, inadequate urban infrastructure, and a lack of basic services, such as water supply, sanitation, and waste management. Maintaining economic growth, while creating sustainable livable cities for all residents, is the biggest urban challenge facing many countries today.
This article compares the air quality and the policies implemented in the Mexico City Metropolitan Area (MCMA, which includes Mexico City and contiguous municipalities as defined below) and Singapore and offers insights into the complexity of managing the air pollution problem to protect the public health and the environment. While there are similarities between the two urban centers as both are challenged to control severe air pollution as a result of rapid population growth, industrialization, and motorization, there are some important differences. Singapore is a city-state with very different governance from that of a city such as Mexico City. Mexico and Singapore started out with comparable GDP per capita in 1960, but it has increased dramatically for Singapore, changing from $428 in 1960 to $57,700 in 2017 [5], making it one of the highest per capita GDP and strongest economies of the world. In contrast, the GDP per capita of Mexico was $342 in 1960 and reached $8910 in 2017, about six times lower than Singapore. Mexico City contributes about 16% to the national GDP and its GDP per capita is about $19,000, much higher than the rest of the country, although it is three times lower than that of Singapore.
The differences in the governance, economics, and culture of the two cities greatly influence the decision-making process. Both cities have worked to overcome severe air pollution problems; Singapore has become one of the cleanest cities in Asia while Mexico City has become a model for the emerging cities in the developing world. Nevertheless, both cities face ongoing challenges to continue reducing concentrations of harmful pollutants to protect the population, as presented in this article.
2. Mexico City Metropolitan Area
2.1. Basic Information about the Mexico City Metropolitan Area
2.1.1. Governance
Mexico City Metropolitan Area consists of the 16 boroughs (alcaldías) of Mexico City (Ciudad de México, or CDMX, formerly known as the Federal District, DF), 59 municipalities of the State of Mexico, and one municipality from the State of Hidalgo. With over 21 million inhabitants, the MCMA is one of the largest megacities of the world and the most populous metropolitan area in North America [6].
In Mexico, the right to clean air and a healthy environment is supported by different levels of Mexican legislations: (a) Constitution: Article 4 recognizes the right to a healthy environment, (b) the recent Constitution of Mexico City: Article 16 guarantees the right to a healthy environment and requires the development of public policies for the protection of the environment, including the atmosphere [7]. Because Mexico City is also the capital of the nation, it can never become a state; however, Mexico City has the same level of autonomy comparable to that of a state. The Secretariat of Environment (SEDEMA) is responsible for Mexico City’s environmental programs, including air quality management and climate action plans. Similarly, the environment secretariats of the State of Mexico and State of Hidalgo manage the environmental programs of their respective states. In 1996, the Metropolitan Environmental Commission (CAM) was created to coordinate the various levels of government that converge in metropolitan environmental problems [8]. The members of CAM consisted of the federal Secretariat of Environment, Natural Resources, and Fisheries (SEMARNAP), the federal Secretariat of Health, the Chief of Government of the Federal District, and the Governor of the State of Mexico. CAM was replaced in 2013 by the Megalopolis Environmental Commission (CAMe) to coordinate the environmental issues in the megalopolis, which covers Mexico City and the contiguous municipalities of five surrounding states (Puebla, Tlaxcala, Morelos, Hidalgo, and Mexico) [9], as described below.
In addition to the local environmental agencies, at federal level the Mexican Secretariat of the Environment and Natural Resources (SEMARNAT) is responsible for the protection and management of natural resources and enforcement of environmental laws. The National Centre for Disaster Prevention (CENAPRED) is responsible for risk management and disaster prevention in Mexico to reduce public exposure to meteorological, hydrological, geological, and chemical hazards such as tropical storms, flooding, earthquakes, volcanic eruptions, and chemical releases. The National Meteorological Service (SMN) provides forecasts and warnings on weather condition, as well as information on meteorology and climatology for the entire country to support decision making.
2.1.2. Population and Urban Development of the MCMA
Mexico City has undergone massive transformations in urbanization and demographics throughout its history [10]. The population of the Valley of Mexico went from less than 2 million inhabitants in 1940 to more than 21 million in the year 2016, and the urban area increased from about 120 km2 to 7585 km2 during the same period. The population growth and the urban expansion pushed the city beyond Mexico City and into the State of Mexico as well as some parts of the State of Hidalgo. Currently, the MCMA includes 8.8 million inhabitants in Mexico City occupying an area of 1485 km2, 12.5 million inhabitants in the 59 municipalities of the State of Mexico covering an area of 6000 km2, and 130,000 inhabitants in the municipality of Tizayuca in the State of Hidalgo in an area of 100 km2 (see Figure 1) [11].
The population growth rate of Mexico City has steadied since 2000, while the urban population of the State of Mexico has increased; therefore, more municipalities of the State of Mexico have been added to the MCMA over the years. In fact, the neighboring metropolitan areas (Puebla, Tlaxcala, Cuernavaca, Pachuca, and Toluca) have also shown increasing demographic growth. This multiple expansion has produced a contiguous urban complex known as the Mexico “Megalopolis” that include Mexico City and the contiguous municipalities from five states (Mexico, Puebla, Tlaxcala, Morelos, and Hidalgo) with an estimated population of about 31 million.
The combination of continuous urban expansion and growing economic activities has induced the daily movement of a large number of people and goods, as well as substantial changes in land use in the region, leading to increased energy demand. Figure 2 shows the energy consumption for the MCMA between 1990 and 2014, illustrating the largest increase in the transport sector.
2.1.3. Topography and Meteorology of the MCMA
The MCMA lies in an elevated basin at an altitude of 2240 m above mean sea level (masl) and is surrounded by mountains and volcanoes on three sides, with an opening in the north to the Mexican Plateau and a mountain gap to the southeast (Figure 1). The MCMA has a subtropical highland climate: A cool dry season from November to February is followed by a warm dry season until May and a rainy season from June to October. The MCMA’s semi-closed basin, together with its altitude and latitude, induce the meteorological factors that characterize each of the seasons throughout the year in the region. The hot dry season is characterized by high-pressure systems with clear skies, high solar radiation, and weak wind most of the day promoting photochemical processes that form ozone (O3) and other oxidants, as well as increase secondary aerosol loadings through chemical reactions, dust, and biomass burning; in addition, the prevailing wind pattern causes the stagnation of pollutants in the southern area of the basin. Weak winds and strong temperature inversions at night also lead to high primary pollutant concentrations during rush hour that continue into the morning, followed by very rapid boundary layer growth to about 2 to 4 km in the early afternoon [12]. The high elevation and the basin-mountain circulation ventilate the basin effectively; consequently, there is relatively little recirculation or day-to-day carry-over of pollutants within the basin [13]. The cool dry season has stronger surface inversions and higher morning concentrations of primary pollutants. The rainy season has lower concentration of particulate matter (PM) but continues to have relatively high O3 concentration because of intense photochemical reactions occurring prior to the precipitation in the afternoon. Thus, high O3 episodes can occur throughout the year in the MCMA due to its subtropical latitude and high altitude [14].
2.2. Infrastructure and Air Quality Management Tools
Since the 1990s, the Mexican government has made significant progress in improving the air quality of the MCMA by developing and implementing successive comprehensive air quality management programs that combined regulatory actions with technological changes and were informed by scientific research. In an effort to successfully achieve clean air goals, the government has established air quality standards, developed an air quality monitoring network, built emission inventories, invested in a forecasting air quality model, and supported research field studies. The combined information on emissions inventory, land cover and urban morphology, meteorology, and atmospheric chemistry enables air quality models to be developed and to be used as a tool for forecasting potential air pollution episode, as well as evaluating past episodes and the efficiency of control measures.
In 1994 and following the lead from the US government, the Mexican government established the first ambient air quality standards for ozone (O3), carbon monoxide (CO), nitrogen dioxide (NO2), sulfur dioxide (SO2), lead (Pb), and particulate matter 10 micrometers or less in diameter (PM10) with the aim of protecting public health. The standards are defined by the Secretary of Health and are reviewed periodically. The standards were updated in 2014 for O3, PM10, and PM2.5 (particulate matter 2.5 micrometers or less in diameter) and in 2010 for SO2, but the standards for Pb, CO, and NO2 have not been updated since the onset [15,16,17,18,19,20]. The current air quality standards for Mexico are presented in Table 1.
The Mexico City atmospheric monitoring system (Sistema de Monitoreo Atmosférico or SIMAT) has a wide geographic coverage and good data collection capacity through its four networks (automatic, manual, atmospheric deposition, and meteorological). It is one of the most advanced in Latin America. Figure 1 shows the locations of the automatic atmospheric monitoring network (Red Automática de Monitoreo Atmosférico, RAMA). The air quality data, along with UV index and meteorological forecasting, are posted hourly on the SEDEMA website; they are also available via mobile app. The air quality forecast alerts the public in advance about critical pollution levels, helping to prevent exposure to harmful pollutants. In concert with CAMe, SIMAT announces contingency actions when measured pollutants levels are above critical threshold [22]. To meet such tasks, SIMAT is equipped with an air quality monitoring center, an environmental analysis laboratory, and a data center.
The MCMA emissions inventory is very well developed and is in compliance with the BASIC+ certification issued by C40 (a network of the world’s megacities and cities committed to addressing climate change). The inventory is updated every two years and includes criteria and toxic pollutants, black carbon and greenhouse gases, as well as the diurnal and spatial variability of the emissions. The inventory estimates emissions of about 2150 regulated industries, and about 3000 regulated commercial and residential activities, in addition to contributions from vehicular traffic, aviation operations, waste and wastewater management, and natural sources (i.e., biogenic sources) over a gridded area of 1 km × 1 km cells (as needed for modeling purposes). Current and past emissions inventories are available on the SEDEMA website [11].
Mexico City government has maintained an extensive communication infrastructure and deploys various strategies to disseminate information to the public. These include real-time reporting of ambient air quality data and forecasting, which are available to the public via its website and mobile app, and are used by the news media in weather forecast to alert the public of high pollution episodes and severe weather events, as well as providing hydrometeorological notices and risks atlas.
2.3. Air Quality Trends
Since the 1960s, there were limited measurements of pollutants, particularly SO2 and total suspended particles (TSP) [23]. The government of Mexico City started monitoring air quality in the 1970s with a manual network of 22 stations for SO2 and TSP. The automatic air-quality monitoring network, established in the late 1980s, revealed high concentrations of all criteria pollutants, placing Mexico City air pollution problems among the worst in the world.
Figure 3 shows the percentage of change of the annual average concentration relative to the annual average of 1990 for each of the main air pollutants in the MCMA (for PM2.5, the reference is the annual average of 2004, since PM2.5 measurements started in 2003). The figure shows that after more than three decades of comprehensive air quality management programs, Mexico City has made important advances to reduce air pollution. The atmospheric concentrations of Pb, SO2, and CO have significantly reduced and are below the current air quality standards. However, although O3, PM10, and PM2.5 concentrations have also decreased substantially, they are still at levels that are above the respective air quality standards. Furthermore, no declining trend for O3 and PM2.5 has been observed since 2006, and several severe pollution episodes in recent years suggest that their concentrations could be increasing [24].
2.4. Emissions Inventory
The MCMA has developed emissions inventory since the late 1980s, in which mobile source emissions were estimated using traffic counts while industrial emissions were estimated by voluntary survey [Molina and Molina, 2002]. Since the year 1994, the emissions inventory covers four categories: Point sources (industry), area sources (services and residential), mobile sources (transportation), and natural sources (vegetation and soil). Figure 4 shows the emission trends by sectors for non-methane volatile organic compounds (NMVOCs), NOx, CO, PM10, PM2.5, and SO2. There are important caveats to consider when comparing the time evolution of MCMA emissions, including: (a) Emission models and versions used for past and newer inventories; (b) changes in repository databases of activity data; (c) selected emission factors for specific sources are often updated using improved information; (d) changes in assumptions and methodologies are often applied in newer inventory versions (e.g., adding new, removing, or grouping of similar emission categories; in general, the more recent inventories include more categories); and (e) changes in the spatial extent of the inventory (e.g., including more peripheral municipalities). Differences in data quality protocols during the emissions estimation can also affect the comparison between past and current inventories. Due to the uncertainties introduced by these issues, the time evolution of emissions shown in Figure 4 should be considered only as illustrative until past inventories are re-calculated using the current models and methods.
The most recent 2016 MCMA emissions inventory includes several improvements relative to previous inventories, such as the number and specificity of source categories and pollutants, and the use of MOVES (motor vehicle emission simulator) developed by US Environmental Protection Agency [26] adapted for Mexico, MOVES-Mexico, for estimating emissions from mobile sources. Table 2 presents the annual emissions of the MCMA for the year 2016 and Figure 5 shows the contributions by source category.
As shown in Figure 5, area sources contribute to high emissions of PM10, PM2.5, NMVOC, ammonia (NH3), SO2, and hazardous air pollutants (HAP) or air toxics. The inventory includes the emissions of 172 toxic species (both gaseous and metals). The seven most abundant are toluene, xylenes, 1,1,1-trichloroethane, isopropanol, hexane, benzene, and methyl tert-butyl ether (MTBE). Key area sources include: Consumer products, solvents, aircraft operations, and fuel in the residential sector. Mobile sources have high emissions of PM10, PM2.5, NOx, CO, NMVOC, black carbon (BC), and greenhouse gases (GHG, expressed as CO2eq). Key mobile sources include: Private vehicles, taxis, microbuses, and heavy-duty diesel vehicles. Point sources have medium-small emissions of all pollutants except for CO and NH3. Key point sources include printing, plastics, food, metallic products, and chemical and electricity generation industries.
2.5. Air Quality Management Programs in the MCMA
Concerted efforts by the Mexican authority to deal with the air pollution problem in the MCMA began in 1971 with the passage of the Federal Law for the Prevention and Control of Environmental Pollution [27], a year after the US Clean Air Act [28]. Subsequently, several environmental laws were introduced; however, actions to prevent pollution were limited during the financial crisis of the 1980s and the Mexico City’s earthquake in 1985. By the mid-1980s, the public was increasingly alarmed about the worsened air pollution when the newly established air quality-monitoring network RAMA revealed high concentrations of all criteria pollutants, with O3 peaking above 300 ppb 40–50 days per year, leading Mexico City to be ranked as the most polluted megacity in the world at that time [29].
Responding to increased public pressure concerning the worsened air pollution, the government of Mexico announced emission reduction actions and strengthened the legal framework with the General Law of Ecological Equilibrium and Environmental Protection (Ley General del Equilibrio Ecológico y la Protección al Ambiente or LGEEPA) that defined responsibilities at federal, state, and local government levels [30]. The government of Mexico City (Federal District at that time) and the State of Mexico were responsible for regulating emissions from commercial enterprises, private motor vehicles, and public transportation services under their jurisdiction. It soon became clear that air pollution in the metropolitan area has to be addressed on the regional level. During the 1990s, the federal government established several administrative agencies to address environmental issues, including the CAM to coordinate the various levels of government dealing with metropolitan environmental problems. An Environmental Trust Fund for the Valley of Mexico was created exclusively to support CAM projects by receiving money collected from the application of a surcharge of gasoline sold in the MCMA. International environmental agencies and financial institutions, international and national academic institutions, and foreign governments also provided financial and technical support, e.g., the World Bank, the Japanese International Cooperation Agency (JICA), and the German Technical Control Agency (GTZ) [14]).
Most of the Mexican air pollution control programs in the 1960s and 1970s targeted the ostensibly visible pollution sources, such as the industrial facilities emitting large quantities of soot and smoke. By the late 1980s and early 1990s, pollution reduction actions focused on both O3 and particulate matter as the monitoring information showed increasing trends on these pollutants. The emissions targeted by these regulations were the O3 precursors VOCs and NOX, with the transportation sector being the most important emission source.
The MCMA has benefited from the Los Angeles experience as it started to clean up its air two decades later by adopting strategies and emission control technologies pioneered by California following the recognition of the Los Angeles smog in the 1950s by Haagen-Smit [31]. The actions included the introduction of unleaded gasoline and eventual elimination of lead in gasoline, three-way catalytic converters, stringent NOx control for O3 and PM2.5, low-sulfur fuels, and diesel particle filters introduced by the California Air Resources Board [32].
Figure 6 compares the air quality trends (for O3 and PM) in the MCMA, the South Coast Air Basin (SoCAB, consists of Orange County and the non-desert region of Los Angeles, Riverside and San Bernardino with a population of 18 million), and Singapore. The air quality in the MCMA and SoCAB shows similar trends. O3 and PM10 have decreased significantly in both air basins, but even more rapidly in the MCMA, so that the concentrations in the MCMA have approached those in SoCAB in recent years despite a large difference in the institutional capacity, financial resources, and technical personnel, which are necessary for developing and implementing emission control programs. A comparative study of the air quality management between the MCMA and Los Angeles is provided in Chapter 2 of Molina and Molina [14]. In the case of Singapore, the air quality data for the 1980s and 1990s were not available; however, as discussed later in Section 3.3.1, the integrated urban and industrial planning, strict enforcement plan, and cost-effective policies have allowed the control of PM10 and O3. Nevertheless, PM2.5 annual concentrations have not changed along this century, as in the case of the MCMA and SoCAB.
The first air quality management program, Comprehensive Program Against Air Pollution in the MCMA (Programa Integral contra la Contaminación del Aire or PICCA), was implemented in 1990 [33] and subsequently was replaced by the Program to Improve the Air Quality in the Valley of Mexico (Programa Para Mejorar la Calidad del Aire en el Valle de México 1995–2000 or PROAIRE 1995–2000) in 1996 [34]. In 2002, the 10-year air quality management program (PROAIRE 2002–2010) was developed [35], and in 2010, the current air quality management program (PROAIRE 2011–2020) was enacted [36].
An analysis of the air quality management programs and recommendations were conducted by the Massachusetts Institute of Technology (MIT) Integrated Program on Urban, Regional, and Global Air Pollution at the request of the Mexican authority, which provided the foundation for the PROAIRE 2002–2010 and was documented in the book of Molina and Molina [14]. The assessment on the air quality programs presented here (Section 2.6) was obtained from the book and updated using the document prepared from a workshop held in September 2018 to evaluate the progress of the current air quality management program (PROAIRE 2011–2020); it was sponsored by SEDEMA and included the participation of local governments, scientific and policy experts, and relevant stakeholders [37].
As discussed later, the most important factor in the successful environmental management is the political will to transform the best available scientific and technological knowledge into action, with strong social support. The following summarizes the air quality management plans developed and implemented by the Mexican authority as a means to demonstrate how a megacity with limited resources successfully coped with severe air pollution problems.
- (1)
- Vehicle technology and fuel improvement and substitution:
- Development and enforcement of the Program for Atmospheric Environmental Contingencies, which includes restrictions on vehicle circulation and reductions in industrial activities during high pollution days (starting in 1986 and updated subsequently).
- Introduction of the obligatory vehicle verification program (Programa de Verificación Vehicular Obligatorio, or PVVO) in 1988; subsequent enhancement of the program through a centralized system and advanced measurement technology.
- Introduction of oxygenated gasoline in 1989.
- Implementation of mandatory “No Driving Day” (Hoy No Circula, HNC) Program in 1989 and subsequent revisions.
- Introduction of unleaded gasoline in 1990 and complete phase out of leaded gasoline in 1997.
- Introduction of two-way catalytic converters in new gasoline vehicles in 1991, and mandatory use of three-way catalytic converters in 1993 for new gasoline vehicles.
- Introduction of alternative fuels, liquefied petroleum gas (LPG), and compressed natural gas (CNG) for vehicles starting in 1992.
- Reduction of Reid Vapor Pressure and limits on olefins, aromatics, and benzene content in gasoline in 1996.
- Gradual reduction of sulfur in diesel starting in 1998.
- Introduction a diesel vehicles self-regulation program.
- Introduction and enhancement of Comprehensive Pollutant Emission Reduction Program (PIREC) in 1999.
- Introduction of a school transportation program in 2009.
- Introduction of roadside monitoring in 2016.
- (2)
- Emissions reduction actions for industrial and commercial sectors:
- Substitution of heavy fuel oil for natural gas in power plants and major industrial facilities starting in 1986.
- Closing down of a large refinery located within the city in 1990.
- Gradual relocation of major industries to areas outside of the MCMA starting in 1990.
- Installation of emission controls in fuel storage tanks and vapor recovery in the gasoline distribution system starting in 1996.
- Requirement of environmental permits (“licencia ambiental”) for new stationary sources and annual operations reporting.
- Establishment of Inspection and Environmental Audit Programs.
- Promotion of cleaner technologies by providing fiscal incentives and tax exemptions.
- (3)
- Actions on transport planning:
- Expansion of the Metro, light train, and trolley buses.
- Introduction a program for replacement of old taxis.
- Establishment of model age limits for taxis and microbuses.
- Introduction of new buses with cleaner technology.
- Scrapping of old buses, taxis, and freight transport.
- Introduction of bus rapid transit system (BRT, locally called Metrobus) in 2005.
- Promotion of non-motorized transportation (cycling and walking).
- (4)
- Actions on ecological restoration:
- Programs for rural and urban reforestation.
- Programs for restoration of eroded areas.
- Programs for controlling human settlements in rural areas.
- Programs for fire prevention.
- (5)
- Environmental education and research programs:
- Integration of environmental issues into regular education curricula.
- Establishment of an epidemiological surveillance system.
- Promotion of air quality research activities and collaboration with national and international research communities.
2.6. Assessment of Air Quality Programs in the MCMA
2.6.1. Vehicle Technology and Fuel Quality
The modernization of the vehicle fleet in the MCMA started in the 1990s with the introduction of catalytic converters in new vehicles, the distribution of unleaded gasoline, and the implementation of stricter emission limits. The technological change and regulatory policies led to significant reductions of vehicular emissions, despite the increasing number of vehicles.
In addition, gasoline was reformulated to limit the content of reactive compounds (olefins and aromatics), to lower evaporative emissions (vapor pressure reduction), and to allow a minimum oxygen content (oxygenate requirement), aiming to reduce the potential formation of O3 and other oxidants, as well as air toxics such as benzene.
Substantial investments in refinery modernization have been made to lower the sulfur content of gasoline and diesel distributed in the MCMA. In recent years, these fuels meet standards that are comparable with low emissions urban quality fuels in the United States and Europe with an allowed maximum sulfur content of 20 ppm (w/w) for gasoline and 15 ppm (w/w) for diesel. However, the rest of the country, except the main metropolitan areas, main industrial corridors, and the US–Mexico border region, still use high sulfur content diesel with a maximum allowed of 500 ppm (NOM-016-CRE-2016) [40].
2.6.2. Obligatory Vehicle Verification Program
The obligatory vehicle verification program PVVO was first applied in the MCMA starting in 1988 with the objective of reducing vehicle emissions by mandatory inspection of the environmental performance of the fleet and ensuring proper vehicle maintenance. The program mandates that the emissions of each vehicle circulating in the MCMA must be inspected every six months [41]. The program has been coupled with the “No Driving Day” program (see below)—depending on the model year and the emission levels, the vehicles can obtain different exemptions, thus encouraging the renovation of the fleet. Recently, the PVVO adopted the acceleration simulation mode (ASM) emissions test and included tailpipe measurements of NOX emissions. Starting in 2011, a major technological upgrade was implemented to improve the test performance and minimize the chances of manipulation of testing results by technicians. Starting in 2016, the OBD (on-board diagnostics) emission test was included as part of the tests for new vehicles [42].
The maximum permissible limits of emissions have been strengthened several times and new testing instruments have been added to improve measurement capabilities, such as dynamometers for dynamic calibration, new configuration and equipment for the measurement of pollutant emissions and ultrafine particles, and equipment for physical-mechanical testing.
2.6.3. No Driving Day (Hoy No Circula)
The “No Driving Day” (Hoy No Circula or HNC) program has its roots back in 1987 as a citizen initiative to participate voluntarily to avoid using cars once a week (see Appendix B of Molina and Molina [14]). The program became mandatory in 1989 as part of a short-term emergency program for the winter months. Based on the last digit of the license plate, around 20% of all private vehicles were banned to circulate one weekday per week between 05:00 and 22:00, with the aim of reducing pollution, vehicular traffic, and fuel consumption. HNC became permanent in 1990 and was tied to the PVVO. In 1991, taxis and public transport vehicles were included in the HNC program. In 1992, vehicles using CNG or LPG were excluded from the circulation restrictions.
An undesirable consequence of the obligatory nature of the HNC was that families acquired an additional vehicle, usually older, increasing the vehicular fleet during the first years of the program. Despite this, a dramatic reduction in traffic-related pollution was observed in the following years promoted by the technological controls of exhaust emissions and improved vehicle maintenance.
To make the HNC program more efficient, significant modifications have been made to the circulation restriction and related policies. In 1997, a stickers code (“hologram”) was used to identify the emissions level using the number “0” for low-emissions vehicle, and “1” and “2” for high emitters. The vehicles equipped with three-way catalytic converter complying with tighter emission standards were recognized with a “Zero” (“0”) sticker and were exempted from the driving ban. In 1999, new vehicles meeting even tighter emissions limits were issued a “Double Zero” (“00”) sticker, exempting them from driving restrictions and emissions inspections during the first two years. Vehicles identified with a “2” sticker were included in the driving ban one day a week during weekdays and additional restrictions during contingency alert. A natural consequence in these actions was the gradual renewal of the vehicle fleet, with positive impacts on air quality despite vehicular growth.
The HNC program has undergone further changes in recent years, generally towards increasing circulation restrictions for older and more polluting vehicles during weekdays and Saturdays. During 2007, the sticker “1” was removed from the program and in 2008 vehicles not registered within the MCMA were banned to circulate between 05:00 and 11:00. In 2014, electric and hybrid vehicles received the sticker “0”, exempting them from any driving restriction. Sticker “1” was resumed in the program but vehicles were banned to circulate one weekday per week and two Saturdays per month, while those with sticker “2” were banned to circulate one weekday per week and during all Saturdays. Recently, vehicles not registered in the entities of the megalopolis not only have morning circulation restrictions, but they are banned one weekday per week and one Saturday per month.
In July 2015, there was a controversial decision by the Mexican Supreme Court withdrawing the vehicle age requirement for obtaining the sticker “0”, and exempting any vehicle from driving restrictions if it had complied with emissions limit. An immediate consequence of this court decision was the increase in the number of vehicles in circulation, leading to an increase in mobile emissions [24]. In 2016, after an extreme O3 episode during March, the environmental authorities implemented changes in the program and mandated the installation of on-board diagnostics system (OBD II) in addition to exhaust emissions and visual inspection tests. The lack of OBD II in older vehicles prevented them from complying with the new requirements for the “0” sticker, reversing to some extent the impact of the previous court decision on the vehicle age requirements. In the second trimester of 2016, the HNC was also temporarily modified in response to the extreme O3 episode: In addition to the regular restrictions, all vehicles were banned to circulate one weekday per week and one Saturday per month during Phase I Contingency, in addition to the regular restrictions. After the second semester of 2016, the check of OBD II became part of the regular tests of the PVVO.
In March 2019, the CAMe announced some changes to the program [43]. In 2020, all electric and hybrid vehicles will be exempted from the driving restrictions. The sticker “00” will be granted to new vehicles with a performance equal or superior to 15 km l−1. The sticker “0” will be granted to vehicles complying with the OBD II, exhaust emissions, and visual inspection tests. In the case of motorcycles, the registration will be granted only for those that have emission controls or electrical technology, and newer units will be expected to have EURO IV technology by 2021.
In conclusion, the HNC program has evolved over the years with a major shift in principal objective from circulation ban to vehicle fleet renewal initiative by coupling with the PVVO Program and providing strong incentives. The removal of older and more polluted vehicles from circulation should help in reducing vehicle emissions.
2.6.4. Alternative Fuels: Compressed Natural Gas and Liquefied Petroleum Gas
Environmental authorities encouraged the conversion of intensively used vehicles to LPG with certified equipment in the 1990s. The authorities also promoted the use of CNG by introducing vehicles built to run on natural gas. In order to encourage the use of alternative fuels, the vehicles running on LPG and CNG were exempted from the HNC program. More recently, the government reviewed the compliance with the technical and administrative guidelines for LPG or CNG converted vehicles, to assign them a “0” type sticker, allowing them to circulate every day of the week.
An important issue related to the use of CNG and LPG is the potential for increasing fugitive emissions from such vehicles. Studies have found that leakages in the gas distribution and storage systems of LPG an CNG are responsible for high concentrations of propane and butane in the atmosphere of Mexico City that can be associated with the use of LPG for the residential, commercial, service, and industrial sectors [44,45,46]. However, the residential, commercial, service, and industrial sectors are the main consumers of both fuels. Estimates suggest that 65% of LPG in the MCMA is consumed in the residential sector for cooking and water heating [47], while over 70% of CNG is consumed by industries [25]. Therefore, it is important to establish inspection and maintenance programs for industrial, commercial, and domestic installations. As part of the air quality and climate action programs, the government of Mexico City is encouraging the use of solar heaters to reduce dependence on LPG.
2.6.5. Diesel Vehicles Self-Regulation Program
This is a voluntary program in which commercial companies are invited to establish plans/initiatives for the replacement, preventive or corrective maintenance, and installation of post-treatment systems of exhaust gases to their diesel vehicles, in order to reduce pollutant emissions below those obtained by the HNC program. The self-regulated companies commit to submit semi-annual reports of emission tests prepared by laboratories specialized in emission measurements for mobile sources. The reports must be accompanied by the calibration certificates of the measuring equipment used for the testing.
This program promotes the implementation of emissions control systems and fleet renewal with advanced technologies to reduce emissions. The participating companies benefit from having their registered vehicles exempted from driving restriction of the HNC program, even when an environmental contingency is declared.
2.6.6. Program for Atmospheric Environmental Contingencies
The Program for Atmospheric Environmental Contingencies (Programa de Contingencias Ambientales Atmosféricas, PCAA) is an emergency program with the aim of warning the public during severe episodes and implementing actions to alleviate pollution levels (see Appendix A of Molina and Molina [14]). It is based on the concentrations of O3, PM2.5, and PM10 reported by RAMA and meteorological forecast. The program began in 1986 with two stages, Phase I and Phase II. In 1996, a pre-contingency stage was included at lower levels than Phase I and was intended as a preventive alert stage. Since 1986, the program had been updated several times with respect to the pollutant concentrations used as contingency thresholds, implementation mechanism, and actions. Figure 7 shows a summary of the changes in the threshold concentrations used for O3. Main actions implemented during a contingency include banning the circulation of some vehicles and reducing the activities of high polluting industries. In 1990, a Phase I was declared when O3 exceeded the value of 250 on the metropolitan air quality index (IMECA, now air quality index or ICA in Spanish), equivalent to 294 ppb. The contingency threshold has been continuously updated as shown in Figure 7. After a severe episode in March 2016, the Phase 1 contingency threshold was set at an ICA value of 150, corresponding to O3 concentration of 155 ppb and the pre-contingency stage was eliminated. In May 2019, following a severe air pollution episode caused by regional wildfires, authorities announced new actions during contingencies, including a preventive phase when O3 level reaches 140 points (142 ppb) or PM2.5 reaches 135 points (81.4 μg m−3), and driving restriction to 50% of Mexico City government official vehicles [48].
The program has the drawback of not guaranteeing an effective reduction of pollution levels on the day the episode occurs; a reduction in exposure is only granted through the immediate actions taken by individuals as a result of the initial warning. Currently, the local environmental authorities are using an air quality forecasting system based on the WRF-CMAQ (weather research and forecasting (WRF) and the community multiscale air quality (CMAQ)) model to anticipate severe pollution events that could exceed the contingency threshold and affect public health, and to trigger a preventive phase of the PCAA [49]. This air quality forecasting system, a collaboration between SEDEMA and Barcelona Supercomputing Center, has been in place since 2017 to alert the public of high pollution events 24 h in advance and is available through the SEDEMA website [50].
2.6.7. Reduction of Emissions in Industries and Services
The partial substitution of fuel oil by natural gas in the two power plants in Mexico City and the use of low sulfur diesel in major industries around the MCMA have been successful in reducing SO2 concentrations in the MCMA, as well as emissions of particles and their precursors. Currently, emissions are relatively well controlled for large industries, but not for the medium, small, and micro industries. However, the large industrial Tula-Tepeji corridor, located about 70 km northwest of the MCMA center, is still the main source of SO2 and particulate sulfate in Mexico City [51,52].
The establishment of the environmental permits for industries of local jurisdiction (Licencia Ambiental Única, LAU) and for facilities of federal jurisdiction (Cédula de Operación Anual, COA) has been an important step for improving the environmental management of industries. However, the emissions inventory shows that industries of local jurisdiction are still high emitters of NMVOCs, while industries of federal jurisdiction are large emitters of NMVOCs and NOx. Some of the NMVOCs emitted by industries are highly toxic and reactive. Furthermore, many industries are not included in the MCMA emission inventory because they are not regulated and do not have reporting requirements. There is also confusion in classifying small but abundant industrial sources as area sources; some shops classified as area sources should in fact be considered as point sources.
Currently, there are no regulations in Mexico that control the VOC content in products for commercial, industrial, or domestic use, such as cleaners, pesticides, and personal and automotive care products. Also, VOC emissions from informal sources (e.g., food cooking street vendors, auto-parts painting, and mechanical shops) will need to be better characterized. Efforts in reducing VOC emissions from the transport and large industrial sectors have shifted the relative contribution of emission sources to atmospheric loadings of VOC in urban areas, increasing the relative contribution of VOC emissions from area sources. Therefore, in order to continue improving air quality, regulatory efforts and technological changes should include control strategies for reducing key VOC compounds from formal and informal area sources and to have a better understanding of the contribution of VOC from consumer products in atmospheric chemistry.
2.6.8. Improvement of the Public Transportation System
Although all the air quality management programs have prioritized the expansion of public transportation to improve air quality and mobility, the MCMA has not provided the road infrastructure required to accommodate needs of the massive population expansion. A lack of coordination at the metropolitan level on transportation and urban planning exacerbates this situation.
In recent years, in addition to the growing motorization rate, commuters have shifted from high-occupancy modes of transport (e.g., buses and subway) to medium- and low-occupancy mass transit vehicles and private cars. To a large degree, these changes have occurred because the existing transportation system has not adequately adapted to the changing demographic spatial distribution and more recently to public safety issues, resulting in new travel patterns. Because of inadequate strategic urban planning, the areas for living, working, and other activities are dispersed and disconnected. Low-income housing has been developed in locations that lack adequate mass transportation options; similarly, new commercial development occurs with inadequate roadway construction and transit access. The result is an increase in the number of trips from the periphery to the urban center, and vice versa, leading to worsening congestion. A survey in 2017 found that 66.5% and 31.1% of non-walking trips in the MCMA were done using public and private transportation, respectively. About three out of four trips were done in microbuses (small occupancy vehicles) whereas the “Metro” subway system is the second most used public transportation mode. About 90.5% of the private trips were done with private vehicles, of which 68.3% with only one occupant [53].
The average vehicle speed in Mexico City reduced from 38.5 km h−1 in 1990 to about 12 km h−1 in 2012, which is very close to an average bicycle speed [54]. Recent studies show that reducing vehicle speeds are generally associated with stop-and-go driving conditions, which increase the tailpipe emissions of both toxic and GHG [55]. The observed reduction in average transit speed in Mexico City has led to a significant increase of vehicular emissions, in addition to increased commuter’s exposure to harmful pollutants [56].
Improving the efficiency of the transportation systems is a long-term challenge that should include regional coordination integrating urban planning, urban mobility, and air quality management. The cooperation between federal and local agencies responsible for environment, transportation, health, urban development, and public works is needed, as well as the public participation. Furthermore, it is essential to develop metropolitan public transport policies that link sufficient and efficient routes to the municipalities surrounding Mexico City, from where a significant number of long-distance trips originate.
2.6.9. Integration of Metropolitan Policies
As mentioned above, since 2013 the Megalopolis Environmental Commission has been responsible for coordinating the regional air quality programs of Mexico City with the surrounding municipalities of five states. However, the different jurisdictions and available resources among the entities of the megalopolis have created an ongoing challenge for the implementation of regional air quality programs and is one of the major barriers for integrated sustainable environmental policies in the megalopolis. In light of this challenge, the CAMe needs to be strengthened financially and politically, making it effectively independent from the presiding government, as well as increase its capacity building and of human resources. The CAMe should also increase its efforts to encourage public participation. Academic, private, and non-governmental sectors should help in designing and monitoring the implementation of environmental policies.
2.6.10. Climate Mitigation Plans
In addition to reducing emissions of criteria pollutants and O3 precursors, Mexico City has aimed to reduce emissions of GHG and short-lived climate pollutants (BC, methane, and hydrofluorocarbons) through a series of air quality management programs and climate action plans developed and implemented over the past decades. These actions have included strengthening emission control standards for vehicles, promoting energy efficiency for public and private buildings, encouraging solar water heating, improving collection and disposal of solid waste, and using landfill gas recovery to supply clean energy [57].
2.6.11. Health Impacts of Air Pollution
Most of the actions listed in the PROAIRE to reduce the emissions of pollutants are ultimately related to decreasing the impacts of air quality on human health. In addition, the program explicitly lists several strategies for protecting public health: Updating air quality thresholds and regulations according to harmful effect, strengthening the early warning system for severe episodes, communication of risk, updates to the PCAA, preventing impacts on climate change and health, and establishment of a system for the evaluation of costs of health impacts. The improvements in air quality since the 1990s suggest that important health benefits have been achieved in terms of reducing chronic exposure. A recent collaborative study between SEDEMA and the Harvard School of Public Health estimates that 22,500 premature deaths were avoided during the period of 1990 to 2015 due to air quality improvement [58,59]. However, some air quality standards are still not met, and it is estimated that 2000 premature deaths per year are attributed to exposure to PM2.5 and around 200 to O3.
2.7. Scientific Research in the MCMA
Scientific research has played an important role in helping the environmental authorities of the MCMA to characterize emission sources of pollutant species and their transport and transformation in the atmosphere, identify effective emission reduction strategies, and monitor the progress of regulations that are already in place to ensure that programs are successfully implemented. One of the actions of the air quality management programs has been to enhance scientific research by collaborating with national and international scientific and technical experts.
The high levels of aerosols and intense photochemical formation in the atmosphere of the MCMA have motivated several large international collaborative field studies since the 1990s. Two intensive field studies, the 1991–1994 Mexico City air quality research initiative (MARI) project and the 1997 aerosol and visibility evaluation (IMADA-AVER), provided measurements of chemical composition particulate and meteorological parameters for supporting air quality modeling [60,61,62].
As mentioned in Section 2.5, in 1999, the assessment of previous air quality programs conducted by the MIT Mexico City Project to support the design of a new strategic plan for the following 10 years highlighted the need for more extensive experimental data from field measurements. Scientific information was needed to update and improve the MCMA emissions inventory and to improve the current knowledge of the chemistry, dispersion, and transport processes of the pollutants emitted to the MCMA atmosphere. Innovative exploratory mobile and fixed site field measurements, sponsored by CAM, were performed during February 2002. This was followed by the intensive MCMA-2003 field measurement campaign in the spring of 2003 by Molina et al. [63].
The MCMA-2003 field measurement campaign was carried out in April 2003 during the height of the annual photochemical season by deploying a highly instrumented supersite and a mobile laboratory for vehicle-chase sampling measurements, as well as for fixed multi-day measurements at various locations around the MCMA. Many high time resolution instruments were deployed for the first time during this campaign. MCMA-2003 and the exploratory mission in February 2002 generated extensive data of many oxidant precursors, photochemical products, and intermediates including radicals, speciated VOC, and PM, as well as meteorology and emissions [63]. MCMA-2003 scientific findings were instrumental in the planning of the MILAGRO campaign in March 2006, the largest and most important study on air pollution in the MCMA to date [64,65].
The MILAGRO (megacity initiative: Local and global research observations) campaign was a large, international, multi-agency, collaborative project involving more than 400 researchers to evaluate the urban and regional impacts of air pollution plume from a megacity. Mexico City Metropolitan Area was selected as the case study. The month-long field measurements included a wide range of instruments at ground sites (three supersites), on aircraft (seven instrumented research aircraft), and satellites. Additional platforms in or near Mexico City included mobile laboratories and mobile and stationary lidars, observations from an eddy covariance flux tower within the urban core, and fixed mobile units located at the boundary sites to measure criteria pollutants and meteorological parameters. The overall campaign was supported by forecasts from meteorological and chemical models, the ambient air quality monitoring network operated by SIMAT, and meteorological measurements provided by SMN [64,65].
The MCMA-2003 and MILAGRO-2006 campaigns provided wide-ranging meteorological, gas, and aerosols measurements. Over 200 peer-reviewed publications resulted from both intensive campaigns [63,64,65]. The review of these publications significantly improved our understanding of the meteorological and photochemical processes contributing to the formation of O3, secondary aerosols, and other pollutants and their transport and transformation.
Since the MILAGRO campaign, there have been relatively few field studies conducted in the MCMA, although some special studies have been conducted by SIMAT and university researchers. The following highlights some of the major results from MCMA-2003 and MILAGRO campaigns as well as results from recent studies.
2.7.1. Meteorology
The MILAGRO campaign provided the most extensive measurements of meteorology in the MCMA to date. A conceptual model of meteorological flow patterns was developed for the MCMA-2003 campaign with three event groups: O3-South, O3-North, and Cold Front [66]. This was extended during the MILAGRO campaign with events such as South-venting, Convection-South, and Convection-North [67]. These were very useful in classifying the air pollution episodes. Observations and modeling studies showed that under most conditions, pollutant export from the basin was relatively rapid and that pollutant carryover from day to day was not a major factor in the basin’s photochemistry. Much of the air remained in the basin for less than 12 h, and the recirculation rate was generally less than 25%. The high elevation and the basin-mountain circulation effectively ventilated the basin.
The variability of the boundary layer height over Mexico City was recently evaluated by Garcia-Franco et al. [68] through continuous backscattering measurements using a commercial lidar for five years. This long-term study allowed them to investigate the impact of the boundary layer evolution on the local air pollution and meteorology. They consistently found maximum heights over 2.7 km and minimum heights below 500 m throughout the year.
Larger-scale meteorology influences surface O3 concentrations. Barret and Raga [69] observed that the intraseasonal variability of surface O3, in both summer and winter, is driven by the variability in the cloud cover due to the upper-troposphere circulation modulated by the Madden–Julian oscillations (MJO). Also, stratospheric O3 intrusions into the boundary layer were identified by Barret et al. [70] during a stratosphere–troposphere exchange event linked to changes in the subtropical jet stream.
In recent years, the SIMAT monitoring stations have shown an increase in ambient temperature; 2017 was warmer than the average of 2000–2016. It is important to conduct an in-depth analysis of the increase in atmospheric temperature on air quality in the MCMA. The role of meteorology can be included in the analysis of the air pollution data to examine if some of the recent air pollutant trends are due to changes in meteorology (temperature, humidity, wind speed, mixing heights) or whether they are a result of changing emissions. The varying strength of the urban heat island effect should also be explored.
2.7.2. Emissions of Gaseous and Particulate Pollutants
MCMA-2003 and MILAGRO demonstrated the synergy of using multiple bottom-up and top-down analysis techniques with data obtained from multiple platforms and instruments to evaluate the accuracy of emission inventories [63,64,65]. The combined process helped to reduce the associated uncertainties in the emission estimates and provided guidance for setting priorities for improving further development and refinement of the emission inventories. The following lists some key results from studies to reduce the uncertainties in past MCMA emission inventories, either by direct measurement of local emission factors and emissions, or by top-down analysis of emissions and activity data of key emission sources. Due to changes in source activities, technologies, fuels, and regulations, the development of an emissions inventory is a continuous endeavor that needs to be frequently evaluated using new field-based studies and improved modeling activities. The current challenges to reduce O3, PM10, and PM2.5 necessitate renewed efforts by the government agencies and the research communities to promote field-based and modeling evaluations of the most recent emissions inventory of the MCMA.
Several innovative techniques were developed in 2003 and expanded in 2006 to evaluate the official emissions inventory used in air quality models. On-road vehicle fleet emission rates in fleet-average mode for various vehicle classes and driving speeds were obtained using a mobile laboratory and identified several discrepancies between the observations and the emission estimates in the 2004 emissions inventory. These included slight over predictions of CO and NO, a probable under prediction of VOC by a factor of 1.4–1.9, and a severely underestimation of the PM emission estimates [71,72]. Recent studies have shown that some chemical species emitted by vehicular traffic in the MCMA have decreased since then [46,73]; however, motor vehicles still play a major role in supplying the NOx and VOC precursors that fuel MCMA’s extremely active photochemistry [24], as well as producing abundant amounts of primary PM, elemental carbon, particle-bound polycyclic aromatic hydrocarbons, and a wide range of air toxics.
The first worldwide eddy covariance flux tower to measure emissions of selected VOC over an urban surface was instrumented during MCMA-2003 and demonstrated the feasibility of the technique to evaluate the accuracy of gridded emission inventories [74]. A second flux tower was erected during MILAGRO, expanding the number of VOC species and including flux measurements of chemically speciated aerosols [75,76]. The direct flux measurements of both campaigns suggested that the emission estimates of the inventory at that time of CO2, olefins, and selected aromatic and oxygenated VOC were accurate for emissions from combustion sources, but overestimated for evaporative emissions from area sources within the 2–3 km scale footprint of the measurements. In contrast, the aircraft flux measurements conducted during MILAGRO suggested an underestimation of the toluene and benzene emissions reported in the 2004 emissions inventory for the northeast industrial sector of the city [77]. An important conclusion was that additional sources from informal commerce and street-side food preparation could be relevant and would need to be characterized. A subsequent study found that the CO2 estimates reported in the 2010 emissions inventory were overestimated by a factor of 2.8 due to a severe overestimation of the traffic load for that particular sector of the city [78], suggesting the need of counting with updated traffic volume data to predict accurate emissions.
2.7.3. Volatile Organic Compounds (VOCs)
Multiple VOC species were measured during the two campaigns at different spatial and temporal scales with equipment installed at background, source, and downwind sites, as well as at rural, suburban, and industrial sites [45,79]. The complementary independent methods provided greater certainty and helped in identifying areas of uncertainty. The main findings from the MCMA-2003 campaign include the first spectroscopic detection of glyoxal in the atmosphere [80] and a unique analysis of the high fraction of ambient formaldehyde from primary emission sources [81]. The complexity of VOC in the MCMA was further investigated using an array of measurement methods deployed at a number of fixed ground sites and in several airborne sampling platforms during MILAGRO [82,83,84,85]. The results showed that LPG use was an important source of low molecular weight alkanes, while evaporative fuel and industrial emissions were important sources for aromatic VOC and methanol in the basin. The two most important measured VOC species in terms of OH reactivity were formaldehyde and acetaldehyde; aldehydes were major components of the outflow reactivity
Since MILAGRO, there have been very limited new data of VOC in the MCMA, although SEDEMA has conducted a number of campaigns monitoring selected non-methane hydrocarbons (NMHCs). Measurements conducted in 2012 showed that ambient concentrations of light alkanes and aromatic species have decreased, in contrast to concentrations of olefins associated with vehicular traffic [46]. Another study measured 64 VOC, including toxic VOC in 2011–2012, and reported that most of the VOC come from vehicular emissions and solvent-related industrial sources [86].
2.7.4. Urban and Regional Photochemistry
The high photochemical formation of O3 in Mexico City is due in large part to the co-emission of NOx and VOCs, which provides a large source of radicals needed for photochemical reactions. Important precursors, formaldehyde, hydroxyl (OH), hydroperoxyl (HO2), glyoxal, as well as OH reactivity were measured during the two campaigns [87,88,89]. Observations and modeling studies indicated that O3 production within the urban core of the MCMA was generally VOC-limited. Ozone formation in the surrounding mountain/rural area was mostly NOx-limited, but could be VOC-limited, and the range of the NOx-limited or VOC-limited areas depended on meteorology [90,91,92]. Although the formation of the urban photochemical smog resulted to be VOC-limited, it was found that reductions of NOx emissions could reduce the formation of regional oxidants. The production of O3 was found to continue in the outflow for at least several days, due to the formation of peroxyacetyl nitrates (PAN), which can regenerate NOx and contribute to regional O3 formation [93].
García-Yee et al. [94] investigated the role of the Tenango del Aire mountain pass at the southeast of the MCMA during the venting of the city’s air pollution during a field study conducted in February and March of 2011. They found that the Mexican O3 standards were not exceeded during days with low pressure synoptic systems but were exceeded on almost all days with high-pressure synoptic systems. Days with low-pressure systems were dominated by southerly wind throughout the day, while during high-pressure systems, northerly winds transported photochemically active air masses from the MCMA in the morning.
2.7.5. Ambient Particulate Matter
During MCMA-2003 and MILAGRO, an extensive mixture of different types of particles was observed, including dust, particles emitted from biomass burning and anthropogenic sources, and aerosols of secondary origin, as a result of using different measurement techniques at multiple monitoring sites [64]. It was found that in the city center the fine fraction was mainly composed of organic (50%), secondary inorganic (25%), BC, and mineral material. In contrast, the mineral fraction was very important (36%) in the outskirts of the city, while BC showed concentrations slightly higher than that found inside the City [95,96].
One of the major results during MCMA-2003 was the observation by Volkamer et al. [97] that secondary organic aerosol (SOA) production was faster and higher than explained by traditional atmospheric models or laboratory simulation experiments. This result was supported by further studies from MILAGRO, indicating that SOA formation from primary semi-volatile and intermediate volatility precursors has the potential to close the gap in predicted vs. measured SOA see e.g., [98,99]. However, these predictions were poorly constrained by the data and more specific measurements are needed. SOA accounts for a large fraction of organic aerosol burden; the formation, evolution, and climate impacts of SOA (and organic aerosols) remain one of the least understood aspects in atmospheric science and is an important current research topic.
Since 2013, the local government through SIMAT has conducted a series of studies to elucidate the particles’ chemical composition. A first campaign took place at the environmental analysis laboratory of SEDEMA located at the north of the city during the period of November 2013 to April 2014. Distinctive characteristics in the chemical composition of particles smaller than 1 µm (PM1) were observed according to seasonal changes [100]. Particles were persistently acidic during November and December, contrary to warmer months. The aerosols’ low acidity during those months was probably due to higher relative humidity, lower temperature, and more frequent winds from the NW, where the Tula-Tepeji industrial complex is located. Although this result is consistent with satellite observations of lower NH3 concentrations in the gas phase during the same period [101], long-term studies are needed to verify the seasonal variability in the aerosol chemistry in Mexico City. This campaign included also measurements of water-soluble inorganic ions and equivalent black carbon. The former contributed 33% and the latter 8% to the total PM2.5 mass [102]. With the exception of higher concentrations of sulfate, nitrate, and ammonium observed from November to February, the aerosols chemical composition and diurnal variability were found to be similar to those observed during MCMA-2003 and MILAGRO-2006.
Another field study conducted from January to March of 2015 showed that the PM1 mass concentration measured in the south side of the city was lower than those measured in the north and east sides; the aerosols were also more aged, consistent with the location of the PM sources and their precursors in the city, as well as the meteorological patterns [52]. These findings point out that the formation of secondary aerosols might have a substantial spatial variability that needs to be further investigated. The impact of fireworks activity and bonfires on the aerosol burden was investigated during Christmas and New Year of 2013 and 2014. Retama et al. [103] found that both fireworks and bonfires are major sources of PM2.5 during such festivities. The emissions from the fireworks’ bursting and bonfires produced immediately elevated PM concentrations, and their chemical transformations led to enhanced levels of secondary organic and inorganic aerosols in the following morning. The bursting of fireworks emits also important amounts of BC and nitrous oxide (HONO).
2.7.6. Aerosol Radiative Properties
MILAGRO results showed that the MCMA plumes were significant sources of both primary and secondary aerosols at the regional scale, and BC and SOA contributed to single scattering albedos (SSA) inside and outside the city. SSA were frequently in the 0.7–0.8 range with some early morning values being even lower, which is consistent with high absorbing aerosol concentrations from both fossil and biomass burning sources [104,105]. Aerosol contributions from biomass burning sources contained both BC and oxidized organics that enhanced UV absorption, indicating that biomass burning can have important impacts on the absorption or heating by carbonaceous aerosols in the urban and regional scales.
More recently, Paredes-Miranda et al. [106] compared the daily variation of BC absorption and scattering coefficients in five cities around the world and found that Mexico City has the highest values. Retama et al. [107] analyzed one-year equivalent BC data (from March 2013 to March 2014) collected at SEDEMA’s laboratory, which is not too far from the urban supersite during MILAGRO, and found a strong seasonal variation. The observed concentrations did not differ substantially from those of previous field campaigns, suggesting no major changes in the BC emissions.
MILAGRO also showed that the use of sun photometers was valuable for evaluating aerosol optical depth (AOD) derived from satellite. Measurements of surface albedo and reflectance in the MCMA showed that many urban surfaces are more reflective than assumed in common satellite retrieval algorithms, and that use of larger visible surface reflectance in algorithms can produce more accurate retrieved AOD [108]. The combined surface measurements with satellite data estimates can be useful in determining PM for air quality research in the megalopolis.
2.7.7. Health Benefits of Air Quality Improvement
Quintana et al. [109] investigated the oxidative potential, biological effects, induced hemolysis, and DNA degradation from PM10 samples during observed ventilation transport events in the MCMA. They found that oxidative potential correlated with Cu/Zn content but not with biological effects, and that ventilation patterns had little effect on intrinsic PM10 composition and toxicological potential, which suggests a significant involvement of local sources. Calderón-Garcidueñas et al. [110,111] reported associations between exposure and the development of Alzheimer and Parkinson’s diseases in childhood and young adults, adding to the growing evidence that long-term exposure to air pollution is a risk factor for a number of neurodegenerative diseases, neuroinflammation, and altered innate immune response. O’Neill et al. [112] showed that air pollution exposure in Mexico City may be a risk factor for preterm births, probably through inflammatory mechanisms. As mentioned in Section 2.6, in 2015 the Secretariat of Environment and the Secretariat of Health of the Government of Mexico City in collaboration with Harvard University School of Public Health evaluated the health benefits derived from air quality improvement from 1990 to 2015. They found that the control measures implemented during such period avoided 22,500 premature deaths [58].
Recently, Mexico City launched a risk index for susceptible persons, which is a health-based indicator that captures additive effects of multiple pollutants on public health risk with the aim of improving risk communication [113]. It is computed using same-day and forecasted air pollution data. This indicator is expected to deliver more accurate information to residents vulnerable to respiratory illness, therefore helping them to take precautionary measures to protect their health.
3. Singapore
Singapore is widely recognized for its environmental achievements and often cited as a model of a high-density, livable, and sustainable city. Through a unique strategy based on an integrated urban and industrial planning, strict enforcement programs, pragmatic and cost-effective policies, and a flexible approach to changes in technology have allowed Singapore to achieve a dynamic economy and a high-quality living environment. Since its inception as an independent nation, Singapore understood the importance of solving environmental problems for the physical and mental wellbeing of its population, as well as a key strategy for convincing foreign investors that it was a well-planned and sustainable city [114]. Despite increased urbanization and industrialization, Singapore has been able to maintain clean air compared to other major cities of the region. This section reviews the strategies and policies that have provided economic progress without compromising seriously its air quality.
Despite Singapore’s stringent emission regulations that have been generally effective in keeping pollutants concentration below international limits, air pollution still poses a threat to public health as exposed by a high incidence of cardiovascular and respiratory illnesses associated to long- and short-term exposure. The economic loss of such ailments represents an important fraction of the city-state’s GDP, in addition to reducing life expectancy and quality of life. This is because there is a lack of a threshold below which pollutants concentrations do not have health impact [115].
With the aim of providing a technical platform to develop an improved air quality management that allows to solve Singapore’s air pollution problems, this section provides a comprehensive and critical review of the current legislation, regulations, and programs and their effectiveness based on publicly available information. The current state and progress of the air quality assessment tools, i.e., ambient monitoring, emission inventories, and numerical modeling are reviewed, as well as the scientific knowledge on the subject.
The material presented here is a continuation of two previous publications on Singapore’s atmospheric environment. The first publication reviewed the available information on air quality and climate change mitigation until 2010 [116], while the second publication demonstrated the need of timely air quality information to provide effective awareness on extreme air pollution episodes [117]. As concluded in both publications, based on its dynamic economy and profile in advanced technological innovations, Singapore has a unique opportunity not only to provide better air quality to its residents, but of opening new frontiers in air quality management, atmospheric research, and public communication. In such a context, the material presented in this third publication together with similar review of Mexico City’s air quality management is expected to provide valuable information to other fast-growing cities in Southeast Asia and Latin America, and (sub)tropical places in general.
3.1. Basic Information of Singapore
3.1.1. Governance
Singapore employs a strategy of integrated urban and industrial planning, together with strict enforcement programs to control vehicular and industrial emissions and air quality monitoring under the Environmental Protection and Management Act (EPMA) [118]. This act was originally enacted on 1999 and is periodically revised. Its regulations stipulate the emission standards and testing methods for industry and vehicles. The Environmental Protection and Management (Air Impurities) Regulations, which came into force since 1 January 2001 and last updated on 1 July 2015, stipulate emission standards for industries. The Environmental Protection and Management (Vehicular Emissions) Regulations, which came into force since 1 July 1999 and last updated on 31 January 2019, stipulate standards for vehicle exhaust emissions.
The Ministry of the Environment and Water Resources (MEWR) has the task of ensuring a clean and sustainable environment for Singapore. It formulates, reviews, and implements strategic policies to address key concerns on Singapore’s environment. The National Environment Agency (NEA) is the operational statutory board that implements MEWR’s policies. NEA develops and leads programs to monitor, reduce, and prevent environmental pollution, as well as to enhance sustainable development. The NEA’s Pollution Control Department manages air pollution through prevention, enforcement, and monitoring. It regulates air emissions from industries, trade premises, and vehicles. It monitors the air quality to which the population is exposed to for the different types of environment found in Singapore (urban, industrial, and suburban) and assesses the effectiveness of emission control programs. It also formulates and implements joint programs on transboundary pollution with Singapore’s neighboring countries. NEA provides up-to-date weather information to support public health and socioeconomic activities through the Meteorological Service Singapore (MSS). The agency also issues alerts of severe air pollution episodes triggered by wildfires at regional scale, locally known as haze events.
With the aim of addressing the recurrent transboundary haze triggered by widespread wildfires resulting from the aggressive deforestation and agricultural expansion experienced by neighboring countries in recent decades, in 2002, Singapore, together with other members of the Association of Southeast Asian Nations (ASEAN) signed the ASEAN Agreement on Transboundary Haze Pollution [119], with the objective of preventing, monitoring, and mitigating forest fires to control transboundary haze pollution through concerted national efforts, regional, and international cooperation. The agreement assigns particular tasks to each nation in the southern ASEAN region, with Malaysia overseeing preventative measures, Indonesia on fire-fighting resources and Singapore on regional monitoring. In this context, the MSS under NEA hosts the ASEAN Specialized Meteorological Centre (ASMC), which monitors daily the weather and haze situation for the entire ASEAN region. One year after the infamous one-week haze episode of 2013, the government of Singapore introduced the Transboundary Haze Pollution Bill, a unilateral law that holds companies accountable for causing severe air pollution by illegal forest burning activities, even if these activities occur outside the island-state [120].
3.1.2. Population and Urban Development
As of 2018, Singapore’s total population is over 5.6 million, of which 3.9 million (71% of total population) are citizens and permanent residents. Singapore’s 742 km2 of land area means a population density of about 7796 people per km2, one of the highest in the word.
Singapore has transformed from a developing nation to a developed one in about 50 years since gaining independence in 1965. As mentioned before, its per capita GDP increased from $428 in 1960 to $57,700 in 2017 [5]. Similarly, the energy consumption associated to such fast development has increased over 13-fold, as shown in Figure 8.
This economic growth together with a dynamic governance have enabled Singapore to build a modern city, making the best use of its limited land space following an integrated master planning system. This system embodies the key principles to make Singapore a livable and resilient city while maintaining a competitive economy, building a sustainable environment, and ensuring a high quality of life for its population. The master plan on land and property that guides Singapore’s development in the medium term (10–15 years) is reviewed every five years and translates the broad long-term (40–50 years) strategies for land use and transportation [121]. As a city-state, Singapore must provide not only for housing, business, social, and recreational needs, but also for activities that are typically located outside a city, for instance, seaports and airports, water catchment areas, and utilities such as waste treatment plants and power stations. Singapore has considered all land use demands comprehensively, and through a continuous land reclamation process has expanded its land by 25% since independence, while its built-up area has increased by a factor of four reaching over 420 km2, primarily at the expense of forest and farm areas.
From its earliest days as an independent nation, Singapore has prioritized the construction of high-rise public housing to meet the housing demands of a population that has tripled its size since then. Today, over 80% of the population lives in high-rise, high-density flats, locally called HDB units. Some of the general industrial areas (e.g., electronics, manufacturing, etc.) are located within residential estates, but most of the heavy industries (e.g., oil refining, petrochemical, steelworks, etc.) are concentrated in a large industrial estate in the western part of the island that includes several reclaimed offshore islands as shown in Figure 9. Nine percent of Singapore’s land has been set aside for parks and ecological reserves [122]. Including the extensive tree cover (roadside greenery, park connector network), about half of Singapore is covered by vegetation [123], and therefore its motto of ‘City in a Garden’ is well-deserved. The commercial and business center is located in the southern part of Singapore and primarily consists of shopping malls, hotels, and entertainment complexes. These areas generally have a high density of workers, visitors, and vehicular traffic that continues past midnight. The central business district, which houses the financial center and includes numerous tall skyscrapers, is located in the center of the southern part.
At regional scale, Singapore together with the urban areas of Johor Bahru in Malaysia (population 1.8 million) and the Indonesia’s island of Batam (1.2 million) form the Sijori Growth Triangle with over 8.6 million people. As shown in Figure 9, Johor Bahru borders Singapore to the north, whereas Batam is located 20 km off the Singapore south coast. These two cities concentrate a large number of labor-intensive industries and are characterized by growing population.
3.1.3. Topography and Meteorology
Singapore is an island-state located at the southern tip of the Malay Peninsula between latitudes 1°09’ N–1°29’ N and longitudes 103°36’ E–104°25’ E. The main island of Singapore is about 49 km from east to west and 25 km from north to south with a coastline of 203 km. Singapore is generally flat, with much of the island lying within 15 m of sea level. The highest point of the island’s surface reaches 163 m.
Because of its geographical location near the equator and coastal setting, Singapore’s climate is characterized by perennial high temperatures, relative humidity, and rainfall, and low average wind speeds typical of a tropical climate. Temperatures range from 23–25 °C during the night to 31–32 °C in the afternoon. Relative humidity is 90% in the early morning and remains above 60% during the rest of the day. The local wind climate is dominated by the reversal of wind direction between the two monsoon seasons (northeast (NE) and southwest (SW)) and modified by land/sea breezes and a possible urban heat island (UHI) circulation. The NE monsoon occurs between November and January and is characterized by widespread heavy rainfall with monthly means ranging from 170 to 330 mm. The SW monsoon typically falls between May and September and is characterized by relatively drier conditions with average monthly rainfall between 130 and 160 mm. Given the high temperatures, humidity, and strong solar radiation, strong convection characterizes the daytime mixing dynamics of the atmosphere. The UHI, a regional-scale phenomena describing the urban–rural temperature difference, is well established and shows a seasonal variation with higher (lower) mean monthly nocturnal temperature differences, measured between the commercial district and a mostly undeveloped rural area in the northwest (NW) of Singapore, during the drier SW (wet NE) monsoon season of 5.5 (3.5) °C [124]. The presence of an UHI in combination with the rough city surface maintains predominantly unstable atmospheric stratification even at night.
3.2. Infrastructure and Air Quality Management Tools:
Singapore recognizes that the current urbanization trend and intensive industrial development, both locally and in the region, represent an increasing challenge to identify, quantify, and prioritize air pollution sources, as well as to differentiate the impact of transboundary sources from local sources [120]. To address such a challenge, Singapore counts with a robust air quality monitoring network and plans to integrate a dispersion modelling system to better forecast air quality and trace pollution sources.
3.2.1. Air Quality Monitoring
The air quality monitoring network is formed by 22 fixed stations, 18 monitor general ambient air quality, and 4 roadside air quality. The former stations are strategically located to accurately assess the air quality in different parts of Singapore (Figure 10). The latter are used to assess the effectiveness of Singapore’s vehicular emission control programs. The monitoring network measures hourly concentrations of PM10 and PM2.5, SO2, NO2, O3, and CO. The ambient concentrations of these six pollutants are used to determine a local pollutant standard index (PSI) to inform the air quality conditions to the larger public. The PSI computation is similar, but not identical, to the air quality index developed by the US EPA. It is based on the 24-h moving average concentrations of PM2.5, PM10, and SO2, 8-h moving average concentrations of CO and O3, and hourly concentration of NO2 [125]. Along the PSI, the hourly moving average concentrations mentioned above are made available to the public together with the 1-h PM2.5 concentration. After the infamous haze episode of 2013, the authorities made the 1-h PM2.5 data publicly available as an indicative measure of the current air quality. During transboundary haze episodes, PM2.5 is usually the predominant pollutant among those monitored and because of its temporal variability the use of moving averages dampens the hourly peak concentrations to which the public may end exposed as demonstrated by Velasco and Rastan [117].
With the aim of providing easily understandable information about the air quality level, an air quality descriptor is published hourly according to the PSI value for each one of the five regions in which the city-island is divided for this purpose, as shown in Figure 10 [126]. This descriptor acts as a health advisory based on the previous 24-h air quality data. The sub-indexes computed for each pollutant and from which the PSI is derived are also disclosed to the public. This information is widely disseminated through the local media (i.e., TV, radio, newspapers), an official website [124], and as part of a mobile application (myENV) for weather and environmental updates. However, the public does not have access to the pollutants’ concentration measured at each monitoring station, and the precise location of the stations and monitors’ characteristics are not disclosed. Furthermore, the public does not know if the six reference pollutants are measured by all stations. An urban air quality monitoring network like Singapore’s might not need to measure necessarily every pollutant at each station [127].
Similarly, the authorities have mentioned in diverse forums that some air quality stations are equipped with instrumentation to monitor continuously 56 VOCs to detect toxic species in the air (e.g., oral reply of the MEWR to parliamentary questions on investigation into chemical odor from Pasir Gudang on 6 November 2017 [128]). However, no major information on the monitored data have been publicly disclosed.
In the case of 1-h PM2.5 data, the authorities have implemented a system of four bands to act as a guide for the public to adjust immediate activities. The first band corresponds to concentrations ≤55 µg m−3 and indicates normal PM2.5 levels. The following bands are labelled as elevated, high, and very high levels of PM2.5 pollution and cover concentrations of 56–150, 151–250, and >250 µg m−3, respectively. The thresholds for these bands were designated according to the breakpoints used to compute the 24-h PSI (see Figure 10). The band labelled as normal covers both the good and the moderate PSI ranges. The band of elevated concentration corresponds to the unhealthy PSI range, the band of high concentration to the very unhealthy PSI range, and the band of very high concentration to the hazardous PSI range. Using 1-h PM2.5 data retrieved from the air quality official website between June 2014 and August 2016, it was found that 97% of all 1-h periods that were not affected by transboundary haze fell under the band labelled as normal and the remaining 3% under the band labelled as elevated. However, if the threshold of 12 µg m−3 used to determine the PSI range of good air quality had been applied, only 13% of the hours would have fallen under such category, while 84% would have presented a moderate air quality. Indeed, the PSI concept is fundamentally based on epidemiological studies that use average daily exposure estimates and its threshold concentrations cannot be directly translated to hourly estimates, but it is unclear why the categories of good and moderate PSI are merged into the normal 1-h PM2.5 band. It would make more sense to use the same PSI thresholds, as it was done for the other bands. Alternatively, the 24-h recommended maximum concentration of 25 µg m−3 by WHO could be used to set the 1-h PM2.5 band for clean air quality, with the finding that 65% of the hours fall under such category. It is important to note that as it stands today (April 2019), only 1-h data for PM2.5 and NO2, as well as 24-h or 8-h moving averages for the other contaminants are publicly available, but on a day-to-day basis. In other words, previous day’s records cannot be retrieved. All hourly data from previous day are restricted the day after. Also, the public has no access to historical data concentrations.
3.2.2. Emissions Inventory
According to the environmental authorities, the industrial sector and vehicular traffic are the main sources of air pollution in Singapore [129]. From time to time, transboundary haze from land and forest fires in the region also affect Singapore’s air quality, particularly during the Southwest monsoon period.
To address the air pollution from SO2, NEA builds every year an annual inventory of SO2 emissions, including contributions from refineries, power stations, other industries, and motor vehicles. The first three sources are responsible for 99.9% of Singapore’s SO2 emissions; however, this inventory does not include emissions from shipping or aviation. Singapore is the busiest port in the world in terms of shipping tonnage, with more than 130,000 vessel calls annually, but does not count with an emission control area (ECA) to minimize SO2 emissions from ships as defined by Annex VI of the 1997 MARPOL Protocol. Every 2–3 min, a ship arrives or leaves Singapore, and at any one time, there are about 1000 vessels passing through the Singapore Strait, as stated by the Maritime and Port Authority of Singapore [130], without any fuel regulation to limit their impact to the local air quality. Similarly, Singapore’s airport is one of the largest transportation hubs in Asia, handling 7200 weekly flights or one every 80 seconds [131], but its emissions are not included in the SO2 emissions inventory.
Singapore, as a member of the Intergovernmental Panel on Climate Change (IPCC), periodically updates its GHG emissions inventory to outline mitigation measures to manage its carbon emissions toward achieving its international commitments to address climate change. In 2009, Singapore pledged to reduce emissions by 16% from business-as-usual levels by 2020, and in 2015 to reduce its emissions intensity by 36% from 2005 levels by 2030 and stabilize emissions with the aim of peaking around 2030 [132]. Singapore’s GHG emissions reached 51,000 Gg CO2eq in 2014. Carbon dioxide is the most important GHG, alone contributing almost 96%. It is produced by the burning of fossil fuels to generate energy used by the industry, buildings, household, and transport sectors [133]. Figure 11 shows the emissions evolution of SO2 and GHG by emission source category as reported by Singapore’s authorities.
Until 2012, the NEA annual reports were used to present an emission inventory for PM2.5. For that year, a total emission of 2880 Mg was reported, with a contribution of 56% from vehicular traffic and the rest from refineries, power plants, industries, and incinerators [134]. No update of PM2.5 emissions has been disclosed since then. For the other pollutants used as reference for Singapore’ air quality, no emissions information is available from the authorities. However, since Singapore is an island-state, the emissions computed at country scale by the Emissions Database for Global Atmospheric Research (EDGAR) initiative can be used to identify positive actions to reduce atmospheric pollution and mitigate climate change. Figure 12 shows the time series of 11 pollutant species and GHG of relevance for Singapore’s air quality management from 1970 to 2012 by major emission sectors as reported by EDGAR.
A comparison of the CO2 emissions reported for 2012 by the local authorities and EDGAR shows an excellent agreement. For the case of PM2.5, there is a discrepancy of 424% between both inventories. Estimations for vehicular emissions are within 2%, but emissions from refineries, power plants, and industries are 2.2-fold higher in EDGAR. However, the discrepancy relies on the emissions reported from refuse incinerators. The official inventory reports 26 Mg, while EDGAR reports 10,776 Mg. Although further analysis is required, the incinerators’ emissions reported by EDGAR could be excessively overestimated based on the contribution from the other sources. Finally, for SO2, such comparison is not possible since no emissions from the same year are available for both inventories; however, a comparison of the emissions reported by EDGAR in 2012 with those of the local authorities in 2013 suggests an underestimation of 50% in the latter.
3.2.3. Air Quality Modeling
Singapore’s air quality management apparently does not rely on modeling capabilities to investigate the origin, dispersion, transformation, and impact of atmospheric emissions within the urban environment. It is unclear if the air quality policies in place were previously evaluated through numerical simulations to assess their effectiveness under present and future emission and climatic scenarios. Nevertheless, as part of Singapore’s weather and haze monitoring commitments at the regional scale, the MSS under NEA hosts the ASMC, which runs the open software Hybrid Single Particle Lagrangian Integrated Trajectory (HYSPLIT) model of National Oceanic and Atmospheric Administration (NOAA) air resources laboratory on a daily basis to forecast the occurrence of transboundary haze from wildfires in the region. The HYSPLIT model simulates the haze dispersion from fire hotspots in Southeast Asia that are detected by NOAA’s satellites. With the aim of improving the local capabilities to forecast the regional haze, the MSS in collaboration with UK Met Office recently developed a Lagrangian dispersion modeling system for real-time prediction based on high-resolution numerical weather simulations and satellite-based active-fire detection that demonstrated promising results for forecasting haze episodes [138]. However, its operational implementation is unclear.
3.3. Air Quality and Emissions Trends
3.3.1. Air Quality Trends
Although Singapore’s environmental authorities have collected hourly, if not continuous, data of six reference pollutants since decades ago, no robust information on the air quality evolution throughout the years is available. The access to the hourly and historical records is confidential and restricted to the public. Before 2012, the public had only access to annual average concentrations and to a 24-h PSI reported once a day. Although 1-h PM2.5 concentration data have been collected for several years, it was not included in the PSI until 2014. After the haze episode of 2013, the authorities started to disseminate the PSI and moving average concentrations every hour. Velasco and Rastan [117] reviewed the changes on the public access to air quality data in Singapore and demonstrated the need of reporting 1-h pollutant concentrations along with moving average records in the local context and of disclosing historical records to have a more transparent air quality management.
Based on the publicly available annual mean concentration, 8-h annual maximum concentration, or 99th 24-h annual percentile concentration depending on the pollutant species, Figure 13 shows the annual trend of such pollutants as the percentage difference relative to 1999 concentrations, except for PM2.5, for which 2002 is used as the reference year. A clear decreasing trend for SO2 and NO2 responding to a switch from fuel oil to natural gas for power generation was observed from 2000 to 2005. Singapore’s electricity generated by natural gas increased from 19% in 2000 to 74% in 2005, reaching a contribution of 95% since 2015 to the total electricity generation [139] (see Figure 8c). The decreasing trends of these two pollutants is also observed in their emissions as discussed in the following section. Similarly, CO annual concentrations show a decreasing trend during the same period, but in response to a reduction in vehicular emissions. If 2000 and 2003 were selected as reference years for PM10 and PM2.5, respectively, no major change on their annual trends would be found. It is fair to affirm, therefore, that the annual levels of PM10 and PM2.5 have remained constant during this century, while the 2006 and 2015 spikes are explained by prolonged transboundary haze episodes on those years. As depicted in Figure 6, the progress for reducing PM2.5 in Mexico City and Los Angeles has been also null. As explained in the following sections, the design of effective control measures against PM2.5 requires a complete understanding of the chemical and physical processes driving its formation and dispersion, besides a thorough identification of local and regional emission sources. The pollution by O3 has not changed, although a sudden increase of 40% was recorded in 2017.
Figure 14 shows the time series of 1-h PM2.5 data retrieved daily from NEA website between June 2014 and August 2016 [140]. This period covers the haze episode of September–October 2015, when PM2.5 concentrations >100 µg m−3 were frequently recorded, with a historical maximum of 471 µg m−3 on October 19th at 23 h. The built up of the previous year during the same months was also produced by wildfires in the neighboring islands of Sumatra and Kalimantan. Some of the short-lived spikes, particularly those during the Northwest monsoon period, respond to fires in peninsular Malaysia. As discussed above, the PM2.5 bands system implemented by the local authorities as a guide on the actual air quality reports that the majority of days are not affected by transboundary haze under the normal air quality band. However, as shown in Figure 15, each of the five regions in which Singapore is divided for air quality purposes exhibits mean diurnal concentrations exceeding the annual threshold of 10 µg m−3 recommended by WHO, as well as the annual threshold of 12 µg m−3 currently in place in Mexico City and US. Based on the mean maximum hourly concentrations recorded across Singapore, it is found that during this period of 27 months, the PM2.5 concentrations exceeded 20 µg m−3 every day, regardless of transboundary haze.
3.3.2. Emissions Trends
The historical emissions reported by EDGAR in combination with the emissions of SO2 and CO2 reported by the local authorities in recent years indicate that after the switch from fuel oil to natural gas for power generation between 2000 and 2005, no major reductions have been experienced in the emissions of pollutants and GHG, except for black carbon and CO as depicted in Figure 12. The reduction in the total emissions of black carbon initially responded to the shift to natural gas in power plants, subsequently to more stringent tailpipe emission regulations in vehicles, which also contributed to the reduction of CO emissions. The industrial sector has always appeared as the main contributor of SO2, NOx, and CO2, and as an important source of other pollutants. In addition to CO and black carbon, the transport sector is a major emission source of NOx, organic particles, NMVOCs, and NH3. The vehicular emissions of NH3 are explained by the use of catalytic converters since ~20 years ago. The waste incineration is the main emission source of PM10 and PM2.5 according to EDGAR, with contributions of 71% and 72%, respectively; however, such estimations might be overestimated as already mentioned in Section 3.2.2. The use of solvents and paints contribute 42% to the net emissions of NMVOCs and represent the main emission source. For CH4 wastewater treatment shows an increasing contribution of 44% followed by waste disposal with 36%.
Improving energy efficiency has been Singapore’s key strategy for reducing industrial emissions, but the consumption of oil fuels and electricity keeps increasing (see Figure 8). Singapore’s economy has grown faster than its emissions. NMVOCs and CO2 are the only two pollutants that show a clear increasing trend.
In terms of GHG, Singapore’s carbon intensity (i.e., CO2 emissions per dollar of economic output) is among the lowest in the world. Singapore ranks among the 15 best-performing countries [141]. The official GHG emissions inventory indicates that industry increased its emissions by 7.8% from 2010 to 2014 (see Figure 11b), while its production grew 12.1% in the same period [39]. While the strategies to meet Singapore’s commitments to address climate change are all worthwhile [132], no absolute emission cut has been proposed.
3.4. Air Quality Control Management in Singapore
3.4.1. Air Pollution from Industries
Singapore officially recognized the air pollution’s adverse health effects in 1971 through the Clean Air Act “The ill effects of air pollution on human beings are numerous, … they are impairment of general health, irritation of the eyes and throat, and chronic bronchitis …. It can also cause economic loss through high maintenance costs and loss in man-hours, and can also contribute to the physical deterioration” (Singapore Parliamentary Debates Official Reports, vol. 31, 1971–1972, col. 449) [142]. It was Singapore’s earliest attempt to control industrial pollution just as the country was industrializing rapidly. The act required industries and trade premises to operate in such a manner as to meet certain air quality standards.
Before the Clean Air Act, there was a general provision in the Local Government Integration Ordinance, 1963 that broadly forbade the discharge of pollutants in a quantity that would be dangerous to public health. These provisions were subsequently incorporated into the Environmental Public Health Act, 1968. Enforcement of these provisions were conducted first by the Director of Medical Services, and then by the Commissioner of Public Health. These provisions did not have established emission standards and were highly subjective, which made enforcement ineffective [143].
In 1970, the government asked the advice of WHO for establishing a first air quality monitoring network and drafting a first air pollution control legislation. This initial request laid down guidelines for setting up an air pollution control unit, requirements for monitoring efforts, air pollution legislation, future consultancy work, as well as general public education [144]. The advice of additional overseas experts contributed to the beginning of Singapore’s air quality monitoring that year. The Public Utilities Board (PUB) acquired equipment to measure the degree of smoke, SO2, and other pollutants in the air, and sent principal officers for training to existing air pollution control units abroad [145]. Based on the air quality data collected by PUB and experts’ advice, the Clean Air Act was enacted a year later and came into force in January 1972.
The implementation of the Clean Air Act required industries to install air pollution control equipment to comply with the new prescribed emission standards, among them the discharge of dark smoke, defined as smoke darker than shade No. 2 on the Ringelmann Chart. Highly polluting industries, such as those manufacturing cement, concrete, asphalt, ceramic, chemicals, petroleum, coke, and crushing, grinding, milling or pulping works, and primary metallurgical activities, as well as premises using high-capacity steam generators, large incinerators and furnaces, or used for the storage of large quantities (>100 ton) of toxic or flammable material, were classified as ‘scheduled premises’ requiring to get a license before starting operations. Following amendments between 1973 and 1980 that prohibited the use of open fires in industrial premises, the construction sites were brought under scrutiny and provided new regulations for a stricter control over the emission of certain pollutants such as dust, acid gases, chlorine, and CO. These regulations were effective in controlling air pollutants associated with Singapore’s fast industrialization. Throughout the 1970s and 1980s, the air pollution levels remained constant and within the limits recommended by the WHO at that time [146,147]
The Clean Air Act was replaced in February 1999 when the parliament passed the Environmental Pollution Control Act 1999 [148]. This new act consolidated previous laws relating to air, water, and noise pollution control into a single act with the aim of providing a stronger legislative framework for the overall control of the environmental pollution from any industrial or trade premise. This act was revised in December 2002 to specify emission standards and testing methods [118]. It was renamed as Environmental Protection and Management Act (EPMA), and after 29 amendments, its regulations are still in place.
3.4.2. Air pollution from Vehicles
The air pollution from vehicular traffic has been regulated by indirect and direct control measures. The indirect measures include a combination of traffic management and an intense promotion for using public transport. Measures to manage private transport include controlling the vehicle population growth rate, restricting car ownership, and managing traffic congestion by charging vehicles entering to certain roads. Simultaneously, significant efforts have been made to make public transport the commuting choice in Singapore. This has been done by improving accessibility, reliability, and comfort in the subway system and bus service. Presently, 67% of trips during peak hours use public transport. The new land transport master plan aims for 9 in 10 peak-period journeys to be undertaken by a combination of walking, cycling, and riding public transport in 2040 [149].
The data publicly available to evaluate the impact of such indirect measures on Singapore’s air quality are insufficient; however, their impact on traffic flow can provide some insight on their environmental impact. Restricting car use and reducing car ownership have undoubtedly controlled vehicular emissions, while the use of road-pricing schemes has moved traffic away from congested roads and lowered peak-hour emissions. Initially, the road-pricing scheme was introduced in 1975 to relieve congestion in the city center [150]. It consisted of levying a flat charge to all motorists entering the restricted zone. Its implementation, in addition to lessening traffic by ~45% during the morning peak hour, improved air quality. Immediately after its introduction, the ambient levels of NOx and CO dropped 10% and 30%, respectively, according to air quality data collected by authorities to prove its environmental benefit [151].
Throughout the years, the road pricing-scheme has evolved and succeeded in maintaining the city free of traffic congestion. As charges are levied on a per-use basis, the negative externalities of road congestion caused by road users are accounted for, encouraging road users to use public transport, or other routes and travel timings. In 1998, Singapore became the first city to introduce an electronic toll that varies according to the hour, location, traffic volume, and vehicle characteristics. The electronic road pricing (ERP) system, has proved to be an efficient policy that forces motorists to be part of the solution rather than the problem. Current plans expect to make the scheme more flexible, charging motorists according to the distance travelled on congested roads, instead of charging all motorists the same amount as long as they pass a gantry [149]. Several studies have evaluated its effectiveness to manage traffic congestion as a unique case of innovation in the public sector [152,153,154]. However, follow-up assessments of its impact on air quality have not been done; this is needed for improving the current scheme or implementing new sophisticated systems for managing vehicular traffic, as well as for demonstrating its ability for maximizing roads efficiency capacity and reducing commuting time. The data collected by the existing roadside air quality monitoring stations and estimations of the vehicular emissions would help to address the associated environmental benefits.
In addition to the ERP system, the number of vehicles on the roads is controlled by the cost of owning a car. In addition to the sales tax, registration fee, an excise duty, and other special taxes, a certificate of entitlement (COE) is needed to get legal right to own a car for a period of 10 years [155]. The cost of this certificate depends on the demand and it can often exceed the cost of the car itself. These certificates are allocated through a bidding process twice a month. As of April 2019, the COE price varied from SG$27,589 to SG$43,102 according to the car category. The final price of a car can be up to 4 times of its open market value. The introduction of the COE in 1990 as part of a vehicle quota system (VQS) limited the vehicles growth rate to 3% per year. In previous years, the growth rate was as high 12%. The annual growth rate is currently set at 0.25%.
The indirect measures to control traffic air pollution have been complemented by regulatory policies to control directly vehicular emissions. They include fuel policies, vehicle emission standards, vehicle inspection and maintenance programs, and scrapping old cars.
Since the 1980s, the lead in gasoline was progressively lowered. Unleaded gasoline was introduced in 1991. To promote its consumption, it was priced 10 cents per liter cheaper than leaded gasoline through taxing. At the end of 1997, unleaded gasoline accounted for 75% of the total gasoline sales. The oil industry voluntary agreed to phase out leaded gasoline in 1998 [156], and by 1999 no vehicle was allowed to use leaded gasoline. The sulfur content in gasoline and diesel has been lowered since the 1990s from 3000 ppm to 10 ppm currently. Since 2005, the use of low-sulfur (50 ppm) diesel has been mandatory, and since 2017 the use of ultra-low or near sulfur free (10 ppm) diesel and gasoline has also been mandatory [157]. New limits in the content of four toxic additives, namely methanol, methylcyclopentadienyl manganese tricarbonyl, phosphorus, and fatty acid methyl ester, are planned to be introduced in both gasoline and diesel from July 2019 as part of Singapore’s continuous effort to improve fuel quality [158].
The progressive elimination of lead and move to lower sulfur content in diesel and gasoline have allowed the tightening of emission standards. Since July 1992, every gasoline vehicle registered for the first time has had to comply with specified standards for exhaust emission prescribed by the Environmental Protection and Management (Vehicular Emissions) Regulations. Over the years, the emission standards have been tightened to keep up with new vehicle technology. Since January 2018, all new diesel and gasoline vehicles have to meet the Euro VI emission standards or their equivalent Japanese standards JPN 20109/2018 [157]. It is important to point out that the Euro VI diesel emission standards include emission limits for ultrafine particles. With regard to motorcycles, those with an engine capacity >200 cc are tightened to Euro IV standard, while smaller motorcycles with an engine capacity ≤200 cc will see the Euro IV emission standards implemented from January 2020.
All vehicles on the road are required to undergo mandatory periodic inspections to ensure that they comply with the emission standards stipulated in the regulations. The schedule of inspection depends on the age and type of vehicles, with the frequency of inspection being shorter for older and diesel-driven vehicles [157]. Smoky vehicles on the roads are sent for emission inspection. If the vehicle fails the inspection, the owner is fined and required to rectify; the vehicle must pass re-inspection before it can circulate again.
To prevent unnecessary pollution and at the same time reduce fuel wastage, it is an offence to leave the engine of a vehicle idling while it is stationary; offenders are fined if caught [157]. Many Singapore motorists leave the engine on to keep the air-conditioning system running while idling. Members of the public are encouraged to report high-polluting vehicles or idling engines.
To encourage earlier retirement of older cars, motorists receive a rebate for the COE and registration fee for a new car when they deregister vehicles with still valid COEs. The rebate is based on the amount paid originally for the COE and its remaining validity. Owners have to send their cars for scrapping or exporting. This rebate works as a mechanism to control the cars’ population, because with every deregistered car a new car is registered. In recent years, the cars population has decreased because of the high cost of getting a COE, making motorists hold their cars for a longer time. Currently, half of the cars are less than five years old, in contrast to a decade ago, when the average car was 3.5 years old [159].
3.4.3. Air Pollution from Shipping
The Maritime and Port Authority of Singapore launched the Maritime Singapore Green Initiative in 2011 to ensure that shipping and its related activities grow in an environmentally responsible and sustainable manner [160]. The initiative comprises five programs: (1) The Green Ship Program encourages Singapore-flagged ships to reduce emissions of CO2 and SO2 by adopting energy-efficient ship designs, installing SO2 scrubbers or using LNG as fuel in exchange for reduced registration fees and rebates on annual tonnage taxes; (2) the Green Port Program reduces port dues by 25% to ocean-going vessels that burn clean fuels (<50 ppm of sulfur content) or use approved abatement technology; (3) the Green Technology Program provides grants to develop and adopt technologies that reduce the emissions of SO2, NOx, and CO2; (4) the Green Awareness Program supports actions and forums in favor of sustainable shipping; and (5) the Green Energy Program provides support for the adoption of alternative/cleaner marine fuels. The initiative was originally funded for five years and then extended to 2019. It has been well received by the shipping sector but has the drawback that it is voluntary and does not fully address the shipping impact on air quality.
3.4.4. Air Pollution from Fireworks
The local tradition of lighting fireworks to celebrate particular festivities became a serious problem of public safety by the late 1960s. During the 1970 Chinese New Year season, the indiscriminate use of fireworks killed six people, injured 25 others, and damaged up to SG $500,000 worth of property [161]. In response, a total ban on the use of fireworks in Singapore was implemented in 1972 through the Dangerous Fireworks Act. After an amendment in 1988, the illegal use and distribution of fireworks is punishable by fines or imprisonment. Repeat offenders face mandatory imprisonment and caning [162]. In addition to solving a major public safety problem, the enforcement of this strict ban eliminated the threat of fireworks to air quality. The worst air pollution episodes in many locations occur on days of intense fireworks activity [103].
3.4.5. Recent Air Quality Management Programs
Since the late 1960s, Singapore has periodically revised its policies to ensure an economic growth model that does not compromise its environment. The Singapore Green Plan (SGP) issued in 1992 was the country’s first formal plan to balance environmental and development needs. It described the policy directions that Singapore would take to become a model ‘green city’ by the year 2000 [163]. New environmental concerns in the city-island such as transboundary air pollution and climate change were included in a second plan launched in 2002 [164]. An extensive review was conducted in 2005, releasing a revised version in 2006. The SGP 2012 moved towards attaining environmental sustainability from just being clean and green [165].
The revised SGP 2012 drew a strategic management against air pollution based on prevention, monitoring, enforcement, and education. The three main targets were (1) to maintain the PSI within the good range for 85% of the year, and within the moderate range 15%; (2) to reduce the ambient concentration of PM2.5 to within an annual mean of 15 µg m−3 by 2014; and (3) to improve carbon intensity by 25% from 1990 level by 2012. To achieve such targets, the proposed measures include reviewing regulatory measures for stationary and mobile emission sources, encouraging co-regulation by industry and consumers, improving energy management practices, and promoting use of natural gas and renewable energy.
The Sustainable Singapore Blueprint launched in 2009 set out a new framework to guide Singapore’s sustainable development efforts up to 2030 [166]. It set higher targets than those in the SGP 2012 with the vision of making Singapore a livable and lively city by boosting resource efficiency, enhancing urban environment, building capabilities, and fostering community action. For air quality, the main target was to reduce further the annual ambient concentration of PM2.5 to 12 µg m−3 by 2020, as well as cap SO2 levels at 15 µg m−3. To do that, the emission standards for industry and transport would be regularly reviewed, and the use of public transport would be strongly encouraged. The cost-effectiveness of new technologies to reduce emissions from public transport would be tested, including the introduction of diesel hybrid vehicles and diesel particle filters. To address the industry’s emissions, the government would promote the use of more efficient pollution control equipment and the use of improved sulfur recovery systems for refineries.
The latest edition of the Sustainable Singapore Blueprint launched in 2015 [122] outlines the updated vision and plans, including new targets for air quality to be meet in 2020 and in the long term pegged to the WHO guidelines (see Table 1). To work towards achieving such targets, Singapore has proposed, among others, the following abatement measures for industry and vehicles:
Industry:
- Impose SO2 caps on key industrial emitters, and simultaneously reduce the emission of other pollutants including PM2.5.
- Introduce stricter emission standards.
- Administer an incentive scheme to encourage adoption of highly efficient pollution control equipment.
- Work with major emitters (e.g., power stations) to reduce SO2 emissions.
- Conduct real-time emissions monitoring of major emitters.
Vehicles:
- Mandate the supply of near sulfur-free diesel and gasoline with a sulfur content of 10 ppm to pave the way for Euro VI emission standards for diesel and gasoline vehicles and further reduce SO2 emissions from vehicular traffic.
- Tighten emission standards for new vehicles and motorcycles.
- Enforce fuel quality regulations.
- Encourage the turnover of old diesel commercial vehicles through the early turnover scheme.
- Conduct enforcement on smoky and idling vehicles.
- Encourage the purchase of new cleaner vehicles through the vehicle emission scheme.
3.4.6. Climate Change Mitigation Plans
The actions proposed to make Singapore a ‘carbon-efficient city’ and meet the pledge of reducing GHG emissions according to international commitments will also help to address local air pollution. The latest climate action plan [132] proposed improving energy efficiency as key strategy for reducing emissions across the industry, transport, buildings, households, waste, and water sectors. Among the proposed actions that will simultaneously reduce the emission of air pollutants are the following:
- Industry will adopt cleaner fuels and will work to reduce the emission of non-CO2 GHG.
- More efficient power generation technologies, such as co- and tri-generation will be adopted.
- The share of non-fossil fuels to produce electricity is expected to increase, mainly through the deployment of solar photovoltaic systems. By 2020, solar power should cover 5% of peak electricity demand.
- Public transport will become the preferred mode of transportation, while active mobility, such as walking and cycling, will be promoted for shorter commutes and complement public transport.
- Pilot programs to evaluate the introduction of electric vehicles under a sharing system will be tested.
- The efficiency in domestic logistics will be improved by developing an integrated delivery system that reduces the number of trucks on the roads by 25%.
- Registration rebates and surcharges will be imposed to new cars according to their carbon emission rate per kilometer.
- The energy efficiency in buildings and households will be progressively raised with the aim of reducing electricity consumption.
- New technologies such as electrochemical desalting will be introduced for halving the energy used in seawater desalination.
- Programs to enhance recycling and reduce incineration will be implemented to reach an overall recycling rate of 70%, from a current rate of 60% (22% domestic and 74% non-domestic).
- New waste-to-energy processes in incineration plants will be developed to optimize energy recovery.
3.5. Scientific Research in Singapore
Scientific research of strategic relevance has been pointed out as necessary to strengthen air quality management (see e.g., [167]). In the case of Singapore, Velasco and Roth [116] reviewed the research and regulatory activities and found a limited interaction between them. They found that the limited publicly accessible data and little scientific information prevented a comprehensive assessment of the local air quality. The current scientific knowledge about Singapore’s air quality is still likely to be insufficient to understand the sources, transformation, fate, and impact of the local and regional air pollution and could hinder effective environmental policies. The strategies and measures implemented to control air pollution may not be sufficient to attain clean air, as defined by the latest Sustainable Singapore Blueprint through the air quality targets summarized in Table 1. Strengthened regulations and new technologies do not always solve environmental problems unless the processes occurring in the entire urban ecosystem are considered. For example, strategies for controlling PM2.5 pollution, in addition to consider particles directly emitted by anthropogenic sources, should also consider particles of secondary origin formed through chemical reactions in the atmosphere, as well as the contribution of natural sources. Emissions from the tropical forest in the region, urban vegetation and ocean may enhance the particle formation and contribute to the local particle burden. Even though studies in cities of similar economic development have found that the secondary component accounts for a large fraction (up to 60%) of PM2.5 (see e.g., [168]), no scientific effort is apparently in place to understand the physical and chemical processes driving the particle pollution in Singapore.
Velasco and Roth [116] pointed out the need for a scientific-based management system following a multipollutant approach to improve local air quality. Its application would improve the effectiveness of environmental programs by prioritizing actions that reduce health risks on the basis of exposure to a mixture of pollutants rather than a single pollutant. Such an approach would need to be supported by ambient monitoring, emissions characterization, air quality modeling, and a comprehensive understanding of the chemical and physical processes driving local air pollution and its impact on public health. To that end, they identified a list of scientific topics and research opportunities for an improved local air quality management (Table 2 in [116]). The progress in those scientific topics has been modest, except for the case of transboundary pollution as a consequence of the impact of recent haze episodes triggered by wildfires in neighboring islands mentioned above. Progress in other specific topics responds to individual efforts rather than institutional initiatives.
The scientific work on transboundary pollution has focused on determining the physical and chemical characteristics of the peat-burning particles that reach Singapore during haze episodes [169,170,171,172,173] and the personal exposure and potential health risk that they pose [174,175,176]. Similarly, a few studies have applied modeling techniques to evaluate the impact of such fires over Singapore and other locations within the region [177,178,179,180].
Impacts of Air Pollution on Public Health
A number of studies have assessed the adverse effects of air pollution on public health in Singapore. Correlations between air pollution and asthma exacerbation were established in the 1990s. It was found that asthmatic children were especially susceptible to increases of SO2 and total suspended particles [181]. Asthma is a high-prevalence health problem in Singapore, according to the Ministry of Health, affecting 5% of adults and 20% of children [182]. The prevalence of asthma in Singapore’s children aged 13–14 year is 27%, compared to 16% in Kuala Lumpur, Malaysia, 10% in Hong Kong, 8% in Mexico City, Mexico, and 5% in Ho Chi Minh City, Vietnam [183]. In the same context, even though the incidence rate of lung cancer has dropped by 47% (24%) in men (women) in the last 35 years, it is still the first (second) cause of cancer death in Singapore, where cancer is currently the leading cause of deaths, accounting for 30% in total [184]. Although air pollution may not be the main cause, scientific research has found that air pollution is an important risk factor for both diseases [185,186], and therefore should be considered for a holistic assessment.
Recent studies have also established strong correlations between air pollution and cardiovascular ailments in Singapore. A group of local epidemiologists investigated the effect of short-term exposure to air pollution on heart attack and cardiac arrest with important findings. Comparing nationwide records of myocardial infarction and out-of-hospital cardiac arrest with PSI data from 2010 to 2015, Ho et al. [187] found 8% and 9% excess risk of heart attack when PSI is in the moderate (13–55 µg m−3, 24-h PM2.5) and unhealthy (56–150 µg m−3, 24-h PM2.5) range, respectively. In the case of cardiac arrest, Ho et al. [188] found that each increment of 30 units in PSI (26 µg m−3, 24-h PM2.5) on the same day and previous 1–5 days was significantly associated with 8% and 6%–8% excess mortality, respectively. For haze episodes, the risk increased by up to 30% when the PSI level entered the unhealthy range of above 100 (>56 µg m−3, 24-h PM2.5); elderly people (>65 years) and patients with cardiac history were found to be the most vulnerable.
Regarding health impacts produced by regional haze events, Emmanuel [189] reported that the 1997 haze episode produced 30% increase in hospital attendance in Singapore, and an increase in PM10 levels from 50 to 150 µg m−3 was associated with increases of 12% in upper respiratory tract illnesses, 19% in asthma, and 26% in rhinitis cases. Quah and Boon [190] estimated an economic loss of $3662 million, equivalent to 4.3% of Singapore’s GDP, due to the same pollution episode, based on a damage–function/dose–response approach on morbidity and mortality effects. No estimations of economic losses related to most recent episodes are publicly available. However, applying a novel modeling scheme based on source–receptor relationships and health impact functions, Koplitz et al. [191] estimated 2200 excess deaths in Singapore from a total of 100,300 deaths in the region during the haze event of September–October 2015.
For 2009, a year that was not severely affected by haze episodes, Quah and Chia [192] estimated an economic cost of health damage attributable to PM10 of $3.75 billion, which was 2.04% of Singapore’s GDP for that year. Premature mortality represented 60% of such cost, 35% illnesses such as bronchitis, asthma attacks and respiratory symptoms 35%, and the remaining 5% visits to hospitals and restricted activity day for adults. More recently, using data from the Global Burden of Disease project, Apte et al. [193] estimated the global impact of PM2.5 on life expectancy, a decrement of nine months for Singapore’s residents in 2016, which compares somewhat favorable to the global population-weighted median decrement of 15 months.
4. Challenges and Lessons Learned
The experience of the Mexico City Metropolitan Area and Singapore demonstrates the complexity of improving the quality of breathable air for the residents. Table 3 presents a comparison of selected statistics, governance, and air quality management programs of the two cities. Although the differences in the governance, economics, and culture of the two cities greatly influence the decision-making process, both cities have made significant progress in improving the air quality by employing similar air quality management tools and strategies, including technology-based regulations and economic instruments.
This section compares the challenges and the lessons learned from air quality managements for the two cities. The objective is to illustrate that while each city has its own unique circumstances, the experience of one city can suggest potential solutions for another. Furthermore, they can provide examples for other urban centers facing similar challenges of addressing air pollution.
During the past three decades, Mexico City has made significant progress towards the solution of air pollution problems through comprehensive air quality management programs based on scientific, technical, social, and political considerations. The air quality standards and the environmental contingency program have been strengthened, recognizing the scientific evidence on health effects associated with exposure to ever lower concentrations of harmful pollutants. Nevertheless, concentrations of PM10, PM2.5, and O3 are still above the respective air quality standards, and possibly have started to rise again. Substantial challenges remain to effectively reduce concentrations of these pollutants.
As demonstrated in the recent air pollution episodes in the MCMA in March 2016 and April 2019 (caused in part by large number of vehicles circulating in the city and the stagnant meteorological condition) and May 2019 (caused by the forest fires from surrounding areas), it is not sufficient to implement contingency actions once pollution levels are increasing. Preventive actions need to be formulated with the help of robust forecasting modeling systems. Furthermore, since population growth, the expansion of urban sprawl, and the high motorization of the metropolitan area will continue to generate polluting emissions, it is important to continue developing and implementing additional policy measures to improve the air quality. To achieve this, it is necessary to improve metropolitan and regional coordination and collaboration in the different tasks related to air quality management, such as atmospheric monitoring, development of the emissions inventory, as well as design, enforcement, and evaluation of control actions.
Currently, the Mexican authority is developing the new 10-year air quality management program for 2021–2030. In September 2018, the Mexico City government sponsored an experts’ workshop to review the current air quality management program (PROAIRE 2011–2020); the workshop report included a set of recommendations to improve the air quality [37]. In May 2019, the Mexican environmental authorities presented a new plan for enhancing urban mobility and a series of measures to further reduce O3 and PM2.5 pollution in the MCMA [48]. The measures include reducing emissions from LPG distribution and VOCs from consumer and personal products, strengthening inspection of gas stations, eradicating practices that cause fires, reducing emissions from industries, public works, diesel vehicles (freight and passenger), and motorcycles, as well as providing incentives for hybrid and electric private vehicles and improving infrastructure for public transportation and non-motorized transport. Most of the measures announced were included in the workshop report.
The Singapore way for achieving a dynamic economy and a high-quality living environment has been generally successful. A long-term and integrated planning in combination with a pragmatic and cost-effective vision, and a flexible approach to changes in technology and in the global environment have allowed Singapore to become a relative clean and green city without threatening its economy growth. This is particularly true for urban greenery and water management. Nevertheless, according to the publicly available air quality data, Singapore falls short in meeting its targets for pollutants such as PM10, PM2.5, and O3. It is promising that authorities recognize the situation as expressed by the MEWR on January 2017 [194], and take additional measures to control pollution, such as the latest changes on vehicular emission standards and the introduction of electric and hybrid buses.
Singapore’s air quality management needs to implement some changes to further improve air quality. Firstly, Singapore faces a problem of secondary pollutants on days not affected by transboundary pollution. The control of such pollutants formed through chemical reactions from precursor gases emitted by local and regional sources of natural and anthropogenic nature represents a major technical challenge. A science-based multi-pollutant air quality management approach could assist Singapore in improving its air quality and reinforce its position as a livable and sustainable city. Secondly, as pointed out in previous publications [116,117,195], there is a need for transparency in sharing and communicating environmental data with the public and research institutions. Although some improvements in transparency have been made, the publicly accessible information is still not enough for a comprehensive assessment of the local air quality.
The experiences and good practices that have allowed Singapore and the MCMA to improve their air quality can be valuable for other urban centers confronting similar air pollution problems. The following summarize main lessons learned by both cities and point out areas of opportunities for improving current and future air quality management programs.
4.1. Air Quality Standards
Currently, many countries have established ambient air quality standards, which define the pollutant levels that should not be exceeded if public health is to be protected and provide an important management tool that can be used progressively to improve air quality. As in the case for Mexico, the standards have been strengthened over time as more information becomes available regarding the effects of public exposure to harmful pollutants. However, standards are effective only when compliance is measured and enforced. Likewise, the concentrations defined as maximum thresholds need to be updated timely according to the criteria specified by the local normativity on public health based on the WHO guidelines. The current standards in Mexico City for Pb, CO, and NO2 are from 1993. The standard for SO2 was updated in 2010, while the standards for O3, PM10, and PM2.5 in 2014.
In the case of Singapore, the use of targets instead of standards discourages the ruling of new environmental policies and hinders the implementation of mitigation actions in case of environmental emergencies, such as the haze episodes triggered by regional wildfires. In addition, as discussed in Section 3.2.1, the current practice of merging good and moderate PSI values into the normal 1-h PM2.5 band, as well as showing that Singapore accomplishes ‘clean air’ in over 99% of the days by merging both categories in the Key Environmental Statistics published annually by MEWR [196], do not help in developing further actions to get a better air quality.
4.2. Air Quality Monitoring
As presented in this article, one of the most effective ways of improving air quality is real-time monitoring of criteria pollutants and other toxic species, as well as meteorological parameters. Robust air quality monitoring enables policy makers to make informed decisions and actions to protect the public health. Furthermore, it is important to make the data readily accessible to the public to raise awareness, promote environmentally friendly practices, and encourage public participation during environmental emergencies. The hourly air pollution data and historical records for all the monitoring stations in the MCMA are available through their website and also via mobile apps. The Secretariat of Environment also releases comprehensive annual air quality reports [102].
Following the example of the MCMA, Singapore should release the 1-h concentration for each measured pollutant at each station together with the actual PSI and rolling concentration averages. This action will help to improve the short-term health risk communication and public participation.
Because of the high cost associated with the infrastructure for setting up an air quality monitoring network, concentrations of many criteria pollutants are not routinely measured in some cities. In fact, this is the case in the surrounding region of the MCMA. While the MCMA has an extensive air quality monitoring network, the air quality monitors are sparse in the other five states of the central megalopolis, making the air quality assessment at a regional scale difficult. This highlights the importance of promoting regional air quality monitoring for neighboring urban centers with a shared air basin. For the case of Singapore, coordinated efforts at the regional scale are needed to develop a monitoring network that covers the neighboring cities of Johor Bahru, Malaysia and Batam, Indonesia.
The increasing availability of satellite data and a new generation of satellite air quality monitoring have provided scientists and policy makers with additional information about the levels of criteria pollutants, which can be very valuable in countries and cities with limited local monitoring (see e.g., [197]). However, it is still important to establish and continue air quality monitoring routinely in such cities. Recent developments in sensor technology have improved the performance of low-cost monitors and, if they are calibrated against agency monitors at regular intervals, could expand the capability of current networks. The data obtained can potentially enhance the information provided by traditional networks and help in detecting local hot spots, thus significantly improving information for air quality management purposes [198]. Another innovative technique is the use of Google Street View cars coupled with fast response gas and particle analyzers, which have been used in mapping air pollution in California [199]. This approach is being scaled up to other cities around the world.
4.3. Health-Based Indicators
In addition to the current AQI (Mexico City) or PSI (Singapore), a health-based indicator that captures additive effects of multiple pollutants on public health risk could provide a quantitative means to improve risk communication by delivering more accurate information on potential health impacts. Indicators like this are currently in place in several cities. Mexico City has the risk index for susceptible people. Other cities, such as Hong Kong, have also compiled air quality health index (AQHI) [200]. This is similar to Canada’s AQHI, which is constructed as the sum of excess mortality risk associated to individual pollutants observed in Canadian cities [201,202]. These indicators are health-focused supplements to local air quality indexes similar to Singapore’s PSI and Mexico City’s AQI used as mechanisms to trigger control actions based on regulatory concentrations.
4.4. Emissions Inventory
Emissions inventory is an essential air quality management tool to evaluate the progress of emission-control strategies and to plan future actions. A robust emissions inventory for air quality assessment should include a thorough quantification and characterization of anthropogenic and natural emissions, considering their spatial and temporal variability on monthly, weekly, and diurnal scales. Furthermore, as emission sources change due to changes in technology and regulations, it is necessary to continue updating the inventory and reducing the uncertainty as improved methodology becomes available. For example, McDonald et al. [203] showed that volatile chemical products, including cleaning agents, pesticides, coatings, printing inks, and personal care products, are an emerging source of urban VOCs in industrialized cities, including precursors of secondary organic compounds.
Mexico City updates the emission inventory every two years; the complete inventory is posted on the environmental agency website, including descriptions of the inventory development process and the methodology used [11].
The estimation, evaluation, and continuous updating of the emissions inventory are important areas of opportunity for the management and improvement of air quality in Singapore. A comprehensive inventory that covers all land-based major emission sources (e.g., power stations, refineries, heavy and light industries, waste incinerators, shipyards, construction sites, and petrol stations), emissions from on-road and non-road transport sectors, households, and commercial premises, as well as emissions from vegetation, soil, and ocean (e.g., biogenic NMVOCs and sea spray) will enable authorities to better manage air pollution and evaluate the effectiveness of current and future emission regulations. In February 2015, NEA called for a tender to develop an emissions inventory with such characteristics [204], however its outcome is still unknown.
4.5. Air Quality Modeling and Forecasting
Numerical models are increasingly used to help in designing air quality policies and in evaluating control measures under present and future emission and climatic scenarios. Furthermore, air quality models in concert with ambient monitoring and emission inventories can be used as air pollution forecasting tools. Currently, Mexico City government has implemented an air quality forecasting system to alert the public of high pollution event 24 h in advance, as well as in evaluating emission reduction policies for air quality improvement and other co-benefits [50].
The development and success of such model depends on a reliable ambient monitoring, accurate emission estimates, and a strong knowledge of the chemistry and physics of the local atmosphere. As discussed in Section 3.2.3, Singapore relies on an operational model based on a plume-dispersion open software to forecast transboundary haze from wildfires in the region. A few modeling initiatives have examined Singapore’s air quality within a regional framework using emission estimates at country scale from initiatives such as EDGAR and local records of surface visibility and PM10 data from neighboring countries as a means to validate the model’s output [205,206]. However, the usefulness of the results of such modeling approach are likely limited for environmental policy recommendations.
4.6. Regional Coordination
Air pollution has no boundaries; air pollutants can be transported from city to city, state to state, and across international borders. Established political and administrative institutions have become ineffective in dealing with regional transport of pollutants, which could become an even greater challenge, given the high population growth rates and rapid industrialization and motorization in many cities and megacities, especially in Asia and Africa.
As demonstrated in the MCMA, although the Megalopolis Environmental Commission was established to coordinate the regional air quality programs of Mexico City with the surrounding municipalities of five states, the different jurisdictions and capacity were major barriers for policy implementation.
In Singapore, significant progress has been achieved in recent years for understanding the characteristics and dispersion of the particle pollution triggered by wildfires in the region that reaches the city-island. However, efforts to understand the physical and chemical processes driving the air pollution on regular days are scarce. The wildfire-haze events are sporadic; the latest episode of severe consequences occurred in 2015. Indeed, they are environmental emergencies and deserve full consideration, but attention should be paid also to understand the air pollution dynamics on regular days. Because of Singapore’ geographical location and highly urbanized and industrialized neighbors of Johor Bahru to the north in Malaysia and the Indonesia’s island of Batam to the south, efforts to address Singapore’s air pollution should have a regional scope. Since air pollution is not stopped by political boundaries, the three cities will have to coordinate efforts to develop together effective strategies to solve common air quality problems. This means establishing a regional air quality monitoring network, building an emissions inventory including major and minor sources located under their political jurisdictions, and developing modeling tools for evaluating environmental policies side by side. For instance, to solve the frequent calls of ‘chemical-smell plumes’ by residents living in the northeast side of the island (e.g., [207]), Singapore will have to work together with Johor Bahru to address the air pollution related to the industrial complex of Pasir Gudang located just crossing the Strait of Johor at a distance of 2–3 km from Punggol Town, a district that houses over 150,000 Singapore’s residents.
4.7. Air Pollution Research
International experience indicates that effective environmental actions usually result from important investments in scientific research (see e.g., [14]). A comprehensive characterization of emission sources, chemical processes, transport, and fate of pollutants, together with an improved understanding of the interactions and health effects of the complex air pollutants mixture and urban climatology are crucial for addressing the air pollution challenges experienced currently in Singapore, Mexico City, and many other large cities.
The atmosphere over sub-tropical cities is not well researched and represents an opportunity for Singapore and the MCMA to expand their agendas in environmental research and development. This could include building a research institute for taking such task similar to the Centre for Urban Greenery and Ecology (CUGE), which creates and promotes knowledge to enhance greenery planning, design, and management for Singapore’s landscape and tropical cities in general [208], or the Centre for Climate Research Singapore (CCRS), which investigates the tropical climate variability and associated systems affecting Singapore and the wider Southeast Asia region [209].
In earth and environmental sciences, researchers from universities account for a lower proportion of high-quality research relative to other fields, such as physics and chemistry, while the research output of government institutions is higher [210]. For the particular case of Singapore’s universities, current policies are more focused on achieving excellence through research of global impact rather than performing research of relevance for solving local problems, thus reducing further the role that academia could play for improving air quality.
One of the best practices in the MCMA air quality management is the partnership with national and international scientific communities. As described in Section 2.7, information obtained from scientific studies, including the field measurement campaigns, IMADA-AVER 1997, MCMA-2003, and MILAGRO 2006, provided comprehensive information on the emissions and the transport and transformation of pollutants. The information contributed significantly to the understanding of the emissions and the atmospheric processes leading to the formation of O3, secondary aerosols, and other pollutants in the MCMA, as well as providing insights for other cities and megacities. The scientific findings and policy implications were incorporated in the air quality management programs. This experience demonstrated that the collaboration between national and international scientific communities is an effective way to promote the research needed to understand the physical and chemical processes that drive air pollution at any given city.
As shown in Figure 3, Figure 6 and Figure 7, there was significant improvement in air quality from the 1990s to approximately 2010, despite a significant increase in the vehicle fleet, fuel consumption, and the expansion of the urban area of the MCMA during the same period. However, since 2010, the reduction in O3 and fine PM concentrations have been much lower than in the previous decade, which seems to suggest at least two types of conclusions: Firstly, there have been changes in emissions, meteorology, and atmospheric chemistry in the MCMA. Secondly, the policies implemented in recent years have prevented a rebound in pollution despite urban growth and an increasing motorization trend but have not reduced pollution levels. In order to better understand the changes in the atmospheric chemistry and the processes that currently control the formation of O3 and particulate matter in the MCMA, it will be essential to investigate, through continuous measurements, the sensitivity of O3 to VOC and NOx and if it could have changed in recent years. In addition, a new focused intensive field campaign would help to understand changes in the MCMA atmospheric chemistry, as well as to ensure that the current models provide reliable information on proposed regulatory strategies. As part of the field campaign, it is important to include an in-depth analysis of potential increases in atmospheric temperature on the air quality in the MCMA, as well as to assess the impacts of the urban heat island effect and climate change on atmospheric chemistry and local and regional meteorology [37]. It is worth noting that Los Angeles is facing a similar challenge: After decades of improvement, there is an increase in smog over the last few years; there were 87 consecutive days of smog in 2018. The environmental agencies are planning to study whether climate change is contributing to the smog problem, in addition to enforcing new emission control regulations [32,38].
5. Conclusions
Rapid population growth and increasing energy use by motor vehicles and industrial activities in urban areas generate high levels of pollutants emissions to the atmosphere. The concentrations of people and their activities, coupled with inadequate basic urban services and infrastructure development, have led to severe air pollution in many cities around the world. However, as centers of economic growth, higher education, technological advancement, and innovation, these urban settings also offer unique opportunities to capitalize on the co-benefits that can be achieved by optimizing energy use, reducing air pollution, minimizing greenhouse gas emissions, and bringing many social benefits. However, realizing the benefits will require strong and wide-ranging institutional cooperation, public awareness, and multi-stakeholder participation.
Multiple tools that can be used to manage air quality in urban centers include robust air quality monitoring networks, continuous emissions inventory development, air quality modeling and forecasting, and comprehensive air quality management programs. This article presents some of the effective emissions reduction policies developed and implemented by the Mexico City Metropolitan Area and Singapore, such as advanced control technologies and environmental audit programs for vehicles and industries, driving restriction strategies, environmental audit programs for vehicles and industries, improvements in public transportation infrastructure and planning, land use restoration and sustainable development, use of alternative and improved fuels, among many others. The establishment and enforcement of progressive air quality and emission standards are also important in pursuing air quality goals by encouraging the implementation of emissions reduction action plans.
As presented in this article, the success of any air quality management program relies on a comprehensive understanding of the chemical and physical processes at local and regional scales that control air pollution The available experience shows that fostering scientific collaboration between national and international researchers catalyzes the needed research and increases the local human capacities required for developing, implementing, and evaluating the air quality programs. Overall, the successful implementation of an integrated air quality management program requires the synergistic and trust-based collaboration between the academic community, the government, and the general public.
With appropriate planning, dedicated scientific research, robust emissions control policies, and access to advanced technology and financing schemes, cities confronting environmental problems have the opportunity to learn from the experience and good practices of cities that have successfully addressed similar problems and meet the challenges of economic development, protection of the natural environment, and improvement of the quality of life for their residents.
Author Contributions
LTM suggested the contents of this review article. L.T.M., M.Z., and A.R. prepared the section on Mexico City Metropolitan Area; E.V. prepared the section on Singapore. All authors discussed and contributed to the final manuscript.
Funding
This manuscript received no external funding.
Acknowledgments
The authors would like to acknowledge the Secretary of Environment of the Government of Mexico City for providing the air quality and emissions data used in this article.
Conflicts of Interest
The authors declare no conflict of interest.
References
- United Nations. The World’s Cities in 2018: Data Booklet; Statistical Papers—United Nations (Ser. A), Population and Vital Statistics Report; UN: New York, NY, USA, 2018; ISBN 978-92-1-047610-2. [Google Scholar]
- WHO (World Health Organization). 9 out of 10 People Worldwide Breathe Polluted Air, but More Countries Are Taking Action. Available online: https://www.who.int/news-room/detail/02-05-2018-9-out-of-10-people-worldwide-breathe-polluted-air-but-more-countries-are-taking-action (accessed on 9 July 2019).
- WHO (World Health Organization). Ambient Air Pollution: A Global Assessment of Exposure and Burden of Disease; World Health Organization: Geneva, Switzerland, 2016; p. 121. Available online: http://apps.who.int/iris/bitstream/10665/250141/1/9789241511353-eng.pdf?ua=1 (accessed on 17 April 2017).
- HEI (Health Effects Institute). State of Global Air 2019. Available online: http://stateofglobalair.org/ (accessed on 9 April 2019).
- World Bank GDP per Capita (Current US$). Data—World Bank Open Data. Available online: https://data.worldbank.org/indicator/NY.GDP.PCAP.CD (accessed on 9 July 2019).
- United Nations. 2018 Revision of World Urbanization Prospects. Available online: https://www.un.org/development/desa/publications/2018-revision-of-world-urbanization-prospects.html (accessed on 9 July 2019).
- CDMX (Ciudad de México). Constitución Política de la Ciudad de México. Gaceta Oficial de la Ciudad de México, 1. 5 February 2017. Available online: https://data.consejeria.cdmx.gob.mx/index.php/gaceta (accessed on 17 August 2019).
- DOF (Diario Oficial de la Federación). Convenio de coordinación por el que se crea la Comisión Ambiental Metropolitana 1996. Available online: http://www.dof.gob.mx/ (accessed on 16 April 2019).
- DOF (Diario Oficial de la Federación). Convenio de coordinación por el que se crea la Comisión Ambiental de la Megalópolis, que celebran la Secretaría de Medio Ambiente y Recursos Naturales, el Gobierno del Distrito Federal y los estados de Hidalgo, México, Morelos, Puebla y Tlaxcala 2013. Available online: http://www.dof.gob.mx/ (accessed on 16 April 2019).
- Lezama, J.; Favela, R.; Galindo, L.; Ibarraran, M.; Sanchez, S.; Molina, L.T. Forces driving pollutant emissions in the MCMA. In Air Quality in the Mexico Megacity: An Integrated Assessment; Kluwer Academic Publishers: Dordrecht, The Netherlands, 2002; pp. 61–104. [Google Scholar]
- SEDEMA (Secretaría del Medio Ambiente de la Ciudad de México). Available online: https://www.sedema.cdmx.gob.mx (accessed on 10 July 2019).
- Whiteman, C.D.; Zhong, S.; Bian, X.; Fast, J.D.; Doran, J.C. Boundary layer evolution and regional-scale diurnal circulations over the Mexican plateau. J. Geophys. Res. 2000, 105, 10081–10102. [Google Scholar] [CrossRef]
- De Foy, B.; Varela, J.R.; Molina, L.T.; Molina, M.J. Rapid ventilation of the Mexico City basin and regional fate of the urban plume. Atmos. Chem. Phys. 2006, 6, 2321–2335. [Google Scholar] [CrossRef] [Green Version]
- Molina, L.T.; Molina, M.J. Air Quality in the Mexico Megacity: An Integrated Assessment. Kluwer Academic Publishers: Dordrecht, The Netherlands, 2002; ISBN 978-1-4020-0507-7. [Google Scholar]
- DOF (Diario Oficial de la Federación). Criterio para evaluar la calidad del aire ambiente con respecto al bióxido de nitrógeno (NO2). Valor normado para la concentración de bióxido de nitrógeno (NO2) en el aire ambiente como medida de protección a la salud de la población. Norma Oficial Mexicana NOM-023-SSA1-1993. 1994. Available online: http://www.aire.cdmx.gob.mx/descargas/monitoreo/normatividad/NOM-023-SSA1-1993.pdf (accessed on 2 May 2019).
- DOF (Diario Oficial de la Federación). Criterio para evaluar la calidad del aire ambiente con respecto al monóxido de carbono (CO). Valor permisible para la concentración de monóxido de carbono (CO) en el aire ambiente como medida de protección a la salud de la población. Norma Oficial Mexicana NOM-021-SSA1-1993. 1994. Available online: http://www.aire.cdmx.gob.mx/descargas/monitoreo/normatividad/NOM-021-SSA1-1993.pdf (accessed on 2 May 2019).
- DOF (Diario Oficial de la Federación). Criterio para evaluar la calidad del aire ambiente, con respecto al plomo (Pb). Valor normado para la concentración de plomo (Pb) en el aire ambiente, como medida de protección a la salud de la población. Norma Oficial Mexicana NOM-026-SSA1-1993. 1994. Available online: http://www.aire.cdmx.gob.mx/descargas/monitoreo/normatividad/NOM-026-SSA1-1993.pdf (accessed on 2 May 2019).
- DOF (Diario Oficial de la Federación). Criterio para evaluar la calidad del aire ambiente, con respecto al dióxido de azufre (SO2). Valor normado para la concentración de dióxido de azufre (SO2) en el aire ambiente, como medida de protección a la salud de la población. Norma Oficial Mexicana NOM-022-SSA1-2010. 2010. Available online: http://www.aire.cdmx.gob.mx/descargas/monitoreo/normatividad/NOM-022-SSA1-2010.pdf (accessed on 2 May 2019).
- DOF (Diario Oficial de la Federación). Valor límite permisible para la concentración de ozono (O3) en el aire ambiente y criterios para su evaluación. Norma Oficial Mexicana NOM-020-SSA1-2014. 2014. Available online: http://www.aire.cdmx.gob.mx/descargas/monitoreo/normatividad/NOM-020-SSA1-2014.pdf (accessed on 2 May 2019).
- DOF (Diario Oficial de la Federación). Valores límites permisibles para la concentración de partículas suspendidas PM10 y PM2.5 en el aire ambiente y criterios para su evaluación. Norma Oficial Mexicana NOM-025-SSA1-2014. 2014. Available online: http://www.aire.cdmx.gob.mx/descargas/monitoreo/normatividad/NOM-025-SSA1-2014.pdf (accessed on 2 May 2019).
- WHO (World Health Organization). Air Quality Guidelines, Global Update 2005; World Health Organization: Geneva, Switzerland, 2006; p. 22. Available online: https://www.who.int/phe/health_topics/outdoorair/outdoorair_aqg/en/ (accessed on 20 April 2019).
- SIMAT (Sistema de Monitoreo Atmosférico). Available online: http://www.aire.cdmx.gob.mx/ (accessed on 10 July 2019).
- Bravo, A.H. Variation of different pollutants in the atmosphere of Mexico City. J. Air Pollut. Control Assoc. 1960, 10, 447–449. [Google Scholar] [CrossRef]
- Velasco, E.; Retama, A. Ozone’s threat hits back Mexico City. Sustain. Cities Soc. 2017, 31, 260–263. [Google Scholar] [CrossRef]
- Inventario de Emisiones de la CDMX, 2016; SEDEMA (Secretaría del Medio Ambiente del Gobierno de la Ciudad de México): Ciudad de México, Mexico, 2018; Available online: http://www.aire.cdmx.gob.mx/default.php?opc=Z6BhnmI=&dc=Zg== (accessed on 7 July 2019).
- US-EPA (US Environmental Protection Agency). Available online: https://www.epa.gov/moves (accessed on 10 July 2019).
- DOF (Diario Oficial de la Federación). Ley Federal para Prevenir y Controlar la Contaminación Ambiental 1971. Available online: http://saludpublica.mx/index.php/spm/article/view/2188/2078 (accessed on 8 July 2019).
- CAA (Clean Air Act). Clean Air Act Extension of 1970. 1970. Available online: https://www.govinfo.gov/content/pkg/STATUTE-84/pdf/STATUTE-84-Pg1676.pdf (accessed on 16 April 2019).
- UNEP and WHO (United Nations Environment Program and World Health Organization). Urban Air Pollution in Megacities of the World: Earthwatch: Global Environment Monitoring System; World Health Organization, United Nations Environment Programme, Eds.; Published on behalf of World Health Organization and United Nations Environment Programme by Blackwell Reference: Oxford, UK, 1992; ISBN 978-0-631-18404-1. [Google Scholar]
- DOF (Diario Oficial de la Federación). Ley General del Equilibrio Ecológico y la Protección al Ambiente 1988. Available online: http://www.diputados.gob.mx/LeyesBiblio/pdf/148_050618.pdf (accessed on 16 April 2019).
- Haagen-Smit, A.J. Chemistry and Physiology of Los Angeles Smog. Ind. Eng. Chem. 1952, 44, 1342–1346. [Google Scholar] [CrossRef]
- CARB (California Air Resources Board). Available online: https://ww2.arb.ca.gov/ (accessed on 10 July 2019).
- DDF (Departamento del Distrito Federal). Programa Integral Contra la Contaminación Atmosférica: Un Compromiso Común (PICCA); Departamento del Distrito Federal: Mexico City, Mexico, 1990; pp. 1–77. Available online: http://www.aire.cdmx.gob.mx/descargas/publicaciones/gestion-ambiental-aire-memoria-documental-2001-2006/descargas/programa_integral_contra_la_contaminacion_atmosferica.pdf (accessed on 8 July 2019).
- DDF (Departamento del Distrito Federal). Programa para Mejorar la Calidad del Aire en el Valle de México, 1995–2000 (PROAIRE); Mexico City, Gobierno del Estado de México, Secretaría de Medio Ambiente, Recursos Naturales y Pesca, Secretaría de Salud: CDMX. 1996. Available online: http://www.aire.cdmx.gob.mx/descargas/publicaciones/gestion-ambiental-aire-memoria-documental-2001-2006/descargas/proaire_2002-2010.pdf (accessed on 8 July 2019).
- CAM (Comisión Ambiental Metropolitana). Programa para Mejorar la Calidad del Aire de la Zona Metropolitana del Valle de México 2002–2010; DF, GEMEX, SEMARNAT, SS: CDMX. 2002. Available online: http://www.aire.cdmx.gob.mx/ (accessed on 27 June 2019).
- CAM (Comisión Ambiental Metropolitana). Programa para mejorar la calidad del aire de la Zona Metropolitana del Valle de México 2011–2020. CDMX. 2011. Available online: http://www.aire.cdmx.gob.mx/ (accessed on 27 June 2019).
- SEDEMA (Secretaría del Medio Ambiente del Gobierno de la Ciudad de México). Taller para la Evaluación del PROARIE 2011–2020, Identificación de Estrategias para Mejorar la Calidad del Aire de la CDMX. Ciudad de México. 2018. Available online: http://www.aire.cdmx.gob.mx/ (accessed on 28 June 2019).
- SCAQMD (South Coast Air Quality Management District). Available online: http://www.aqmd.gov (accessed on 10 July 2019).
- DSS (Department of Statistics Singapore). Available online: https://www.singstat.gov.sg/ (accessed on 10 July 2019).
- DOF (Diario Oficial de la Federación) Especificaciones de Calidad de Los petrolíferos. Norma Oficial Mexicana NOM-016-CRE-2016. Available online: http://www.dof.gob.mx/nota_detalle.php?codigo=5450011&fecha=29/08/2016 (accessed on 12 July 2019).
- Gakenheimer, R.; Molina, L.T.; Sussman, J.; Zegras, C.; Howitt, A.; Makler, J.; Lacy, R.; Slott, R.; Villegas, A.; Molina, M.J.; et al. The MCMA transportation system: Mobility and air pollution. In Air Quality in the Mexico Megacity: An Integrated Assessment. Kluwer Academic Publishers: Dordrecht, The Netherlands, 2002; ISBN 978-1-4020-0507-7. [Google Scholar]
- CDMX (Ciudad de México) Aviso por el que se da a Conocer el Programa de Verificación Vehicular Obligatoria para el Segundo Semestre del año 2019. Available online: https://www.sedema.cdmx.gob.mx/storage/app/media/comunicacion-social/PVVO%202%20SEM%2019.pdf (accessed on 7 July 2019).
- CAMe (Comisión Ambiental de la Megalópolis). Medidas Inmediatas para Mejorar la Calidad del Aire en la Zona Metropolitana del Valle de México. CDMX. 2019. Available online: http://dsiappsdev.semarnat.gob.mx/datos/portal/publicaciones/2019/Medidas_prioritarias_ZMVM.pdf (accessed on 7 July 2019).
- Blake, D.R.; Rowland, F.S. Urban leakage of liquefied petroleum gas and its impact on Mexico City air quality. Science 1995, 269, 953–956. [Google Scholar] [CrossRef] [PubMed]
- Velasco, E.; Lamb, B.; Westberg, H.; Allwine, E.; Sosa, G.; Arriaga-Colina, J.L.; Jobson, B.T.; Alexander, M.L.; Prazeller, P.; Knighton, W.B.; et al. Distribution, magnitudes, reactivities, ratios and diurnal patterns of volatile organic compounds in the Valley of Mexico during the MCMA 2002 & 2003 field campaigns. Atmos. Chem. Phys. 2007, 7, 329–353. [Google Scholar] [Green Version]
- Jaimes-Palomera, M.; Retama, A.; Elias-Castro, G.; Neria-Hernández, A.; Rivera-Hernández, O.; Velasco, E. Non-methane hydrocarbons in the atmosphere of Mexico City: Results of the 2012 ozone-season campaign. Atmos. Environ. 2016, 132, 258–275. [Google Scholar] [CrossRef] [Green Version]
- Diagnóstico de Equipos a Gas L.P. y Actualización de Factores de Emisión de Fugas y Combustión de Gas L.P; en Viviendas de la ZMVM. Secretaría del Medio Ambiente; SEDEMA (Secretaría del Medio Ambiente del Gobierno de la Ciudad de México): Ciudad de México, Mexico, 2016.
- CDMX (Ciudad de México). Aviso por el que se da a Conocer el Programa para Prevenir y Responder a Contingencias Ambientales Atmosféricas en la Ciudad de México 2019. Available online: http://www.aire.cdmx.gob.mx/descargas/ultima-hora/calidad-aire/pcaa/Gaceta_Oficial_CDMX.pdf (accessed on 16 June 2019).
- SEDEMA (Secretaría del Medio Ambiente del Gobierno de la Ciudad de México). Calidad del Aire en la Ciudad de México, Informe 2016. Dirección General de Gestión de la Calidad del Aire, Dirección de Monitoreo Atmosférico. Ciudad de México. November 2017, pp. 152–164. Available online: http://www.aire.cdmx.gob.mx/descargas/publicaciones/flippingbook/informe-2016-calidad-del-aire-en-la-ciudad-de-mexico/ (accessed on 7 July 2019).
- SEDEMA (Secretaría del Medio Ambiente de la Ciudad de México). Pronóstico de Calidad del Aire y Meteorológico para la CDMX. Available online: http://www.aire.cdmx.gob.mx/pronostico-aire/ (accessed on 10 July 2019).
- De Foy, B.; Krotkov, N.A.; Bei, N.; Herndon, S.C.; Huey, L.G.; Martínez, A.-P.; Ruiz-Suárez, L.G.; Wood, E.C.; Zavala, M.; Molina, L.T. Hit from both sides: Tracking industrial and volcanic plumes in Mexico City with surface measurements and OMI SO2 retrievals during the MILAGRO field campaign. Atmos. Chem. Phys. 2009, 9, 9599–9617. [Google Scholar] [CrossRef]
- Salcedo, D.; Alvarez-Ospina, H.; Peralta, O.; Castro, T. PM1 Chemical Characterization during the ACU15 Campaign, South of Mexico City. Atmosphere 2018, 9, 232. [Google Scholar] [CrossRef]
- INEGI (Instituto Nacional de Estadística Geografía). Encuesta Origen-Destino en Hogares de la Zona Metropolitana del Valle de México (EOD 2017). Available online: http://www.beta.inegi.org.mx/proyectos/enchogares/especiales/eod/2017/ (accessed on 8 July 2019).
- El Poder del Consumidor Cae Velocidad en Principales Rutas del Valle de México. Available online: https://elpoderdelconsumidor.org/2012/11/cae-velocidad-rutas-valle-de-mexico/ (accessed on 4 July 2019).
- Barth, M.; Boriboonsomsin, K. Access. 2009, pp. 2–10. Available online: http://www.accessmagazine.org/fall-2009/traffic-congestion-greenhouse-gases/ (accessed on 8 July 2019).
- Velasco, E.; Retama, A.; Segovia, E.; Ramos, R. Particle exposure and inhaled dose while commuting in Mexico City by public transport. Submitt. Atmos. Environ. 2019. [Google Scholar]
- Molina, L.T.; de Foy, B.; Vazquez-Martinez, O.; Paramo-Figueroa, V.H. Air quality, weather and climate in Mexico City. WMO Bull. 2009, 58, 48–53. [Google Scholar]
- SPH-Harvard (School of Public Health Harvard). Análisis Histórico de Los Beneficios para la Salud Asociados a Una Mejor Calidad del Aire en la Ciudad de México (CDMX) Entre 1990 y 2015. Secretaría del Medio Ambiente del Gobierno del Distrito Federal: CDMX, 2016. Available online: http://www.data.sedema.cdmx.gob.mx/beneficios-en-salud-por-la-mejora-de-la-calidad-del-aire/descargas/analisis-espanol.pdf (accessed on 7 July 2019).
- Evans, J.; Hammitt, J.; Rojas-Bracho, L.; Dockery, D. Historical Analysis of Air Quality-Related Health Benefits in the Population in Mexico City from 1990 to 2012. Phases IV and IIIa. Phase IV. Public Policy and Economic Valuation of the Health Benefits of Air Quality Improvements; Secretaría del Medio Ambiente: Mexico City, Mexico, 2017; ACCSG/016A/2017. [Google Scholar]
- Streit, G.E.; Guzmán, F. Mexico City Air quality: Progress of an international collaborative project to define air quality management options. Atmos. Environ. 1996, 30, 723–733. [Google Scholar] [CrossRef]
- Doran, J.C.; Abbott, S.; Archuleta, J.; Bian, X.; Chow, J.; Coulter, R.L.; de Wekker, S.F.J.; Edgerton, S.; Elliott, S.; Fernandez, A.; et al. The IMADA-AVER Boundary Layer Experiment in the Mexico City Area. Bull. Am. Meteor. Soc. 1998, 79, 2497–2508. [Google Scholar] [CrossRef]
- Edgerton, S.A.; Bian, X.; Doran, J.C.; Fast, J.D.; Hubbe, J.M.; Malone, E.L.; Shaw, W.J.; Whiteman, C.D.; Zhong, S.; Arriaga, J.L.; et al. Particulate Air Pollution in Mexico City: A Collaborative Research Project. J. Air Waste Manag. Assoc. 1999, 49, 1221–1229. [Google Scholar] [CrossRef] [PubMed] [Green Version]
- Molina, L.T.; Kolb, C.E.; de Foy, B.; Lamb, B.K.; Brune, W.H.; Jimenez, J.L.; Ramos-Villegas, R.; Sarmiento, J.; Paramo-Figueroa, V.H.; Cardenas, B.; et al. Air quality in North America’s most populous city; overview of the MCMA-2003 campaign. Atmos. Chem. Phys. 2007, 7, 2447–2473. [Google Scholar] [CrossRef]
- Molina, L.T.; Madronich, S.; Gaffney, J.S.; Apel, E.; de Foy, B.; Fast, J.; Ferrare, R.; Herndon, S.; Jimenez, J.L.; Lamb, B.; et al. An overview of the MILAGRO 2006 Campaign: Mexico City emissions and their transport and transformation. Atmos. Chem. Phys. 2010, 10, 8697–8760. [Google Scholar] [CrossRef] [Green Version]
- Singh, H.B.; Brune, W.H.; Crawford, J.H.; Flocke, F.; Jacob, D.J. Chemistry and transport of pollution over the Gulf of Mexico and the Pacific: Spring 2006 INTEX-B campaign overview and first results. Atmos. Chem. Phys. 2009, 9, 2301–2318. [Google Scholar] [CrossRef]
- De Foy, B.; Caetano, E.; Magaña, V.; Zitácuaro, A.; Cárdenas, B.; Retama, A.; Ramos, R.; Molina, L.T.; Molina, M.J. Mexico City basin wind circulation during the MCMA-2003 field campaign. Atmos. Chem. Phys. 2005, 5, 2267–2288. [Google Scholar] [CrossRef] [Green Version]
- De Foy, B.; Fast, J.D.; Paech, S.J.; Phillips, D.; Walters, J.T.; Coulter, R.L.; Martin, T.J.; Pekour, M.S.; Shaw, W.J.; Kastendeuch, P.P.; et al. Basin-scale wind transport during the MILAGRO field campaign and comparison to climatology using cluster analysis. Atmos. Chem. Phys. 2008, 8, 1209–1224. [Google Scholar] [CrossRef] [Green Version]
- García-Franco, J.L.; Stremme, W.; Bezanilla, A.; Ruiz-Angulo, A.; Grutter, M. Variability of the mixed-layer height over Mexico City. Bound. Layer Meteorol. 2018, 167, 493–507. [Google Scholar] [CrossRef]
- Barrett, B.S.; Raga, G.B. Variability of winter and summer surface ozone in Mexico City on the intraseasonal timescale. Atmos. Chem. Phys. 2016, 16, 15359–15370. [Google Scholar] [CrossRef] [Green Version]
- Barrett, B.S.; Raga, G.B.; Retama, A.; Leonard, C. A Multiscale Analysis of the Tropospheric and Stratospheric Mechanisms Leading to the March 2016 Extreme Surface Ozone Event in Mexico City. J. Geophys. Res. Atmos. 2019, 124, 4782–4799. [Google Scholar] [CrossRef]
- Zavala, M.; Herndon, S.C.; Wood, E.C.; Onasch, T.B.; Knighton, W.B.; Marr, L.C.; Kolb, C.E.; Molina, L.T. Evaluation of mobile emissions contributions to Mexico City’s emissions inventory using on-road and cross-road emission measurements and ambient data. Atmos. Chem. Phys. 2009, 9, 6305–6317. [Google Scholar] [CrossRef]
- Zavala, M.; Herndon, S.C.; Slott, R.S.; Dunlea, E.J.; Marr, L.C.; Shorter, J.H.; Zahniser, M.; Knighton, W.B.; Rogers, T.M.; Kolb, C.E.; et al. Characterization of on-road vehicle emissions in the Mexico City Metropolitan Area using a mobile laboratory in chase and fleet average measurement modes during the MCMA-2003 field campaign. Atmos. Chem. Phys. 2006, 6, 5129–5142. [Google Scholar] [CrossRef] [Green Version]
- Guevara, M.; Tena, C.; Soret, A.; Serradell, K.; Guzmán, D.; Retama, A.; Camacho, P.; Jaimes-Palomera, M.; Mediavilla, A. An emission processing system for air quality modelling in the Mexico City Metropolitan Area: Evaluation and comparison of the MOBILE6.2-Mexico and MOVES-Mexico traffic emissions. Sci. Total Environ. 2017, 584, 882–900. [Google Scholar] [CrossRef]
- Velasco, E.; Lamb, B.; Pressley, S.; Allwine, E.; Westberg, H.; Jobson, B.T.; Alexander, M.; Prazeller, P.; Molina, L.T.; Molina, M.J. Flux measurements of volatile organic compounds from an urban landscape. Geophys. Res. Lett. 2005, 32, L20802. [Google Scholar] [CrossRef]
- Velasco, E.; Pressley, S.; Grivicke, R.; Allwine, E.; Coons, T.; Foster, W.; Jobson, B.T.; Westberg, H.; Ramos, R.; Hernández, F.; et al. Eddy covariance flux measurements of pollutant gases in urban Mexico City. Atmos. Chem. Phys. 2009, 9, 7325–7342. [Google Scholar] [CrossRef] [Green Version]
- Zalakeviciute, R.; Alexander, M.L.; Allwine, E.; Jimenez, J.L.; Jobson, B.T.; Molina, L.T.; Nemitz, E.; Pressley, S.N.; Van Reken, T.M.; Ulbrich, I.M.; et al. Chemically-resolved aerosol eddy covariance flux measurements in urban Mexico City during MILAGRO 2006. Atmos. Chem. Phys. 2012, 12, 7809–7823. [Google Scholar] [CrossRef] [Green Version]
- Karl, T.; Apel, E.; Hodzic, A.; Riemer, D.D.; Blake, D.R.; Wiedinmyer, C. Emissions of volatile organic compounds inferred from airborne flux measurements over a megacity. Atmos. Chem. Phys. 2009, 9, 271–285. [Google Scholar] [CrossRef] [Green Version]
- Velasco, E.; Perrusquia, R.; Jiménez, E.; Hernández, F.; Camacho, P.; Rodríguez, S.; Retama, A.; Molina, L.T. Sources and sinks of carbon dioxide in a neighborhood of Mexico City. Atmos. Environ. 2014, 97, 226–238. [Google Scholar] [CrossRef]
- Jobson, B.T.; Volkamer, R.A.; Velasco, E.; Allwine, G.; Westberg, H.; Lamb, B.K.; Alexander, M.L.; Berkowitz, C.M.; Molina, L.T. Comparison of aromatic hydrocarbon measurements made by PTR-MS, DOAS and GC-FID during the MCMA 2003 Field Experiment. Atmos. Chem. Phys. 2010, 10, 1989–2005. [Google Scholar] [CrossRef] [Green Version]
- Volkamer, R.; Molina, L.T.; Molina, M.J.; Shirley, T.; Brune, W.H. DOAS measurement of glyoxal as an indicator for fast VOC chemistry in urban air. Geophys. Res. Lett. 2005, 32, L08806. [Google Scholar] [CrossRef]
- Garcia, A.R.; Volkamer, R.; Molina, L.T.; Molina, M.J.; Samuelson, J.; Mellqvist, J.; Galle, B.; Herndon, S.C.; Kolb, C.E. Separation of emitted and photochemical formaldehyde in Mexico City using a statistical analysis and a new pair of gas-phase tracers. Atmos. Chem. Phys. 2006, 6, 4545–4557. [Google Scholar] [CrossRef] [Green Version]
- De Gouw, J.A.; Welsh-Bon, D.; Warneke, C.; Kuster, W.C.; Alexander, L.; Baker, A.K.; Beyersdorf, A.J.; Blake, D.R.; Canagaratna, M.; Celada, A.T.; et al. Emission and chemistry of organic carbon in the gas and aerosol phase at a sub-urban site near Mexico City in March 2006 during the MILAGRO study. Atmos. Chem. Phys. 2009, 9, 3425–3442. [Google Scholar] [CrossRef] [Green Version]
- Fortner, E.C.; Zheng, J.; Zhang, R.; Berk Knighton, W.; Volkamer, R.M.; Sheehy, P.; Molina, L.; André, M. Measurements of Volatile Organic Compounds Using Proton Transfer Reaction—Mass Spectrometry during the MILAGRO 2006 Campaign. Atmos. Chem. Phys. 2009, 9, 467–481. [Google Scholar] [CrossRef]
- Apel, E.C.; Emmons, L.K.; Karl, T.; Flocke, F.; Hills, A.J.; Madronich, S.; Lee-Taylor, J.; Fried, A.; Weibring, P.; Walega, J.; et al. Chemical evolution of volatile organic compounds in the outflow of the Mexico City Metropolitan area. Atmos. Chem. Phys. 2010, 10, 2353–2375. [Google Scholar] [CrossRef] [Green Version]
- Bon, D.M.; Ulbrich, I.M.; de Gouw, J.A.; Warneke, C.; Kuster, W.C.; Alexander, M.L.; Baker, A.; Beyersdorf, A.J.; Blake, D.; Fall, R.; et al. Measurements of volatile organic compounds at a suburban ground site (T1) in Mexico City during the MILAGRO 2006 campaign: Measurement comparison, emission ratios, and source attribution. Atmos. Chem. Phys. 2011, 11, 2399–2421. [Google Scholar] [CrossRef]
- Garzón, J.P.; Huertas, J.I.; Magaña, M.; Huertas, M.E.; Cárdenas, B.; Watanabe, T.; Maeda, T.; Wakamatsu, S.; Blanco, S. Volatile organic compounds in the atmosphere of Mexico City. Atmos. Environ. 2015, 119, 415–429. [Google Scholar] [CrossRef] [Green Version]
- Shirley, T.R.; Brune, W.H.; Ren, X.; Mao, J.; Lesher, R.; Cardenas, B.; Volkamer, R.; Molina, L.T.; Molina, M.J.; Lamb, B.; et al. Atmospheric oxidation in the Mexico City Metropolitan Area (MCMA) during April 2003. Atmos. Chem. Phys. 2006, 6, 2753–2765. [Google Scholar] [CrossRef] [Green Version]
- Dusanter, S.; Vimal, D.; Stevens, P.S.; Volkamer, R.; Molina, L.T.; Baker, A.; Meinardi, S.; Blake, D.; Sheehy, P.; Merten, A.; et al. Measurements of OH and HO2 concentrations during the MCMA-2006 field campaign—Part 2: Model comparison and radical budget. Atmos. Chem. Phys. 2009, 9, 6655–6675. [Google Scholar] [CrossRef]
- Volkamer, R.; Sheehy, P.; Molina, L.T.; Molina, M.J. Oxidative capacity of the Mexico City atmosphere—Part 1: A radical source perspective. Atmos. Chem. Phys. 2010, 10, 6969–6991. [Google Scholar] [CrossRef]
- Lei, W.; de Foy, B.; Zavala, M.; Volkamer, R.; Molina, L.T. Characterizing ozone production in the Mexico City Metropolitan Area: A case study using a chemical transport model. Atmos. Chem. Phys. 2007, 7, 1347–1366. [Google Scholar] [CrossRef]
- Lei, W.; Zavala, M.; de Foy, B.; Volkamer, R.; Molina, L.T. Characterizing ozone production and response under different meteorological conditions in Mexico City. Atmos. Chem. Phys. 2008, 8, 7571–7581. [Google Scholar] [CrossRef] [Green Version]
- Song, J.; Lei, W.; Bei, N.; Zavala, M.; de Foy, B.; Volkamer, R.; Cardenas, B.; Zheng, J.; Zhang, R.; Molina, L.T. Ozone response to emission changes: A modeling study during the MCMA-2006/MILAGRO Campaign. Atmos. Chem. Phys. 2010, 10, 3827–3846. [Google Scholar] [CrossRef]
- Mena-Carrasco, M.; Carmichael, G.R.; Campbell, J.E.; Zimmerman, D.; Tang, Y.; Adhikary, B.; D’allura, A.; Molina, L.T.; Zavala, M.; García, A.; et al. Assessing the regional impacts of Mexico City emissions on air quality and chemistry. Atmos. Chem. Phys. 2009, 9, 3731–3743. [Google Scholar] [CrossRef] [Green Version]
- García-Yee, J.S.; Torres-Jardón, R.; Barrera-Huertas, H.; Castro, T.; Peralta, O.; García, M.; Gutiérrez, W.; Robles, M.; Torres-Jaramillo, J.A.; Ortínez-Álvarez, A.; et al. Characterization of NOx-Ox relationships during daytime interchange of air masses over a mountain pass in the Mexico City megalopolis. Atmos. Environ. 2018, 177, 100–110. [Google Scholar] [CrossRef]
- Aiken, A.C.; de Foy, B.; Wiedinmyer, C.; DeCarlo, P.F.; Ulbrich, I.M.; Wehrli, M.N.; Szidat, S.; Prevot, A.S.H.; Noda, J.; Wacker, L.; et al. Mexico City aerosol analysis during MILAGRO using high resolution aerosol mass spectrometry at the urban supersite (T0)—Part 2: Analysis of the biomass burning contribution and the non-fossil carbon fraction. Atmos. Chem. Phys. 2010, 10, 5315–5341. [Google Scholar] [CrossRef]
- Querol, X.; Pey, J.; Minguillón, M.C.; Pérez, N.; Alastuey, A.; Viana, M.; Moreno, T.; Bernabé, R.M.; Blanco, S.; Cárdenas, B.; et al. PM speciation and sources in Mexico during the MILAGRO-2006 Campaign. Atmos. Chem. Phys. 2008, 8, 111–128. [Google Scholar] [CrossRef] [Green Version]
- Volkamer, R.; Jimenez, J.L.; San Martini, F.; Dzepina, K.; Zhang, Q.; Salcedo, D.; Molina, L.T.; Worsnop, D.R.; Molina, M.J. Secondary organic aerosol formation from anthropogenic air pollution: Rapid and higher than expected. Geophys. Res. Lett. 2006, 33, L17811. [Google Scholar] [CrossRef]
- Tsimpidi, A.P.; Karydis, V.A.; Zavala, M.; Lei, W.; Molina, L.; Ulbrich, I.M.; Jimenez, J.L.; Pandis, S.N. Evaluation of the volatility basis-set approach for the simulation of organic aerosol formation in the Mexico City Metropolitan Area. Atmos. Chem. Phys. 2010, 10, 525–546. [Google Scholar] [CrossRef]
- Li, G.; Zavala, M.; Lei, W.; Tsimpidi, A.P.; Karydis, V.A.; Pandis, S.N.; Canagaratna, M.R.; Molina, L.T. Simulations of organic aerosol concentrations in Mexico City using the WRF-CHEM model during the MCMA-2006/MILAGRO campaign. Atmos. Chem. Phys. 2011, 11, 3789–3809. [Google Scholar] [CrossRef] [Green Version]
- Guerrero, F.; Alvarez-Ospina, H.; Armando, R.; López-Medina, A.; Telma, C.; Salcedo, D. Seasonal changes in the PM1 chemical composition north of Mexico City. Atmósfera 2017, 30, 243–258. [Google Scholar] [CrossRef] [Green Version]
- Cady-Pereira, K.E.; Payne, V.H.; Neu, J.L.; Bowman, K.W.; Miyazaki, K.; Marais, E.A.; Kulawik, S.; Tzompa-Sosa, Z.A.; Hegarty, J.D. Seasonal and spatial changes in trace gases over megacities from Aura TES observations: Two case studies. Atmos. Chem. Phys. 2017, 17, 9379–9398. [Google Scholar] [CrossRef]
- SEDEMA (Secretaría del Medio Ambiente del Gobierno de la Ciudad de México). Calidad del Aire en la Ciudad de México, Informe 2017. Dirección General de Gestión de la Calidad del Aire, Dirección de Monitoreo Atmosférico. Ciudad de México: Octubre. 2018, pp. 99–104. Available online: http://www.aire.cdmx.gob.mx/default.php?opc=Z6BhnmI= (accessed on 28 June 2019).
- Retama, A.; Neria-Hernández, A.; Jaimes-Palomera, M.; Rivera-Hernández, O.; Sánchez-Rodríguez, M.; López-Medina, A.; Velasco, E. Fireworks: A major source of inorganic and organic aerosols during Christmas and New Year in Mexico City. Atmos. Environ. X 2019, 2, 100013. [Google Scholar] [CrossRef]
- Marley, N.A.; Gaffney, J.S.; Castro, T.; Salcido, A.; Frederick, J. Measurements of aerosol absorption and scattering in the Mexico City Metropolitan Area during the MILAGRO field campaign: A comparison of results from the T0 and T1 sites. Atmos. Chem. Phys. 2009, 9, 189–206. [Google Scholar] [CrossRef]
- Paredes-Miranda, G.; Arnott, W.P.; Jimenez, J.L.; Aiken, A.C.; Gaffney, J.S.; Marley, N.A. Primary and secondary contributions to aerosol light scattering and absorption in Mexico City during the MILAGRO 2006 campaign. Atmos. Chem. Phys. 2009, 9, 3721–3730. [Google Scholar] [CrossRef] [Green Version]
- Paredes-Miranda, G.; Arnott, W.P.; Moosmüller, H.; Green, M.C.; Gyawali, M. Black Carbon Aerosol Concentration in Five Cities and Its Scaling with City Population. Bull. Am. Meteor. Soc. 2013, 94, 41–50. [Google Scholar] [CrossRef] [Green Version]
- Retama, A.; Baumgardner, D.; Raga, G.B.; McMeeking, G.R.; Walker, J.W. Seasonal and diurnal trends in black carbon properties and co-pollutants in Mexico City. Atmos. Chem. Phys. 2015, 15, 9693–9709. [Google Scholar] [CrossRef] [Green Version]
- De Almeida Castanho, A.D.; Prinn, R.; Martins, V.; Herold, M.; Ichoku, C.; Molina, L.T. Analysis of Visible/SWIR surface reflectance ratios for aerosol retrievals from satellite in Mexico City urban area. Atmos. Chem. Phys. 2007, 7, 5467–5477. [Google Scholar] [CrossRef] [Green Version]
- Quintana, R.; Serrano, J.; Gómez, V.; de Foy, B.; Miranda, J.; Garcia-Cuellar, C.; Vega, E.; Vázquez-López, I.; Molina, L.T.; Manzano-León, N.; et al. The oxidative potential and biological effects induced by PM10 obtained in Mexico City and at a receptor site during the MILAGRO Campaign. Environ. Pollut. 2011, 159, 3446–3454. [Google Scholar] [CrossRef] [PubMed]
- Calderón-Garcidueñas, L.; González-Maciel, A.; Reynoso-Robles, R.; Kulesza, R.J.; Mukherjee, P.S.; Torres-Jardón, R.; Rönkkö, T.; Doty, R.L. Alzheimer’s disease and alpha-synuclein pathology in the olfactory bulbs of infants, children, teens and adults ≤40 years in Metropolitan Mexico City. APOE4 carriers at higher risk of suicide accelerate their olfactory bulb pathology. Environ. Res. 2018, 166, 348–362. [Google Scholar] [CrossRef] [PubMed]
- Calderón-Garcidueñas, L.; Solt, A.C.; Henríquez-Roldán, C.; Torres-Jardón, R.; Nuse, B.; Herritt, L.; Villarreal-Calderón, R.; Osnaya, N.; Stone, I.; García, R.; et al. Long-term Air Pollution Exposure Is Associated with Neuroinflammation, an Altered Innate Immune Response, Disruption of the Blood-Brain Barrier, Ultrafine Particulate Deposition, and Accumulation of Amyloid β-42 and α-Synuclein in Children and Young Adults. Toxicol. Pathol. 2008, 36, 289–310. [Google Scholar] [CrossRef] [PubMed]
- O´Neill, M.S.; Osornio-Vargas, A.; Buxton, M.A.; Sánchez, B.N.; Rojas-Bracho, L.; Castillo-Castrejon, M.; Mordhukovich, I.B.; Brown, D.G.; Vadillo-Ortega, F. Air pollution, inflammation and preterm birth in Mexico City: Study design and methods. Sci. Total Environ. 2013, 448, 79–83. [Google Scholar] [CrossRef] [PubMed]
- Cromar, K. Development of an Indicator to Identify the Association between Air Pollution and Health Effects in Mexico City; Marron Institute of Urban Management: Mexico City, Mexico, 2018; Available online: http://www.aire.cdmx.gob.mx/conoce-tu-numero-iner/ (accessed on 9 July 2019).
- Lim, W.D.; Tan, G.H. A Resilient Singapore; Centre for Liveable Cities Singapore: Singapore, 2018; ISBN 978-981-11-7810-8. [Google Scholar]
- Craig, L.; Brook, J.R.; Chiotti, Q.; Croes, B.; Gower, S.; Hedley, A.; Krewski, D.; Krupnick, A.; Krzyzanowski, M.; Moran, M.D.; et al. Air Pollution and Public Health: A guidance document for risk managers. J. Toxicol. Environ. Health Part A 2008, 71, 588–698. [Google Scholar] [CrossRef] [PubMed]
- Velasco, E.; Roth, M. Review of Singapore’s air quality and greenhouse gas emissions: Current situation and opportunities. J. Air Waste Manag. Assoc. 2012, 62, 625–641. [Google Scholar] [CrossRef] [PubMed]
- Velasco, E.; Rastan, S. Air quality in Singapore during the 2013 smoke-haze episode over the Strait of Malacca: Lessons learned. Sustain. Cities Soc. 2015, 17, 122–131. [Google Scholar] [CrossRef]
- SAGC (Singapore Attorney General’s Chambers). Environmental Protection and Management Act (Chapter 94A); The Statutes of the Republic of Singapore; 31 December 2002. Available online: https://sso.agc.gov.sg/Act/EPMA1999 (accessed on 10 July 2019).
- ASEAN (Association of Southeast Asian Nations). ASEAN Agreement on Transboundary Haze Pollution; The ASEAN Secretariat: Jakarta, Indonesia, 2016; Available online: http://haze.asean.org/2016/09/asean-agreement-on-transboundary-haze-pollution-2/ (accessed on 10 July 2019).
- SAGC (Singapore Attorney General’s Chambers). Transboundary Haze Pollution Act 2014. Government of Singapore; 26 September 2014. Available online: https://sso.agc.gov.sg/Act/THPA2014 (accessed on 10 July 2019).
- SURA (Singapore Urban Redevelopment Authority) Draft Master Plan 2019. 2019. Available online: https://www.ura.gov.sg/Corporate/ (accessed on 10 July 2019).
- MEWR and MND (Ministry of the Environment and Water Resources and Ministry of National Development). Sustainable Singapore Blueprint 2015. Available online: https://www.mewr.gov.sg/ssb/home (accessed on 9 July 2019).
- Yee, A.T.K.; Corlett, R.T.; Liew, S.C.; Tan, H.T.W. The vegetation of Singapore—An updated map. Gard. Bull. Singap. 2011, 63, 205–212. [Google Scholar]
- Chow, W.T.L.; Roth, M. Temporal dynamics of the urban heat island of Singapore. Int. J. Climatol. 2006, 26, 2243–2260. [Google Scholar] [CrossRef]
- NEA (National Environmental Agency). Computation of the Pollutant Standard Index (PSI). 2014. Available online: https://www.haze.gov.sg/docs/default-source/faq/computation-of-the-pollutant-standards-index-(psi).pdf (accessed on 11 March 2019).
- SNEA (Singapore National Environmental Agency). Air Quality. 2019. Available online: https://www.haze.gov.sg/ (accessed on 11 March 2019).
- Hidy, G.M.; Pennell, W.T. Multipollutant Air Quality Management. J. Air Waste Manag. Assoc. 2010, 60, 645–674. [Google Scholar] [CrossRef]
- MEWR (Ministry of the Environment & Water Resources). News. 2019. Available online: https://www.mewr.gov.sg/news (accessed on 10 July 2019).
- NEA (National Environmental Agency). Environmental Protection Division Annual Report 2017. Available online: https://www.nea.gov.sg/corporate-functions/resources/publications/annual-reports (accessed on 12 March 2019).
- SMPA (Singapore Maritime Port Authority). Available online: https://www.mpa.gov.sg/web/portal/home/ (accessed on 10 July 2019).
- SCA (Singapore Changi Airport). Available online: http://www.changiairport.com (accessed on 10 July 2019).
- NCCS and PMO (National Climate Change Secretariat and Prime Minister’s Office). Singapore’s Climate Action Plan 2016. Available online: https://www.mewr.gov.sg/resources-climate-action-sg (accessed on 12 March 2019).
- NEA (National Environmental Agency). Singapore’s Fourth National Communication and Third Biennial Update Report on Climate Change. National Environmental Agency; 2018. Available online: https://www.nccs.gov.sg/docs/default-source/default-document-library/singapore’s-fourth-national-communication-and-third-biennial-update-repo.pdf (accessed on 10 July 2019).
- NEA (National Environmental Agency). Environmental Protection Division Report 2012. Available online: https://www.nea.gov.sg/corporate-functions/resources/publications/annual-reports (accessed on 12 March 2019).
- Crippa, M.; Guizzardi, D.; Muntean, M.; Schaaf, E.; Dentener, F.; van Aardenne, J.A.; Monni, S.; Doering, U.; Olivier, J.G.J.; Pagliari, V.; et al. Gridded emissions of air pollutants for the period 1970–2012 within EDGAR v4.3.2. Earth Syst. Sci. Data 2018, 10, 1987–2013. [Google Scholar] [CrossRef]
- Janssens-Maenhout, G.; Crippa, M.; Guizzardi, D.; Muntean, M.; Schaaf, E.; Dentener, F.; Bergamaschi, P.; Pagliari, V.; Olivier, J.; Peters, J.A.H.W.; et al. EDGAR v4.3.2 Global atlas of the three major greenhouse gas emissions for the period 1970–2012. Earth Syst. Sci. Data 2019, 11, 959–1002. [Google Scholar] [CrossRef]
- EDGAR Database. Available online: http://edgar.jrc.ec.europa.eu/overview.php?v=4320 (accessed on 10 July 2019).
- Hertwig, D.; Burgin, L.; Gan, C.; Hort, M.; Jones, A.; Shaw, F.; Witham, C.; Zhang, K. Development and demonstration of a Lagrangian dispersion modeling system for real-time prediction of smoke haze pollution from biomass burning in Southeast Asia: Smoke haze dispersion in southeast Asia. J. Geophys. Res. Atmos. 2015, 120, 12605–12630. [Google Scholar] [CrossRef]
- EMA (Energy Market Authority). Singapore Energy Statistics 2018. Available online: https://www.ema.gov.sg/singapore_energy_statistics.aspx (accessed on 4 July 2019).
- NEA (National Environmental Agency). 1-hr PM2.5 (µg/m3) Readings. Available online: https://www.haze.gov.sg/resources/1-hr-pm2.5-readings (accessed on 10 July 2019).
- IEA (International Energy Agency). Key World Energy Statistics 2018. Available online: https://webstore.iea.org/key-world-energy-statistics-2018 (accessed on 9 July 2019).
- Singapore Clean Air Act of 1971. Available online: http://eresources.nlb.gov.sg/infopedia/articles/SIP_2014-04-07_110024.html (accessed on 10 July 2019).
- Lee, K.Y.; Chua, S.C. Clean Air Act of 1971; Singapore Infopedia. National Library of Singapore; 2014. Available online: http://eresources.nlb.gov.sg/infopedia/articles/SIP_2014-04-07_110024.html (accessed on 7 July 2019).
- Cleary, G.J. Air Pollution Control: Preliminary Assessment of Air Pollution in Singapore; National Library Board Singapore: Singapore, 1970. [Google Scholar]
- Campbell, W. Getting “on top of old smokey” . The Straits Times; 1970. Available online: http://eresources.nlb.gov.sg/newspapers/Digitised/Article/straitstimes19700423-1.2.90 (accessed on 7 July 2019).
- Wai, R. Air in Jurong just as clean. The Straits Times; p. 12. 14 April 1983. Available online: http://eresources.nlb.gov.sg/newspapers/Digitised/Article/straitstimes19830414-1.2.55 (accessed on 10 July 2019).
- Goh, J. Pollution under control here. The Straits Times; 1986; p. 16. Available online: http://eresources.nlb.gov.sg/newspapers/Digitised/Page/straitstimes19890716-1.1.16 (accessed on 8 July 2019).
- SAGC (Singapore Attorney General’s Chambers). Environmental Protection Control Act 1999; The Statutes of the Republic of Singapore: Singapore, 1999. Available online: https://sso.agc.gov.sg/Acts-Supp/9-1999/Published/20001230?DocDate=19990302 (accessed on 10 July 2019).
- LTA (Land Transport Authority). Land Transport Master Plan 2040. Available online: https://www.lta.gov.sg/content/ltaweb/en/about-lta/what-we-do/ltmp2040.html (accessed on 9 July 2019).
- Seng, L.T. Area Licensing Scheme. Available online: http://eresources.nlb.gov.sg/infopedia/articles/SIP_777_2004-12-13.html?s=Environmentarea%20licensing%20schemeal%20Protection%20and%20Management%20(Vehicular %20Emissions)%20Regulations (accessed on 9 July 2019).
- Watson, P.; Holland, E. Relieving Traffic Congestion: The Singapore Area License Scheme; The World Bank: Washington, DC, USA, 1978; Available online: http://agris.fao.org/agris-search/search.do?recordID=US2012426853 (accessed on 7 July 2019).
- Chia, N.-C.; Phang, S.-Y. Motor vehicle taxes as an environmental management instrument: The case of Singapore. Environ. Econ. Policy Stud. 2001, 4, 67–93. [Google Scholar] [CrossRef]
- Agarwal, S.; Koo, K.M. Impact of Electronic Road Pricing (ERP) changes on transport modal choice. Reg. Sci. Urban Econ. 2016, 60, 1–11. [Google Scholar] [CrossRef]
- Quirapas, M.A.J.R.; Aboagye-Gyan, R.; Gul, M.F. Sources, drivers and barriers of innovation in Singapore’s Electronic Road Pricing. Asian J. Public Aff. 2018, 11, e3. [Google Scholar] [CrossRef]
- LTA (Land Transport Authority). Overview of Vehicle Quota System. Available online: https://www.lta.gov.sg/content/ltaweb/en.html (accessed on 9 July 2019).
- UNEP and OECD (United Nations Environment Programme and Organisation for Economic Co-Operation and Development). Older Gasoline Vehicles: In Developing Countries and Economies in Transition: Their Importance and the Policy Options for Addressing Them; UNEP, OECD: Paris, France, 1999; ISBN 978-92-807-1796-9. [Google Scholar]
- SAGC (Singapore Attorney General’s Chambers). Road Traffic (Motor Vehicles, Construction and Use) Rules. 9 April 2019. Available online: https://sso.agc.gov.sg/SL/RTA1961-R9 (accessed on 10 July 2019).
- Kurohi, R. Singapore to Introduce Limits on Additives in Petrol and Diesel from 1 July 2019. The Straits Times. 2018. Available online: https://www.straitstimes.com/singapore/environment/singapore-to-introduce-limits-on-additives-in-petrol-and-diesel-from-july-1 (accessed on 9 July 2019).
- Tan, C. U-turn for Singapore car fleet after a decade of ageing. The Straits Times. 2019. Available online: https://www.straitstimes.com/singapore/transport/u-turn-for-spore-car-fleet-after-a-decade-of-ageing (accessed on 7 July 2019).
- MPA (Maritime Port Authority). Maritime Singapore Green Initiative. Singapore Government; 2016. Available online: https://www.mpa.gov.sg/web/portal/home/maritime-singapore/green-efforts/maritime-singapore-green-initiative (accessed on 10 July 2019).
- Chiam, S.T.; Wong, L.K.; Lim, K.S. Regulating the Use of Fireworks. Available online: http://eresources.nlb.gov.sg/infopedia/articles/SIP_2013-10-04_181113.html (accessed on 8 July 2019).
- SAGC (Singapore Attorney General’s Chambers). Dangerous Fireworks Act. Revised edition 2014. Government of Singapore. 28 February 2014. Available online: https://sso.agc.gov.sg/Act/DFA1972 (accessed on 10 July 2019).
- MEWR (Ministry of the Environment and Water Resources). The Singapore Green Plan: Action Programmes; Published for the Ministry of the Environment by Times Editions Pty Ltd.: Singapore, 1993; ISBN 978-981-204-490-7. [Google Scholar]
- MEWR (Ministry of the Environment and Water Resources). The Singapore Green Plan 2012; Ministry of the Environment and Water Resources: Singapore, 2002. Available online: https://www.mewr.gov.sg/grab-our-research/singapore-green-plan-2012 (accessed on 10 July 2019).
- MEWR (Ministry of the Environment and Water Resources). The Singapore Green Plan 2012, 2006 ed.; Ministry of the Environment and Water Resources: Singapore, 2006. Available online: https://www.mewr.gov.sg/grab-our-research/singapore-green-plan-2012 (accessed on 28 August 2019).
- MEWR and MND (Ministry of the Environment and Water Resources and Ministry of National Development). Sustainable Singapore Blueprint. A Lively and Livable Singapore: Strategies for Sustainable Growth, Singapore Government 2009. Available online: https://www.mewr.gov.sg/ssb/home (accessed on 10 July 2019).
- Hidy, G.M.; Brook, J.R.; Demerjian, K.L.; Molina, L.T.; Pennell, W.T.; Scheffe, R.D. Technical Challenges of Multipollutant Air Quality Management; Springer: Dordrecht, The Netherlands, 2011; ISBN 978-94-007-0304-9. [Google Scholar]
- Karagulian, F.; Belis, C.A.; Dora, C.F.C.; Prüss-Ustün, A.M.; Bonjour, S.; Adair-Rohani, H.; Amann, M. Contributions to cities’ ambient particulate matter (PM): A systematic review of local source contributions at global level. Atmos. Environ. 2015, 120, 475–483. [Google Scholar] [CrossRef]
- Budisulistiorini, S.H.; Riva, M.; Williams, M.; Miyakawa, T.; Chen, J.; Itoh, M.; Surratt, J.D.; Kuwata, M. Dominant contribution of oxygenated organic aerosol to haze particles from real-time observation in Singapore during an Indonesian wildfire event in 2015. Atmos. Chem. Phys. 2018, 18, 16481–16498. [Google Scholar] [CrossRef] [Green Version]
- Chen, J.; Budisulistiorini, S.H.; Miyakawa, T.; Komazaki, Y.; Kuwata, M. Secondary aerosol formation promotes water uptake by organic-rich wildfire haze particles in equatorial Asia. Atmos. Chem. Phys. 2018, 18, 7781–7798. [Google Scholar] [CrossRef] [Green Version]
- Behera, S.N.; Cheng, J.; Balasubramanian, R. In situ acidity and pH of size-fractionated aerosols during a recent smoke-haze episode in Southeast Asia. Environ. Geochem. Health 2015, 37, 843–859. [Google Scholar] [CrossRef]
- Yang, L.; Nguyen, D.M.; Jia, S.; Reid, J.S.; Yu, L.E. Impacts of biomass burning smoke on the distributions and concentrations of C2–C5 dicarboxylic acids and dicarboxylates in a tropical urban environment. Atmos. Environ. 2013, 78, 211–218. [Google Scholar] [CrossRef]
- Salinas, S.V.; Chew, B.N.; Miettinen, J.; Campbell, J.R.; Welton, E.J.; Reid, J.S.; Yu, L.E.; Liew, S.C. Physical and optical characteristics of the October 2010 haze event over Singapore: A photometric and lidar analysis. Atmos. Res. 2013, 122, 555–570. [Google Scholar] [CrossRef]
- Sharma, R.; Balasubramanian, R. Size-fractionated particulate matter in indoor and outdoor environments during the 2015 haze in Singapore: Potential human health risk assessment. Aerosol Air Qual. Res. 2018, 18, 904–917. [Google Scholar] [CrossRef]
- Tham, K.W.; Parshetti, G.K.; Balasubramanian, R.; Sekhar, C.; Cheong, D.K.W. Mitigating particulate matter exposure in naturally ventilated buildings during haze episodes. Build. Environ. 2018, 128, 96–106. [Google Scholar] [CrossRef]
- Betha, R.; Behera, S.N.; Balasubramanian, R. 2013 Southeast Asian smoke haze: fractionation of particulate-bound elements and associated health risk. Environ. Sci. Technol. 2014, 48, 4327–4335. [Google Scholar] [CrossRef]
- Hansen, A.B.; Witham, C.S.; Chong, W.M.; Kendall, E.; Chew, B.N.; Gan, C.; Hort, M.C.; Lee, S.-Y. Haze in Singapore—Source attribution of biomass burning PM10 from Southeast Asia. Atmos. Chem. Phys. 2019, 19, 5363–5385. [Google Scholar] [CrossRef]
- Aouizerats, B.; van der Werf, G.R.; Balasubramanian, R.; Betha, R. Importance of transboundary transport of biomass burning emissions to regional air quality in Southeast Asia during a high fire event. Atmos. Chem. Phys. 2015, 15, 363–373. [Google Scholar] [CrossRef] [Green Version]
- Engling, G.; He, J.; Betha, R.; Balasubramanian, R. Assessing the regional impact of Indonesian biomass burning emissions based on organic molecular tracers and chemical mass balance modeling. Atmos. Chem. Phys. 2014, 14, 8043–8054. [Google Scholar] [CrossRef]
- Reddington, C.L.; Yoshioka, M.; Balasubramanian, R.; Ridley, D.; Toh, Y.Y.; Arnold, S.R.; Spracklen, D.V. Contribution of vegetation and peat fires to particulate air pollution in Southeast Asia. Environ. Res. Lett. 2014, 9, 094006. [Google Scholar] [CrossRef] [Green Version]
- Chew, F.T.; Goh, D.Y.; Ooi, B.C.; Saharom, R.; Hui, J.K.; Lee, B.W. Association of ambient air-pollution levels with acute asthma exacerbation among children in Singapore. Allergy 1999, 54, 320–329. [Google Scholar] [CrossRef]
- Health Hub Asthma: Triggers and Symptoms. Available online: https://www.healthhub.sg/a-z/diseases-and-conditions/11/asthma (accessed on 9 July 2019).
- Lai, C.K.W.; Beasley, R.; Crane, J.; Foliaki, S.; Shah, J.; Weiland, S. The ISAAC Phase Three Study Group. Global variation in the prevalence and severity of asthma symptoms: Phase Three of the International Study of Asthma and Allergies in Childhood (ISAAC). Thorax 2009, 64, 476–483. [Google Scholar] [CrossRef] [PubMed]
- NRDO (National Registry of Diseases Office). Singapore Cancer Registry: Annual Registry Report 2015. Health Promotion Board. Singapore. Available online: https://www.nrdo.gov.sg/publications/ (accessed on 10 July 2019).
- Guarnieri, M.; Balmes, J.R. Outdoor air pollution and asthma. Lancet 2014, 383, 1581–1592. [Google Scholar] [CrossRef] [Green Version]
- Couraud, S.; Zalcman, G.; Milleron, B.; Morin, F.; Souquet, P.-J. Lung cancer in never smokers—A review. Eur. J. Cancer 2012, 48, 1299–1311. [Google Scholar] [CrossRef] [PubMed]
- Ho, A.F.W.; Zheng, H.; Earnest, A.; Cheong, K.H.; Pek, P.P.; Seok, J.Y.; Liu, N.; Kwan, Y.H.; Tan, J.W.C.; Wong, T.H.; et al. Time-stratified case crossover ctudy of the association of outdoor ambient air aollution with the risk of acute myocardial infarction in the context of seasonal exposure to the Southeast Asian haze problem. JAHA 2019, 8, e011272. [Google Scholar] [CrossRef] [PubMed]
- Ho, A.F.W.; Wah, W.; Earnest, A.; Ng, Y.Y.; Xie, Z.; Shahidah, N.; Yap, S.; Pek, P.P.; Liu, N.; Lam, S.S.W.; et al. Health impacts of the Southeast Asian haze problem—A time-stratified case crossover study of the relationship between ambient air pollution and sudden cardiac deaths in Singapore. Int. J. Cardiol. 2018, 271, 352–358. [Google Scholar] [CrossRef] [PubMed]
- Emmanuel, S.C. Impact to lung health of haze from forest fires: The Singapore experience. Respirology 2000, 5, 175–182. [Google Scholar] [CrossRef] [PubMed]
- Quah, E.; Boon, T.L. The economic cost of particulate air pollution on health in Singapore. J. Asian Econ. 2003, 14, 73–90. [Google Scholar] [CrossRef]
- Koplitz, S.N.; Mickley, L.J.; Marlier, M.E.; Buonocore, J.J.; Kim, P.S.; Liu, T.; Sulprizio, M.P.; DeFries, R.S.; Jacob, D.J.; Schwartz, J.; et al. Public health impacts of the severe haze in Equatorial Asia in September–October 2015: Demonstration of a new framework for informing fire management strategies to reduce downwind smoke exposure. Environ. Res. Lett. 2016, 11, 094023. [Google Scholar] [CrossRef]
- Quah, E.; Chia, W.M. Economic costs of air pollution in Singapore. In The Globalization of Cost-Benefits Analysis in Environmental Policy; Livermore, M.A., Revesz, R.L., Eds.; Oxford Scholarship Online; Oxford University Press: Oxford, UK, 2013. [Google Scholar] [CrossRef]
- Apte, J.S.; Brauer, M.; Cohen, A.J.; Ezzati, M.; Pope, C.A. Ambient PM2.5 reduces global and regional life expectancy. Environ. Sci. Technol. Lett. 2018, 5, 546–551. [Google Scholar] [CrossRef]
- Othman, L. Singapore not meeting its air quality targets: Masagos. Channel News Asia. 26 January 2017. Available online: https://www.channelnewsasia.com/news/singapore/singapore-not-meeting-its-air-quality-targets-masagos-7543240 (accessed on 10 July 2019).
- Bordt, M.; Rastan, S. The Role of National Agencies as Honest Brokers between Science and Policy: Case Studies on Environmental Sustainability Indicators. In Handbook of Clean Energy Systems; Yan, J., Ed.; John Wiley & Sons, Ltd.: Chichester, UK, 2015. [Google Scholar]
- MEWR (Ministry of the Environment and Water Resources). Key Environmental Statistics 2018. Available online: https://www.mewr.gov.sg/grab-our-research (accessed on 9 July 2019).
- NASA (National Aeronautics and Space Administration). Air Quality Observations from Space. Available online: https://airquality.gsfc.nasa.gov/ (accessed on 10 July 2019).
- Ahangar, F.; Freedman, F.; Venkatram, A. Using Low-cost air quality sensor networks to improve the spatial and temporal resolution of concentration maps. Int. J. Environ. Res. Public Health 2019, 16, 1252. [Google Scholar] [CrossRef]
- Apte, J.S.; Messier, K.P.; Gani, S.; Brauer, M.; Kirchstetter, T.W.; Lunden, M.M.; Marshall, J.D.; Portier, C.J.; Vermeulen, R.C.H.; Hamburg, S.P. High-resolution air pollution mapping with Google Street View Cars: Exploiting big data. Environ. Sci. Technol. 2017, 51, 6999–7008. [Google Scholar] [CrossRef] [PubMed]
- GOHK (Government of Hong Kong). Air Quality Health Index. Available online: https://www.gov.hk/en/residents/environment/air/aqhi.htm) (accessed on 10 July 2019).
- Stieb, D.M.; Burnett, R.T.; Smith-Doiron, M.; Brion, O.; Shin, H.H.; Economou, V. A new multipollutant, no-threshold air quality health index based on short-term associations observed in daily time-series analyses. J. Air Waste Manag. Assoc. 2008, 58, 435–450. [Google Scholar] [CrossRef] [PubMed]
- GOC (Government of Canada). About the Air Quality Health Index. Available online: https://www.canada.ca/en/environment-climate-change/services/air-quality-health-index/about.html (accessed on 8 July 2019).
- McDonald, B.C.; de Gouw, J.A.; Gilman, J.B.; Jathar, S.H.; Akherati, A.; Cappa, C.D.; Jimenez, J.L.; Lee-Taylor, J.; Hayes, P.L.; McKeen, S.A.; et al. Volatile chemical products emerging as largest petrochemical source of urban organic emissions. Science 2018, 359, 760–764. [Google Scholar] [CrossRef] [PubMed] [Green Version]
- Zengkun, F. Study to suss out air pollutants here. The Straits Times. 2015. Available online: https://www.asiaone.com/singapore/study-suss-out-air-pollutants-here (accessed on 7 July 2019).
- Lee, H.-H.; Bar-Or, R.Z.; Wang, C. Biomass burning aerosols and the low-visibility events in Southeast Asia. Atmos. Chem. Phys. 2017, 17, 965–980. [Google Scholar] [CrossRef] [Green Version]
- Lee, H.-H.; Iraqui, O.; Wang, C. The Impact of Future Fuel Consumption on Regional Air Quality in Southeast Asia. Sci. Rep. 2019, 9, 2648. [Google Scholar] [CrossRef] [PubMed]
- Boh, S. Chemical smell across Singapore traced to Johor. The Straits Times. 2017. Available online: https://www.straitstimes.com/singapore/environment/chemical-smell-across-spore-traced-to-johor (accessed on 28 August 2019).
- CUGE (Centre for Urban Greenery and Ecology). Available online: https://www.nparks.gov.sg/cuge (accessed on 10 July 2019).
- CCRS (Centre for Climate Research Singapore). Available online: http://ccrs.weather.gov.sg/ (accessed on 10 July 2019).
- Armitage, C. The search for solutions. Nature 2018, 558, S1. [Google Scholar] [CrossRef] [PubMed]
Figure 1.
Mexico City Metropolitan Area in 2016. The black squares refer to the automatic air quality monitoring stations (RAMA). The background color scheme represents the elevation above sea level.
Figure 1.
Mexico City Metropolitan Area in 2016. The black squares refer to the automatic air quality monitoring stations (RAMA). The background color scheme represents the elevation above sea level.

Figure 2.
Trends in energy consumption for the key sectors in the Mexico City Metropolitan Area (MCMA). Source: SEDEMA [11].
Figure 2.
Trends in energy consumption for the key sectors in the Mexico City Metropolitan Area (MCMA). Source: SEDEMA [11].

Figure 3.
Percentage of change of the annual average concentration with respect to the annual average of 1990 for each of the main air pollutants in the MCMA. For PM2.5, the reference is the annual average of 2004. Averages were calculated for sites with ≥75% of valid data (graphs plotted by authors with information obtained from SIMAT website [22]).

Figure 4.
Emissions time series (2000–2016) by sectors for: (a) non-methane volatile organic compounds (NMVOCs), (b) NOx, (c) CO, (d) PM10, (e) PM2.5, and (f) SO2 obtained from the official MCMA emissions inventory [25]. The emissions presented here are lumped in major sectors.
Figure 4.
Emissions time series (2000–2016) by sectors for: (a) non-methane volatile organic compounds (NMVOCs), (b) NOx, (c) CO, (d) PM10, (e) PM2.5, and (f) SO2 obtained from the official MCMA emissions inventory [25]. The emissions presented here are lumped in major sectors.

Figure 5.
Contributions of emissions sources to the 2016 MCMA emissions inventory. HAP denotes hazardous air pollutants or air toxics. (Adapted from SEDEMA [25]).
Figure 5.
Contributions of emissions sources to the 2016 MCMA emissions inventory. HAP denotes hazardous air pollutants or air toxics. (Adapted from SEDEMA [25]).

Figure 6.
Comparison of air quality trends (for O3 and PM) in the MCMA, South Coast Air Basin (SoCAB), and Singapore (graphs plotted by authors with data from SIMAT [22], South Coast Air Quality Management District [38], and Singapore Department of Statistics [39]).

Figure 7.
Daily maximum ozone concentrations (1990–2016) illustrating the changes on the threshold used to trigger environmental contingency.
Figure 7.
Daily maximum ozone concentrations (1990–2016) illustrating the changes on the threshold used to trigger environmental contingency.

Figure 8.
Historical consumption of energy in Singapore. Panel (a) shows the total energy consumption by source in megatons of oil equivalent (Mtoe). Oil products and electricity have been the two main sources of energy; panels (b,c) show their consumption from 1990 to 2016 by type of fuel and fuel used for its generation, respectively. Data were extracted from the International Energy Agency (IEA) World Energy Balances 2018 (https://www.iea.org).

Figure 9.
Map of Sijori Growth Triangle formed by the urban areas (indicated by line shading) of Singapore, Johor Bahru, and Batam. Stars are locations of heavy industries in Singapore (Jurong Industrial Estate and Jurong Island) and Malaysia (Pasir Gudang). Similarly, yellow and red dots are locations of ambient and roadside air quality monitoring stations according to the Sustainable Singapore Blueprint 2015 [122].

Figure 10.
Air quality information provided hourly by Singapore’s authorities [126]. The screenshot of the map shows the pollutant standard index (PSI) values for each of the five sections in which the island is divided for air quality purposes; the corresponding sub-indexes for each monitored pollutant show that PM2.5 triggered moderate air quality conditions on that particular day and hour. The breakpoints for PM2.5 that are used to define the PSI category are included for reference.

Figure 11.
Singapore’s SO2 and GHG emission evolution. The annual emissions of SO2 in 2017 accounted for 81,036 Mg, while the emissions of GHG in 2014 for 50,908 Gg CO2eq including emissions of CO2, CH4, N2O, HFCs, PFCs, and SF6. The green areas acted as net source of GHG and contributed 0.1% to the total emissions [129,133].

Figure 12.
Singapore’s emission time series (1970–2012) by sectors for O3 precursor gases (CO, NOx, and NMVOCs), acidifying gases (NH3, NOx, and SO2), primary particles (PM10, PM2.5, black carbon, and organic carbon), and greenhouse gases (CO2 and CH4) as computed by the global air pollutant emissions EDGAR v4.3.2 inventory (Crippa et al., [135]; Janssens-Maenhout et al., [136]). The emissions presented here are lumped in major sectors; the contributions from specific sectors can be retrieved from EDGAR database [137].

Figure 13.
Percentage difference of the annual mean concentration (PM2.5, NO2, and SO2), 8-h annual maximum concentration (O3 and SO2) or 99th 24-h annual percentile concentration (PM10) to respective concentrations of 1999, except for PM2.5, for which 2002 is the used as reference year. Years 2006, 2013, and 2015 were affected by transboundary haze. Data were obtained from the Department of Statistics Singapore [39].

Figure 14.
Time series of 1-h PM2.5 ambient concentration reported hourly for each of the five air quality regions of Singapore. The black dots indicate the hourly maximum concentrations in the whole island. The background colors correspond to the bands system implemented by National Environment Agency (NEA) as a guide for the public to adjust immediate activities. Data were retrieved daily from NEA air quality website [140].

Figure 15.
Diurnal pattern of PM2.5 ambient concentrations during weekdays for each of the five regions in which Singapore is divided for air quality purposes, excluding the days affected by transboundary haze. The black and grey curves show to the mean maximum concentrations recorded across the whole island on days no affected and affected by transboundary haze, respectively. All diurnal patterns correspond to the geometric mean obtained from the 1-h data published by NEA between June 2014 and August 2016. The shaded area indicates the day-to-day variability as the ±1 standard deviation of the hourly maximum concentrations on days not affected by haze.


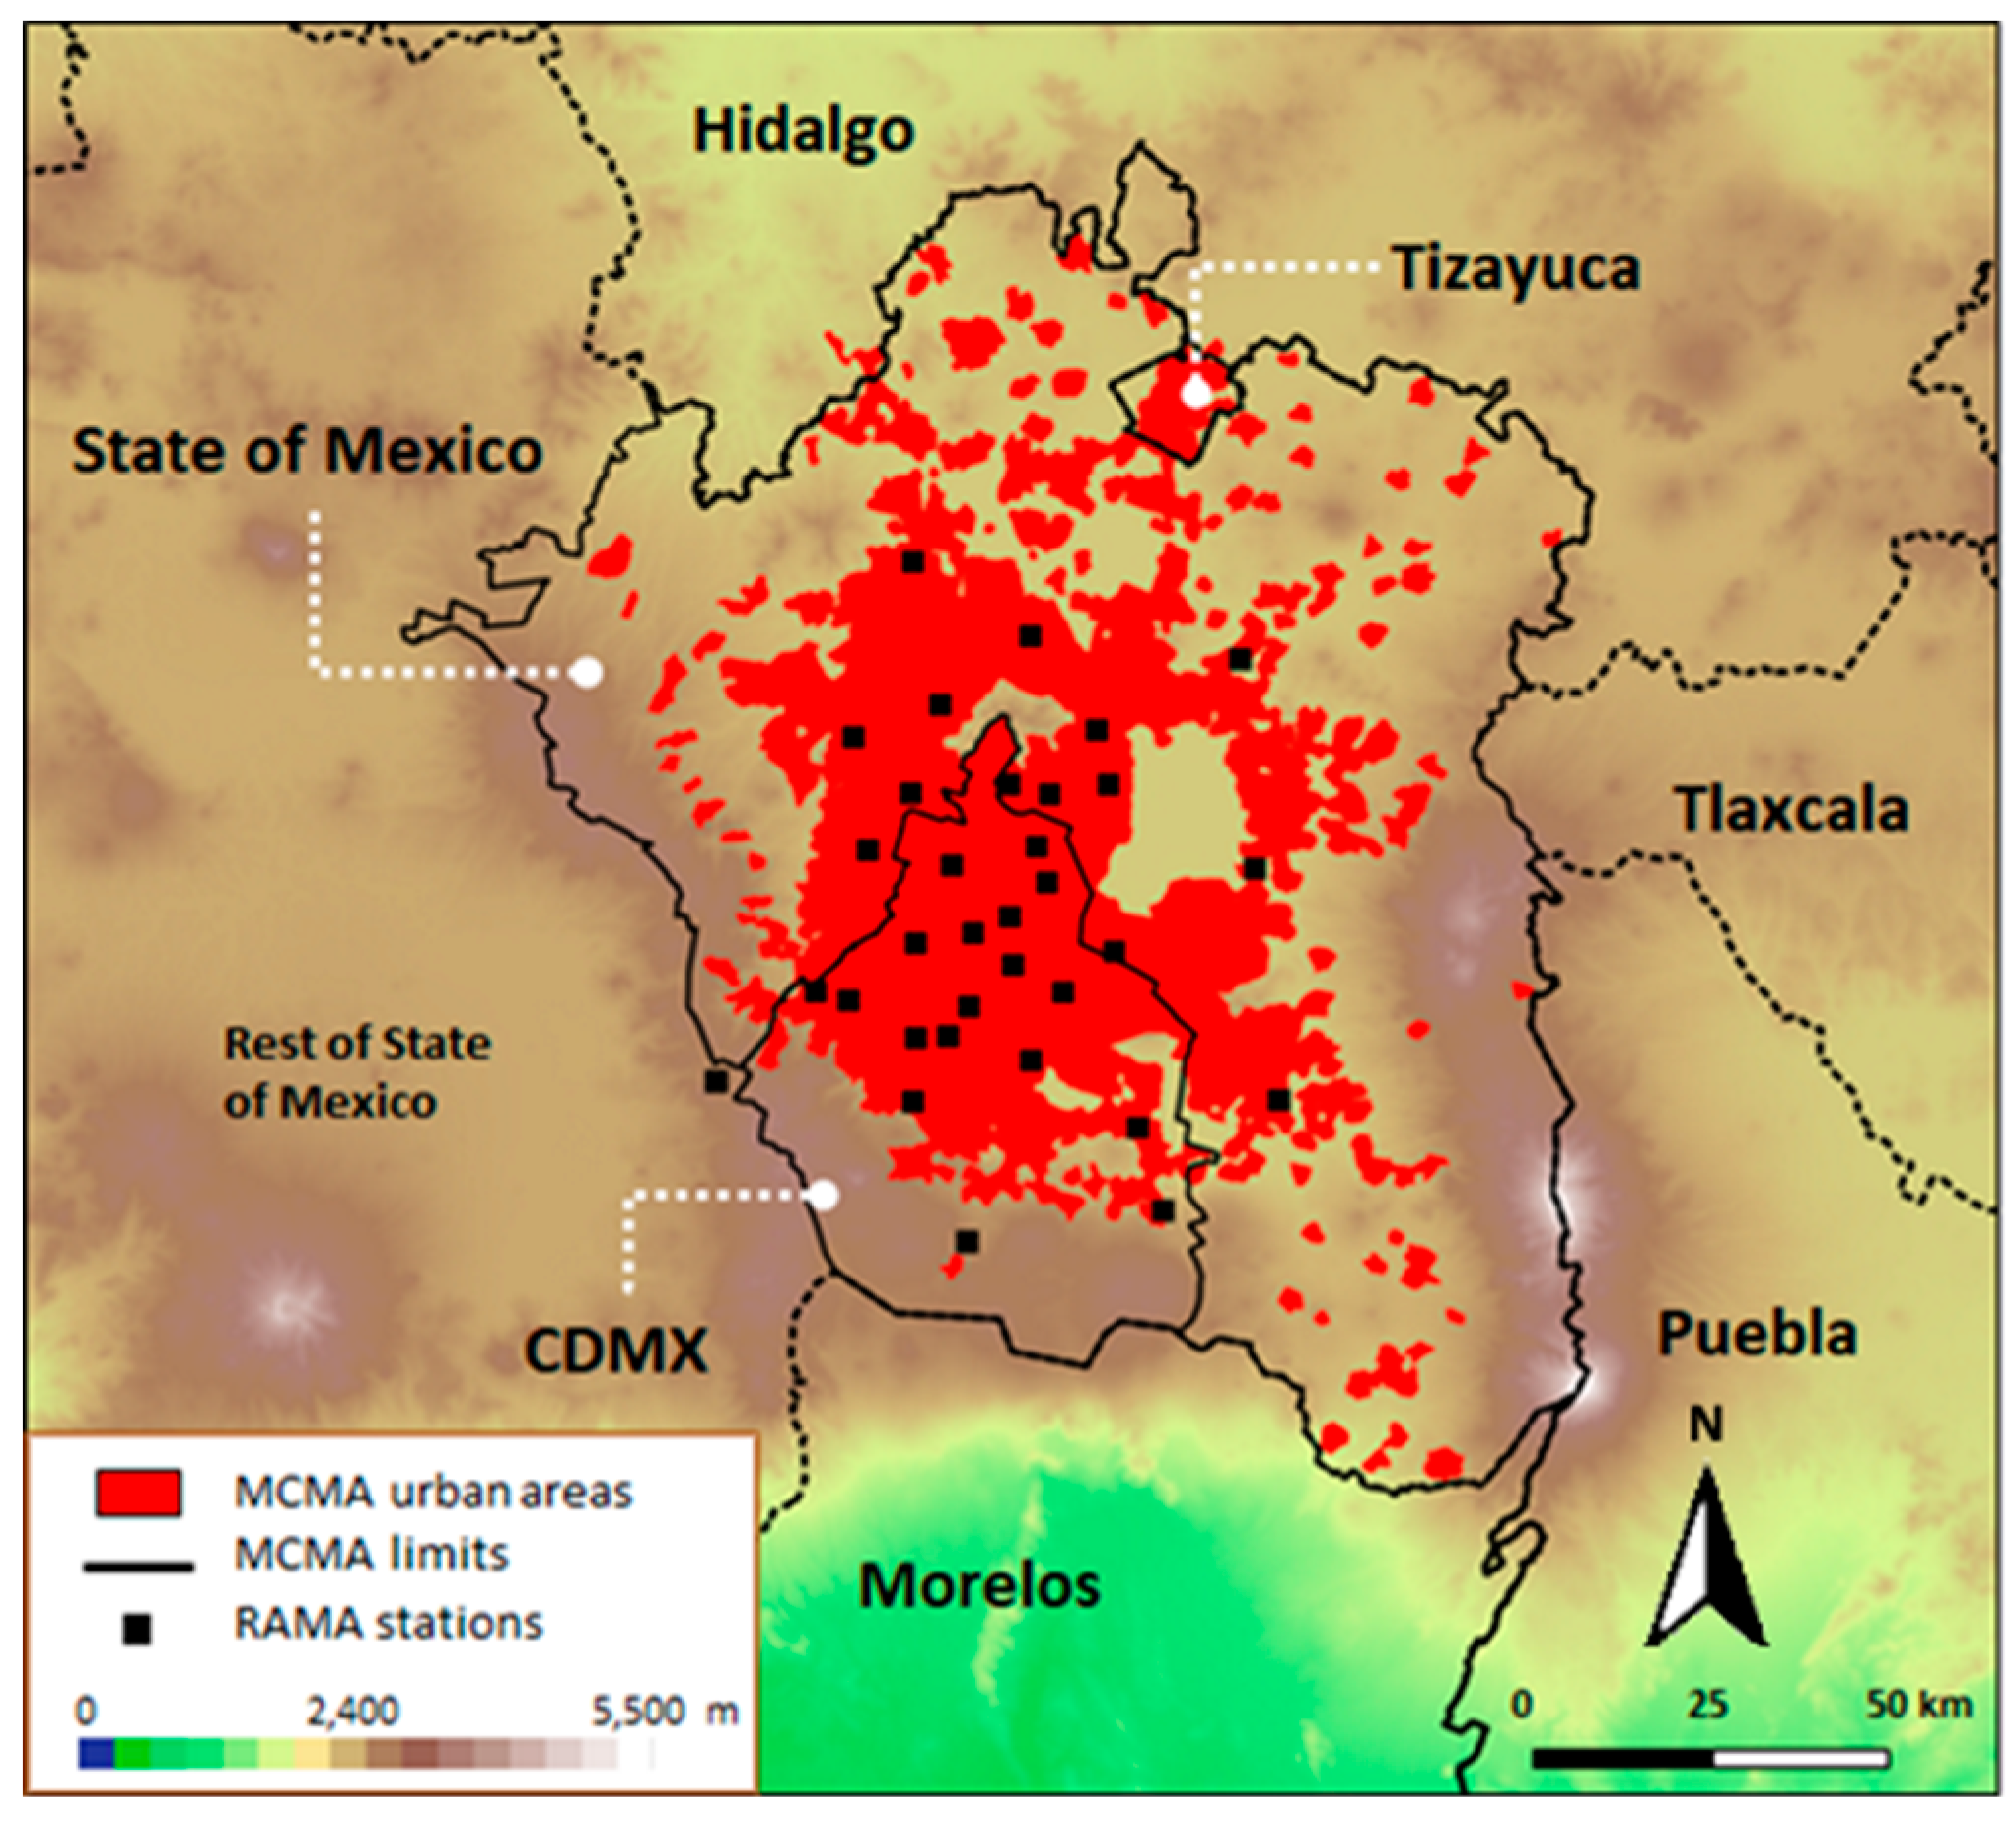
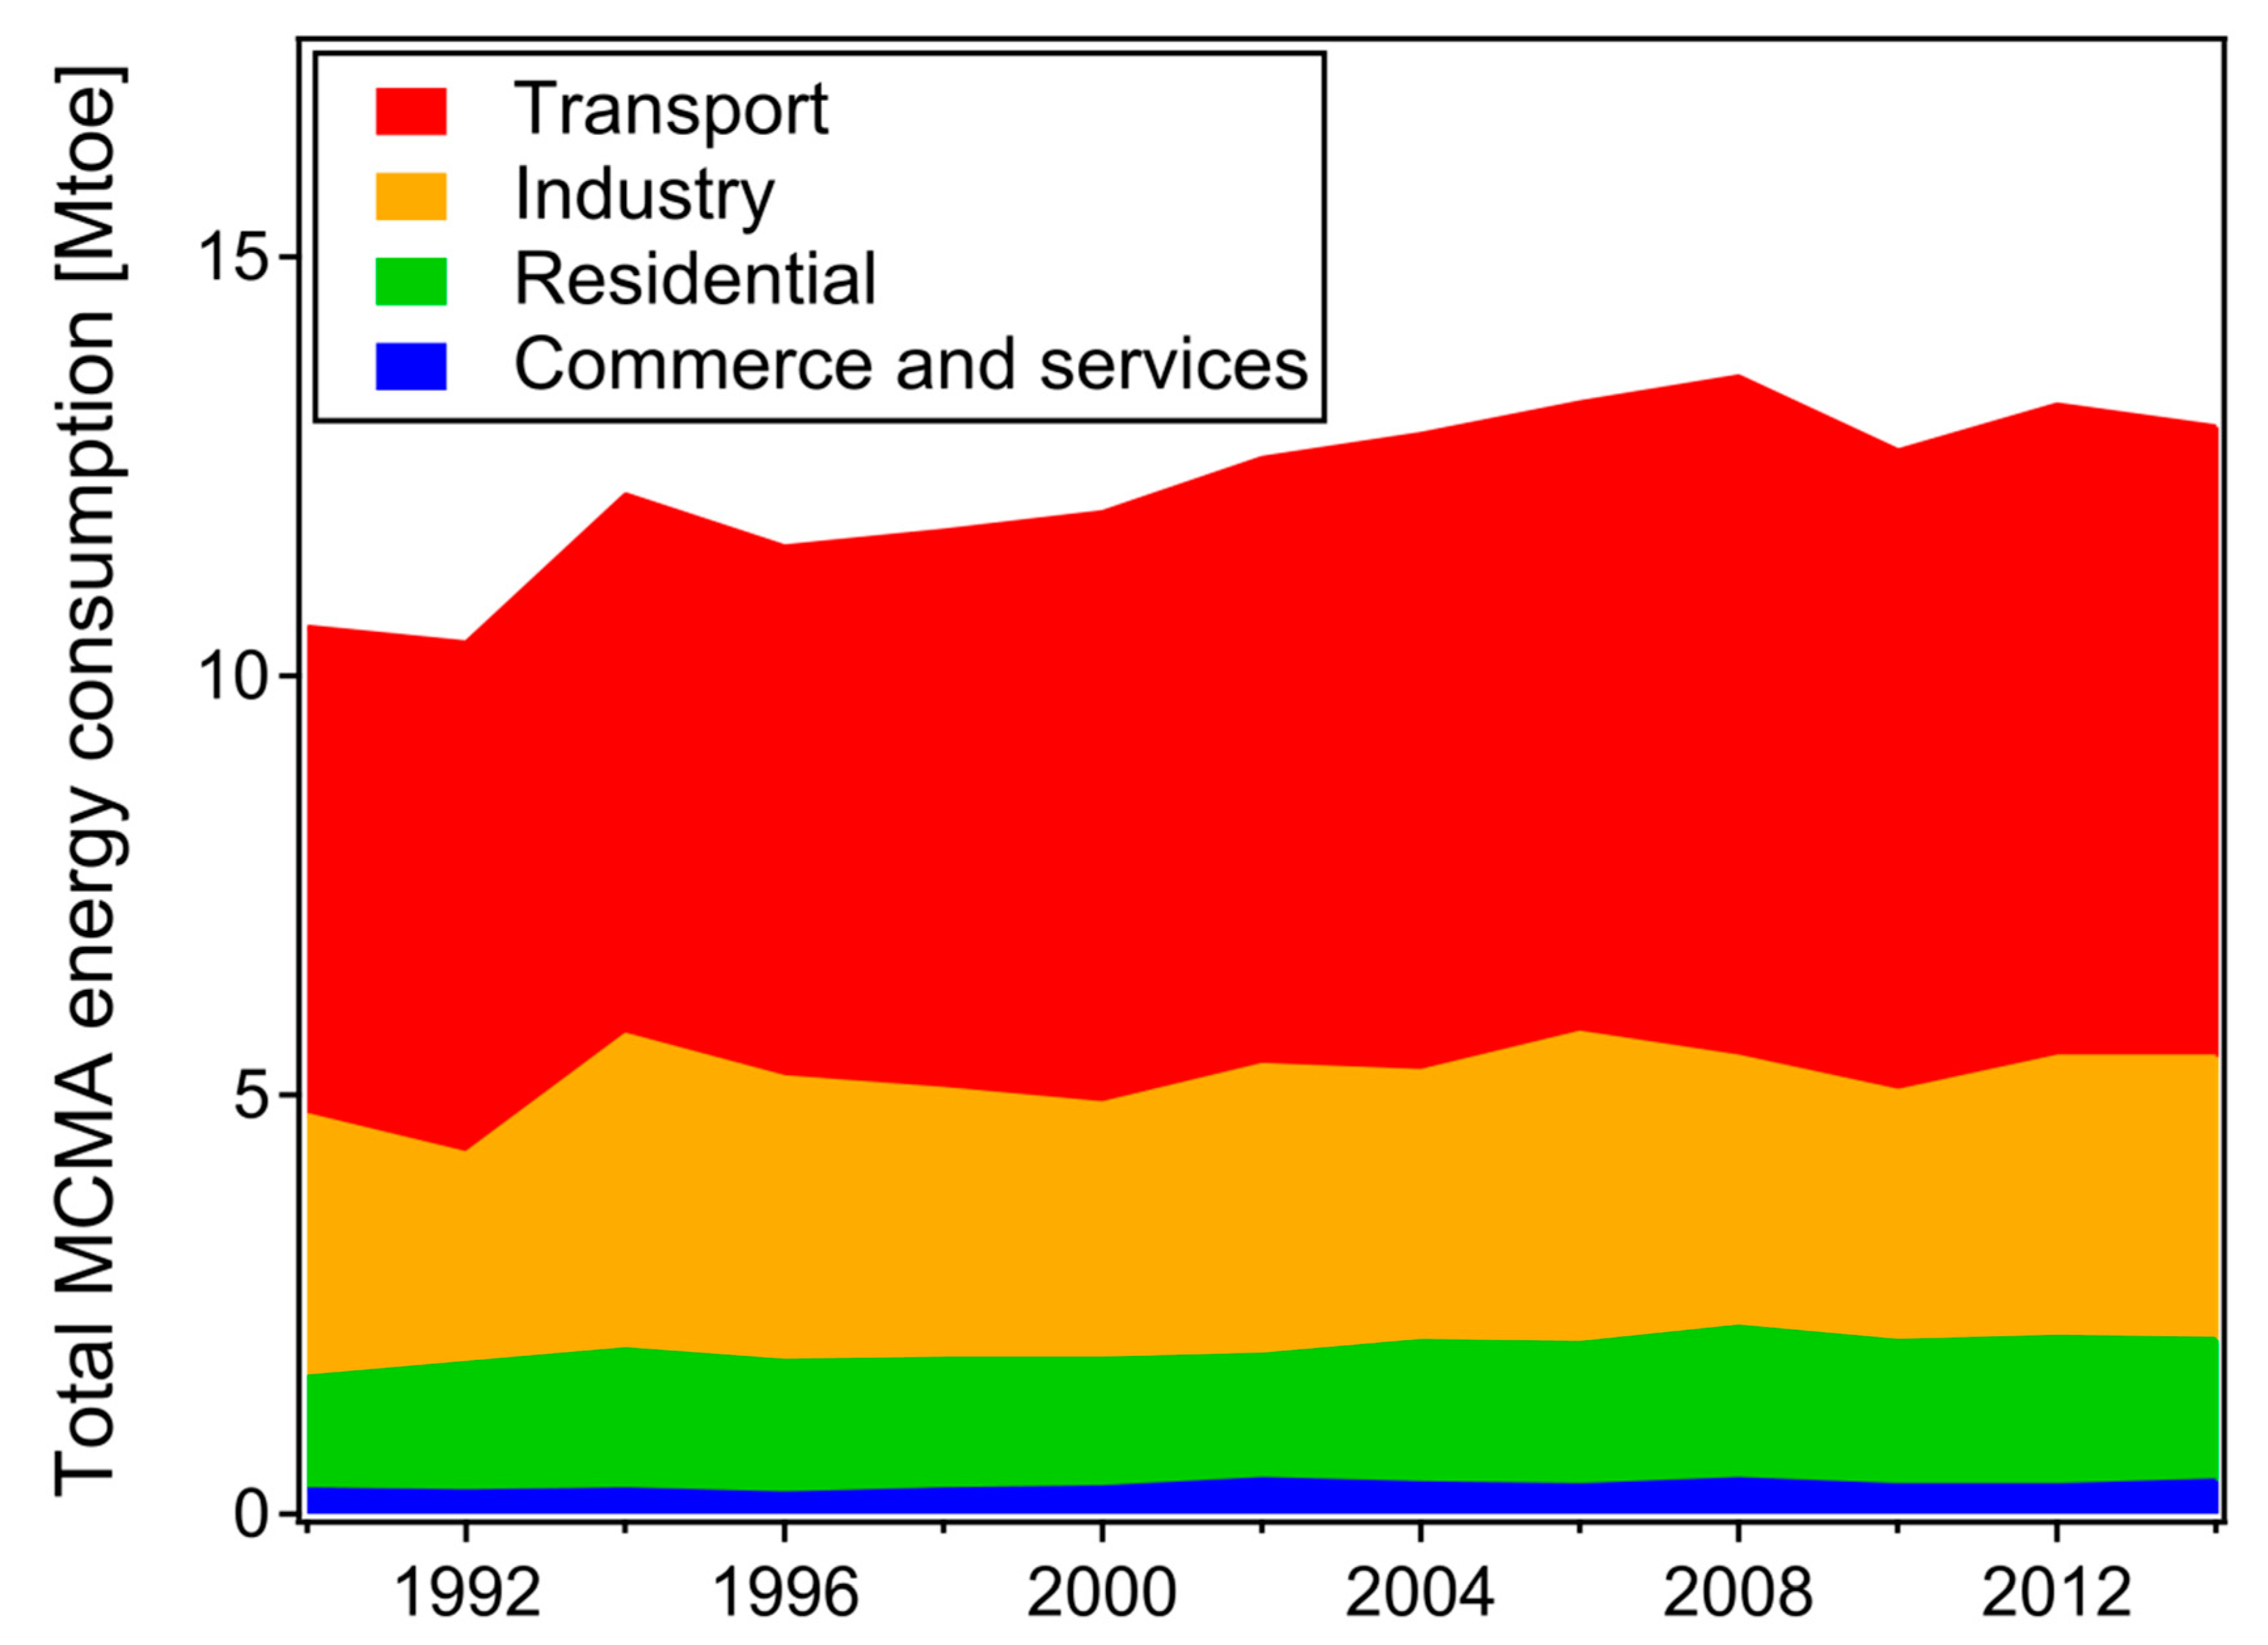
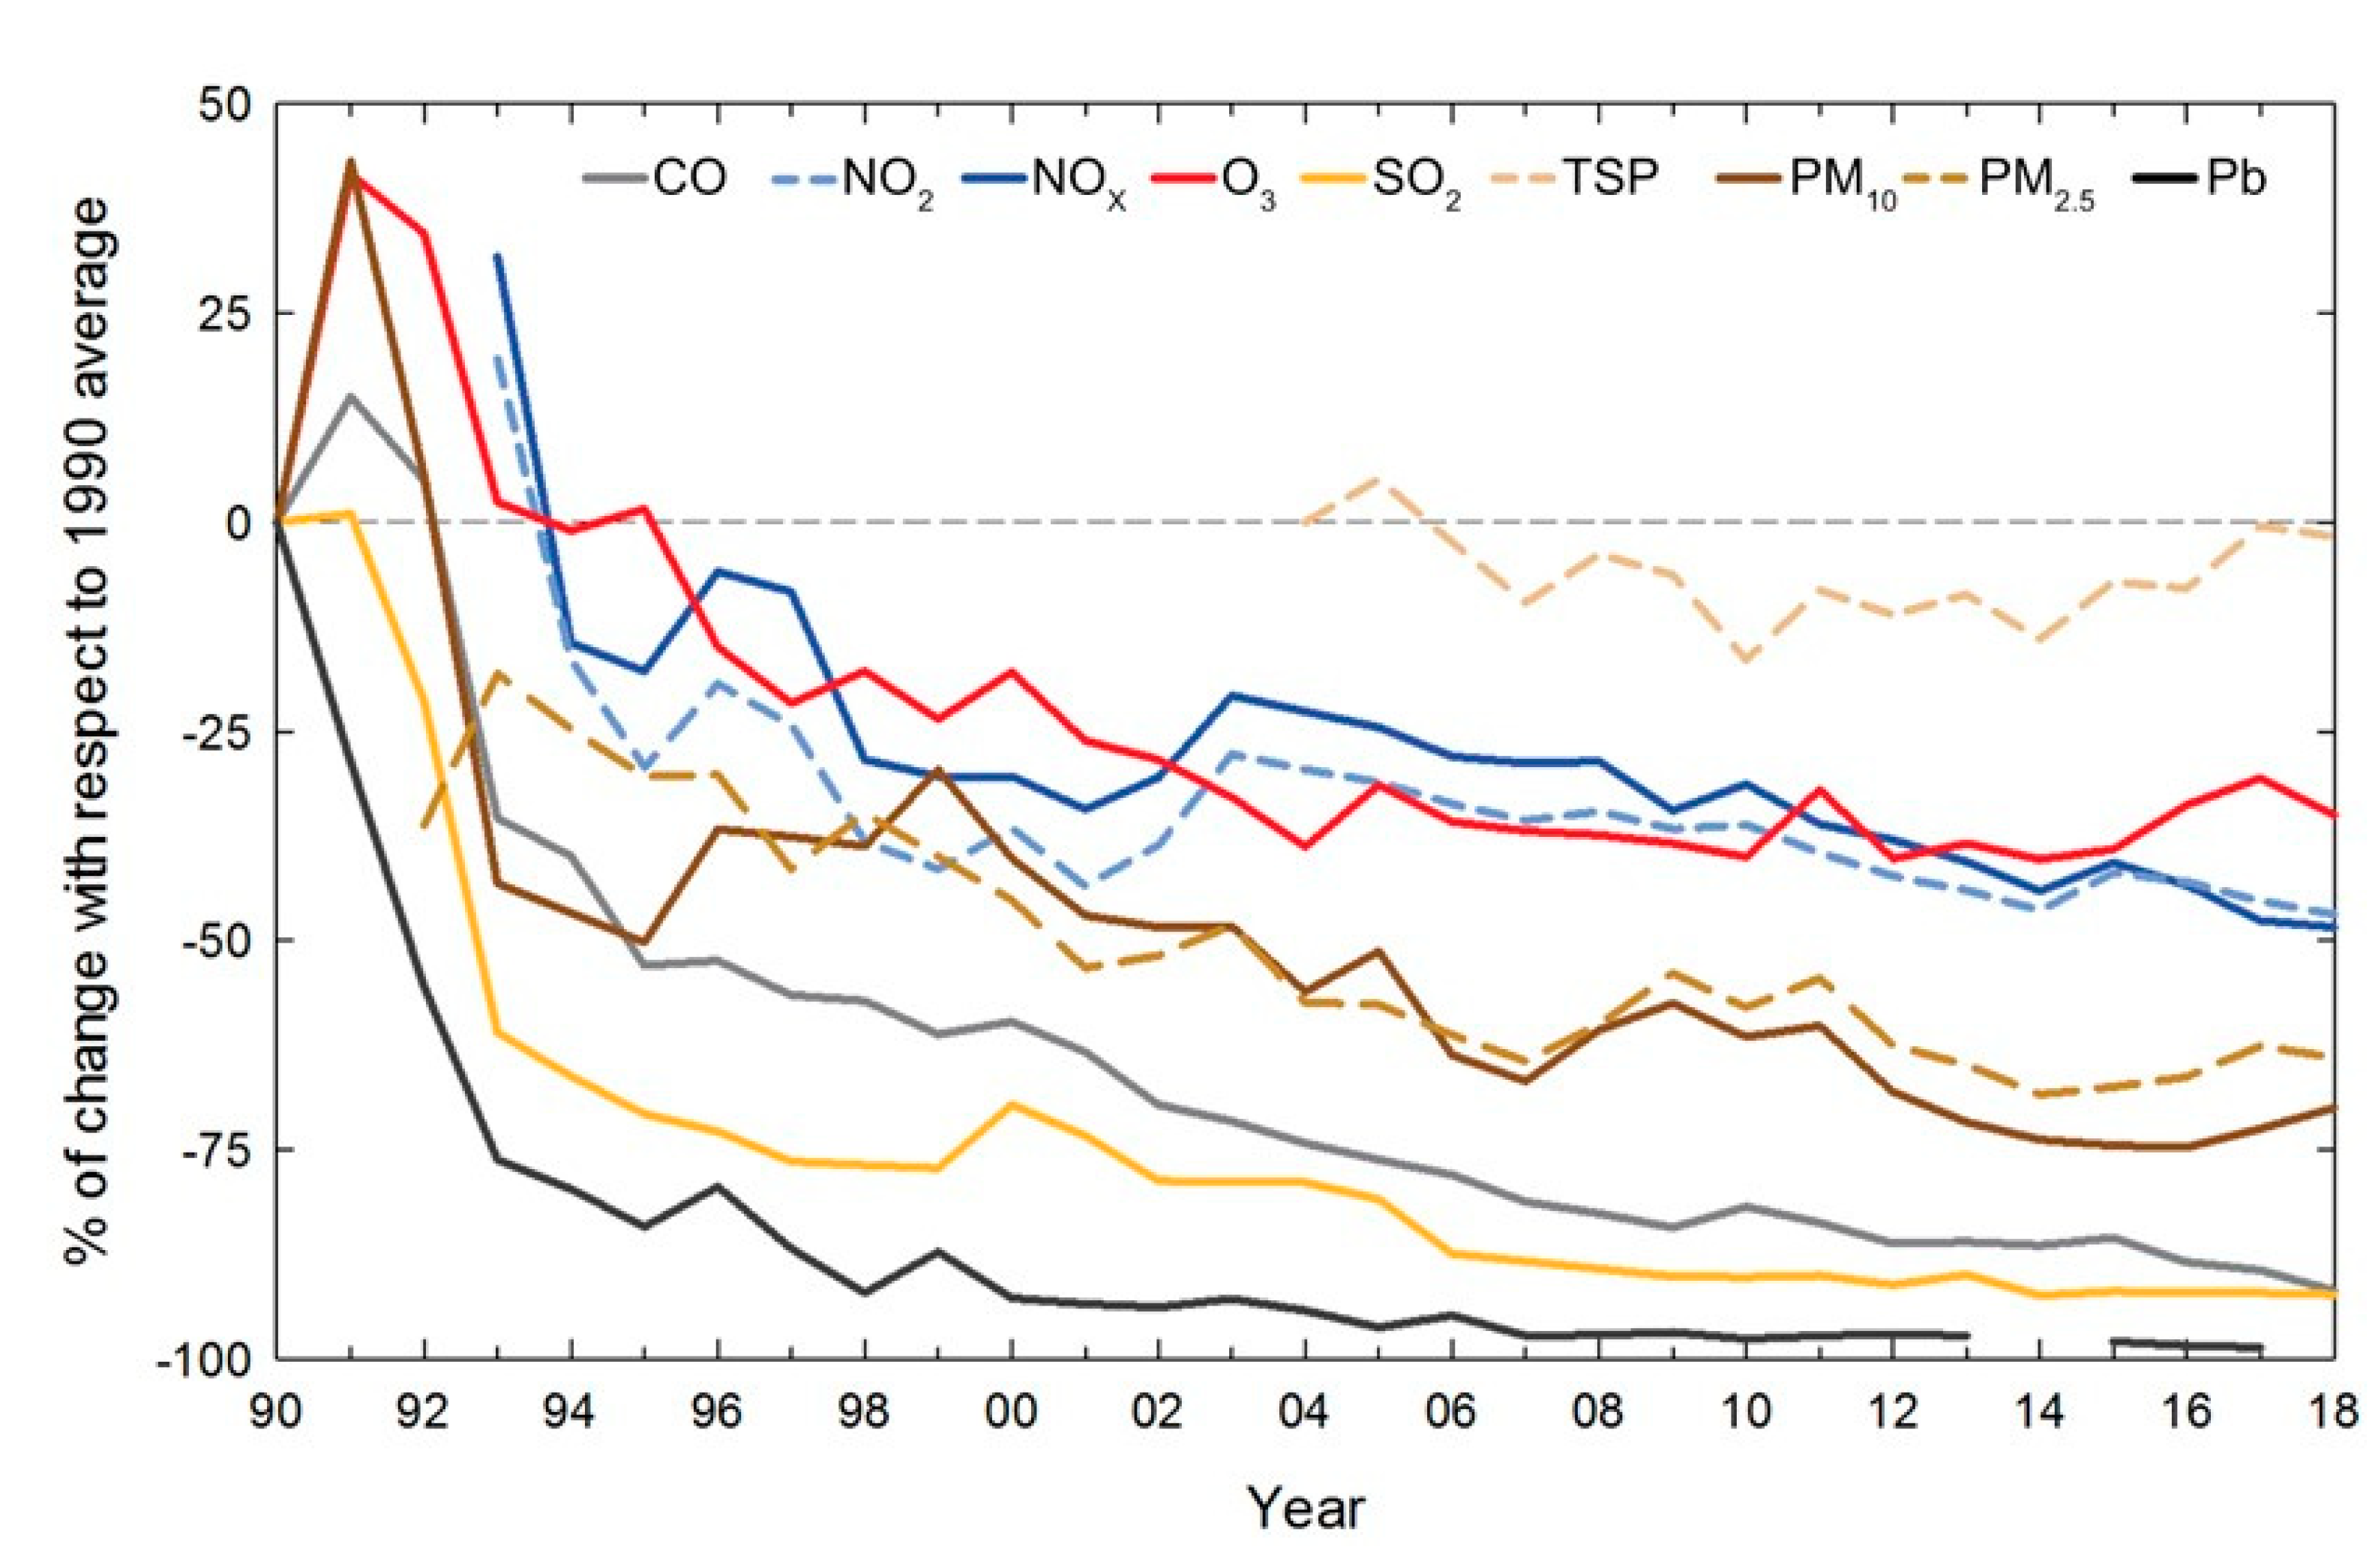
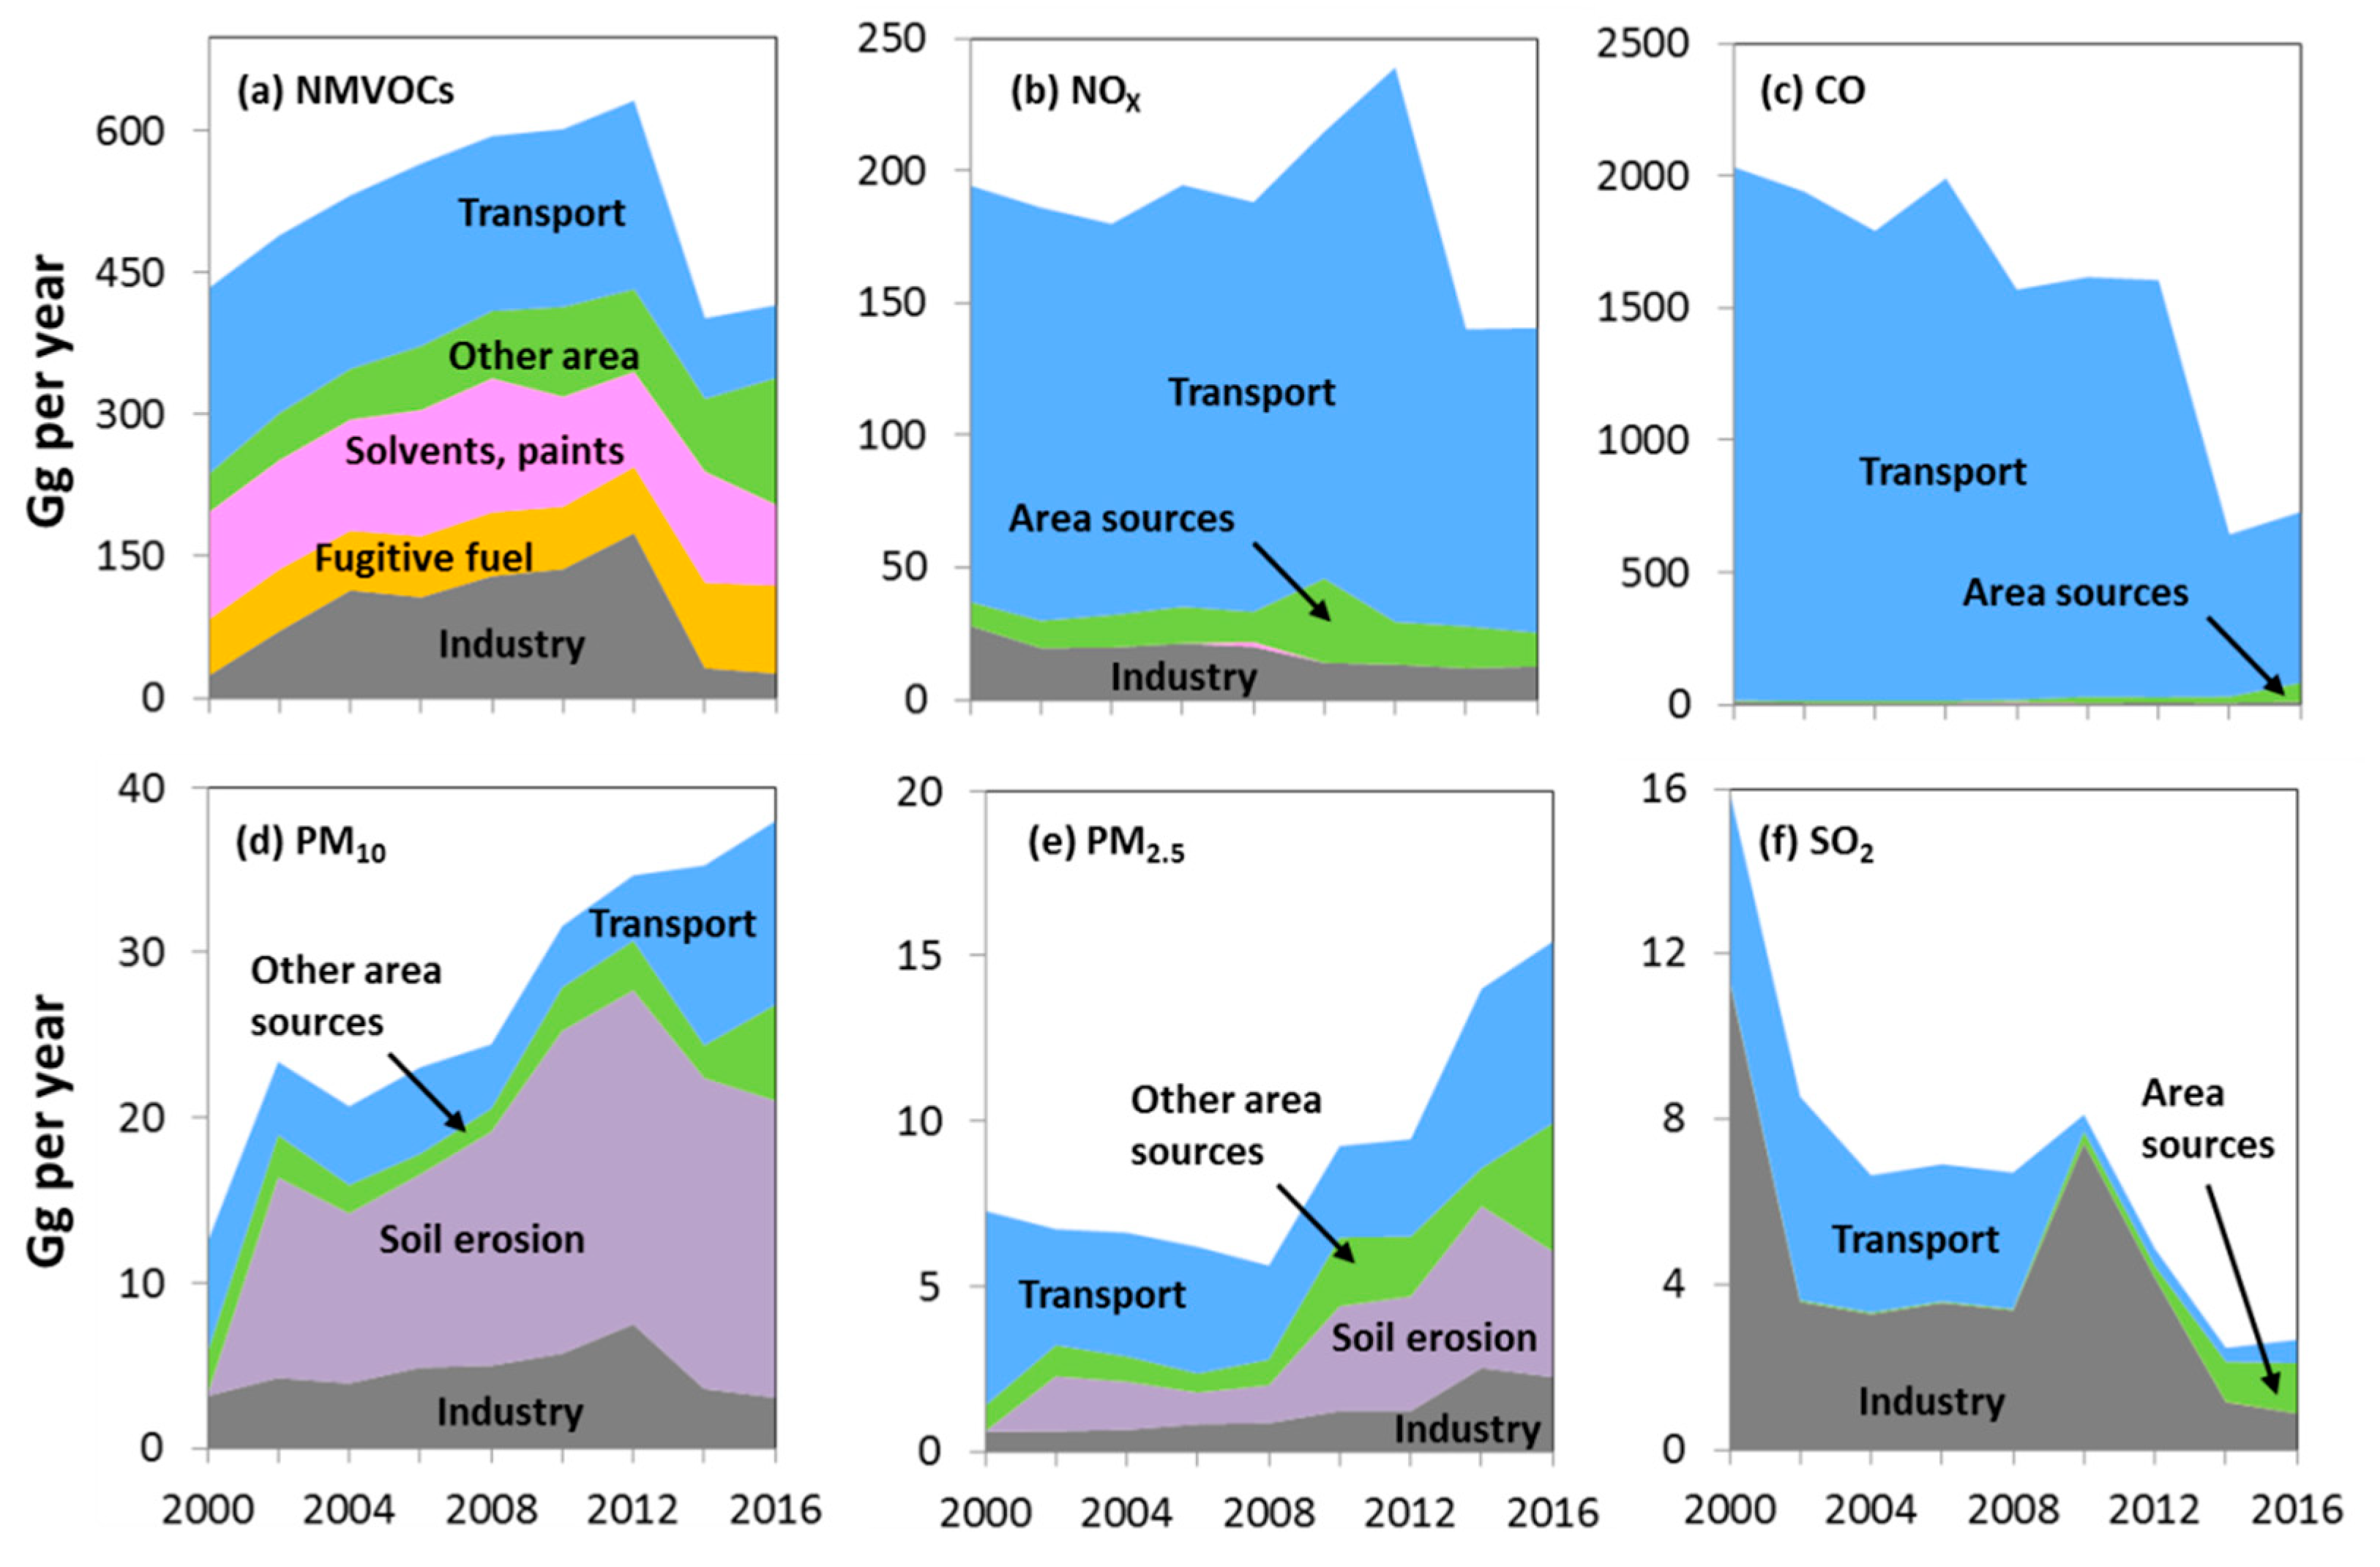
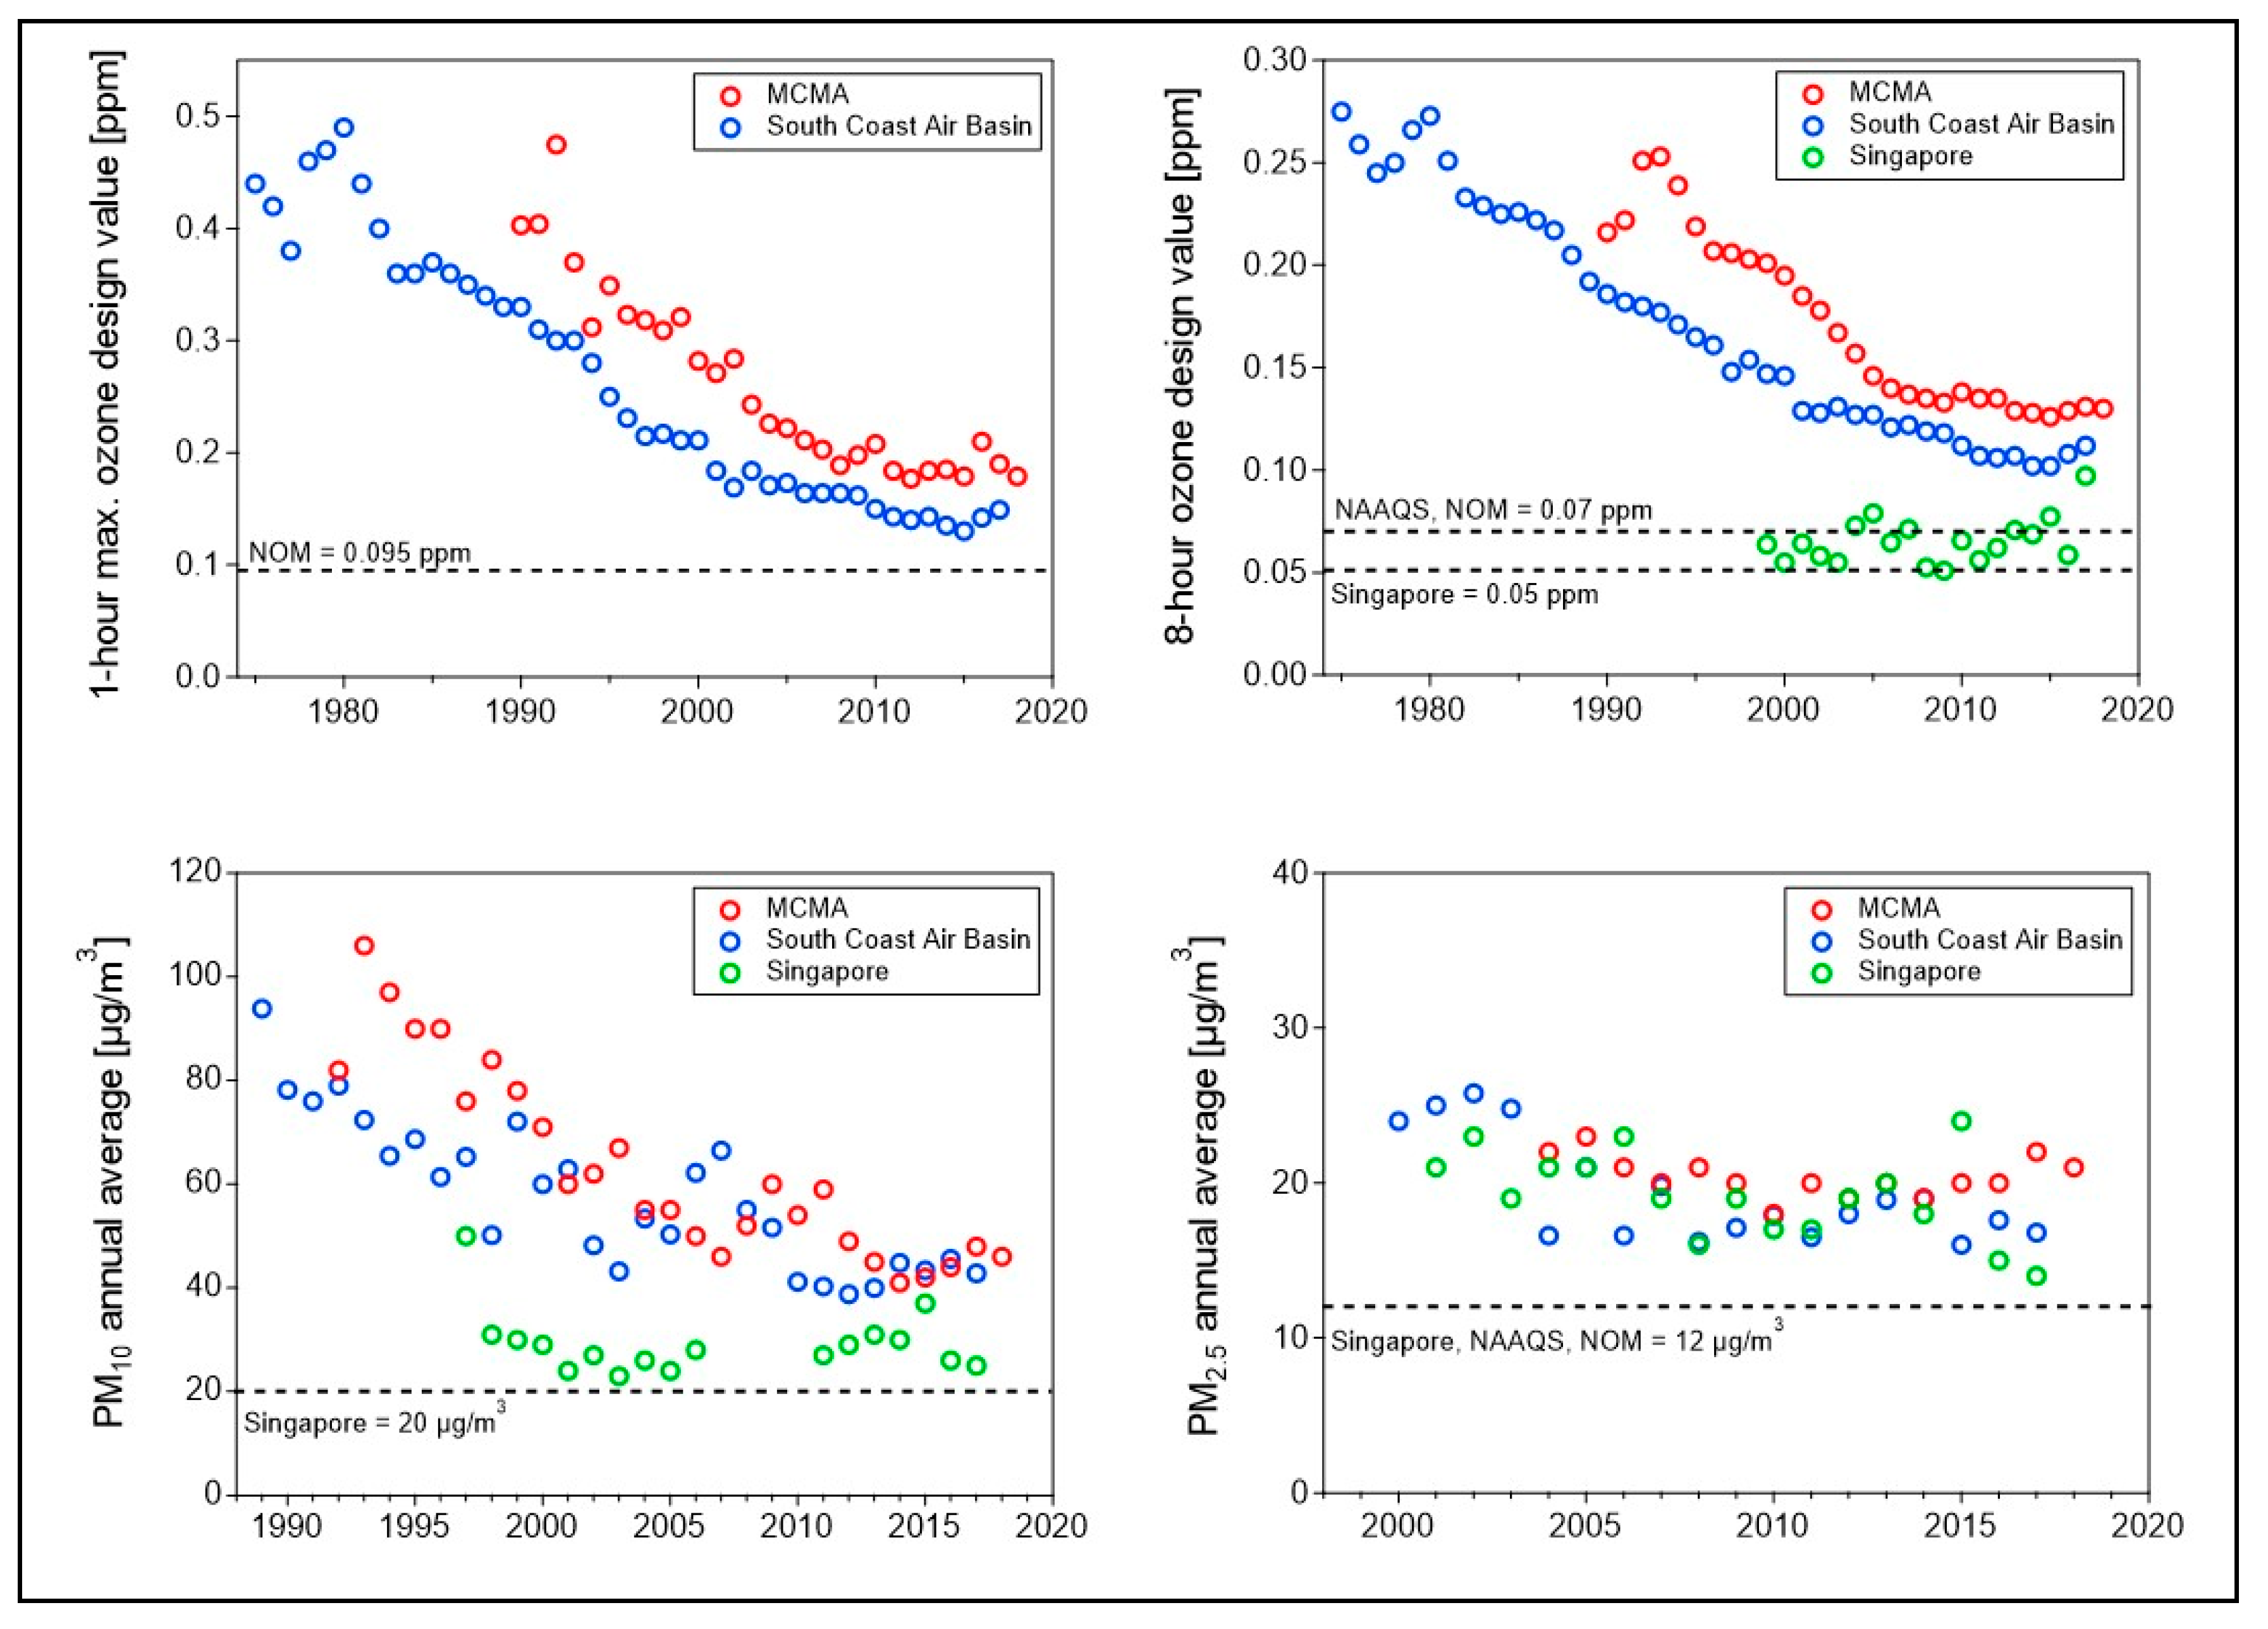
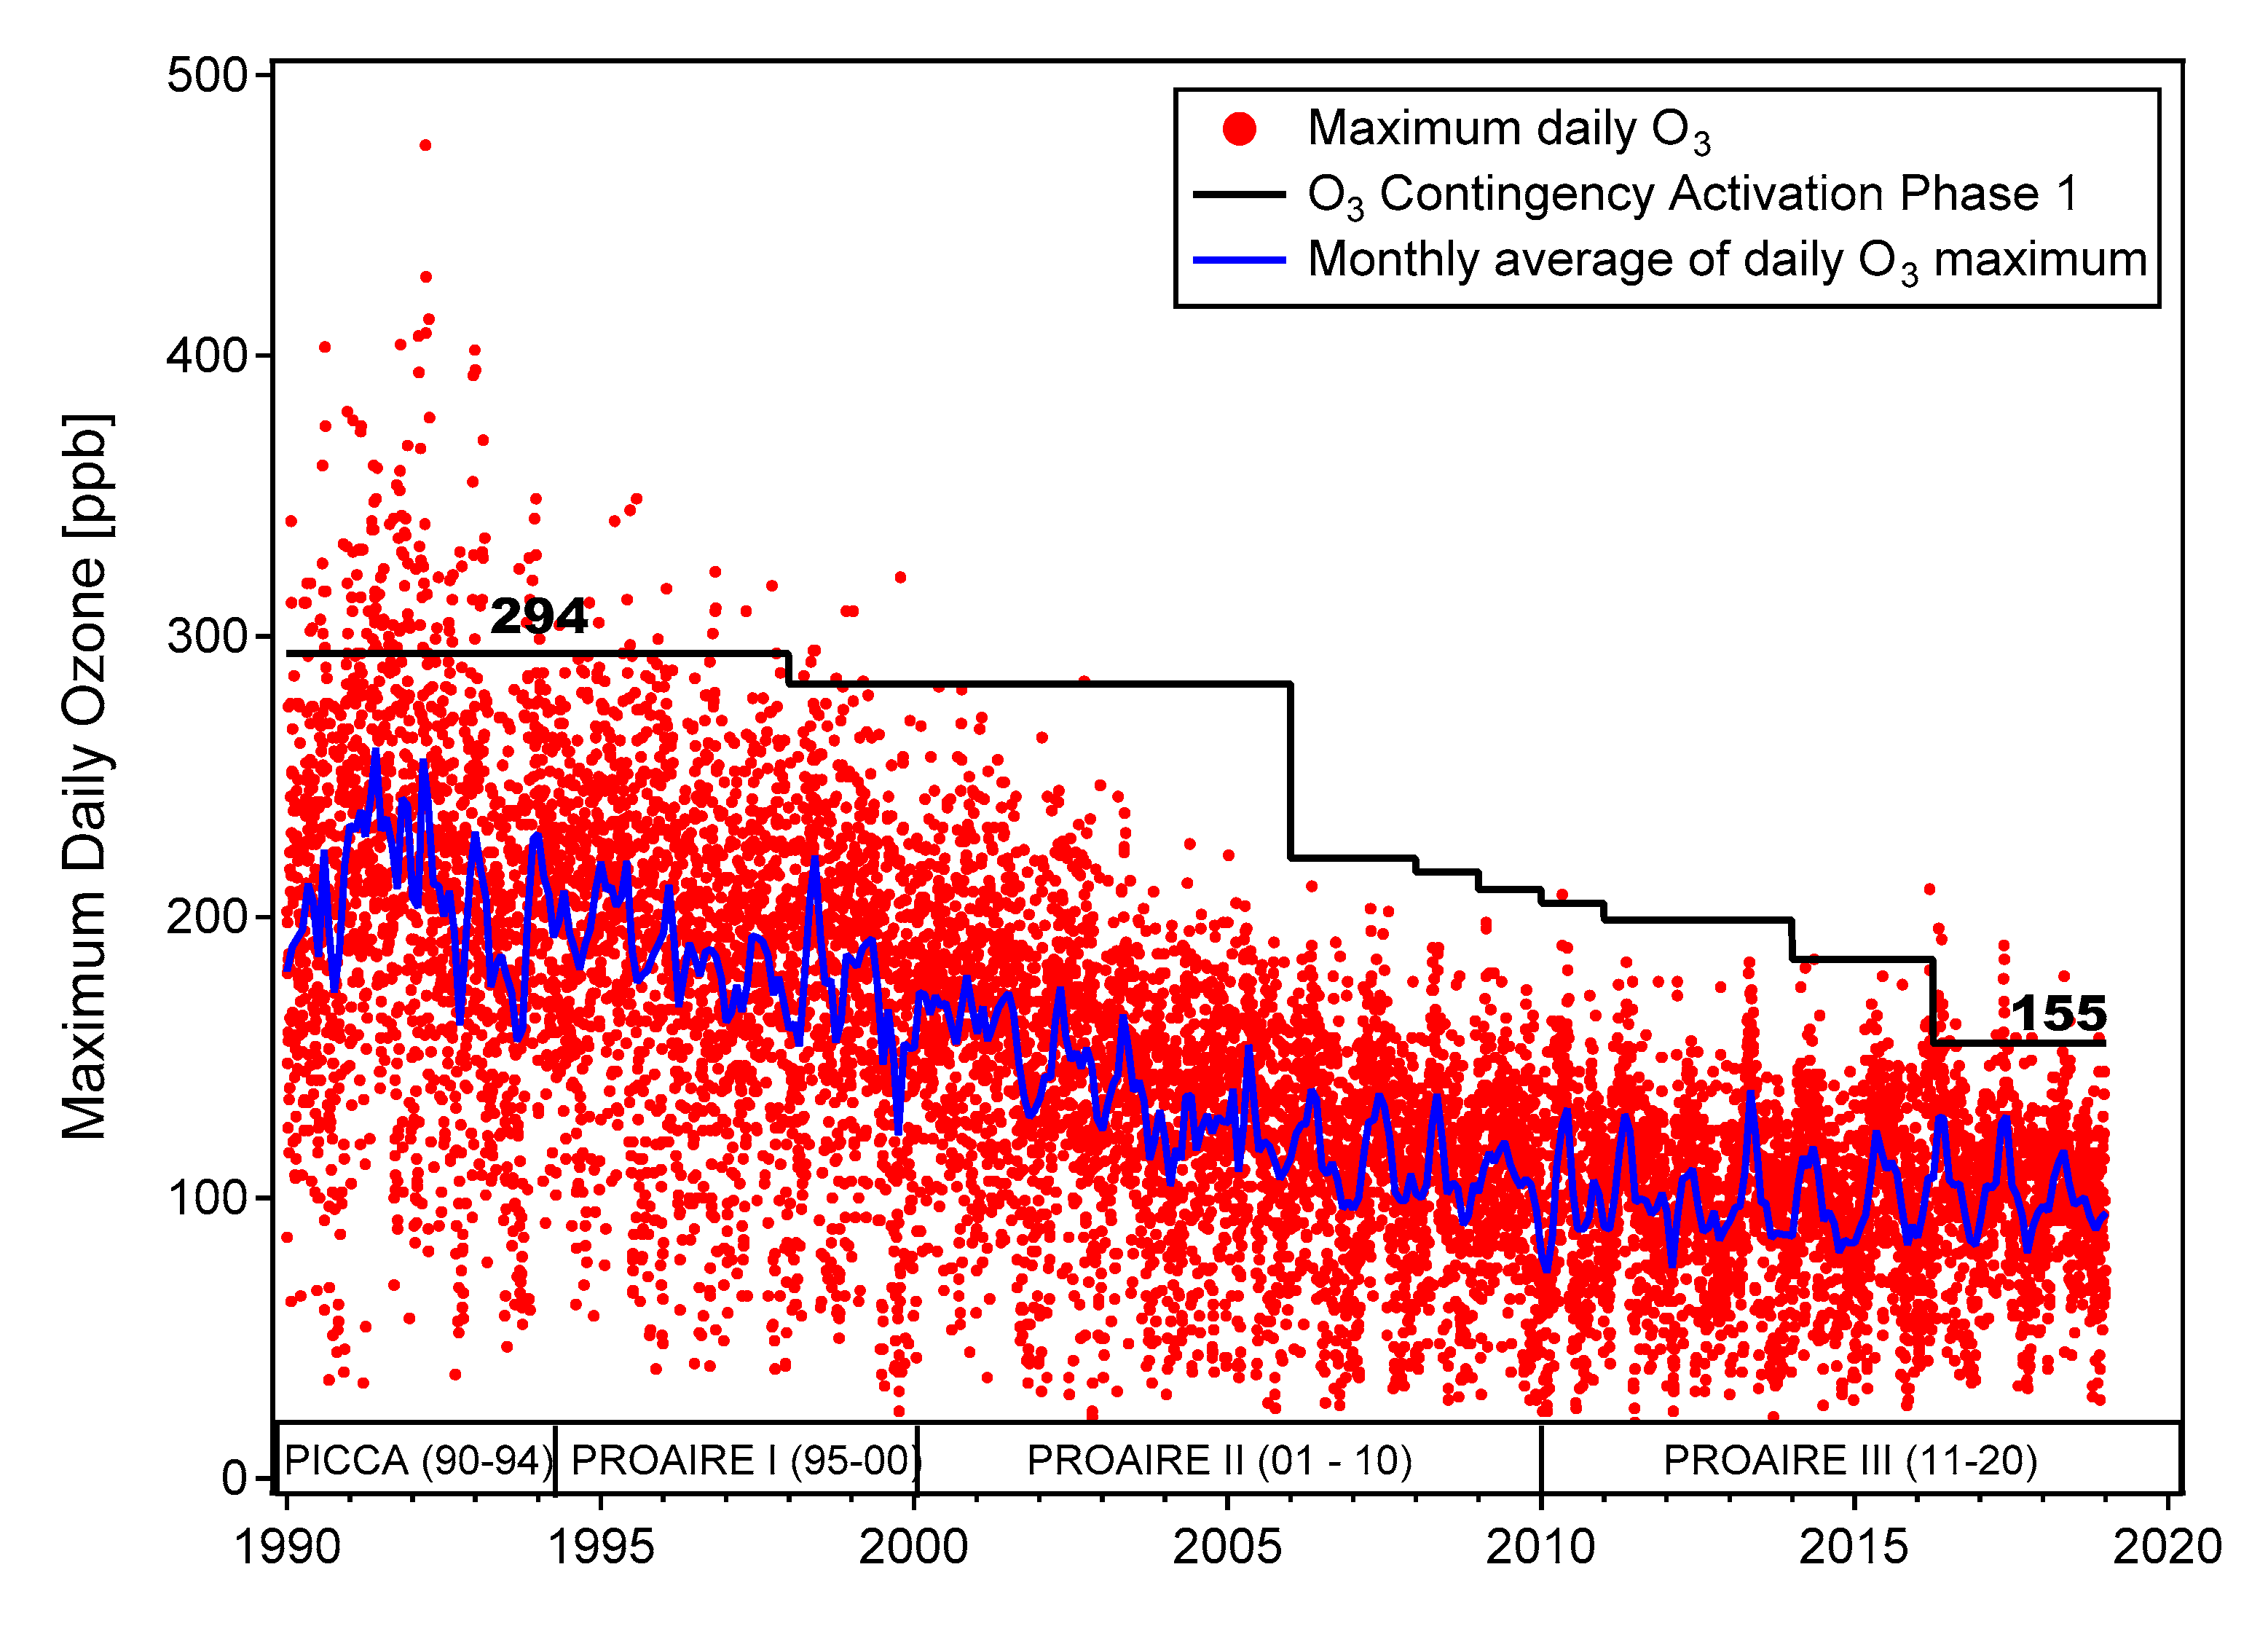
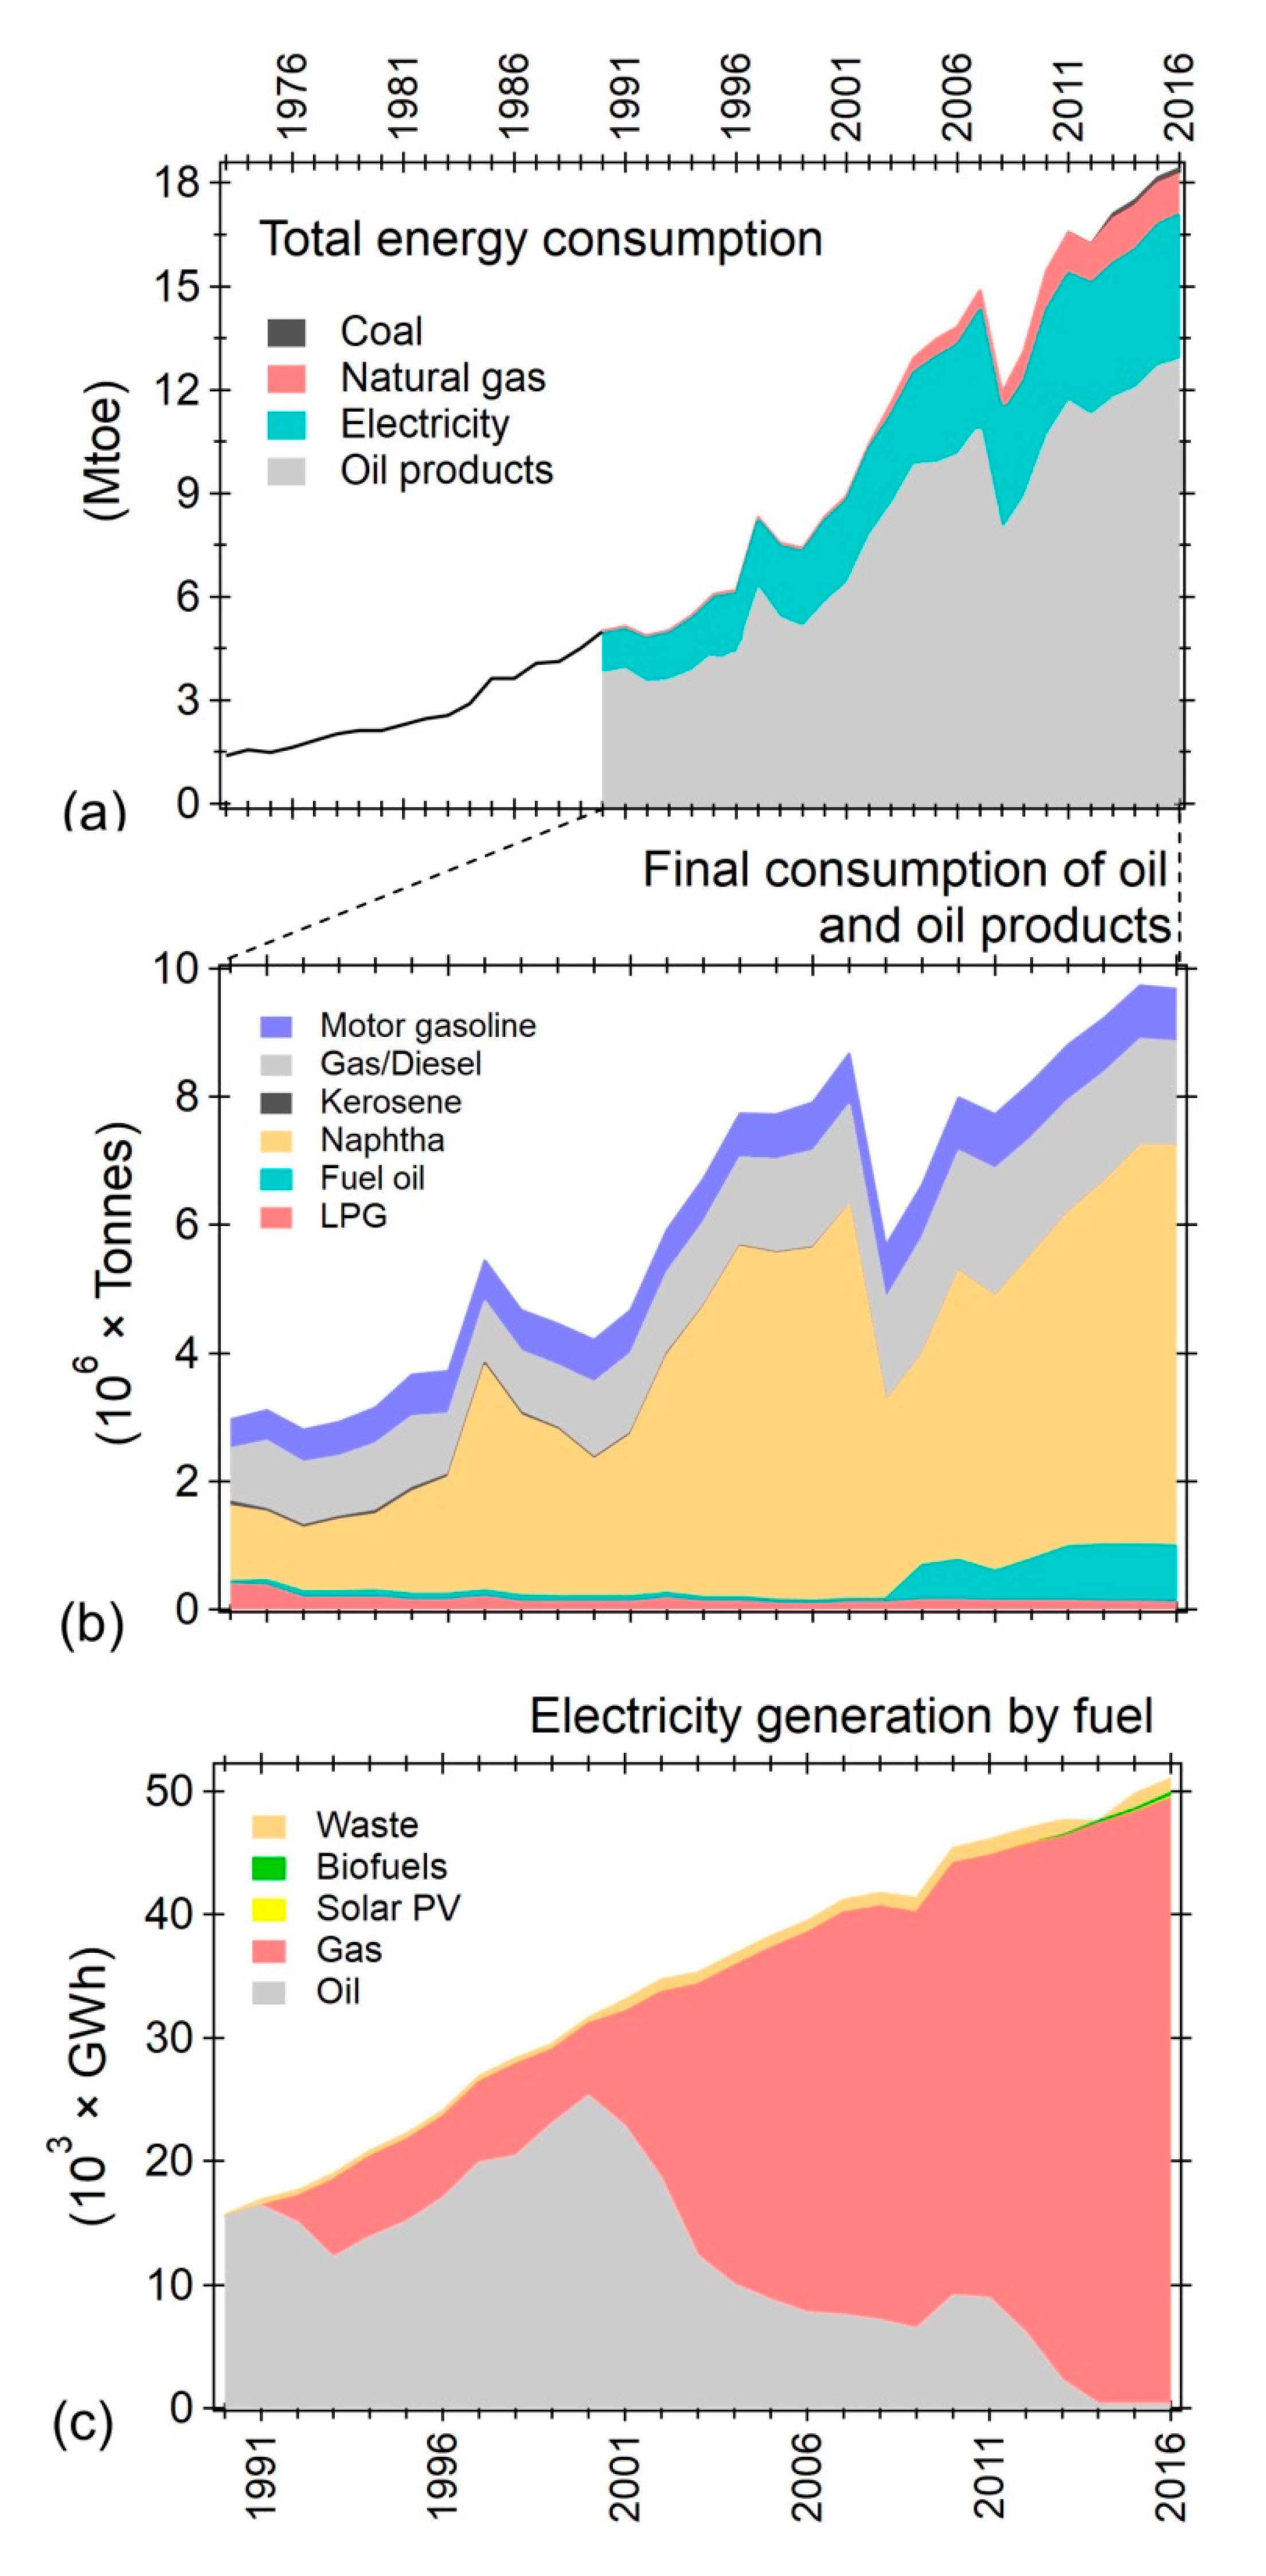
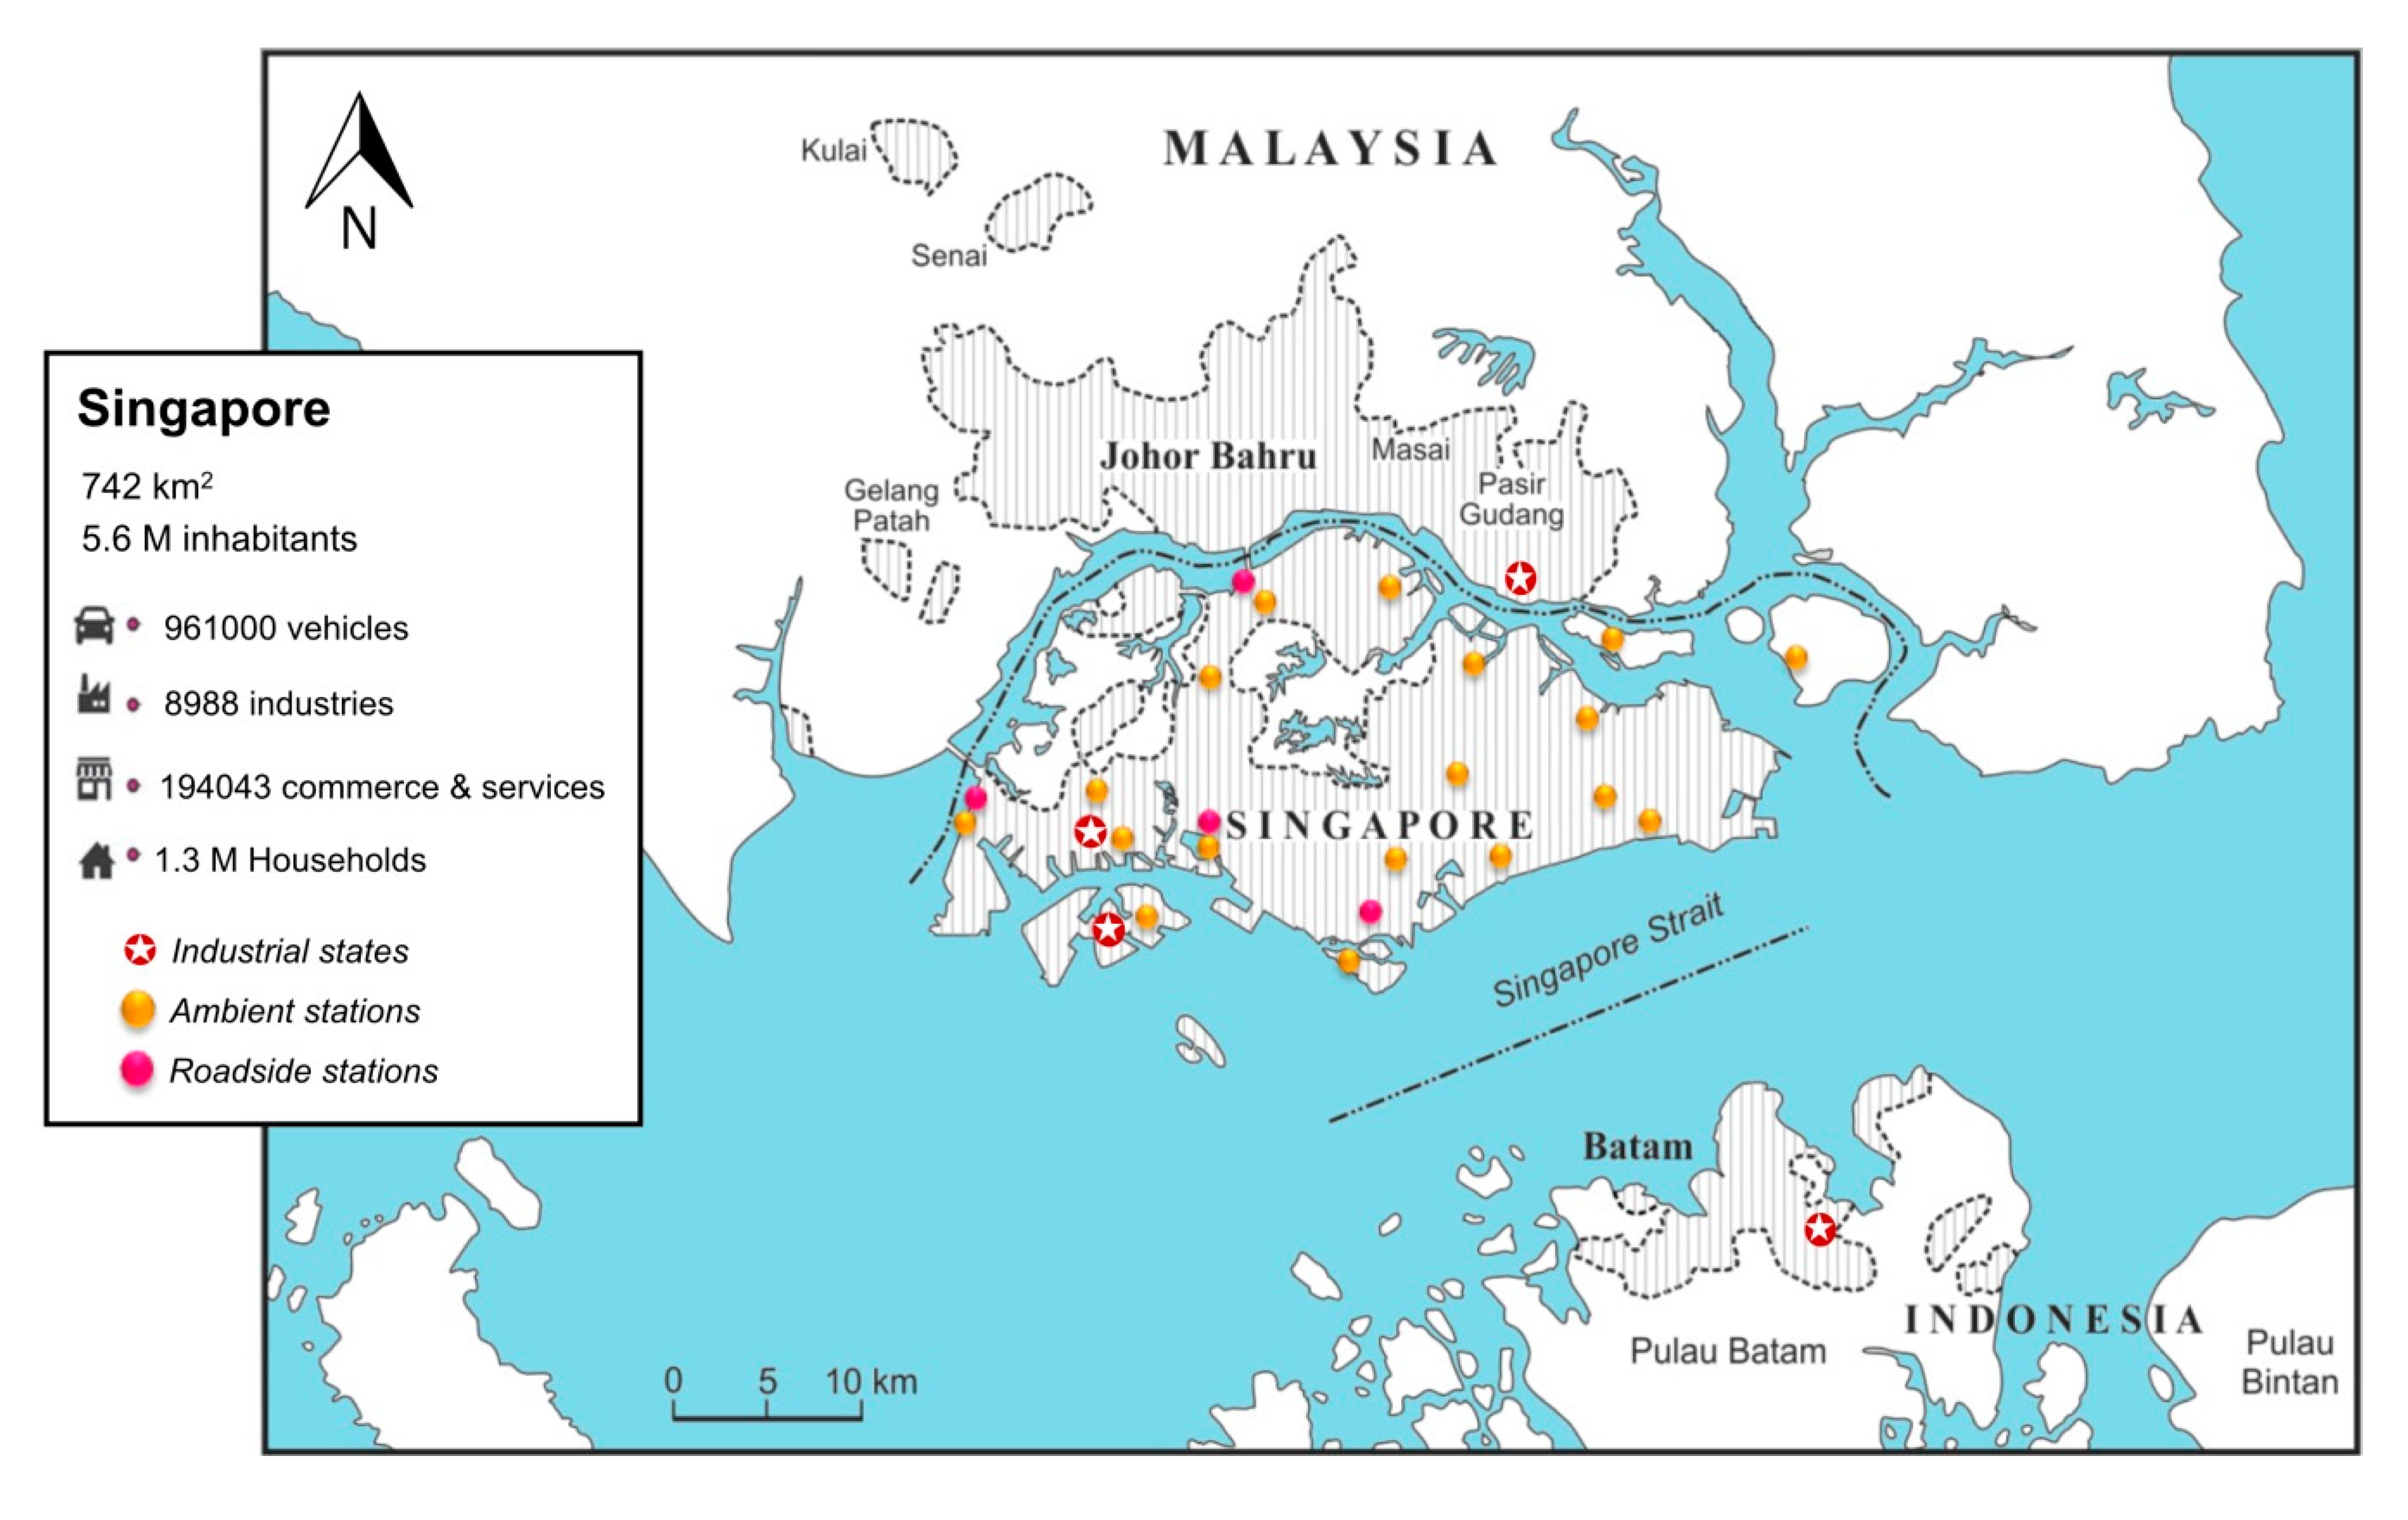
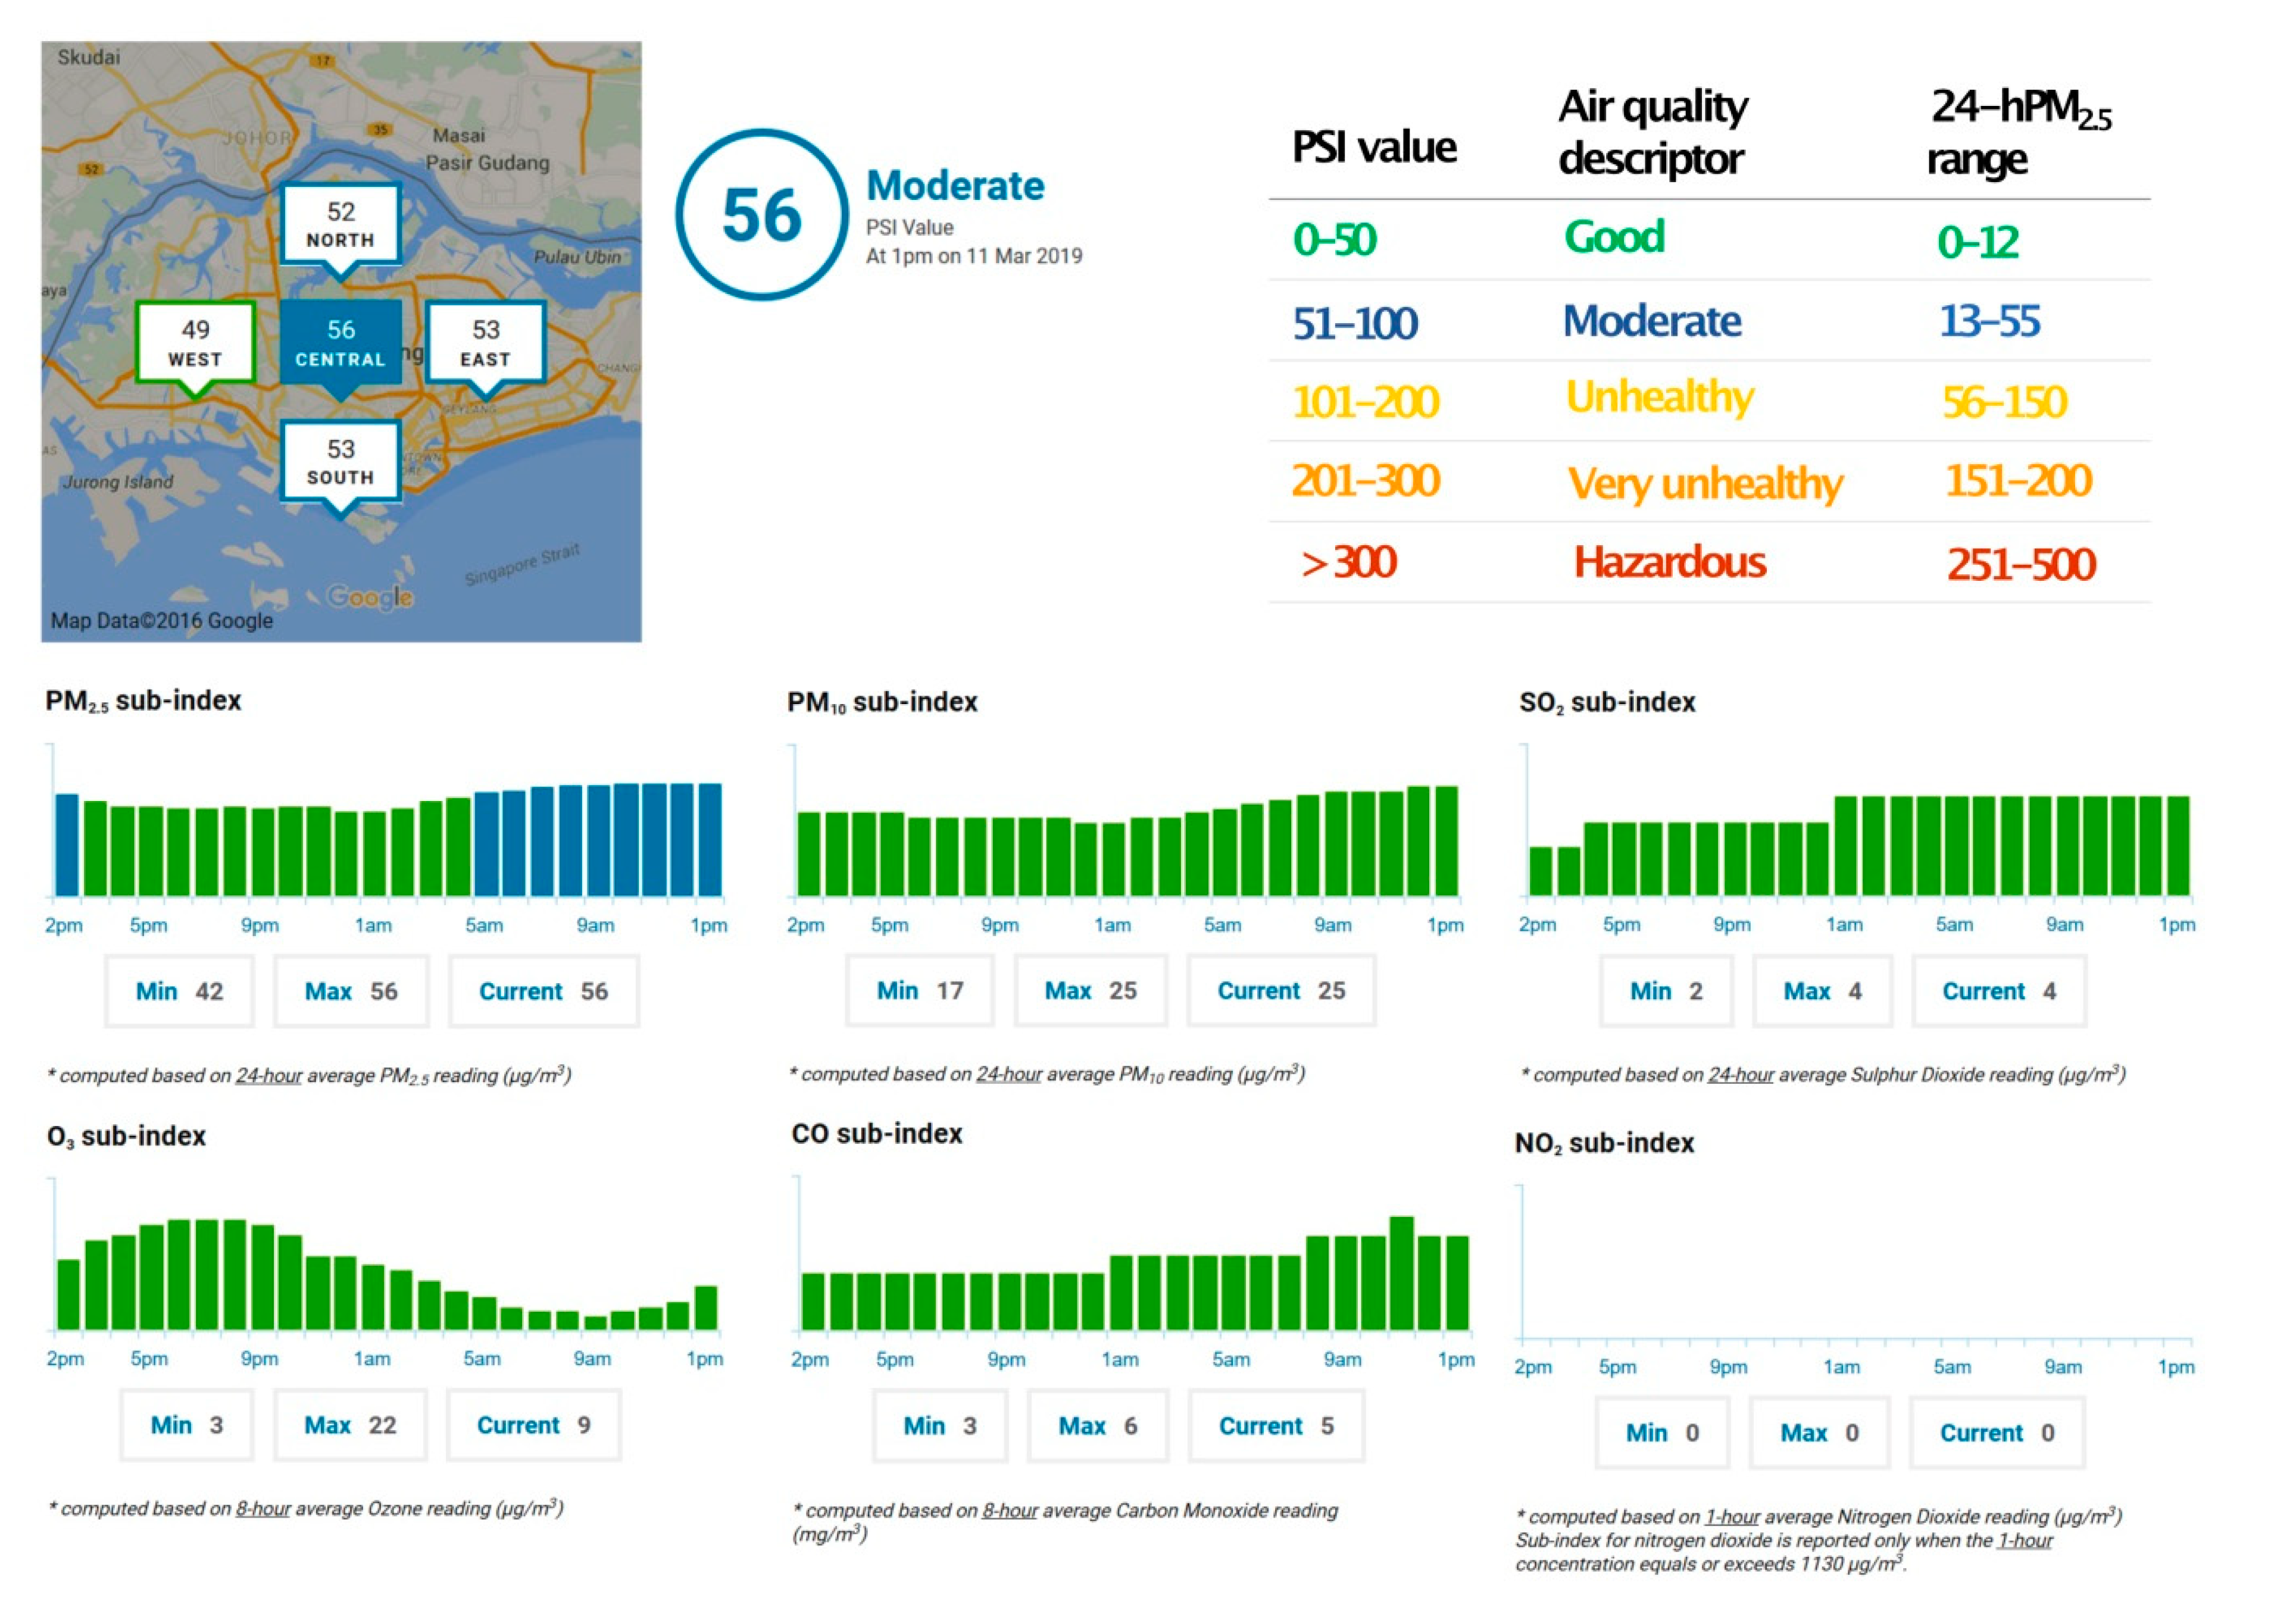
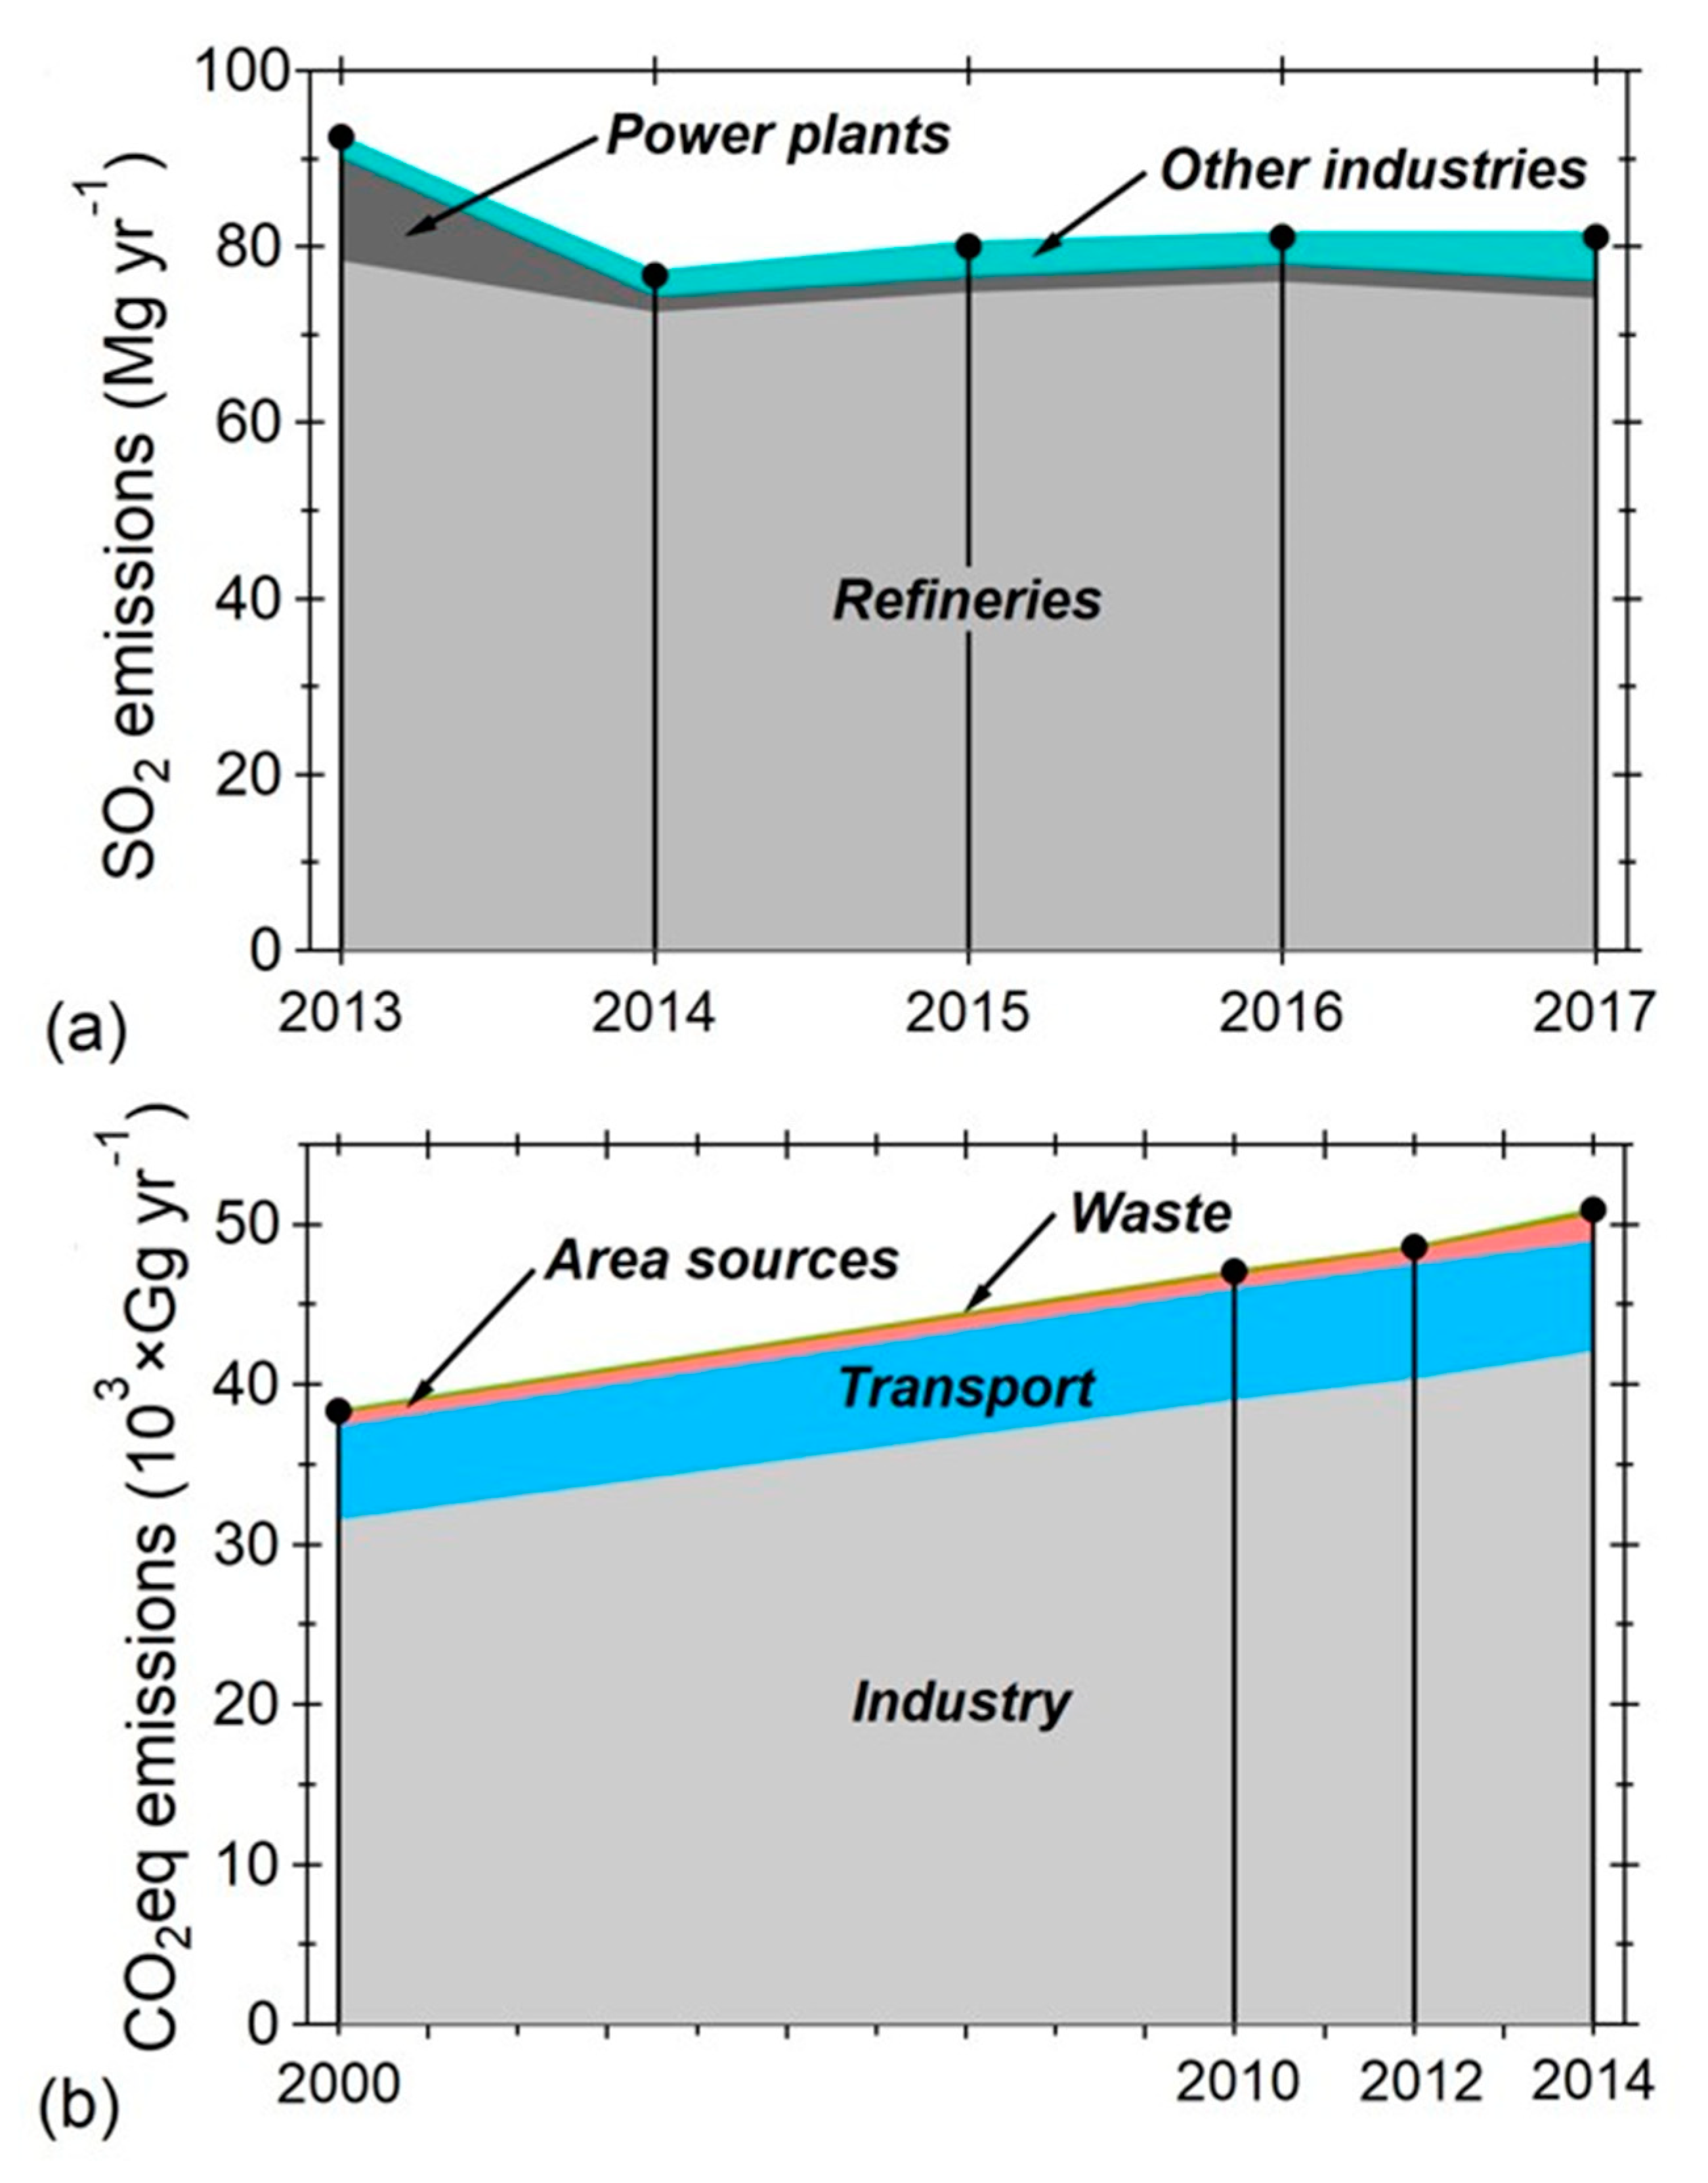
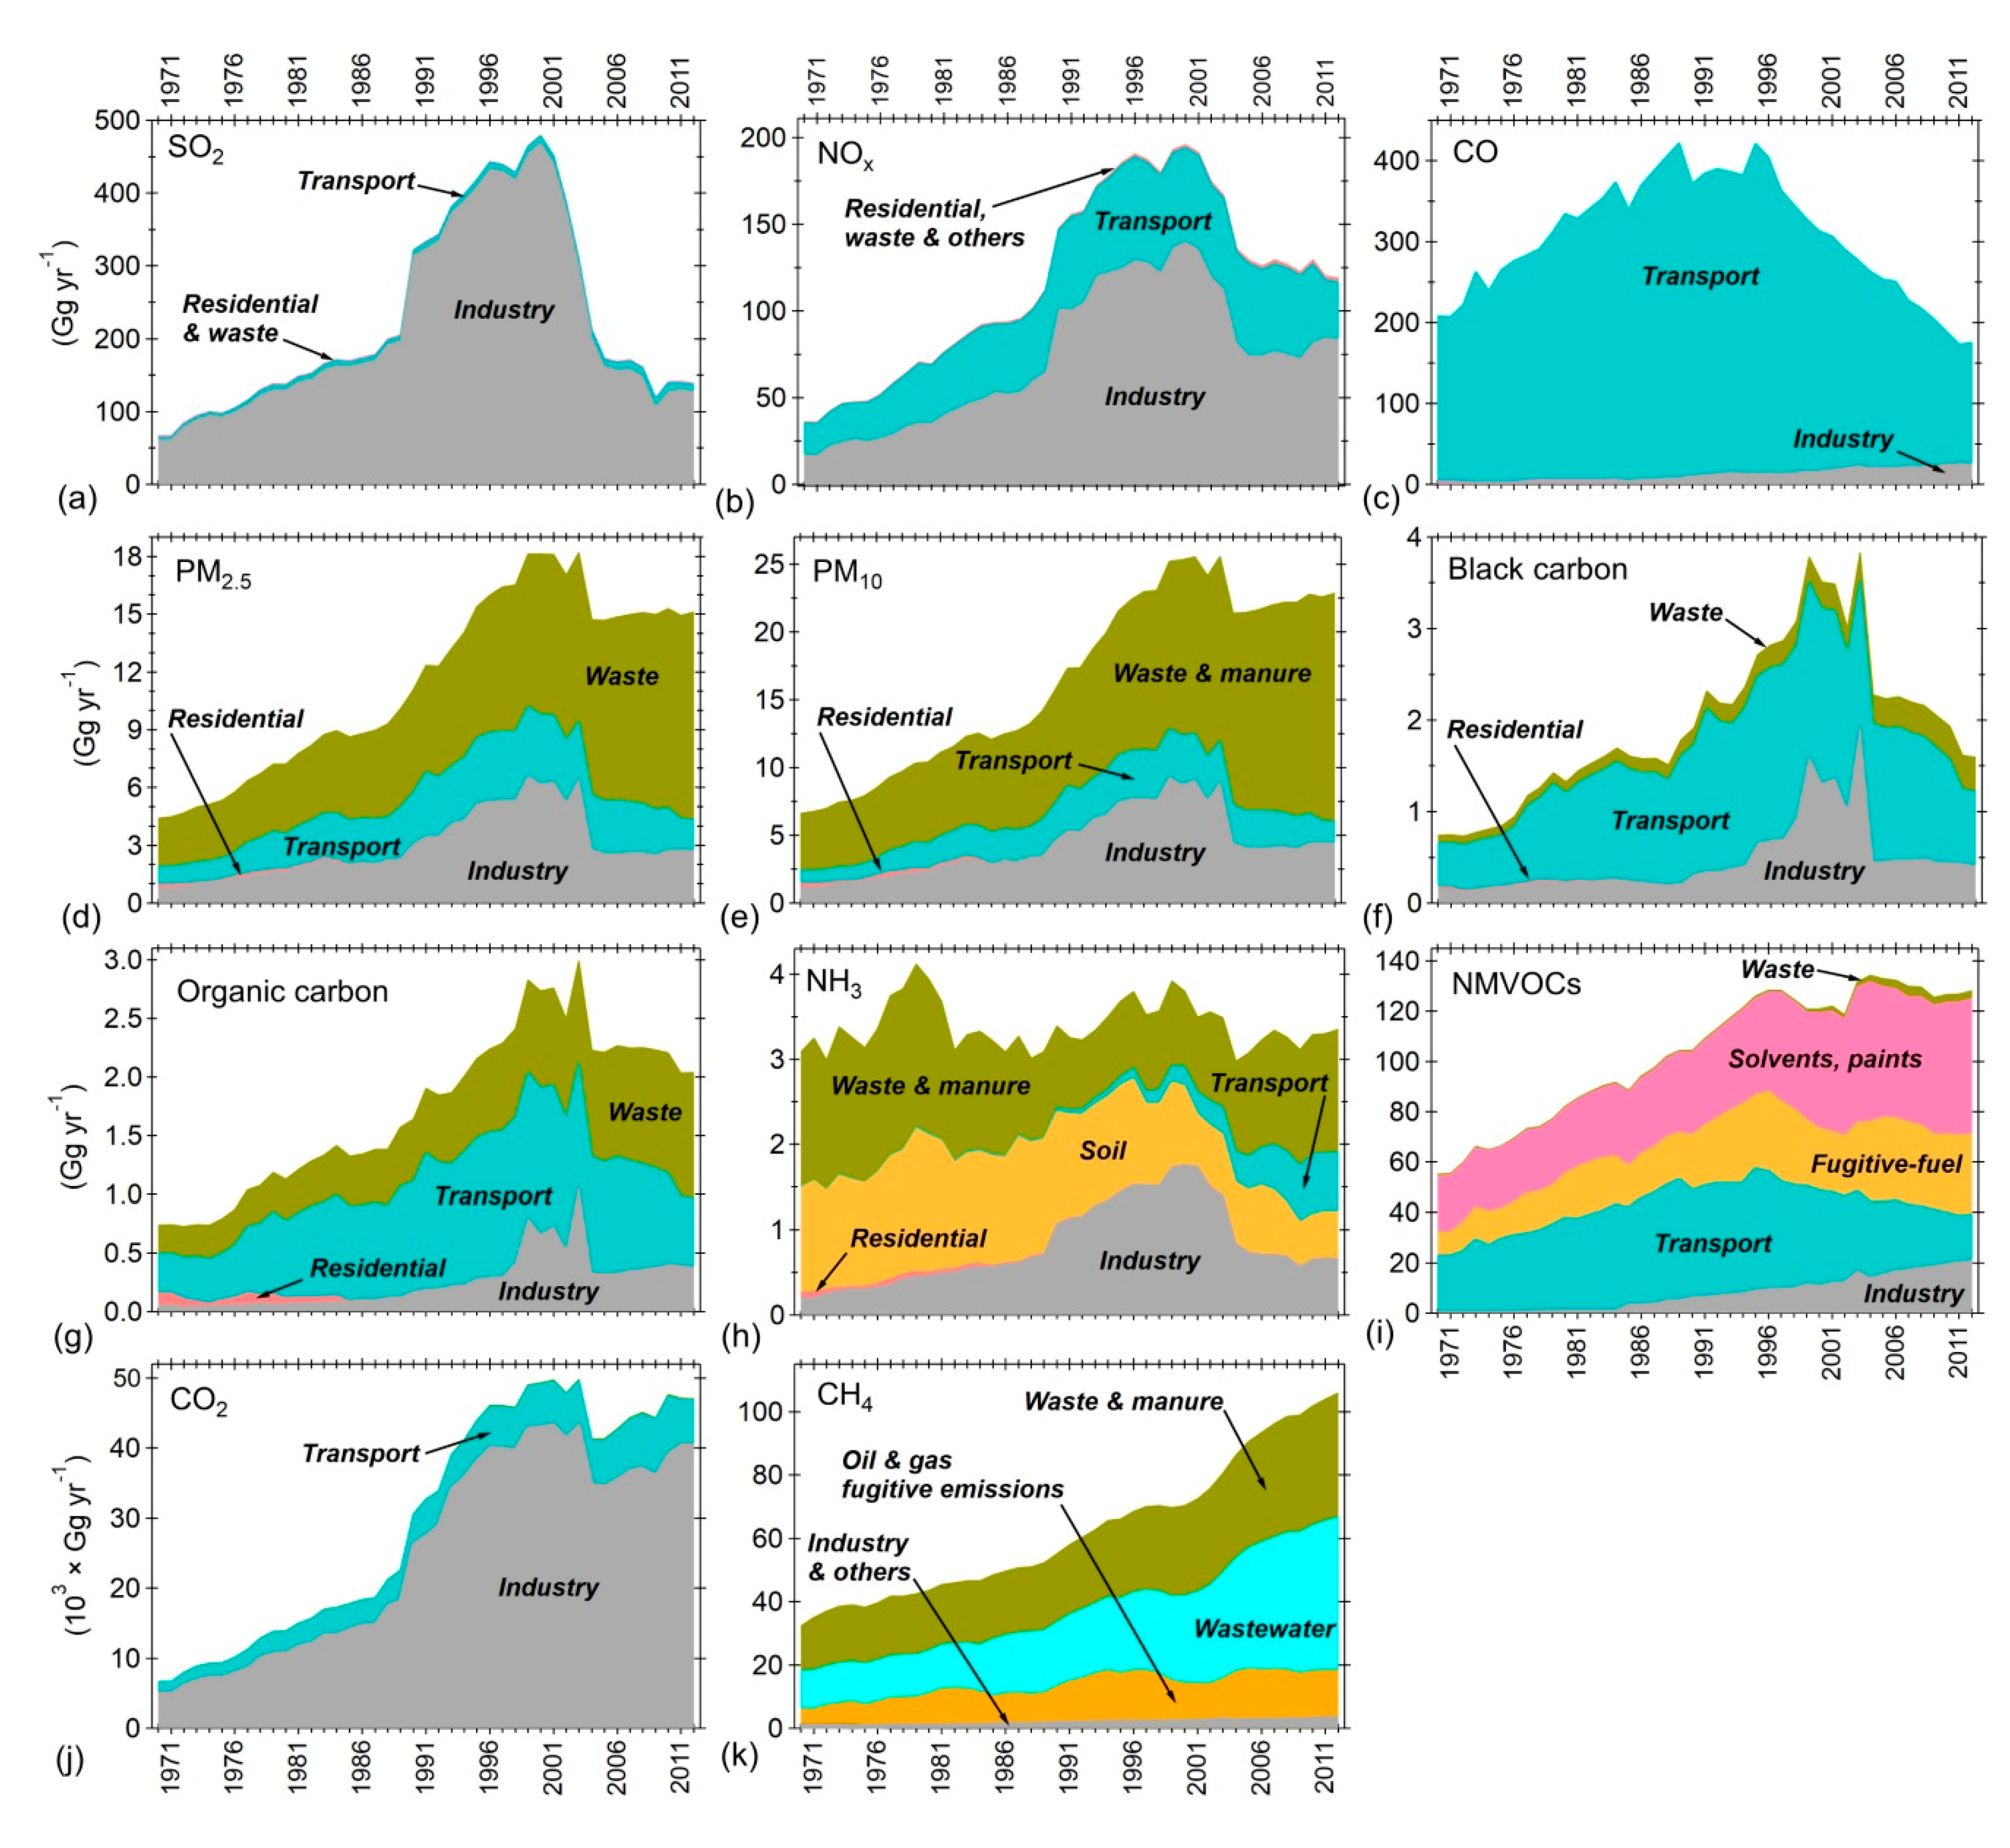
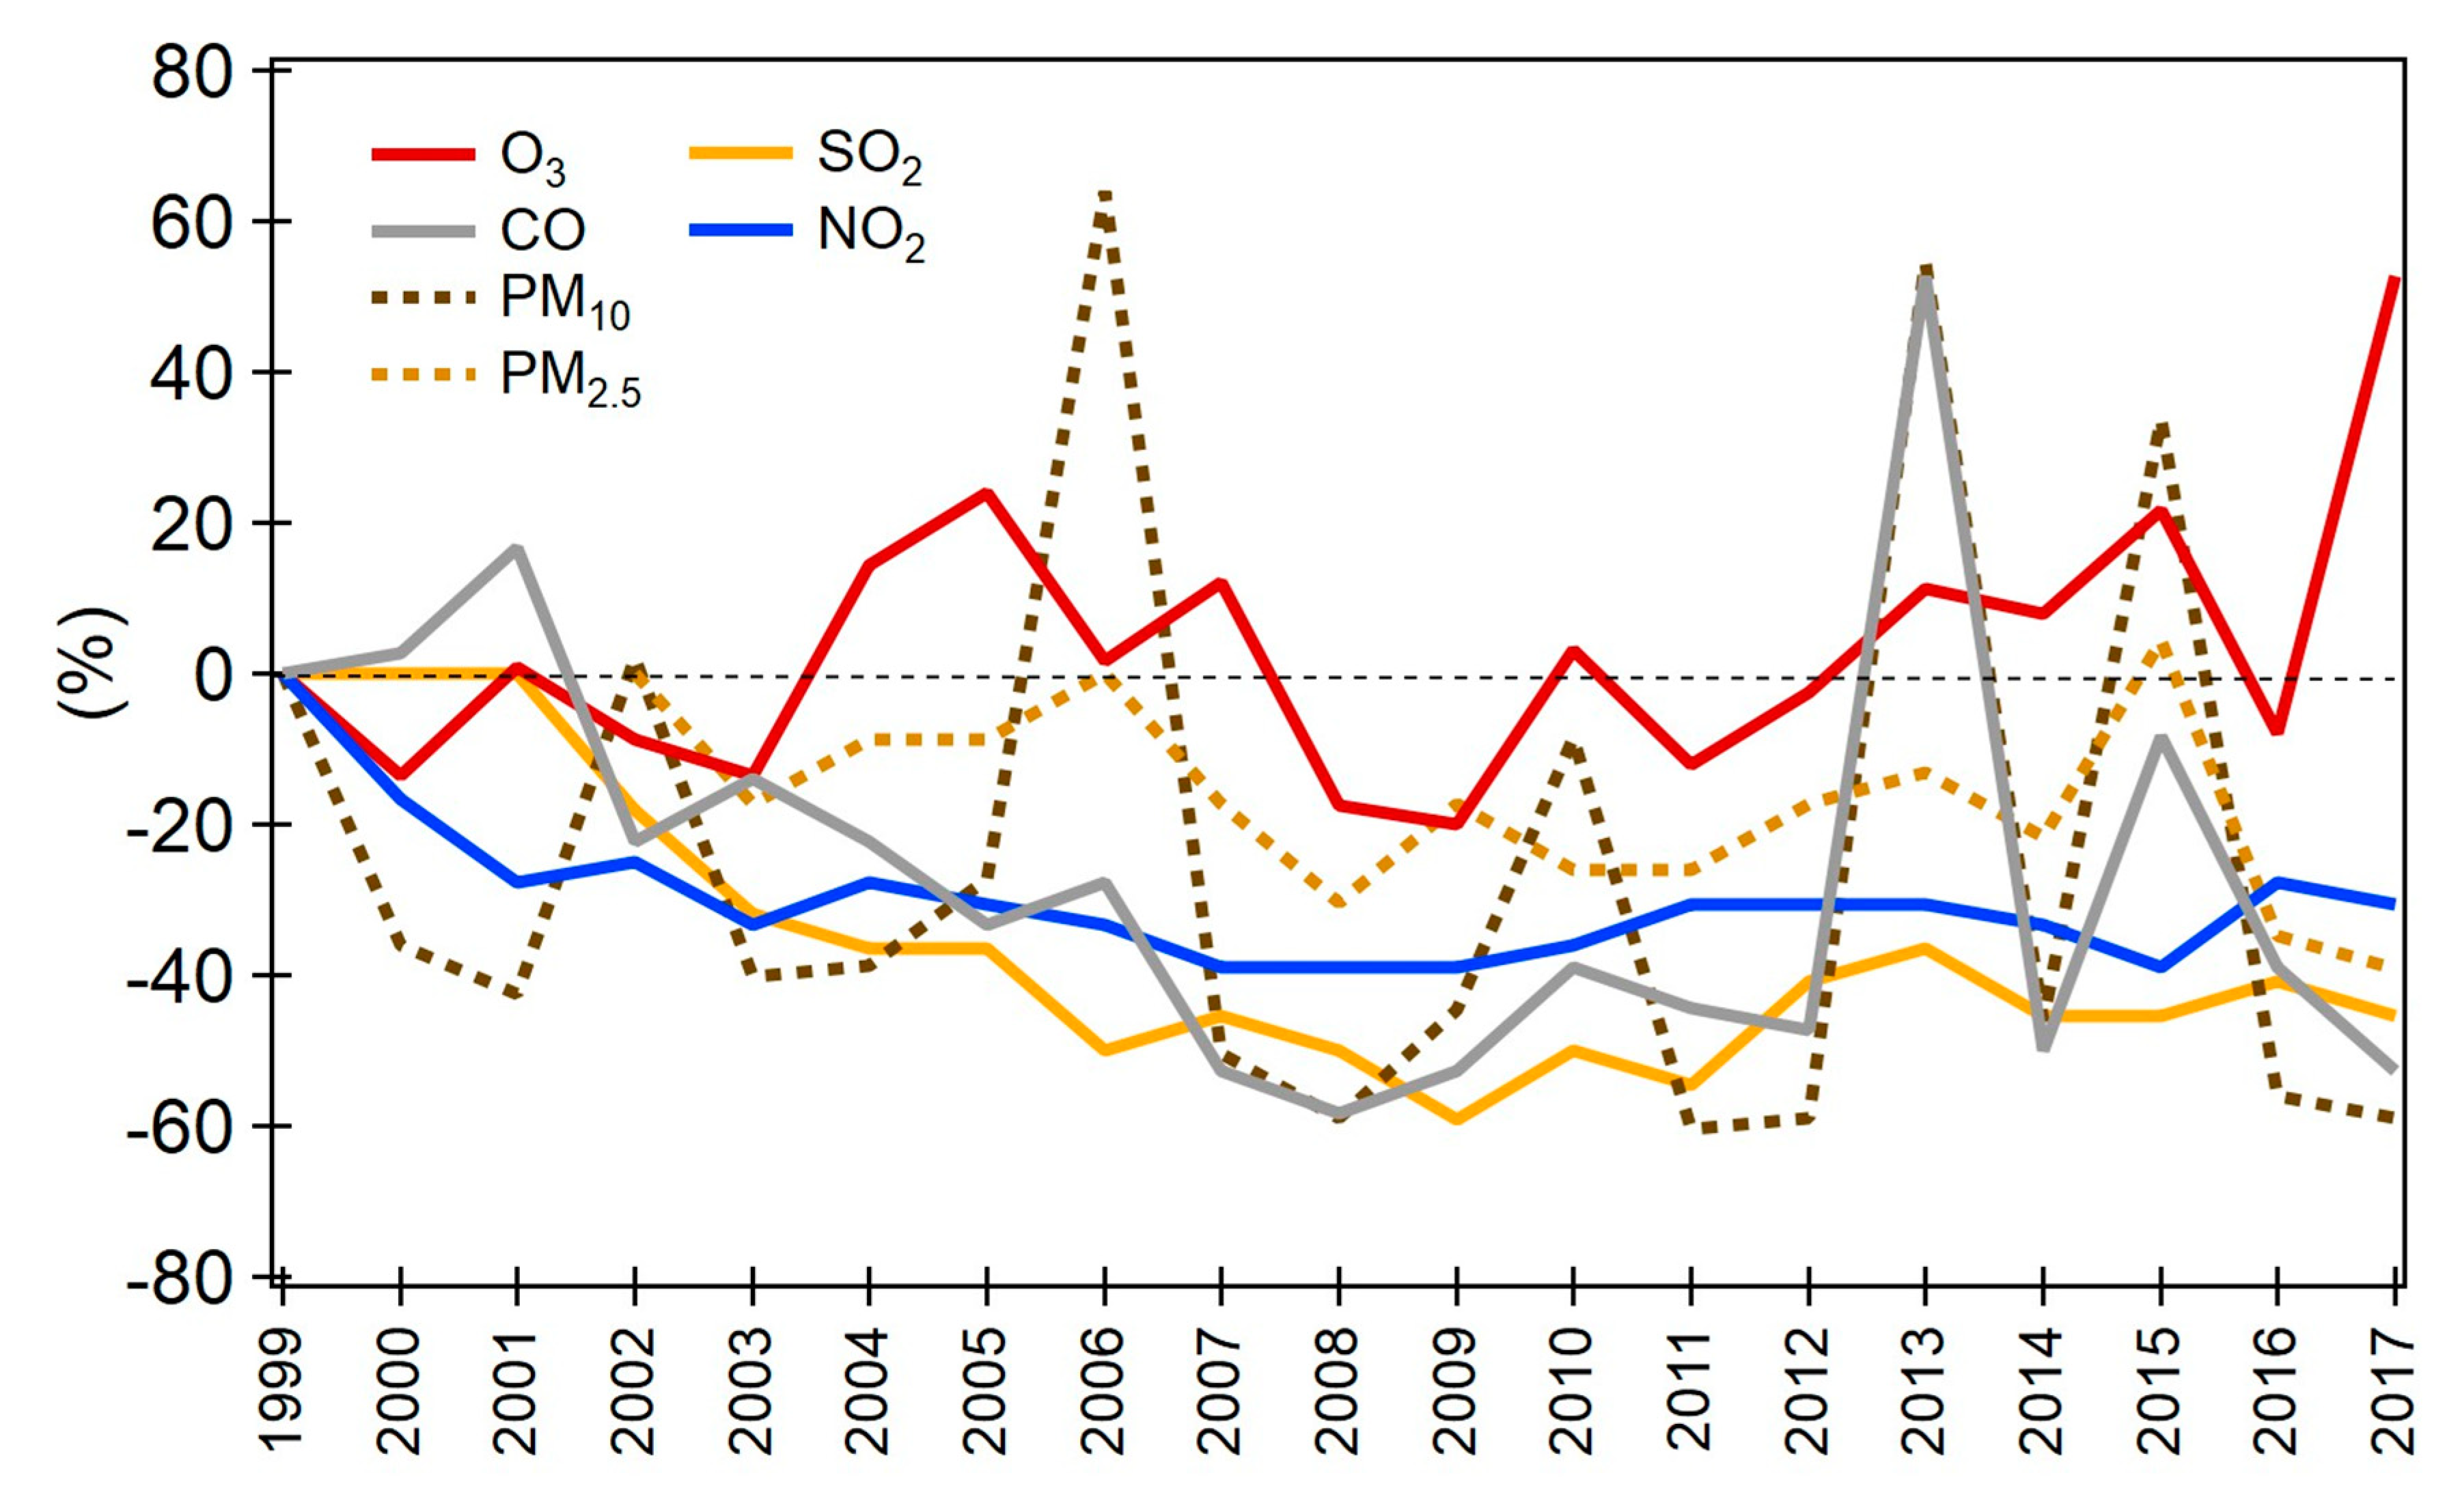
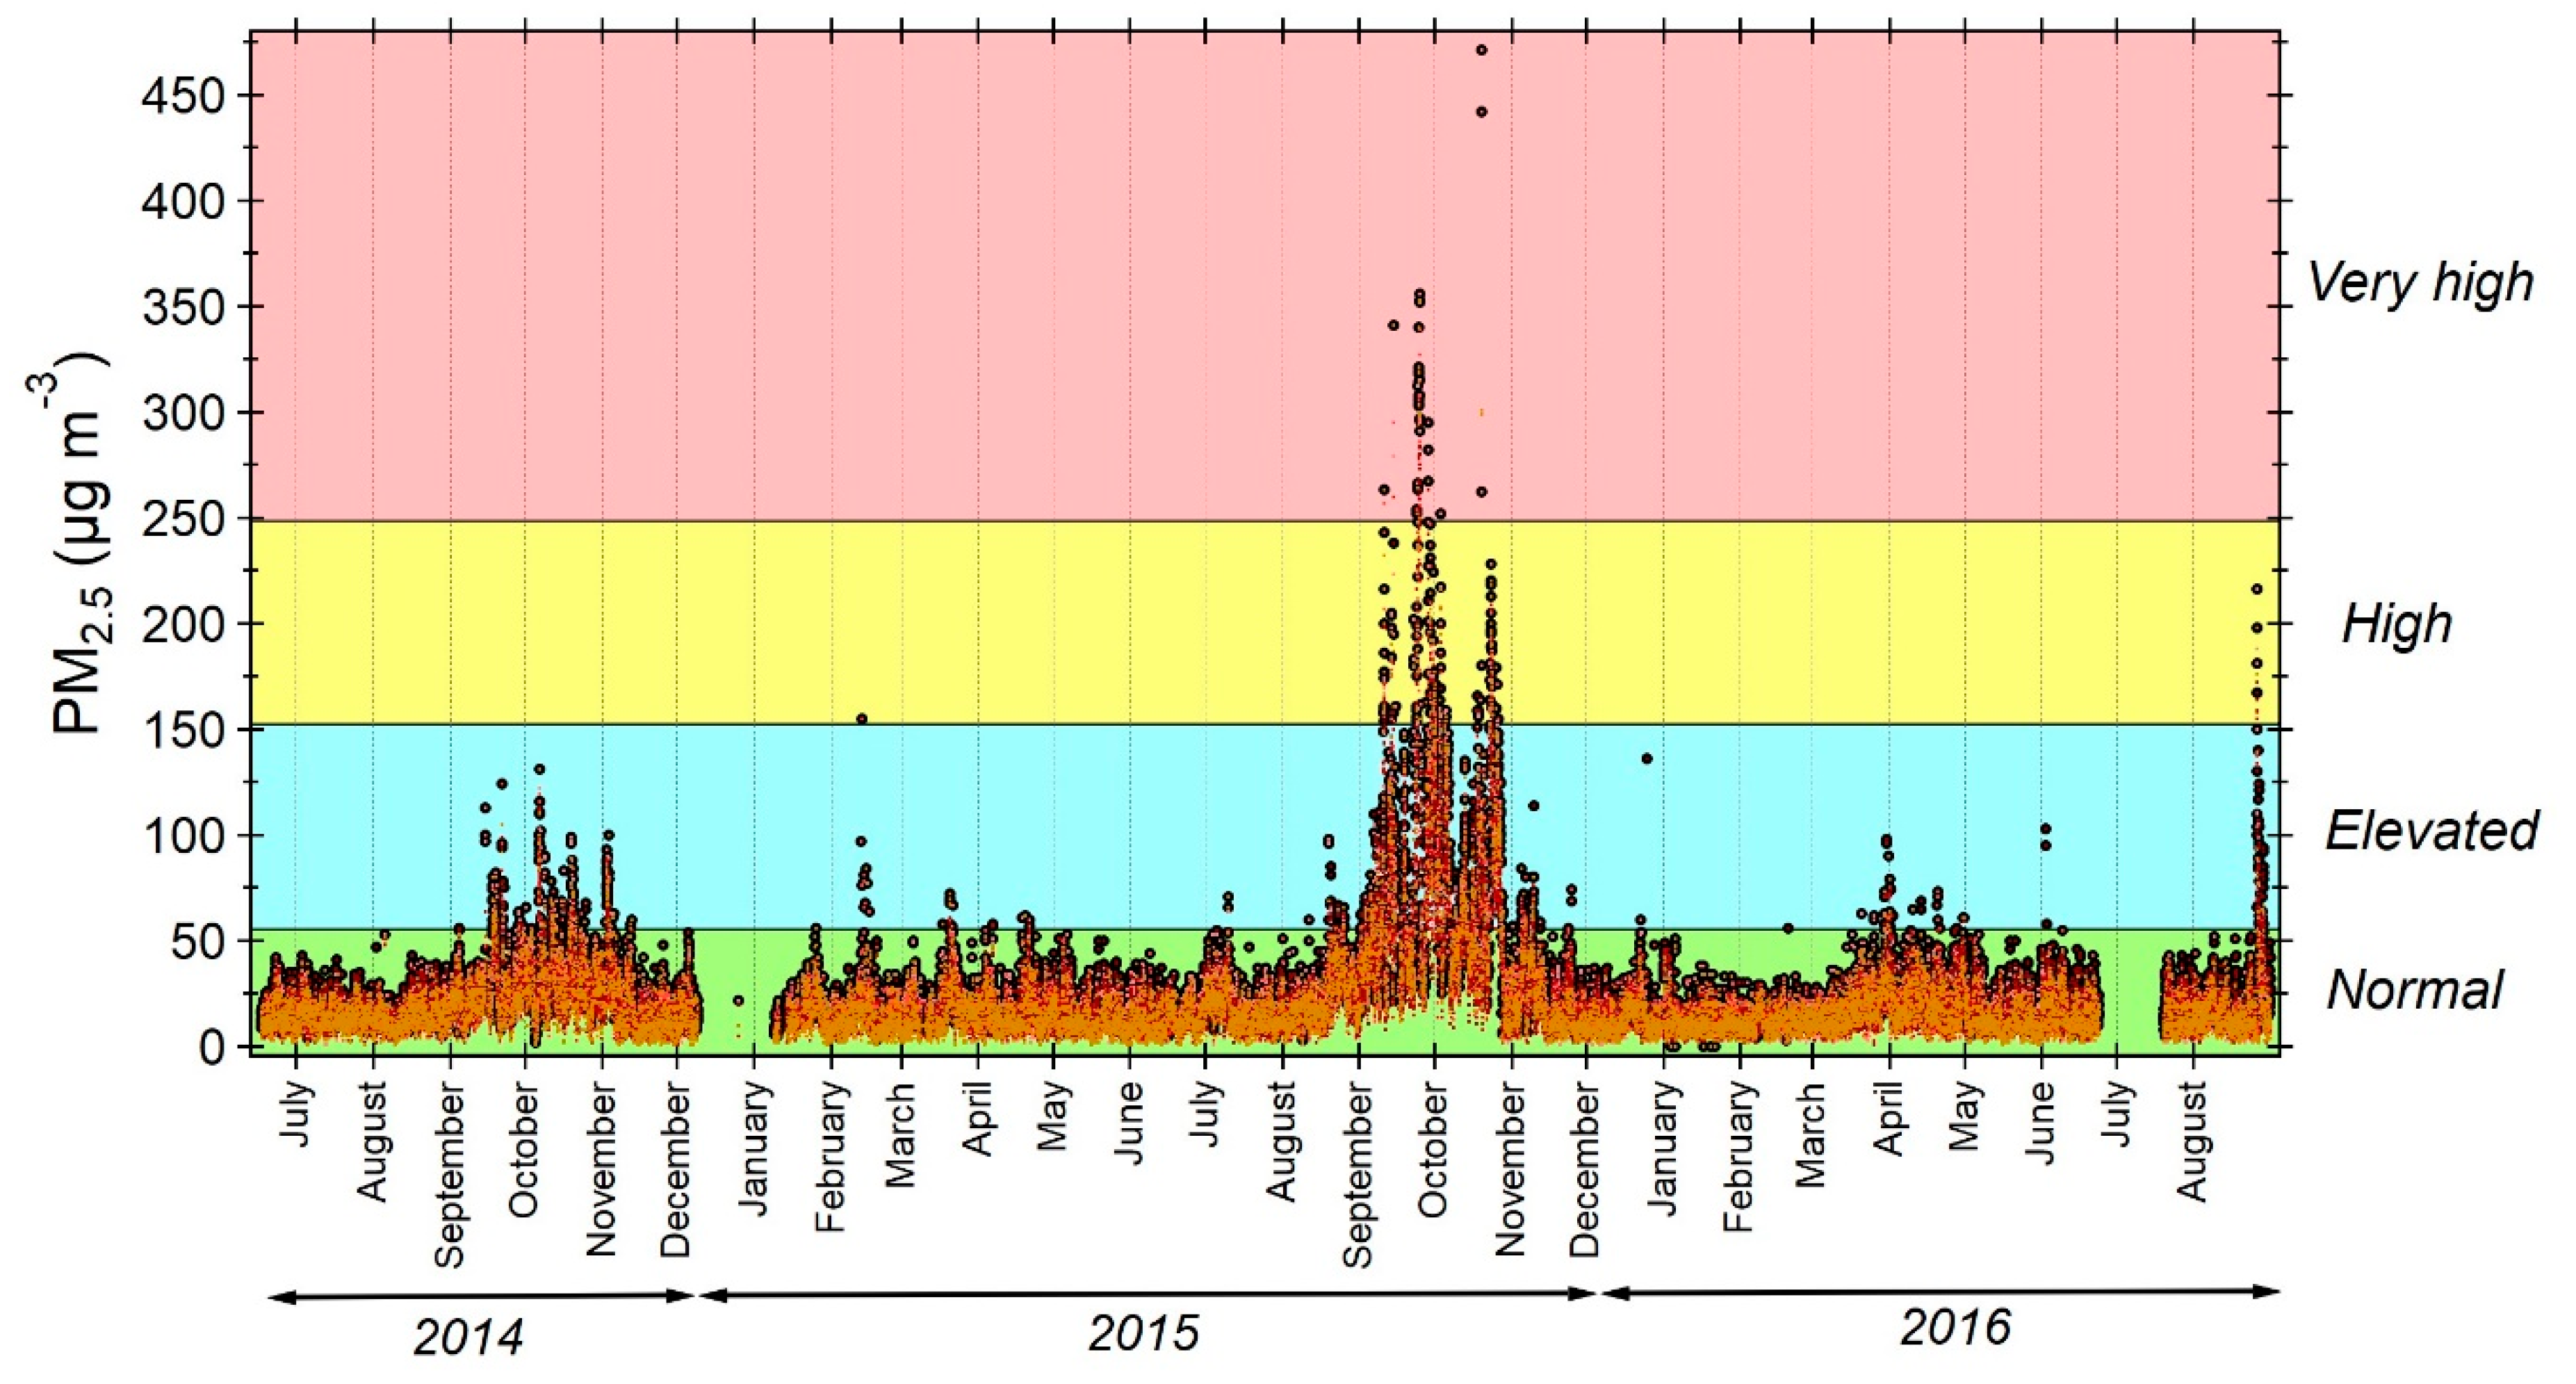
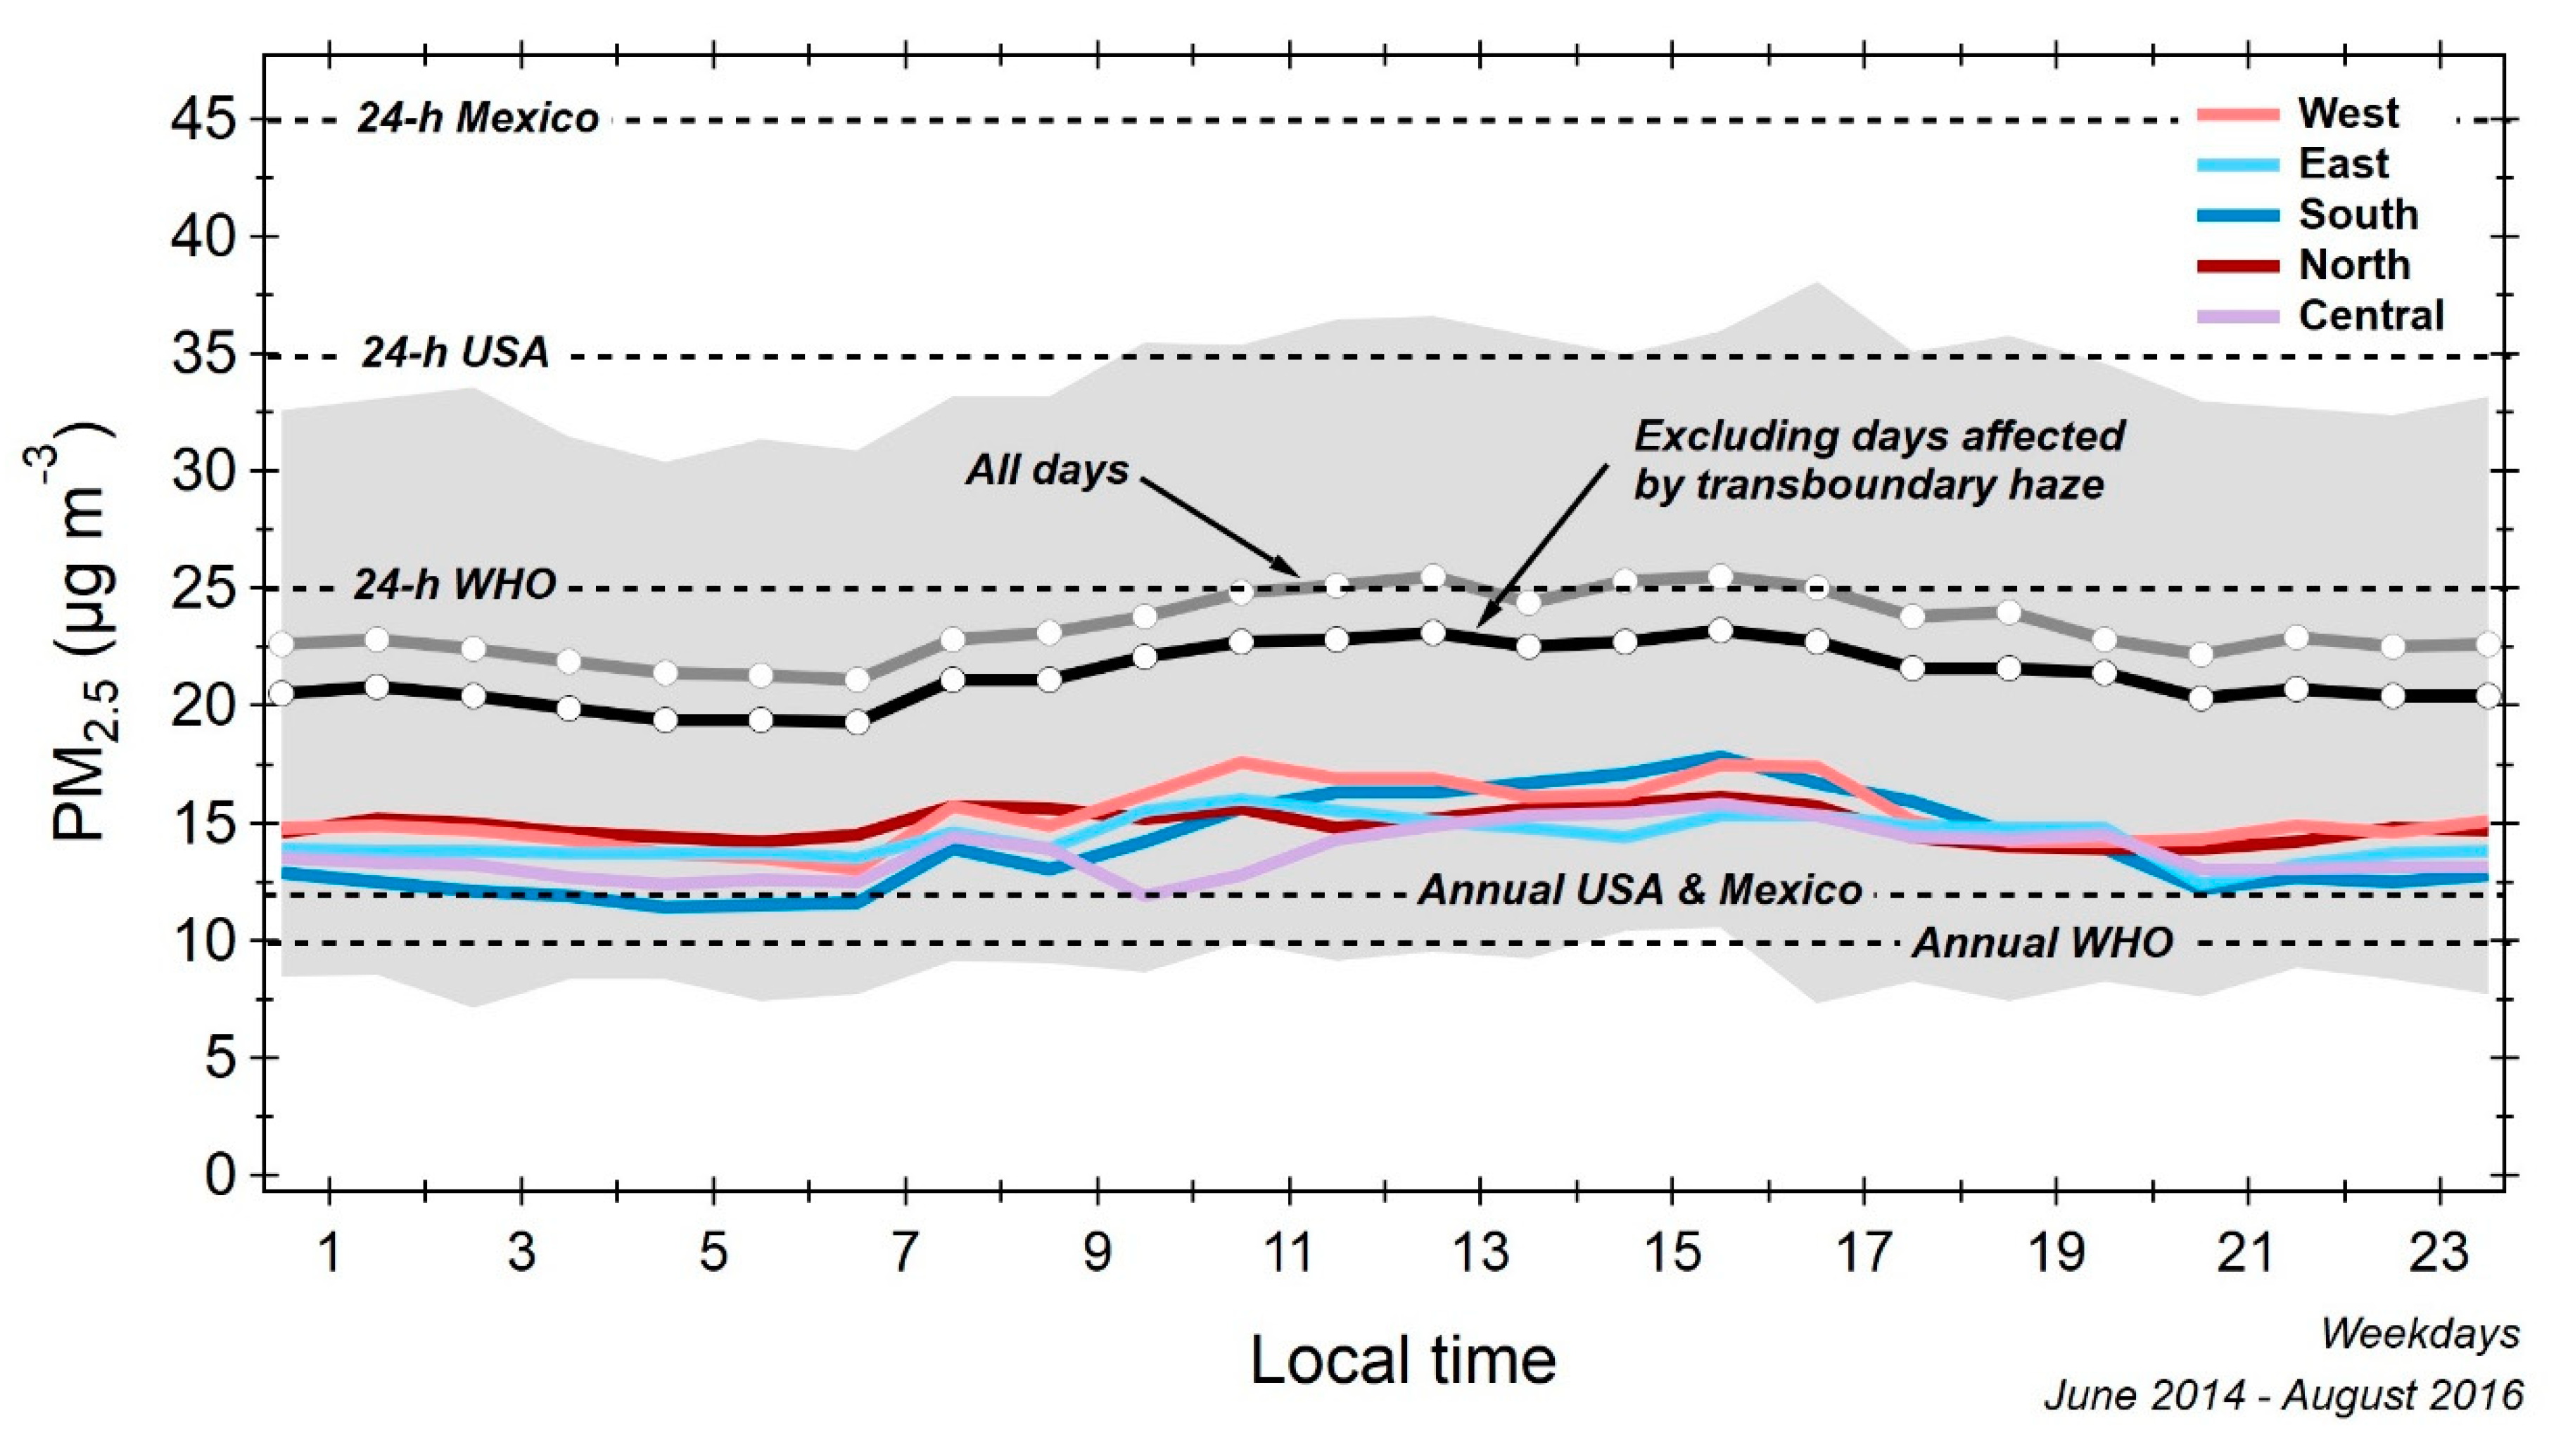
Table 1.
Mexico’s ambient air quality standards, Singapore’s air quality targets, and WHO’s air quality guidelines.
Table 1.
Mexico’s ambient air quality standards, Singapore’s air quality targets, and WHO’s air quality guidelines.
| Mexico * | Singapore ** | WHO *** | |
|---|---|---|---|
| Pollutant | Max. Limit (µg m−3) | Targets by 2020 (µg m−3) | Guidelines (µg m−3) |
| O3 | 186 (1-h mean) 137 (8-h mean) | 100 (8-h mean) | 100 (8-h mean) |
| PM10 | 75 (24-h mean) | 50 (24-h mean) 20 (ann mean) | 50 (24-h mean) 20 (ann mean) |
| PM2.5 | 45 (24-h mean) 12 (ann mean) | 37.5 (24-h mean) 12 (ann mean) | 25 (24-h mean) 10 (ann mean) |
| SO2 | 290 (24-h) 520 (8-h mean) 65 (ann mean) | 50 (24-h mean) 15 (ann mean) | 20 (24-h mean) 500 (10-min mean) |
| CO | 12.5 mg m−3 (8-h mean) | 10 mg m−3 (8-h mean) 30 mg m−3 (1-h mean) | -- |
| Pb | 1.5 (3 month mean) | -- | -- |
| NO2 | 400 (1-h mean) | 200 (1-h mean) 40 (ann mean) | 200 (1-h mean) 40 (ann mean) |
* Air quality standards for O3, SO2, NO2, and CO in Mexico are reported in parts per million (ppm); they are converted to µg m−3 for comparison at a reference temperature of 298 K and barometric pressure of 1 atm. ** Singapore does not have air quality standards; the country has established air quality targets for 2020. *** WHO Air Quality Guidelines [21].
Table 2.
Annual emissions (tons per year) of the MCMA for the year 2016.
| Sources | PM10 | PM2.5 | SO2 | CO | NOx | NMVOC | NH3 | BC | Toxics | CO2eq |
|---|---|---|---|---|---|---|---|---|---|---|
| Point | 3055 | 2256 | 878 | 9850 | 12,603 | 26,130 | 126 | 413 | 12,882 | 9,547,220 |
| Area | 21,859 | 7255 | 1216 | 72,278 | 12,224 | 267,996 | 45,568 | 391 | 84,010 | 18,196,532 |
| Mobile | 11,123 | 5497 | 568 | 646,434 | 115,275 | 77,051 | 2023 | 1897 | 22,474 | 34,571,330 |
| Natural | 1930 | 425 | N/A | N/A | 505 | 44,912 | N/A | 0.4 | 4018 | N/A |
| Total | 37,967 | 15,433 | 2662 | 728,561 | 140,607 | 416,089 | 47,717 | 2701 | 123,384 | 62,315,082 |
Source: SEDEMA Emissions Inventory [25].
Table 3.
Comparison of selected statistics and air quality management programs between the MCMA and Singapore.
Table 3.
Comparison of selected statistics and air quality management programs between the MCMA and Singapore.
| Category | MCMA | Singapore |
|---|---|---|
| A. General Information | ||
| Population | 21.4 million in 2016 | 5.6 million in 2018 |
| Total area (km2) | 7585 | 742 |
| Population density (inhabitants per km2) | 14,000 (central area); 2100 (periphery) | 7800 |
| GDP per capita (2017) in US dollars | 8910 (Mexico City) | 57,700 |
| Topography |
|
|
| Climate zone | Sub-tropical highland climate | Tropical climate |
| Annual energy consumption | 543 PJ (13.0 Mtoe) in 2014 | 770 PJ (18.4 Mtoe) in 2016 |
| Gasoline consumption | 30,600 m3 per day in 2016 | 3050 m3 per day in 2016 |
| Diesel consumption | 6100 m3 per day in 2016 | 5370 m3 per day in 2016 |
| Regulated industries | 2150 in 2016 | 8988 in 2016 |
| Regulated commerce and services | 3000 in 2016 | 194,043 in 2016 |
| Vehicle fleet | 5.7 million in 2016 | 961,000 in 2016 |
| Air quality monitoring network (2019) |
|
|
| Emissions inventory |
|
|
| Air quality standards | O3, PM2.5, PM10, SO2, CO, Pb, NO2 (reviewed and updated periodically) | Targets by 2020 for O3, PM2.5, PM10, SO2, CO, NO2 |
| Public alert systems and indicators |
|
|
| Peak O3 concentration (ppbV) in 2018 | 179 (1-h), 119 (8-h) | No records available |
| Peak PM2.5 concentration (µg m−3) in 2018 | 70 (24-h) | No records available |
| NOx emissions (tonnes per year) | 141,000 in 2016; 82% from transport | 119,000 in 2012; 28% from transport (from EDGAR database [135]) |
| VOC emissions (tonnes per year) | 416,000 in 2016; 19% from transport | 128,000 in 2012; 14% from transport. (from EDGAR database [135]) |
| B. Governance Structure | ||
| Legal framework for air pollution management |
|
|
| Institutional structures for air pollution management |
|
|
| C. Air Quality Management Programs | ||
| Air quality and environmental management programs |
|
|
| Emission reduction programs for vehicle fleet * |
|
|
|
| |
| Emissions reduction actions for industries * |
|
|
|
| |
| Emissions reduction actions for shipping | Not applicable. |
|
| Emissions reduction actions for residential and commercial sectors |
|
|
* The emission reduction programs are divided into two sections: The top section presents the programs that are similar for both cities, while the bottom section presents programs unique for each city.
© 2019 by the authors. Licensee MDPI, Basel, Switzerland. This article is an open access article distributed under the terms and conditions of the Creative Commons Attribution (CC BY) license (http://creativecommons.org/licenses/by/4.0/).
Share and Cite
MDPI and ACS Style
Molina, L.T.; Velasco, E.; Retama, A.; Zavala, M. Experience from Integrated Air Quality Management in the Mexico City Metropolitan Area and Singapore. Atmosphere 2019, 10, 512. https://0-doi-org.brum.beds.ac.uk/10.3390/atmos10090512
AMA Style
Molina LT, Velasco E, Retama A, Zavala M. Experience from Integrated Air Quality Management in the Mexico City Metropolitan Area and Singapore. Atmosphere. 2019; 10(9):512. https://0-doi-org.brum.beds.ac.uk/10.3390/atmos10090512
Chicago/Turabian StyleMolina, Luisa T., Erik Velasco, Armando Retama, and Miguel Zavala. 2019. "Experience from Integrated Air Quality Management in the Mexico City Metropolitan Area and Singapore" Atmosphere 10, no. 9: 512. https://0-doi-org.brum.beds.ac.uk/10.3390/atmos10090512
Note that from the first issue of 2016, this journal uses article numbers instead of page numbers. See further details here.