Article

Climatic Factors in Relation to Diarrhoea Hospital Admissions in Rural Limpopo, South Africa

by
Takayoshi Ikeda
1,†,
Thandi Kapwata
2,
Swadhin K. Behera
1,
Noboru Minakawa
3,
Masahiro Hashizume
3,
Neville Sweijd
4,
Angela Mathee
2,5,6 and
Caradee Yael Wright
7,8,*
1
Japan Agency for Marine-Earth Science and Technology, Yokohama Institute for Earth Sciences, 3173-25 Showa-machi, Kanazawa-ku, Yokohama 236-0001, Japan
2
Environment and Health Research Unit, South African Medical Research Council, Johannesburg 2094, South Africa
3
Institute of Tropical Medicine, Nagasaki University, Nagasaki 852-8521, Japan
4
Applied Centre for Climate and Earth Systems Science, National Research Foundation, Cape Town 7700, South Africa
5
Environmental Health Department, Faculty of Health Sciences, University of Johannesburg, Johannesburg 2094, South Africa
6
Department of Health Sciences, University of the Witwatersrand, Johannesburg 2050, South Africa
7
Environment and Health Research Unit, South African Medical Research Council, Pretoria 0001, South Africa
8
Department of Geography, Geoinformatics and Meteorology, University of Pretoria, Pretoria 0002, South Africa
*
Author to whom correspondence should be addressed.
Presently: Department of Biostatistics and Epidemiology, Faculty of Health and Environmental Sciences, Auckland University of Technology, Auckland 1010, New Zealand.
Submission received: 12 June 2019 / Revised: 8 August 2019 / Accepted: 15 August 2019 / Published: 5 September 2019

Abstract

:
Diarrheal disease is one of the leading causes of morbidity and mortality globally, particularly in children under 5 years of age. Factors related to diarrheal disease incidence include infection, malnutrition, and exposure to contaminated water and food. Climate factors also contribute to diarrheal disease. We aimed to explore the relationship between temperature, precipitation and diarrhoea case counts of hospital admissions among vulnerable communities living in a rural setting in South Africa. We applied ‘contour analysis’ to visually examine simultaneous observations in frequencies of anomalously high and low diarrhoea case counts occurring in a season, and assigning colours to differences that were statistically significant based on chi-squared test results. Children under 5 years of age were especially vulnerable to diarrhoea during very dry, hot conditions as well as when conditions were wetter than usual. We saw an anomalously higher number of diarrhoea cases during ‘warmer than usual’ conditions in the dry winter season, with average winter temperatures in Limpopo being from about 5 to 10 °C. As for ‘wetter than usual’ conditions, we saw an anomalously higher number of diarrhoea cases during ‘drier than usual’ conditions for the winter and spring. The lagged association seen in cumulative rainfall could not be distinguished in the same way for temperature-related variables (indicating rainfall had a larger impact on higher cases of diarrhoea), nor for the older age group of 5 years and older. Dry conditions were associated with diarrhoea in children under 5 years of age; such conditions may lead to increased water storage, raising the risks of water contamination. Reduced use of water for personal hygiene and cleaning of outdoor pit latrines also affect sanitation quality. Rural communities require adequate and uninterrupted water provision, and healthcare providers should raise awareness about potential diarrhoeal risks, especially during the dry season as well as during wintertime when conditions are warmer than usual.

1. Introduction

An estimated 3.4 million people die from diarrhoeal and other water-related diseases each year [1]. Diarrhoeal disease is responsible globally for 21% of deaths per year in children younger than 5 years of age [2] and is ranked as the third leading cause of death in this age group in South Africa [3]. The transmission of diarrhoeal disease is determined by factors related to, among others, weather variables, the vector and agent, socio-economic and ecological conditions, and intrinsic human immunity [4].
Several infectious water-borne diseases, including diarrhoeal disease, are linked to fluctuations in weather and climate [5] and usually exhibit typical seasonal patterns in which the role of temperature and rainfall has been documented [6] but not always in agreement. Both floods and droughts can increase the risk of diarrhoeal diseases, although the evidence for the effects of drought on diarrhoea is inconclusive [7]. Major causes of diarrhoea, i.e., cholera, cryptosporidium, E. coli infection, giardia, shigella, typhoid, and viruses such as hepatitis A, are associated with heavy rainfall and contaminated water supplies [8]. In the tropics, diarrhoeal diseases typically peak during the rainy season. A significant association of non-cholera diarrhoea related hospital visits was found with high and low rainfall and with high temperature in Dhaka, Bangladesh [9]. In Senegal, there were two annual peaks in diarrhoeal incidence: one during the cold dry season and one during the rainy season [10]. Thiam et al. [10] observed a positive association of diarrhoeal incidence with high average temperature of 36 °C and above, and high cumulative monthly rainfall at 57 mm and above in Senegal. In Vietnam, considerable spatial heterogeneity existed in the risk of all-cause for diarrhoea across districts investigated with low elevation and differential responses to flooding and air temperature, and humidity further drove spatial heterogeneity in diarrhoeal disease risk [11]. In Ecuador, heavy rainfall events were associated with increased diarrhoea incidence following dry periods and decreased diarrhoea incidence following wet periods [12].
Children, especially under 5 years of age, are particularly susceptible to diarrhoeal disease. In a study using demographic and health survey data from 14 sub-Saharan countries, regional prevalence of diarrhoea in children under three years of age was considered in relation to variations in precipitation and temperature [13]. Results showed that shortage of rainfall in the dry season increased the prevalence of diarrhoea across Sub-Saharan Africa. Such shortages occur in many regions when rainfall is average to below-average relative to the long-term monthly-mean. The results also showed that an increase in monthly-average maximum temperature raises the prevalence of diarrhoea, while an increase in monthly minimum temperature reduces the number of diarrhoeal cases [13]. Both average minimum and maximum temperatures affect diarrhoeal case counts, much like mean temperature, but the effect of maximum temperatures being hotter than average would be associated with increased evaporation during midday. Whereas an increase in minimum temperatures would be associated with temperatures at dawn and dusk, which would imply that the day is hotter in general. Maximum temperature and extreme rainfall days were also reported as strongly related to diarrhoea-associated morbidity with the impact of maximum temperature on diarrhoea-associated morbidity appearing primarily among children (0–14 years) and older adults (40–64 years), but with relatively less effects on adults (15–39 years) [14]. When maximum temperatures are hotter than average, this is associated with increased evaporation and drier days, leading to limited access to water, and thus difficulty of maintaining sanitation and cleaning of hands. As for extreme rainfalls, these cause floods and contamination of drinking water.
Diarrhoeal disease is a major cause of morbidity and mortality, particularly among children under 5 years of age in developing countries and climate change-related health consequences of diarrhoeal diseases are projected to pose significant risks to future populations [15]. We set out to explore the relationship between climate factors (temperature and precipitation) and diarrhoea prevalence among vulnerable rural communities in South Africa. Very little work has been done in South Africa to identify the relationships between climate factors and diarrhoea, so we aimed to fill this knowledge gap.
Haffejee and Moosa [16] considered microbiological and epidemiological aspects, but no climate/temperature link was made. Bandyopadhyay et al. quantified the impact of variations in precipitation and temperature on the regional prevalence of diarrhoea in children under the age of three in sub-Saharan Africa (not South Africa, specifically) [13]. They found that low rainfall increased the prevalence of diarrhoea. Increases in monthly average maximum temperature increased the prevalence of diarrhoea, while increases in monthly minimum temperature reduced diarrhoeal illness. Both Mphahlele and Steele [17] looked at rotavirus genotypes in children with diarrhoea and Potgieter et al. [18] who considered rotavirus strains in children with diarrhoea in Limpopo found no link to climate factors in their studies. Finally, Lopez-Carr et al. [19] looked at vulnerability in decreasing rainfall but had no climate link either; they identified regions that have experienced significant decreases in precipitation over a recent 30-year period and correlated those drying trends with changes in population density and in populations of children under 5 years of age.
Diarrhoeal diseases continue to affect a large part of the global populations, in spite of improvements in health care and prevention mechanisms in many parts of the world. The effect is expected to be even worse with large regional variations in extreme climate events under the stress of global warming [15]. In this context, in order to understand the unique characteristics of the disease outbreaks in a rural setup, we explored the relationship between temperature and precipitation and regional diarrhoea prevalence among vulnerable rural communities of the Limpopo province in South Africa. The province experiences some of the extreme seasonal variations in climate factors with consecutive hot months in summer season and good seasonal rainfalls, leading to drinking water contamination. On the other hand, winters are usually dry, adding stress to the availability of water for sanitary purposes. In the season when maximum temperatures go above the average, increased evaporation causes more drier days, leading to further stress on water availability. In spite of a clear seasonal backdrop for the disease outbreaks in both seasons, very little work has been done in South Africa to identify the relationships between climate factors and diarrhoea. Further, the seasonal rainfalls in the region have a large temporal variability with dry and wet spells varying from week to week. So, in this study we aimed to fill this knowledge gap by using a novel statistical method called contour analysis on the weekly data sets for both seasons separately. To the best of our knowledge, this is the first-time contour analysis has been used in climate-based-health research.

2. Methods

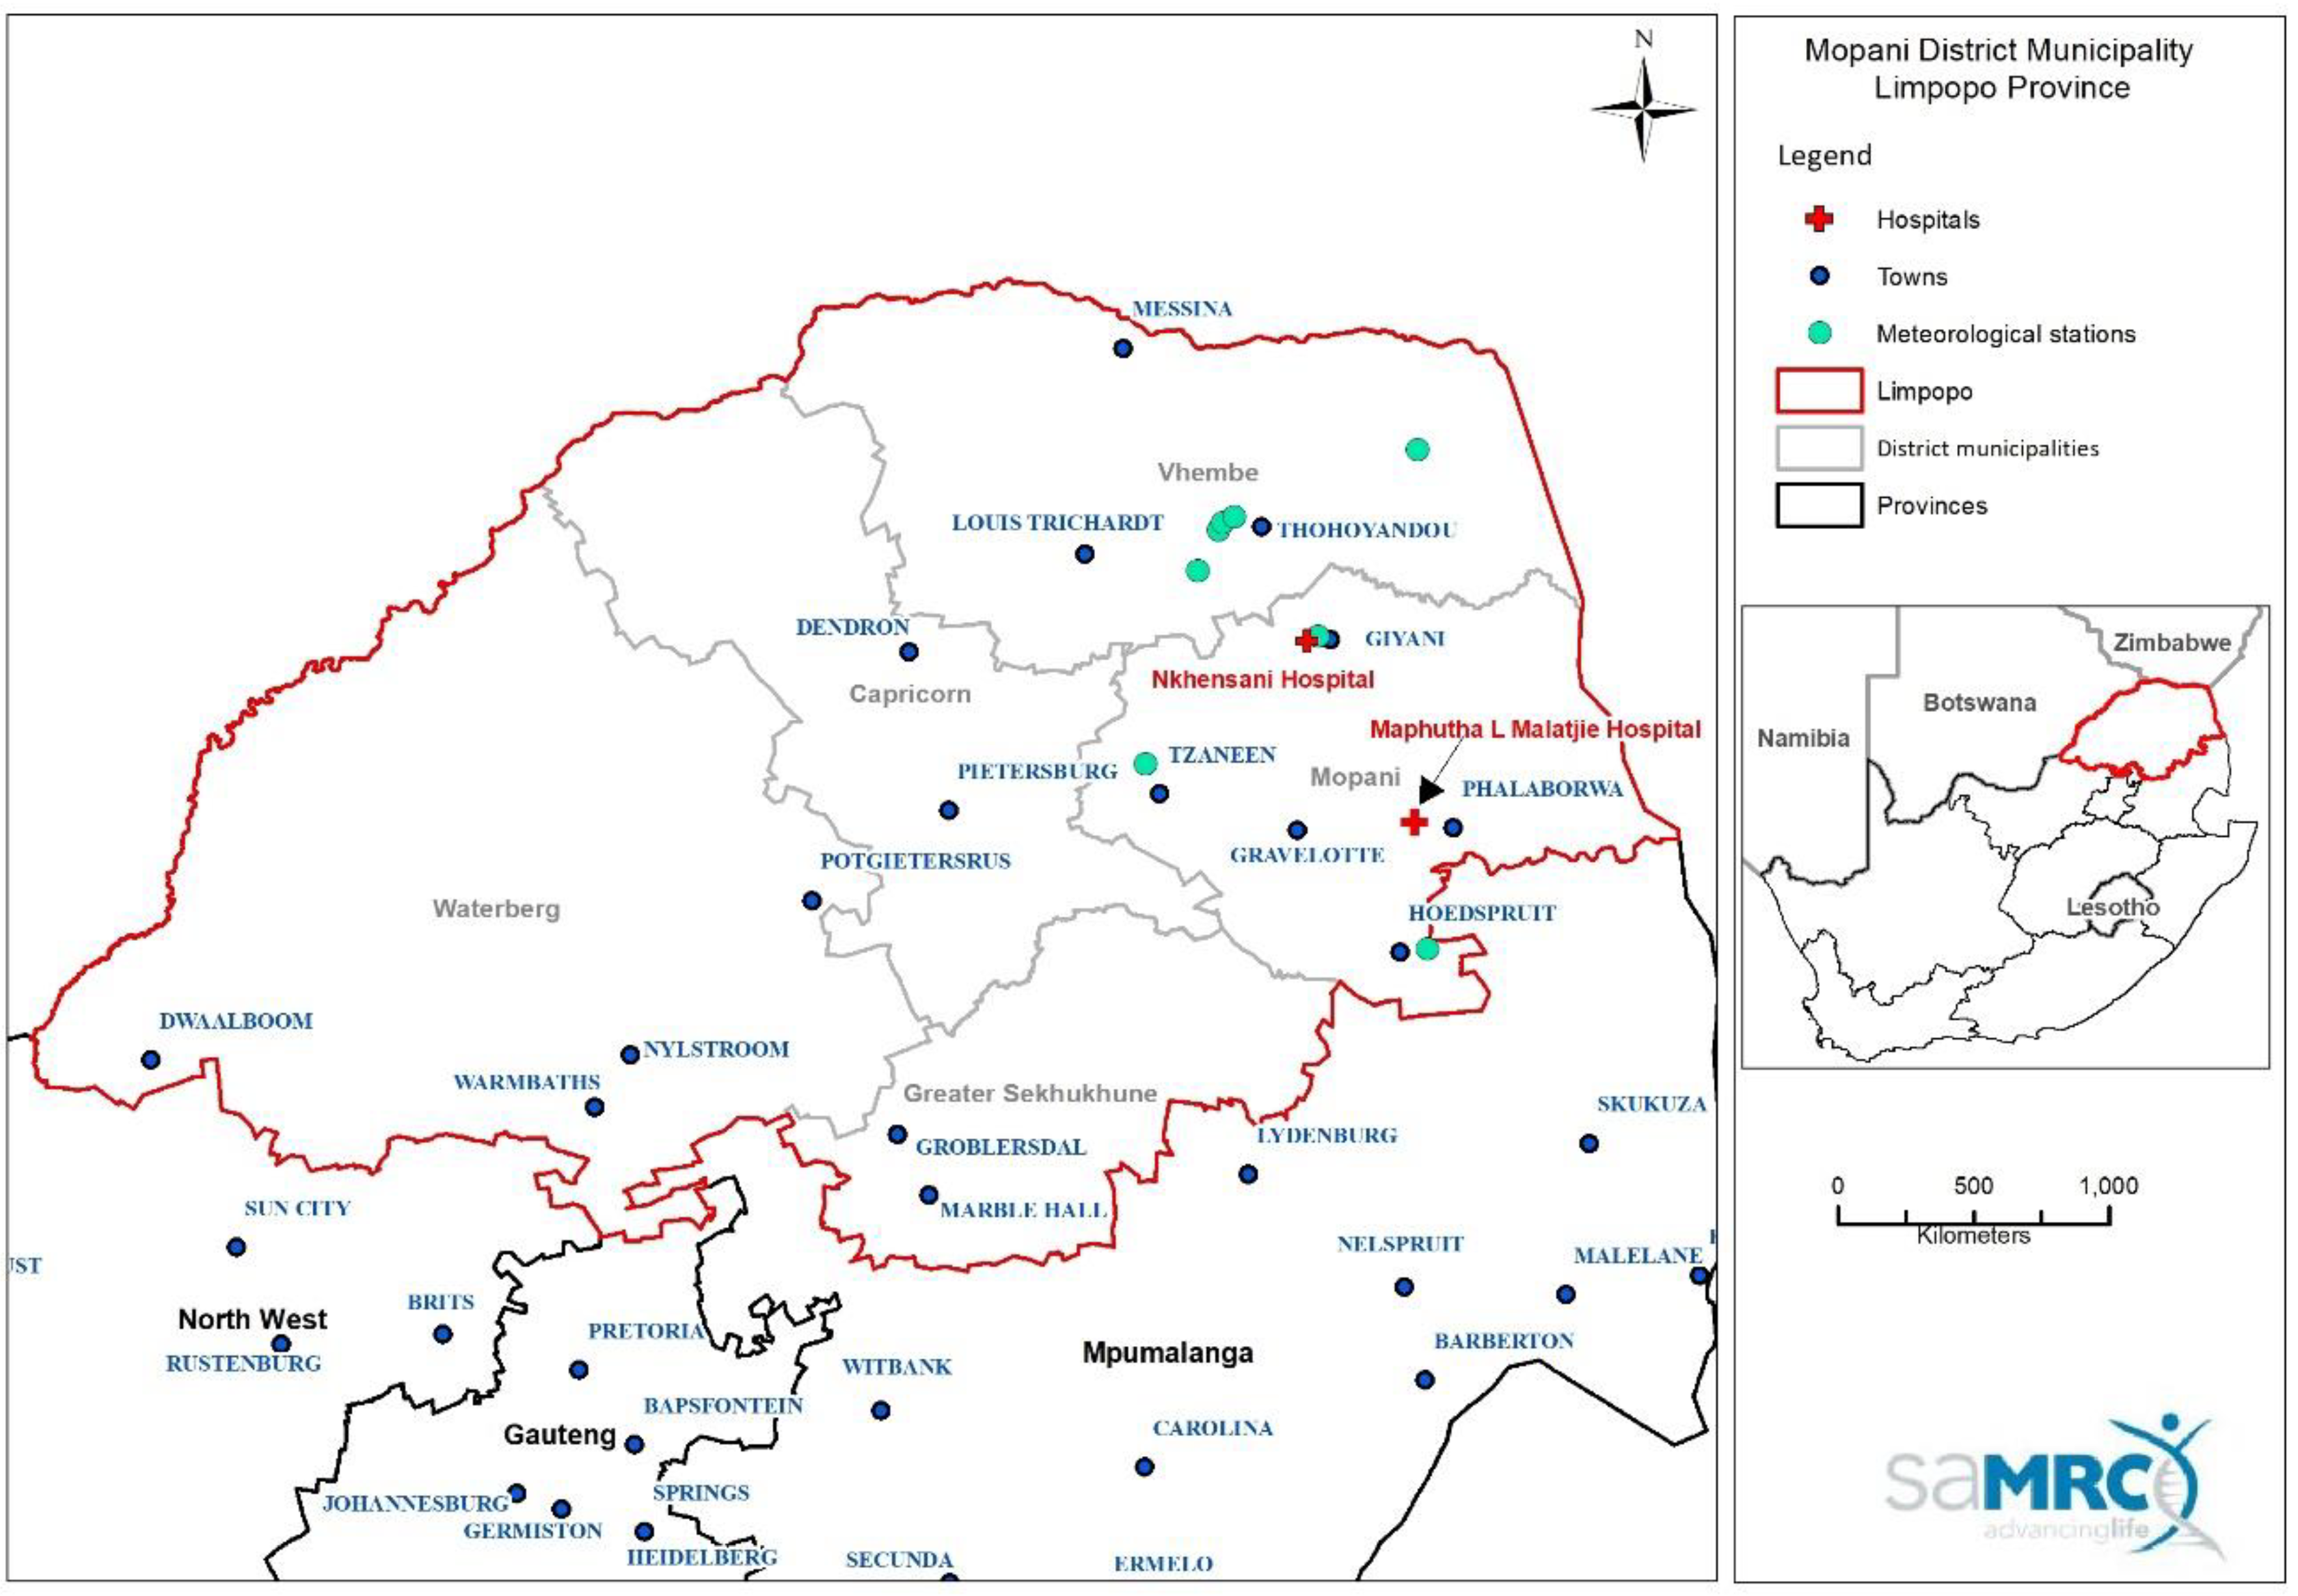
2.1. Study Setting and Data

The study setting was Mopani District Municipality in Limpopo Province, South Africa. The District has a population of about 1 million people comprising 300,000 households; 97% and 54% of the population are Black African and women, respectively. Unemployment is on average 39% but as high as 47% in the Greater Giyani Local Municipality [20]. More than 70% of people living in the District do not have a steady monthly income greater than ZAR400. The dependency ratio of youth, children and pensioners relying on social grants from the government is 65% and about 74% of the District rely on free basic services.
Handwritten, non-digitised hospital admission records for 1 January, 2002 to 31 December, 2016 were collected from two large, public hospitals, namely Nkhensani Hospital and Maphutha L. Malatjie Hospital, located in Mopani District Municipality in Limpopo Province, South Africa (Figure 1). Hospital records were scanned using an SV 600 overhead snap scanner, pages were saved as soft copies as PDF files and later printed for double data entry into an electronic database using EpiData [21]. Each hospital admission record included patient’s name and surname, patient’s residential address, patient’s date of birth, patient’s age, date of admission and reason for admission. The medical records included those from the children, female and male wards only. All the records were handwritten and posed numerous challenges such as faded ink and handwriting being illegible, daily use of books leading to torn pages, errors in recording (for example: a male patient captured in a female ward) and missing data (for example: date of admission and patient age).
All diarrhoea cases were extracted from the hospital admission records database for cases defined as diarrhoea using the criteria and terms provided by a South African medical doctor. Abdominal distention was not included as it could be associated with a variety of medical conditions other than diarrhoea. Data were unavailable in 2006 for both hospitals as well as at one hospital for weeks 1–23 in 2002 and weeks 1–40 in 2007. Despite the missing data mentioned above, our analyses could still be applied with the missing values; we did not replace missing values with zero but left these cells blank since we focused on daily case counts of diarrhoea that were anomalously higher and lower than what is expected on average. The choice of weekly variables was mainly related to the location of the study. Although Limpopo can experience consecutive hot months, it is not the case with rainfall. In order to capture the possible effects of consecutive rainfall and consider its week-to-week variability, we used weekly variables. The use of daily variables was not considered due to the greater amount of noise in the data. It should be emphasized that the count for total admissions is not necessarily the total admissions at that hospital for that day/month/year, but rather a total of the admissions that were captured by the hospital staff, collected by the researchers and entered by the data enterers. Cases of diarrhoea were summed as counts per week and diarrhoea weekly case counts were used in the contour analysis, described below.
Daily precipitation and temperature data were obtained from the South African Weather Service monitoring stations in the same District Municipality in which the two public hospitals were located. Table 1 presents the mean weekly precipitation and temperature by season for 2002 to 2016 for the study site. Precipitation data were available from one station in the District Municipality. Daily precipitation levels (mm) were summed to generate a weekly rainfall value. For temperature, data from eight stations (namely Hoedspruit Air force Base, Tzaneen-Westfalia Estate, Levubu, Giyani, Tshivhasie Tea Venda, Tshanowa Primary School, Mukumbani Tea Estate and Punda Maria) at longitudes between 30.1 and 31.1° E and latitudes between 22.6 and 24.3° S in the District Municipality were extracted and applied in the study. Data from all these stations were used to calculate a spatially-averaged temperature for the study area. Daily minimum and maximum temperature (°C) values were then temporally averaged to generate weekly temperature values for minimum (Tmin) and maximum (Tmax) temperatures. For the contour analysis, weekly rainfall, Tmin and Tmax were used.

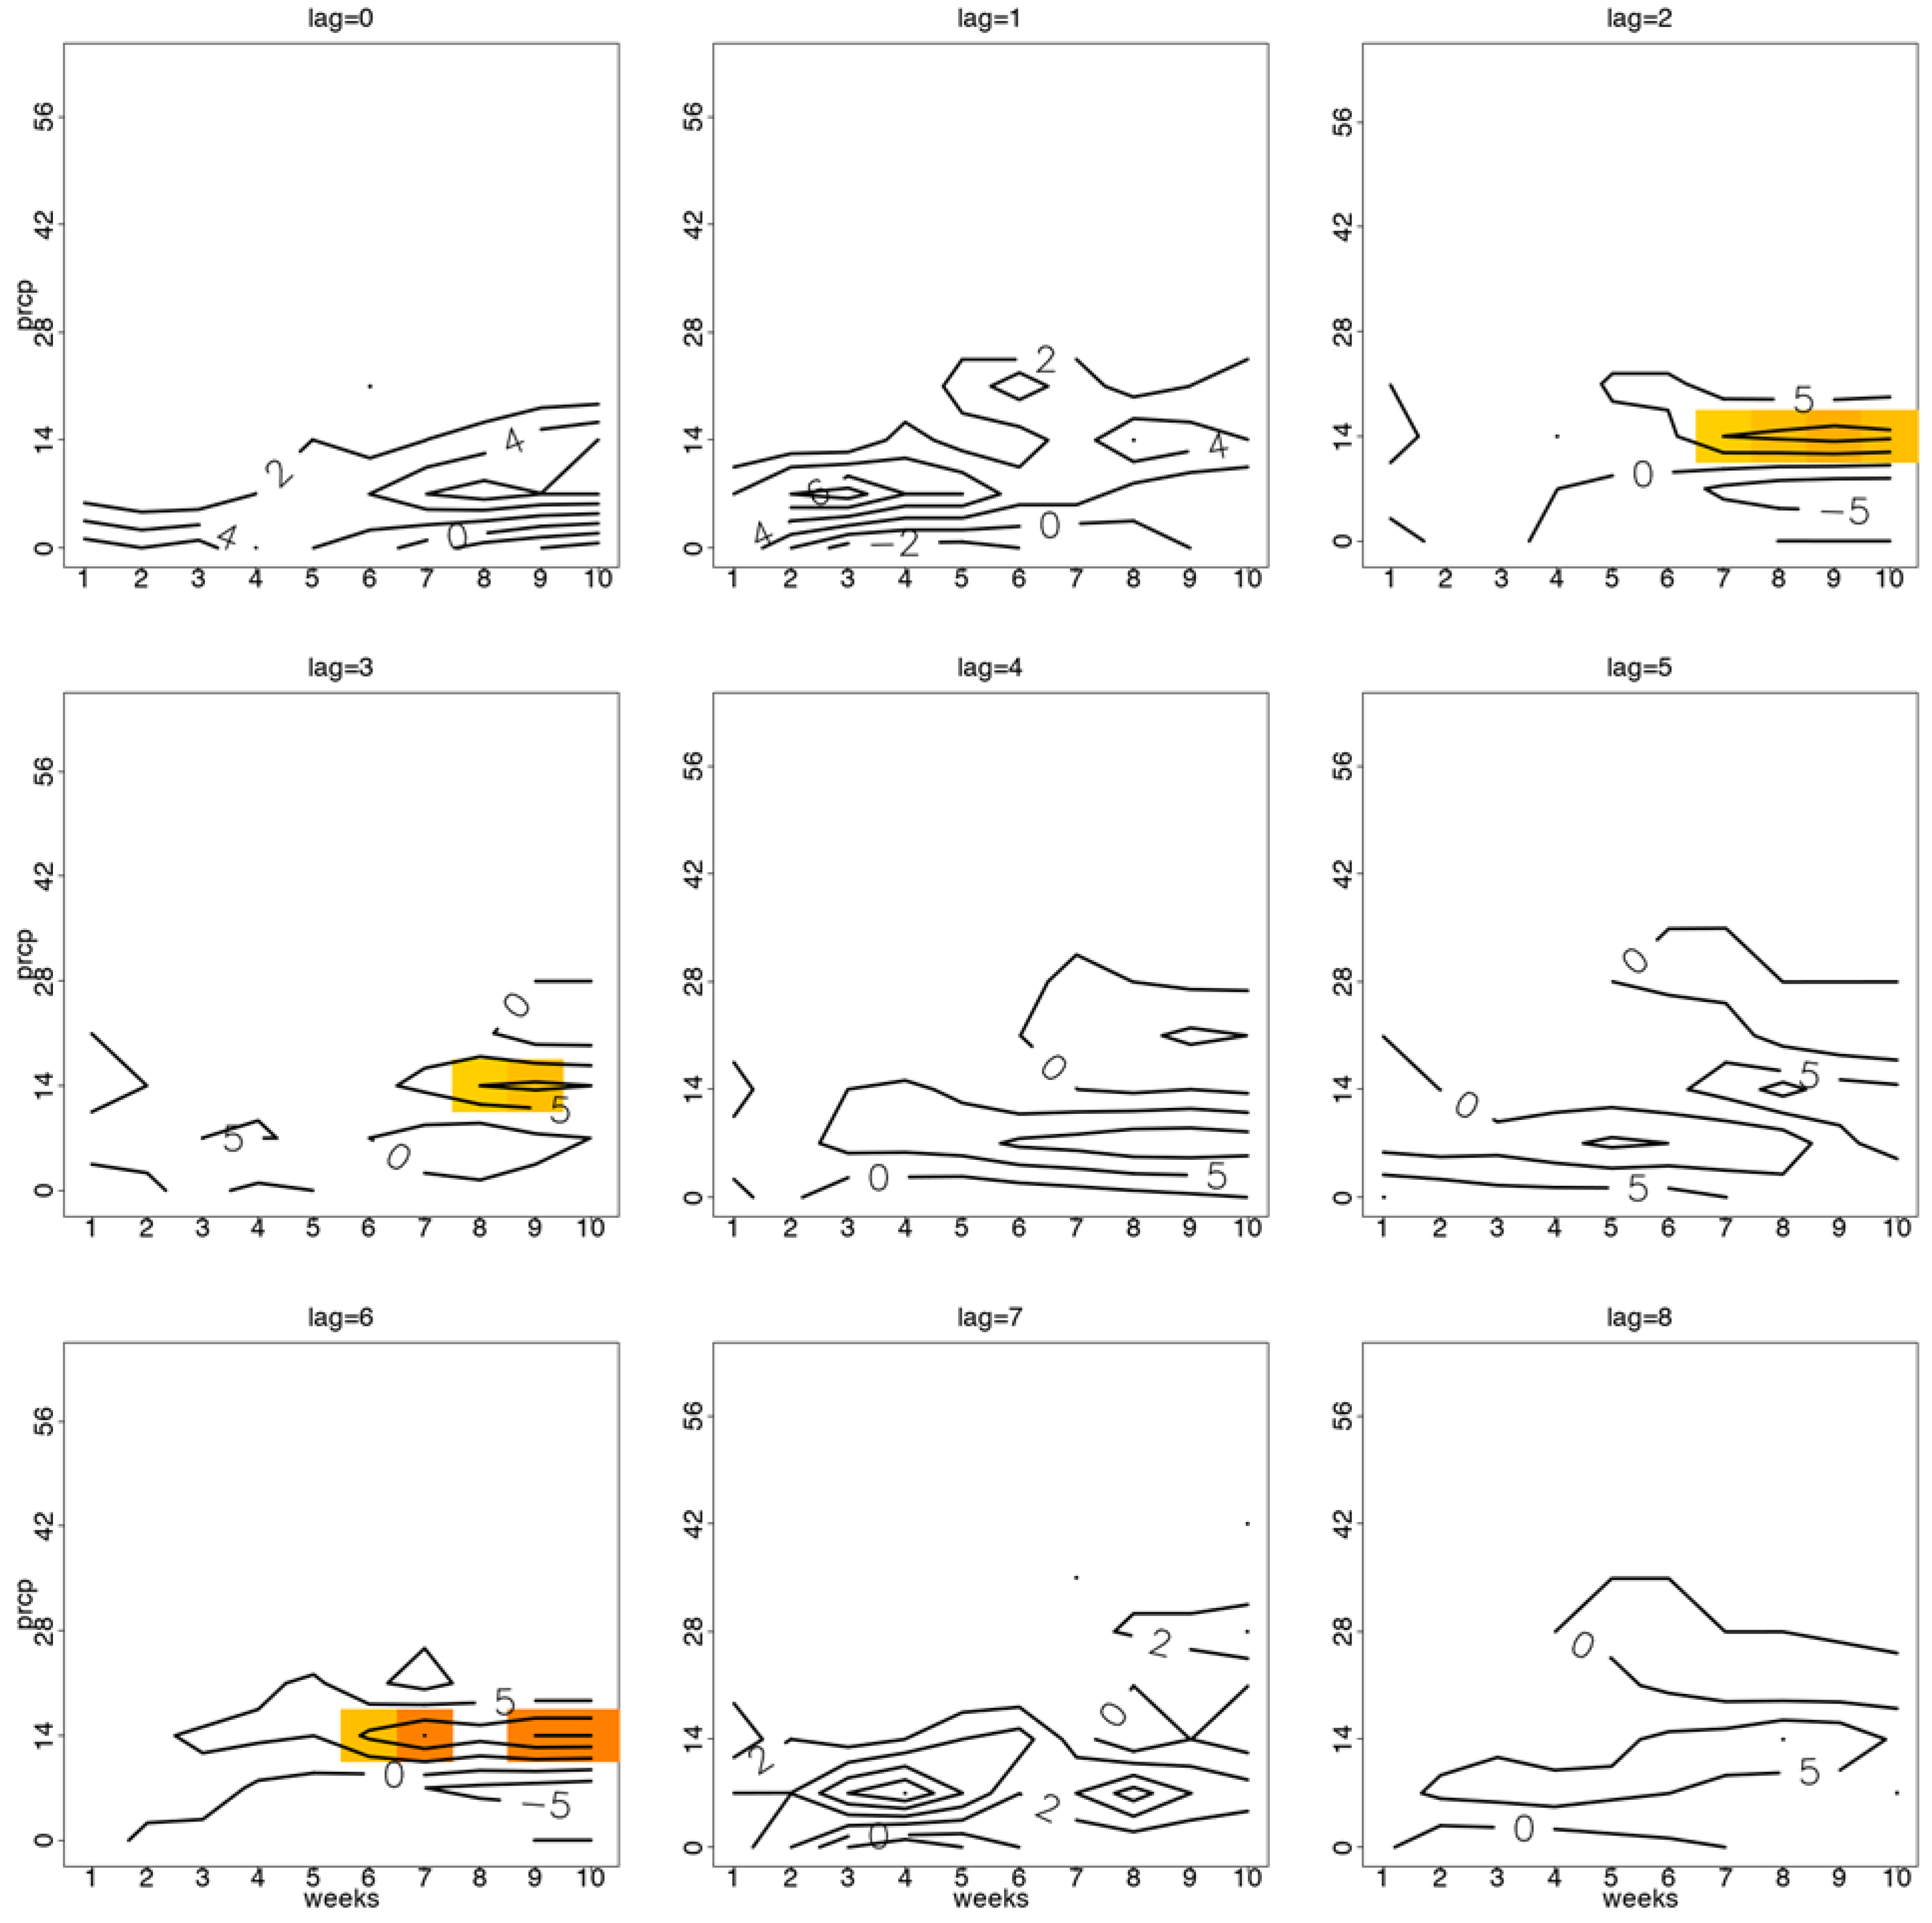
2.2. Contour Analysis

Meteorologists and oceanographers apply a technique called ‘contour analysis’ to visually explain simultaneous observations [22]. Isopleths, or lines of equal value, are used in contour analysis to link places of equal parameter. The use of “contours” or “contour plots” is seen in climate-related research, for instance, to consider weather patterns [23]. In this study, we have attempted to extend this analysis to visualize frequencies of diarrhoea anomalies in response to seasonal climate variations.
First, we compared the climate variables, namely temperature and precipitation, between high and low diarrhoea case count anomalies from hospital admissions, which were calculated by removing the climatological mean and linear trend of the diarrhoea case counts. The trends were obtained by creating a linear regression model of diarrhoea case count anomaly against time. Then, the fitted values of that model were removed from the diarrhoea case count anomaly along with the seasonal mean.
Next, the original time series (see Figure 1) was decomposed into three components:
(i)
Seasonal patterns that repeated with a fixed period of time (defined according to season with spring: September-October-November (SON); summer: December-January-February (DJF); autumn: March-April-May (MAM); and winter: June-July-August (JJA)) considered on a monthly scale and deemed as the climatological means;
(ii)
The underlying trend which could be related to the effort of collecting diarrhoea data, the effect of some community-based intervention or population growth, etc.;
(iii)
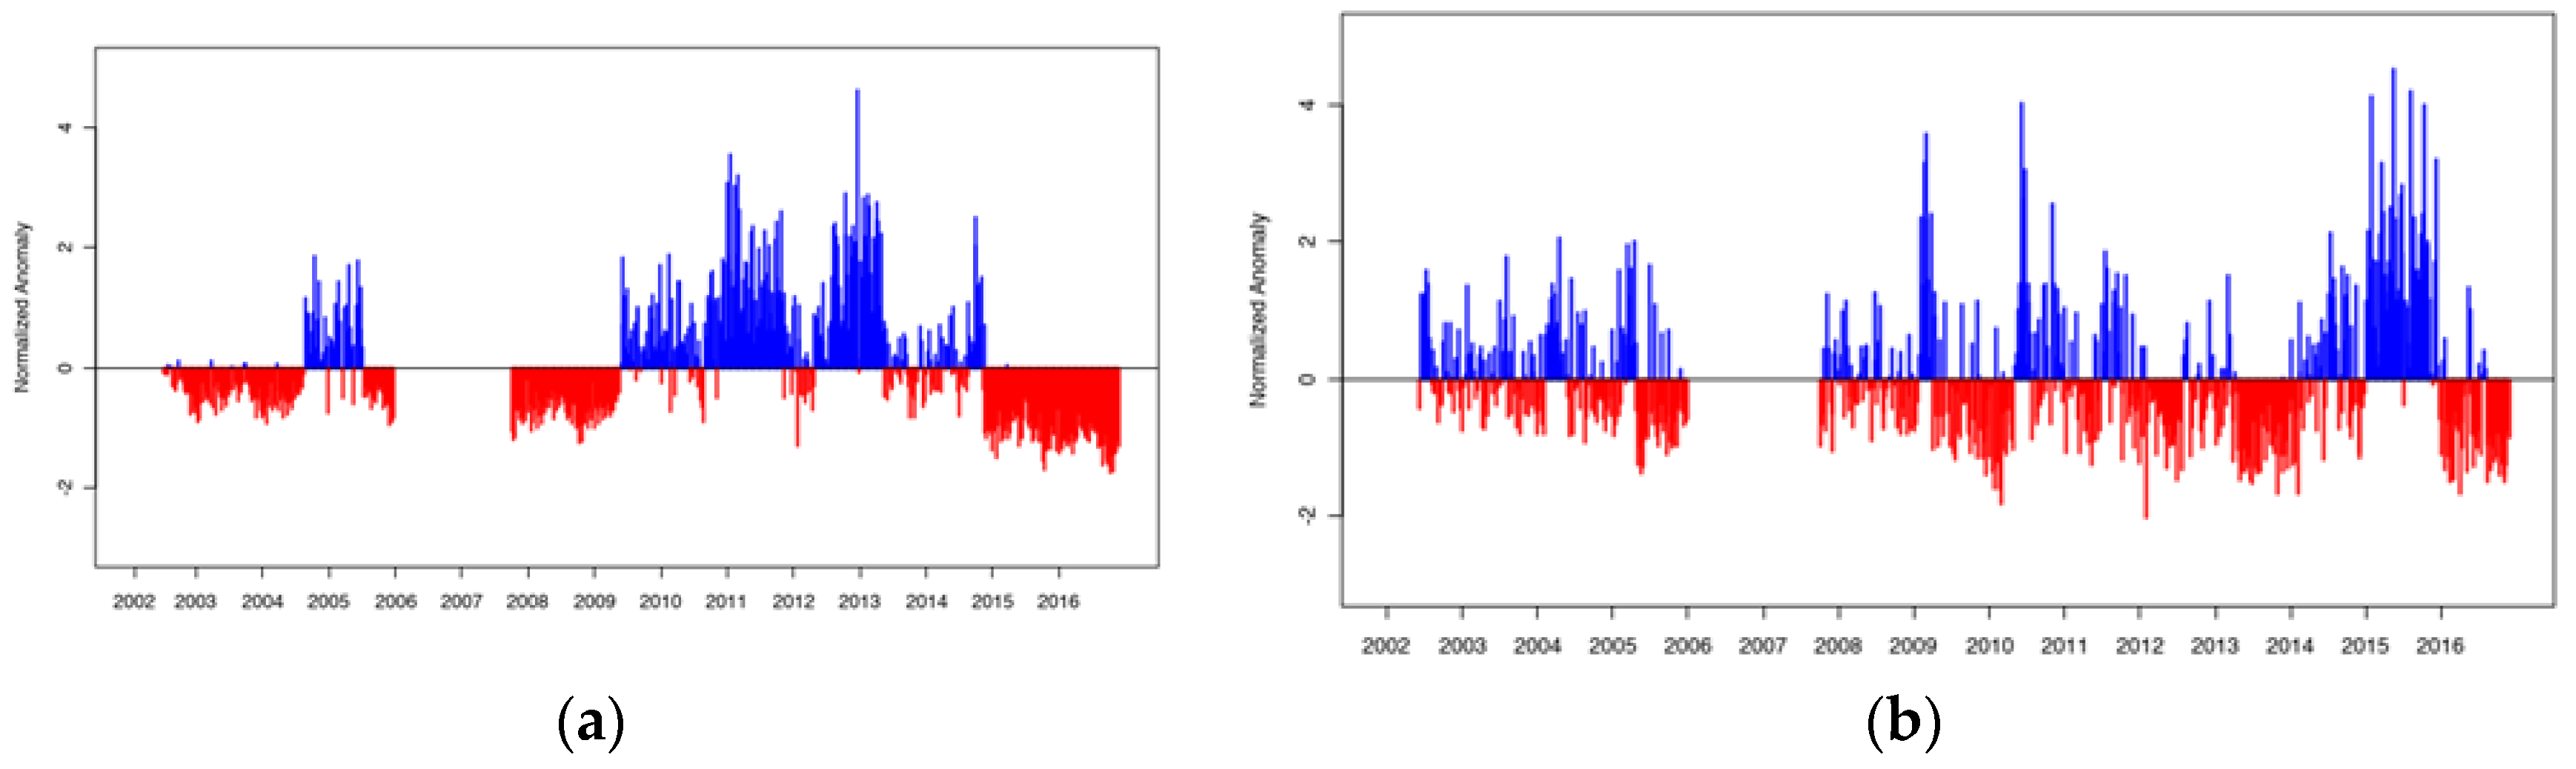
The residuals of the original time series obtained after the seasonal and trend components were removed, which is thus termed the random component, i.e., the anomalies. Anomalies were calculated according to Equation (1):
A(t) = X(t) − S(t) − T(t),
where A is the anomaly, S is the seasonal component, T is the trend component, and t is time (or week). High weekly anomalies were inferred as ‘higher than normal’ diarrhoea case counts and low anomalies were referred to as ‘lower than normal’. ‘Normal’ refers to the long-term average for the corresponding period/week. In addition, we discarded anomalies that were less than one standard deviation from the mean to retain only anomalously extreme high or extreme low incidence. Then we categorised the high and low incidence (diarrhoea case count anomalies) by season.
For all weeks within each season, across the data set, we counted for precipitation how many times it rained on average ‘y’ mm over ‘x’ consecutive weeks (with x going from 1 to 10 weeks, and y for decile increments of the range of precipitation values) and tested these findings for statistically significant differences between the two groups of incidence category (i.e., high or low). The differences of how many times it rained in the high and low groups were plotted as contour lines. Differences with statistical significance, based on a chi-squared test for counts and using a Monte Carlo test [24] with 1000 replicates to compute p-values at alpha level 0.01 were plotted. We repeated this approach for consecutive weeks with weekly Tmax and Tmin. For both precipitation and temperature, we also looked at lagged effects of each climate variable, for 0 to 8 weeks lag (chosen a priori) [9,25], i.e., lag 3 means “temperature or rain 3 weeks prior to diarrhoea counts of a certain week”. Contour plots were made separately for individuals of 5 years and older and for children under 5 years of age (i.e., 0 to 4 years). All analyses were done in R version 3.2.2 [26].

2.3. Ethics Statement

Permission to conduct the study was granted by the Limpopo Department of Health (REF 4/2/2), the management staff of Nkhensani Hospital and Maphutha L. Malatjie Hospital. Permission was granted by the South African Weather Service for use of the climate data. The South African Medical Research Council Research Ethics Committee approved the study protocol (EC005-3/2014).

3. Results

3.1. Hospital Admission Counts

Between 2002 and 2016 (inclusive) the total numbers (as captured for this study) of diarrhoea hospital admission case counts at the two hospitals for individuals aged 5 years and older and for children under 5 years of age, separately, were 8885 and 2343, respectively. Figure 2 shows the high and low weekly diarrhoea case count anomalies during the 14-year period for (a) individuals aged 5 years and older and (b) children under 5 years of age. For clarity in the understanding of their individual effects, we have discussed the results from the rainfall analysis and the temperature analysis separately first before discussing all the results.

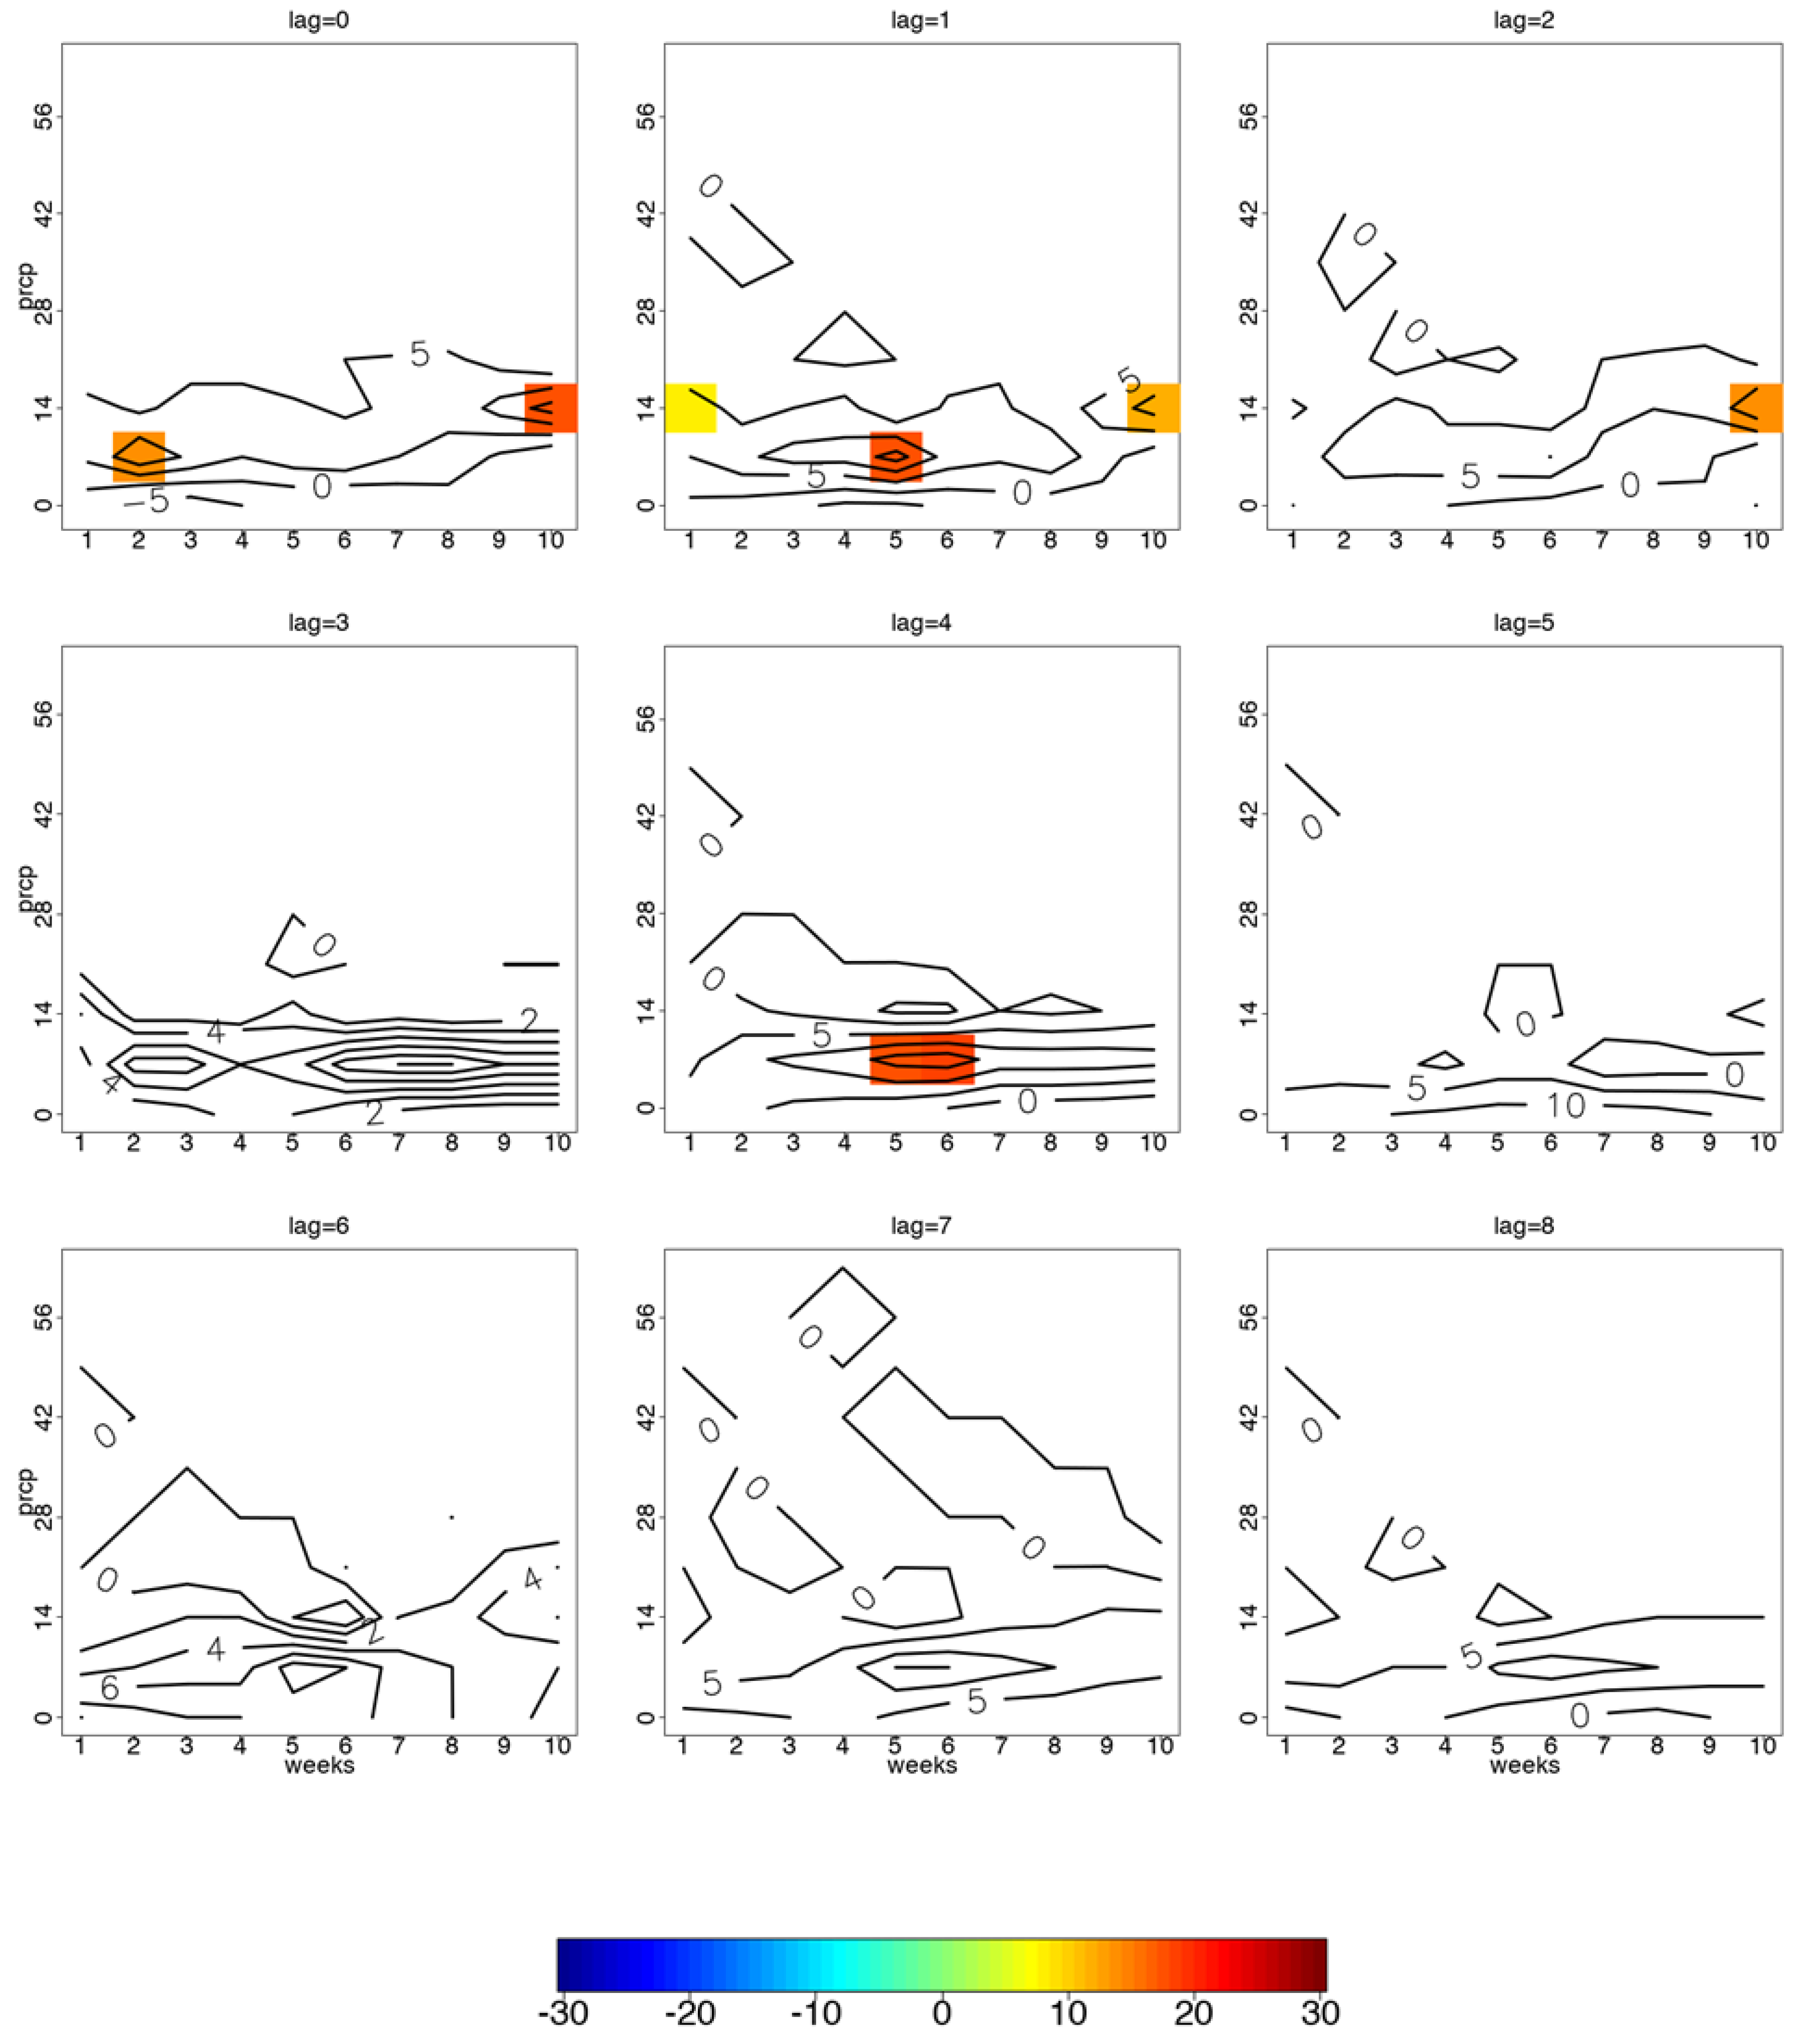
3.2. Precipitation and Diarrhoea Case Counts for Individuals 5 Years and Older

We applied ‘contour analysis’ to the anomalously high and low weekly diarrhoea count groups for individuals aged 5 years and older and compared these groups by counting consecutive weekly cumulative rainfall above different threshold levels. Figure 3 shows significant positive differences for different lags for JJA (dry season). At lags of 2, 3 and 6 weeks, cumulative rain of 8 to 14 mm for 6 to 10 consecutive weeks showed positive differences between high and low groups (orange colours). The significant difference is associated to more rainy days occurring when there were anomalously higher diarrhoeal case counts in JJA.
In the beginning of the rainy season SON, significant differences were seen in cumulative rain of up to 14 mm for 10 consecutive weeks for up to 2 weeks lag (Figure 4). In the rainy season (DJF), cumulative rain of 40 to 52 mm for 8 to 9 consecutive weeks showed significant differences between high and low groups up to 1-week lag (Supplementary Figure S1). Similar levels of cumulative rain were seen in MAM, however, for lags of 5 to 8 weeks (Figure S2).

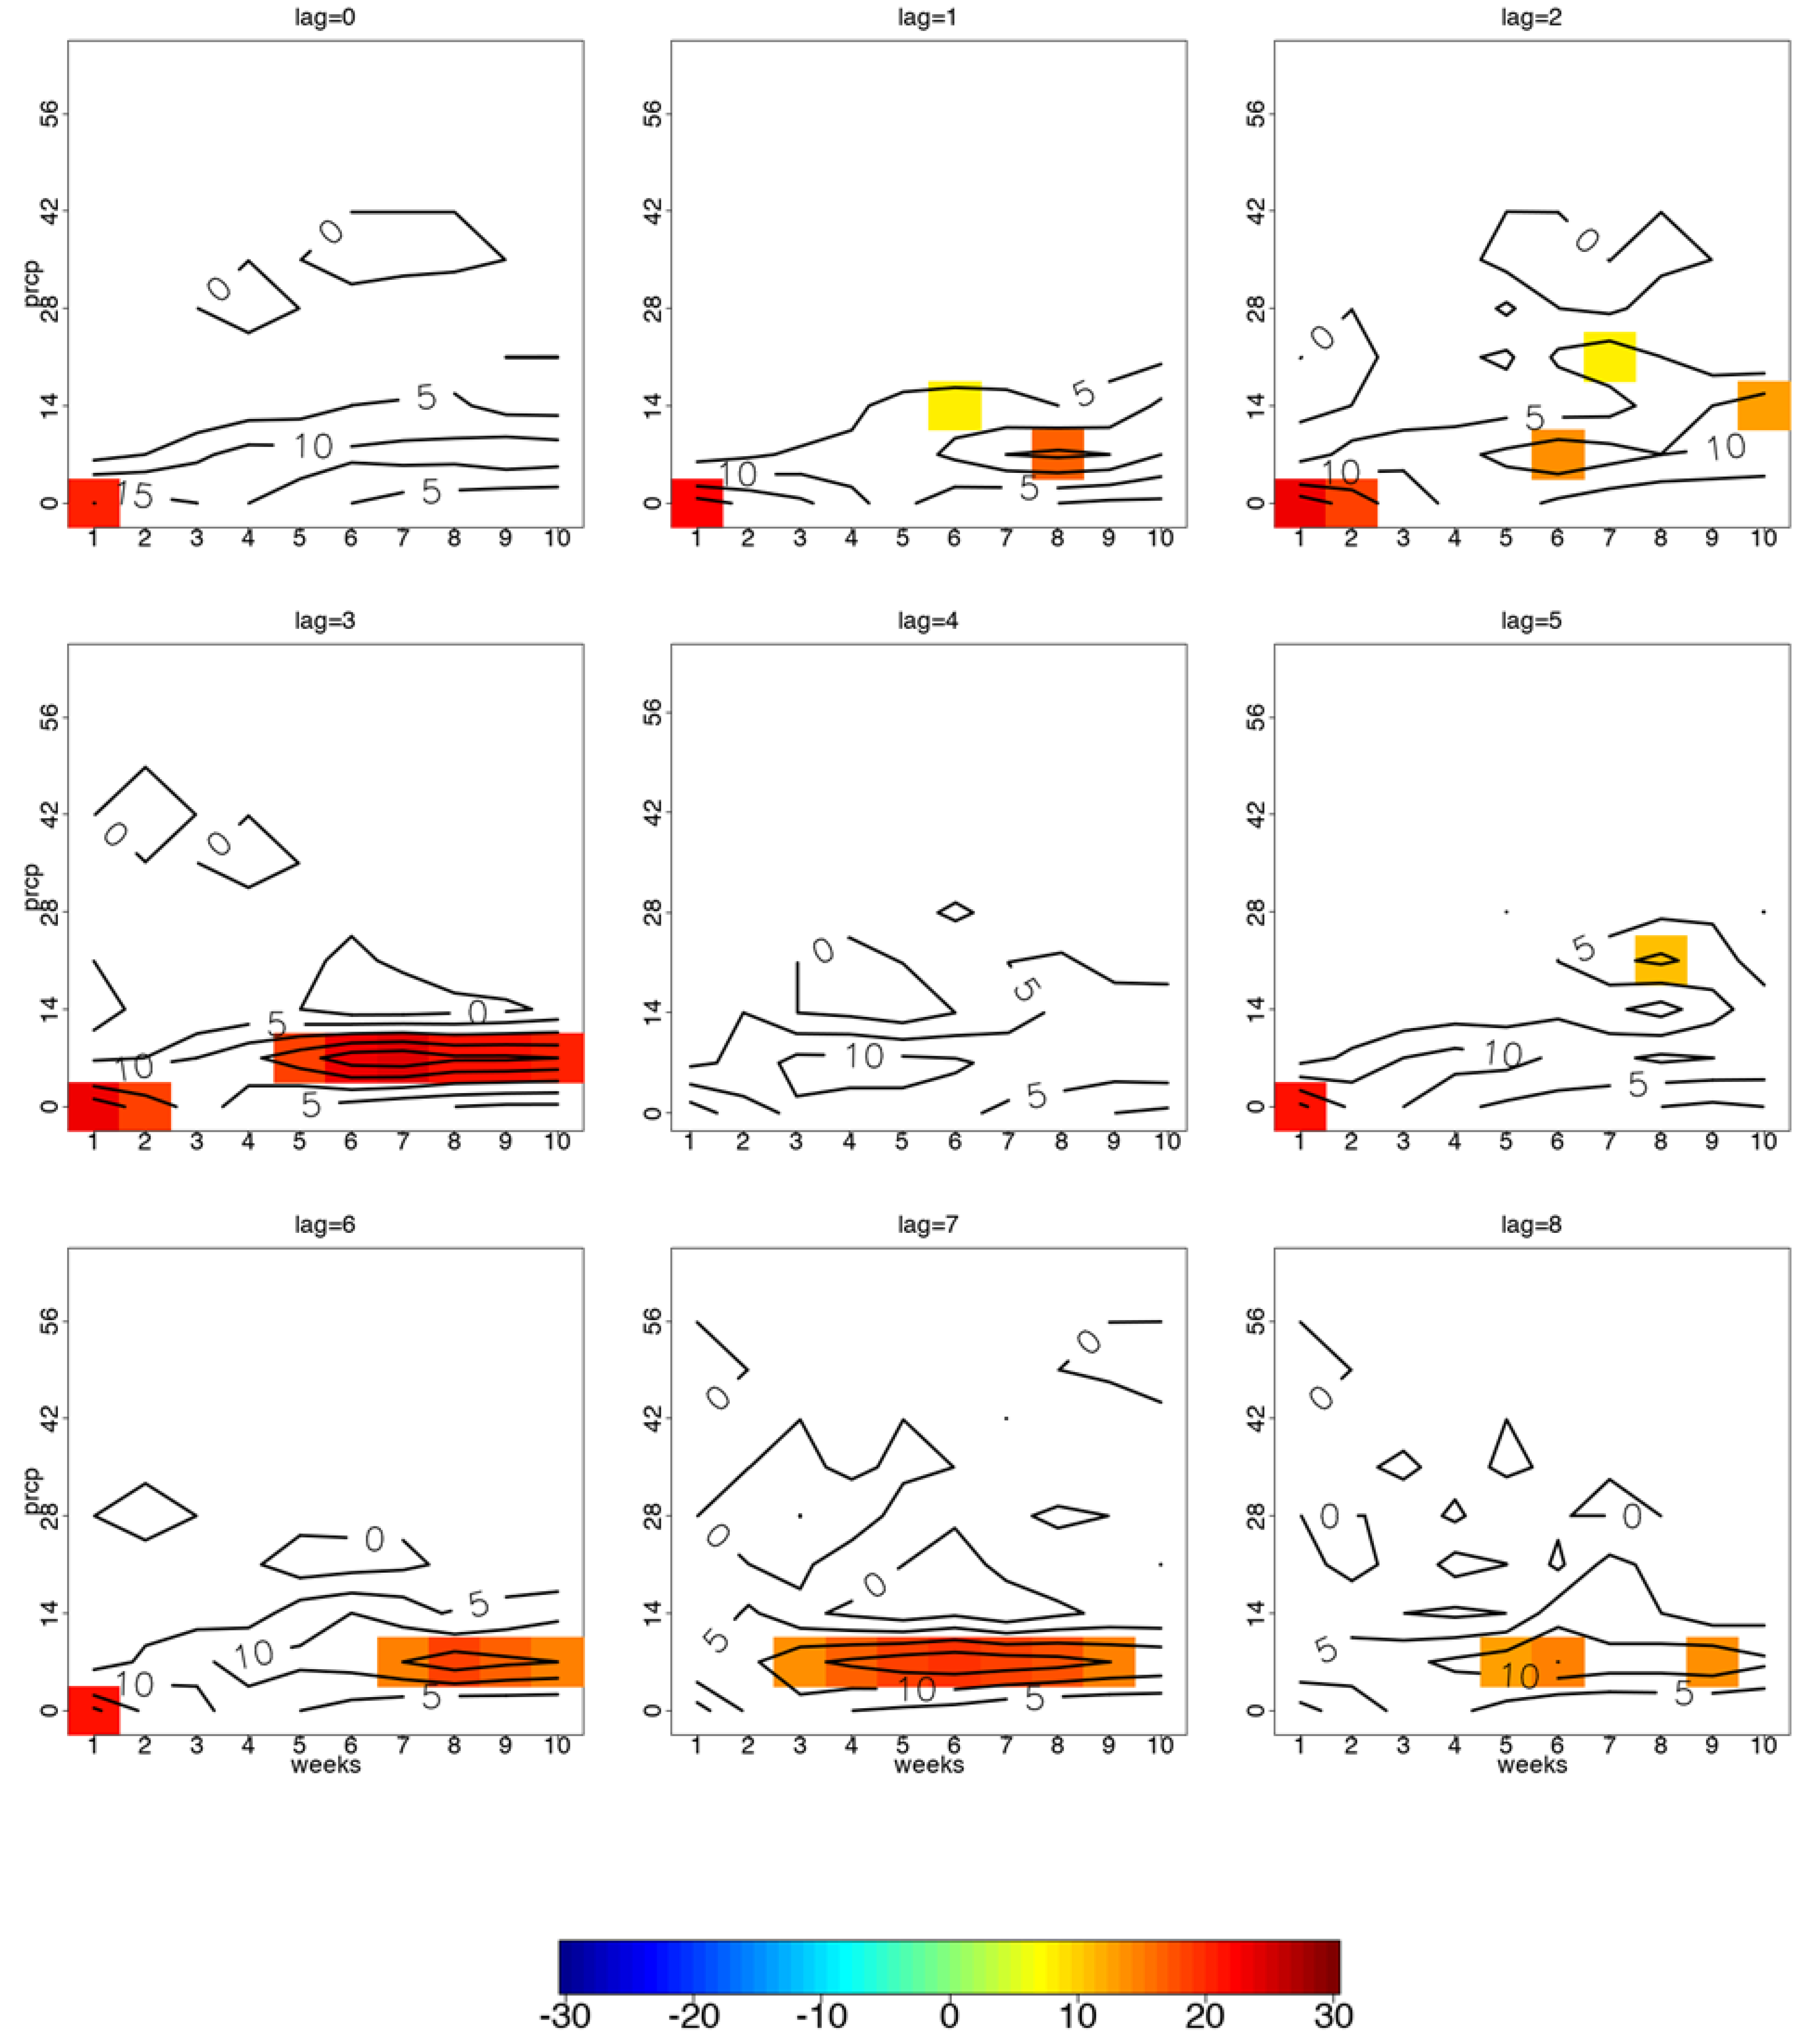
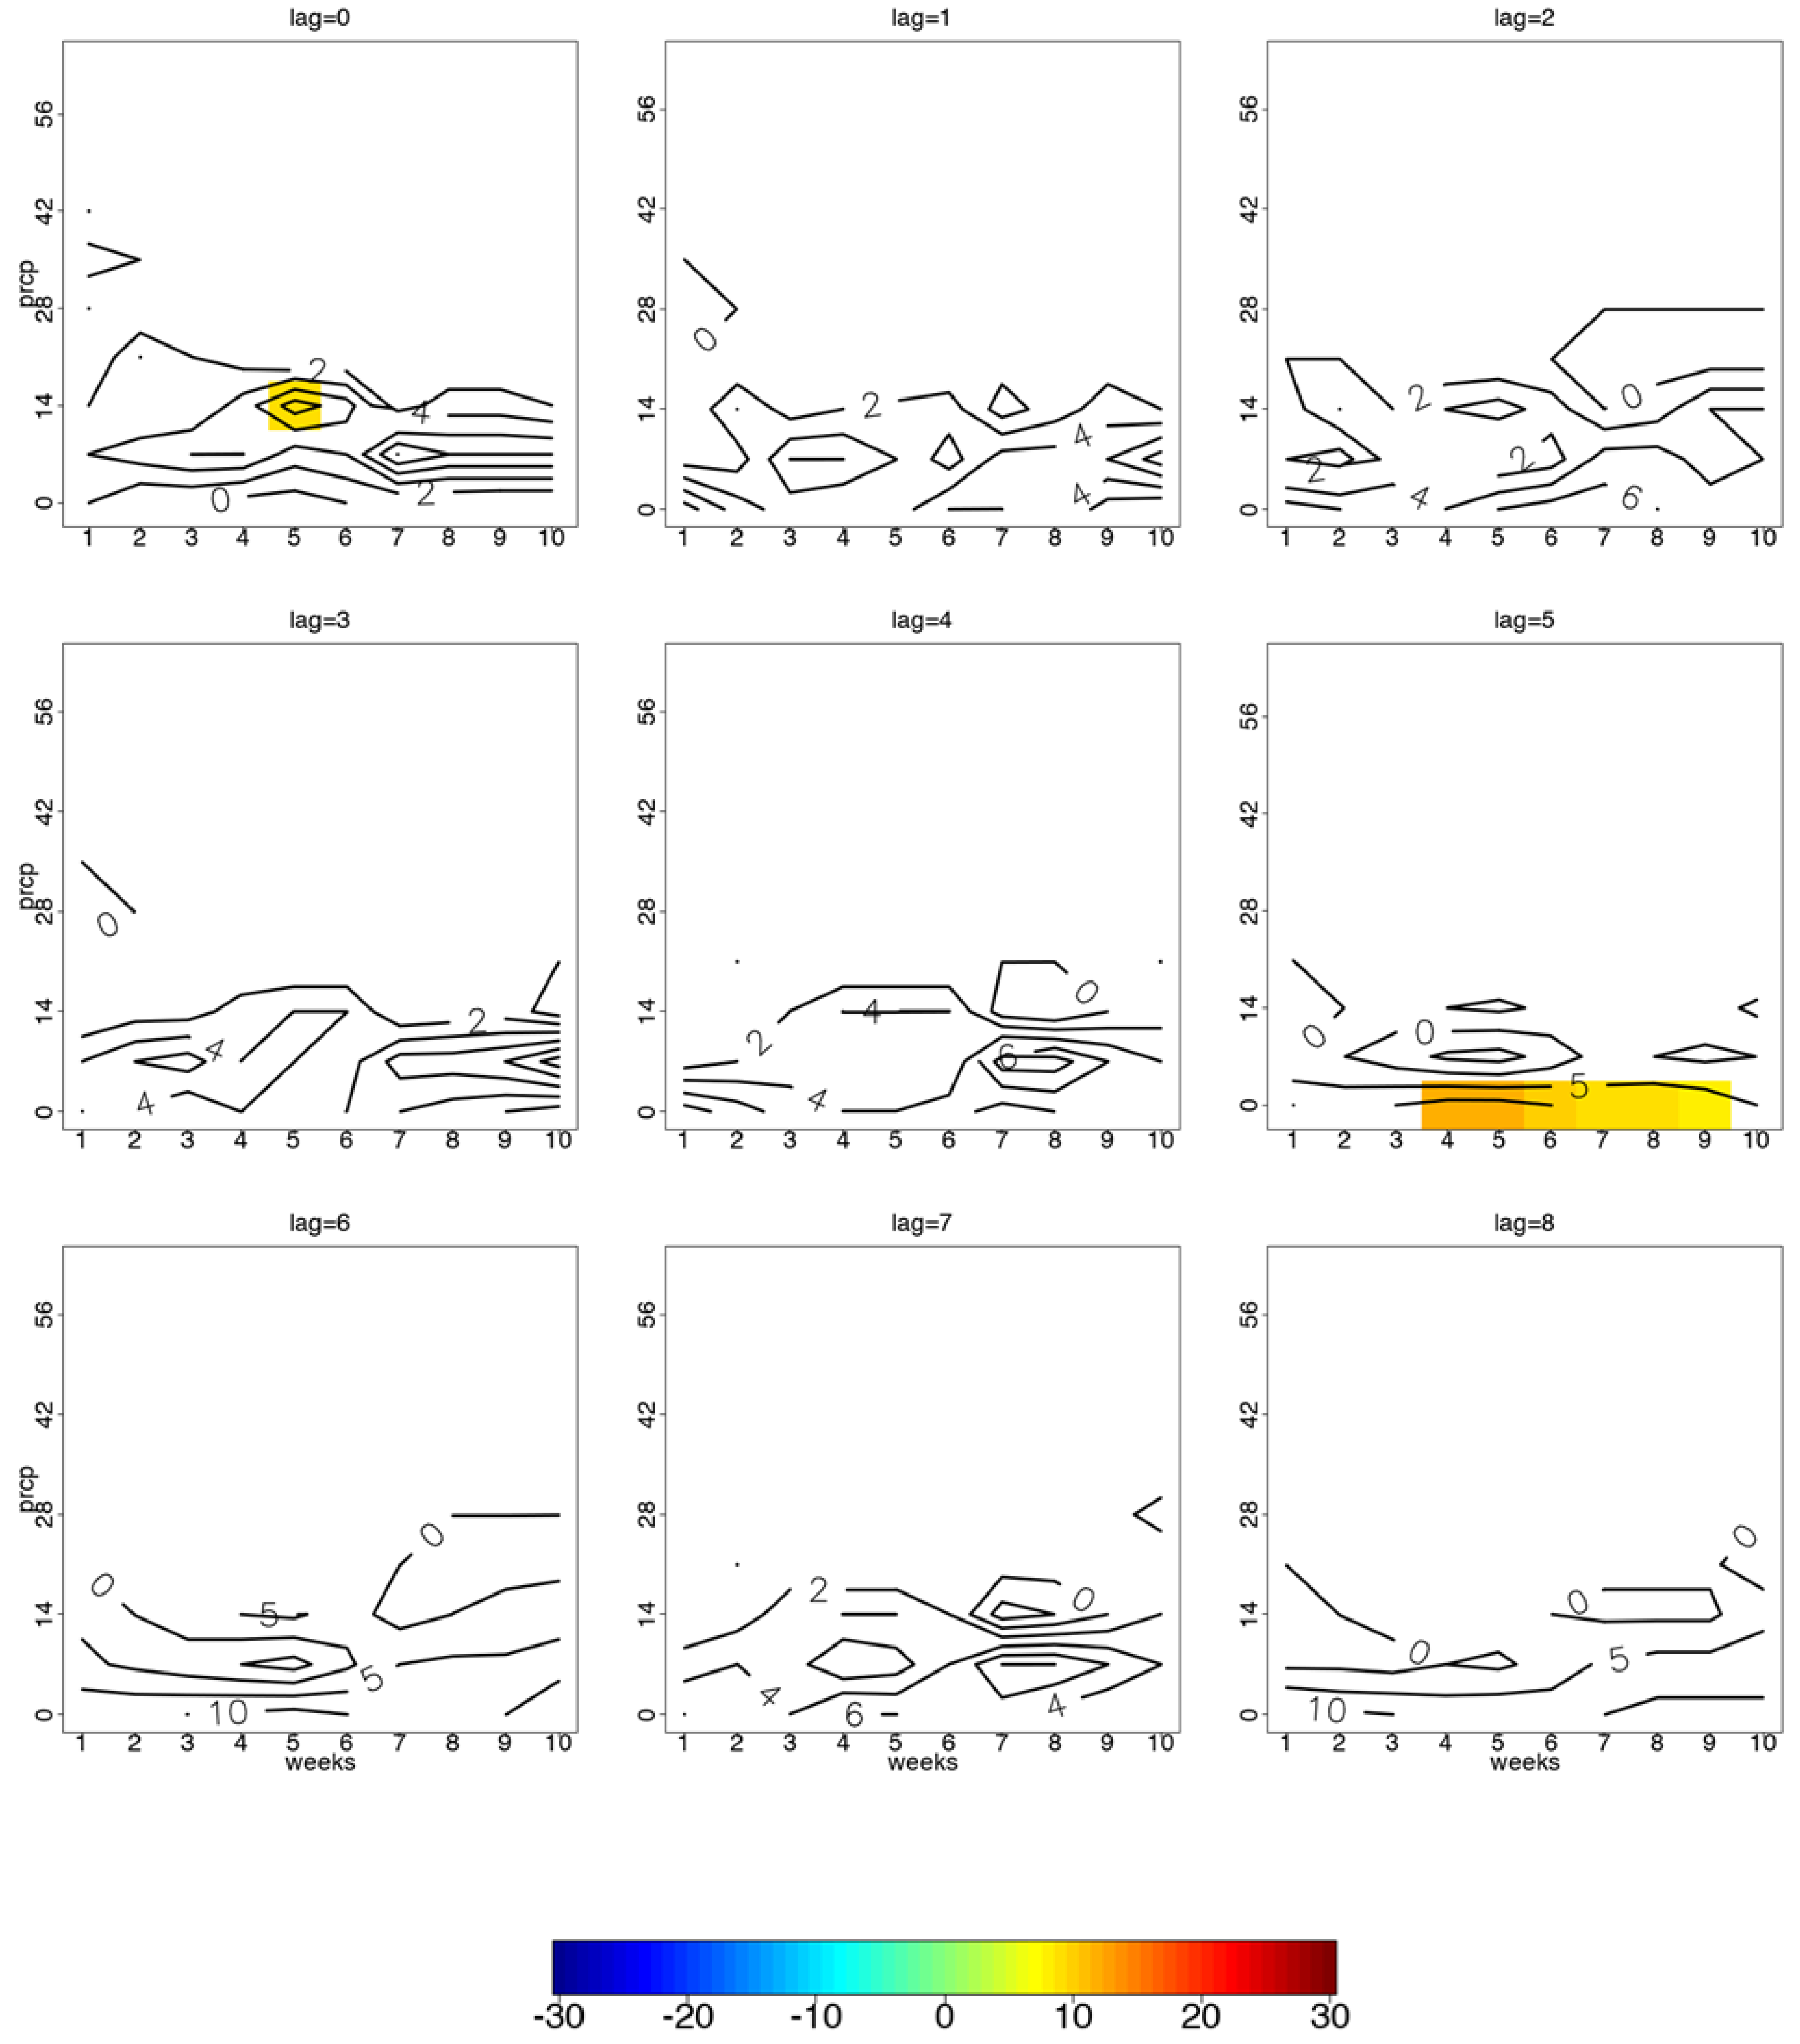
3.3. Precipitation and Diarrhoea Case Counts for Children Under 5 Years of Age

For children under 5 years of age, significant differences between the high and low groups showed different patterns in all seasons compared to the older age group. The most remarkable difference—evident by the ‘red cells’ in Figure 5 for most lags—indicated that there was a significantly positive difference when there was a lack of rain (0 mm of cumulative rain) for 1 to 2 weeks in JJA. Also, 5 or more consecutive weeks of 7 to 21 mm of cumulative rain showed significantly positive differences at most lags.
For SON, significant differences were seen most noticeably at a lag of 5 weeks with 4 to 9 weeks of consecutively no rain (Figure 6). Significant differences were not seen in DJF (Figure S3) and MAM showed differences only at 4 and 8 for 8 to 10 weeks of consecutive cumulative rain of 14 to 26 mm (Figure S4).

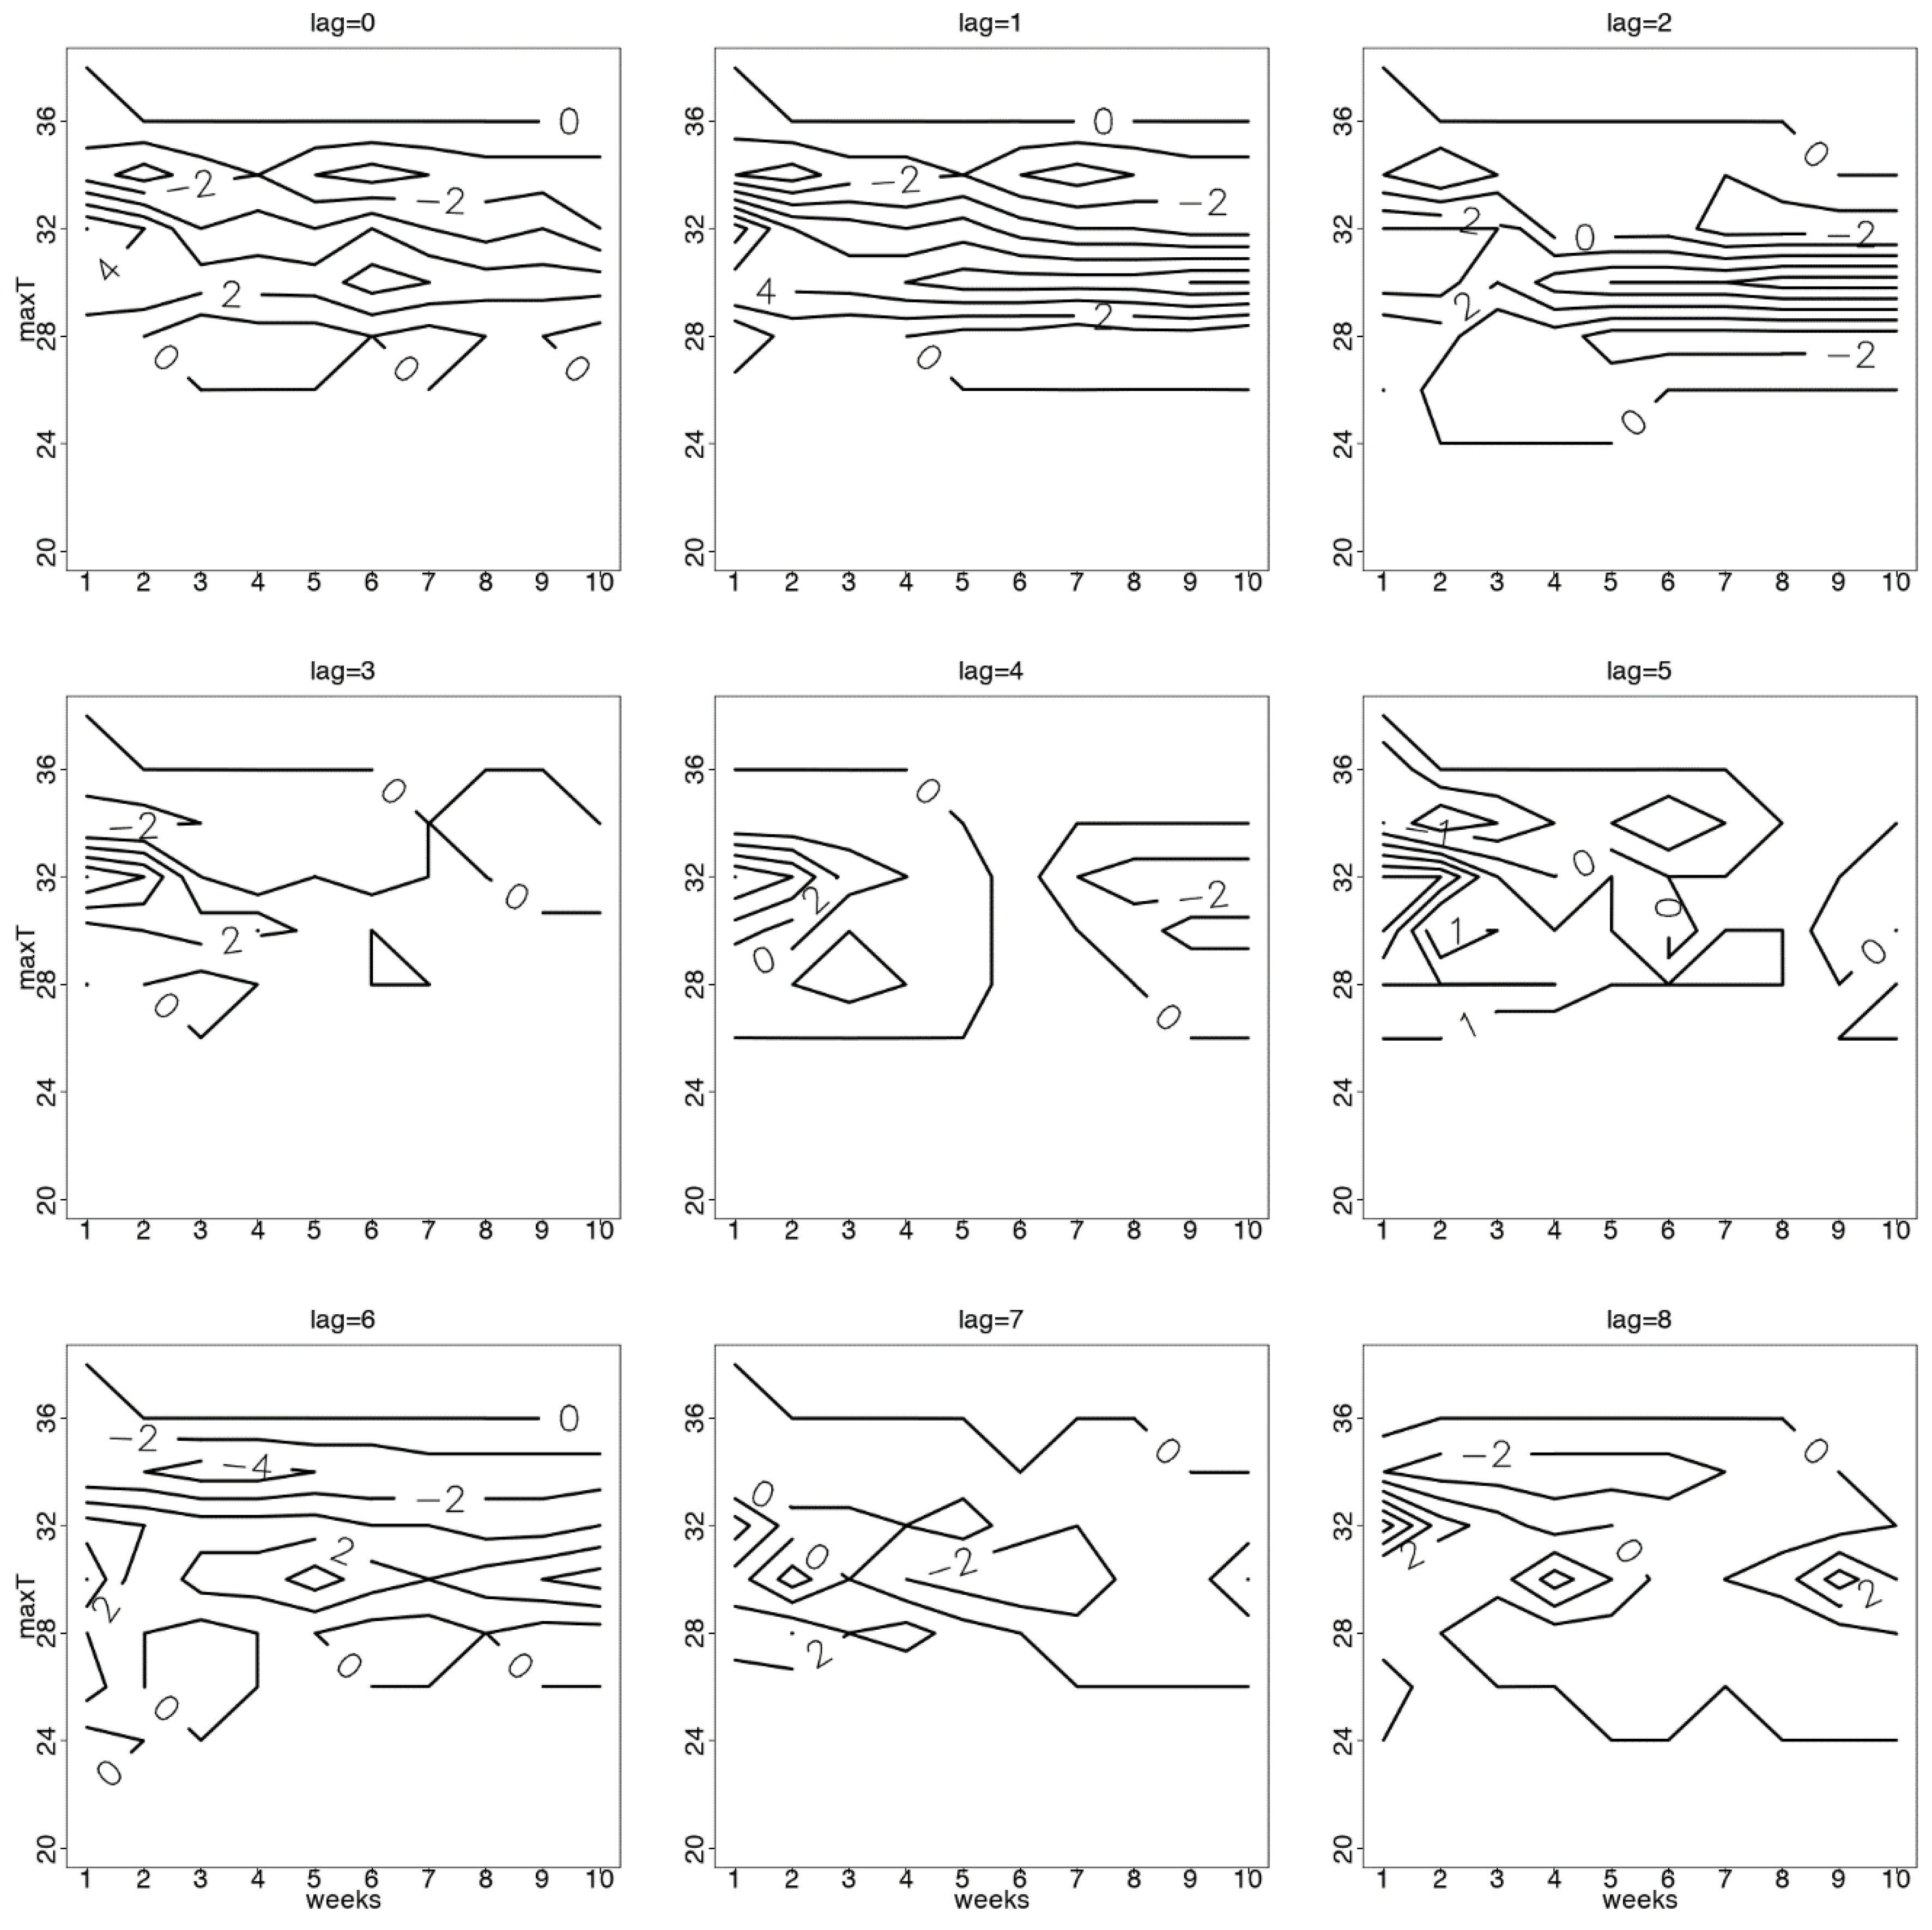
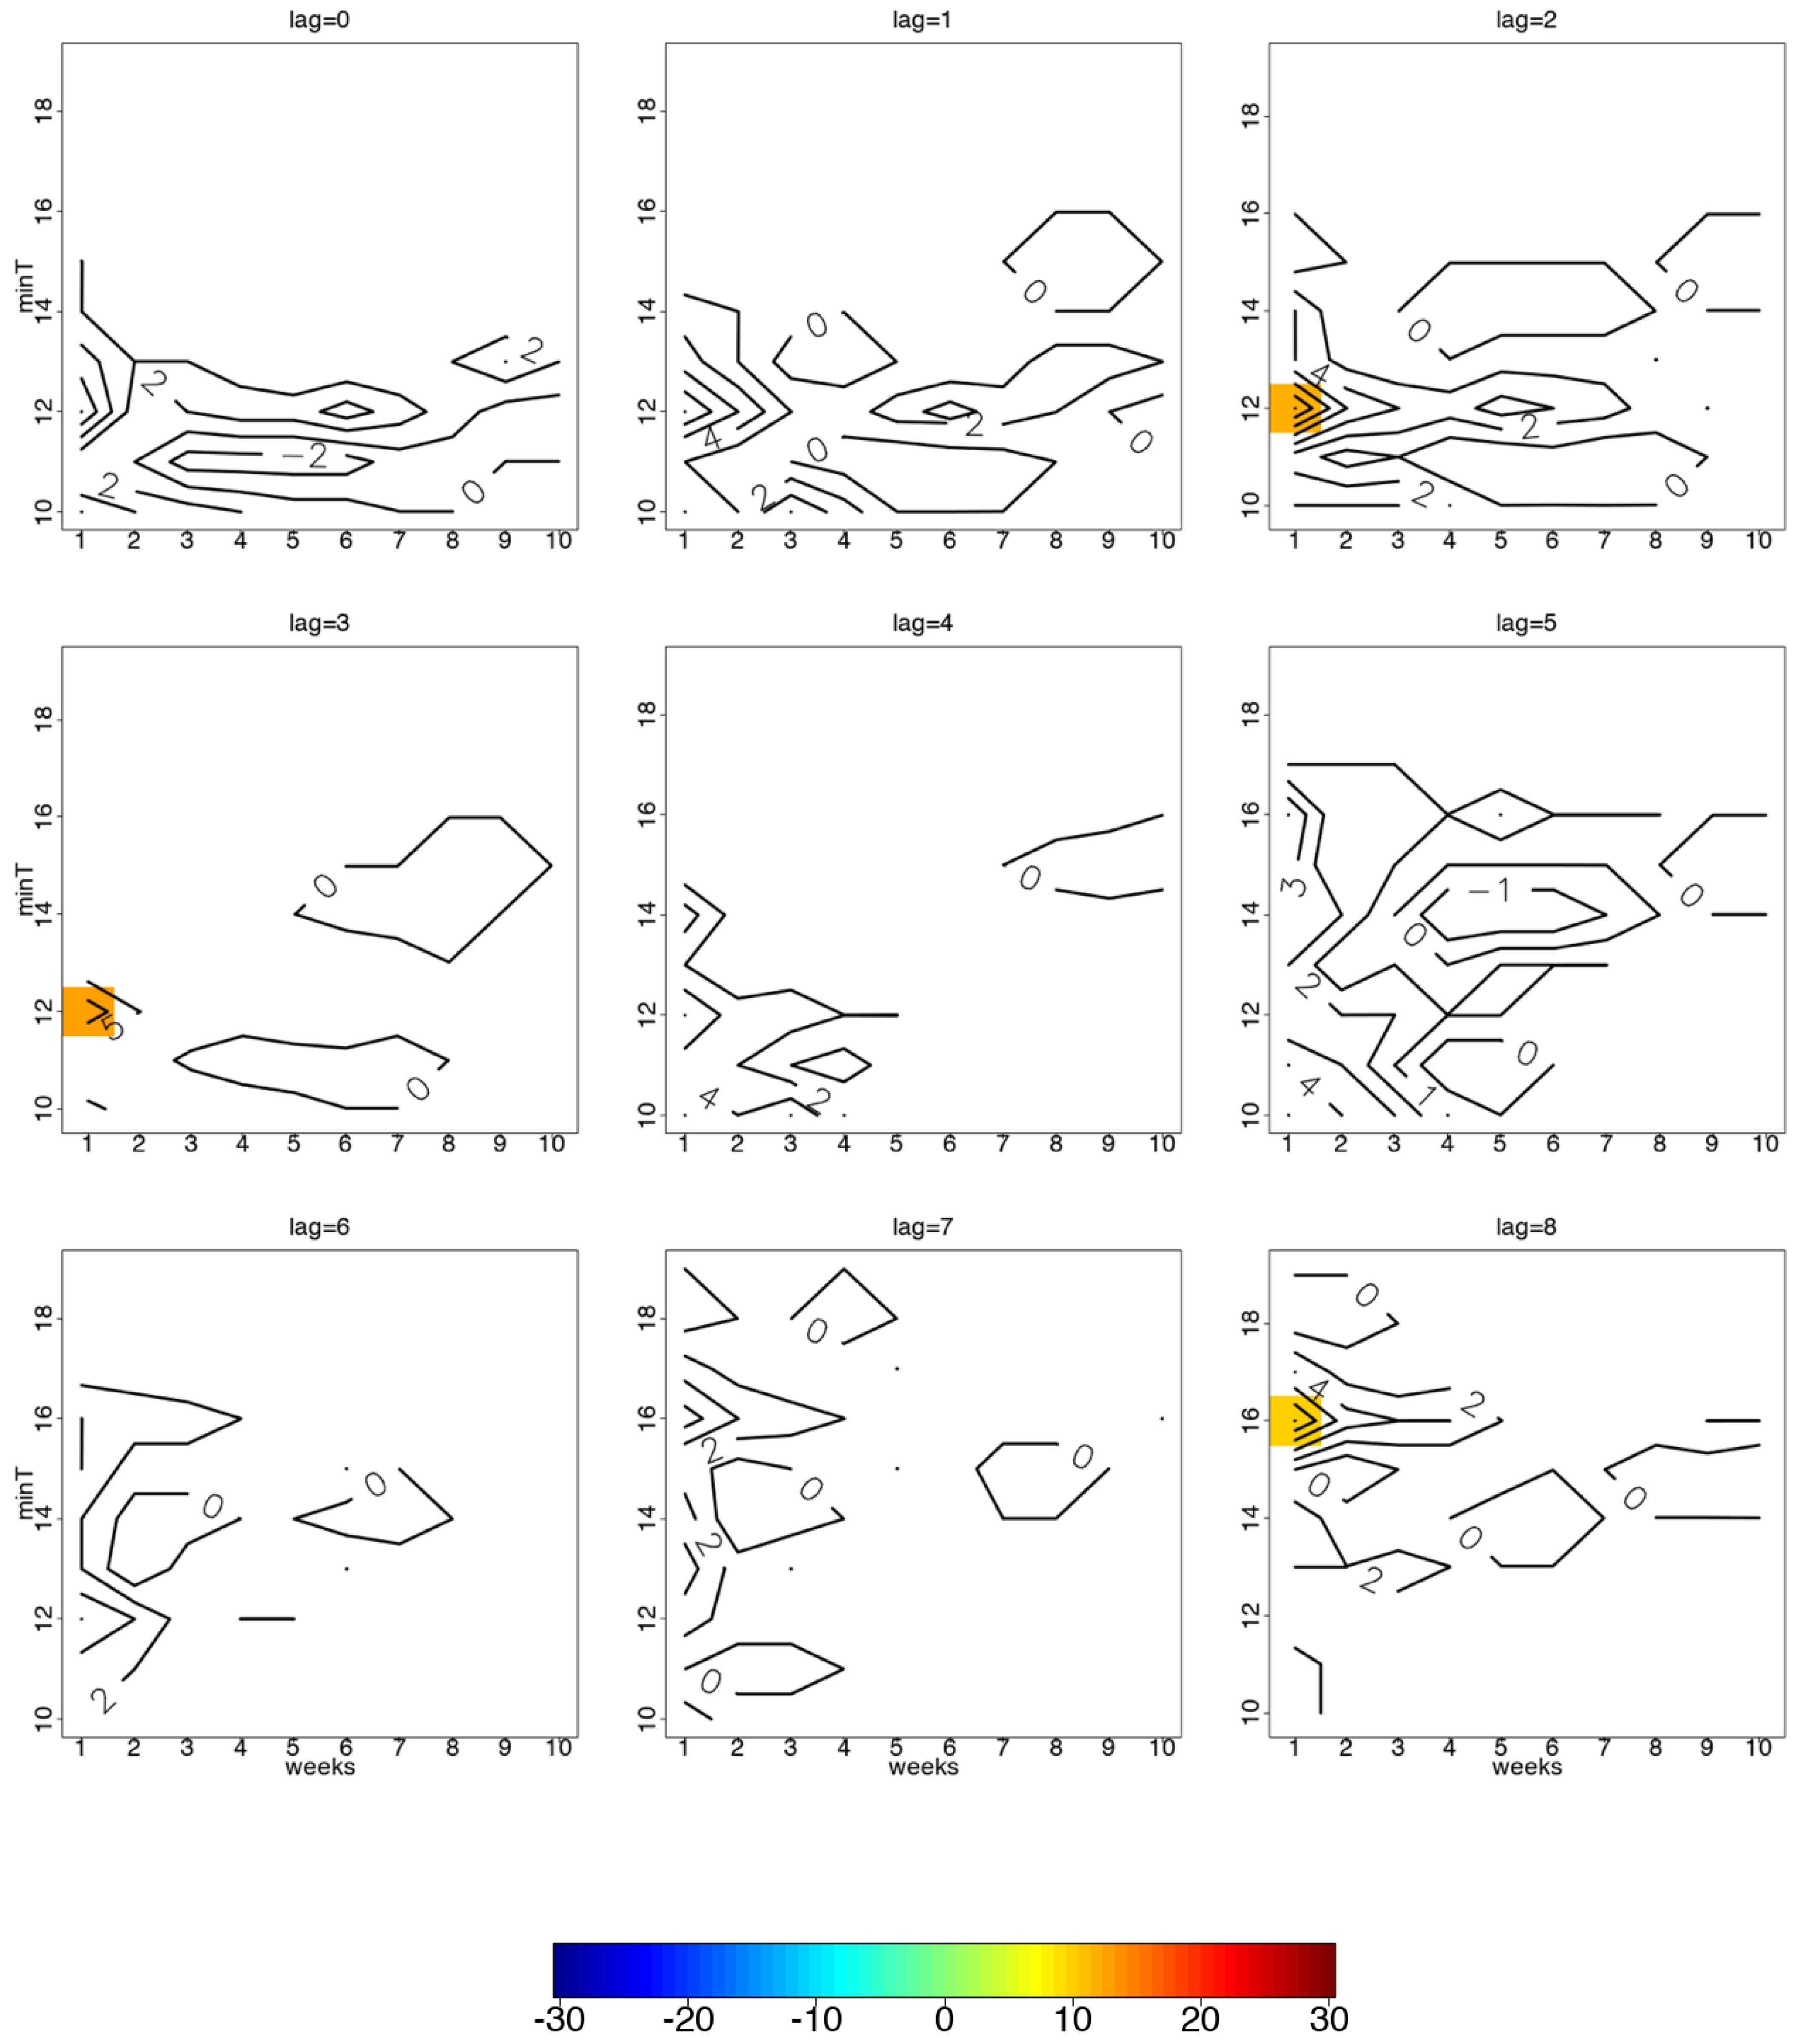
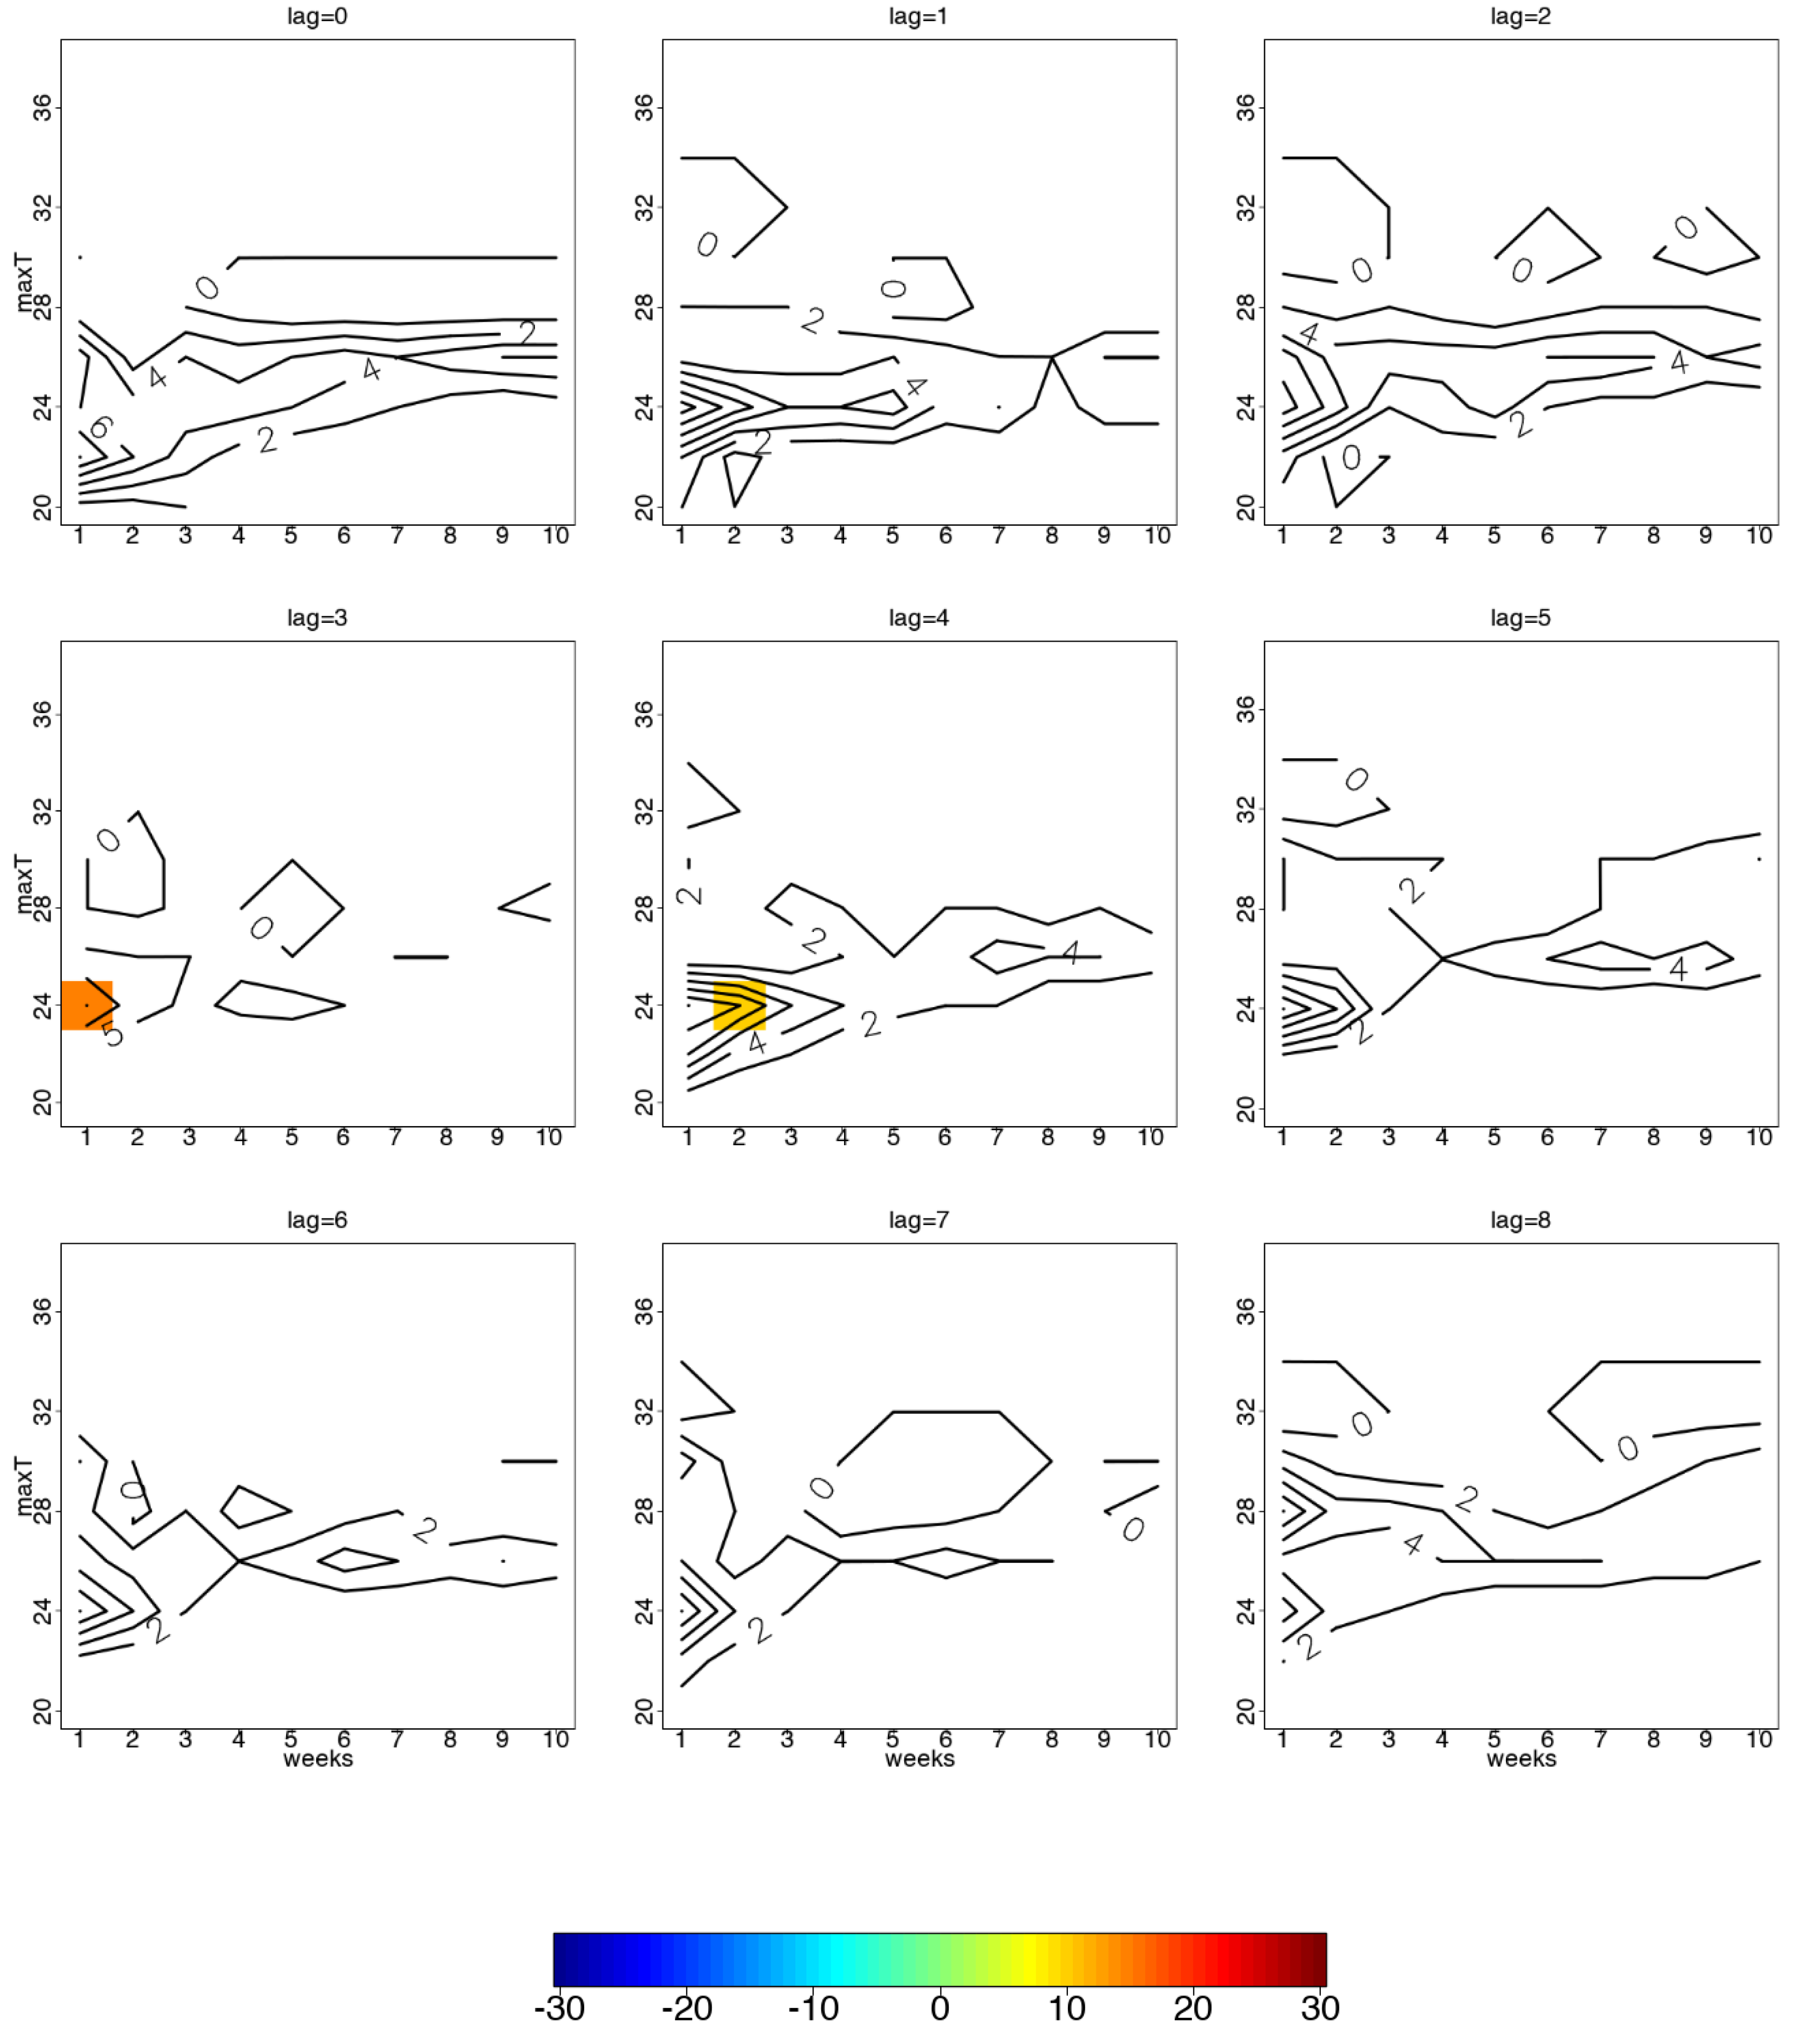
3.4. Temperature and Diarrhoea Case Counts for Individuals Aged 5 Years and Older

Unlike for precipitation and diarrhoea case counts, there were no statistically significant associations between temperature (Tmin and Tmax) and high and low anomalies in case counts of diarrhoea among individuals aged 5 years and older for any season. We show an example for Tmax in DJF in Figure 7. There were no statistically significant contour differences in anomalously high or low diarrhoea case counts for lag 0 to 8 weeks per consecutive weeks of minimum or maximum temperature among individuals 5 years and older for DJF, MAM, JJA or SON.

3.5. Temperature and Diarrhoea Case Counts for Children Under 5 Years of Age

Among children under 5 years of age, there were some differences of Tmin and Tmax between the high and low groups for seasons JJA and SON. For JJA, 1 week of Tmin at 12 °C at 2 to 3 weeks lag and 16 °C at 8 weeks lag showed significant positive differences between high and low groups (Figure 8). For Tmax, 1 to 2 weeks of consecutive temperatures reaching 24 °C showed positive differences between the two groups at 3 to 4 weeks lag (Figure 9). As for SON, 9 to 10 weeks of consecutive Tmax of 26 °C showed positive significant differences at 5-, 7- and 8-weeks lag (Figure 10). Seasons DJF and MAM did not show any significant differences.

4. Discussion

We explored the relationship between precipitation/temperature and case counts of diarrhoea hospital admissions using a novel approach of ‘contour analysis’ to visually explain simultaneous statistically significant observations in frequencies of anomalously high and low diarrhoea case counts occurring in a season. Previous studies have used alternate statistical methods of analysis, such as time series regression [27,28] to consider the relationship between precipitation and diarrhoea, and temperature and diarrhoea. In those studies, the datasets were significantly larger in size compared to the data available in our study and there were fewer missing data, most likely because of electronic record-keeping, which is not common practice in rural, African hospitals and clinics.
We successfully implemented contour analysis for the first time with meteorological and public health data. This method of analysis is therefore of great potential value for use with relatively small- and medium-sized datasets and where the hospital admissions data are constrained due to missing information—partially because of data being handwritten and not electronically captured. In time series analysis, for example, the approach would be to either remove all data prior to the complete year of missing data (in our study this was the year 2006) or use data imputation. In our analyses, we did not need to remove the data, because our analysis was not affected by such missing data. Instead, we treated missing values as missing (not zeroes) and focused on the anomalously high and low diarrhoea counts.
Our most statistically significant findings were for children under 5 years of age in whom we saw a high prevalence of diarrhoea when conditions were either wetter than average during the rainy season or drier than average during the dry season, as well as when temperatures were higher than normal. The results shown suggest that rainfall has a bigger role in disease transmission compared to the temperature. Children may be particularly vulnerable to diarrhoea transmission when conditions are very dry and hot. A similar finding was seen in Nigeria where rotavirus was also most prevalent (95% of all cases) during the dry season [29]. Similarly, in Botswana, diarrhoea incidence is high in both the wet and dry seasons, but it was unexpectedly highest in the dry season with a 20% increase over the yearly mean [30]. In the latter study, the authors hypothesized that the dry (and hot) conditions encouraged the activity and density of flies that transmitted diarrhoea-causing microorganisms. Our findings also concur with a cross-sectional study conducted in the Pacific Islands by Singh et al. [31] that found low rainfall was statistically significantly associated with increased reports of diarrhoea in the same month and the following month. The decrease in diarrhoea rates due to a decrease in rainfall can be summarized by a global study that assessed the association between diarrhoea morbidity and climate variables. Using data from a global range of sites, predominately in low income countries, the study found that there was a 4% increase in diarrhoea incidence for each 10 mm mo−1 decrease in rainfall [32].
We surmise that in Limpopo, South Africa, the warmer and drier conditions may lead to water shortages, lower availability of safe water sources [33] and increased water storage (perhaps not hygienically maintained), reducing personal use (and cleaning) of outdoor pit latrines, thereby reducing sanitation quality and personal hygiene. In addition, the wetter conditions may lead to increased risks of water contamination. Under-developed infrastructure and illegal connections to water supply pipes may also lead to contaminated water [18]. It is possible that children under the age of 5 are more vulnerable to such conditions. However, these assumptions remain to be verified among the communities served by the two hospitals from which data were drawn for use in the analyses presented here.
Our study was constrained by the quantity and quality of the hospital admissions data that were used to determine diarrhoea prevalence. Misdiagnosis and misclassification were also evident in the hospital records, for example, where there was no clear indication of the final diagnosis of health outcome when a patient was discharged and where dates were entered incorrectly (the discharge date was sometimes captured as being before the admission date). While it would have been informative to know the cause of each diarrhoea case, this information was not available from the hospitals, however, it is possible that the dry, cold season diarrhoea was of viral cause [18]. In almost all cases the information on the patient’s sex was missing. Therefore, it was not possible to use these data in our analyses. Despite those hurdles, the results presented here are statistically significant, and missing data and incorrect reporting are unlikely to drastically change the conclusions.

5. Conclusions

In summary, using a novel approach of analysis, we detected trends in patterns of precipitation and temperature in relation to diarrhoea prevalence for two separate age groups, children younger than 5 years of age and children aged 5 years and older.
Children under 5 years of age were especially vulnerable to diarrhoea during very dry, hot conditions as well as when conditions were wetter than usual. We saw an anomalously higher number of diarrhoea cases during ‘warmer than usual’ conditions in the dry winter season, with average winter temperatures in Limpopo being from about 5 to 10 °C. As for ‘wetter than usual’ conditions, we saw an anomalously higher number of diarrhoea cases during ‘drier than usual’ conditions for the winter and spring. Therefore, there were two distinct peaks in diarrhoea case counts: one for the consecutively dry weeks (with 0 mm of cumulative rain) and the other peak when conditions were wetter than usual, with 5 or more consecutive weeks of 7 to 21 mm of cumulative rain. For winter, two peaks were also statistically distinguishable within lag period, meaning that the difference between high and low anomaly groups maintained a bimodal nature.
The lagged association seen in cumulative rainfall could not be distinguished in the same way for temperature-related variables (indicating rainfall had a larger impact on higher cases of diarrhoea), for summer and autumn seasons (indicating that there were no significant differences between the high and low groups due to similar climate conditions), nor for the older age group of 5 years and older (indicating the younger age group being more susceptible/vulnerable to both sides of the spectrum in terms of wetter and drier than normal conditions, especially in the dry winter season). These differences may also have occurred due to under-reporting in older ages, the use of self-treatment among older individuals etc.
We noted from our findings that local living, environmental and environmental health conditions likely ‘overwhelm’ the typical climate-disease patterns known to influence diarrhoeal disease. Dry conditions lead to changes in water availability, use and storage and likely increase the risk of diarrhoea transmission in rural settings, whereas wet conditions lead to water contamination. Rural communities require adequate and uninterrupted water provision all-year round. Healthcare practitioners should help raise awareness about potential diarrhoeal risks—especially during the dry season. Policy- and decision-makers should be advised that diarrhoea risk may need multi-season attention and not only during the rainy season. Future research should consider the linkages between climatic and environmental health factors in more detail. A significant proportion of diarrhoeal disease can be prevented through safe drinking water, adequate sanitation and personal and food hygiene, so therefore this should remain a priority especially in rural settings.

Supplementary Materials

The following are available online at https://0-www-mdpi-com.brum.beds.ac.uk/2073-4433/10/9/522/s1, Figure S1: Statistically significant contour differences in anomalously high and low diarrhoea case counts for lag 0 to 8 weeks per consecutive weeks of precipitation among individuals aged 5 years and older for season DJF, Figure S2. Statistically significant contour differences in anomalously high and low diarrhoea case counts for lag 0 to 8 weeks per consecutive weeks of precipitation among individuals aged 5 years and older for season MAM, Figure S3. Statistically significant contour differences in anomalously high and low diarrhoea case counts for lag 0 to 8 weeks per consecutive weeks of precipitation among individuals under 5 years of age for season DJF, Figure S4. Statistically significant contour differences in anomalously high and low diarrhoea case counts for lag 0 to 8 weeks per consecutive weeks of precipitation among individuals under 5 years of age for season MAM, Figure S5. Statistically significant contour differences in anomalously high and low diarrhoea case counts for lag 0 to 8 weeks per consecutive weeks of minimum temperature among individuals under 5 years of age for season JJA, Figure S6. Statistically significant contour differences in anomalously high and low diarrhoea case counts for lag 0 to 8 weeks per consecutive weeks of maximum temperature among individuals under 5 years of age for season JJA, Figure S7. Statistically significant contour differences in anomalously high and low diarrhoea case counts for lag 0 to 8 weeks per consecutive weeks of maximum temperature among individuals under 5 years of age for season SON.

Author Contributions

Conceptualization, T.I., C.Y.W., T.K. and A.M.; formal analysis, T.I.; writing—original draft preparation, C.Y.W. and T.I.; writing—review and editing, T.I., T.K., S.K.B., N.M., M.H., N.S., A.M., C.Y.W.

Funding

This research was carried out for the iDEWS (infectious Diseases Early-Warning System) project supported by SATREPS (Science and Technology Research Partnership for Sustainable Development) Program of JICA (JAPAN International Cooperation Agency)/AMED (Japan Agency for Medical Research and Development) in Japan and the ACCESS (Applied Centre for Climate and Earth Systems Science) program of NRF (National Research Foundation) and DST (Department of Science and Technology in South Africa).

Acknowledgments

Zamantimande Kunene, Mirriam Mogotsi and Wellington Siziba are acknowledged for collecting hospital data. We thank the hospital management and staff for permitting the study and for accommodating our team during the collection periods. We acknowledge the South African Weather Service for provision of the temperature and precipitation data.

Conflicts of Interest

The authors declare no conflict of interests.

References

  1. WHO. 2017 Diarrheal Disease Key Facts. Available online: http://www.who.int/news-room/fact-sheets/detail/diarrhoeal-disease (accessed on 8 October 2018).
  2. Kosek, M.; Bern, C.; Guerrant, R.L. The global burden of diarrheal disease, as estimated from studies published between 1992 and 2000. Bull. WHO 2003, 81, 197–204. [Google Scholar]
  3. Awoniton, O.F.; Pillay-van Wky, V.; Dhansay, A.; Day, C.; Bradshaw, D. Diarrhoea in children under five years of age in South Africa (1997–2014). Trop. Med. Int. Health 2016, 21, 1060–1070. [Google Scholar]
  4. McMichael, A.J.; Woodruff, R.E.; Hales, S. Climate change and human health: Present and future risks. Lancet 2007, 367, 859–869. [Google Scholar] [CrossRef]
  5. Patz, J.; Campbell-Lendrum, D.; Holloway, T.; Foley, J.A. Impact of regional climate change on human health. Nature 2005, 438, 310–317. [Google Scholar] [CrossRef]
  6. Haines, A.; Kovats, R.S.; Campbell-Mendrum, D.; Corvalan, C. Climate change and human health: Impacts, vulnerability and public health. Public Health 2006, 120, 585–596. [Google Scholar] [CrossRef]
  7. Levy, K.; Woster, A.P.; Goldstein, R.S.; Carlton, E.J. Untangling the impacts of climate change on waterborne diseases: A systematic review of relationships between diarrheal diseases and temperature, rainfall, flooding, and drought. Environ. Sci. Technol. 2016, 50, 4905–4922. [Google Scholar] [CrossRef]
  8. WHO. Climate Change and Human Health—Risks and Responses Summary. 2018. Available online: http://www.who.int/globalchange/summary/en/index4.html (accessed on 8 October 2018).
  9. Hashizume, M.; Armstrong, B.; Hajat, S.; Wagatsuma, Y.; Faruque, A.; Hayashi, T.; Sack, D. Association between climate variability and hospital visits for non-cholera diarrhoea in Bangladesh: Effects and vulnerable groups. Int. J. Epidemiol. 2007, 36, 1030–1037. [Google Scholar] [CrossRef]
  10. Thiam, S.; Diene, A.N.; Sy, I.; Winkler, M.S.; Schindler, C.; Ndione, J.A.; Faye, O.; Vounatsou, P.; Utzinger, J.; Cissé, G. Association between childhood diarrheal incidence and climatic factors in urban and rural settings in the Health District of Mbour, Senegal. Int. J. Environ. Res. Public Health 2017, 14, 1049. [Google Scholar] [CrossRef]
  11. Thompson, C.N.; Zelner, J.L.; Nhu Tdo, H.; Phan, M.V.; Hoang Le, P.; Nguyen Thanh, H.; Vu Thuy, D.; Minh Nguyen, N.; Ha Manh, T.; Van Hoang Minh, T.; et al. The impact of environmental and climatic variation on the spatiotemporal trends of hospitalized paediatric diarrhoea in Ho Chi Minh City, Vietnam. Health Place 2015, 35, 147–154. [Google Scholar] [CrossRef]
  12. Carlton, E.J.; Eisenberg, J.N.S.; Goldstick, J.; Cevallos, W.; Trostel, J.; Levy, K. Heavy rainfall events and diarrhoea incidence: The role of social and environmental factors. Am. J. Epidemiol. 2013, 179, 344–352. [Google Scholar] [CrossRef]
  13. Bandyopadhyay, S.; Kanji, S.; Wang, L. The impact of rainfall and temperature variation on diarrheal prevalence in Sub-Saharan Africa. Appl. Geogr. 2012, 33, 63–72. [Google Scholar] [CrossRef]
  14. Chou, W.C.; Wu, J.L.; Wang, Y.C.; Huang, H.; Sung, F.C.; Chuang, C.Y. Modelling the impact of climate variability on diarrhoea-associated diseases in Taiwan (1996–2007). Sci. Total Environ. 2010, 409, 43–51. [Google Scholar] [CrossRef]
  15. Ebi, K.L. Adaptation costs for climate change-related cases of diarrheal disease, malnutrition, and malaria in 2030. Glob. Health 2008, 4, 9. [Google Scholar] [CrossRef]
  16. Haffejee, I.E.; Moosa, A. Rotavirus studies in Indian (Asian) South African infants with acute gastro-enteritis: I. Microbiological and epidemiological aspects. Ann. Trop. Paediatr. 1990, 10, 165–172. [Google Scholar] [CrossRef]
  17. Mphahlele, M.J.; Steele, A.D. Relative frequency of human rotavirus VP4 (P) genotypes recovered over a ten-year period from South African children with diarrhea. J. Med. Virol. 1995, 47, 1–5. [Google Scholar] [CrossRef]
  18. Potgieter, N.; de Beer, M.C.; Taylor, M.B.; Steele, A.D. Prevalence and diversity of rotavirus strains in children with acute diarrhoea from rural communities in the Limpopo Province, South Africa, from 1998 to 2000. J. Infect. Dis. 2010, 202 (Suppl. 1), 148–155. [Google Scholar] [CrossRef]
  19. Lopez-Carr, D.; Pricope, N.G.; Aukema, J.E.; Jankowska, M.M.; Funk, C.; Husak, G.; Michaelson, J. A spatial analysis of population dynamics and climate change in Africa: Potential vulnerability hot spots emerge when precipitation declines and demographic pressures coincide. Popul. Environ. 2014, 35, 323–339. [Google Scholar] [CrossRef]
  20. Mopani District Municipality. Reviewed Integrated Development Plan 2016–2021 (2017/18 Version 2); Mopani District Municipality: Giyani, South Africa, 2017. Available online: http://www.mopani.gov.za/docs/idp/Mopani%20IDP%202017%202018%20Version%202.pdf (accessed on 17 August 2019).
  21. Christiansen, T.B.; Lauritsen, J.M. (Eds.) EpiData—Comprehensive Data Management and Basic Statistical Analysis System; EpiData Association: Odense, Denmark, 2010; Available online: http://www.epidata.dk (accessed on 17 August 2019).
  22. University of Wisconsin-Madison. Contour Analysis. 1997. Available online: http://cimss.ssec.wisc.edu/wxwise/contour/contour1.html (accessed on 8 October 2018).
  23. Swales, D.; Alexander, M.; Hughes, M. Examining moisture pathways and extreme precipitation in the U.S. Intermountain West using self-organizing maps. Geophys. Res. Lett. 2016, 43, 1727–1735. [Google Scholar] [CrossRef]
  24. Hope, A.C.A. A simplified Monte Carlo significance test procedure. J. R. Stat. Soc. Ser. B 1968, 30, 582–598. [Google Scholar] [CrossRef]
  25. Carlton, E.J.; Woster, A.P.; DeWitt, P.; Goldstein, R.S.; Levy, K. A systematic review and meta-analysis of ambient temperature and diarrheal diseases. Int. J. Epidemiol. 2016, 45, 117–130. [Google Scholar] [CrossRef]
  26. R Core Team. R: A Language and Environment for Statistical Computing; R Foundation for Statistical Computing: Vienna, Austria, 2016; Available online: https://www.R-project.org/ (accessed on 8 October 2018).
  27. Purohit, S.G.; Kelkar, S.D.; Simha, V. Time series analysis of patients with rotavirus diarrhoea in Pune, India. J. Diarrheal Dis. Res. 1998, 16, 74–83. [Google Scholar]
  28. Imai, C.; Hashizume, M. A Systematic review on methodology: Time series regression analysis for environmental factors and infectious diseases. Trop. Med. Health 2015, 43, 1–9. [Google Scholar] [CrossRef]
  29. Tagbo, B.N.; Mwenda, J.M.; Armah, G.; Obidike, E.O.; Okafor, U.H.; Oguonu, T.; Ozumba, U.C.; Eke, C.B.; Chukwubuike, C.; Edelu, B.O.; et al. Epidemiology of rotavirus diarrhoea among children younger than 5 years in Enugu, South East, Nigeria. Paediatr. Infect. Dis. J. 2014, 33, S19–S22. [Google Scholar] [CrossRef]
  30. Alexander, K.A.; Carzolio, M.; Goodin, D.; Vance, E. Climate Change is Likely to Worsen the Public Health Threat of Diarrheal Disease in Botswana. Int. J. Environ. Res. Public Health 2013, 10, 1202–1230. [Google Scholar] [CrossRef]
  31. Singh, R.B.; Hales, S.; De Wet, N.; Raj, R.; Hearnden, M.; Weinstein, P. The influence of climate variation and change on diarrheal disease in the Pacific Islands. Environ. Health Perspect. 2001, 109, 155–159. [Google Scholar] [CrossRef]
  32. Boithias, L.; Choisy, M.; Souliyaseng, N.; Jourden, M.; Quet, F.; Buisson, Y.; Thammahacksa, C.; Silvera, N.; Latsachack, K.; Sengtaheuanghoung, O.; et al. Hydrological Regime and Water Shortage as Drivers of the Seasonal Incidence of Diarrheal Diseases in a Tropical Montane Environment. PLoS Negl. Trop. Dis. 2016, 10, e0005195. [Google Scholar] [CrossRef]
  33. Kapwata, T.; Mathee, A.; le Roux, W.; Wright, C.Y. Diarrhoeal disease in relation to possible household risk factors in South African villages. Int. J. Environ. Res. Public Health 2018, 15, 1665. [Google Scholar] [CrossRef]
Figure 1. Location of the two hospitals and meteorological stations in the study site in Limpopo Province, South Africa (Map produced by the SAMRC).
Atmosphere 10 00522 g001
Figure 2. High and low weekly diarrhoea case count anomalies for (a) individuals aged 5 years and older and (b) children under 5 years of age between 2002 and 2016. Anomalies were normalised for comparison purposes. The anomaly was obtained by removing the linear trend and seasonal climatology of the counts. Colours represent positive (red) and negative (blue) anomalies. Normalisation entailed using the time series counts minus the mean of all counts then divided by the standard deviation.
Atmosphere 10 00522 g002
Figure 3. Statistically significant contour differences in anomalously high and low diarrhoea case counts for lag 0 to 8 weeks per consecutive weeks of precipitation among individuals aged 5 years and older for season JJA. X-axis represents number of consecutive weeks in which the average precipitation reached over Y-axis representing rainfall in millimetres (mm). Warm colours represent higher frequency of (X, Y) occurring when diarrhoea case counts were anomalously higher than average.
Atmosphere 10 00522 g003aAtmosphere 10 00522 g003b
Figure 4. Statistically significant contour differences in anomalously high and low diarrhoea case counts for lag 0 to 8 weeks per consecutive weeks of precipitation among individuals aged 5 years and older for season SON. X-axis represents number of consecutive weeks in which the average precipitation reached over Y-axis representing rainfall in millimetres (mm). Warm colours represent higher frequency of (X, Y) occurring when diarrhoea case counts were anomalously higher than average.
Atmosphere 10 00522 g004
Figure 5. Statistically significant contour differences in anomalously high and low diarrhoea case counts for lag 0 to 8 weeks per consecutive weeks of precipitation among individuals under 5 years of age for season JJA. X-axis represents number of consecutive weeks in which the average precipitation reached over Y-axis representing rainfall in millimetres (mm). Warm colours represent higher frequency of (X, Y) occurring when diarrhoea case counts were anomalously higher than average.
Atmosphere 10 00522 g005
Figure 6. Statistically significant contour differences in anomalously high and low diarrhoea case counts for lag 0 to 8 weeks per consecutive weeks of precipitation among individuals under 5 years of age for season SON. X-axis represents number of consecutive weeks in which the average precipitation reached over Y-axis representing rainfall in millimetres (mm). Warm colours represent higher frequency of (X, Y) occurring when diarrhoea case counts were anomalously higher than average.
Atmosphere 10 00522 g006
Figure 7. There were no statistically significant contour differences in anomalously high and low diarrhoea case counts for lag 0 to 8 weeks per consecutive weeks of maximum temperature among individuals 5 years of age and older for season DJF. X-axis represents number of consecutive weeks in which the average temperature reached over Y-axis representing temperature in degrees Celsius (°C). Warm colours represent higher frequency of (X, Y) occurring when diarrhoea case counts were anomalously higher than average.
Atmosphere 10 00522 g007
Figure 8. Statistically significant contour differences in anomalously high and low diarrhoea case counts for lag 0 to 8 weeks per consecutive weeks of minimum temperature among individuals under 5 years of age for season JJA. X-axis represents number of consecutive weeks in which the average temperature reached over Y-axis representing temperature in degrees Celsius (°C). Warm colours represent higher frequency of (X, Y) occurring when diarrhoea case counts were anomalously higher than average.
Atmosphere 10 00522 g008
Figure 9. Statistically significant contour differences in anomalously high and low diarrhoea case counts for lag 0 to 8 weeks per consecutive weeks of maximum temperature among individuals under 5 years of age for season JJA. X-axis represents number of consecutive weeks in which the average temperature reached over Y-axis representing temperature in degrees Celsius (°C). Warm colours represent higher frequency of (X, Y) occurring when diarrhoea case counts were anomalously higher than average.
Atmosphere 10 00522 g009
Figure 10. Statistically significant contour differences in anomalously high and low diarrhoea case counts for lag 0 to 8 weeks per consecutive weeks of maximum temperature among individuals under 5 years of age for season SON. X-axis represents number of consecutive weeks in which the average temperature reached over Y-axis representing temperature in degrees Celsius (°C). Warm colours represent higher frequency of (X, Y) occurring when diarrhoea case counts were anomalously higher than average.
Atmosphere 10 00522 g010
Table 1. Mean and standard error (SE) of weekly precipitation and temperature by season for 2002 to 2016 for the study site.
Climate VariableSeason
JJASONDJFMAM
Mean Tmax (°C) (Tmax SE)24.0 (0.2)28.7 (0.2)29.7 (0.2)26.9 (0.2)
Mean Tmin (°C) (Tmin SE)11.1 (0.1)16.2 (0.1)19.3 (0.1)15.6 (0.2)
Mean Prcp (mm) (Prcp SE)0.6 (0.2)7.4 (1.1)19.5 (2.6)6.9 (1.4)
Note. Prcp—precipitation, JJA—June-July-August (winter), SON—September-November-December (spring), DJF—December-January-February (summer) and MAM—March-April-May (autumn).

