Climatology and Spatiotemporal Analysis of North Atlantic Rapidly Intensifying Hurricanes (1851–2017)


1
Department of Geography and Anthropology, Louisiana State University, Baton Rouge, LA 70803, USA
2
Faculty in the Department of Geography and Anthropology, Louisiana State University, Baton Rouge, LA 70803, USA
*
Authors to whom correspondence should be addressed.
Atmosphere 2020, 11(3), 291; https://0-doi-org.brum.beds.ac.uk/10.3390/atmos11030291
Submission received: 31 January 2020
/
Revised: 4 March 2020
/
Accepted: 14 March 2020
/
Published: 16 March 2020
(This article belongs to the Special Issue Atmospheric Hazards)
Abstract
:In recent decades, the scientific ability to project tropical cyclone (TC) intensities and tracks has improved. Hurricanes undergoing the process of rapid intensification (RI) have created new barriers in formulating predictions of TC paths and peak velocities. Current research suggests the warming climate may produce more intense TCs with a higher probability of undergoing RI during their life cycle. The increased likelihood of rapidly intensifying TCs necessitates the development of an RI climatology spanning the current North Atlantic record. A time series count analysis suggests a significant increasing trend of RI events in the Atlantic basin by 29.1% (17%–45%) from the years 1900 to 2017. For the entire basin, the peak frequency occurs in September, followed by August, then October. Gulf of Mexico events tend to occur more regularly over June, July, August, and September, while Atlantic storms peak in August, September, and October. The onset of RI typically begins in the Western Caribbean and Gulf of Mexico, west of 85° W. The lifetime maximum intensity typically occurs in the Gulf of Mexico basin. Density analysis suggests the locations of lifetime maximum intensities (LMIs) in rapidly intensifying TCs are clustered through space. It should be noted that these results are dependent upon the HURDAT record of events. This research is necessary in order to find substantive trends in RI events that may aid future predictions of tropical cyclones; therefore, potentially decreasing the lives lost and the cost of damage that these storms are known to cause.
1. Introduction
The scientific community’s ability to project tropical cyclone (TC) intensities and tracks has improved in recent years. However, the consistent variability within TC intensity and activity every season creates persistent barriers in formulating accurate predictions of TC paths and peak velocities [1]. This is due to the range of severe hazards associated with these weather events, as well as the volatility that TCs are known to exhibit [2]. One such example of TC changeability is a storm’s capacity to undergo rapid intensification (RI). RI is typically defined as a 30 knot (25 and 35) increase in the one-minute maximum sustained surface wind speed over a 24-h period [3]. RI has recently become a main focus for researchers and policymakers in regard to TC hazards [3].
The North Atlantic basin has historically been a very active TC genesis site. Thus, an in-depth investigation of RI in TCs tracking within the Atlantic is a necessity. The National Hurricane Center (NHC) and Statistical Hurricane Intensity Prediction Scheme (SHIPS) databases find that 31% of all TCs, 60% of all hurricanes, 83% of all major hurricanes (Category 3+ on the Saffir-Simpson Hurricane Wind Scale), and all of Categories 4 and 5 hurricanes undergo RI [4]. Famously destructive storms, such as Camille (1969), Andrew (1992), Opal (1995), Mitch (1998), Charley (2004), Katrina (2005), Gustav (2008), Sandy (2012), and Harvey (2017) were shown to have undergone RI at some point within their life cycle [4].
The seasonal RI distribution in the Atlantic basin follows the Atlantic seasonal hurricane distribution, with the highest RI occurrence in September [5]. This is due to the increased likelihood of RI given the occurrence of more storms. From the years 1950 to 2014, the North Atlantic had a total of 988 TCs, and of these, 215 experienced at least one episode of RI. In relation to climate indices, RI is significantly correlated with the June–November El Niño southern oscillation (ENSO), main development region (MDR) sea surface temperatures, and the Atlantic warm pool (AWP) [5]. It is also suggested that there are three main regions of maximum RI occurrence: the Gulf of Mexico and Western Caribbean Sea, the open ocean southeast and east of Florida, and the Western Tropical North Atlantic [5,6]. Xu and Wang (2014) discuss the dependence of TC intensification rates on storm intensity and size in the North Atlantic basin, concluding that the intensification rate is positively correlated with storm intensity and negatively correlated with storm size in terms of the radius of maximum wind.
Forecasting for Atlantic hurricane RI continues to present major challenges for researchers, climatologists, and meteorologists alike. The projections of RI are limited by two key issues: researchers lack a clear definition for RI, having varying thresholds for increasing wind speeds between 25 to 35 knots over a 24-h period, and researchers also differ in whether they utilize wind speed or minimum sea level pressure to measure RI. While these definitions are related, they are not synonymous with one another, therefore causing a lack of standardization in requirements for the measurement of RI [4].
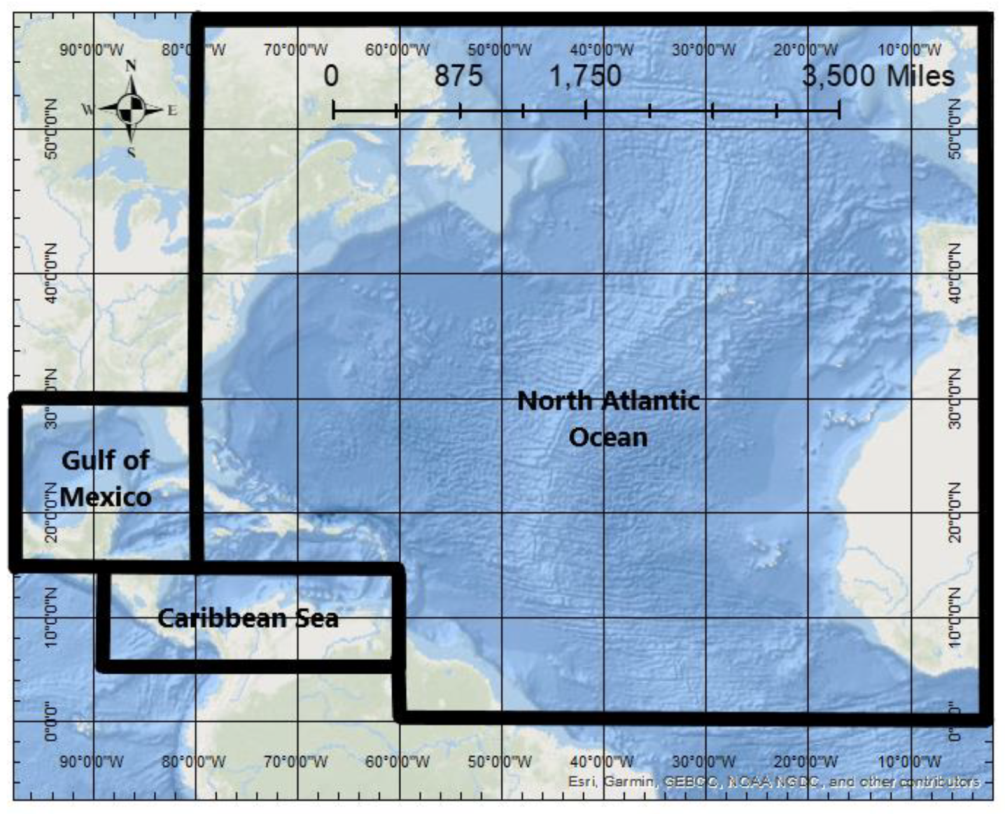
Current research suggests the warming climate may produce more intense TCs with a higher probability of undergoing RI during their life cycle [3,4,5]. The increased likelihood of rapidly intensifying TCs necessitates the development of an RI climatology spanning the current North Atlantic record. While multiple studies have focused on the spatial origin patterns of RI, as well as potential forcing mechanisms that may be integral to the initiation of the RI process [1,3], [5,6,7], there have been no studies dedicated to an analysis of the entire Atlantic basin record (1851 to 2017) with specific emphasis on possible trends in time, spatial clustering, and climatological characteristics per sub-basin. A comprehensive assessment of RI processes in the Atlantic basin can provide important information to researchers, thus allowing more accurate forecasts to be disseminated to potentially affected communities. This paper assesses temporal and spatial trends in RI hurricanes throughout the Atlantic Basin historical record as an in-depth statistical analysis to supplement the existing literature. Figure 1 shows the study area and each delineated sub-basin.
The main objectives of this study are as follows:
- To determine basin-wide and sub-basin frequency distributions and seasonality, with sub-basins organized into the North Atlantic, Gulf of Mexico, and Caribbean waterways (Figure 1).
- To examine potential trends in RI hurricane counts by utilizing a count time series regression model spanning the entire North Atlantic hurricane record (1851–2017) and shorter data subsets to assess possible data bias present in the trend.
- To analyze spatiotemporal trends of storms that both originate and initiate their RI cycle within the Gulf of Mexico basin compared to those in the North Atlantic.
- To examine spatiotemporal trends of storms that undergo more than one cycle of RI in their lifetime.
- To explore spatial trends that may exist within the sub-basins in regard to RI hurricane origins, RI genesis, RI landfall, and RI lifetime maximum intensity (LMI) points.
2. Experiments
2.1. Data
The number of North Atlantic hurricanes that have undergone RI and the spatial points for RI hurricane origin, RI genesis, landfall, and LMI were derived from the HURDAT2 database, which contains hurricane counts since 1851, as well as track data for longitude, latitude, and wind speed (in knots). This dataset is provided by the National Oceanic and Atmospheric Association (NOAA) and is updated yearly to include the most recent tracks.
There are well-documented issues with HURDAT2, including the likelihood of missing TCs from the earliest part of the record and possible intensity inaccuracies [8]. These issues are taken into account within the present study by sub-setting the record to 1900 and then to 1950 for comparison purposes in time series analyses. The shorter time spans likely have less data collection bias than the longer, historical record. While the data bias is present early on, finding trends and describing the climatology of the entire basin for the entirety of the record is helpful in providing some clarity to the expected occurrence of future RI events.
HURDAT2 TC observations are cataloged in 6-h increments. However, due to the forward speed of hurricanes averaging 6 ms−1, this 6-h resolution can be considered too coarse for spatial analysis and modeling purposes [9]. Therefore, the hurricane data were interpolated hourly using splines for wind speed and the geographic position of the hurricane center, as detailed in Elsner and Jagger [9]. Utilizing this hourly interpolated data is advantageous due to the reduced likelihood of missing a hurricane passing through any given area [10].
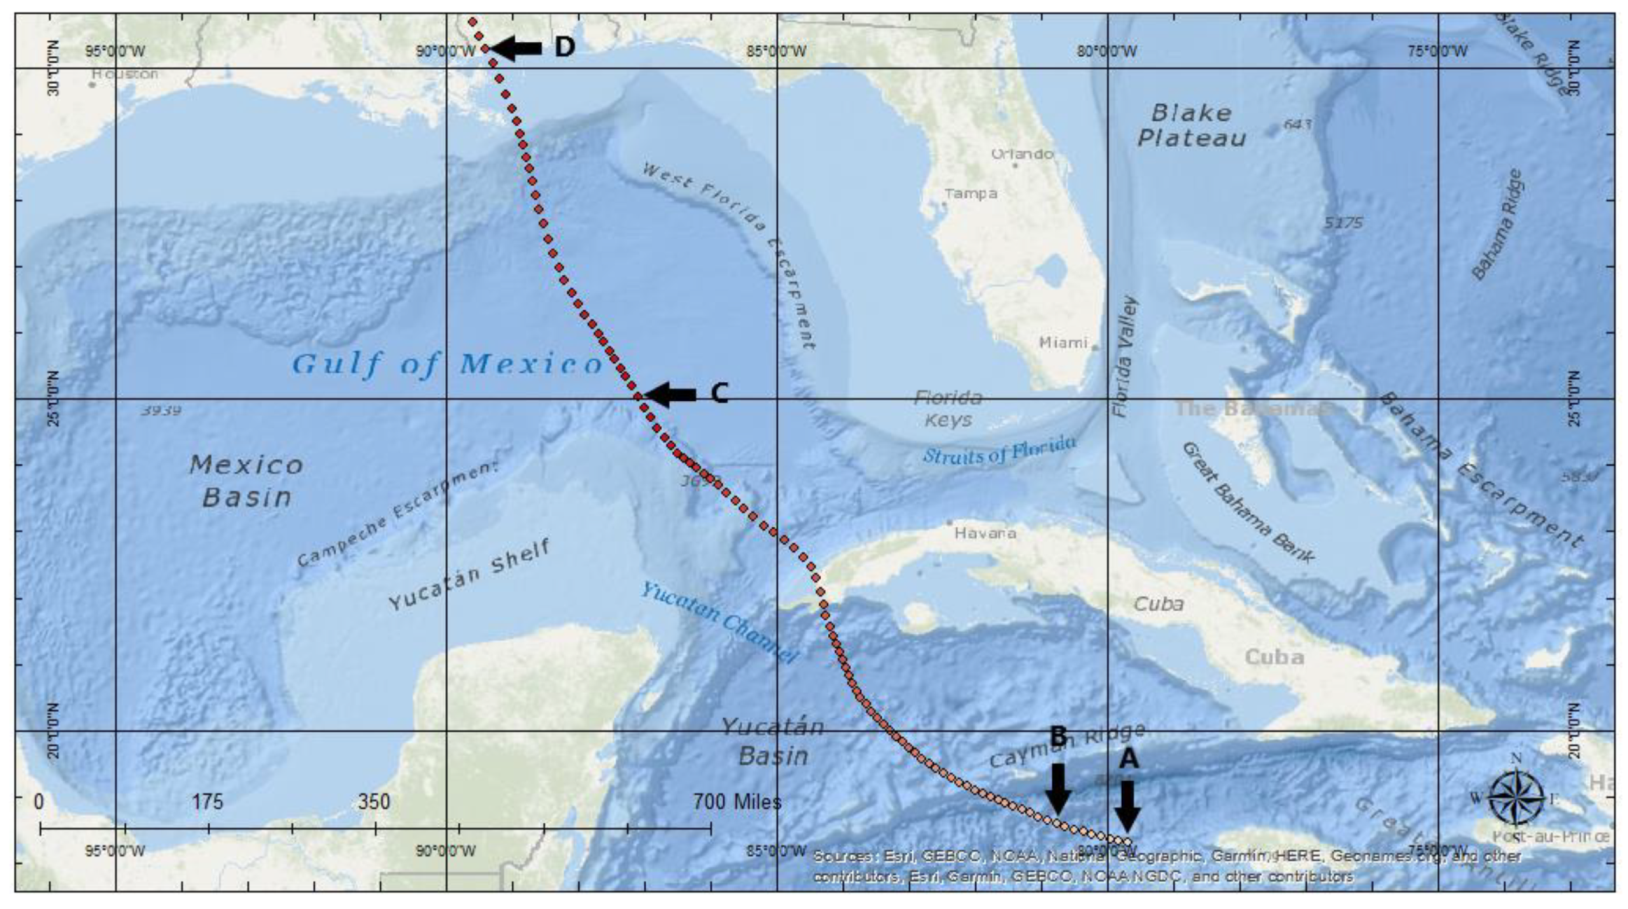
For the purposes of this paper, RI is defined as an increase in wind speed of 30 knots or more in a 24-h period. RI genesis is defined as the point where the storm begins its first cycle of RI. Landfalling storms were identified as interpolated tracks crossing over a site of land following their LMI. Figure 2 depicts a schematic of Hurricane Camille in 1969 with its origin (A), RI genesis (B), LMI (77.33 ms−1) (C), and landfall (D) points highlighted.
RI events are identified in the dataset by finding the 24-h wind speed difference at any point along the storm’s lifecycle. If an increase occurred greater than or equal to 30 knots, it is considered an RI event. Of all 1618 events in the North Atlantic from 1851–2017, 392 storms were identified as having undergone at least one RI event during their life cycle. The storm count per year was then catalogued.
Sub-basin storm counts were determined by defining each separate sub-basin according to longitudinal and latitudinal bounds, while also utilizing geographical land features to distinguish the borders (Figure 1). The Gulf of Mexico was subset between 81 to 100° W and 15 to 30° N, Florida and Mexico acting as longitudinal borders and Veracruz and Alabama acting as latitudinal borders. The Caribbean Sea was subset between 60 to 88° W and 5 to 15° N, Guatemala and Barbados acting as longitudinal borders and Panama and the Dominican Republic acting as latitudinal borders. The North Atlantic was subset to define all storms not within the stated Gulf of Mexico and Caribbean Sea ranges. The storm count per year per sub-basin was then cataloged for the entirety of the record. Table 1 depicts the total counts of both storm origins and RI genesis points per sub-basin.
The latitudes, longitudes, and respective wind speeds (in knots) of each storm’s origin, RI genesis, landfall, and LMI points were cataloged from the subset RI HURDAT dataset. LMI points for non-RI hurricanes were also extracted to compare differences.
2.2. Methods
2.2.1. Time Series
A Poisson regression model and a generalized autoregressive conditional heteroscedasticity (GARCH) model were both utilized to examine RI hurricane count data throughout time. A Poisson process has been shown in the literature [11,12,13] to best describe land-falling hurricane counts in the North Atlantic basin. A Poisson regression model was implemented to describe the relationship of RI storms both originating and initiating their first cycle of RI in the Gulf of Mexico sub-basin as a function of time. When describing situations in which there are a large number of opportunities for an event to occur but a small chance that it will occur on any one trial, the Poisson distribution is a useful statistical process to implement. A Poisson distribution is a discrete probability distribution where the mean of the distribution is equal to its variance. It applies to occurrences of some event over a specified interval, described as
where the probability (P) of obtaining a count x is equal to the mean count (rate) λ multiplied by the exponential function (e) and divided by the factorial count (x!). A Poisson regression model is a type of generalized linear model described in the equation
that expresses the p covariates (indicated by xi’s) and p +1 parameters (βi’s). The model uses the logarithm of the rate as a response variable, but the regression structure is linear with the model coefficients determined by the method of maximum likelihood [9].
However, due to the variance remaining constant in a Poisson process and the yearly variance of RI events being nonhomogeneous in nature, the RI count data for the entire basin required a type of analysis model that allows the conditional variance to shift throughout the data as needed. Therefore, the GARCH models originally proposed for describing the conditional variance in 1986 were deemed the most appropriate choice when analyzing the entire Atlantic basin’s RI hurricane time series count data [14,15]. The GARCH model, a broader form of the ARCH model, allows the conditional variance to change over time as a function of past errors, leaving the unconditional variance constant [15]. However, where the GARCH model departs from the ARCH model is in its use of a more flexible linear declining lag structure within the conditional variance equation, a term that often arbitrarily takes account of the long memory found in empirical work [15].
The GARCH process is given as
where
P = 0 reduces the process to the ARCH(q) process, and p = q = 0εt is white noise [15]. The ARCH(q) process specifies the conditional variance as a linear function of past sample variances only, whereas the GARCH(p,q) process also allows lagged conditional variances to enter [15]. This process was used when modeling the RI hurricane counts per year as a function of time in the regression equation
where yt is the dependent variable of RI hurricane counts, and xt the explanatory variable of time, while b represents a vector of unknown parameters [15].
A Poisson regression model was then used to describe the relationship of multi-RI storms as a function of time to investigate if the number of storms exhibiting this characteristic has increased over the period of record.
2.2.2. Spatial and Temporal Clustering
When modeling a spatial point process dataset with covariate data as an interacting variable, it is necessary to utilize a methodology that can incorporate both a measure of intensity, or the frequency of events recorded by points, as well as a measure of interpoint interaction, or the stochastic dependence between points in a point pattern [16]. The longitudinal and latitudinal data of RI hurricanes at specific occurrences within their life cycle are best defined as a point process dataset with their frequency throughout units of space delineated as descriptive covariate data [16]. This frequency, or density, throughout space is multimodal in nature, meaning that the data has more than one peak in its density distribution. Thus, a kernel density analysis is deemed an appropriate methodology to utilize when measuring both the intensity and interpoint interactions of the multimodal RI spatial data to see if any spatial clusters may exist.
A kernel is a Gaussian, or normal, distribution centered at each data value, with the bandwidth of each kernel set as the standard deviation of the kernel in the dataset’s density distribution [9]. The usual kernel density estimate fh of a univariate density f based on a random sample X1,…,Xn of size n is
with K as the kernel function, which is taken to be a symmetric probability density [17]. A kernel density analysis was implemented to model RI hurricane origin, initial RI genesis, landfall, and LMI points for all 392 RI defined hurricanes within the dataset. All LMI points of non-RI hurricanes were also modeled using a kernel density analysis for a comparative discussion.
Hurricanes originating in the same area frequently take similar paths [9]. Thus, comparing the observed versus the expected number of years for groups of hurricane counts is an important methodology to utilize when determining if there are more hurricanes than expected originating or initiating RI in certain areas [9]. Temporal cluster detection was performed for basin-wide and sub-basin RI storms by comparing observed versus expected counts through a Poisson distribution with a rate r. It was thought necessary to add the Caribbean Sea as a third sub-basin for this analysis based on the high frequency of RI events found within the region following the kernel density analysis. All of the calculations in this study were performed in the R Program for Statistical Computing [18].
3. Results
3.1. Frequency and Seasonality
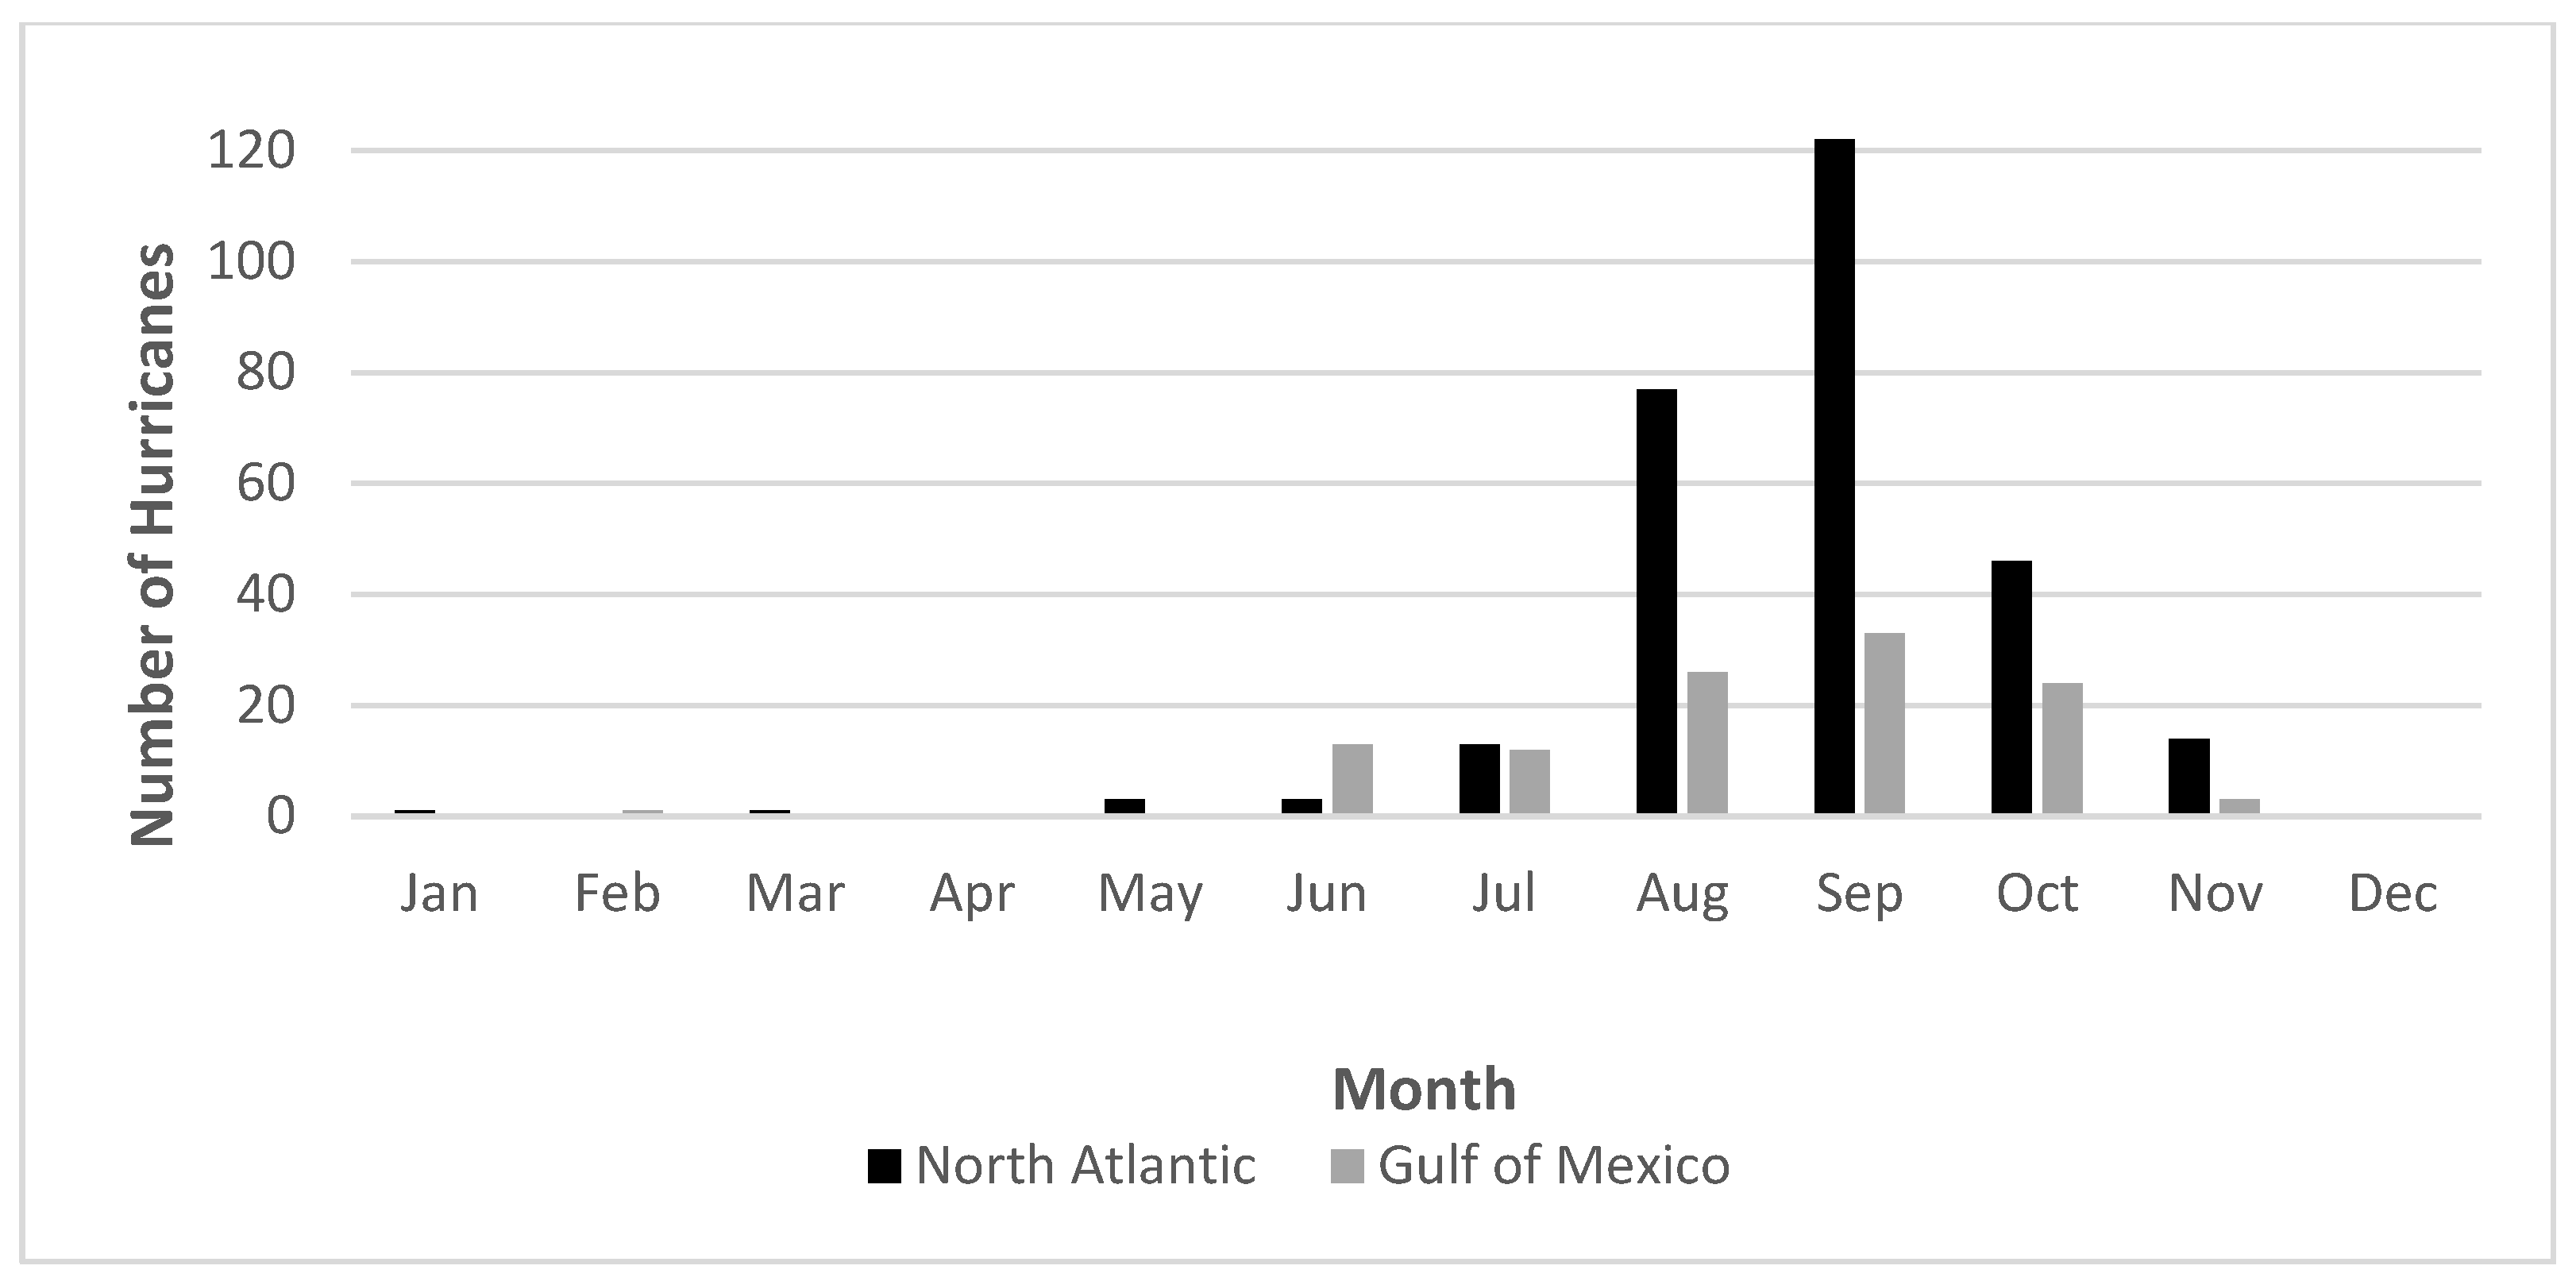
Seasonality and frequency calculations were done to first examine potential similarities and differences between the full record and one subset to a time of more data confidence. Second, these calculations were deemed necessary to investigate potential patterns and variations in RI storm sub-basin development, intensity, and prevalence. Figure 3 shows a monthly frequency analysis per sub-basin (Gulf of Mexico and North Atlantic). It reveals a similar trend to typical North Atlantic hurricane seasons, with the highest occurrences of RI storms in September for both regions. However, Gulf of Mexico RI events tend to occur more regularly throughout the summer months of June, July, and August, while Atlantic storms peak in August, September, and October. The steady activity within the Gulf of Mexico during the summer months may be correlated with higher SSTs (sea surface temperatures) and shallower water, thus allowing for consistent development and maturation of RI hurricanes [19].
When comparing storms that have undergone at least one cycle of RI to storms that have undergone no cycles of RI, RI storm mean LMIs are much higher than non-RI storms. The maximum windspeed of RI storms is over 12 ms−1 higher, and the minimum windspeed of RI storms are more than 10 ms−1 higher than non-RI storms. Table 2 lists the average LMI, minimum wind speed, maximum windspeed, and number of total storms for both groups of hurricanes.
Upon investigating the number of RI storms that undergo the cycle within the first 24 h, it was found that only 67 of 392 RI storms fit this description, showing that nearly 83% of all RI storms underwent the process at some other point in their cycle. Seventy-five percent of the 67 storms initiating RI within the first 24 h were within the North Atlantic sub-basin. Out of the total number of storms, the vast majority underwent only one cycle of RI, while 92 storms underwent multiple cycles of RI during their lifetimes. The five storms that underwent four RI cycles are Beulah (1967), Camille (1969), Allen (1980), Gilbert (1988), and Emily (2005). Table 3 shows the number of storms that underwent one, two, three, and four RI cycles during their lifetime.
3.2. Time Series Analysis
3.2.1. Entire Atlantic Basin
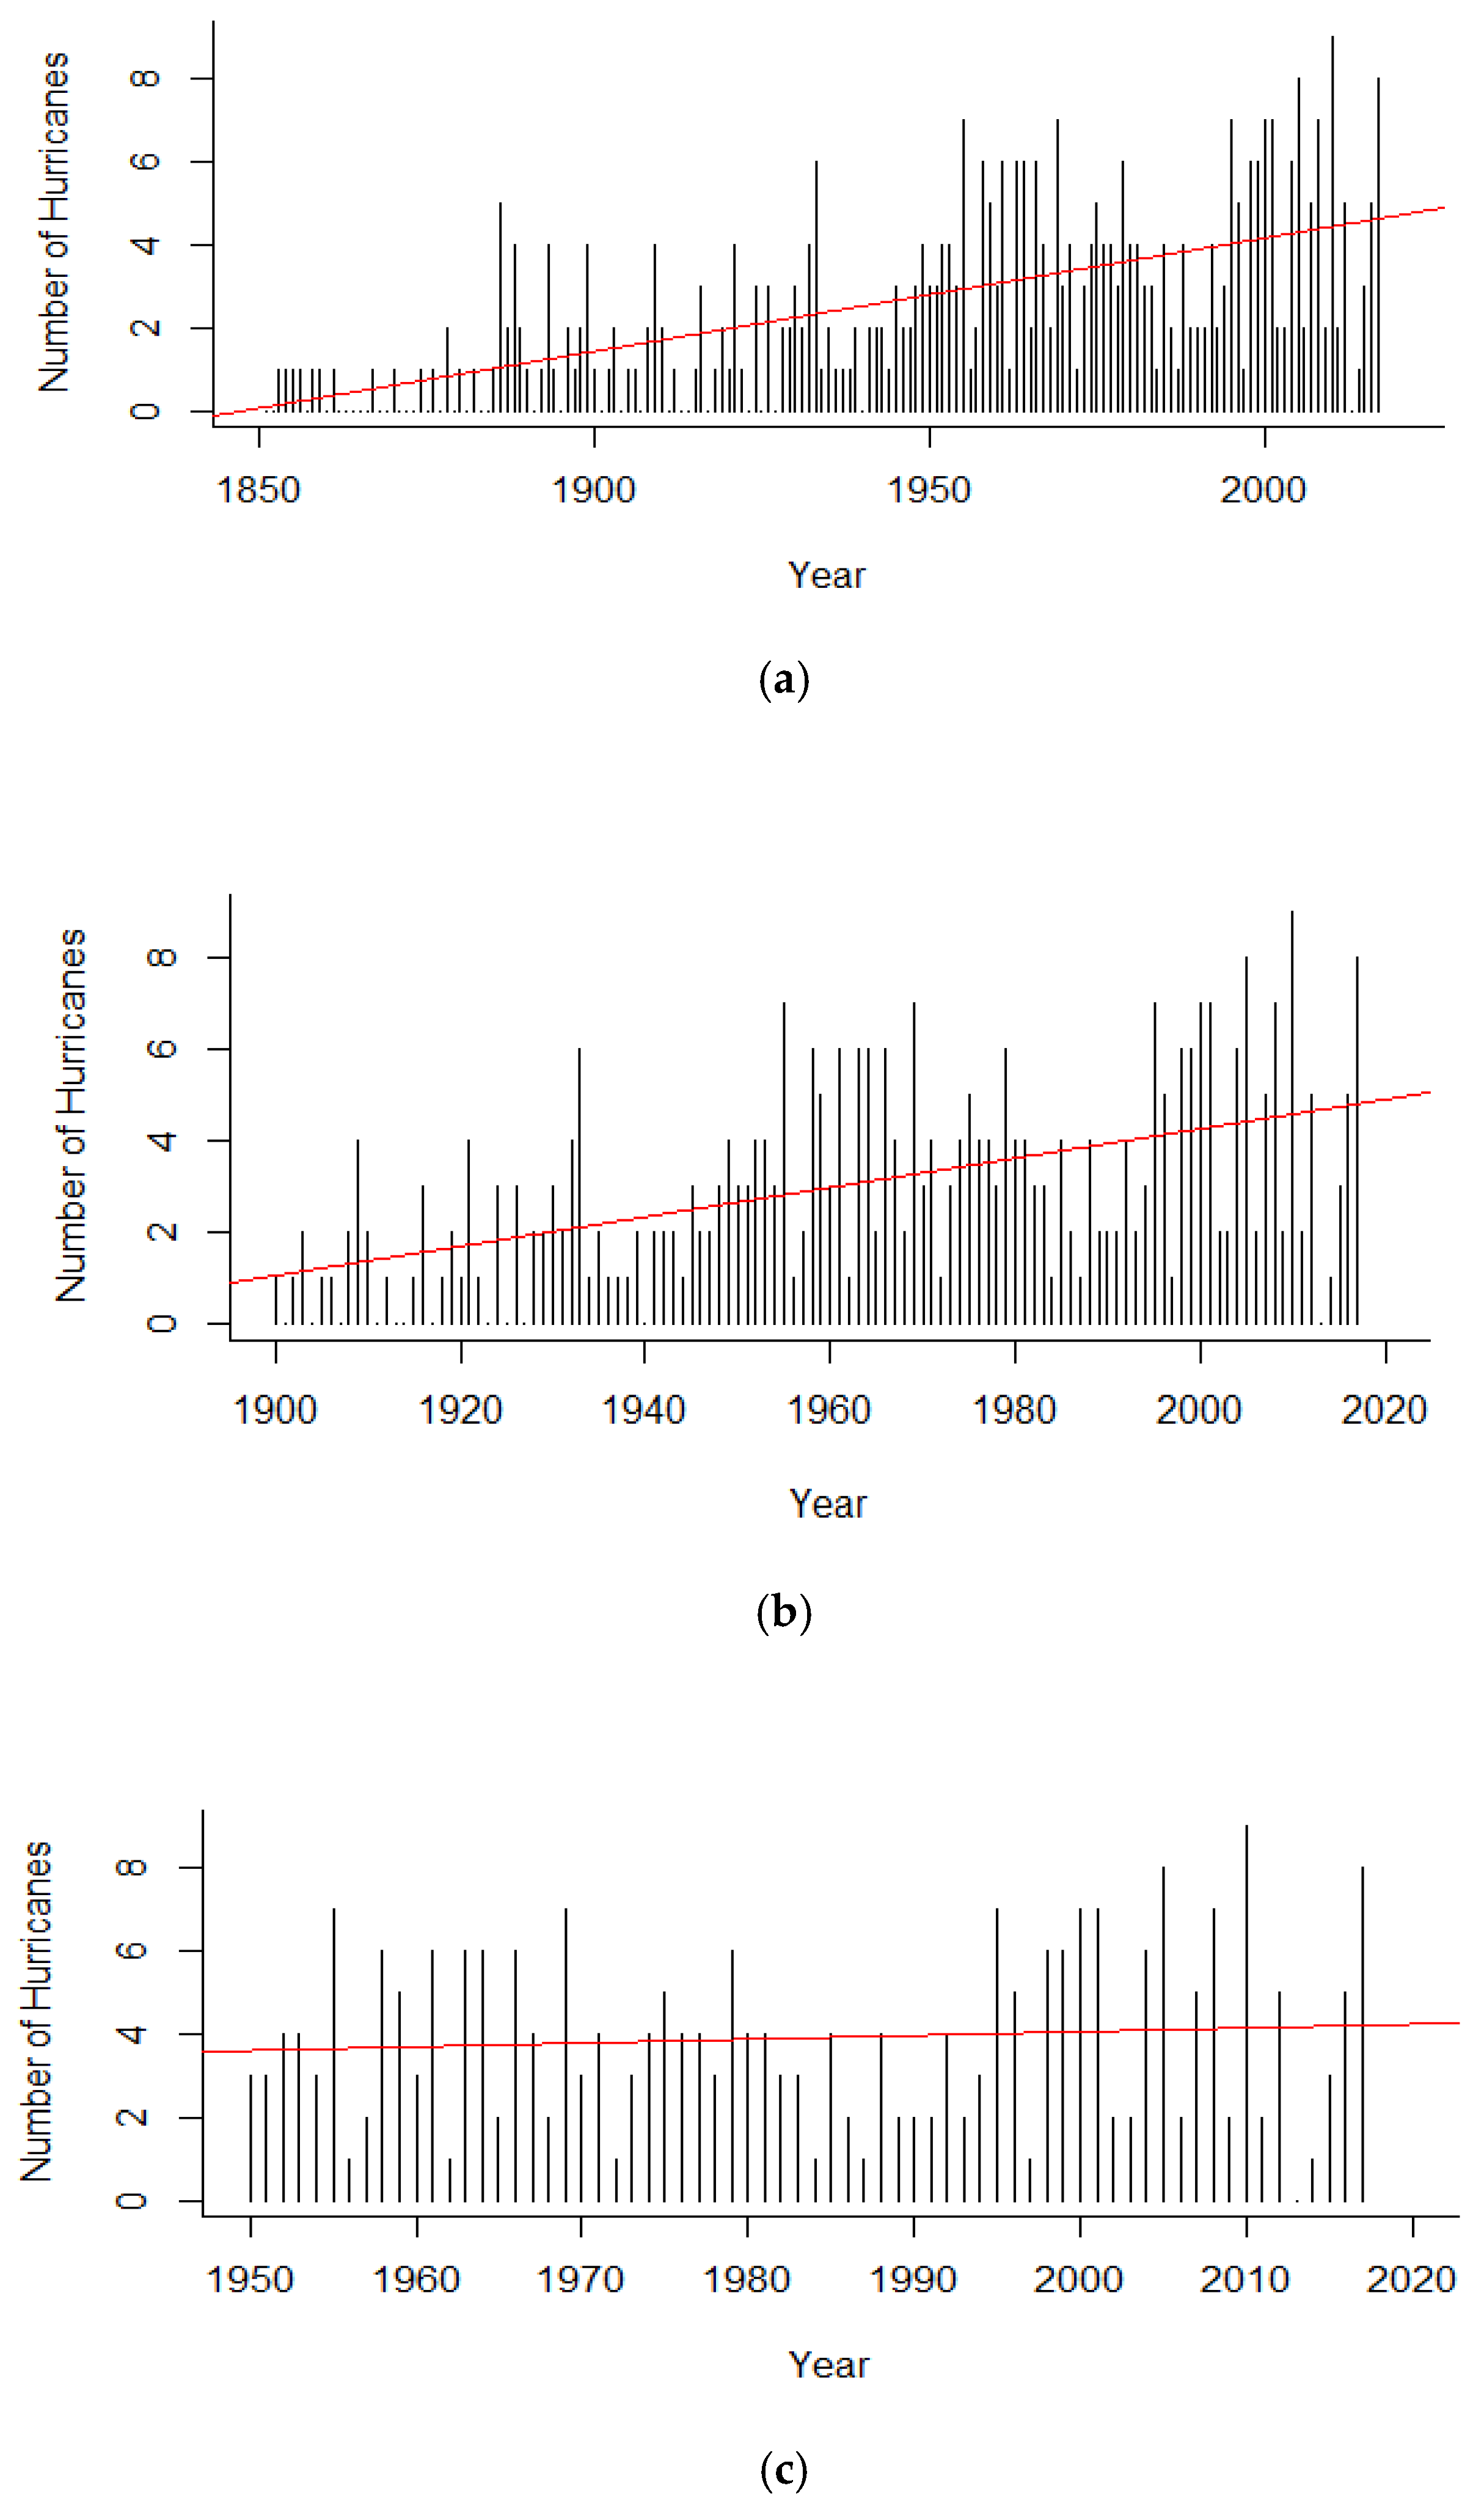
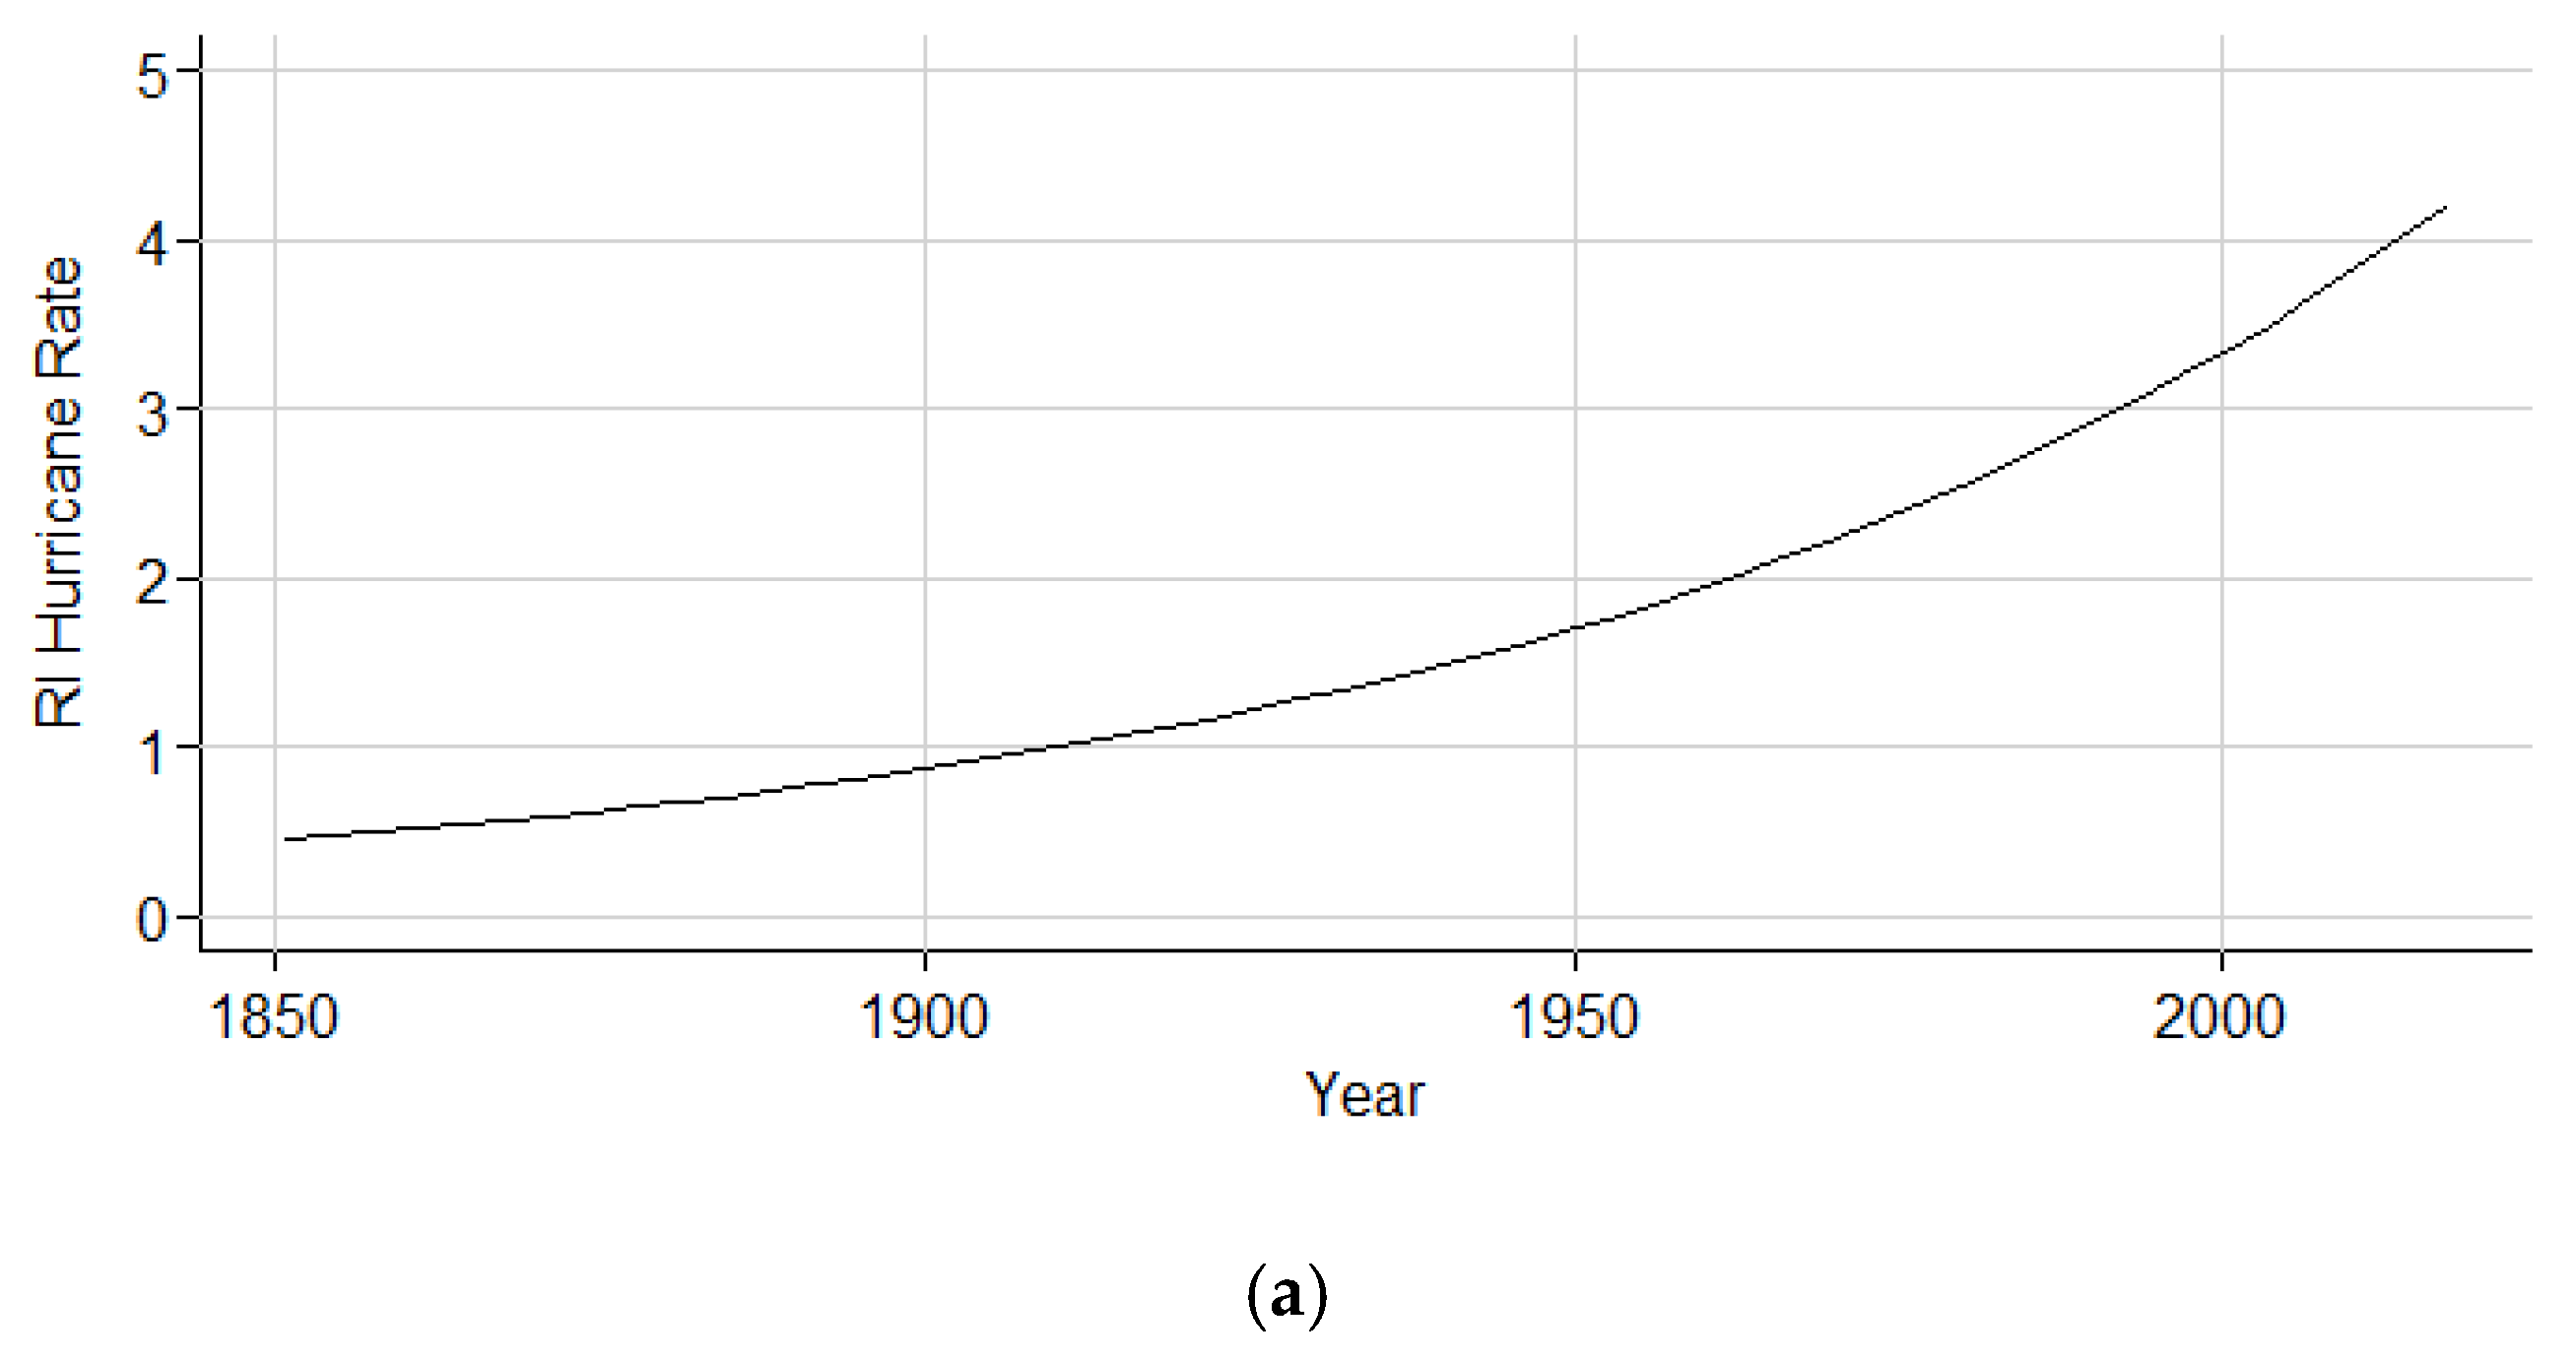
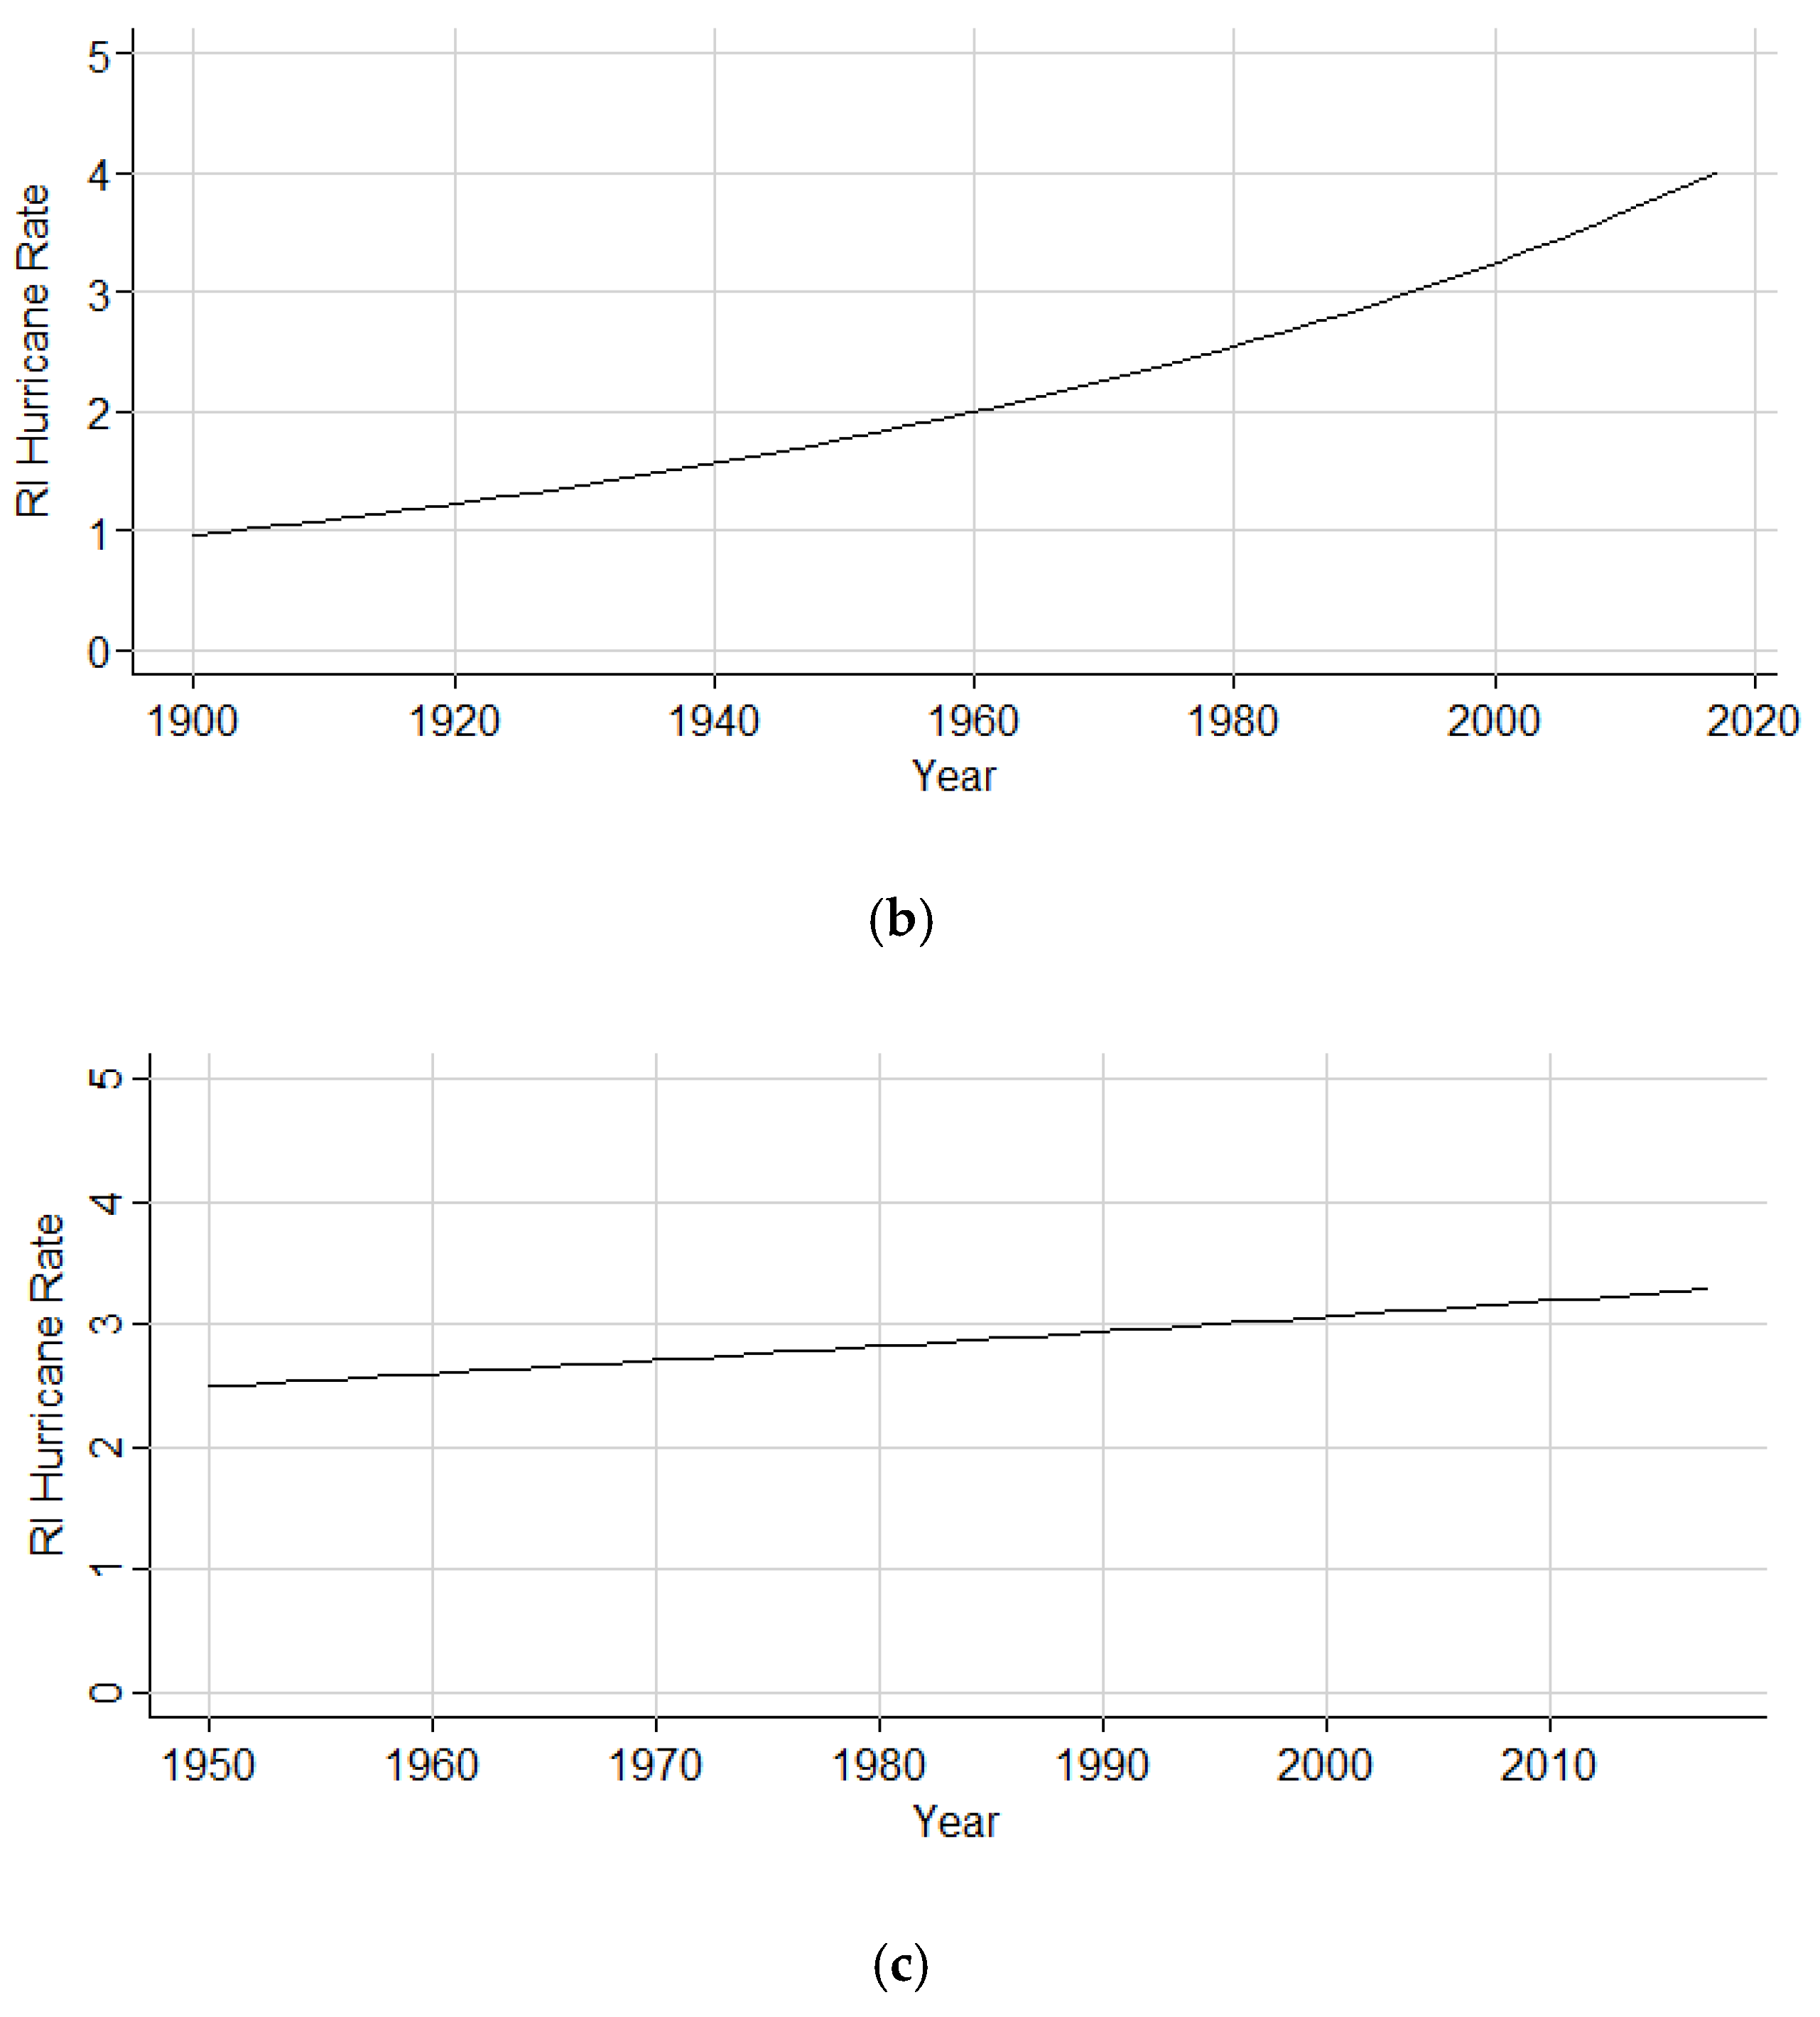
The Poisson regression model does not allow for the variance in the data set to vary. Therefore, the GARCH model was used to assess the trends through time for the entire Atlantic basin. The GARCH time series count analysis results suggest a significant increasing trend of RI events in the entire Atlantic basin by 48.3% (36%–61%) for the entirety of the record and 29.1% (17%–45%) from the years 1900 to 2017. A small increase is noted from the years 1950 to 2017; however, due to the non-negative integer nature of the data, the negative lower confidence interval value suggests that the increasing coefficient estimate is not a significant representation of the RI hurricane population. Table 4 illustrates the model coefficients and corresponding confidence intervals. Figure 4 shows an increasing trend through time in the yearly frequency of RI events for the entirety of the record, from the years 1900 to 2017, and from the years 1950 to 2017.
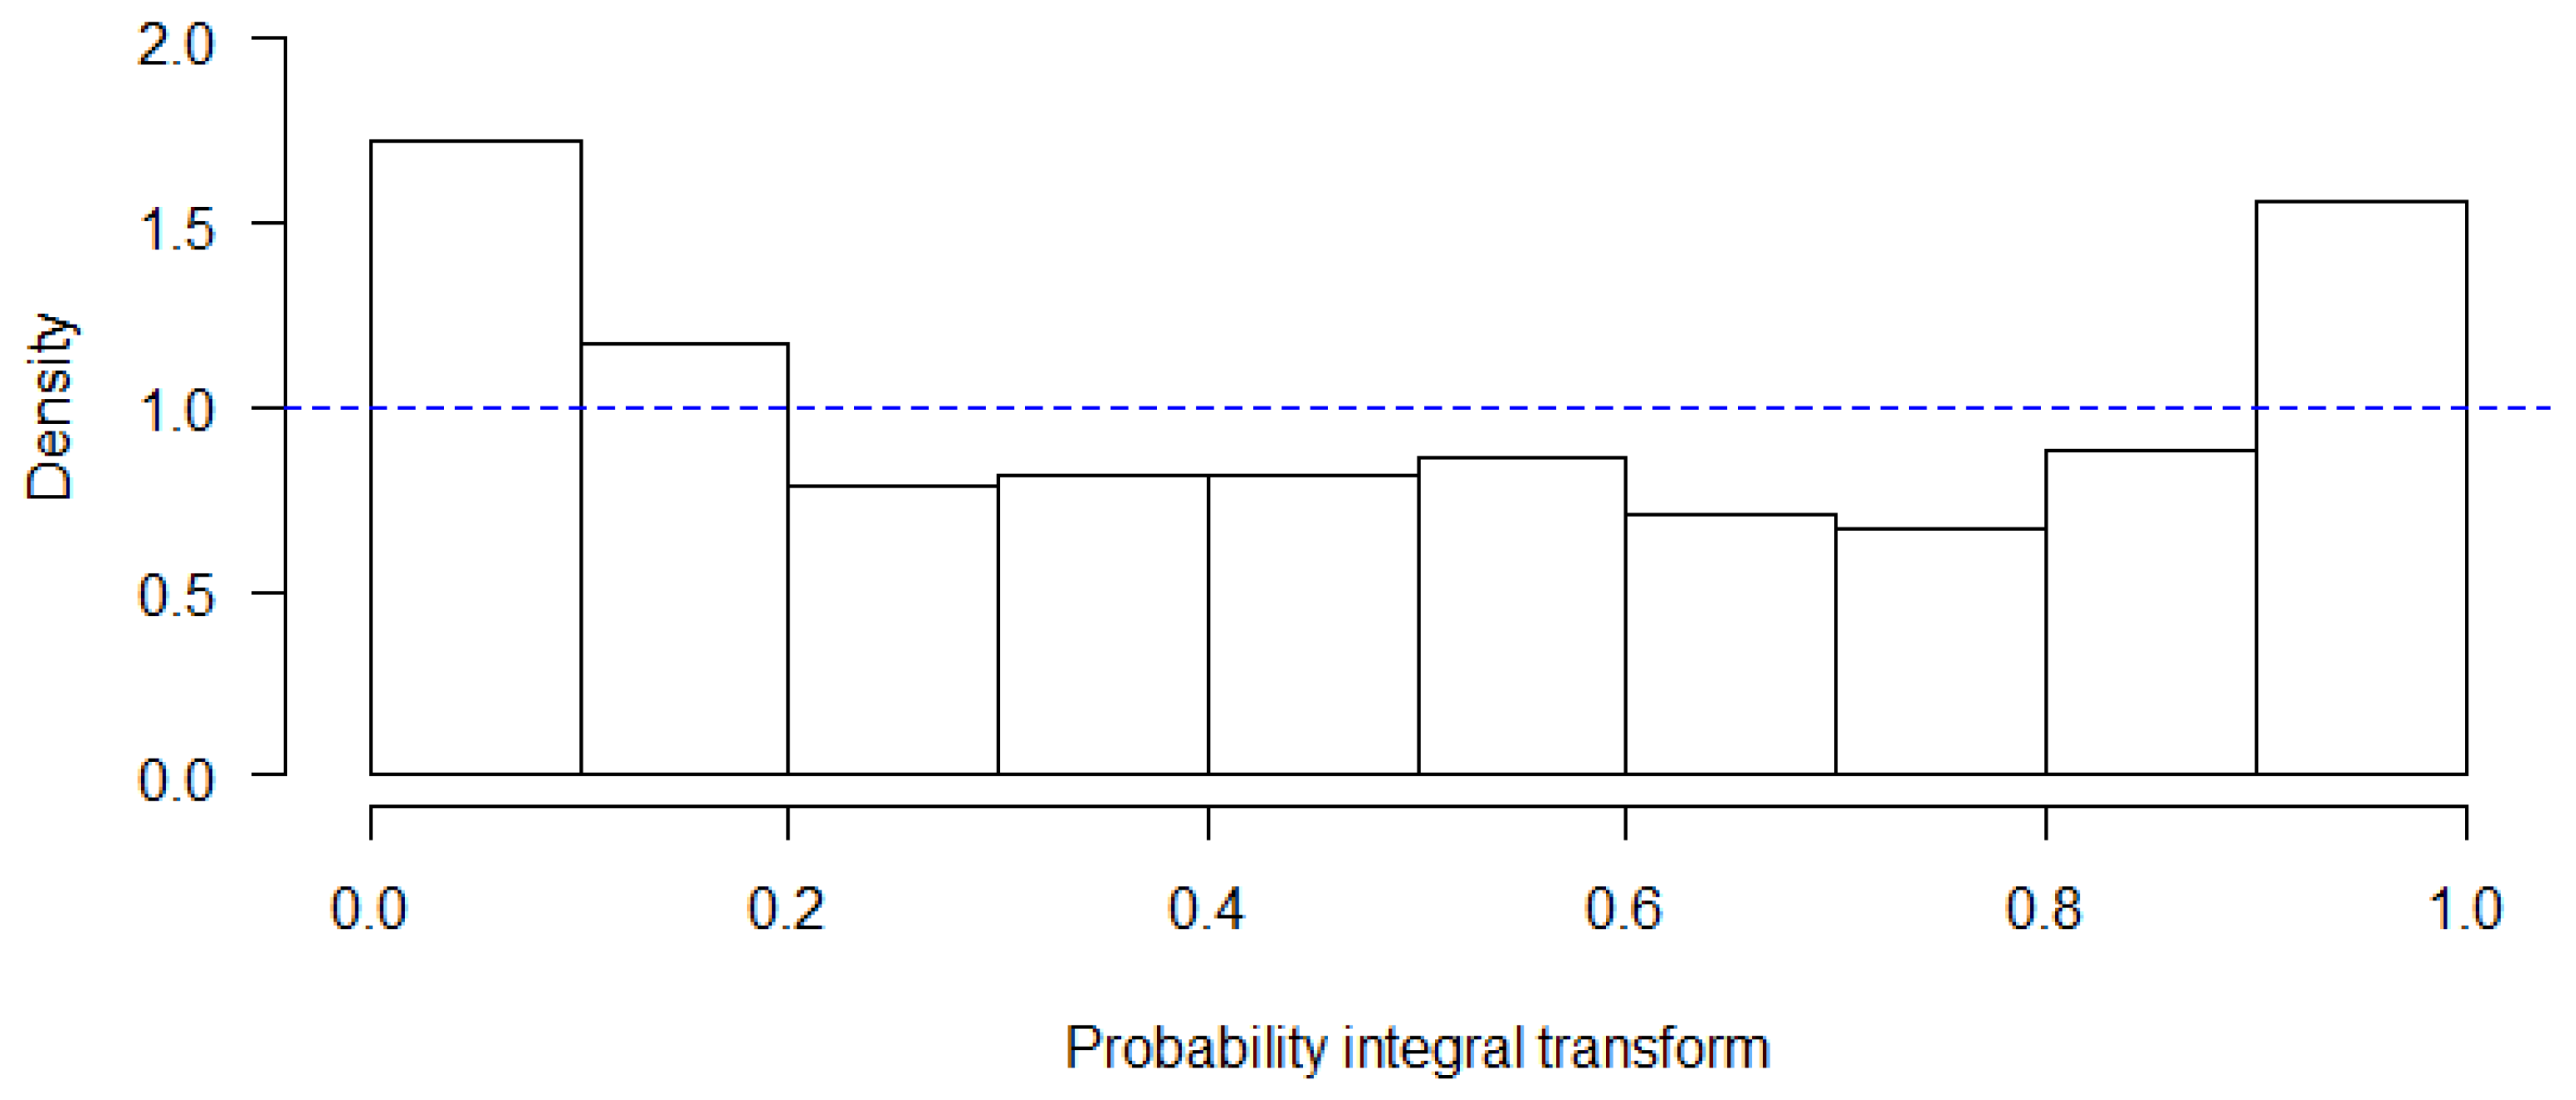
To measure the appropriateness of model fit, several different procedures were used. First, assessment of the model’s residual deviance was employed. A probability integral transform (PIT) histogram was created to examine if the RI hurricane count values were able to be converted to random variables having a standard uniform distribution with the assumption that the original data were modeled as random variables from any given continuous distribution [11]. The resulting graphic, Figure 5, exhibits a moderate U-shaped distribution, indicating a potential lack of transformation uniformity and, therefore, a poor model fit.
However, although the PIT has historically been the analysis of choice for determining model fit in count time series data throughout the literature, Hamill [20] and Gneiting et al. [21], in their respective studies, argue that uniform PIT values may be necessary but are not sufficient for a model to be determined an ideal fit. This is due to the PIT taking the form of a probability distribution and the observations being real values in nature. Therefore, for the purposes of this research, a second test of fitness was used to further explore the appropriateness of the GARCH model. An assessment of calibration and sharpness was employed for the model through the implementation of a proper scoring rule [21]. Of particular interest was the normalized squared error score. It measures the variance of the Pearson residuals and is close to one if the model is adequate. The score of 1.58 allows an adequate model fit to be inferred. However, because there are varying results related to model fit, it is suggested that there may be a significant increase in RI hurricanes over the known record for the entire basin but also that further study should be endeavored.
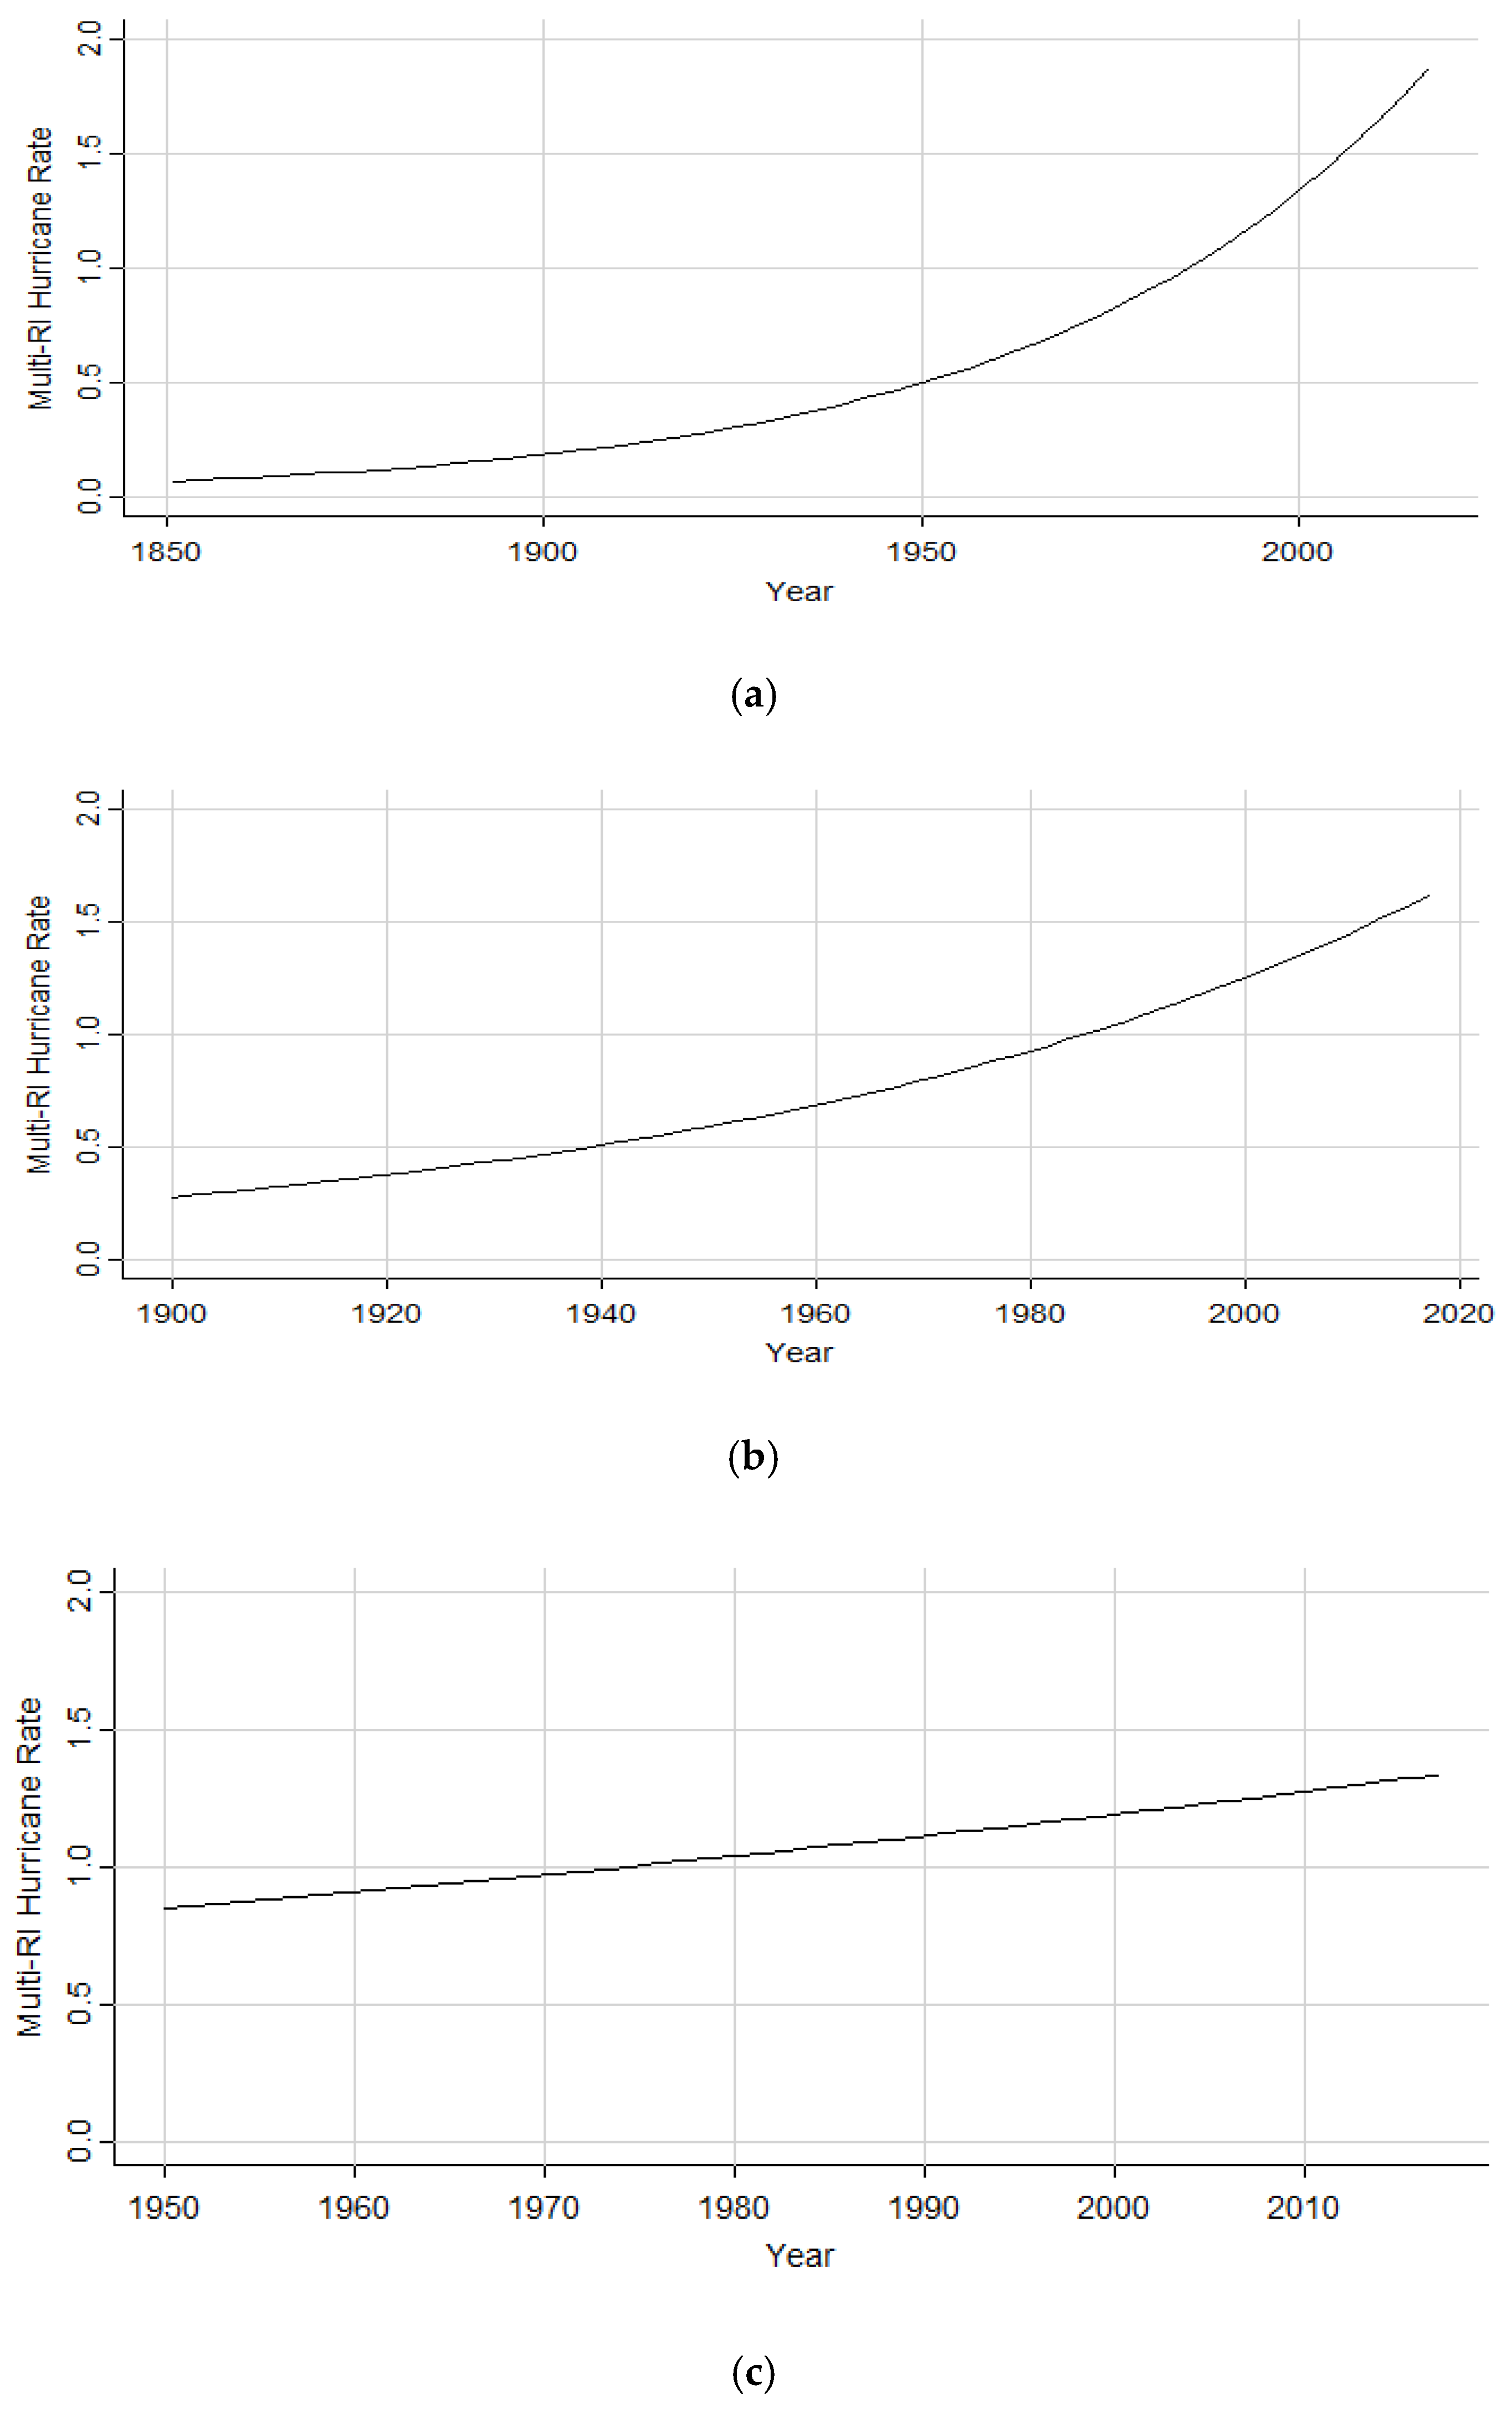
The Poisson regression analysis of multi-RI storms resulted in a significant increasing trend over time. Storms undergoing more than one RI cycle within their lifetime increased by a factor of 2% from the years 1851 to 2017, a factor of 1.5% from the years 1900 to 2017, and a factor of 0.7% from the years 1950 to 2017, as illustrated in Figure 6. A chi-square fitness test performed upon these Poisson models yielded p-values of 0.77, 0.12, and 0.04, thus demonstrating that the model adequately describes the variables’ relationship for both 1851-2017 and 1900-2017 but may be a weaker fit for 1950–2017.
3.2.2. North Atlantic Sub-Basin
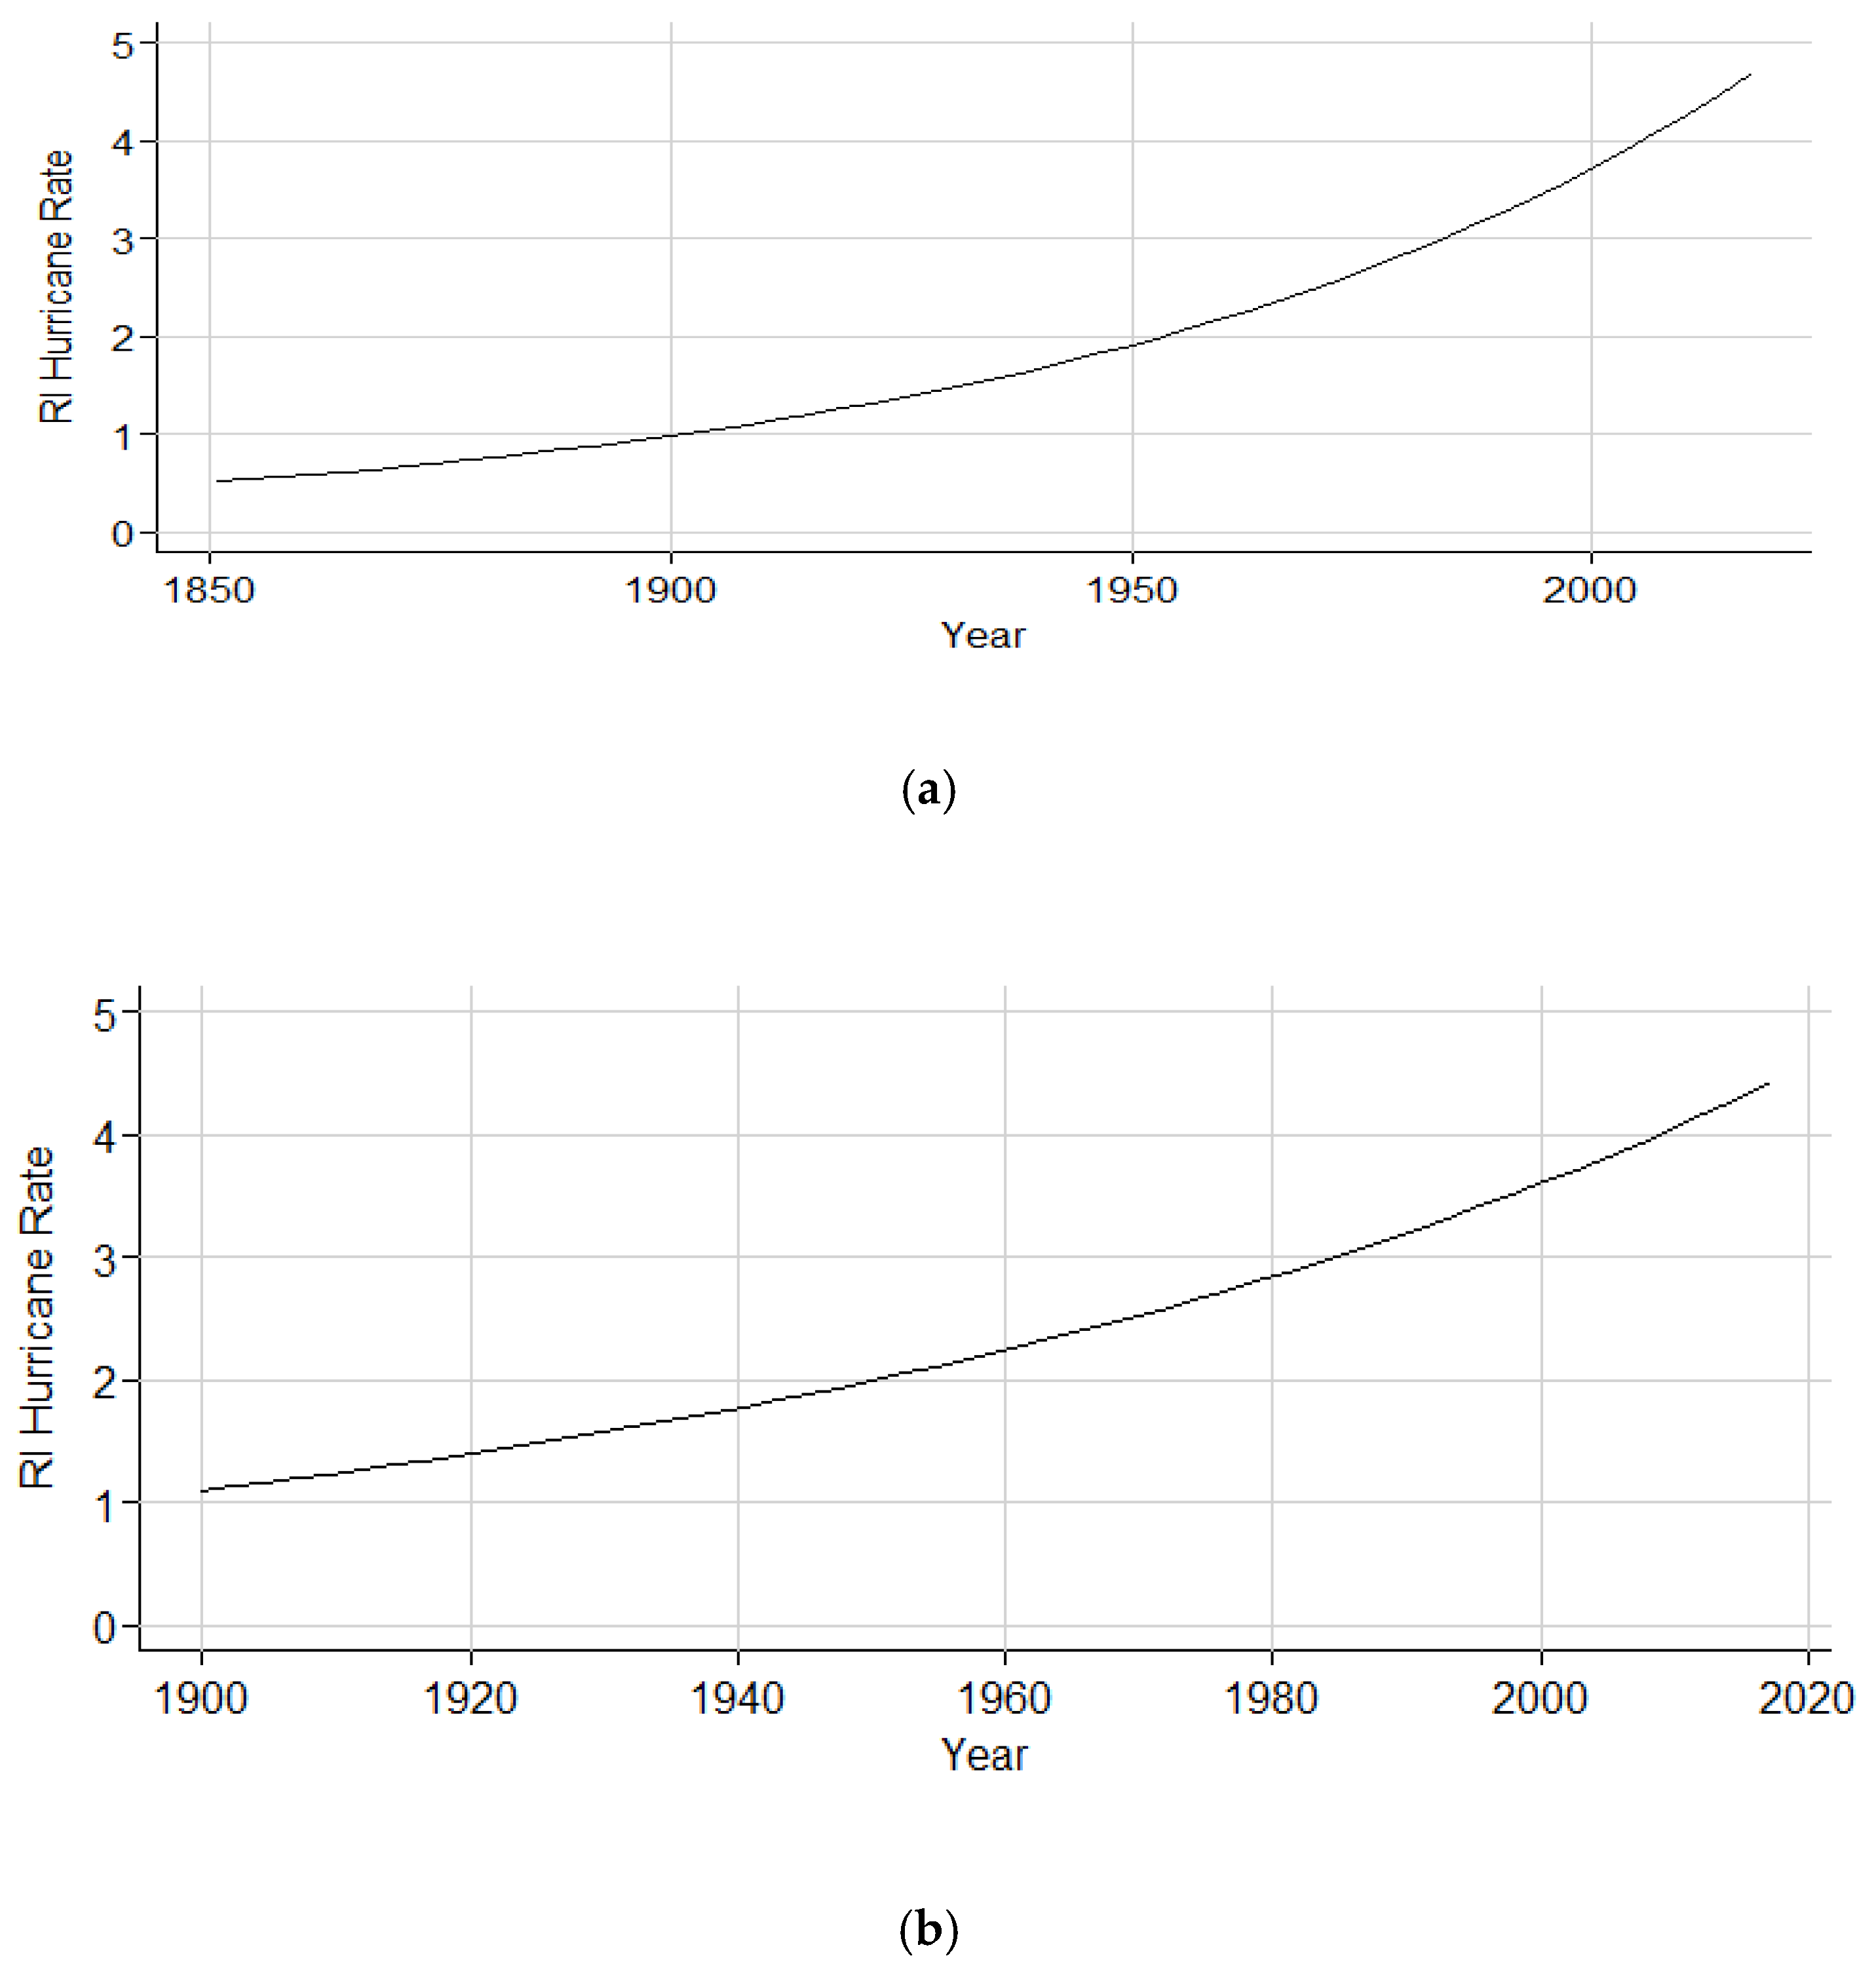
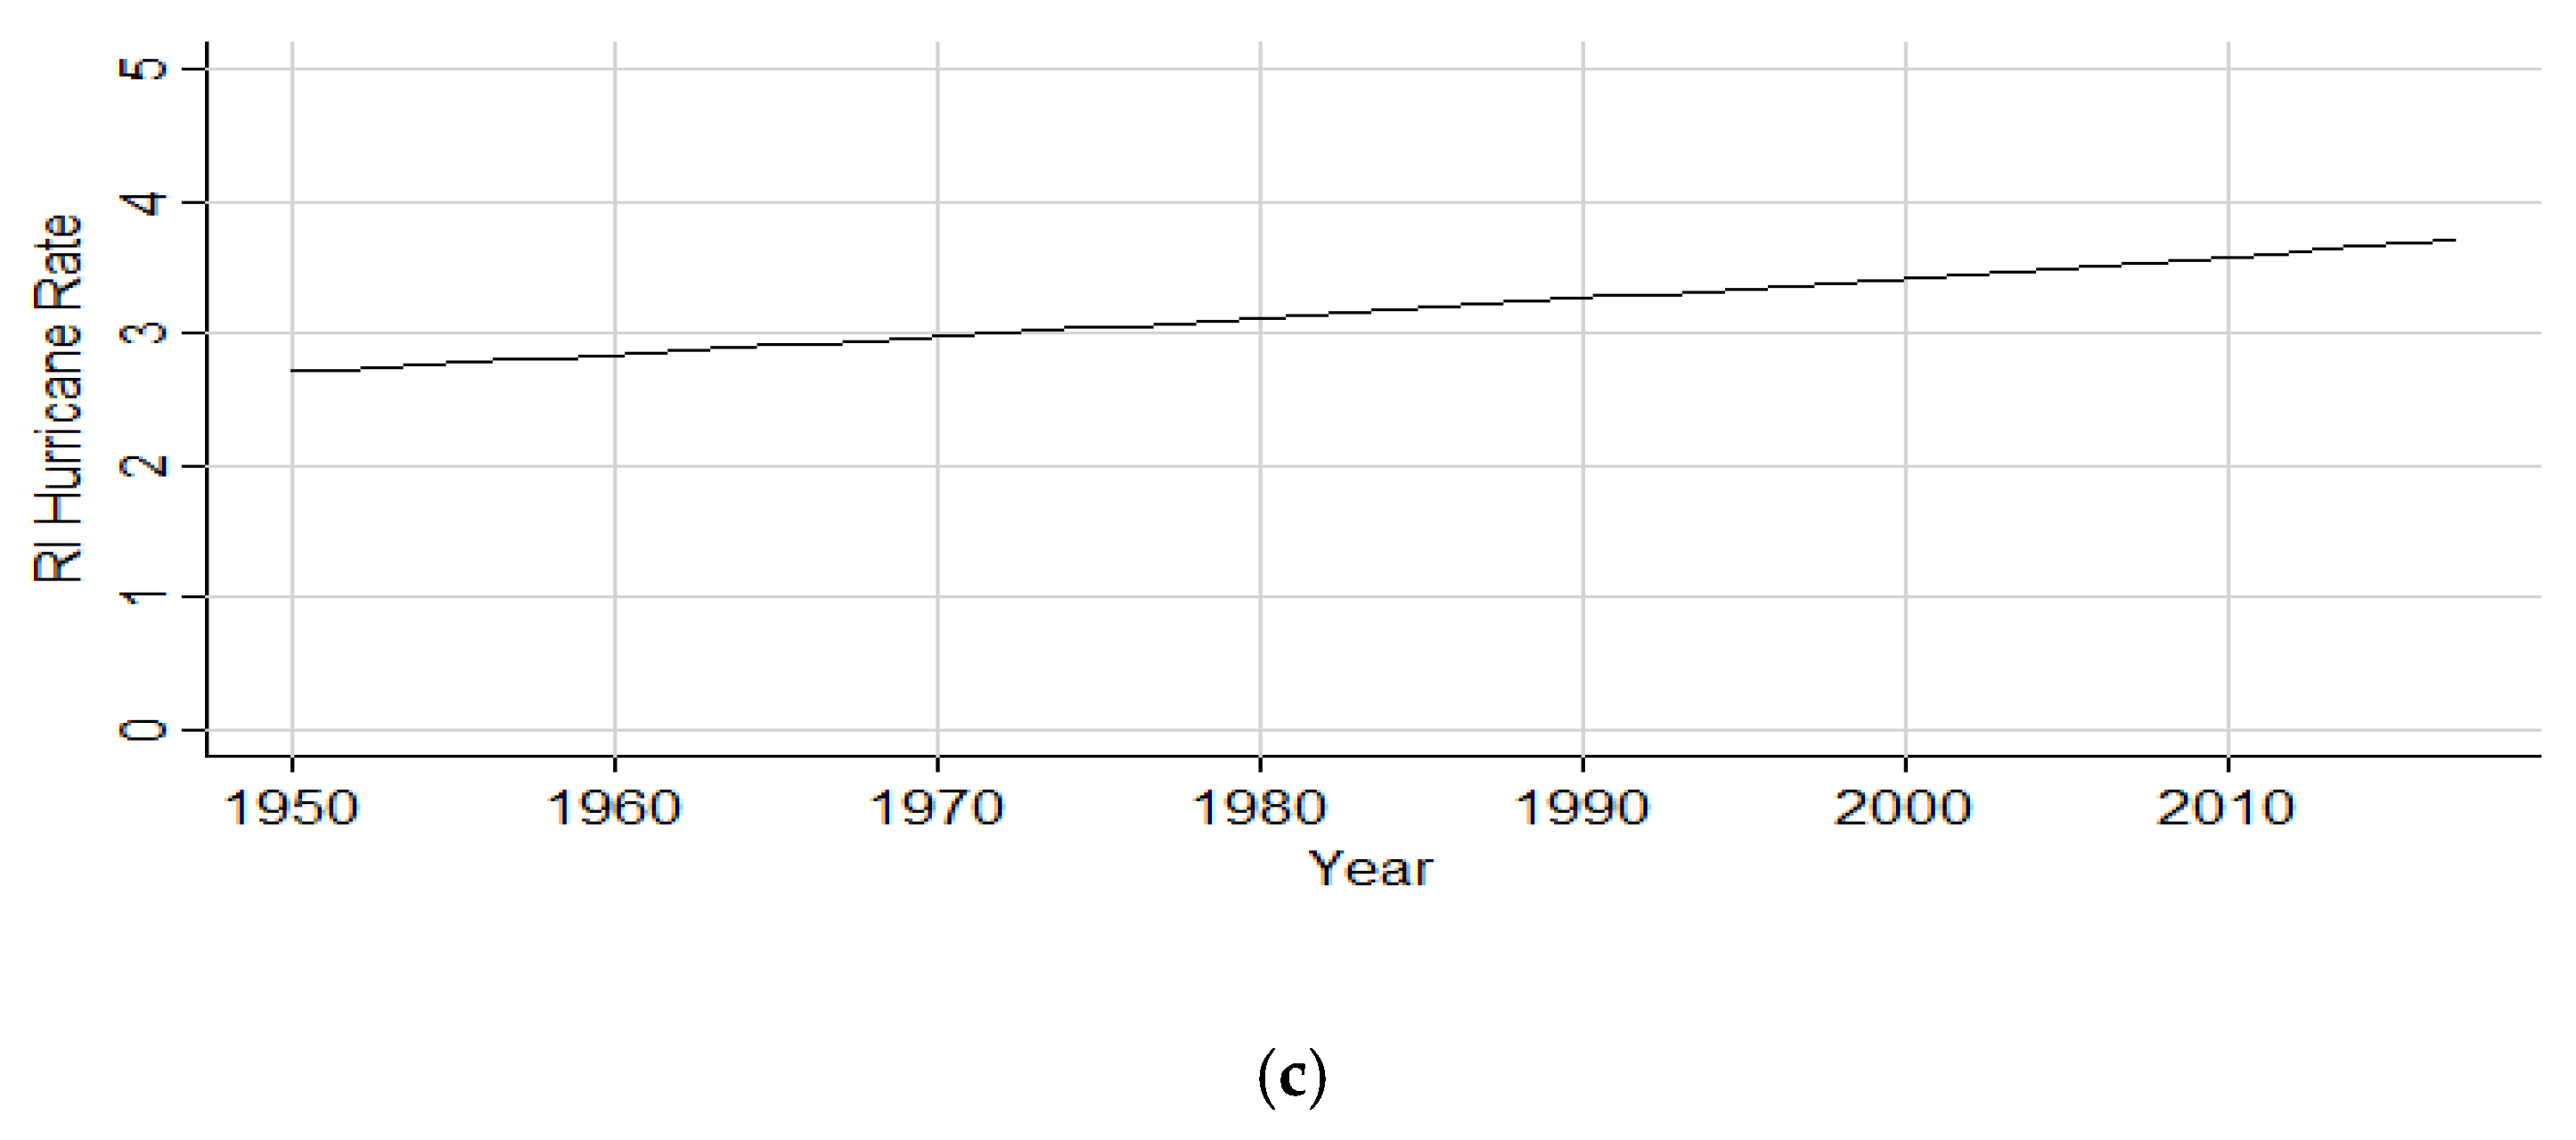
The Poisson regression analysis of RI storms within the North Atlantic sub-basin suggests a significant increasing trend in both RI hurricane counts and the number of events initiating RI within the region. RI hurricane counts originating within the sub-basin (1851–2017) increased by a factor of 1.3%, as depicted in Figure 7a. The same factor increase is also present for hurricanes originating in the North Atlantic sub-basin from the years 1900 to 2017, as shown in Figure 7b, demonstrating a consistent trend after sub-setting the data to take into account the likely sparseness in the early record. From the years 1950 to 2017, a 0.4% factor increase was noted, as depicted in Figure 7c. Table 5 shows the coefficient estimates, p-value, and chi-square p-values on the residual deviances for both the full and subset analyses.
Hurricanes initiating the RI process within the North Atlantic sub-basin increased by a factor of 1.4% (1851–2017), as illustrated in Figure 8a. The subset analysis (1900–2017) still maintained an increase by a factor of 1.2%, as shown in Figure 8b. The years 1950 to 2017 saw a factor increase of 0.4%, shown in Figure 8c. Table 6 depicts the coefficient estimates, p-value, and chi-square p-values on the residual deviances for both the full and subset analyses.
3.2.3. Gulf of Mexico Sub-Basin
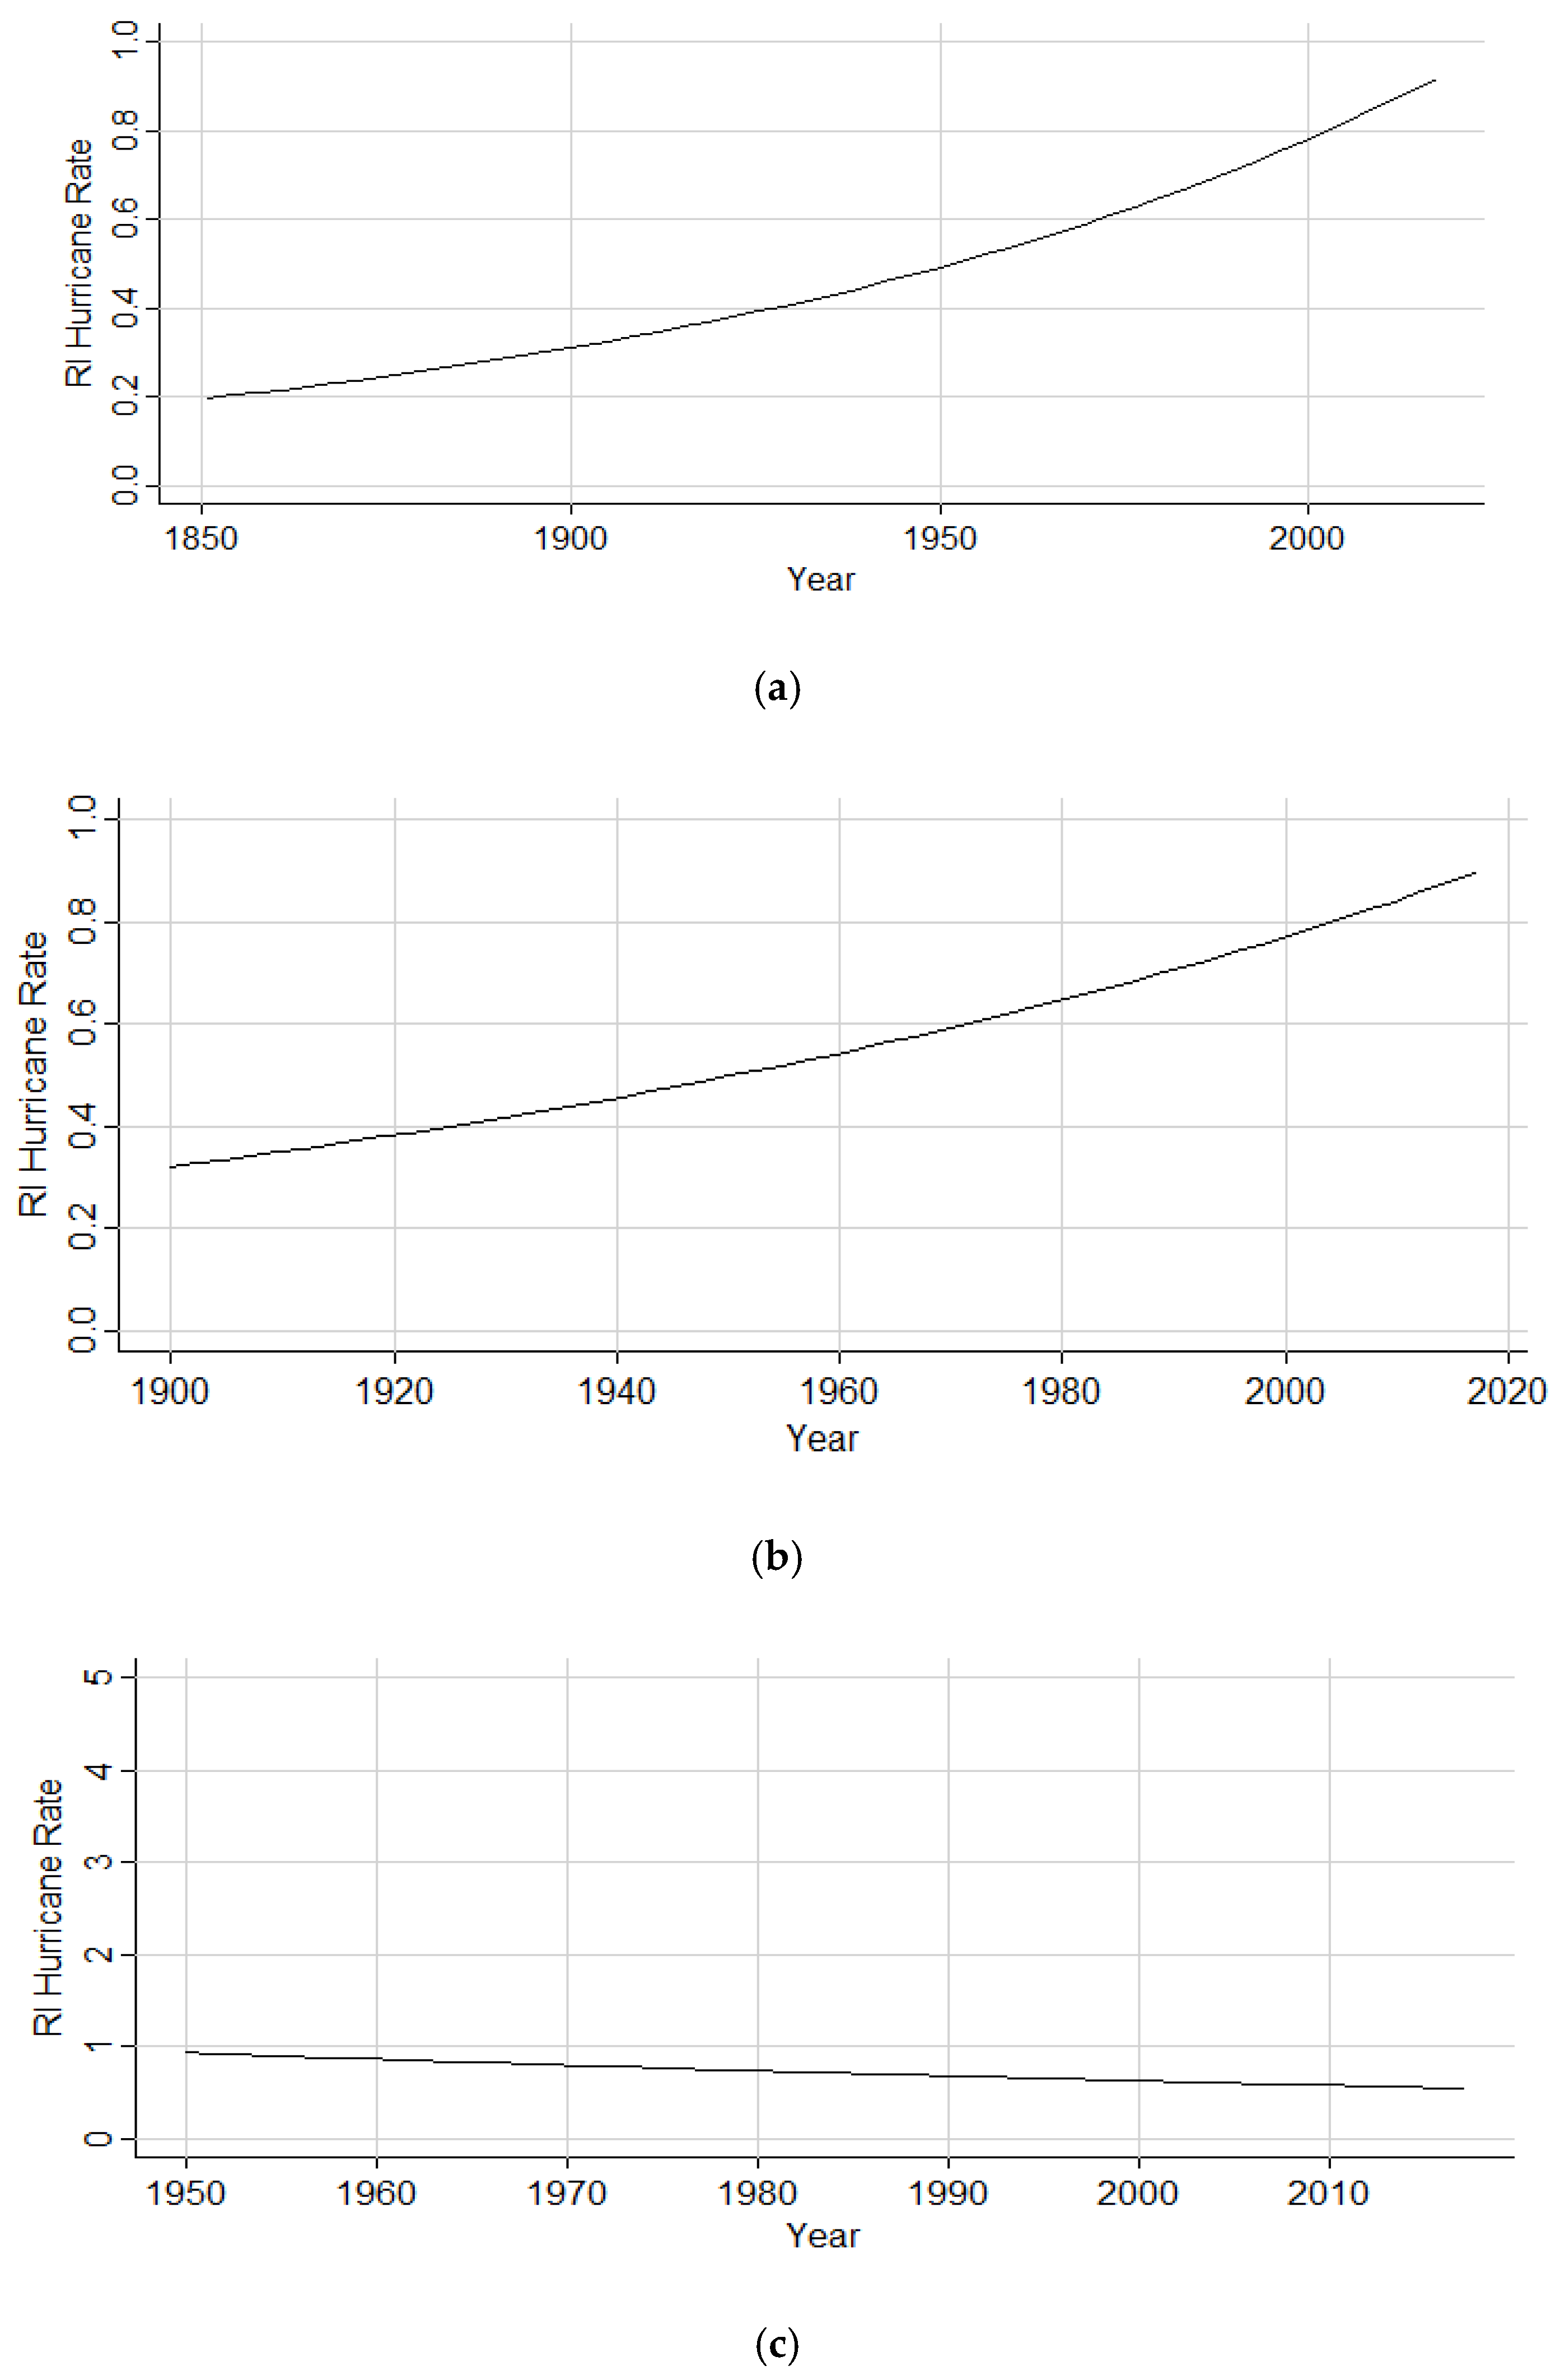
The Poisson regression analysis of RI storms within the Gulf of Mexico suggests a significant increasing trend in both RI hurricane counts and the number of events initiating RI within the Gulf of Mexico. RI hurricane counts originating within the Gulf of Mexico (1851–2017) increased by a factor of 0.9%, as depicted in Figure 9a. The same factor increase is also present for hurricanes originating in the Gulf of Mexico from the years 1900 to 2017, as shown in Figure 9b, demonstrating a consistent trend after sub-setting the data to take into account the likely sparseness in the early record. The subset of the years 1950 to 2017, however, yielded a 0.7% factor decrease (Figure 9c). Table 7 depicts the coefficient estimates, p-value, and chi-square p-values on the residual deviance for both the full and subset analyses.
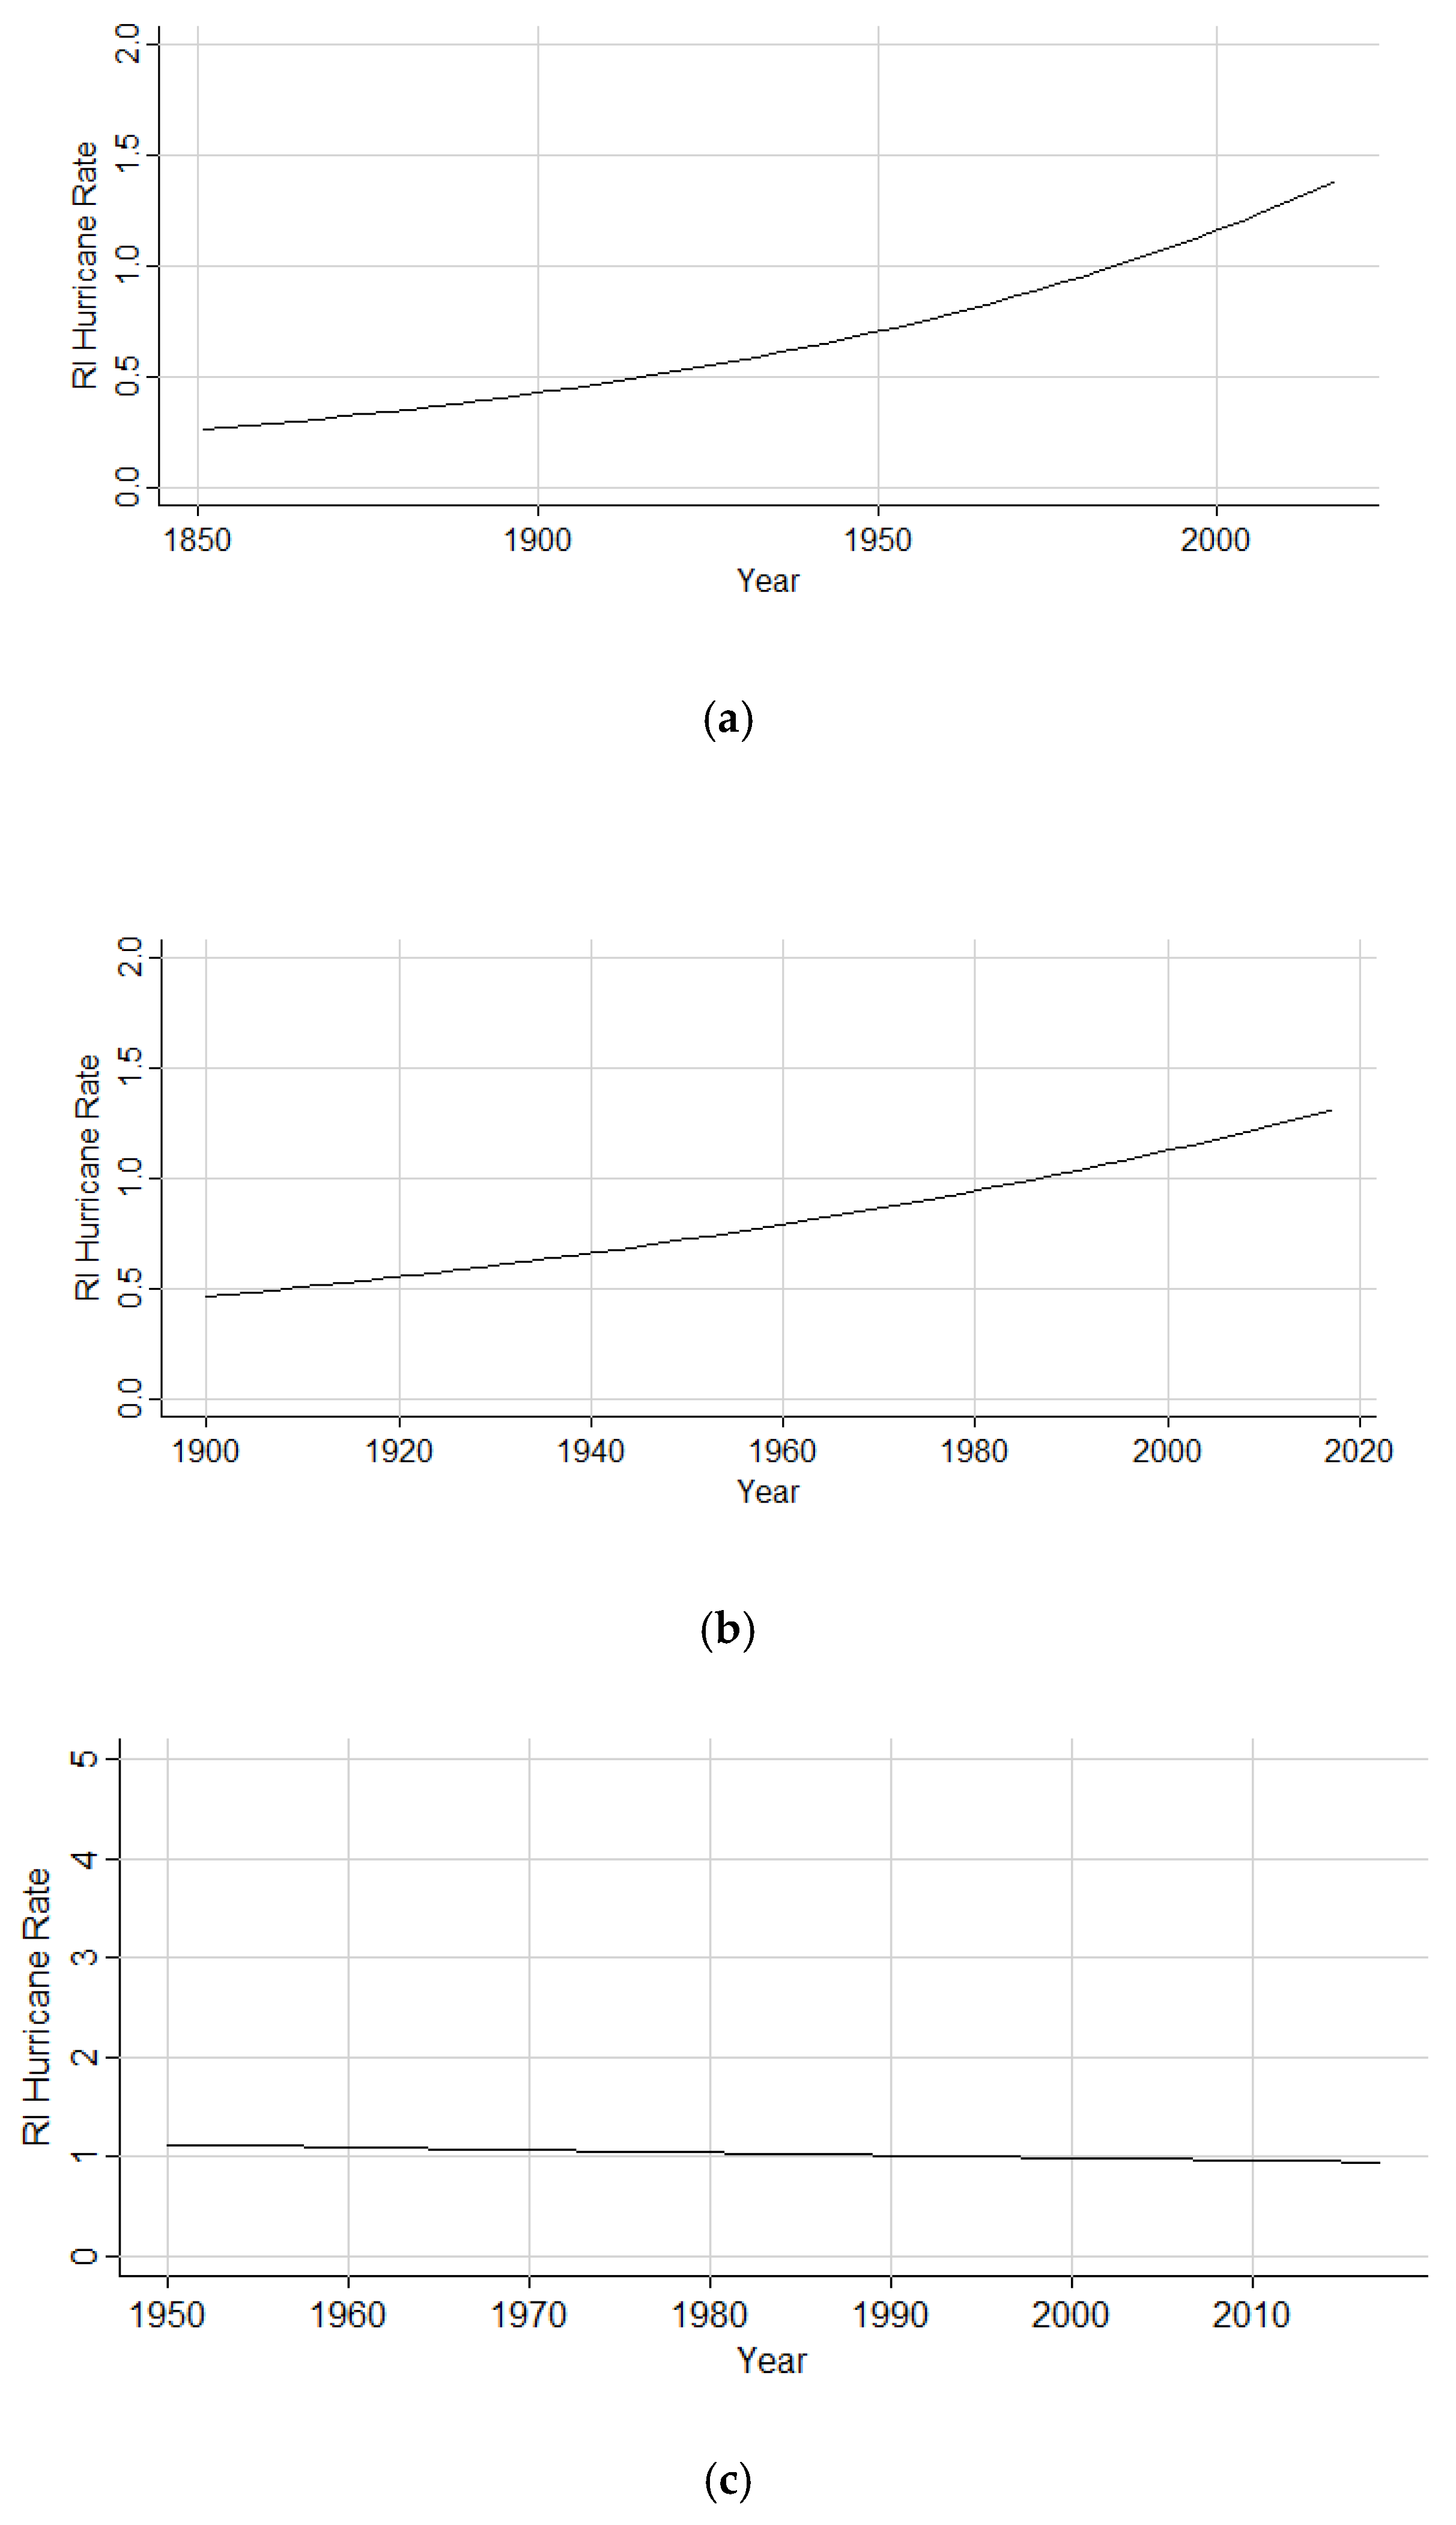
Hurricanes initiating the RI process within the Gulf of Mexico increased by a factor of 1.4% (1851–2017), as illustrated in Figure 10a. The subset analysis (1900–2017) still maintained an increase by a factor of 1.2%, as shown in Figure 10b. However, in Figure 10c, the rate is shown to decrease by a factor of 0.3%. Table 8 depicts the coefficient estimates, p-value, and chi-square p-values on the residual deviance for both the full and subset analyses.
3.3. Spatial Cluster Analysis
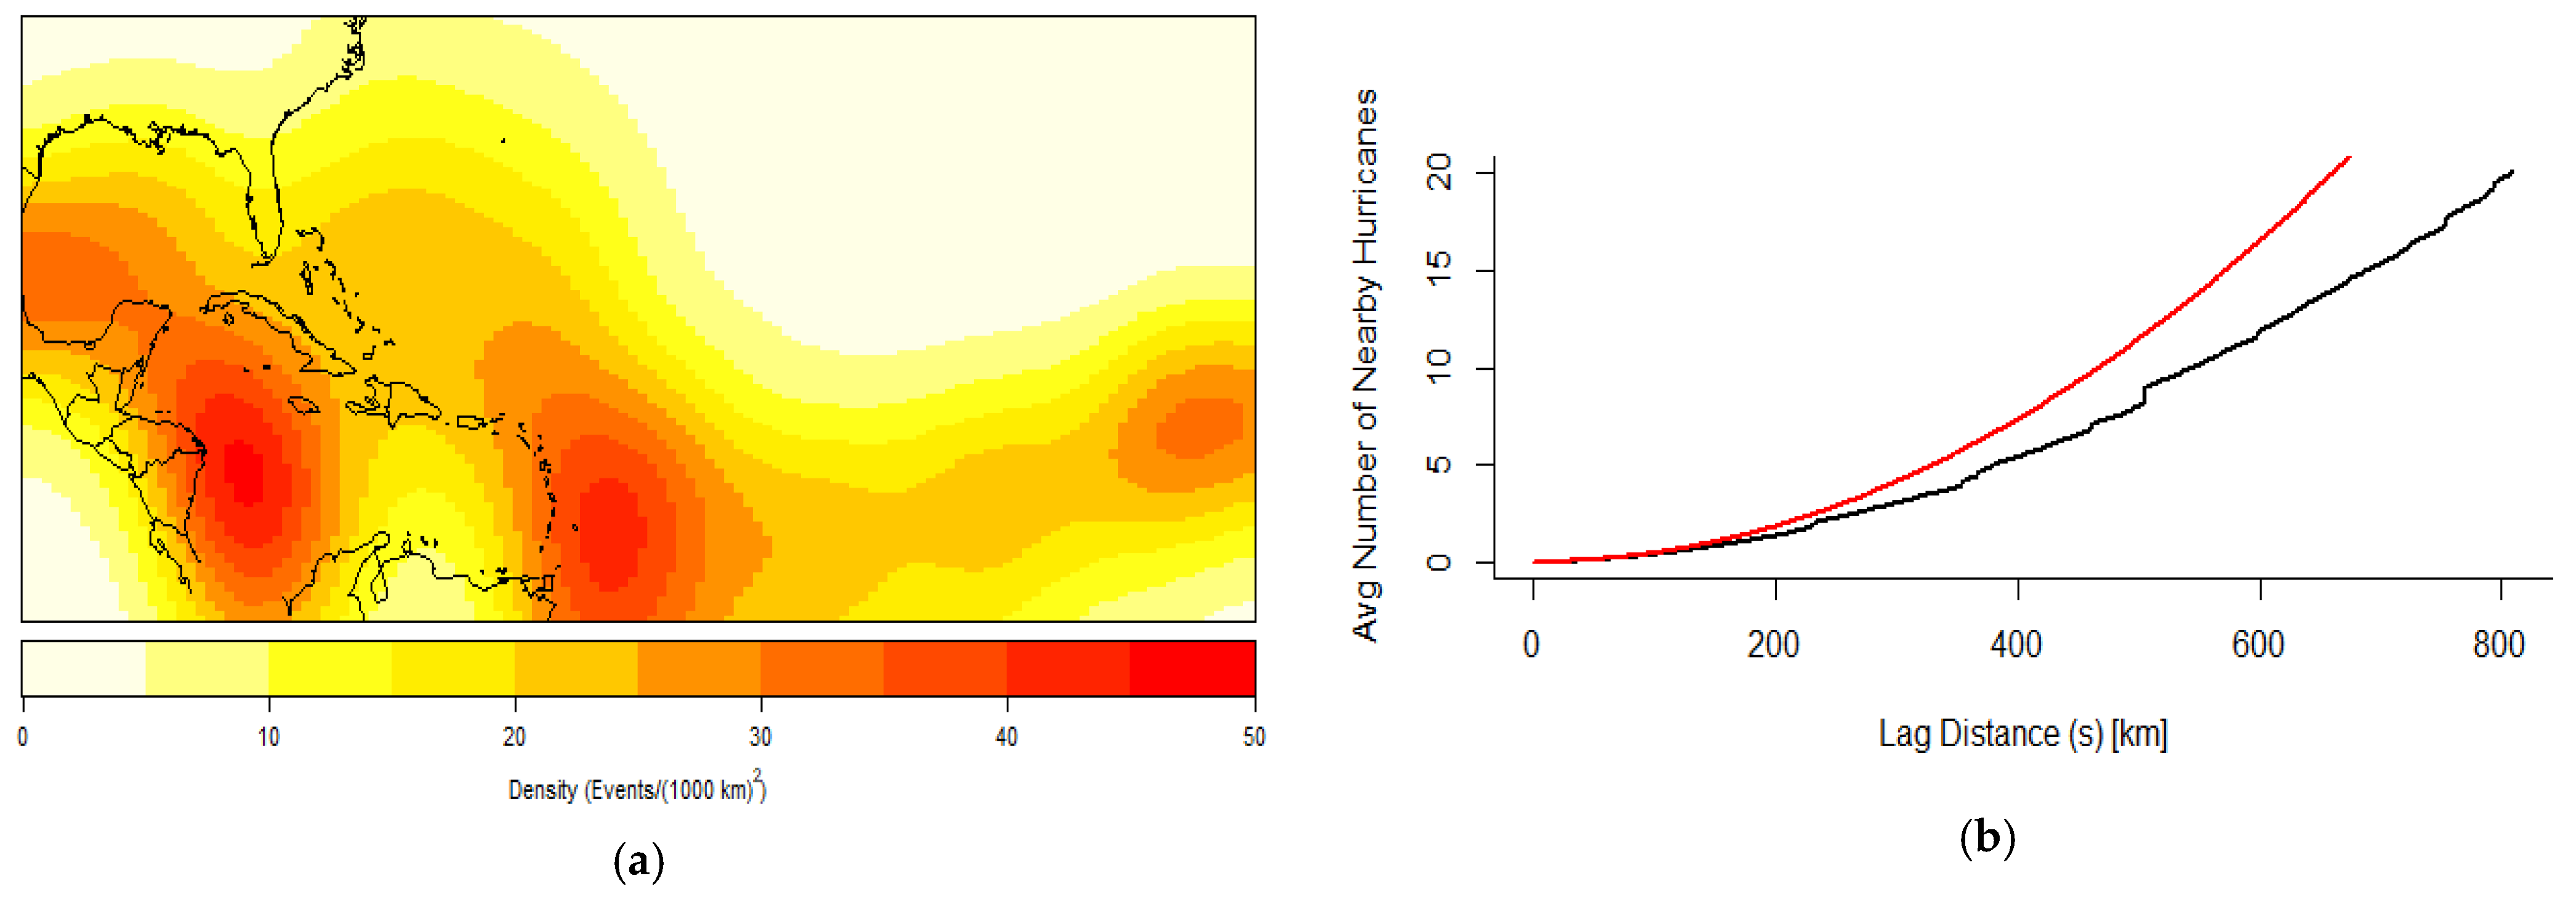
The kernel density analysis of both RI and non-RI hurricanes was done to investigate potential spatial trends for each of the predetermined spatial points of interest. The resulting kernel density map, Figure 11a, indicates four main development regions for RI storm origin points. These four regions include the Eastern Atlantic, the Western South Atlantic, the Western Caribbean, and the Southern Gulf of Mexico, differing from the three main development regions discussed in Wang et al. [5]. A K test and generalization of K test were both performed upon the kernel density model, comparing the theoretical versus the empirical estimate of the number of hurricanes nearby one another. However, because the generalization of K test is more suited for inhomogeneous data, it was used as the preferred method for testing the model’s adequacy. The result of this goodness of fit test illustrates that, for a given hurricane, there are more nearby hurricanes than you would expect by chance under the assumption of complete spatial randomness (CSR), which is indicative of spatial clustering and, therefore, indicative of an appropriate model fit. Figure 11b depicts a plot of the generalization of K test for RI storm origin points. The curves separate at a lag distance of approximately 150 km, indicating regularity from this distance.
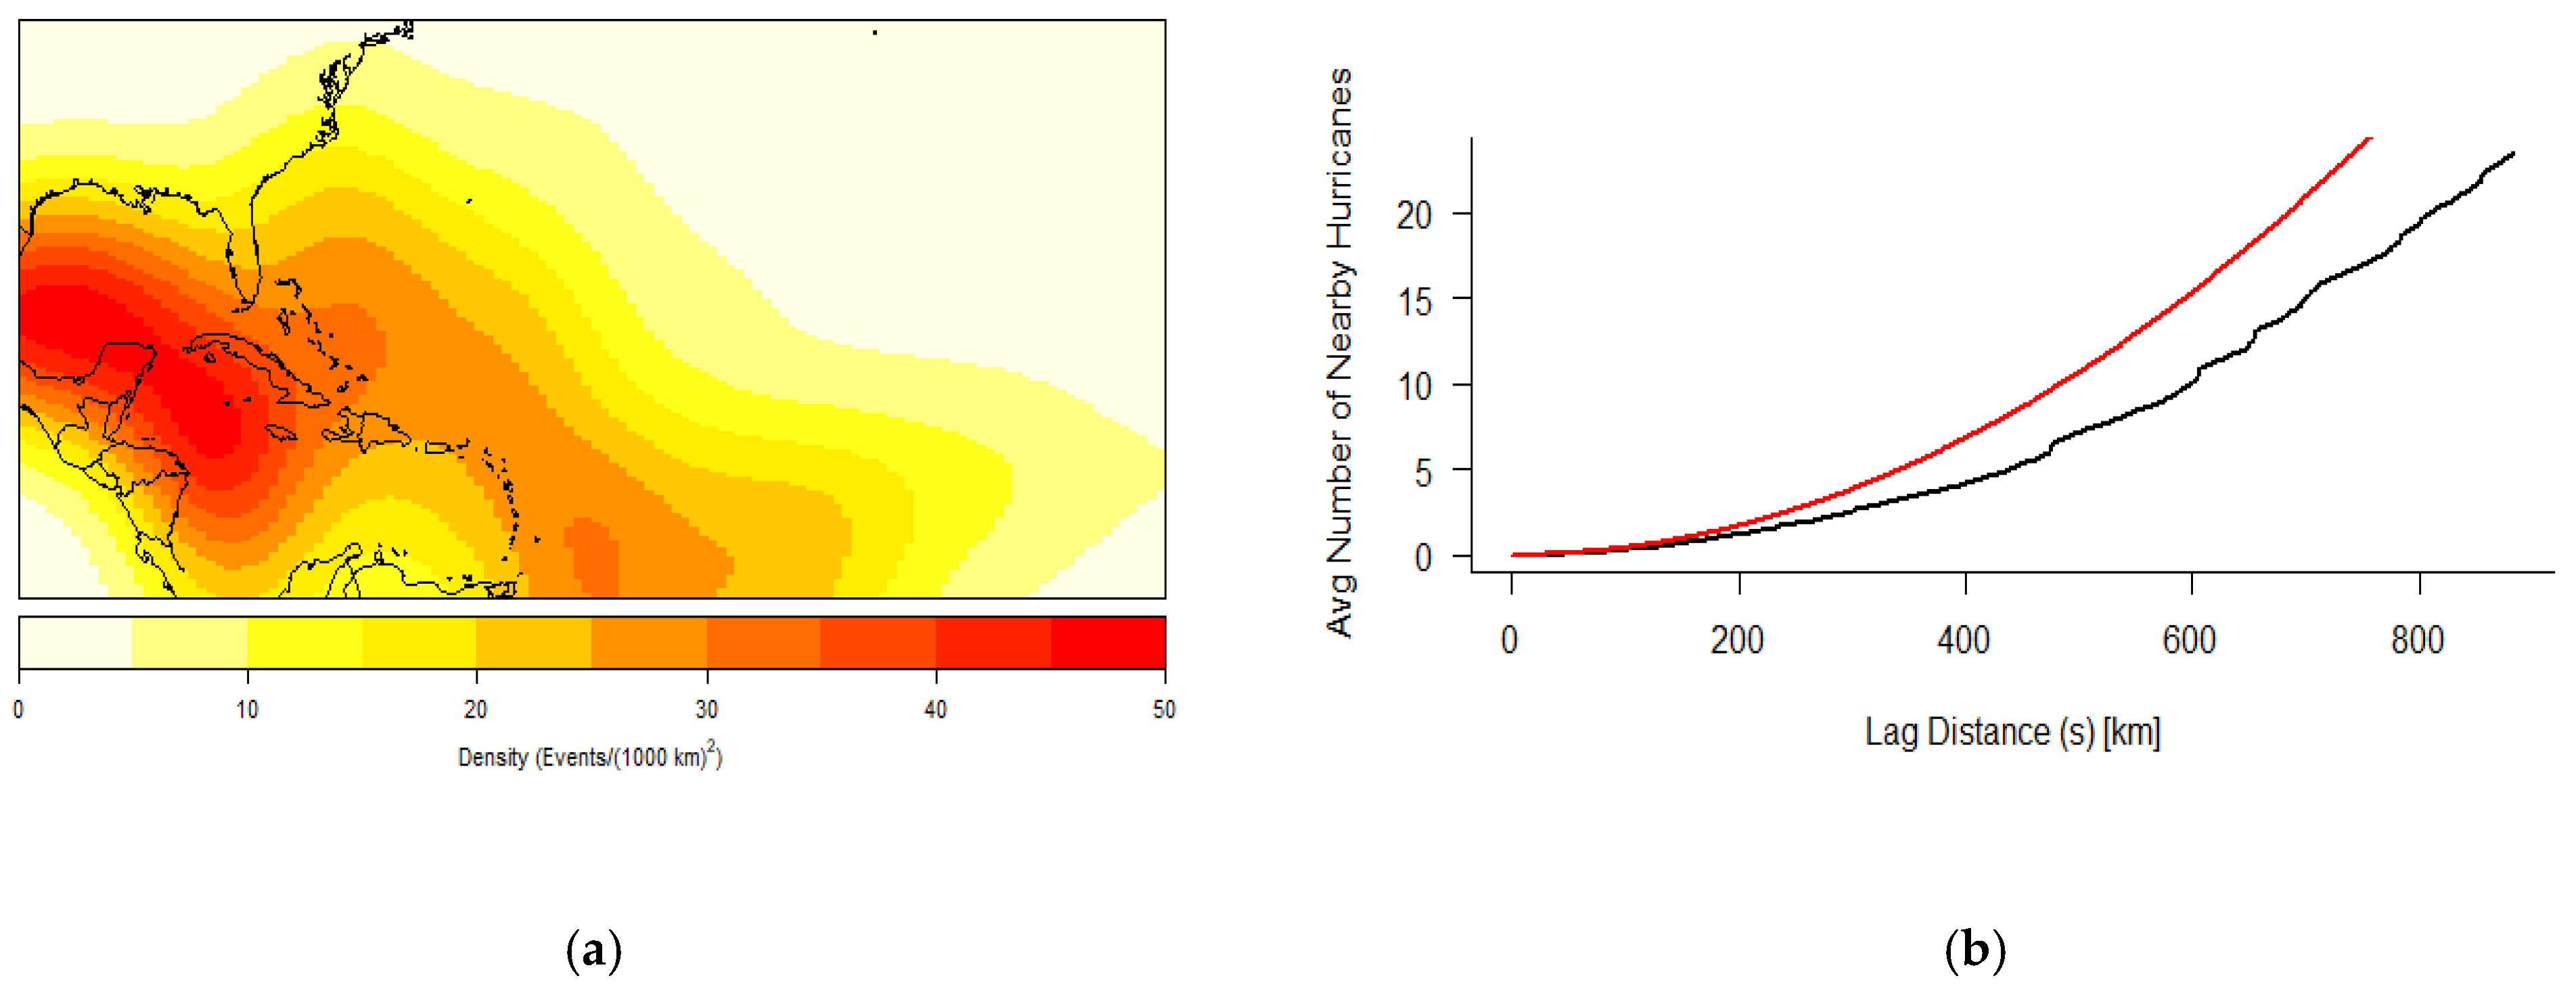
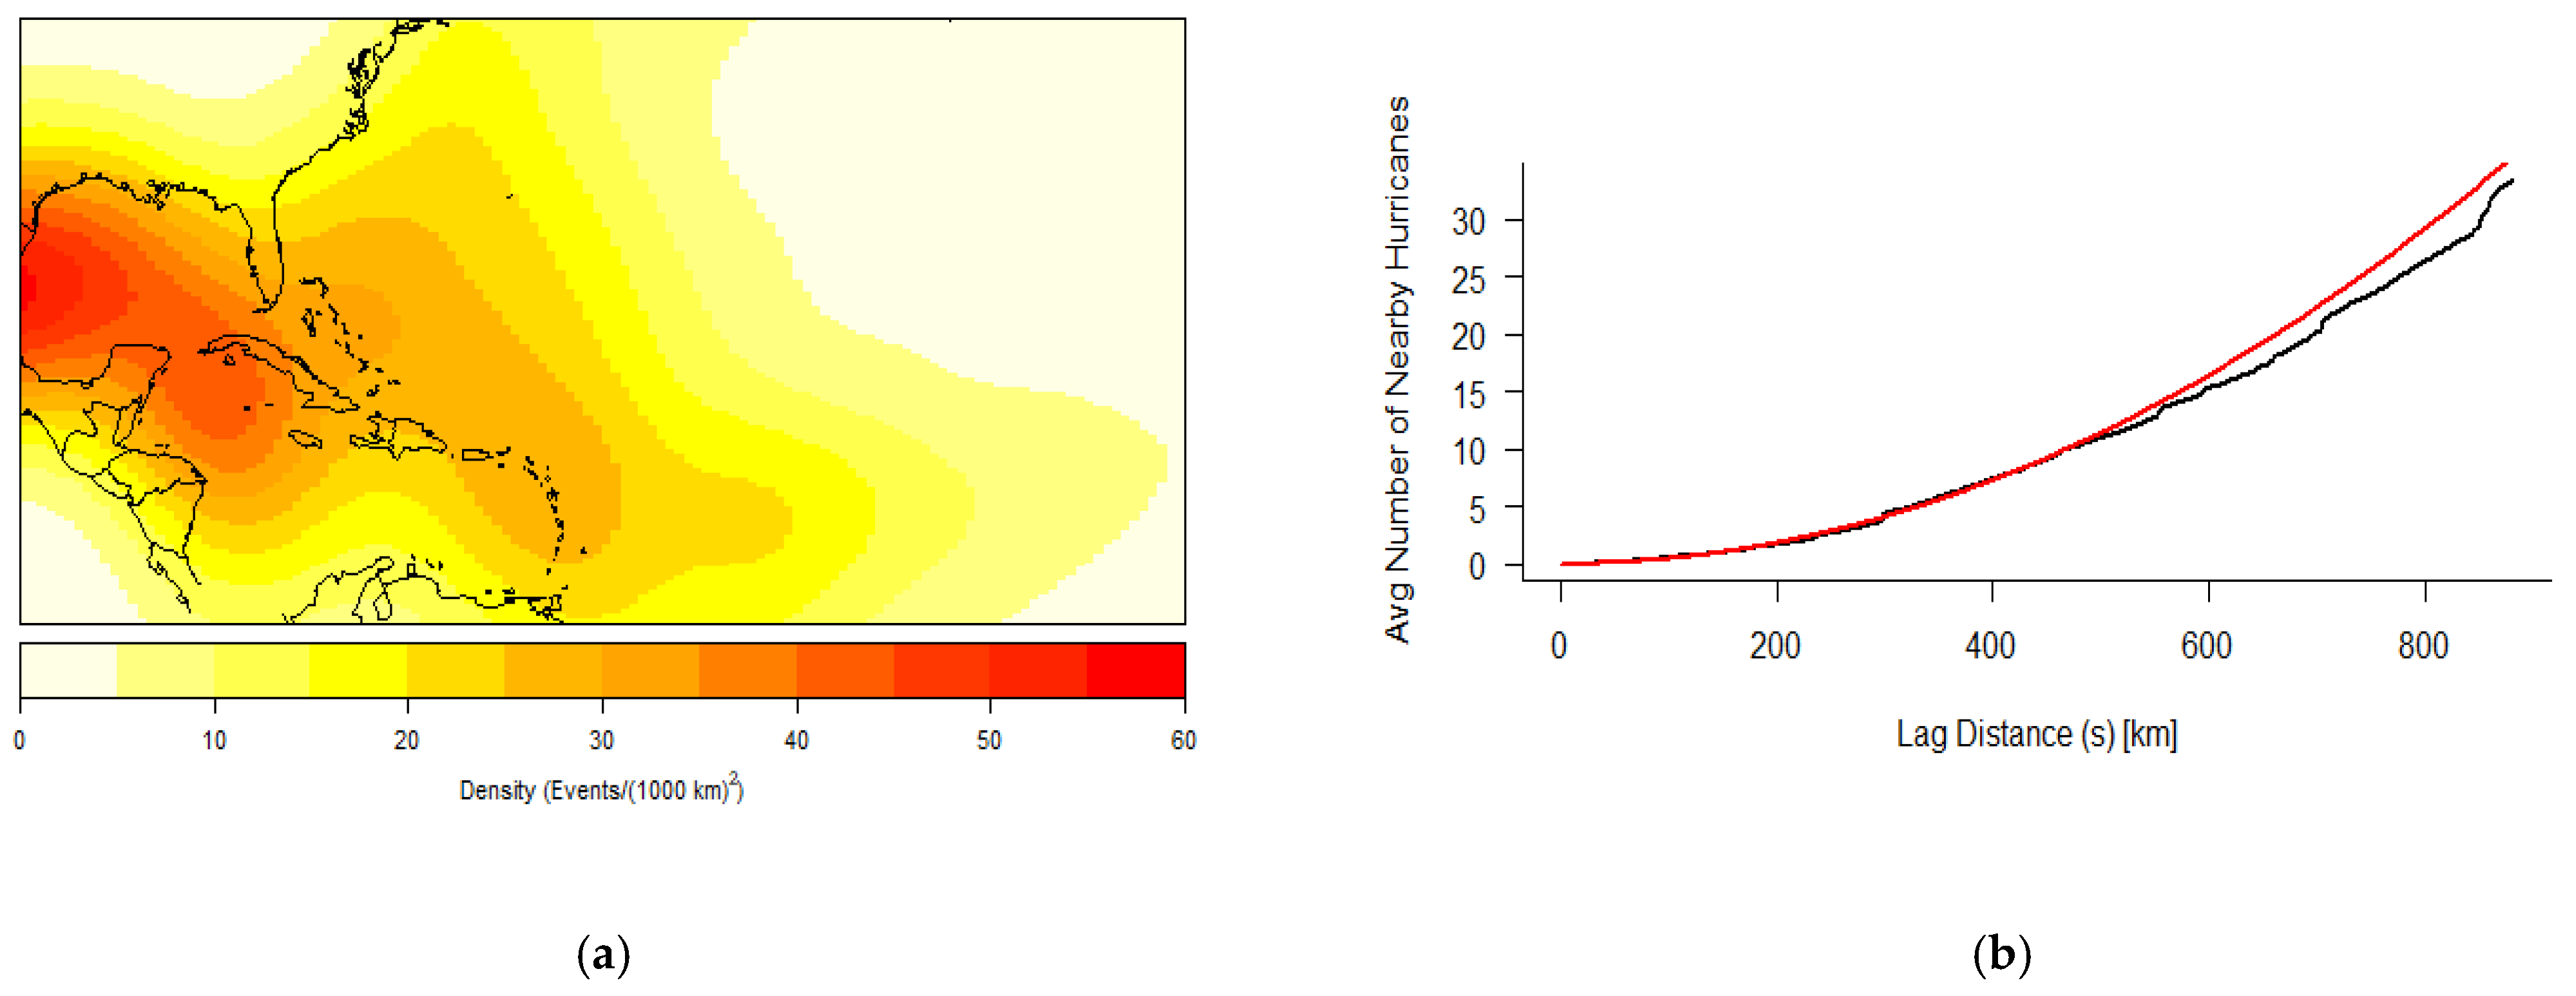
Initial RI genesis and RI completion points indicate clustering within the Caribbean Sea and Gulf of Mexico sub-basins, as shown in Figure 12a and Figure 13a. A generalization of K test for genesis points (Figure 12b) shows a higher empirical curve to about 150 km, which suggests an identifying pattern in the point distribution up to this lag distance, and CSR beyond this point. A generalization of K test was also performed on the initial RI completion points (Figure 13b), illustrating a higher empirical curve for up to 400 km of lag distance and, therefore, likely clustering of the points to this distance.
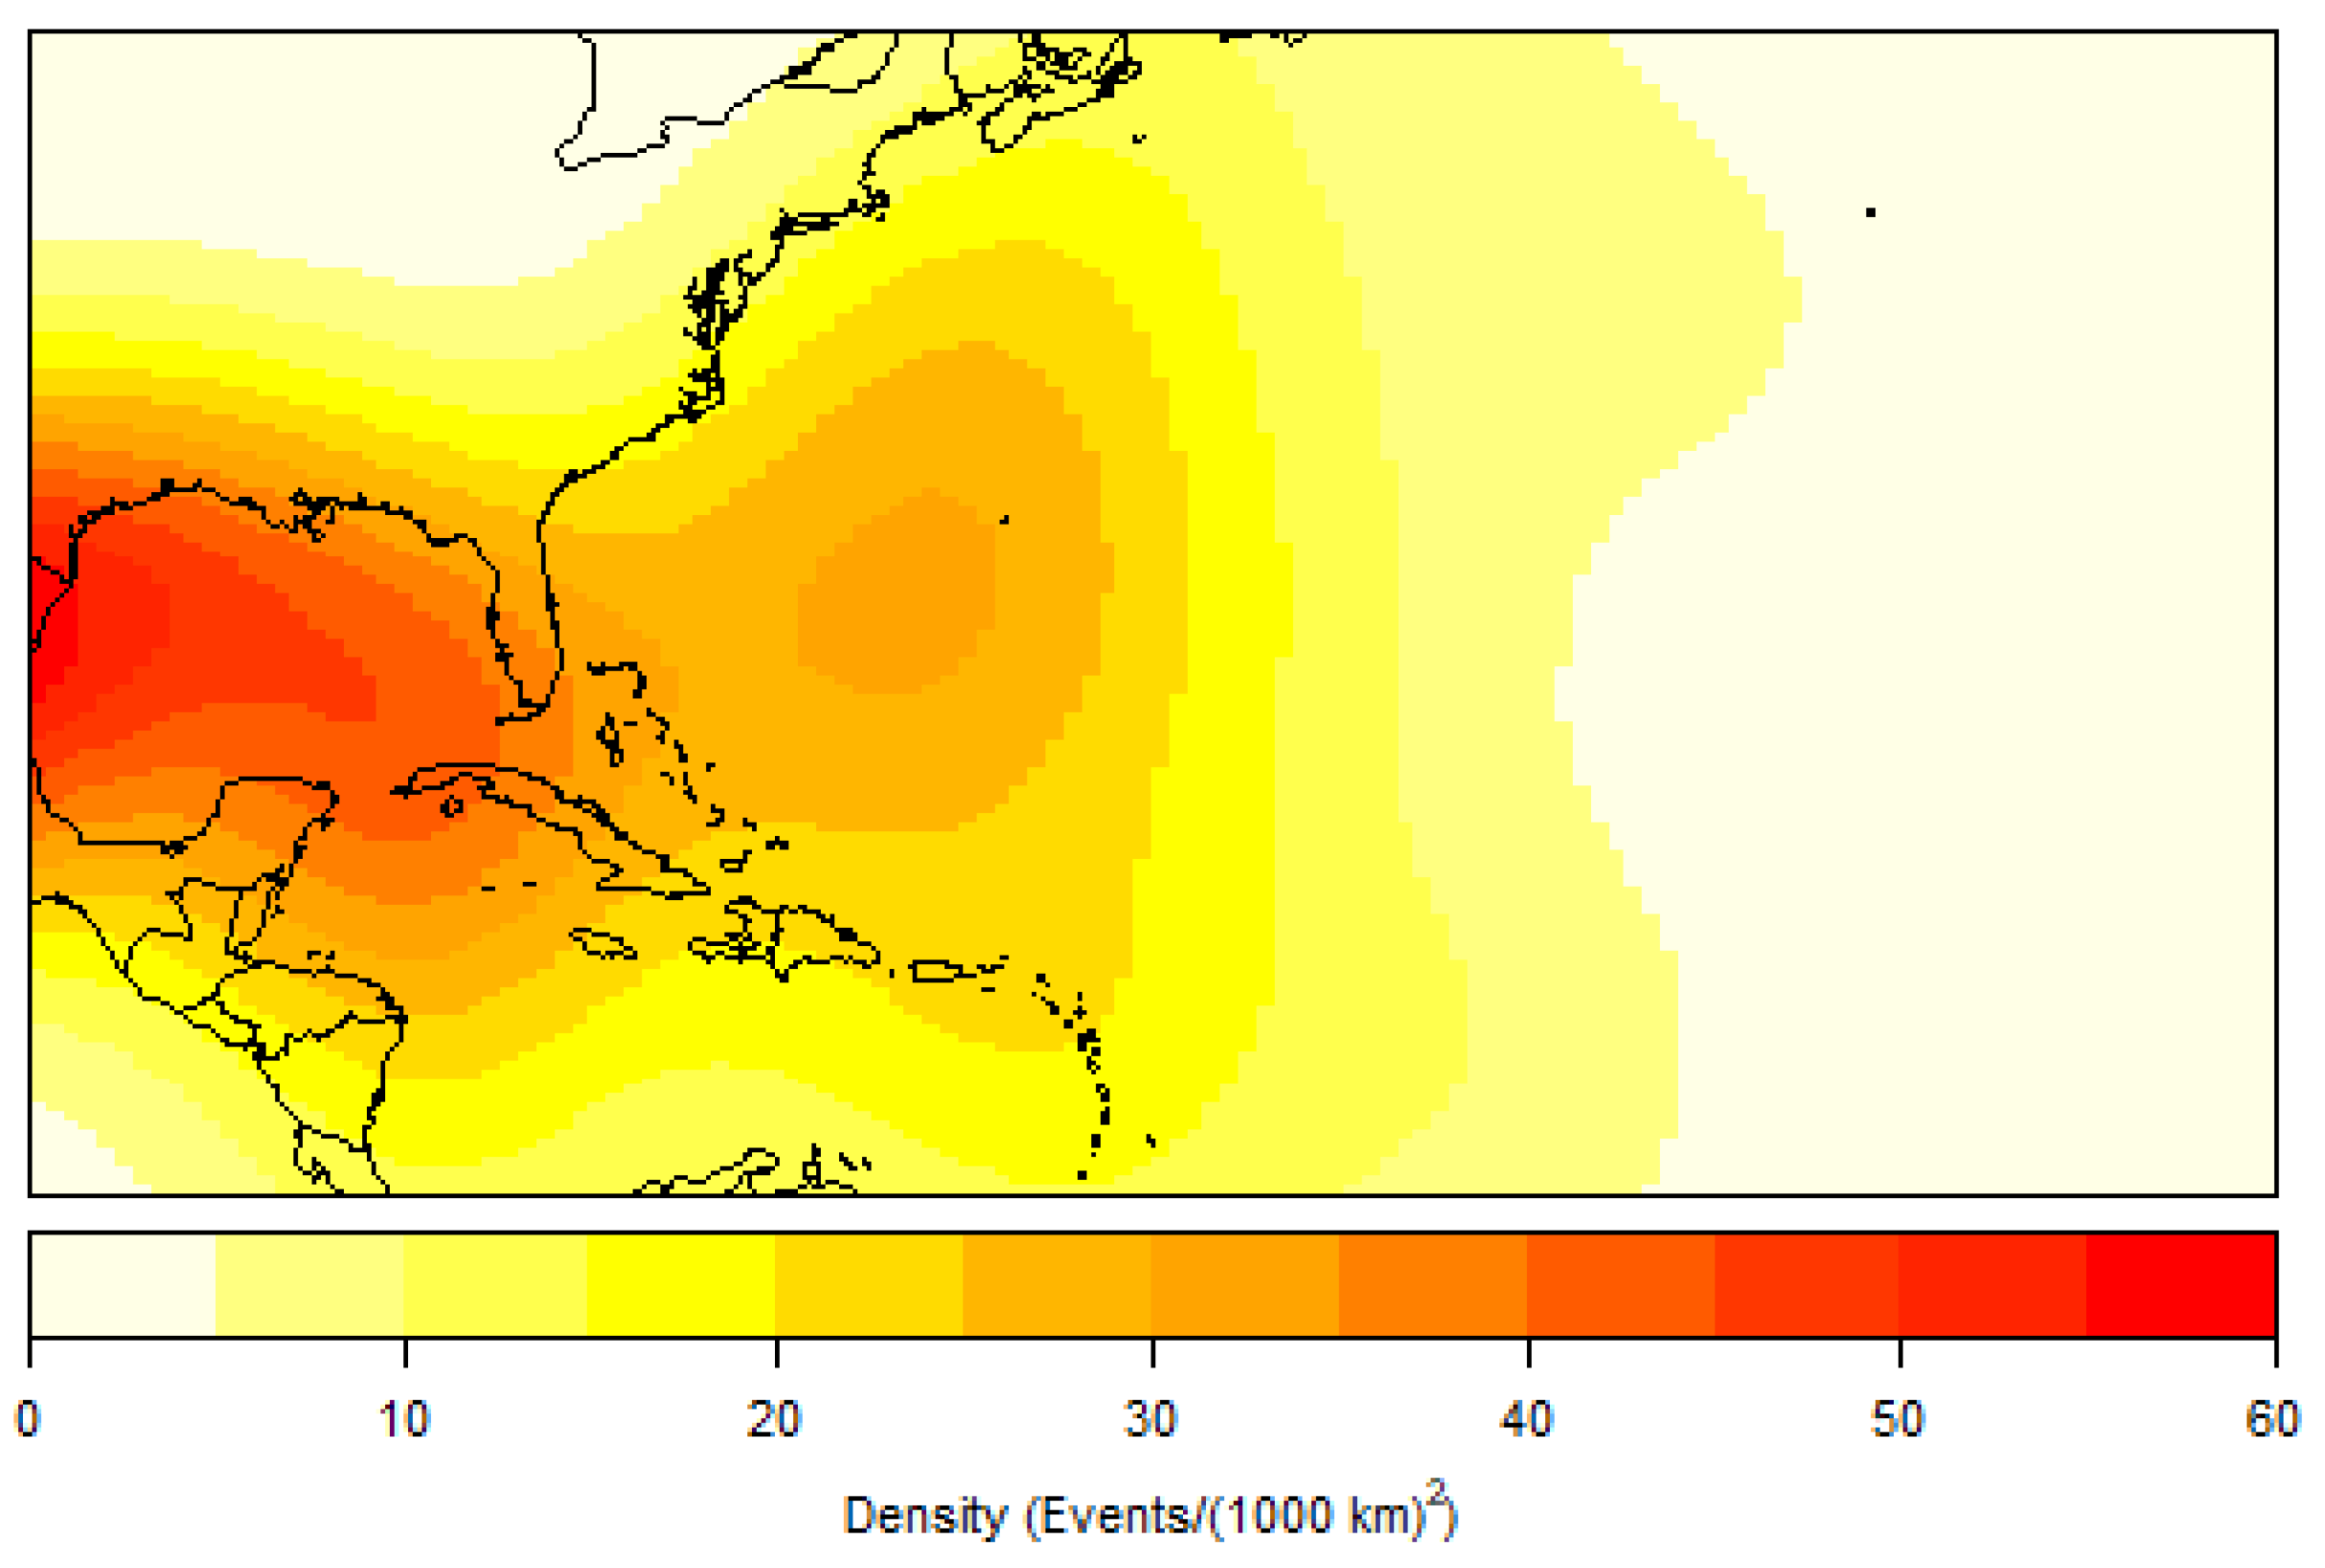
Storms that were determined to have made landfall were plotted using a kernel density analysis. Figure 14a indicates clustering throughout the Gulf of Mexico coastlines. A generalization of K test for landfall points (Figure 14b) shows a higher empirical curve up to a lag distance of 750 km and then a higher theoretical curve for the remaining lag distance. This suggests a likelihood of clustering for storms up to 750-km apart but CSR for any storms beyond that lag distance.
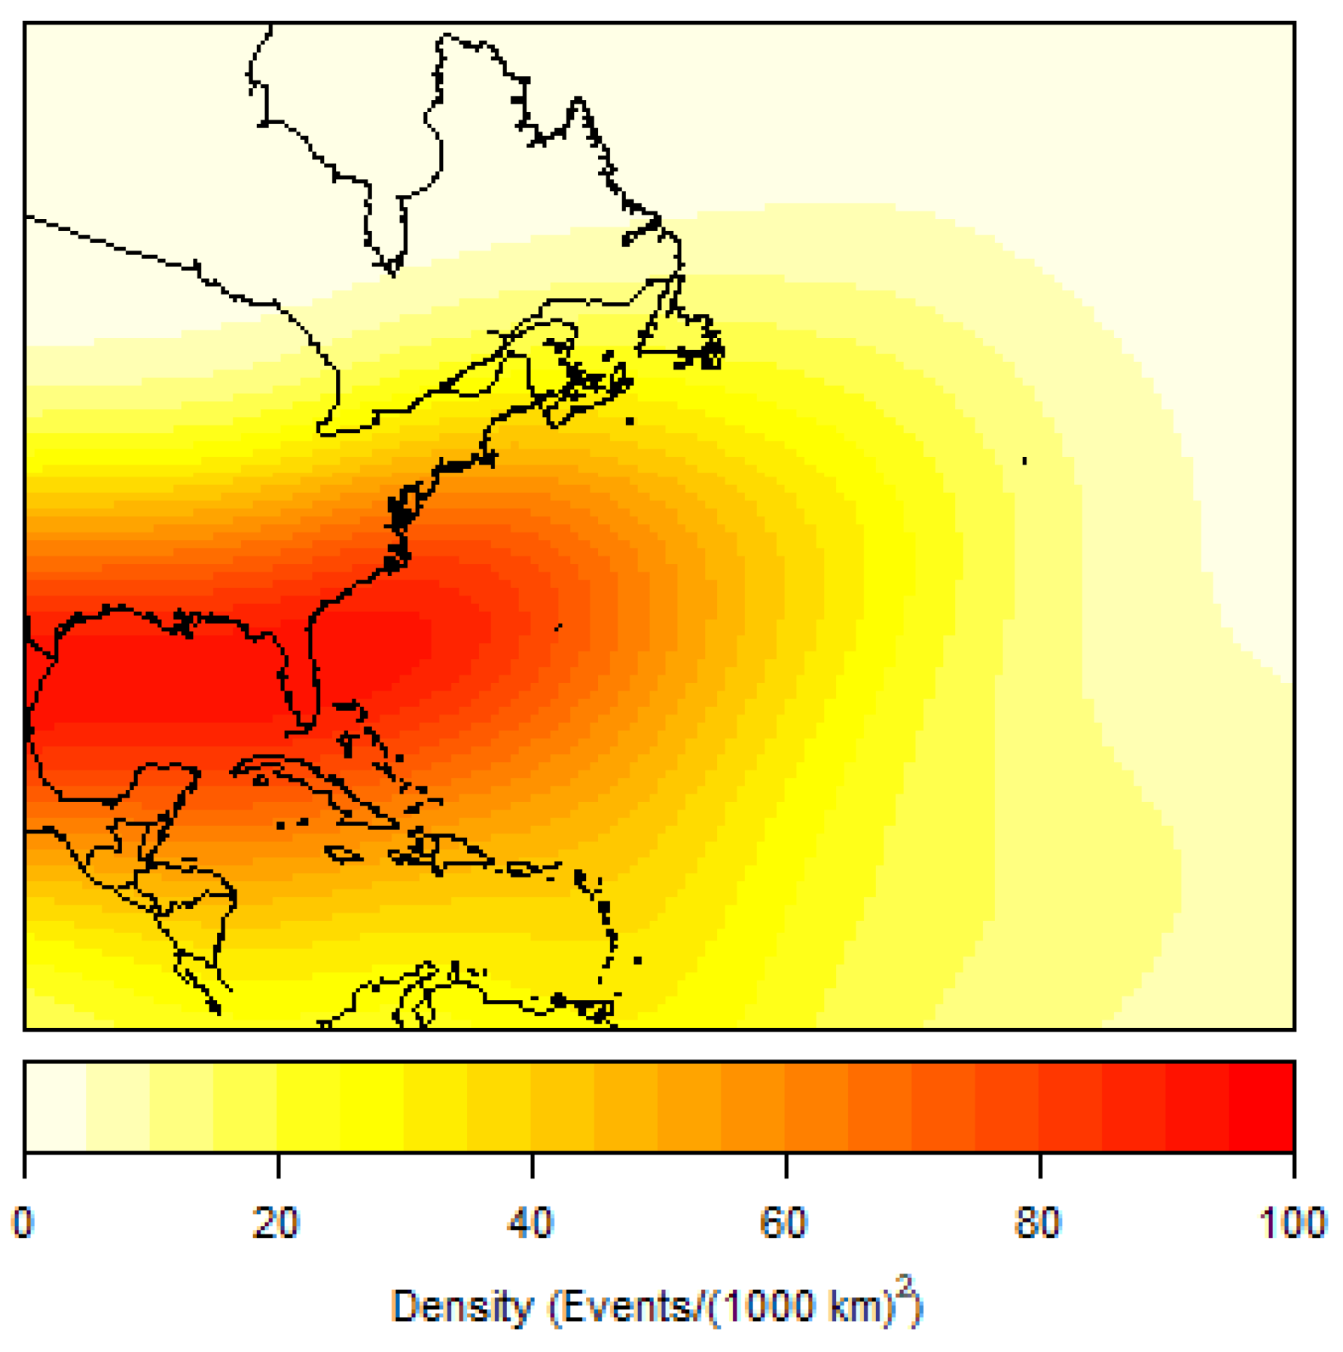
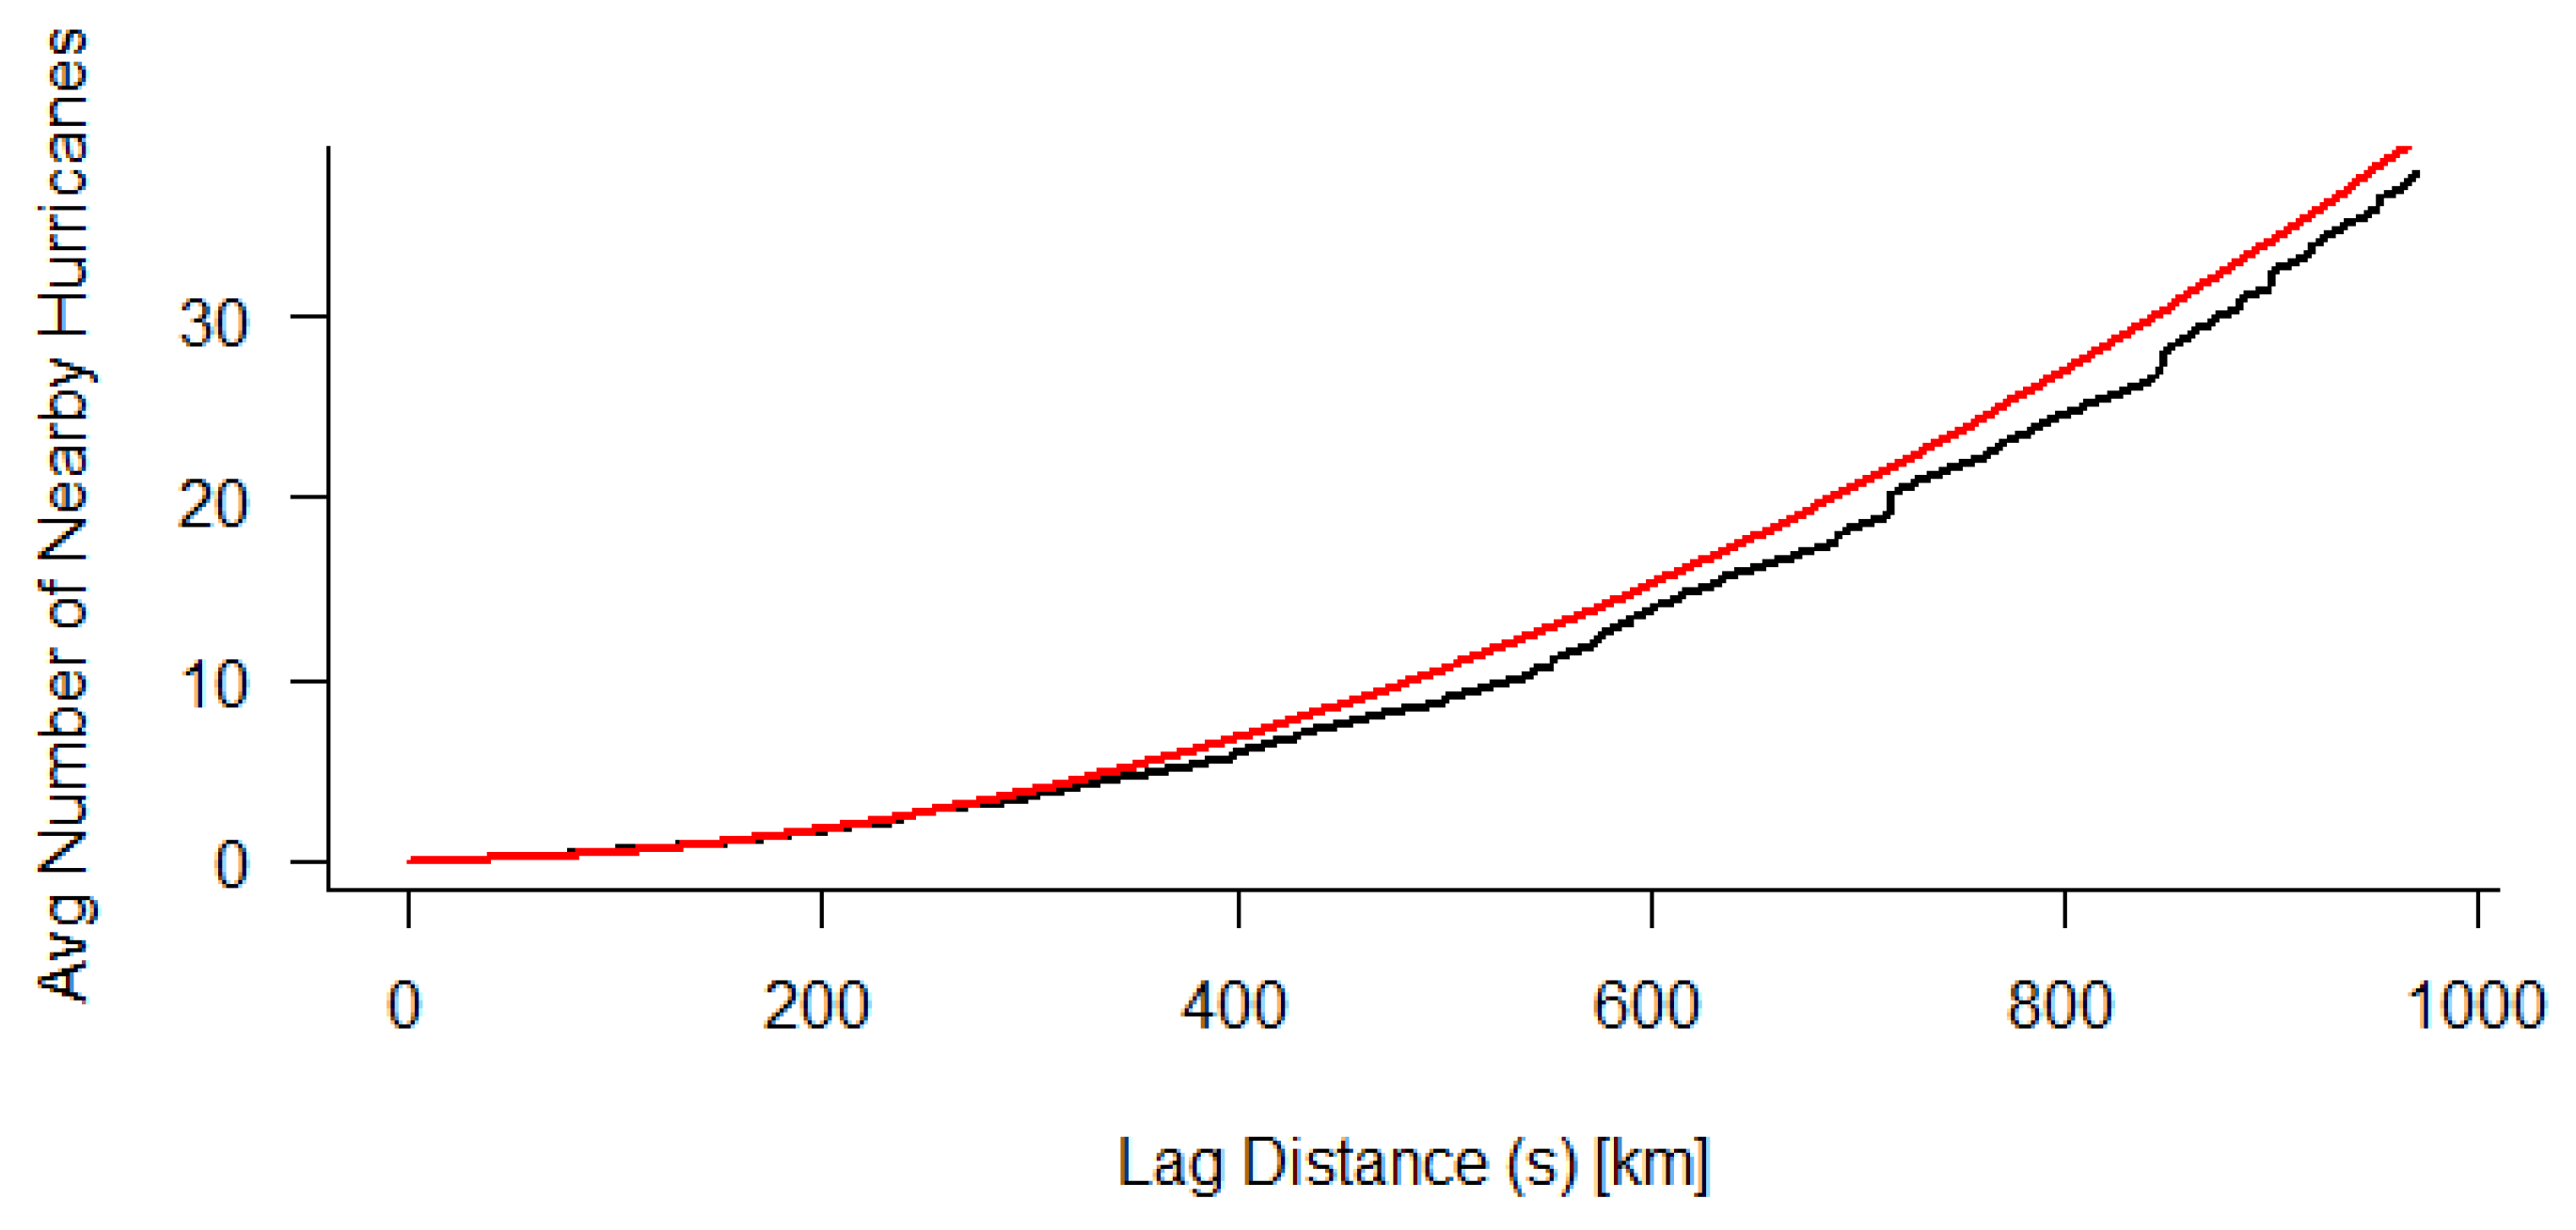
LMI points for RI hurricanes and non-RI hurricanes were modeled using a kernel density analysis. This analysis illustrates a spatial difference between RI storm LMI points (Figure 15) and non-RI storm LMI points (Figure 16), highlighting a concentration of RI LMI points within the Gulf of Mexico and Caribbean, while the non-RI LMI points are more distributed throughout the entirety of the Atlantic basin. A multitude of RI LMI coordinates are also present near the coastline of the Gulf states, suggesting that these storms reach their greatest intensity just before landfall in the Gulf. A generalization of K test (Figure 17) suggests a likelihood of clustering for storms up to 250-km apart.
3.4. Temporal Cluster Analysis
Due to the spatial analysis demonstrating a high level of RI activity within the Caribbean Sea, it was deemed necessary to conduct a temporal cluster analysis on the region as well. The annual frequency probabilities of RI hurricanes were modeled based on a Poisson distribution. Temporal clustering of hurricanes indicates that, for a certain area, there are years of no or low hurricane activity and then, in contrast years, where multiple hurricanes develop within an area within the same season. Table 9 depicts the observed (O) number of years where there were zero and then three or more (3+) RI hurricanes versus the expected (E) number of years where there were zero and then 3+ RI hurricanes. These comparative frequencies are divided into sub-basins based on hurricane origin points. If a region is shown to have a higher than expected number of years where zero hurricanes occur, as well as a higher than expected number of years where 3+ hurricanes occur, this region likely experiences temporal clustering of RI hurricanes.
Table 9 also illustrates the O number of years where there were zero and then 3+ hurricanes that originated (o), initiated RI (i), and underwent more than one cycle of RI versus the E number of years where there were zero and then 3+ hurricanes that originated, initiated RI, and underwent more than one cycle of RI, as well as chi-square and p-values for all categories. All three sub-basins show a greater observed number of years where zero RI hurricanes originated within them than the expected number of years. However, when compared to the expected number of years, only the Caribbean sub-basin shows a higher number of observed years where 3+ hurricanes developed. The Atlantic’s observed number of years is nearly the same as the expected number of years, and the Gulf of Mexico’s observed number of years with RI hurricanes originating within it is less than the expected number. A chi-square fitness test was performed on the model for each sub-basin, accepting the null hypothesis of no significant clustering only for the Gulf of Mexico basin and rejecting the null hypothesis of no clustering for the Caribbean and Atlantic basins. Table 8 contains the results of the chi-square fitness test on each sub-basin.
Compared to the expected number of years, all three sub-basins showed a significantly higher observed number of years where both zero hurricanes and 3+ hurricanes RI were initiated. A chi-square fitness test was performed on the model for each sub-basin, accepting the null hypothesis of no significant clustering only for the Gulf of Mexico basin and rejecting the null hypothesis of no clustering for the Caribbean and Atlantic basins. This indicates a significant likelihood of clustering within the Caribbean and Atlantic waterways. This lack of clustering within the Gulf of Mexico combined with the steady increasing trend from the Poisson model suggests that RI initiation is a steadily increasing, consistent occurrence within the sub-basin.
When relating the expected number of years for both zero and then 3+ hurricanes to the observed, hurricanes undergoing more than one cycle of RI showed a significantly higher number of observed number of years for both categories. A chi-square fitness test rejected the null hypothesis of no clustering, illustrating that significant clustering throughout time was present for these hurricanes. These results show a higher than expected occurrence of seasons where multiple storms underwent more than one cycle of RI and a higher than expected number of seasons when no storms underwent more than one cycle of RI. Thus, when hurricanes that undergo more than one cycle of RI within their lifetime occur, they tend to occur around the same time as others that exhibit this characteristic.
4. Discussion and Concluding Remarks
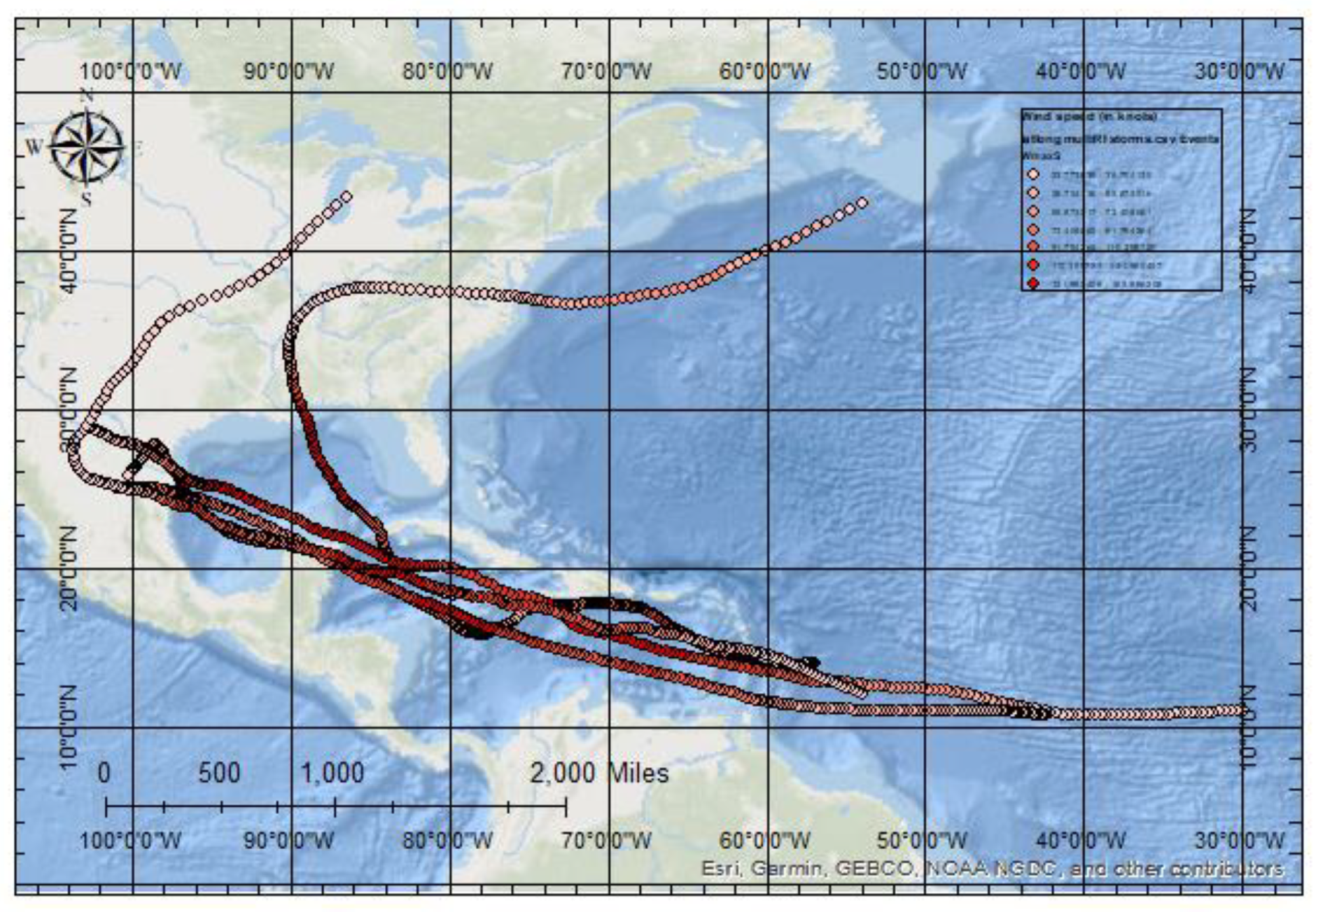
The seasonality and frequency of RI hurricanes in the Atlantic basin suggest that both geographical and environmental forcing processes are at play. The monthly RI hurricane distribution of the North Atlantic and Gulf of Mexico sub-basins generally follows a typical Atlantic hurricane season peak in August, September, and October. However, the sharp contrast between the singular September peak in the North Atlantic to the more consistent presence of RI hurricanes throughout the summer months of June, July, and August in the Gulf of Mexico indicates sub-basin variations. The Gulf of Mexico’s lesser, though steady, development of RI hurricanes shows a higher tendency for hurricanes to undergo the RI process within the sub-basin. Of further evidence in support of this idea is the five storms with four RI processes in their lifecycle that all tracked through the Gulf of Mexico and made landfall along the Gulf Coast. Figure 18 depicts the tracks of these storms color-coded based on increasing intensity.
The high rate of RI storms within this sub-basin may be due to the more evenly distributed heating that the sub-basin receives throughout the summer months, as well as the higher temperatures the Gulf of Mexico is known to have in comparison to the North Atlantic. The Gulf of Mexico is also a more compact, shallower body of water, which allows for the hot water temperatures to occur during the entirety of the Boreal summer months.
Seventy-five percent of the storms initiating their first cycle of RI immediately following their origin within the North Atlantic sub-basin may be indicative of the involvement of larger atmospheric and oceanic forces. Although having a relatively small rate of occurrence (only 67 of the total number of storms), this result might suggest the existence of a triggering mechanism, such as proximity to the MDR, that could be the cause of an immediate RI onset, thus necessitating further analysis of the environmental determining factors that spur on RI events. These results are also varying from Tallapragada et al. [22,23] conclusions that most storms undergo RI at their origin. The present study shows that the majority of storms’ initial RI cycles were initiated at some point following the storm’s origin (83% of storms underwent RI at some other point in their cycle besides the origin of the storm). The higher windspeed values of RI storms in contrast with non-RI storms suggest, not surprisingly, that, on average, storms undergoing RI cycles tend to be more intense than storms that do not. Storms undergoing more than one cycle of RI within their lifetime were found to have an average LMI of 64.05 ms−1 as compared to an average LMI of 48.27 ms−1 for storms undergoing only one cycle of RI. This further corroborates the idea that the process of RI tends to spawn more intense and, thus, more dangerous, storms.
Upon sub-setting the data from 1980 on, it was found to have similar climatological results as the entirety of the record. The number of storms undergoing RI at some other point within their lifecycle besides their origin was found to be 129 of the 147 total storms from 1980 on (87.76% of the storms), which holds steady with the results of the entirety of the record that found 83% of storms underwent RI at some other point in their lifecycle besides their origin. Three of the five storms that underwent four cycles of RI occurred from 1980 on, and all five storms that underwent four cycles occurred from 1967 on where there was satellite data available. The monthly distribution also holds steady from 1980 on, showing a peak in August, September, and October, the highest of which still is September.
The GARCH model yields a positive increasing trend for RI hurricane counts in both the 1851–2017 and 1900–2017 subsets. The inconsistency in the CIs of the 1950–2017 subset may be illustrative of a false increasing trend from 1851 to 2017 based on missing storms from the earliest part of the HURDAT2 record. However, substantial advancements were made to the detection and cataloguing of hurricanes beginning in 1900 with the advent of wireless telegraph capabilities from ships [24]. Thus, the trend seen in both 1851 to 2017 and 1900 to 2017 points to a legitimate significant increase over the record. The inconsistency of significance in the latter period’s trend could be related to the much shorter timeframe of data being analyzed, causing a smaller sample of data and, thus, a poorer estimate of the RI hurricane population parameter.
The use of the GARCH model is further supported by the Poisson regression analysis results in the North Atlantic sub-basin. Although the region shows factor increases for storms both originating and initiating RI, the chi-square p-value’s rejection of the null hypothesis suggests the Poisson distribution is not an appropriate model to describe storm patterns in the region. However, the positive increasing trend within both the GARCH and Poisson models supports a likely legitimate increase in RI hurricanes over time.
The factor increases of storms both originating and initiating RI within the Gulf of Mexico, and the steady rise in incidence rate ratios depicted in the graphics is indicative of consistent RI hurricane activity within the sub-basin. Although the Gulf of Mexico has substantially fewer events than the North Atlantic and Caribbean, the presence of RI storms within the basin has been not only steady but also slightly enhanced throughout time. The 0.7% factor decrease in the 1950 to 2017 subset of storms originating within the Gulf may speak to a decreasing trend but more than likely further illustrates the low frequency of storm originations for the basin in general. The 0.2% factor decrease of storms initiating RI within the Gulf of Mexico from the years 1950 to 2017 is an extremely low decline in activity and was also found to be an insignificant finding based on the p-value. Thus, an increase in Gulf of Mexico RI basin activity is still seen as the prominent finding. Similar to the consistent monthly distribution of RI events within the Gulf of Mexico during the summer months, the warm SSTs (sea surface temperatures) and shallower water of the sub-basin may play a role in this consistent activity, and warming waters in the region in response to anthropogenic climate change may correlate with the increasing trend.
The Poisson regression results for multi-RI storms illustrate that, as time has progressed, more storms have begun to undergo more than one RI cycle during their lifetime. The consistent increase from all subsets of the data (1851 to 2017, 1900 to 2017, and 1950 to 2017) is further evidence in support of this upward trend of multi-RI events. These results may be indicative of changes in environmental fueling mechanisms, such as warmer SSTs (sea surface temperatures), conditions producing less vertical wind shear, or warmer air temperatures that allow for more evaporation and, thus, more precipitable water vapor.
Spatial clustering appears to be centered around the Caribbean and Gulf of Mexico waterways, especially for the initiation of RI, the LMI of RI storms, and the landfall of these storms. Although the generalization of K results indicate a trend toward CSR the higher the lag distance, the presence of RI storms within these two sub-basins is noteworthy. RI storm origin points are clustered up to 150 km. This small lag distance indicates a weak patterning of points and supports the idea that an RI storm, like any hurricane, can develop at historically conducive areas in the basin. RI genesis points’ strong presence in the Caribbean and Gulf of Mexico may speak to the available heat and moisture of the area, though there is only a weak indication of clustering for these data. However, the initial RI completion points showing a trend toward the Gulf of Mexico is supported by a higher lag distance of 500 km. This indicates that RI storms not only have a likelihood of moving toward this sub-basin but also are spatially clustered there following the completion of their first cycle of RI. RI landfall points have the highest lag distance at 750 km, illustrating an even higher likelihood of clustering around the Gulf Coast, specifically Texas and Louisiana coastlines. Due to the available datapoints demonstrating that a large proportion of RI storms originate, travel, and make landfall within these geographical spaces, further investigation into common geographical features and environmental mechanisms that may allow for these storms to originate and mature is warranted.
The temporal cluster results indicate a significant likelihood of clustering within the Caribbean and Atlantic basins but not the Gulf of Mexico. The clustering within the North Atlantic and Caribbean is potentially linked to major atmospheric cycles like ENSO and the Atlantic multidecadal oscillation. These may help to explain the groupings of hurricanes in these regions and aid in future prediction capabilities for when RI might be more likely to be triggered within hurricanes. The lack of temporal hurricane clustering within the Gulf of Mexico is further evidence in support of the consistent presence of RI hurricanes within this sub-basin. This lack of clustering within the Gulf of Mexico coupled with the steady increasing trend shown in the Poisson regression results suggests that the Gulf of Mexico has seen consistent, yearly origins of RI hurricanes throughout the record of study (1851–2017).
The results of this study highlight two important findings. The first is that the Gulf of Mexico sees the consistent presence of RI hurricanes from year to year within the Boreal summer months. The second is that the process of RI is linked to the development of higher intensity storms. Thus, communities along the Gulf Coast should prepare to see consistent hurricanes that intensify quickly, mostly with little warning, and become highly intense hurricanes. In recent years, hurricanes such as Gustav (2008), Gordon (2012), and Harvey (2017)—all Gulf of Mexico rapid intensifiers that underwent RI right before they made landfall—have caught both forecasters and affected populations by surprise, resulting in billions of dollars’ worth of damages and a multitude of preventable deaths. Therefore, these results warrant a more focused investigation of the Gulf Coast area in both physical geography and population risk management perspectives. The levels of population preparedness, as well as the understanding of hurricanes and their associated hazards, of which RI is one, are important aspects to gauge in affected communities. Once a baseline of understanding is assessed, a proper education and preparedness curriculum can then be implemented by appropriate parties based on various community needs.
This research is part of a broader goal involving improvements to the predictions of TC paths and velocities to potentially decrease the number of lives lost and the cost of damage that these storms are known to cause. However, the focus on informing and aiding the public in their preparedness and understanding of these storms should be a top priority. It is a necessity to support affected populations in fully conceptualizing the dangers and risks of hurricanes and their hazards so that they can then increase their resiliency to such storms. Future research should aim to not only explain forcing mechanisms behind the RI process, as well as macro and mesoscale influences, but also to formulate effective communication approaches that would best relay proper preparedness strategies and information to communities most affected by these hazards.
Author Contributions
The conceptualization, methodology, software, validation, formal analysis, investigation, resources, and data curation were completed by K.M.B. and J.C.T. The original draft preparation was completed by K.M.B., with edits following by J.C.T. Open-access funding acquisition was completed by K.M.B., with full support from J.C.T. All authors have read and agreed to the published version of the manuscript.
Funding
This research received open-access publishing support from the Louisiana State University Middleton Library Open-Access Fund.
Conflicts of Interest
The authors declare no conflicts of interest. The funders had no role in the design of the study; in the collection, analyses, or interpretation of data; in the writing of the manuscript; or in the decision to publish the results.
References
- Mercer, A.; Grimes, A. Atlantic Tropical Cyclone Rapid Intensification Probabilistic Forecasts from an Ensemble of Machine Learning Methods. Procedia Comp. Sci. 2017, 114, 333–340. [Google Scholar] [CrossRef]
- Senkbeil, J.C.; Brommer, D.M.; Comstock, I.J. Tropical Cyclone Hazards in the USA. Geogr. Compass 2011, 5, 544–563. [Google Scholar] [CrossRef]
- Kaplan, J.; Rozoff, C.M.; Demaria, M.; Sampson, C.R.; Kossin, J.P.; Velden, C.S. Evaluating Environmental Impacts on Tropical Cyclone Rapid Intensification Predictability Utilizing Statistical Models. J. Clim. 2015, 30, 1374–1396. [Google Scholar] [CrossRef]
- Grimes, A.; Mercer, A. Synoptic-Scale Precursors to Tropical Cyclone Rapid Intensification in the Atlantic Basin. Adv. Meteorol. 2015, 2015, 1–16. [Google Scholar] [CrossRef] [Green Version]
- Wang, C.; Wang, X.; Weisberg, R.H.; Black, M.L. Variability of tropical cyclone rapid intensification in the North Atlantic and its relationship with climate variations. Clim. Dyn. 2017, 49, 3627–3645. [Google Scholar] [CrossRef]
- Yaukey, P.H. Intensification and rapid intensification of North Atlantic tropical cylones: Geography, time of year, age since genesis, and storm characteristics. Int. J. Climatol. 2013, 34, 1038–1049. [Google Scholar] [CrossRef]
- Xu, J.; Wang, Y. A Statistical Analysis on the Dependence of Tropical Cyclone Intensification Rate on the Storm Intensity and Size in the North Atlantic. Weather Forecast. 2015, 30, 692–701. [Google Scholar] [CrossRef]
- Landsea, C.W.; Franklin, J.L. Atlantic Hurricane Database Uncertainty and Presentation of a New Database Format. Mon. Weather Rev. 2013, 141, 3576–3592. [Google Scholar] [CrossRef]
- Elsner, J.B.; Jagger, T.H. Hurricane Climatology: A Modern Statistical Guide Using R; Oxford University Press: New York, NY, USA, 2013. [Google Scholar]
- Malmstadt, J.C.; Elsner, J.B.; Jagger, T.H. Risk of Strong Hurricane Winds to Florida Cities. J. Appl. Meteor. Climatol. 2010, 49, 2121–2132. [Google Scholar] [CrossRef]
- Thom, H.C.S. The Distribution of Annual Tropical Cyclone Frequency. J. Geophys. Res. 1960, 65, 213–222. [Google Scholar] [CrossRef]
- Russell, L.R. Probability Distributions for Hurricane Effects. J. Waterw. Harb. Coast. Eng. Div. 1971, 97, 139–154. [Google Scholar]
- Elsner, J.B.; Jagger, T.H. Prediction Models for Annual U.S. Hurricane Counts. J. Clim. 2006, 19, 2935–2952. [Google Scholar] [CrossRef]
- Liboschik, T. Modeling Count Time Series Following Generalized Linear Models. Ph.D. Dissertation, TU Dortmund University, Dortmund, Germany, 13 July 2016. [Google Scholar]
- Bollerslev, T. Generalized Autoregressive Conditional Heteroskedasticity. J. Econom. 1986, 31, 307–327. [Google Scholar] [CrossRef] [Green Version]
- Baddeley, A.; Turner, R. Spatstat: An R Package for Analyzing Spatial Point Patterns. J. Stat. Softw. 2005, 12, 1–42. [Google Scholar] [CrossRef] [Green Version]
- Sheather, S.J.; Jones, M.C. A Reliable Data-based Bandwidth Selection Method for Kernel Density Estimation. J. R. Stat. Soc. B 1991, 53, 683–690. [Google Scholar] [CrossRef]
- R Core Team. R: A Language and Environment for Statistical Computing; R Foundation for Statistical Computing: Vienna, Austria, 2013; Available online: https://www.R-project.org/ (accessed on 1 December 2018).
- Perlroth, I. Hurricane Behavior as Related to Oceanographic and Environmental Conditions. Tellus 1967, 19, 258–268. [Google Scholar] [CrossRef]
- Hamill, T.M. Interpretation of Rank Histograms for Verifying Ensemble Forecasts. Mon. Weather Rev. 2001, 129, 550–560. [Google Scholar] [CrossRef]
- Gneiting, T.; Balabdaoui, F.; Raftery, A.E. Probabilistic Forecasts, calibration, and sharpness. J. R. Stat. Soc. B 2007, 69, 243–268. [Google Scholar] [CrossRef] [Green Version]
- Tallapragada, V.; Kieu, C.; Kwon, Y.; Trahan, S.; Liu, Q.; Zhang, Z.; Kwon, I.H. Structural Evaluation of the HWRF model during 2011 model implementation. Mon. Weather Rev. 2013, 142, 4308–4325. [Google Scholar] [CrossRef]
- Tallapragada, V.; Kieu, C.; Trahan, S.; Liu, Q.; Wang, W.; Zhang, Z.; Strahl, B. Real-Time Forecasts for the 2012 North-Western Pacific Typhoon Season using the NCEP Operational HWRF. Weather Forecast. 2015, 30, 1355–1373. [Google Scholar] [CrossRef]
- Jarvinen, B.R.; Neumann, C.J.; Davis, M.A.S. A Tropical Cyclone Data Tape for the North Atlantic Basin, 1886–1983: Contents, Limitations, and Uses. NOAA Tech. Memo. NWS NHC 1984, 22, 1–21. [Google Scholar]
Figure 1.
Map depicting study area and divided sub-basins.

Figure 2.
Schematic of defined rapid intensification (RI) hurricane processes using Hurricane Camille’s track in 1969 as an example. (A) Hurricane origin point, (B) RI genesis point, (C) lifetime maximum intensity (LMI) point, and (D) landfall point.
Figure 2.
Schematic of defined rapid intensification (RI) hurricane processes using Hurricane Camille’s track in 1969 as an example. (A) Hurricane origin point, (B) RI genesis point, (C) lifetime maximum intensity (LMI) point, and (D) landfall point.

Figure 3.
Monthly frequency distribution of North Atlantic (black) and Gulf of Mexico (gray) sub-basin RI counts of storms originating within each basin.
Figure 3.
Monthly frequency distribution of North Atlantic (black) and Gulf of Mexico (gray) sub-basin RI counts of storms originating within each basin.

Figure 4.
Histograms of rapidly intensifying hurricane counts per year from (a) 1851–2017, (b) 1900–2017, and (c) 1950–2017.
Figure 4.
Histograms of rapidly intensifying hurricane counts per year from (a) 1851–2017, (b) 1900–2017, and (c) 1950–2017.

Figure 5.
Probable integral transform (PIT) histogram testing for data uniformity of the generalized autoregressive conditional heteroscedasticity (GARCH) time series count model.
Figure 5.
Probable integral transform (PIT) histogram testing for data uniformity of the generalized autoregressive conditional heteroscedasticity (GARCH) time series count model.

Figure 6.
Incidence rate ratio showing (a) a 2% increase of hurricanes undergoing more than one cycle of RI in their lifetimes from 1851–2017, (b) a 1.5% increase of hurricanes undergoing more than one cycle of RI from 1900–2017, and (c) a 0.7% increase of hurricanes undergoing more than one cycle of RI from 1950–2017.

Figure 7.
Incidence rate ratios of RI storms originating within the North Atlantic sub-basin over time described by the Poisson regression model (a) between 1851–2017 and (b) depicting 1900–2017 and (c) a 0.4% factor increase from 1950 to 2017.
Figure 7.
Incidence rate ratios of RI storms originating within the North Atlantic sub-basin over time described by the Poisson regression model (a) between 1851–2017 and (b) depicting 1900–2017 and (c) a 0.4% factor increase from 1950 to 2017.


Figure 8.
Incidence rate ratios of RI storms initiating RI within the North Atlantic sub-basin over time described by the Poisson regression model (a) between 1851–2017, (b) depicting 1900–2017, and (c) 1950–2017.
Figure 8.
Incidence rate ratios of RI storms initiating RI within the North Atlantic sub-basin over time described by the Poisson regression model (a) between 1851–2017, (b) depicting 1900–2017, and (c) 1950–2017.


Figure 9.
Incidence rate ratios of RI storms originating within the Gulf of Mexico sub-basin over time described by the Poisson regression model (a) between 1851–2017, (b) depicting 1900–2017, and (c) 1950–2017.
Figure 9.
Incidence rate ratios of RI storms originating within the Gulf of Mexico sub-basin over time described by the Poisson regression model (a) between 1851–2017, (b) depicting 1900–2017, and (c) 1950–2017.

Figure 10.
Incidence rate ratios of RI storms initiating RI within the Gulf of Mexico sub-basin over time described by the Poisson regression model (a) between 1851–2017, (b) depicting 1900–2017, and (c) 1950–2017.
Figure 10.
Incidence rate ratios of RI storms initiating RI within the Gulf of Mexico sub-basin over time described by the Poisson regression model (a) between 1851–2017, (b) depicting 1900–2017, and (c) 1950–2017.

Figure 11.
(a) Kernel density analysis of RI hurricanes at their origin points (1851–2017). (b) Generalization of K graph for inhomogeneous data with the empirical (black) curve above the theoretical (red) curve for lag distances less than 150 km, indicating the likelihood of clustering up to this distance.

Figure 12.
(a) Kernel density analysis of RI hurricanes at their initial RI genesis points (1851–2017). (b) Generalization of K graph for inhomogeneous data of initial RI genesis points with the empirical (black) curve above the theoretical (red) curve for lag distances of 150 km and lower, indicating the likelihood of clustering up to this distance.

Figure 13.
(a) Kernel density analysis of RI hurricanes at their initial RI completion points (1851–2017). (b) Generalization of K graph for inhomogeneous data of initial RI completion points with the empirical (black) curve above the theoretical (red) curve for lag distances 500 km and lower, indicating the likelihood of clustering for all distances up to this point.

Figure 14.
(a) Kernel density analysis of RI hurricanes at their landfall points (1851–2017). (b) Generalization of K graph for inhomogeneous data of RI landfall points with the empirical (black) curve above the theoretical (red) curve until a 750-km lag distance and the theoretical curve over the empirical curve for all of the following lag distances.

Figure 15.
Kernel density analysis of RI hurricanes at their LMI points (1851–2017).

Figure 16.
Kernel density analysis of non-RI hurricanes at their LMI points (1851–2017).

Figure 17.
Generalization of K graph for inhomogeneous data of RI LMI points with the empirical (black) curve above the theoretical (red) curve to a lag distance of 350 km, indicating significant clustering up to this point of distance between hurricanes.
Figure 17.
Generalization of K graph for inhomogeneous data of RI LMI points with the empirical (black) curve above the theoretical (red) curve to a lag distance of 350 km, indicating significant clustering up to this point of distance between hurricanes.

Figure 18.
Tracks of the five storms that underwent 4 RI cycles with their intensity delineated by darkening red shades. (Beulah (1967), Camille (1969), Allen (1980), Gilbert (1988), and Emily (2005)).
Figure 18.
Tracks of the five storms that underwent 4 RI cycles with their intensity delineated by darkening red shades. (Beulah (1967), Camille (1969), Allen (1980), Gilbert (1988), and Emily (2005)).


Table 1.
Comparison of Gulf of Mexico, North Atlantic, and Caribbean rapid intensification (RI) storm origins and RI genesis sites.
Table 1.
Comparison of Gulf of Mexico, North Atlantic, and Caribbean rapid intensification (RI) storm origins and RI genesis sites.
| Sub-Basin | No. of RI Storm Origins | No. of RI Genesis Points |
|---|---|---|
| Gulf of Mexico | 79 | 113 |
| North Atlantic | 178 | 153 |
| Caribbean Sea | 135 | 126 |
Table 2.
Comparison of the number, average lifetime maximum intensity (LMI), minimum wind speed, and maximum windspeed of RI hurricanes and non-RI hurricanes. Category refers to the Saffir-Simpson scale.
Table 2.
Comparison of the number, average lifetime maximum intensity (LMI), minimum wind speed, and maximum windspeed of RI hurricanes and non-RI hurricanes. Category refers to the Saffir-Simpson scale.
| Type of Storm | No. of Total Storms | Average LMI (ms−1) | Minimum Wind Speed (ms−1) | Maximum Wind Speed (ms−1) |
|---|---|---|---|---|
| RI Storms | 392 | 52.02 | 28.34 | 83.8 (Cat 5) |
| Non-RI Storms | 1226 | 32.64 | 17.51 | 71.88 (Cat 5) |
Table 3.
Number of storms that have undergone 1, 2, 3, and 4 RI cycles during their lifetime.
| 1 RI Cycle | 2 RI Cycles | 3 RI Cycles | 4 RI Cycles |
|---|---|---|---|
| 300 | 75 | 12 | 5 |
Table 4.
Time series count model coefficients and confidence intervals within a Poisson distribution.
Table 4.
Time series count model coefficients and confidence intervals within a Poisson distribution.
| Years | Beta_1 Coefficient | CI (lower) | CI (upper) |
|---|---|---|---|
| 1851–2017 | 0.483 | 0.36 | 0.606 |
| 1900–2017 | 0.291 | 0.136 | 0.447 |
| 1950–2017 | 9.84−11 | −0.232 | 0.232 |
Table 5.
Coefficient estimates, p-values, and chi-square p-values on the residual deviance for RI storms originating within the North Atlantic sub-basin.
Table 5.
Coefficient estimates, p-values, and chi-square p-values on the residual deviance for RI storms originating within the North Atlantic sub-basin.
| Years | Coefficient Estimate | p-Value | Chi-Square Value |
|---|---|---|---|
| 1851–2017 | 0.013 | <0.000 | 0.008 |
| 1900–2017 | 0.012 | <0.000 | 0.010 |
| 1950–2017 | 0.005 | 0.180 | 0.04 |
Table 6.
Coefficient estimates, p-values, and chi-square p-values on the residual deviance for RI storms initiating their first cycle of RI within the North Atlantic sub-basin.
Table 6.
Coefficient estimates, p-values, and chi-square p-values on the residual deviance for RI storms initiating their first cycle of RI within the North Atlantic sub-basin.
| Years | Coefficient Estimate | p-Value | Chi-Square Value |
|---|---|---|---|
| 1851–2017 | 0.013 | <0.000 | 0.05 |
| 1900–2017 | 0.012 | <0.000 | 0.03 |
| 1950–2017 | 0.004 | 0.262 | 0.19 |
Table 7.
Coefficient estimates, p-values, and chi-square p-values on the residual deviance for RI storms originating within the Gulf of Mexico sub-basin.
Table 7.
Coefficient estimates, p-values, and chi-square p-values on the residual deviance for RI storms originating within the Gulf of Mexico sub-basin.
| Years | Coefficient Estimate | p-Value | Chi-Square Value |
|---|---|---|---|
| 1851–2017 | 0.009 | <0.000 | 0.700 |
| 1900–2017 | 0.009 | 0.02 | 0.473 |
| 1950–2017 | -0.007 | 0.278 | 0.321 |
Table 8.
Coefficient estimates, p-values, and chi-square p-values on the residual deviance for RI storms initiating their first cycle of RI within the Gulf of Mexico sub-basin.
Table 8.
Coefficient estimates, p-values, and chi-square p-values on the residual deviance for RI storms initiating their first cycle of RI within the Gulf of Mexico sub-basin.
| Years | Coefficient Estimate | p-Value | Chi-Square Value |
|---|---|---|---|
| 1851–2017 | 0.010 | <0.000 | 0.375 |
| 1900–2017 | 0.009 | 0.004 | 0.282 |
| 1950–2017 | -0.003 | 0.670 | 0.149 |
Table 9.
Observed (O) and expected (E) number of years with zero hurricanes and with 3+ hurricanes originating (o) and initiating RI (i) within the Gulf of Mexico, Caribbean, and Atlantic sub-basins.
Table 9.
Observed (O) and expected (E) number of years with zero hurricanes and with 3+ hurricanes originating (o) and initiating RI (i) within the Gulf of Mexico, Caribbean, and Atlantic sub-basins.
| Region | O(= 0) | E(= 0) | O(≥ 3) | E(≥ 3) | Chi-Square Statistic | p-Value |
|---|---|---|---|---|---|---|
| Gulf of Mexicoo | 107 | 104.7 | 1 | 2.0 | 0.59 | 0.75 |
| Caribbeano | 86 | 74.4 | 13 | 8.1 | 7.94 | 0.02 |
| Atlantico | 47 | 25.5 | 49 | 48.6 | 23.37 | <0.00 |
| Gulf of Mexicoi | 89 | 85.4 | 9 | 5.1 | 3.82 | 0.15 |
| Caribbeani | 88 | 78.5 | 12 | 6.9 | 7.60 | 0.02 |
| Atlantici | 50 | 31.2 | 44 | 39.5 | 212.2 | <0.00 |
| Multi-RI Hurricanes | 107 | 96.3 | 7 | 3.1 | 9.29 | 0.01 |
© 2020 by the authors. Licensee MDPI, Basel, Switzerland. This article is an open access article distributed under the terms and conditions of the Creative Commons Attribution (CC BY) license (http://creativecommons.org/licenses/by/4.0/).
Share and Cite
MDPI and ACS Style
Benedetto, K.M.; Trepanier, J.C. Climatology and Spatiotemporal Analysis of North Atlantic Rapidly Intensifying Hurricanes (1851–2017). Atmosphere 2020, 11, 291. https://0-doi-org.brum.beds.ac.uk/10.3390/atmos11030291
AMA Style
Benedetto KM, Trepanier JC. Climatology and Spatiotemporal Analysis of North Atlantic Rapidly Intensifying Hurricanes (1851–2017). Atmosphere. 2020; 11(3):291. https://0-doi-org.brum.beds.ac.uk/10.3390/atmos11030291
Chicago/Turabian StyleBenedetto, Kathleen M., and Jill C. Trepanier. 2020. "Climatology and Spatiotemporal Analysis of North Atlantic Rapidly Intensifying Hurricanes (1851–2017)" Atmosphere 11, no. 3: 291. https://0-doi-org.brum.beds.ac.uk/10.3390/atmos11030291
Note that from the first issue of 2016, this journal uses article numbers instead of page numbers. See further details here.