Determining the Carbon Footprint and Emission Hotspots for the Wine Produced in Cyprus


Department of Agricultural Sciences, Biotechnology and Food Science, Cyprus University of Technology, Arch. Kyprianos 30, Limassol 3036, Cyprus
*
Authors to whom correspondence should be addressed.
Atmosphere 2020, 11(5), 463; https://0-doi-org.brum.beds.ac.uk/10.3390/atmos11050463
Submission received: 20 February 2020
/
Revised: 19 April 2020
/
Accepted: 29 April 2020
/
Published: 3 May 2020
(This article belongs to the Special Issue Viticulture and Climate)
Abstract
:International agreements and policies on climate change urge for a drastic reduction in greenhouse gas (GHG) emissions to prevent a temperature rise above 2 °C at the end of the century. Determination of the product carbon footprint (CF), identifying carbon hotspots and examining ways for CF reduction is an essential step towards mitigation actions. Viticulture and winemaking are very important for the economy of Mediterranean regions, especially for the sustainability of rural areas. To determine the CF for wine, the Life Cycle Assessment (LCA) approach was adopted with system boundaries from vineyard to market. Input data were collected from 20 vineyards on the island of Cyprus, where the indigenous Xynisteri variety is cultivated and from an SME winery that uses the grapes to produce wine. The winery CF was 99,586 kg CO2-eq for 76,000 bottles produced (1.31 kg/0.75 L bottle). The uncertainty factor was determined to be ±50%, which was considered adequate for the methodology followed. The share of electrical energy was 46%, of packaging 18% and of the vineyard 16%. Fuel (transportation and heating), as well as waste management (solid and wastewater) contributed 10% each to the CF. There is potential for mitigation of the CF by replacing the bottles currently used by lighter ones, lowering the energy use and reusing a part of the solid waste as fertilizer. Research towards eco-innovation of viticulture/winemaking is essential for reducing the footprint of the sector to promote sustainable wine production.
1. Introduction
On a global scale, agriculture accounts for 20% of the anthropogenic greenhouse gas emissions (GHGE) [1]. The main sources of agricultural GHGE are fuel use, land use change, soil cultivation and nitrous oxide (N2O) emissions [2]. Carbon Footprint (CF; CO2-equivalent kg−1 of product) determination through Life Cycle Assessment (LCA) enables the quantification of the contribution of different methods of production to GHGE and is evolving towards new and additional impact categories and regionalized methods for life cycle impact assessment [3]. It allows for a comparison of CF among different products, as well as production optimization which typically results in production costs reduction [4].
Research results highlight that the CF of agricultural products can be reduced through: (1) lowering inputs (e.g., fertilizers, fuel, electricity, adapted varieties) for production, (2) increasing carbon storage in the soil, and (3) minimizing transportation distance to the markets [5]. Changing from intensive (high input) to low input agriculture reduces emissions but focus should also be placed on safeguarding global food security, by maintaining crop yields and food quality at the level required to feed an increasing global population [6]. However, in lower input cropping systems some environmental benefits are offset by lower yields [7].
The European Union (EU 28) holds a 62.9% share of the global wine production [8], followed by the USA, Argentina and Australia. Wine production in the EU averaged 16 billion L (about 21.5 billion 0.75 L bottles, data for the period 2014–2020) with 50% of the wine consumed locally, another 28% moved to intra EU markets and the remaining 22% exported globally. The area under vines in the EU is approx. 3 million ha and the EU wine trade balance was about +12 billion euros in 2018 [8].
As for other Mediterranean countries, viticulture and winemaking are essential for the economy and rural development in Cyprus. Wine grapes cover 5313 ha (2017 data [9]) yielding 20,508 tons of grapes annually (average 2013–2017 [9]). Vineyard abandonment has been a steady force acting on the rural landscape of the island, with a ca. 85% reduction in the area of vineyards from 1975 to today [9]. Most of the vineyards on the island are located in High Nature Value farmland (HNVf) areas, i.e., agricultural areas important for the conservation of species and habitats of EU importance [10]. There are currently close to 70 wineries on the island, of which 63 are SMEs (Cyprus Winemakers Association, personal communication). The wine production in Cyprus is estimated to be 11–13 million L [3] or 14.5–17.5 million 0.75 L bottles. Climate change threatens wine production on the island [11].
In the EU, emissions from the agricultural sector are estimated at 470.6 MTons CO2-eq/year, or ca. 10% of the total emissions. Although data are scarce, considering a representative CF per wine bottle equal to 1.31 kg CO2-eq [12,13], the annual emissions from the winemaking sector are estimated to be approximately 10% of the agricultural emissions. This rough estimation is provided for comparison purposes, as the winemaking is not part of the agricultural emissions and LCA reports for different wines usually have different system boundaries (e.g., cradle to grave; vineyard to packaging center; winery) and the results are not directly comparable.
The annual GHGE from the Cypriot agricultural sector were estimated to be 550,000 tons CO2-eq [14] but the contribution of the viticulture is unknown. Viticultural GHGE result mainly from cultivation practices (e.g., tillage, irrigation, fertilization, pest management) and soil processes. Potential mitigation measures consist of: a) increasing carbon sequestration in the soil and b) reducing emissions from inputs such as field-energy and agro-chemical use, through adoption of sustainable practices including the use of low input (native) varieties [5,6]. In addition, the emissions of the winemaking sector are also unknown. Electricity use in the winery and the production of glass bottles contribute a substantial portion to the wine CF [12,13].
Mitigation of the impacts of climate change, an important international goal, requires drastic reductions of GHGE to limit the temperature increase to below 2 °C at the end of this century [15]. Accordingly, governments, organizations, companies and consumers are seeking ways to limit GHGE, towards a “low C” economy. To achieve the 2 °C goal, the CF could be a meaningful indicator [4,16,17]. The low CF could be used to support local products and in addition, LCA could showcase opportunities for inputs optimization, leading to GHGE and cost reductions. The CF is considered an indicator that could be easily perceived by the consumers [13].
Accordingly, the aims of the research were: (1) To estimate for the first time the GHGE of a winery in Cyprus (at the organizational level), (2) To determine the CF of a bottle (0.75 L) of white wine produced from the indigenous Xynisteri variety, and (3) To get a rough estimate of the total GHGE from the winemaking sector in Cyprus using the studied winery as a model.
2. Materials and Methods
2.1. GHGE Calculations and System Boundaries
For the GHGE accounting the IWCCP (International Wine Carbon Calculator Protocol) and the IPCC Fifth Assessment Report (AR5) approach were used [18,19]. The IWCCP is based on the 2006 IPCC Guidelines for National Greenhouse Gas Inventories [20], the International Standard ISO 14064 1-3: 2006, for Greenhouse Gas Accounting [21] and the International Standard for Life Cycle Assessment, ISO 14044: 2006 [22]. The emission factors (EFs) were modified, as many of the original values are considered outdated and the global warming potential (GWP100) was calculated (for all the EFs provided in the following paragraphs) by the following equation [19]:
GWP100 = CO2 × 1 + CH4 × 25 + N2O × 298.
Although the AR5 proposed the use of the following GWP factors CO2 = 1, CH4 = 21, N2O = 265, we opted to use slightly different values to ensure uniformity with available EFs regarding agricultural inputs. For many of the available EFs for viticulture (e.g., fertilizers, pesticides) and winemaking (e.g., electricity, glass) the CO2-eq is estimated by using the factors adopted by the current work.
The parameters included in the GHGE calculations for the vineyard and the winery, are presented in Figure 1.
For the determination of the CF of the Cypriot wine from the native variety Xynisteri, an inventory of the inputs and outputs was performed at the (a) vineyard and (b) winery level. All the data regarding inputs (e.g., fuel, electricity, materials) and outputs (e.g., grapes, wine) were collected by interviewing the vineyard and the winery owners. Twenty (n = 20) vineyards, which deliver their grapes for the last 5 years to the winery, were used to collect the information. The inputs (e.g., energy, fertilizers, pesticides and outputs e.g., grapes, prunings) were recorded. The selected vineyards covered an area of 2.5 ha, which represented ca. 13% of the total area (19 ha) from which the winery receives grapes to make the annual quantity of Xynisteri wine. The average value (n = 20) of the inputs (e.g., fertilizers, fuel, pesticides applications) per ha was then used to estimate the total inputs for the 19 ha production area of grapes received by the winery (Supplementary Material; Table S1). The parameters that were taken into consideration for GHGE accounting are presented in Figure 1 (vineyard). The EFs and models are presented in the Section 2.2 Section 2.3 Section 2.4 Section 2.5 and Section 2.6.
For the winery, data were recorded regarding the parameters presented in Figure 1 (e.g., fuel and electricity consumption, amounts of purchased materials, water used, solid waste and wastewater amounts produced), as were provided for the Xynisteri production (as the winery produces wine from other varieties as well). In Section 2.2 Section 2.3 Section 2.4 Section 2.5 and Section 2.6, the methodology for the estimation of GHGE is provided, as well as the EFs. The model for estimating the GHGE for wine production (organizational level) was:
GHGE (kg CO2-eq) = C sequestration (vineyard) + Vineyard practices (N2O; CO2 emissions due to fertilizers and pesticides) + Fuel consumption (vineyard and winery) + Electricity (winery) + Packaging material (winery) + Waste treatment (solid and wastewater produced in the winery).
Accordingly, the emissions were categorized as Scope 1 (controlled by the winery; e.g., diesel for owned vehicles), Scope 2 (electricity from the network) and Scope 3 (controlled by others; e.g., vine growers, suppliers, leasing). At first, the emissions at the organizational level, for the production of Xynisteri white wine were determined. They were divided by the number of (0.75 L) bottles produced to get the CF for a wine bottle, since all data collected were for the production of Xynisteri white wine.
2.2. GHGE from Fuel Use
The amount of fuel used in the vineyard and the winery was measured to obtain the GHGE from this category. Emissions that arise from the combustion of fuel (see Figure 1) within mobile operating equipment including vehicles and plant or farming machinery are modelled using the following equation [18]:
CO2-eq = Fuel energy × EFfuel
The fuel energy for diesel was 0.0371 GJ/L while the EFfuel was 74.10 CO2-eq/GJ (74.224 in the case of heating diesel), respectively [23]. Diesel is only used in the winery and the vineyards. The fuel use (and the respective emissions) for soil management, fertilizers and pesticides application and transportation (deliver the grapes to the winery and visits of the farmer to the field), that are related to the vineyard practices (see Section 2.3), was modeled using the above equation, as well as the fuel that was used for heating purposes. The emissions due to fuel use for the transportation of the product to the market were also calculated by the above equation. However, emissions due to the manufacturing of the equipment used (e.g., tractors, cars) were not considered.
2.3. GHGE Due to Vineyard Related Practices
The following were modelled to calculate the CF from Xynisteri grape production: (a) fertilizer and pesticides production and application and (b) N2O emissions due to fertilizer use and soil management. C sequestration from (c) the presence of plants in the vineyard margins as well as due to (d) organic waste additions were also taken into account.
CO2 emissions from fertilizer production and application, as well as N2O emissions from fertilizer addition to the soil and soil management were considered.
The EFs for (a) fertilizer and pesticides production were obtained from Hiller et al. [24]. Farmers apply NPK and K fertilizers; the EFs for each type were 0.782 and 0.265 kg CO2-eq/kg of product applied, respectively. These EFs (especially for K) were the closest that could be obtained for the fertilizer types that are typically used in Cypriot viticulture. The EF for pesticides production was also obtained from Hillier et al. [24] and was equal to 20.5 kg CO2-eq/application per ha.
For the calculations for N2O emissions due to (b) fertilizer use and soil management the IPCC methodology was used [25], in combination with the work of Marquez et al. [26] to estimate the N2O emissions resulting from soil processes after N fertilizer addition. The N % content of the fertilizer was determined and the EF 0.0057 kg N2O-N/kg of N applied as fertilizer was used [25] to estimate the direct N2O emissions. For estimating the N2O indirect emissions due N volatilization, the EF used was 0.001 kg N2O-N/kg of N applied [25]. Leaching was assumed to be zero, as the vineyards are not irrigated [25]. The N2O-N that was estimated was converted to N2O by using the conversion factor 44/28 (1.5714). Then, the N2O amount was converted to CO2-eq by multiplying by 298.
Carbon Sequestration
The methodology proposed in IWCCP and Hillier et al. [24] was used for the estimation of C sequestration from (c) the presence of plants in the vineyard margins as well as due to (d) organic waste additions. Carbon sequestration in the vineyard was therefore attributed to CO2 capture in permanent structures (e.g., wood and roots). The EF for sequestration in wood from the IWCCP is equal to 0.35 tons CO2/ha/year. The C sequestration in roots, was obtained from Brunori et al. [27], equal to 0.57 tons CO2/ha/year (range 0.38–0.75). Therefore, C sequestration due to CO2 capture is 0.92 tons CO2/ha/year. Sequestration in leaves, shoots and clusters was not considered. An average weight of the prunings equal to 0.15 kg per vine plant was obtained by interviewing 20 vineyard owners and was used to estimate kg prunings per ha (using a planting density of 2500 plants per ha). Accordingly, 375 kg of prunings per ha were estimated. According to the IWCCP, 50% of this weight is C, and 55% of it is emitted if incorporation is practiced, as in this research. Therefore, the EF is 1.01 kg CO2-eq/kg of pruning (=0.5 × 0.55 × 44/12 = 1.01; 44/12 is the factor to get CO2 from C).
Where organic fertilizers were used, the C sequestration was estimated after Hiller et al. [24]. Accordingly, the % change in soil organic carbon is equal to 3.8% of the dry weight (d.w.) of the manure added or 4% of the compost d.w. added. In our case, the majority of the vine growers did not add organic fertilizers to their vineyards as weed management was much more difficult.
The presence of trees (e.g., almonds) and bushes (e.g., wild berries) in the margins of the vineyards selected for this study was very common, even though many winemakers in Cyprus prefer clear margins to avoid shadowing the vines (and lower production/product quality). It was estimated from the studied vineyards that 7% of their area is covered by this type of vegetation. Following the calculation approach from the IWCCP [18], the C sequestered by these plants was estimated. Accordingly, the assumption was that 50 tons of C are present per ha of margin vegetation and 15% of this amount is added to the soil over a period of 15 years [18]. The respective CO2 amount captured is 128.3 kg CO2/ha/year (= 50 × 0.07 × 0.15/15 × 44/12).
2.4. Waste Produced during the Winemaking Process
2.4.1. Solid Waste
Solid waste (co-mingled, grape marc, pomace, grape stalks and stems) that is produced in this winery ends up in landfill sites. According to the IWCCP [18], the EF for these wastes due to the respective generation of methane (GWP = 25) emitted from the landfill sites is 900 kg CO2-eq/ton of wastes. The methodology of IWCCP assumes that all the organic materials are degraded in 1 year, allowing those to be considered as part of the annual C balance. The annual amount of solid wastes produced by the winery was estimated as the average value for the last 3 years and obtained from the records of the company.
2.4.2. Wastewater
The emissions of CH4 (GWP = 25) from wastewater depend on the organic material concentration which is measured using the Chemical Oxygen Demand (COD). The emissions were estimated after the equation [18]:
where, Wgen is wastewater generated in kL or m3, CODconc is in kg/kL and R is the recovered methane (tons) and in this case is equal to zero. The amount of wastewater produced annually by the winery is 13.44 m3 and the COD value is 20,000 mg/L (obtained from company record and chemical analysis data). The equation leads to an EF equal to 0.0819 kg CO2-eq/L of wastewater produced by the winery [18].
2.5. Purchased Power (Electricity)
The emissions from the purchased power were calculated after the equation [18]:
where, EF for Cyprus is equal to 0.810 kg CO2-eq/kWh [28] and kWh is the annual electrical energy consumption by the winery (attributed to the production of Xynisteri wine), as presented in the records (average of the last 3 years) of the Electrical Authority of Cyprus.
GHGE (t CO2-eq) = EF × kWh
2.6. Packaging
For the calculations, the following products were considered: (1) bottles, (2) closures and (3) wooden products. The emissions were calculated after the equation [18]:
where, the EF was 24.6 g CO2-eq/PVC capsule. Six pack cartons (EF = 17.5 g CO2-eq/item; 12,000 items) were used for the 0.75 L bottles. Wooden pallets (EF = 0.7 kg CO2-eq/item; assuming that they are used for 10 years) were also used for storage/transportation. The above EFs were also obtained from the IWCCP. For the glass, a mix of 23% of recycled glass was used with the EF at 0.3 kg CO2-eq/kg glass and the remaining 77% was virgin glass with an EF at 0.6 kg CO2-eq/kg glass [29,30]. Wine bottle labels were not taken into account for GHGE estimation.
GHGE (t CO2-eq) = EF × number of items used.
2.7. Uncertainty Assessment
The estimation followed company data and EFs or models to determine the greenhouse gas emissions. According to the protocol followed [18] there is (1) scientific and (2) estimation uncertainty. According to our analysis, the following elements have a high degree of scientific uncertainty, as they are not based on direct measurements in the studied system: (1) N2O emissions from fertilizers applications in the vineyards, (2) soil C sequestration and (3) waste and wastewater related emissions.
Estimation uncertainty is related to model or parameter uncertainty. The first arises from incorrect or inaccurate mathematical models or inappropriate parameters. The second, arises from uncertainty associated with model inputs, such as activity data and EFs. In this research, quality assurance, quality management and uncertainty assessment was followed as presented in the IWCCP protocol [18]. In Table S2 (Supplementary Material) the EFs and model ranking are provided, in terms of uncertainty assessment, adjusted for the case of Cypriot wineries and based on the data obtained from the inventory of this study. Briefly, EFs and models used were ranked in a scale from A to E. If the “A” value characterizes an EF, it means that the approximate data range in GHGE estimation is ±5% (low uncertainty) while for the “E” value the range is ±200% (very high uncertainty). By providing a score for each EF or model used, we obtain an overall score, that characterizes the quality of the estimations for GHGE in the winery [18].
2.8. Estimation of the GHGE at Sectoral Level
After the estimation of the GHGE at the vineyard level (kg CO2-eq/ha), it was multiplied by the total area cultivated with grapes in Cyprus to get a first approximation of the total GHGE of the sector, due to grape cultivation. Similarly, the total amount of bottles of wine produced annually on the island was multiplied by the calculated GHGE per bottle to get an estimate of sectoral emissions from wine production.
3. Results
3.1. Inputs and Outputs for Wine Production
In Table 1, the materials used for wine production, for the local variety Xynisteri are presented, for the total production of the winery (76,000 0.75 L bottles and per bottle of white wine).
3.2. Wine Carbon Footprint
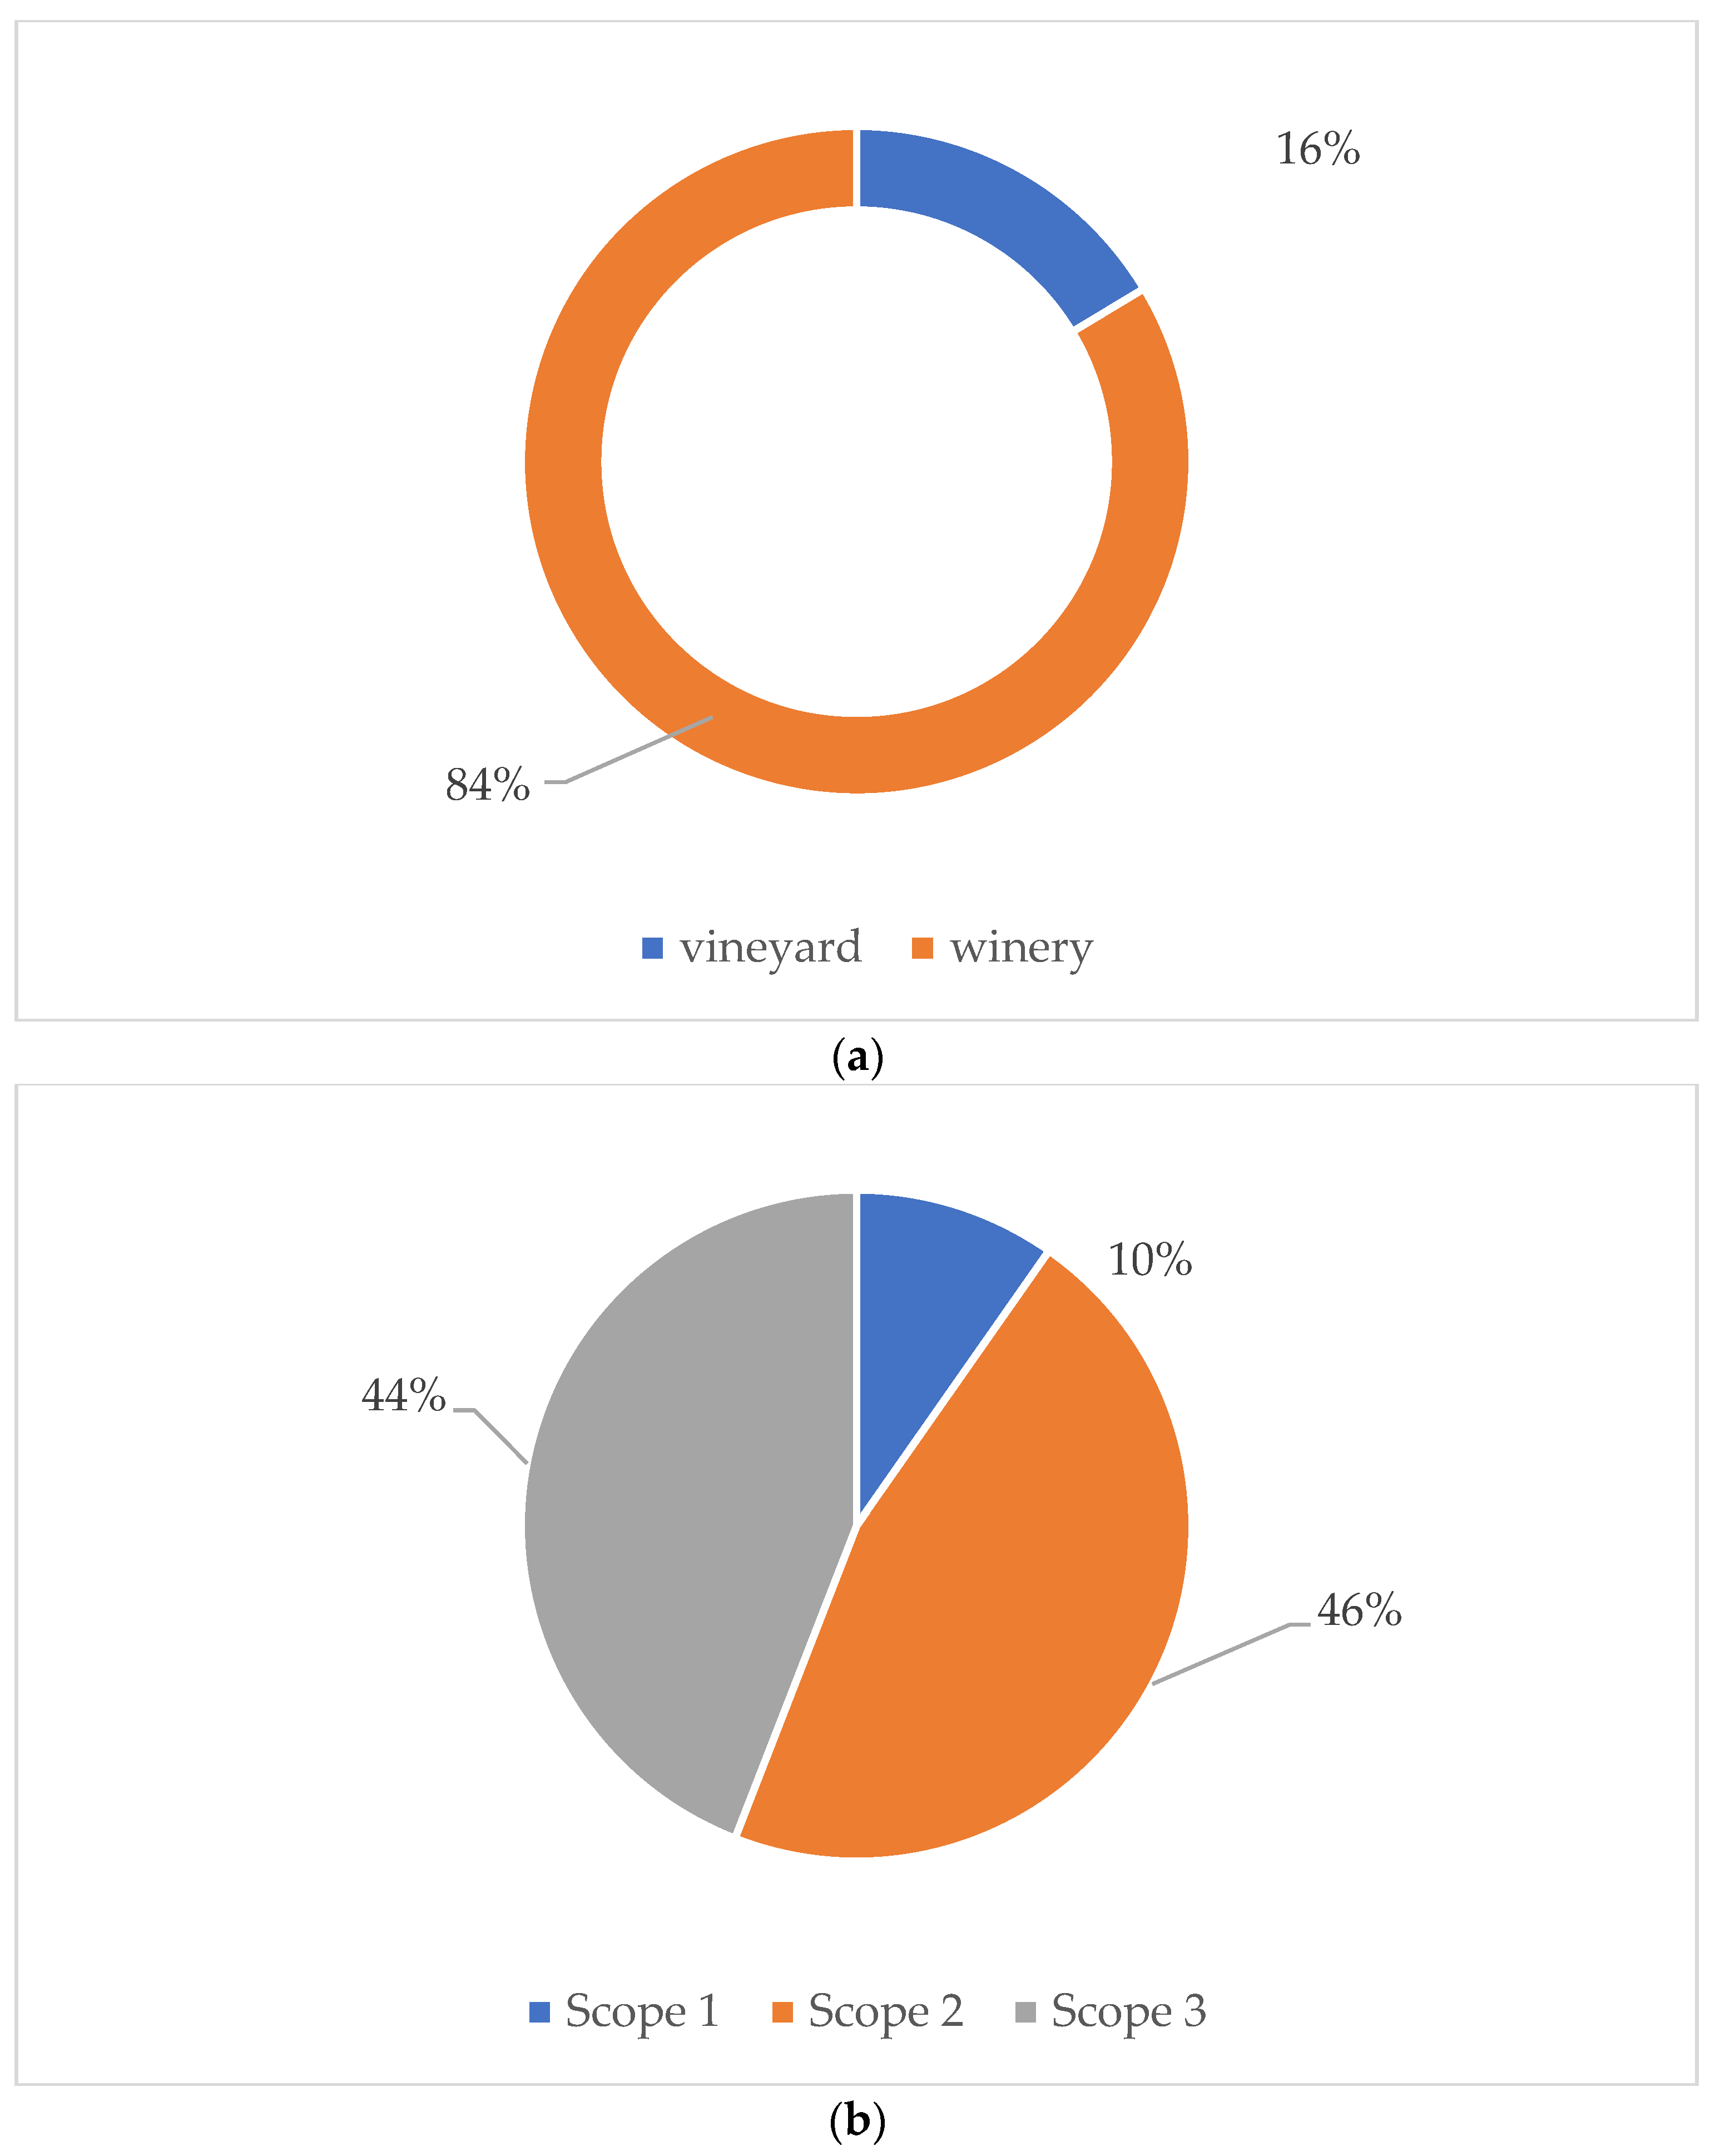
The CF of Xynisteri wine was estimated at 1.31 kg CO2-eq/0.75 L bottle. In Table 2, the results for the Xynisteri wine CF calculations are presented per emissions scope, together with the uncertainty assessment. The data are for the total wine production which is 76,000 bottles, produced from an area of 19 ha (organization level data). In Figure 2a, the emissions in the vineyards and the winery are presented for comparison purposes. In Figure 2b, the emissions per scope category are presented.
In Figure 3, the emissions are grouped in five main categories. Transportation and fuel use for heating are listed as Scope 1 (controlled by the winery), electricity as Scope 2 and the rest are Scope 3 emissions.
3.3. Using the Results to Estimate GHGE at the Sectoral Level
According to the results (Table 2 and Figure 2a) the emissions in the vineyards (19 ha) were estimated to be 16,305 kg CO2-eq or 858 kg CO2-eq/ha. The total area cultivated with (wine) grapes in Cyprus is 5313 ha (Cy Statistical Service [9]) and it is dominated by the two indigenous varieties Xynisteri and Mavro (>60%; Vine statistics—Cyprus Statistical Service [31]). The GHGE value calculated for Xynisteri in the current work was used, albeit for a very rough estimation, for all the area cultivated with vines on the island, to calculate the total emissions: ca. 4559 tons CO2-eq/year (0.8% of the emissions from the agricultural sector in Cyprus). The vineyard emissions estimate is rather conservative, as some introduced varieties have a higher CF, due to increased inputs to achieve higher yields [5].
Similarly, using the wine CF for the winery included in the current work we estimate that emissions for the production of the 11–13 million L of wine on the island [8] are between 19,195 and 22,685 tons CO2-eq/year (vineyard and winery included; 1.745 CO2-eq/L). As for the vineyard emissions, the estimate provided here does not consider variations in CF between wineries. Comparing these figures to the GHGE inventory of Cyprus [14], the sectors emissions are equivalent to that of approx. 2094 people, as the per capita emissions in the island are 10 tons CO2-eq/year. The annual GHGE from the agricultural sector of the island were estimated to be 550,000 tons CO2-eq [14], and the number estimated for the wine sector is 3.8% of this value. This is only for comparison purposes as winemaking is not part of the agricultural emissions.
4. Discussion
In this study, the IWCCP methodology [18] was applied, after GWP estimation and EF modifications, to determine the CF of the white wine Xynisteri, produced in a typical SME winery in Cyprus. This approach was selected as it allows for the GHGE calculation in the vineyard and the winery. In addition, the required data for the CF determination were relatively easy to obtain from the winery and the vine growers. The IWCCP allows for credible determination of the CF, as it follows the same principles and models as those recommended by IPCC and more importantly it was tailored to support the winemaking sector [18]. In the current work, we modified the GWP of greenhouse gases using the following conversion factors: CO2 = 1, CH4 = 25, and N2O = 298 [19]. The conversion factors that are now included in the updated IWCCP are CO2 = 1, CH4 = 21, N2O = 265, but the values do not take into account climate–carbon feedbacks [19], while our approach does. GWP factors for a 100-year period could have uncertainty as high as ±40%, as presented in the AR5 of the IPCC [19].
The GHGE were estimated at the organization level (winery) and the CF was obtained by dividing them by the amount of wine bottles produced. The estimated value for the CF in the case of the Cypriot wine Xynisteri produced under conventional agriculture methods was estimated to be 1.31 kg CO2-eq/0.75 L bottle. In the review of Pattara et al. [13] on the CF of various wines, mostly from Italy and Spain, the reported values ranged from 0.15 to 16.37 kg CO2-eq/FU (typically 0.75 L bottle). The median value was 1.31 kg CO2-eq/FU. In most cases, the system boundaries for the LCA applied were not the same and many values reported in the paper considered only some phases of the wine production (e.g., grape production, bottling, winemaking). In addition, many of the studies did not consider waste management as well as emissions from soil or C sequestration. Waste treatment and N2O emissions from the soil are important parameters for the calculation of the CF from wine (Table 2). Jourdaine et al. [32] compared LCA of bottled wines using a harmonization procedure. There, the range of the CF for several wines was from 0.88 to 6.20 kg CO2-eq. The average value for the CF was 2.17 ± 1.34 kg CO2-eq, higher than what our study reports. Tsangas et al. [33] in their study in a Greek winery reported CF values of 1.704 and 1.58 kg CO2-eq/0.75 L bottle.
The uncertainty analysis showed (Table 2) that the result for the determination of the CF for the white wine Xynisteri could be considered adequate. However, work should be done for obtaining more accurate results for the packaging materials, C sequestration in vines and N2O emissions from soils and fertilizers.
The CF of the Xynisteri wine is higher than that of many field products (e.g., onions, carrots, citrus [2,3,5]) but lower than that for peaches, cherries, field and greenhouse tomatoes, eggs and meat (chicken and pork) [2]. From this point of view, the CF for the Xynisteri wine is considered average and, in addition, there is potential for further reduction in the studied winery (e.g., input reduction where possible, using lighter glass bottles and wine bags).
Most of the SME wineries in Cyprus use buildings that are not energy efficient and under the hot summer and autumn months, when the wine is stored in the tanks under controlled temperature, the demand for electricity increases. Consequently, electricity use is the first hotspot for the Xynisteri wine CF (Figure 3; 46%). Energy analysis and improvement of the energy efficiency in wine production could be a reasonable target for CF reduction. The installation of photovoltaic panels could (indirectly) reduce the use of electrical energy and the CF. In addition, technologies that reduce the energy consumption by the coolers and lighting systems could further reduce the CF.
In addition, 18% of the wine CF is attributed to packaging material use. The average weight of the glass bottle that is used is equal to 400 g. Minimizing the weight, will lead to a further decrease in the CF [2,13] as well as increasing the amount of recycled glass in the bottles; however, this is not a direct decision of the winemakers, as it depends on consumer preferences as well as on what the market is offering. Shifting to different packaging material, e.g., wine bags, will also lead to a decrease in the CF. In this study, it was assumed that all the Xynisteri wine is bottled in 0.75 L bottles, however, depending on the market demands, a quantity between 5–15% is sold annually in wine bags (for use in restaurants).
Vineyard was the third hotspot for the GHGE. All the vineyards of the winery under study were conventionally managed and organic fertilizers were not used. Litskas et al. [5] reported the CF for Xynisteri grapes at 0.28 kg CO2-eq/kg of grapes, which is higher than the CF for grapes of the same variety estimated in the current work (0.132 kg CO2-eq/kg of grapes) [5]. The difference stems partly from methodological differences, such as the lower EF used for N2O in this study (0.0057 instead of 0.01), as well as the higher average yield of grapes in this study (6500 kg/ha) compared to that in Litskas et al. [5]. As discussed by Litskas et al. [5] there is potential for lowering emissions for Xynisteri grapes by minimizing the use of synthetic fertilizers in non-irrigated vineyards. In order for this to be achieved, further research is required to examine the effects of shifting to the use of organic instead of synthetic fertilizers, on vine nutrition and wine quality characteristics as well as soil emissions (due to manure addition and increased microbial activity). However, the Xynisteri production (e.g., examples of organic grapes), as presented in previous research [5], could be a valuable benchmark. The mitigation potential could support the promotion of the Cypriot wine as low CF—environmentally friendly. A branding strategy based on the CF could support local varieties, such as Xynisteri, which are usually grown in High Nature Value Farmland (HNVF) areas on the island.
Beyond the CF, the Product Environmental Footprint Category Rules (PEFCR) contain a set of rules to measure the life cycle environmental performance of a product. Wine was included in the PEF pilots to capture the average practices applied to produce a bottle of wine in the EU. Other than the CF, impact categories for the wine PEF include water use, eutrophication potential (fertilizer use), and biodiversity impact.
5. Conclusions
In this research, the CF for Cypriot wine was determined. According to the results, glass bottles and electricity consumption in the winery could be the main target for CF mitigation, thus lowering the emissions of the winemaking sector. Management practices, such as the use of organic material instead of synthetic fertilizers in the vineyard could lead to further reduction of the wine CF and increase C sequestration in the soil, supporting sustainable management of soils. As the larger percentage of the emissions are Scopes 2 and 3, (not directly controlled by the winery) other sectors (e.g., electricity production; glass industry) also affect the emissions from the wine sector. Uncertainty analysis suggests that more work is needed for obtaining accurate results for the packaging materials, C sequestration in vines and N2O emissions from soils and fertilizers. Furthermore, the analysis on GHGE from the wine sector of the island is based on one SME winery. While the rough estimate provided is a useful first step, more elaborate work is needed to estimate accurately sectoral GHGE.
CO2-eq emissions were determined which might be helpful to some degree to the stakeholders in Cyprus (and other Mediterranean areas), due to lack of relevant data. However, LCA is evolving to include additional impact categories and methods addressing regional variation for life cycle impact assessment. In addition to GHGE, agriculture systems are responsible for other pollutants that harm the environment. Therefore, assessment shifting to more impact categories might be more informative to policy-makers for the implementation of sustainable production strategies. The approach and the tool used in the current work cannot account for other pollutants or impact categories. In addition, for the estimations at the sectoral level, it should be taken into account that only the 1/2000 area of vineyards was sampled and practices applied in different wineries as well as inputs use (e.g., electricity, fuels) may vary.
Nevertheless, the determination of the CF for the Cypriot wine could be a first step towards reducing GHGE and developing a branding strategy around the CF. Further research is required to determine the CF in Cypriot and Mediterranean wineries to quantify the CF hotspots and promote the potential for mitigation in the sector by increasing C sequestration in the vineyards.
Supplementary Materials
The following are available online at https://0-www-mdpi-com.brum.beds.ac.uk/2073-4433/11/5/463/s1, Table S1. Inputs and outputs from the vineyards used for wine CF estimations. Table S2. Uncertainty analysis for the models and emission factors (EFs) that were used in this study. Where: A) Excellent: EF or model based on sound, independent, detailed, and verified data. B) Very Good: EF or model based on sound, independent, detailed and verified data. C) Good: (Minimum acceptable level in the long-term) EF or model based on “reasonable” and third party independently verified/certified data. D) Poor: EF or model based on internal company data. E) Emission uncertain: Further investigation/ on-site measurements required. X: Unknown: No data available.
Author Contributions
V.D.L., M.C.S. and N.T. designed the research, V.D.L. collected and analyzed the data, V.D.L. prepared the first draft of the paper, V.D.L., M.C.S. and N.T. reviewed and edited the draft and wrote the paper. Funding was provided by a grant to M.C.S. All authors have read and agreed to the published version of the manuscript.
Funding
The authors are grateful to the Cyprus Research Promotion Foundation programmes for research, technological development and innovation “RESTART 2016–2020” for financially supporting the project EcoWinery (EXCELLENCE/1216/0279). The project is co-funded by the European Regional Development Fund and the Republic of Cyprus. We also thank Cyprus University of Technology Open Access Author Fund.
Acknowledgments
We thank the two Reviewers for their detailed comments and suggestions that improved the work substantially.
Conflicts of Interest
The authors declare no conflicts of interest.
References
- Hoegh-Guldberg, O.; Jacob, D.; Taylor, M.; Bindi, M.; Brown, S.; Camilloni, I.; Diedhiou, A.; Djalante, R.; Ebi, K.; Engelbrecht, F.; et al. Chapter 3: Impacts of 1.5 °C global warming on natural and human systems. In Global Warming of 1.5 °C an IPCC Special Report on the Impacts of Global Warming of 1.5 °C Above Pre-Industrial Levels and Related Global Greenhouse Gas Emission Pathways, in the Context of Strengthening the Global Response to the Threat of Climate Change; Intergovernmental Panel on Climate Change: Geneva, Switzerland, 2018. [Google Scholar]
- Clune, S.; Crossin, E.; Verghese, K. Systematic review of greenhouse gas emissions for different fresh food categories. J. Clean. Prod. 2017, 140, 766–783. [Google Scholar] [CrossRef] [Green Version]
- Litskas, V.; Chrysargyris, A.; Stavrinides, M.; Tzortzakis, N. Water-energy-food nexus: A case study on medicinal and aromatic plants. J. Clean. Prod. 2019, 233, 1334–1343. [Google Scholar] [CrossRef]
- Michos, M.C.; Menexes, G.C.; Mamolos, A.P.; Tsatsarelis, C.A.; Anagnostopoulos, C.D.; Tsaboula, A.D.; Kalburtji, K.L. Energy flow, carbon and water footprints in vineyards and orchards to determine environmentally favourable sites in accordance with Natura 2000 perspective. J. Clean. Prod. 2018, 187, 400–408. [Google Scholar] [CrossRef]
- Litskas, V.D.; Irakleous, T.; Tzortzakis, N.; Stavrinides, M.C. Determining the carbon footprint of indigenous and introduced grape varieties through Life Cycle Assessment using the island of Cyprus as a case study. J. Clean. Prod. 2017, 156, 418–425. [Google Scholar] [CrossRef]
- Litskas, V.D.; Platis, D.P.; Anagnostopoulos, C.D.; Tsaboula, A.C.; Menexes, G.C.; Kalburtji, K.L.; Stavrinides, M.C.; Mamolos, A.P. Chapter 3—Climate change and agriculture: Carbon footprint estimation for agricultural products and labeling for emissions mitigation. In Sustainability of the Food System; Betoret, N., Betoret, E., Eds.; Academic Press: Cambridge, MA, USA, 2020; pp. 33–49. ISBN 978-0-12-818293-2. [Google Scholar]
- Kulak, M.; Nemecek, T.; Frossard, E.; Gaillard, G. How eco-efficient are low-input cropping systems in Western Europe, and what can be done to improve their eco-efficiency? Sustainability 2013, 5, 3722–3743. [Google Scholar] [CrossRef] [Green Version]
- Wine Market Observatory. Available online: https://ec.europa.eu/info/food-farming-fisheries/farming/facts-and-figures/markets/overviews/market-observatories/wine_en (accessed on 5 February 2020).
- Statistical Service – Agricult - Key Figures. Available online: https://www.mof.gov.cy/mof/cystat/statistics.nsf/agriculture_51main_en/agriculture_51main_en?OpenForm&sub=1&sel=2 (accessed on 5 February 2020).
- Zomeni, M.; Martinou, A.; Stavrinides, M.; Vogiatzakis, I. High nature value farmlands: Challenges in identification and interpretation using Cyprus as a case study. Nat. Conserv. 2018, 31, 53–70. [Google Scholar] [CrossRef] [Green Version]
- Chrysargyris, A.; Xylia, P.; Litskas, V.; Mandoulaki, A.; Antoniou, D.; Boyias, T.; Stavrinides, M.; Tzortzakis, N. Drought stress and soil management practices in grapevines in Cyprus under the threat of climate change. J. Water Clim. Chang. 2018, 9, 703–714. [Google Scholar] [CrossRef] [Green Version]
- Vázquez-Rowe, I.; Rugani, B.; Benetto, E. Tapping carbon footprint variations in the European wine sector. J. Clean. Prod. 2013, 43, 146–155. [Google Scholar] [CrossRef]
- Pattara, C.; Russo, C.; Antrodicchia, V.; Cichelli, A. Carbon footprint as an instrument for enhancing food quality: Overview of the wine, olive oil and cereals sectors: Carbon footprint in the wine, olive oil and cereals sectors. J. Sci. Food Agric. 2017, 97, 396–410. [Google Scholar] [CrossRef] [PubMed]
- Cyprus GHG and Energy 2017 Country Profile—European Environment Agency. Available online: https://www.eea.europa.eu/themes/climate/trends-and-projections-in-europe/trends-and-projections-in-europe-2017/country-profiles-greenhouse-gases-and-energy/cyprus-ghg-and-energy-country-profile.pdf/view (accessed on 4 February 2020).
- The Paris Agreement | UNFCCC. Available online: https://unfccc.int/process-and-meetings/the-paris-agreement/the-paris-agreement (accessed on 5 February 2020).
- Vanclay, J.K.; Shortiss, J.; Aulsebrook, S.; Gillespie, A.M.; Howell, B.C.; Johanni, R.; Maher, M.J.; Mitchell, K.M.; Stewart, M.D.; Yates, J. Customer response to carbon labelling of groceries. J. Consum. Policy 2011, 34, 153–160. [Google Scholar] [CrossRef]
- Hartikainen, H.; Roininen, T.; Katajajuuri, J.-M.; Pulkkinen, H. Finnish consumer perceptions of carbon footprints and carbon labelling of food products. J. Clean. Prod. 2014, 73, 285–293. [Google Scholar] [CrossRef]
- International Wine Carbon Calculator Protocol V1.2.pdf. Available online: http://www.ipw.co.za/content/pdfs/ghg/eng/International_Wine_Carbon_Calculator_Protocol_V1.2.pdf (accessed on 5 February 2020).
- AR5 Climate Change 2013: The Physical Science Basis—IPCC. Available online: https://www.ipcc.ch/working-group/wg1/ (accessed on 29 March 2020).
- IPCC—Task Force on National Greenhouse Gas Inventories. Available online: https://www.ipcc-nggip.iges.or.jp/public/2006gl/ (accessed on 29 March 2020).
- ISO 14064-1:2006(en), Greenhouse Gases—Part 1: Specification with Guidance at the Organization Level for Quantification and Reporting of Greenhouse Gas Emissions and Removals. Available online: https://www.iso.org/obp/ui/#iso:std:iso:14064:-1:ed-1:v1:en (accessed on 30 March 2020).
- ISO—ISO 14044:2006—Environmental Management—Life Cycle Assessment—Requirements and Guidelines. Available online: https://www.iso.org/standard/38498.html (accessed on 3 March 2020).
- Jurich, K. CO2 Emission Factors for Fossil Fuels. Umwelt Bundesamt, 2016, 48. Available online: https://www.umweltbundesamt.de/sites/default/files/medien/1968/publikationen/co2_emission_factors_for_fossil_fuels_correction.pdf (accessed on 29 March 2020).
- Hillier, J.; Walter, C.; Malin, D.; Garcia-Suarez, T.; Mila-i-Canals, L.; Smith, P. A farm-focused calculator for emissions from crop and livestock production. Environ. Model. Softw. 2011, 26, 1070–1078. [Google Scholar] [CrossRef]
- De Klein, C.; Novoa, R.S.A.; Ogle, S.; Smith, K.A.; Rochette, P.; Wirth, T.C.; McConkey, B.G.; Mosier, A.; Rypdal, K. Guidelines for National Greenhouse Gas Inventories, Chapter 11: N2O Emissions from Managed Soils, and CO2 Emissions from Lime and Urea Application; IPCC: Geneva, Switzerland, 2006. [Google Scholar]
- Marques, F.J.M.; Pedroso, V.; Trindade, H.; Pereira, J.L.S. Impact of vineyard cover cropping on carbon dioxide and nitrous oxide emissions in Portugal. Atmos. Pollut. Res. 2018, 9, 105–111. [Google Scholar] [CrossRef]
- Brunori, E.; Farina, R.; Biasi, R. Sustainable viticulture: The carbon-sink function of the vineyard agro-ecosystem. Agric. Ecosyst. Environ. 2016, 223, 10–21. [Google Scholar] [CrossRef]
- Moro, A.; Lonza, L. Electricity carbon intensity in European Member States: Impacts on GHG emissions of electric vehicles. Transp. Res. Part D Transp. Environ. 2018, 64, 5–14. [Google Scholar] [CrossRef] [PubMed]
- Schmitz, A.; Kamiński, J.; Maria Scalet, B.; Soria, A. Energy consumption and CO2 emissions of the European glass industry. Energy Policy 2011, 39, 142–155. [Google Scholar] [CrossRef]
- U.S. Environmental Protection Agency. Documentation for Greenhouse Gas Emission and Energy Factors Used in the Waste Reduction Model (WARM); Containers, Packaging, and Non-Durable Good Materials Chapters; Office of Resource Conservation and Recovery: Washington DC, USA, 2016.
- Statistical Service - Agriculture – Publications. Available online: https://www.mof.gov.cy/mof/cystat/statistics.nsf/agriculture_51main_en/agriculture_51main_en?OpenForm&sub=1&sel=4 (accessed on 5 February 2020).
- Jourdaine, M.; Loubet, P.; Trebucq, S.; Sonnemann, G. A detailed quantitative comparison of the life cycle assessment of bottled wines using an original harmonization procedure. J. Clean. Prod. 2020, 250, 119472. [Google Scholar] [CrossRef]
- Tsangas, M.; Gavriel, I.; Doula, M.; Xeni, F.; Zorpas, A.A. Life Cycle Analysis in the Framework of Agricultural Strategic Development Planning in the Balkan Region. Sustainability 2020, 12, 1813. [Google Scholar] [CrossRef] [Green Version]
Figure 1.
Operation process boundaries for the vineyard and winery and parameters accounted for greenhouse gas emissions (GHGE) calculation.
Figure 1.
Operation process boundaries for the vineyard and winery and parameters accounted for greenhouse gas emissions (GHGE) calculation.

Figure 2.
(a) Contribution of the vineyard and the winery to the total emissions (total = 99,586 kg CO2-eq). (b) Emissions per scope category. Scope 1: emissions controlled by the winery (9685 kg CO2-eq); Scope 2: electricity purchase from the national network (45,993 kg CO2-eq) and Scope 3: factors controlled by others (e.g., vinegrowers, waste management—(43,908 kg CO2-eq)).

Figure 3.
Contribution of the vineyard, transportation and fuels, electricity, packaging and wastes to the total emissions (kg CO2-eq) for the production of Xynisteri white wine.
Figure 3.
Contribution of the vineyard, transportation and fuels, electricity, packaging and wastes to the total emissions (kg CO2-eq) for the production of Xynisteri white wine.


Table 1.
Inventory for the inputs and outputs at the organizational level and per bottle of white wine produced from the variety Xynisteri.
Table 1.
Inventory for the inputs and outputs at the organizational level and per bottle of white wine produced from the variety Xynisteri.
| Input/Output | Organizational Level | Value per Bottle |
|---|---|---|
| Grape production | 95,000 kg | 1.25 kg |
| Fertilizers (typically 15-15-15 YaraMila Universe and Patenkali (0-0-30) once/3–4 years) | 11,400 kg product/year (1710 kg N, 1710 kg P2O5 and 1710 kg K2O/year) | 1.18 g N; 1.18 g P2O5; 1.18 g K2O |
| Pesticides application (sulphur and insecticides) | 608 applications | 0.008 applications |
| Vineyard diesel (Cultivation (hand driven rotary cultivator) and pruning machine) | 828.8 L | 0.0109 L |
| Irrigation water | Non-irrigated vineyards | - |
| Vineyard waste (prunings) | 7125 kg | 0.094 kg |
| Electricity in the winery (for the production of 76,000 bottles of white wine). | 56,782 kWh/year | 0.747 kWh |
| Stationary combustion (heaters in the winery) | 207.2 L/year | 0.003 L |
| Processing water (wastewater) | 13,440 L (COD 20,000 mg/L) | 0.177 L |
| Solid waste to landfill (Grape marc, pomace, grape stalks and stems) | 9200 kg | 0.121 kg |
| Packaging material | 76,000 items; 400 g glass per bottle (23% recycled glass); 1 PVC closure per bottle; 12,000 cartons (1200 kg paper) | One 400 g glass bottle; 1 PVC closure; 0.0158 kg paper |
| Wooden pallets | 840 kg wood (typical 6 years life = 143.33 kg wood/year) | 0.002 kg |
| Transportation (heavy track, light truck)—diesel consumption | 3315.2 L diesel/year | 0.44 |
Table 2.
Total emissions for the annual Xynisteri production in the winery presented per emission scope. For the uncertainty analysis (emission factor (EF) or model rank) see also Table S2 (Supplementary Material).
Table 2.
Total emissions for the annual Xynisteri production in the winery presented per emission scope. For the uncertainty analysis (emission factor (EF) or model rank) see also Table S2 (Supplementary Material).
| Scope | Parameter | Total Emissions (kg CO2-eq) for 76,000 (0.75L) Bottles of Xynisteri White Wine | EF or Model Rank | Approx. Data Range |
|---|---|---|---|---|
| 1 | Fuel (mobile) transportation | 9114 | A | ±5% |
| Stationary combustion (heaters) | 571 | B | ±20% | |
| 2 | Electricity | 45,993 | A | ±5% |
| 3 | Fuel (mobile) vineyard | 2278 | A | ±5% |
| CO2 sequestration (vines) | −17,480 | D | ±100% | |
| Prunings | 7196 | D | ±100% | |
| Fertilizers production | 8915 | A | ±5% | |
| Pesticides production/application | 12,464 | C | ±50% | |
| N2O emissions (direct from N fertilizers and indirect from N volatilization) | 5370 | D | ±100% | |
| Plants in the vineyard margin | −2438 | E | ±200% | |
| Packaging | 18,222 | C | ±50% | |
| Waste (solid and wastewater) management | 9381 | B | ±20% | |
| Total | 99,586 | C | ±49.5% | |
| kg CO2/0.75 L glass bottle of Xynisteri wine | =99,586/76,000 = 1.31 kg CO2 | |||
© 2020 by the authors. Licensee MDPI, Basel, Switzerland. This article is an open access article distributed under the terms and conditions of the Creative Commons Attribution (CC BY) license (http://creativecommons.org/licenses/by/4.0/).
Share and Cite
MDPI and ACS Style
Litskas, V.D.; Tzortzakis, N.; Stavrinides, M.C. Determining the Carbon Footprint and Emission Hotspots for the Wine Produced in Cyprus. Atmosphere 2020, 11, 463. https://0-doi-org.brum.beds.ac.uk/10.3390/atmos11050463
AMA Style
Litskas VD, Tzortzakis N, Stavrinides MC. Determining the Carbon Footprint and Emission Hotspots for the Wine Produced in Cyprus. Atmosphere. 2020; 11(5):463. https://0-doi-org.brum.beds.ac.uk/10.3390/atmos11050463
Chicago/Turabian StyleLitskas, Vassilis D., Nikolaos Tzortzakis, and Menelaos C. Stavrinides. 2020. "Determining the Carbon Footprint and Emission Hotspots for the Wine Produced in Cyprus" Atmosphere 11, no. 5: 463. https://0-doi-org.brum.beds.ac.uk/10.3390/atmos11050463
Note that from the first issue of 2016, this journal uses article numbers instead of page numbers. See further details here.