Article

Assessing iMET-XQ Performance and Optimal Placement on a Small Off-the-Shelf, Rotary-Wing UAV, as a Function of Atmospheric Conditions

by
Sytske K. Kimball
1,*,
Carlos J. Montalvo
2 and
Madhuri S. Mulekar
3
1
Department of Earth Sciences, University of South Alabama, 5871 USA North Drive, Mobile, AL 36688, USA
2
Department of Mechanical Engineering, University of South Alabama, 150 Student Services Drive, Mobile, AL 36688, USA
3
Department of Mathematics and Statistics, University of South Alabama, 411 University Blvd North, Mobile, AL 36688, USA
*
Author to whom correspondence should be addressed.
Submission received: 26 May 2020 / Revised: 16 June 2020 / Accepted: 19 June 2020 / Published: 20 June 2020

Abstract

:
The accuracy and precision of iMET-XQ (InterMET Inc., Grand Rapids, MI, USA) temperature measurements in ten different locations on an off-the shelf rotary-wing unmanned aerial vehicle (rw-UAV) were assessed, as a function of atmospheric conditions. The rw-UAV hovered near an instrumented South Alabama Mesonet tower. The mean ± standard deviation of all the temperature differences between the tower and the ten iMET-XQ sensors for all experiments are −0.23 °C ±0.24 °C. Both the UAV and the environment influence the accuracy and precision of the iMET-XQ temperature measurements. Heat generated by the electronic components within the UAV body has a significant influence on the iMET-XQ temperature measurements, regardless of solar radiation conditions, and is highly dependent on wind direction. Electronic components within the UAV body heat up and can cause sensors downwind from the UAV body to record temperatures that are too warm, even if the sensors are aspirated by propeller wash. iMET-XQ sensors placed on rotor arms not near UAV body heat sources, and properly aspirated by propeller wash, perform well. Measurements from iMET-XQ sensors suspended below the UAV are also accurate. When using an off-the-shelf UAV for atmospheric temperature sensing, the electronic components inside the body of the UAV must be properly located. It is recommended that multiple sensors are placed on the UAV. Sensor redundancy will mitigate data loss in case of malfunction during flight and the identification of poorly performing sensors.

1. Introduction

The recent development of low-cost, easy to use, small unmanned aerial vehicles (UAVs) and miniaturized thermodynamic sensors, has enormous potential to help close the gap in meteorological observations in the atmospheric boundary layer (ABL) [1,2,3]. This gap exists because surface-based towers are not high enough, balloons are only launched twice daily, most surface-based remote sensing instruments provide a vertical profile only, and radar does not provide thermodynamic information. An advantage of small UAVs is their ability to fly in airspaces or situations that are too difficult or dangerous for manned aircraft, such as, for example, in and around thunderstorms [4] or at low heights above ground level [5]. UAVs are perfectly suited for taking observations in sensitive ecosystems [6]. An advantage of rotary wing UAVs over their fixed-wing cousins is their capability to (1) hover; (2) ascend vertically at a fixed horizontal location [2,4]; and (3) land on a small spatial footprint [2]. Other scenarios where UAVs can play a role in meteorological sensing are (1) to determine atmospheric stability and wind characteristics in the event of dangerous gas release [6,7]; (2) monitoring freezing conditions around temperature-sensitive crops like citrus; (3) investigating micro-climates in farm fields for precision agriculture; (4) observing the structure of meteorological phenomena like sea breezes and cold fronts; (5) characterizing atmospheric turbulence [8,9]; (6) studying convection initiation [9,10]; (7) investigating atmospheric boundary layer transitions, inversions, and vertical profiles [9,11,12]; (8) numerical weather model validation and initialization [11]; and (9) measuring surface-sensible heat fluxes [13,14]. Numerous UAV-based atmospheric applications exist and over the past four years, several researchers have investigated the validation of sensors in laboratory and field settings as well as optimal sensor placement on the UAV platform as a function of external (to the sensor) heating sources and aspiration. This study will focus on small, rotary-wing UAVs (rw-UAVS) used to measure air temperature. Hence, only the results from prior studies emphasizing rw-UAVs and temperature sensors are summarized here.
With the development of UAV technology comes the need to improve the knowledge of the best practices for accurate UAV-based measurement [4]. The calibration of meteorological sensors is typically performed under controlled laboratory conditions [10]. However, calibration or reliance on manufacturer specifications is not sufficient for determining the accuracy and reliability of meteorological measurements made by UAVs, because they do not account for the impacts of turbulence, solar heating, sensor placement on the platform, and the extent to which the measurements represent actual conditions [10]. Uncertainties can arise from how atmospheric sensors are mounted on the UAV platform [4]. For example, rotary-wing UAVs can introduce the localized mixing of the atmosphere by the propellers, which alters the environment being sampled. Another concern is that the lower speeds of rotary-wing UAVs reduces the airflow and aspiration of the sensors, contributing to heating from the direction of the sun [4]. Therefore, the validation of UAV-based sensors is another critical step towards acquiring accurate UAV-based measurements [10]. Validation is performed by comparing measurements from UAV-based sensors to collocated measurements from independent observing systems of generally accepted high quality.
Comparisons between temperature measurements from rw-UAVs and instrumented towers have been performed in several studies [1,4,8,14]. Experiment details are summarized in Table 1, mean and standard deviations are given in Table 2. In several cases, the iMET-XQ (InterMET Inc., Grand Rapids, MI, USA) sensor was used. Details about this sensor are presented in Section 2. In refs. [8,14] the rw-UAV hovered close to the instrumented tower and cold biases were found (Table 2). In ref. [1], the UAVs flew vertical profiles at 300 m from the instrumented tower and the temperature averages of the lowest 5 m of the ascending legs of the vertical profiles were compared to a tower sensor at 2 m above ground level (AGL). In this case, a warm bias was the result. The comparisons described in ref. [4] are unique in that multiple UAVs were used with multiple sensor types and configurations. Some sensors were placed in radiation shields, some were aspirated (usually by rotor wash), some sensors were both shielded and aspirated, and some were neither. Overall, a warm bias was found for the UAV-based sensors (Table 2); shielded but unaspirated sensors showed the warmest bias, sensors that were neither shielded nor aspirated showed a slightly smaller warm bias, and sensors that were both shielded and aspirated reported the smallest warm bias. Sensors that were unshielded but aspirated showed a small cool bias. The warm biases were attributed to the absorption of direct solar radiation from the sun as well as infrared radiation from the surface, the atmosphere, or warm UAV components (e.g., motors or batteries).
Comparison with rawinsonde measurements were reported in refs. [1,10], and the results are shown in Table 2. The biases were warm in three out of four experiments. In ref. [10], the rw-UAV temperature measurements were compared against both a rawinsonde system and an atmospheric emitted radiance interferometer (AERI). The warm biases found in both experiments were attributed to the flow of warm air from the multiple rotary motors of the UAVs.
In ref. [1], two types of experiments were performed to assess the precision (or uncertainty bounds) of the iMET-XQ sensors: (1) by comparing the measurements from two iMET-XQ sensors on the same UAV and (2) by comparing the measurements from two iMET-XQ sensors on two different UAVs flown approximately 50 m apart. The former resulted in temperature differences between the two iMET-XQ sensors that were almost all within ±0.2 °C. In the second experiment, mean differences in temperature between the two UAVs ranged between 0.12 and 0.39 °C.
When measuring temperature, sensors need to be shielded from solar radiation which can bias temperature measurements according to [15] by 1 °C or more in weak ambient winds. On towers, the radiation shields are either aspirated by a mechanical fan or by the ambient wind. Radiosondes are ventilated by the relative airflow during the flight [16,17]. On rw-UAVs, sensors can be aspirated by rotor downwash or fans [2,3]. Past studies indicate that shielding on rw-UAVs may not be critical [4] due to sufficient aspiration from rotor wash just like radiosondes being aspirated by airflow. However, no clear consensus exists and experiments are ongoing as summarized below.
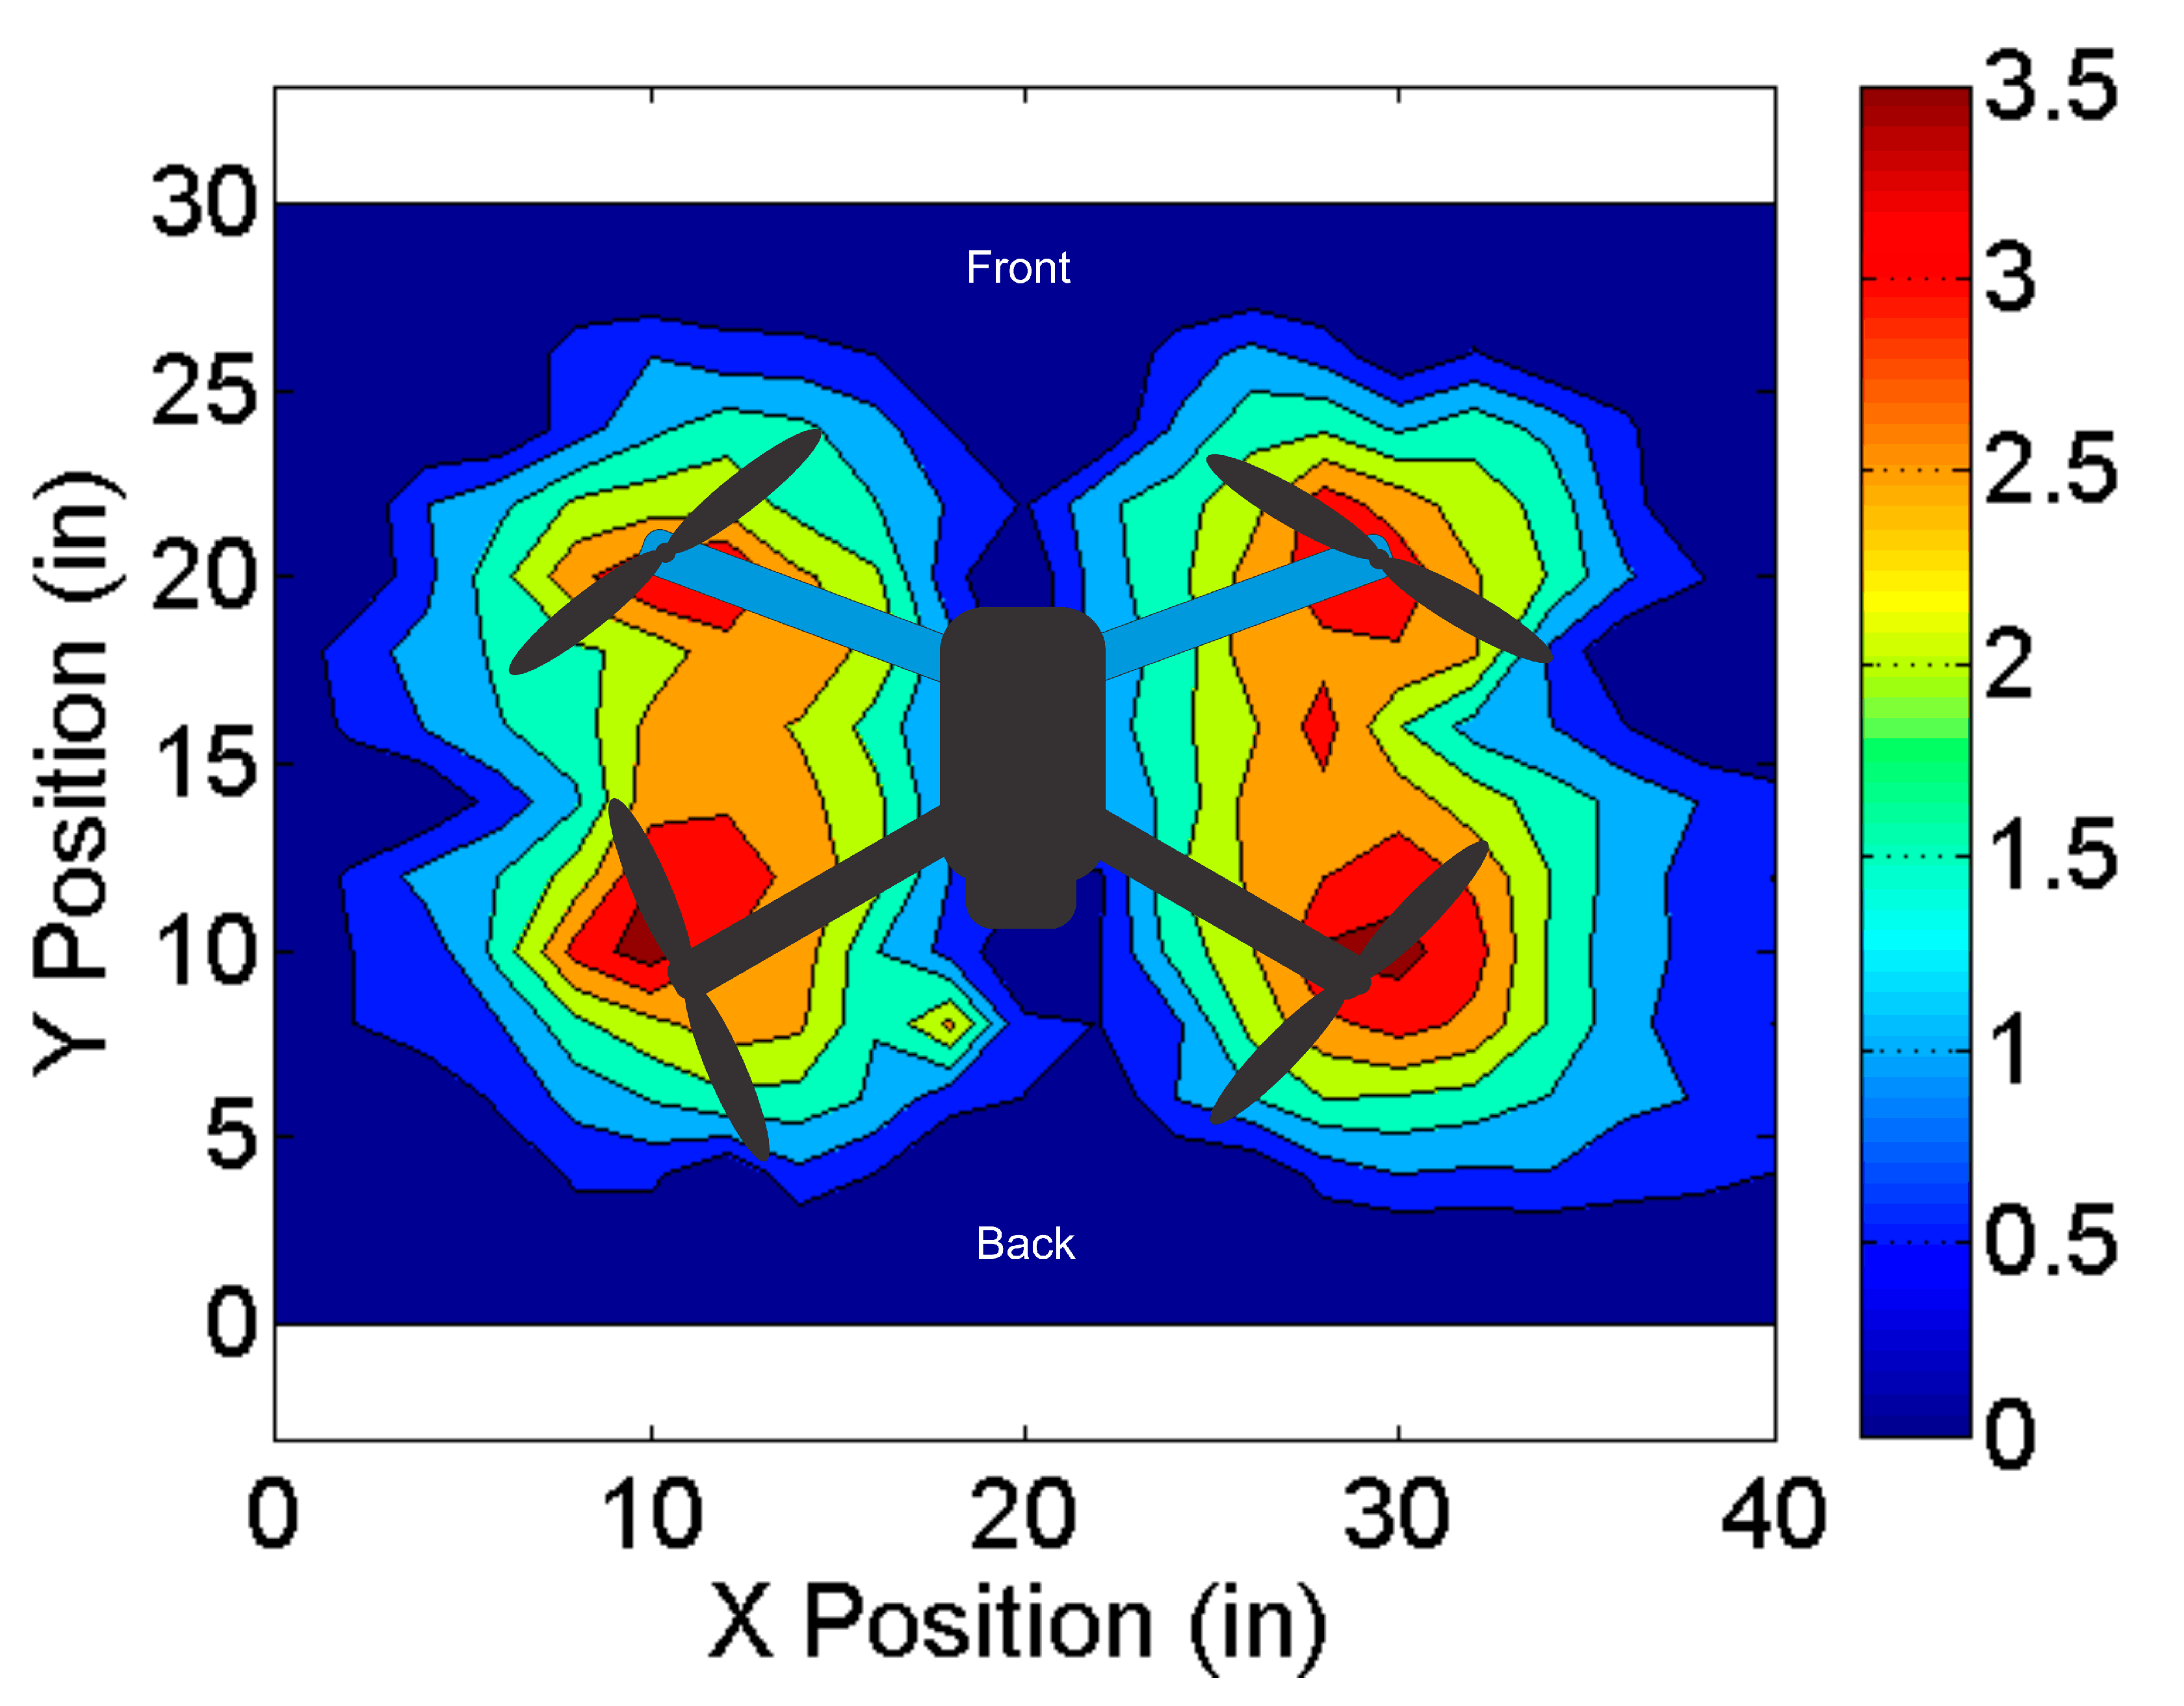
The effects of rotor wash from a customized rw-UAV and shielding on temperature observations were tested in an indoor chamber in ref. [2]. Underneath the propellers, temperatures were close to the reference temperature due to the rotor wash. Directly underneath the propeller motor mount, the absence of rotor wash led to warmer temperatures than the reference, as a result of the self-heating of the thermistors and hot air being advected from the motors. Between the propellers, the rotor wash was also close to zero and the test sensor was slightly warmer than the reference due to the sensor self-heating. Close to the outer edge of the circle drawn by the propeller tip, the test sensor was affected by a warm stream of air that was attributed to frictional heating at the tip of the propellers. Less sensor heating was experienced when the test sensor was placed in a radiation shield. The recommended optimal position for measuring environmental temperatures with an rw-UAVs is in a solar radiation shield about 5–10 cm below the propeller and one third of the length of the propeller from the propeller tip [2]. This location provides ample aspiration while avoiding warm air streams from the motor or the propeller tips. It was concluded that using the rotor wash was an effective solution for aspirating sensors without having to design and build a custom UAV.
Further investigation into UAV-based sensor aspiration and shielding was conducted in the field by ref. [3], using thermistors and a customized rw-UAV. Two methods to minimize the effects from non-atmospheric heat sources (motors, batteries, the UAV body, and frictional heating at the propeller tips) were proposed. In the first method, the temperature sensors were placed in a cylindrical plastic solar shield and aspirated by the propellers. In the second method, the sensors were placed inside an L-duct on the front end of the UAV and aspirated by a fan. The thermistors in the L-duct configuration exhibited a higher precision and accuracy than those aspirated by the rotor wash [3]. However, the L-duct configuration was not optimal for observing temperature on a UAV, because (1) the sensor response time increased significantly; (2) the materials of both the UAV body and the solar shield may absorb heat; and (3) the ducts and potential fans add to the weight of the UAV, possibly reducing its flight endurance. A fan would also add to the power consumption, reducing flight endurance even further. It was concluded that aspiration from propellers may still be a viable solution, especially in conditions of weak solar heating and by orienting the UAV so that the temperature sensor is located upwind from its body.
Besides the UAV itself, meteorological conditions also influence temperature measurements taken by the rw-UAVs [3]. The influence from the wind direction on temperature sensor placement was investigated in ref. [1]. Sensors located on the downwind side of the UAV body recorded warmer temperatures than the sensors that were facing into the wind due to a reduction in the aspiration of the sensor on the downwind side of the UAV. The effects from both the wind direction and solar radiation were investigated in ref. [3]. Sensors on the sunny side of a rw-UAV measured warmer temperatures than sensors on the side shaded by the UAV body, even if aspirated by the propeller wash and placed in a cylindrical radiation shield. The sensors on the sunny side also recorded warmer temperatures than a nearby tower. It was concluded that when the radiation shields were illuminated by the sun, they absorbed solar radiation as heat and did not effectively protect the sensors inside. In low solar radiation conditions, the sensors on both sides of the UAV measured similar temperatures that agreed well with the measurements from the tower. To investigate the effects of wind direction, the UAV was oriented so that the wind impinged on it from one side and so that all the sensors were exposed to direct sunlight. Measurements from the sensors on the upwind side were in good agreement with the tower measurements. The downwind side sensors measured warmer temperatures. The authors suggested that the grey plastic shell of the UAV body may have absorbed heat from the sun that was subsequently transported towards the downwind sensors. Additionally, heat from motors and propeller friction may have also been transported downwind.
The current study will build upon these important prior results as follows. First, iMET-XQ sensors with aluminum coating will be used. Many more flight experiments will be conducted, capturing a wide variety of meteorological conditions and providing statistically significant data sets. Ten different locations on the UAV will be tested, including suspended sensors. Stationary field testing was addressed in ref. [18]. In the current paper, optimal sensor placement on the UAV is examined.

2. Data and Methodology

In this study, the iMET-XQ (InterMET Inc., Grand Rapids, MI, USA) temperature sensor performance on a rw-UAV was investigated. The versions of the iMET-XQ sensors used in these experiments are coated in aluminum to reduce the warming effects from solar and terrestrial radiation. This is based on radiosonde technology; the radiosondes are ventilated by the relative airflow during the flight [11,12]. The manufacturer specified the accuracy of the iMET-XQ bead thermistor sensor is ±0.3 °C and the response time is 2 s. Each iMET-XQ has its own GPS (GNSS using the GPS, Galileo, GLONASS, and BeiDou constellations) module, a Shenzhen PKCELL rechargeable lithium-ion battery, and a flash memory card for recording data. Data are downloaded manually after the flight using software provided by the manufacturer.
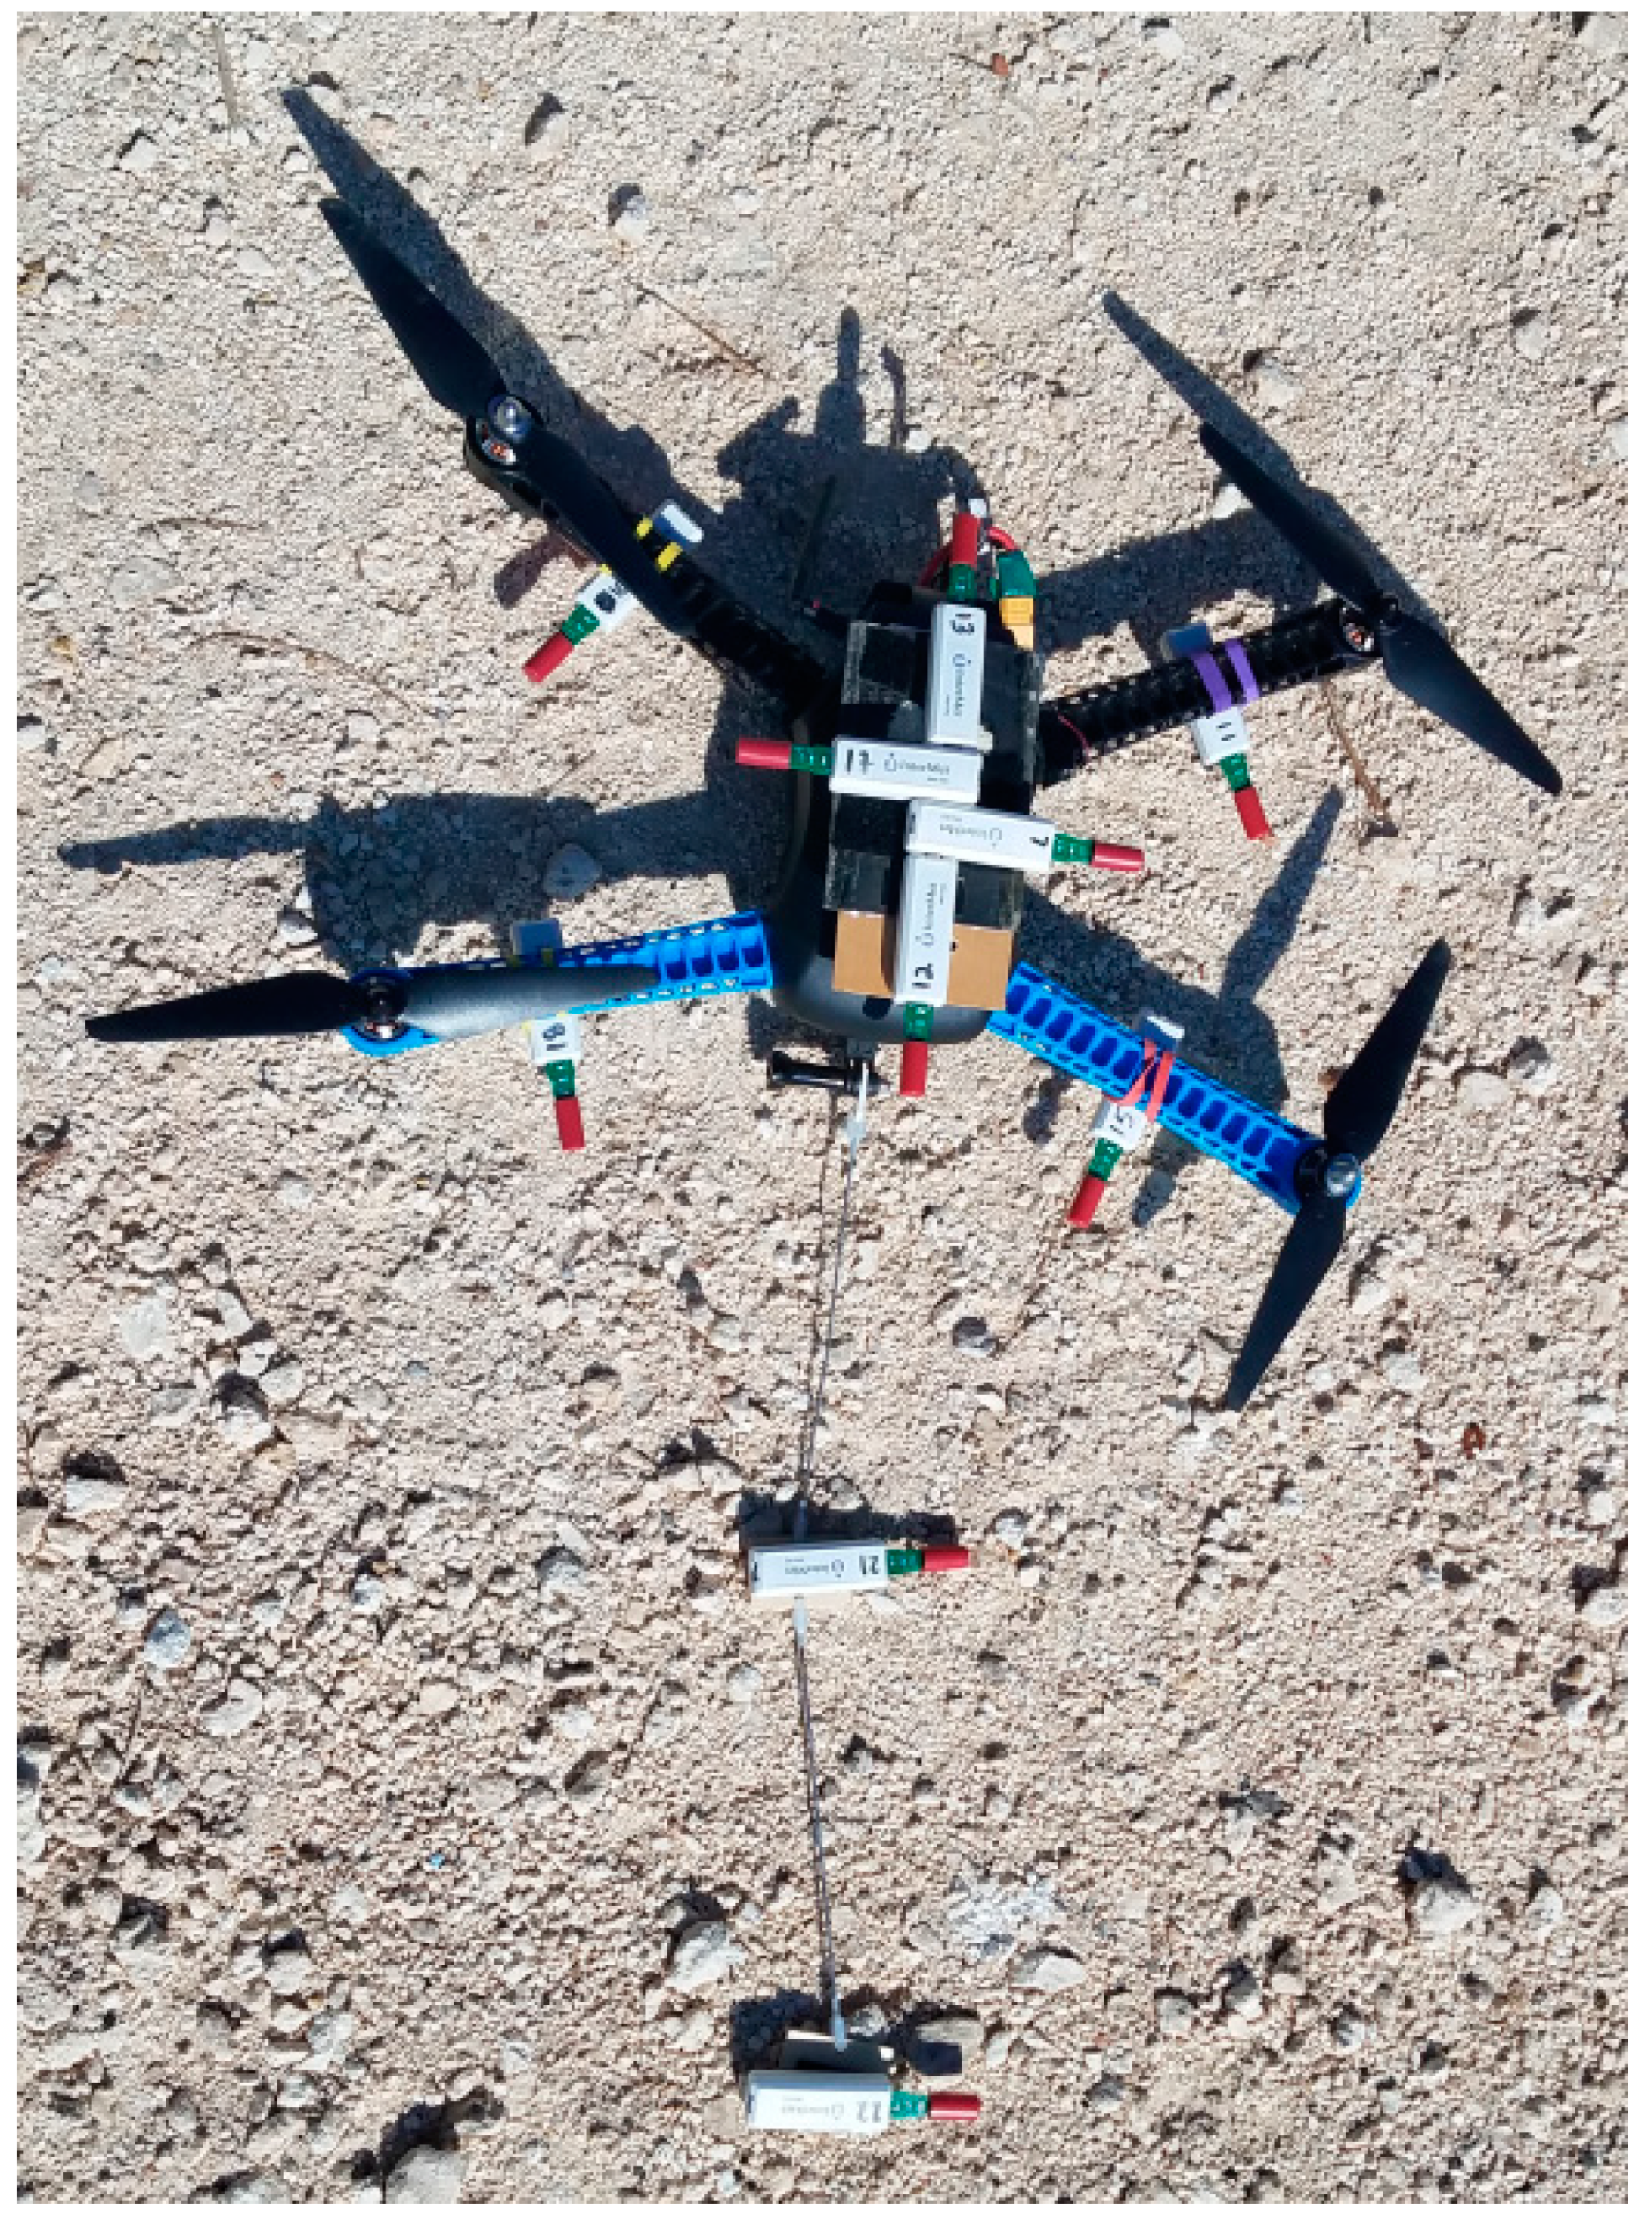
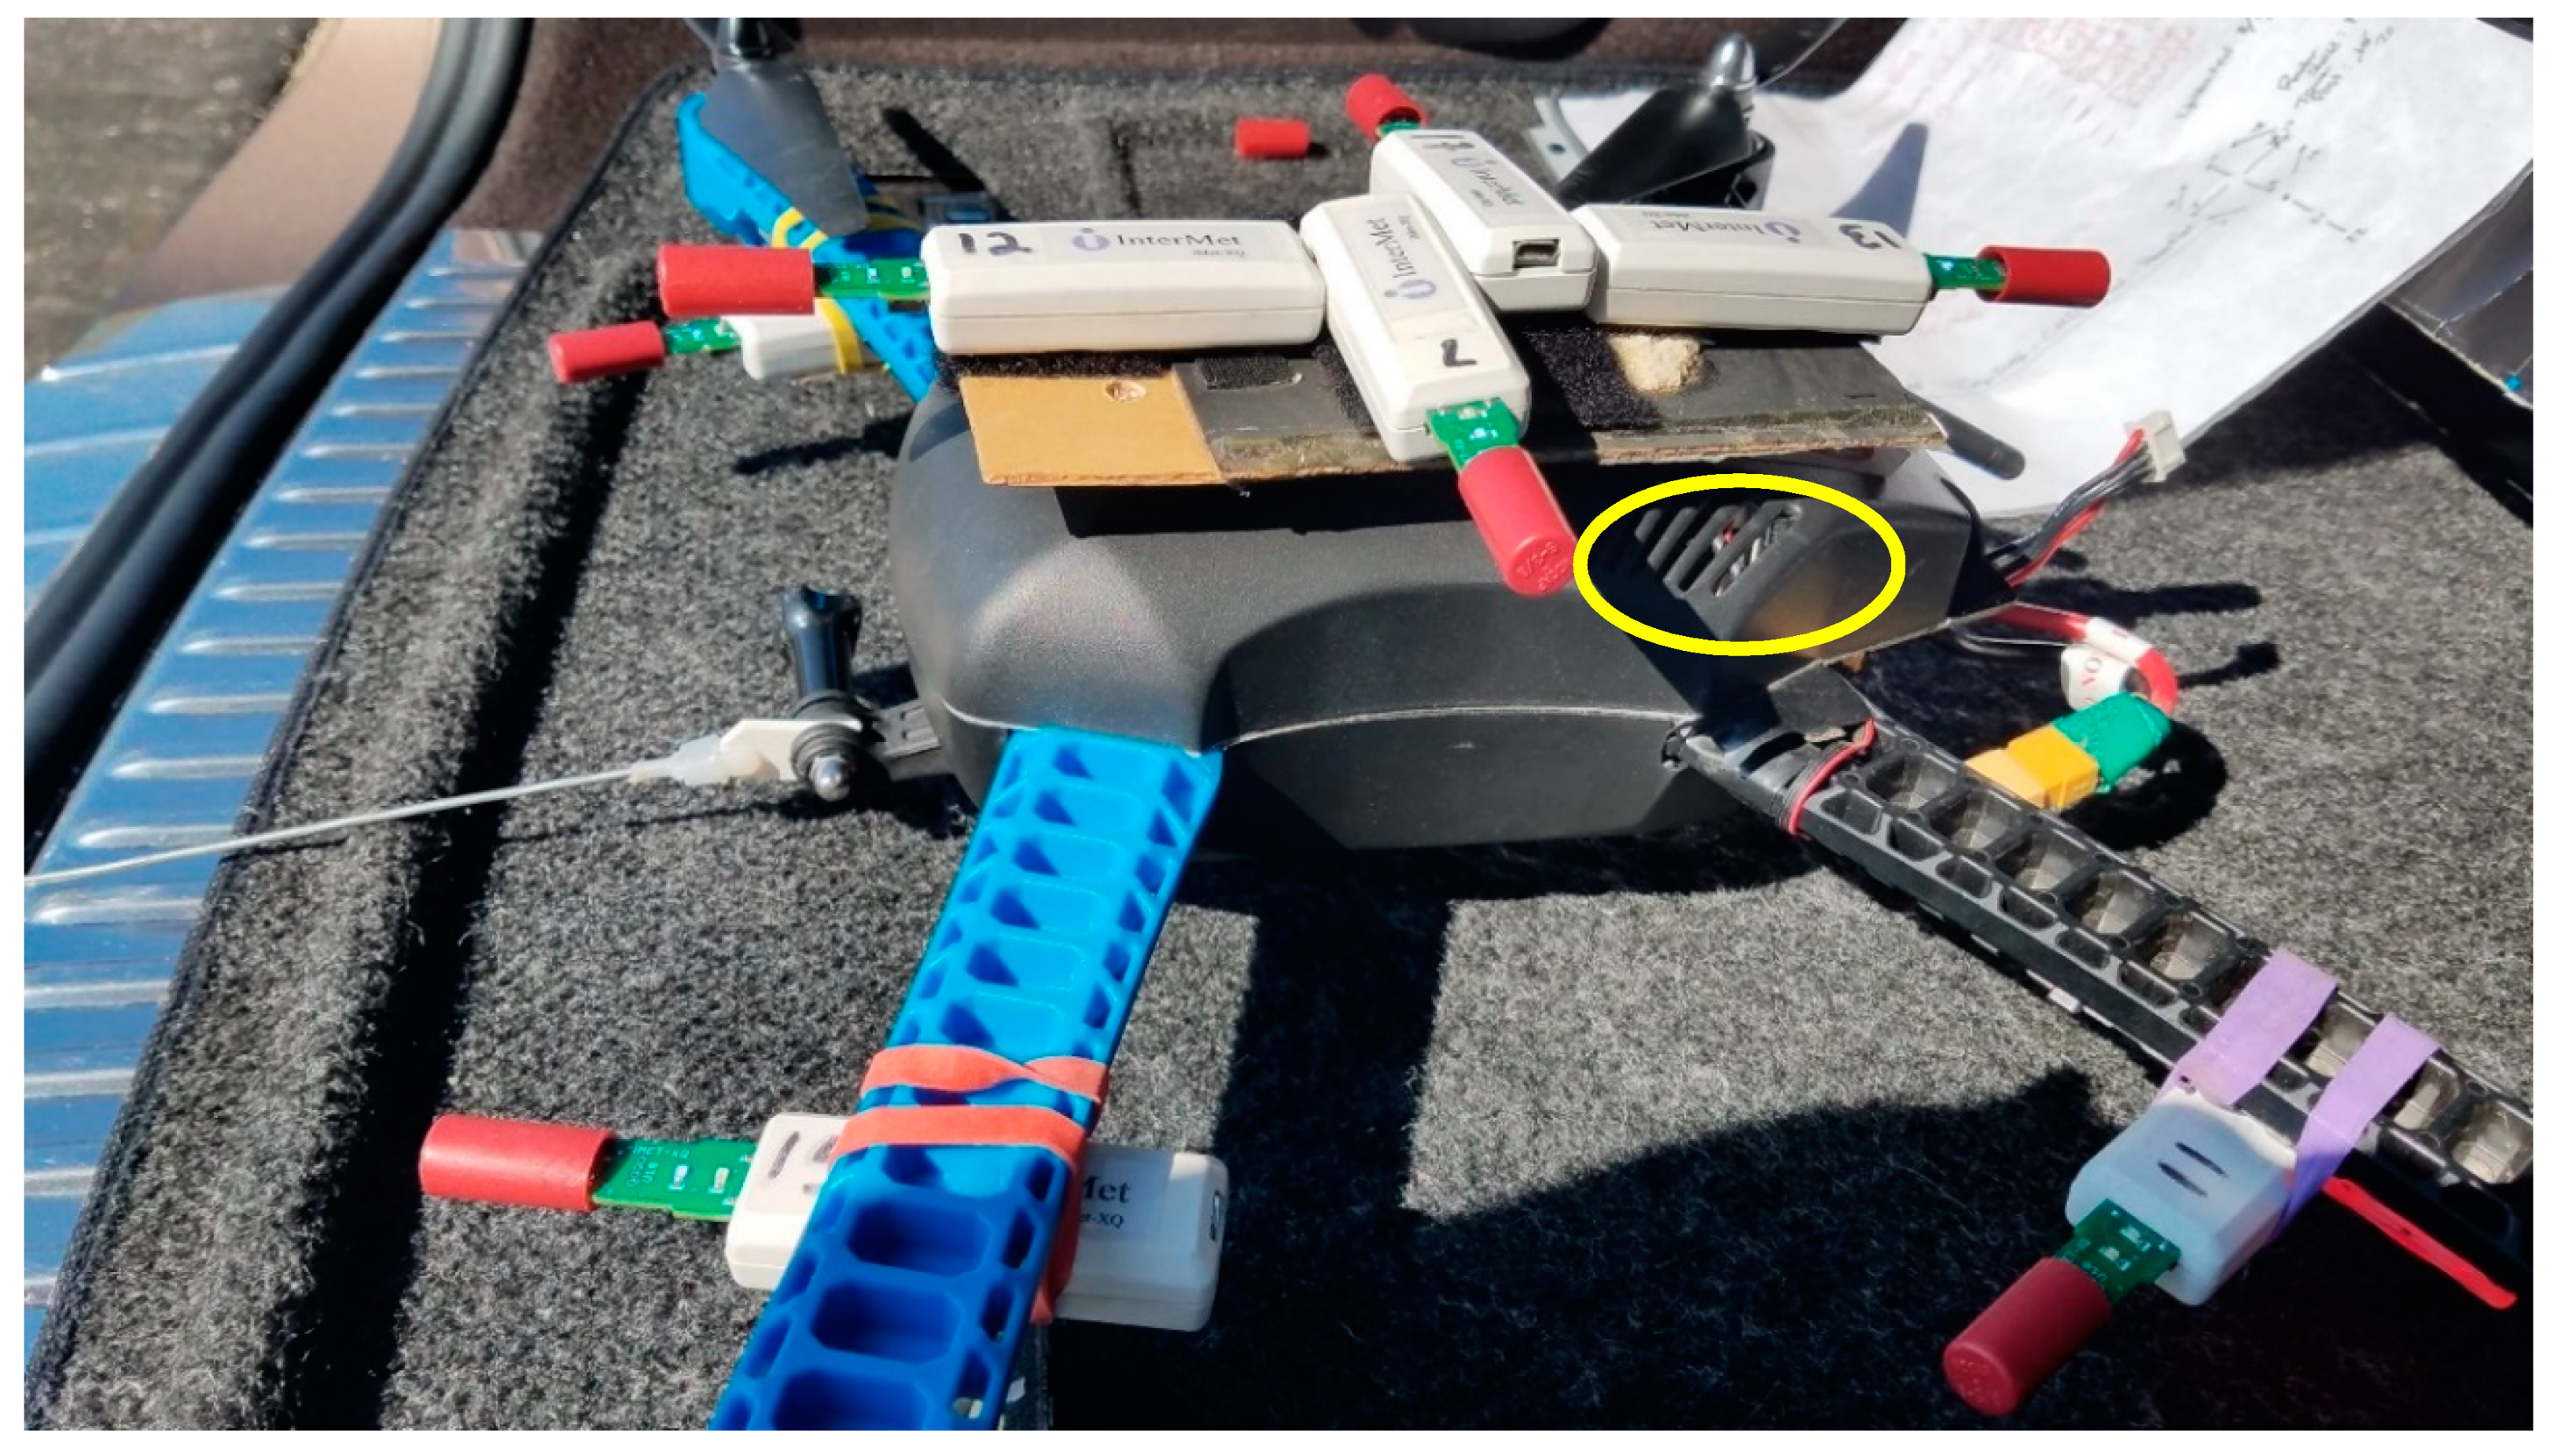
The experiments were conducted using an Iris+ quad-copter made by 3DRobotics complete with a Px4 autopilot with telemetry. The mass of the UAV including the battery was 1.28 kg. Each flight experiment was performed with ten iMET-XQ sensors placed in ten different locations (Figure 1). The iMET-XQ sensors were 15 g each. The iMET-XQ sensors were given numbers for easy identification. 
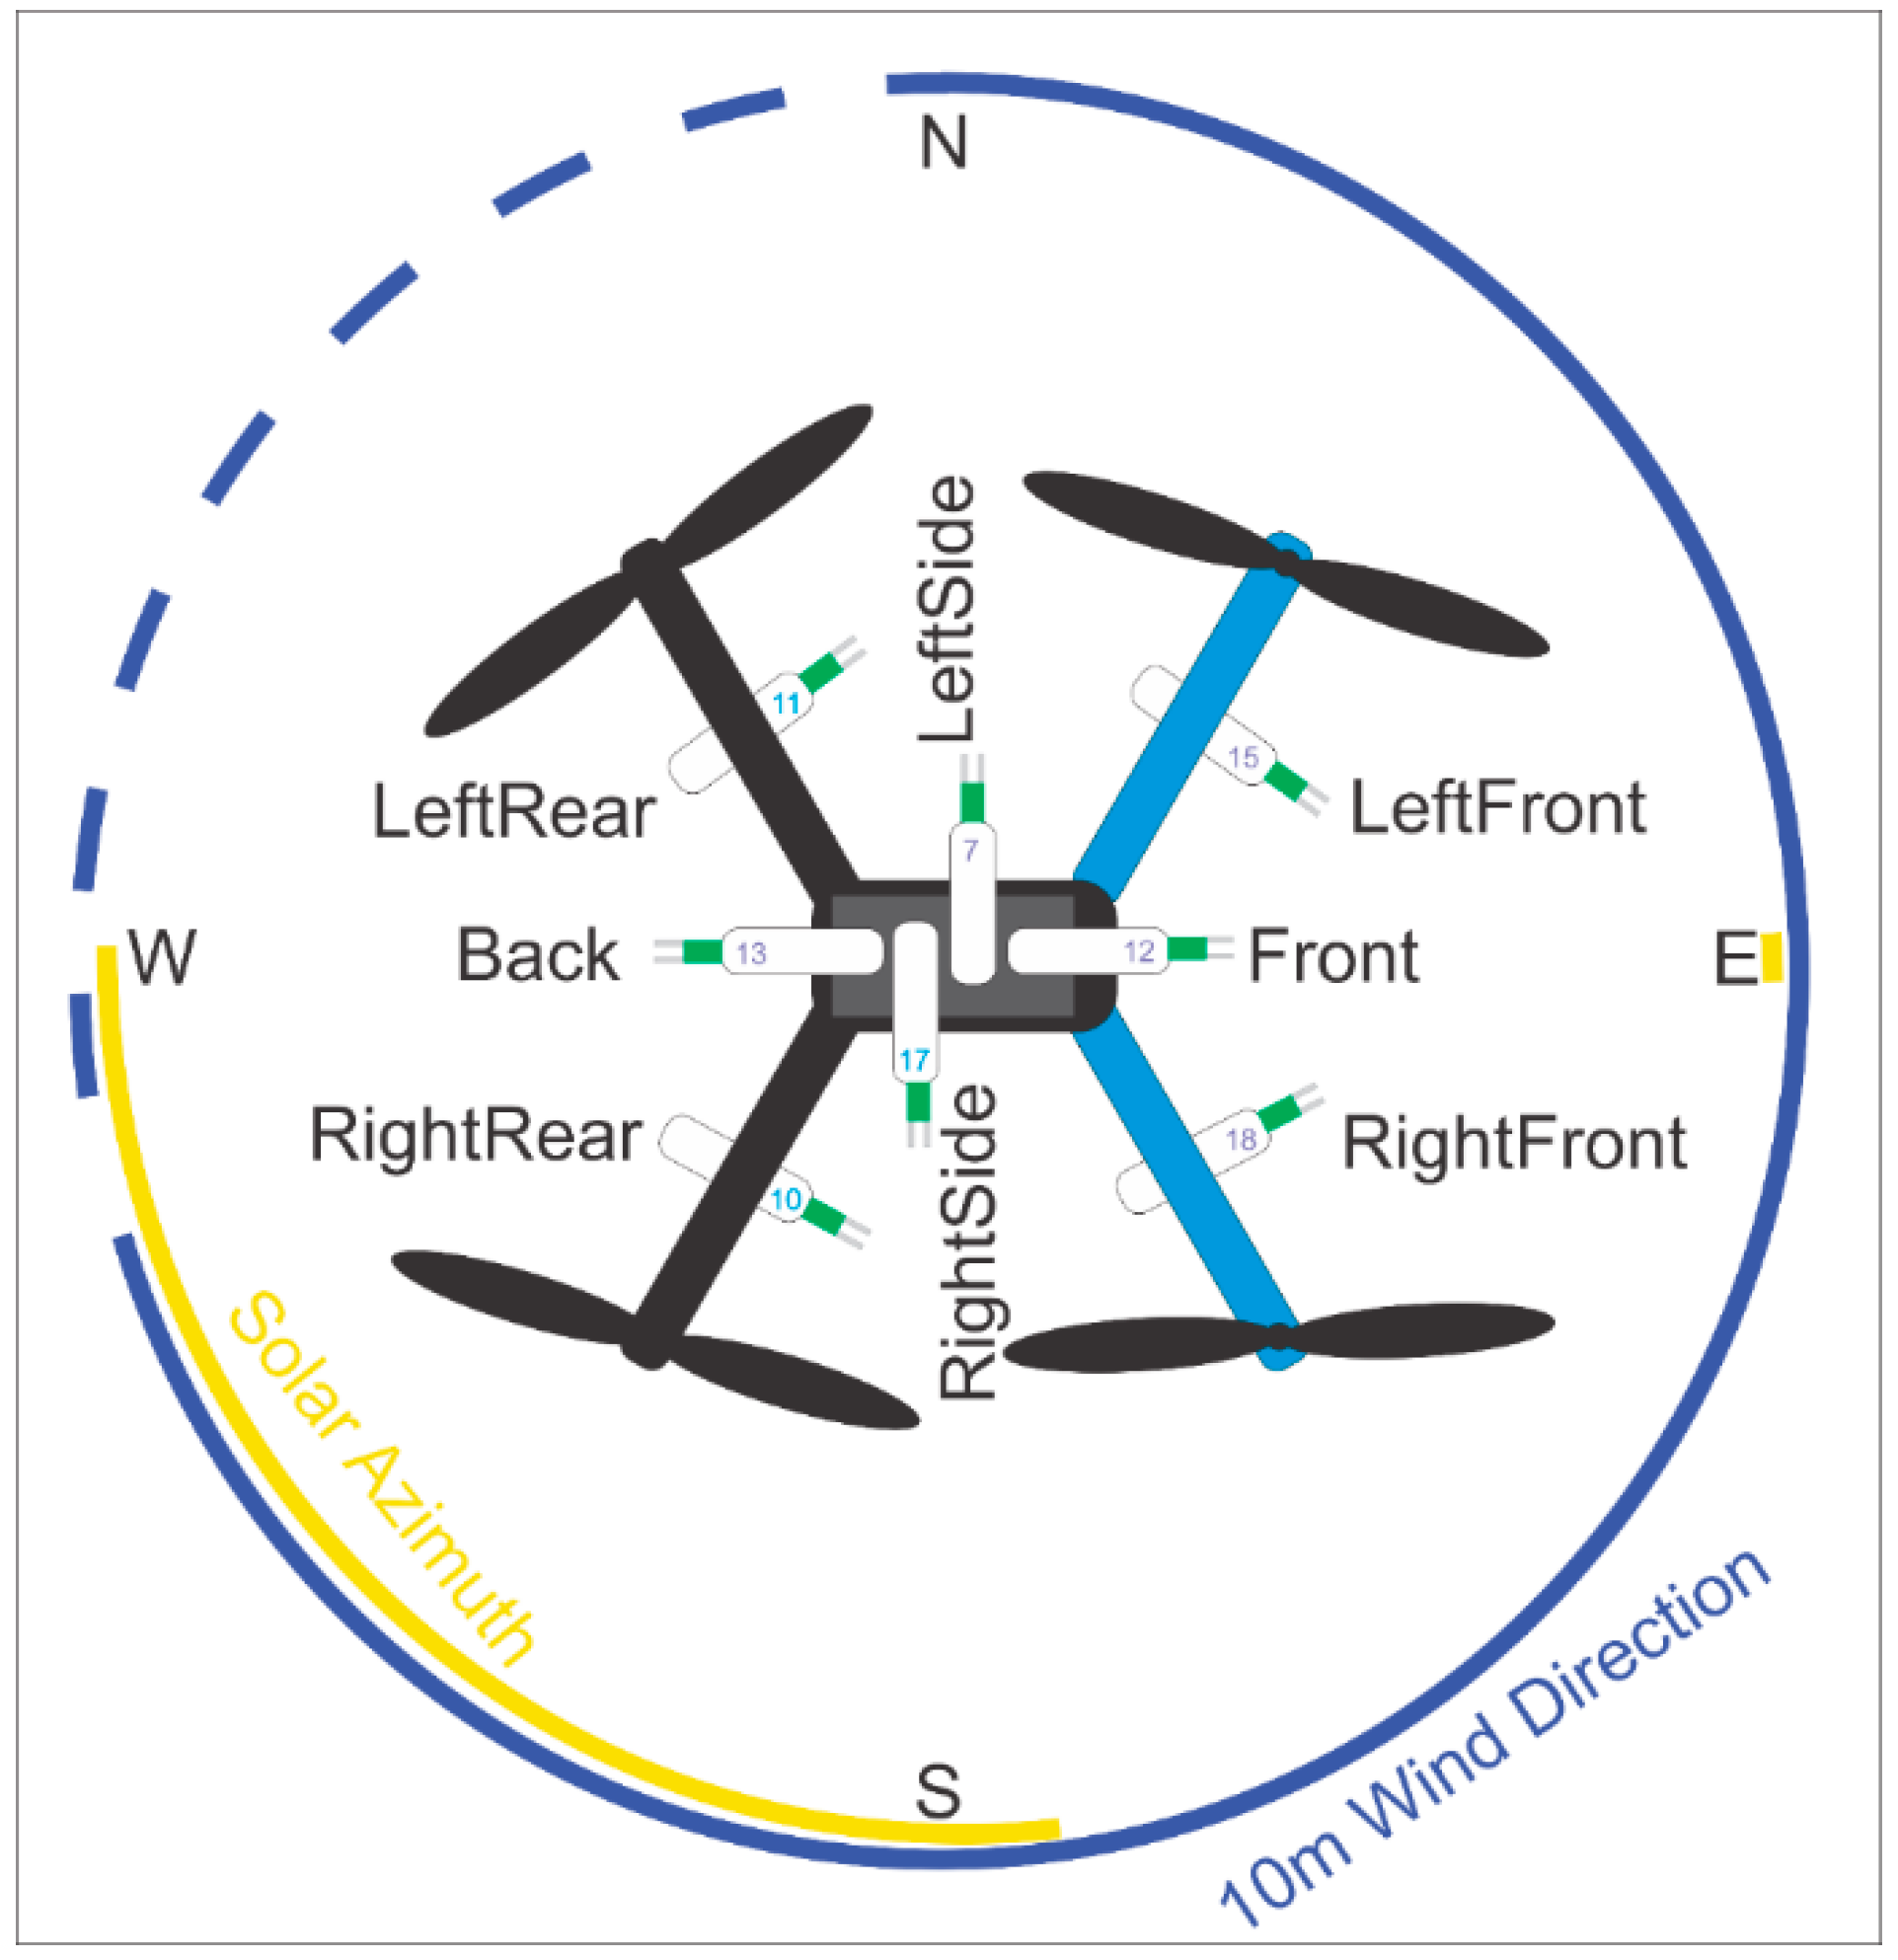
Figure 2 shows a schematic diagram of the UAV in hover mode showing the iMET-XQ numbers and their locations on the UAV. Four iMET-XQs were mounted underneath (in locations “LeftFront”, “RigtFront”, “LeftRear”, and “RightRear”) each of the 4 rotor arms of the Iris+ next to the anti-collision lights. In this location, the bead thermistor of the iMET-XQ was located 4.4 cm inward from the outer tip of the propeller as it rotated over the rotor arm. The Iris+ propeller measured 12 cm from the rotor axis to the tip. Therefore, the thermistor was located very close to one third of the length of the propeller from the propeller tip, as recommended by ref. [2]. These 4 sensors were aspirated by rotor wash from the Iris+ (Appendix A). Two iMET-XQ sensors were mounted on a wire attached to the front of the UAV (Figure 1). These two sensors were suspended 21 and 44 cm below the UAV in locations “DangleHi” and “DangleLo”, respectively. The remaining four iMET-XQ sensors were placed on the top of the body of the UAV, facing in 4 different directions (“Front”, “Back”, “LeftSide”, and “RightSide”). Each iMET-XQ was always put in the same location on the UAV.
All experiments were conducted at the South Alabama Mesonet [19] weather station (30.6944° N, 88.1944° W) on the campus of the University of South Alabama. The tower has temperature sensors at four levels: 1.5, 2, 9.5, and 10 m. The sensors at 1.5 and 9.5 m are a model 107 thermistor probe from Campbell Scientific Inc. with a manufacturer-stated accuracy of ±0.4 °C for a temperature range of −24 to 48 °C. At 2 and 10 m, HMP45C (Campbell Scientific Inc., Logan, UT, USA) platinum resistance temperature detectors are used. The accuracy of this sensor ranges between ±0.2 °C at 20 °C and ±0.3 °C at 40 °C and 0 °C. All the temperature sensors were housed in radiation shields that are aspirated by the wind. Wind speed was measured at two levels (2 and 10 m) by R. M. Young 05103 propeller wind monitors. The total solar radiation (i.e., direct plus diffuse radiation) was measured at 10 m by a Li-Cor LI200R-PT pyranometer and the vertical wind speed was measured at 10 m using a R.M. Young 27016T propeller anemometer. All the tower sensors sampled every 3 s and minute averages of temperature and wind speed measurements were archived. Pyranometer measurements were archived once per minute at the beginning of each minute. Vertical wind speed measurements consisted of an instantaneous measurement at the beginning of each minute, as well as a minimum and maximum measurement during each minute. To obtain an approximation of a minute average, the absolute values of the minimum, maximum, and instantaneous vertical wind speed measurements were averaged each minute.
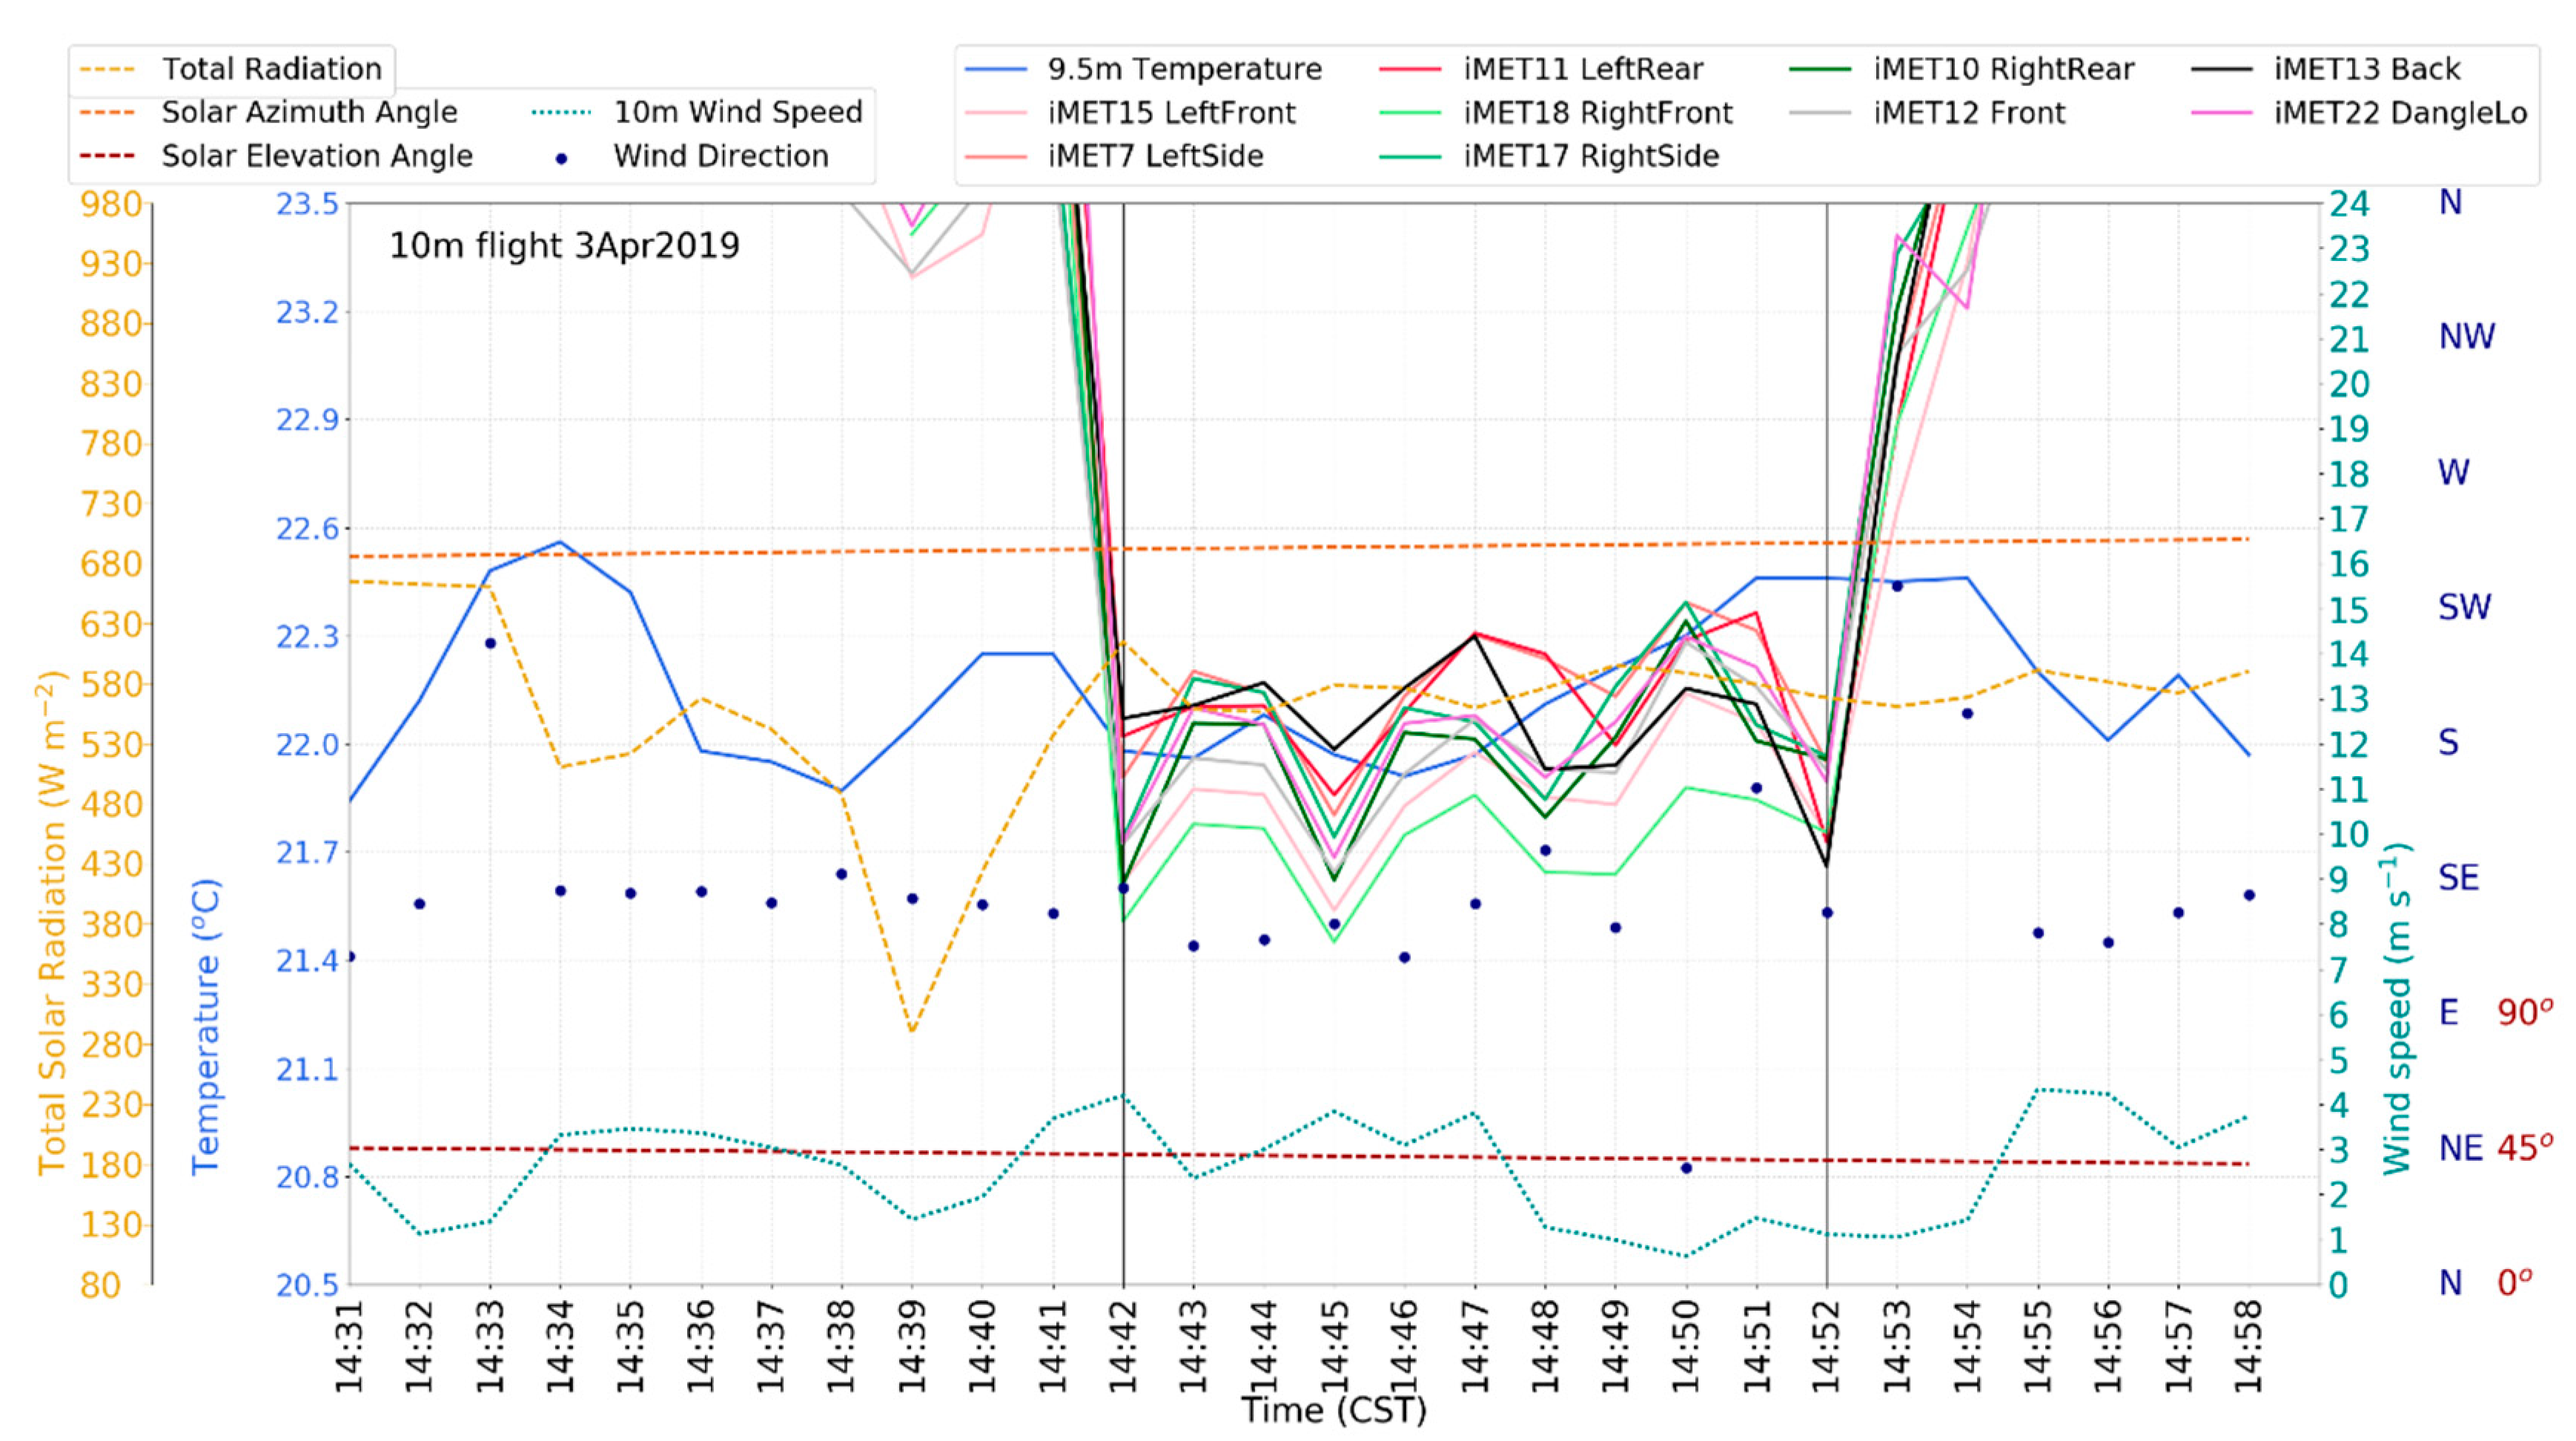
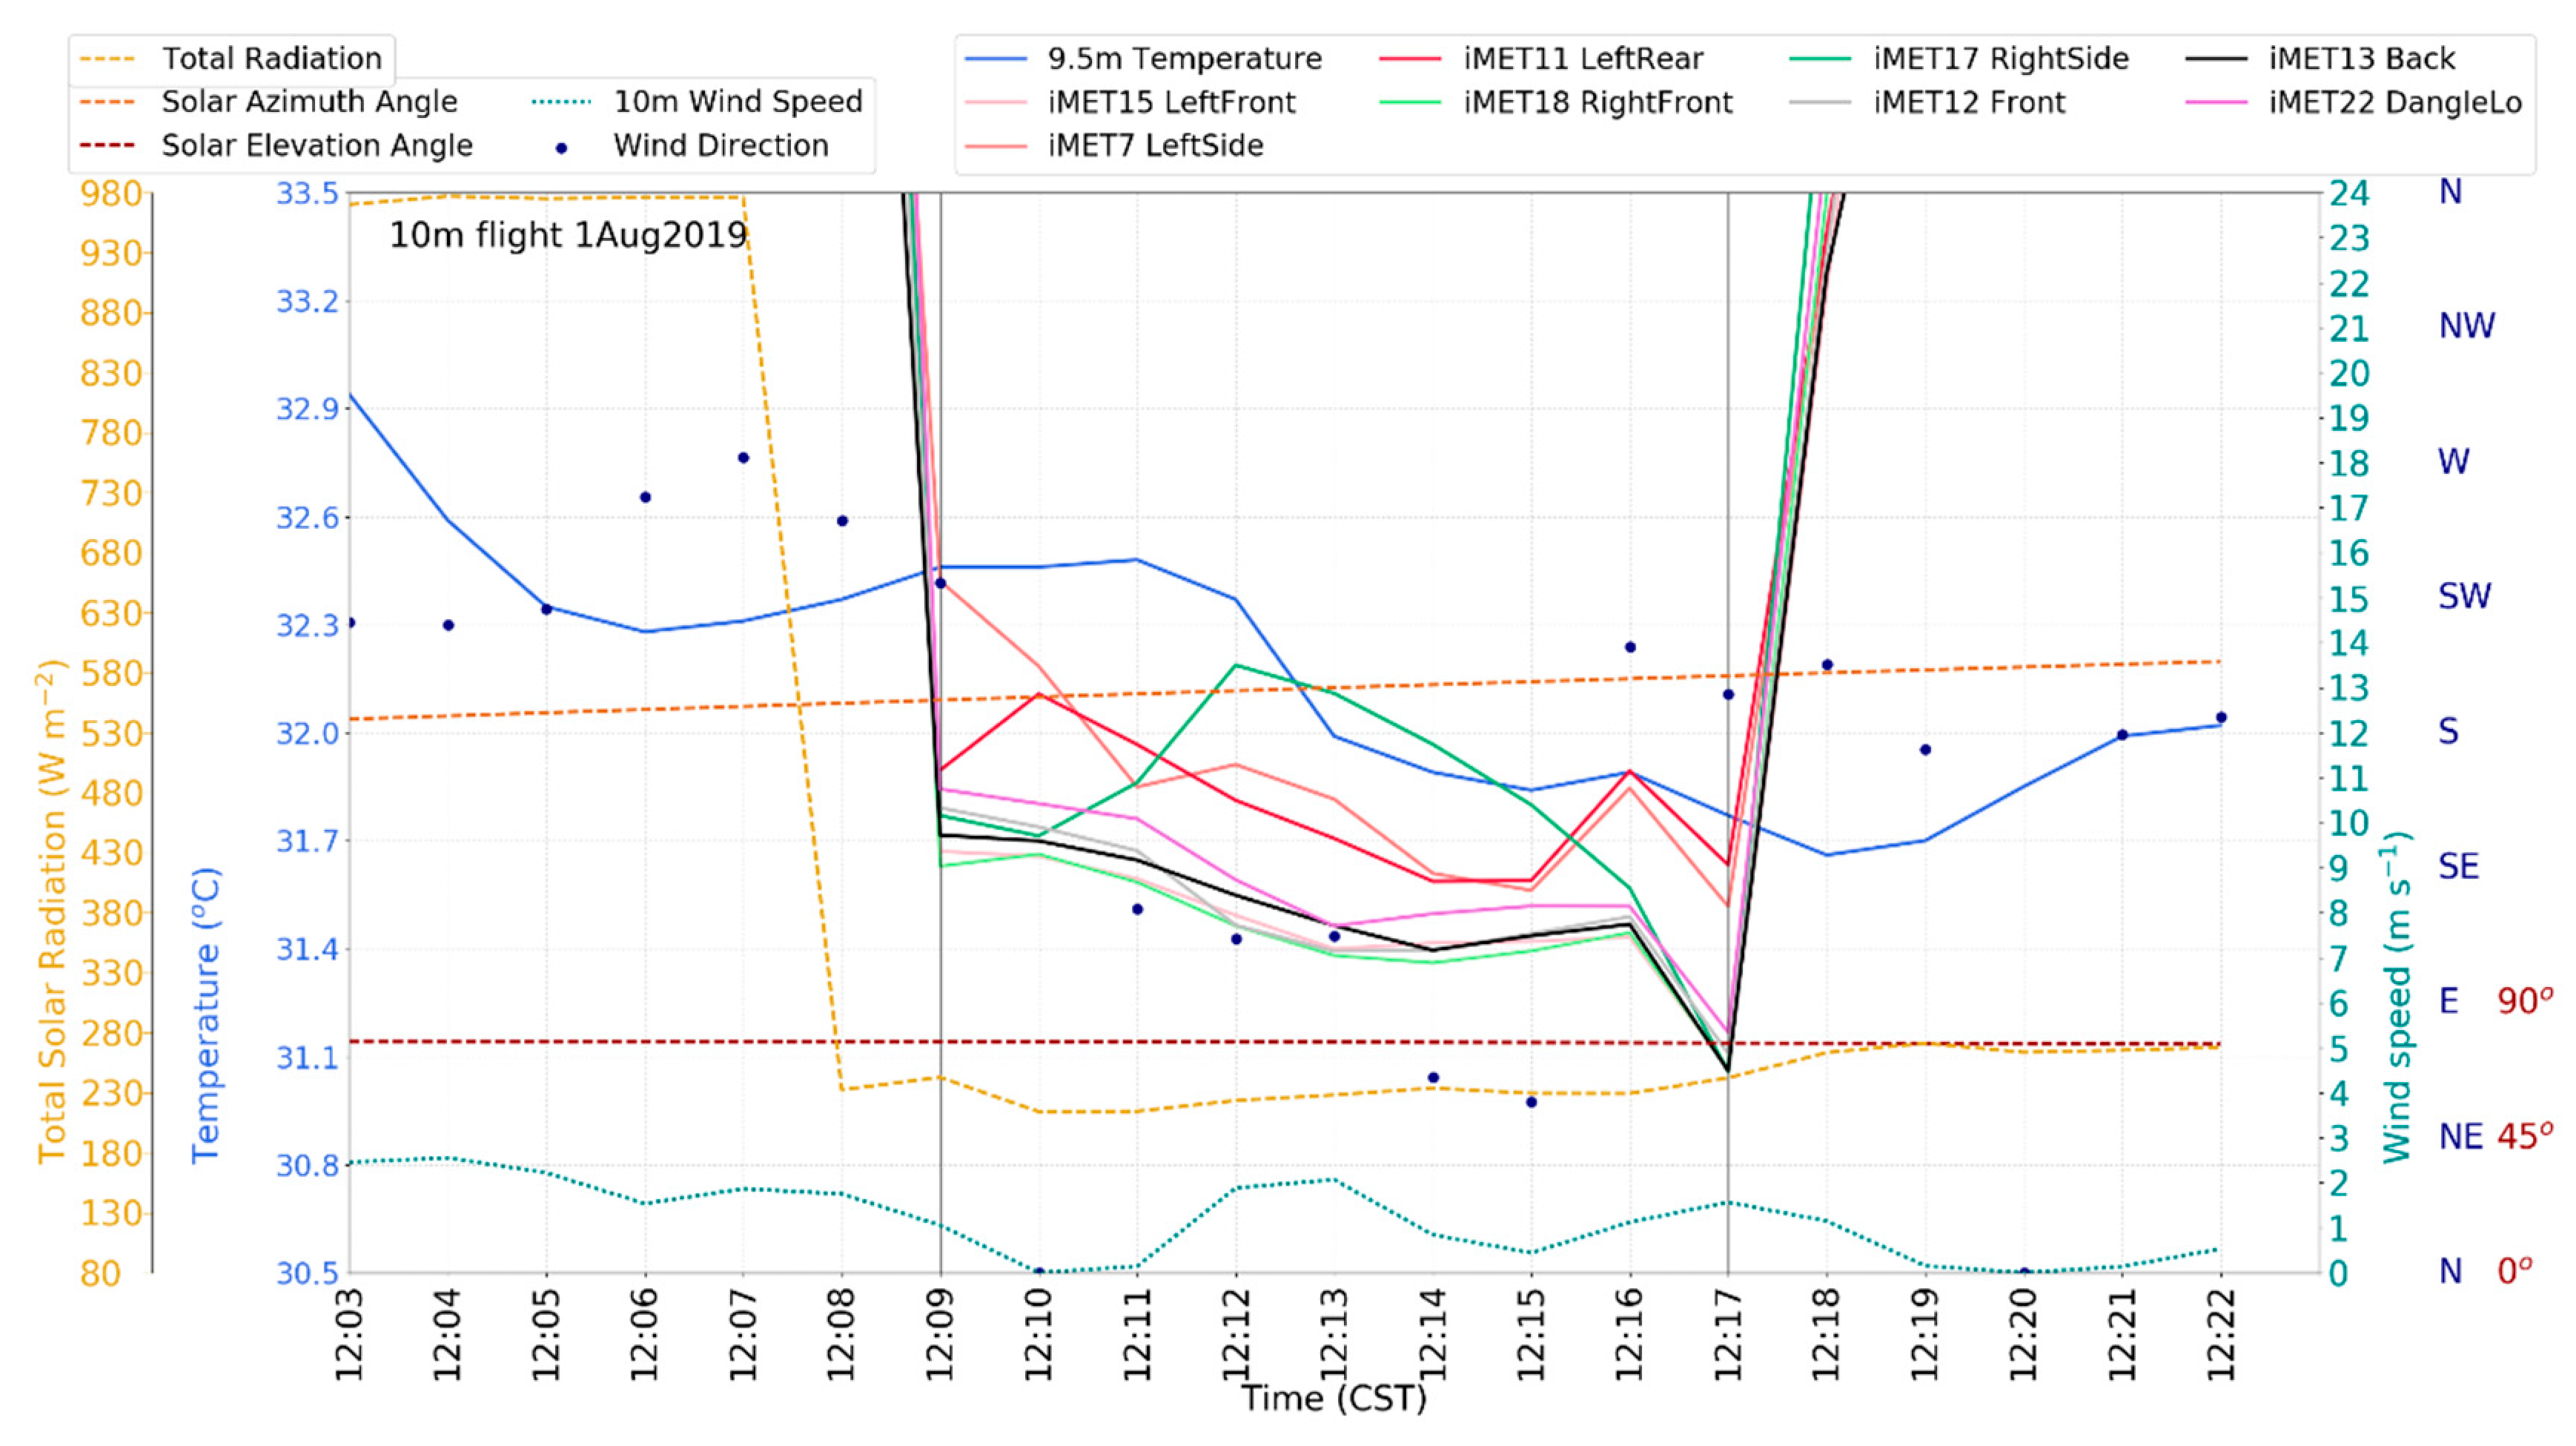
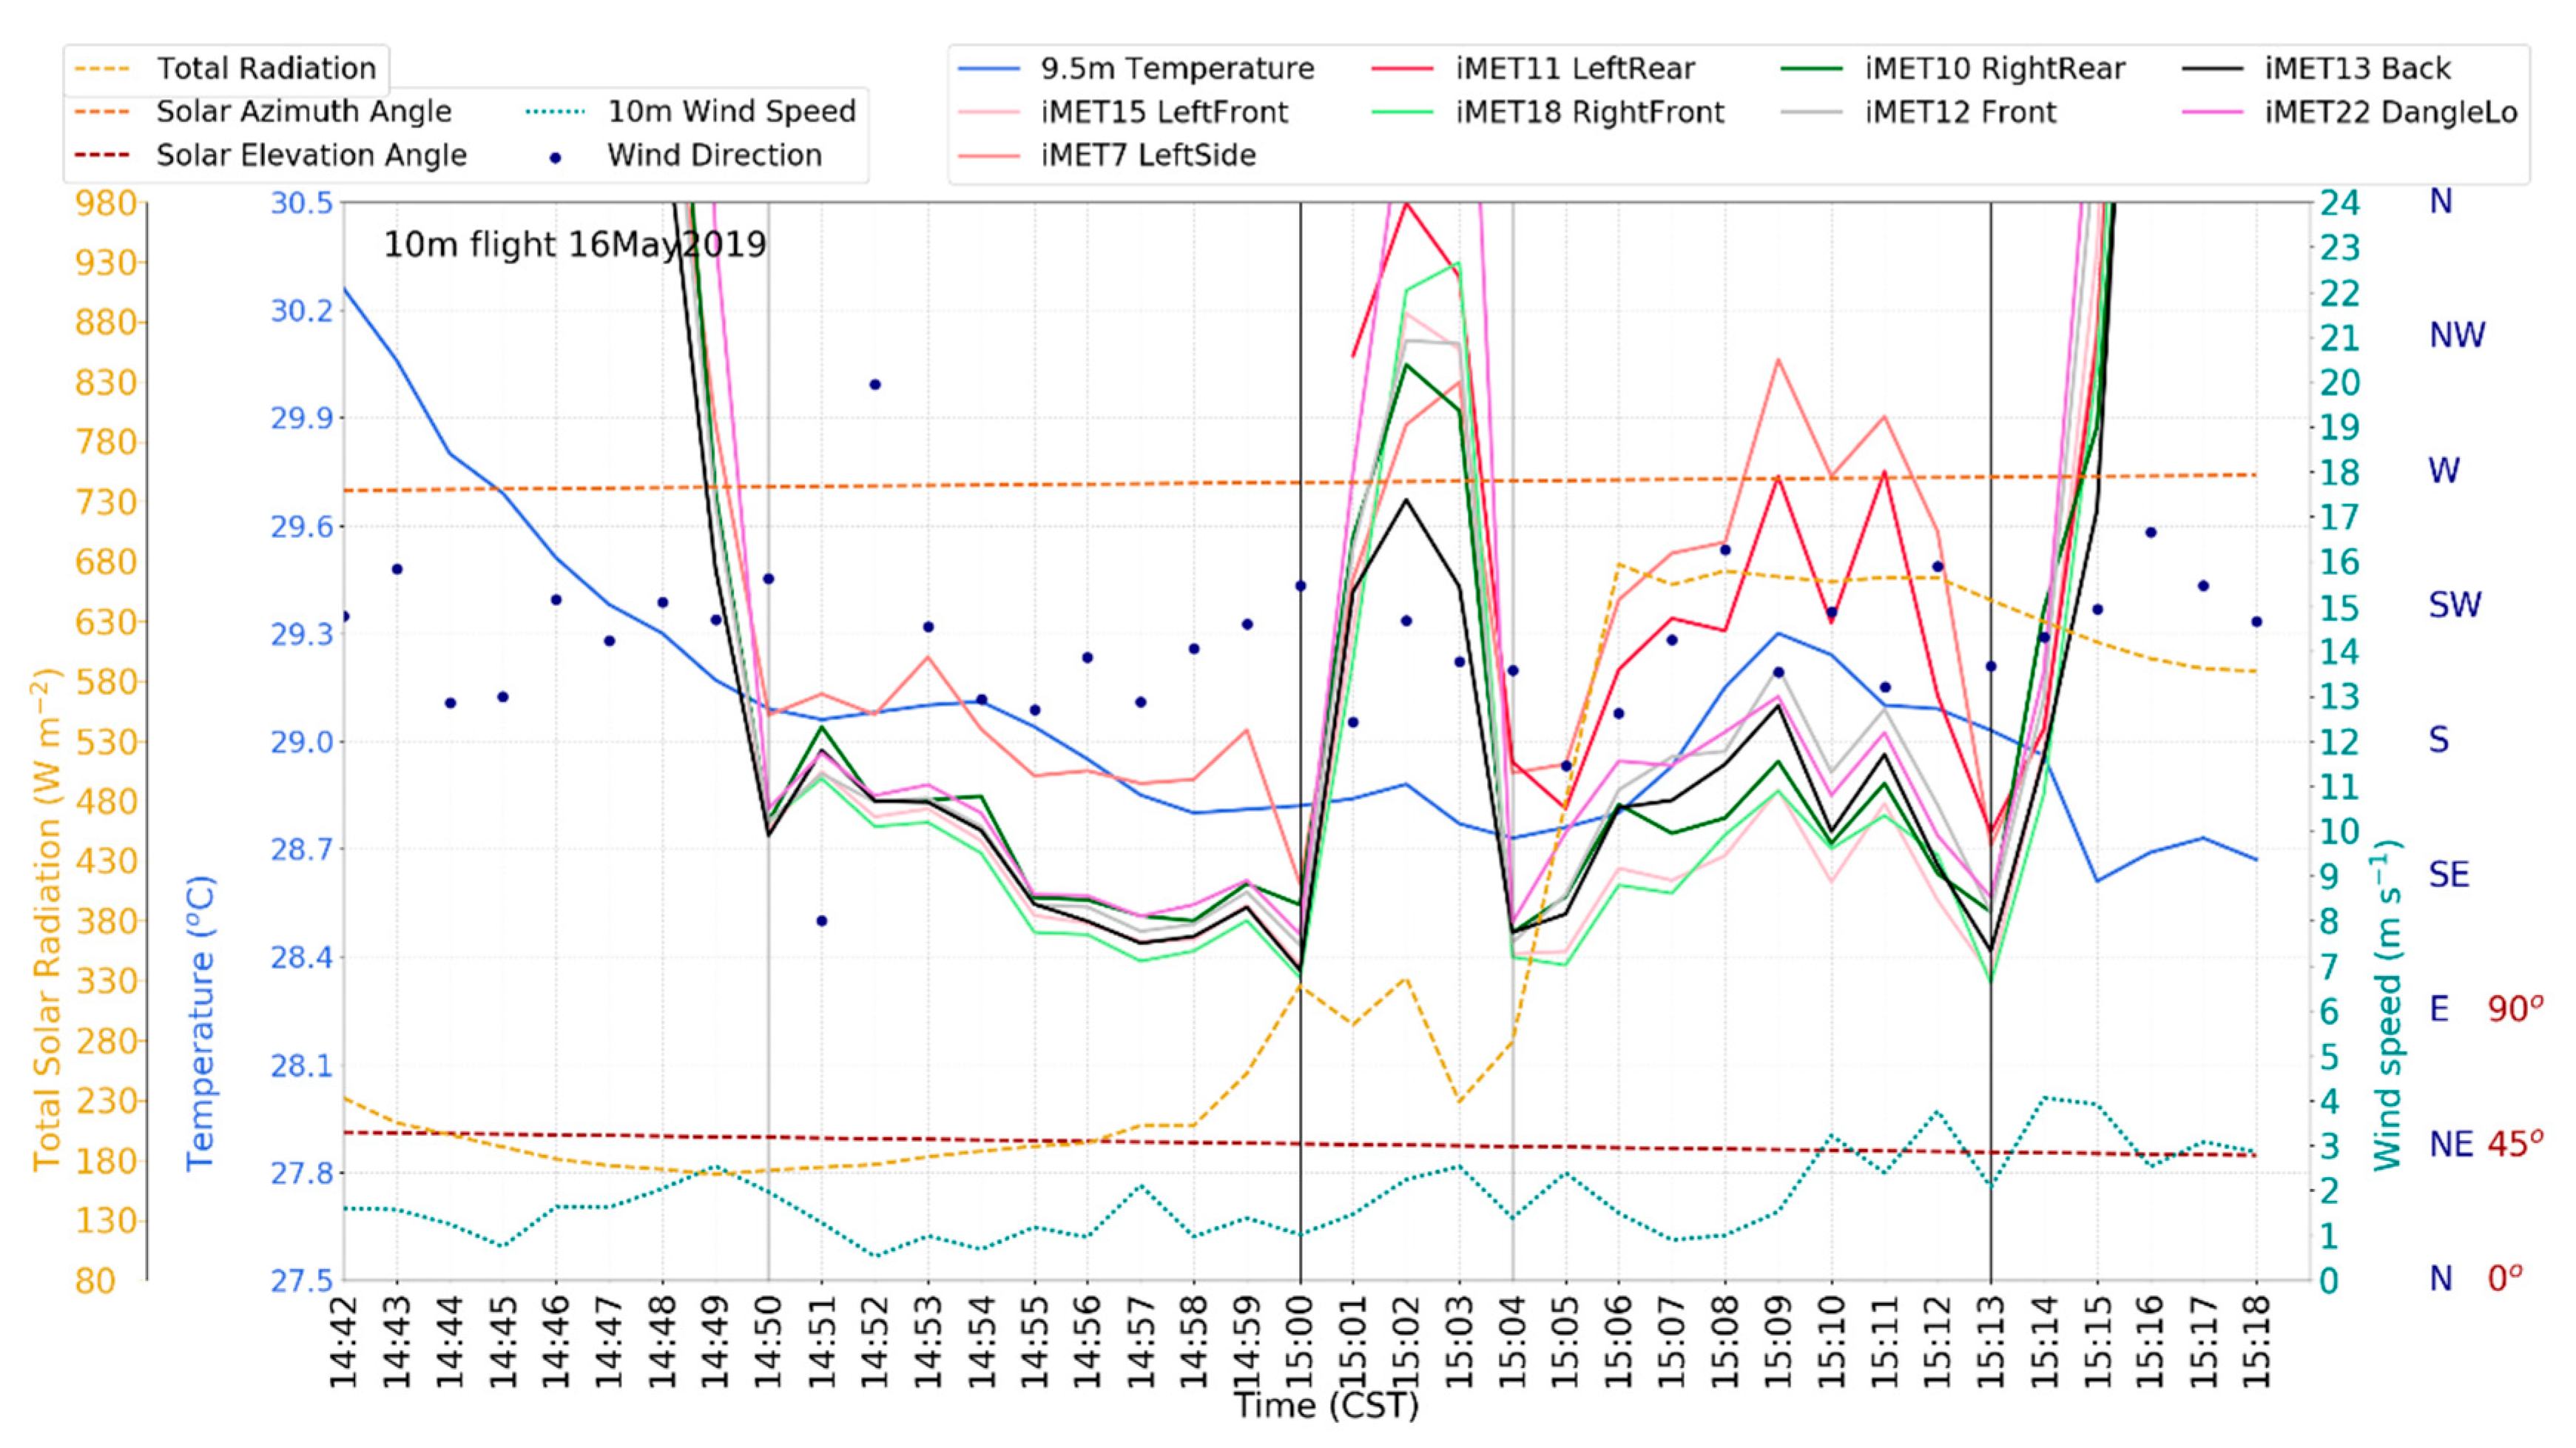
Flight experiments were conducted from February to August in 2019. Dates and other information for each experiment day are listed in Table 3. The UAV was flown adjacent to the Mesonet tower in hover mode at approximately 10 m, at a horizontal distance less than 10 m from the tower. This way there was no spatial variability in surface fluxes, because the land-surface characteristics under the UAV and around the tower are identical. The UAV battery limits each flight to between 14 and 18 min. In order to calculate the consistent temperature differences and to quantify the statistical relationships with meteorological parameters, the iMET-XQ 1 Hz measurements were averaged over the corresponding minutes. Minutes that were completely or partly spent ascending or descending were not used in this analysis. Most of the 10 m flight experiments were carried out in the afternoon when the solar angle was between 180° (south) and 270° (west). The UAV was consistently flown facing east, meaning that the sun almost never shone directly on the front of the UAV. The Mesonet tower was located to the north of the UAV.
Both the iMET-XQ and the tower data were quality controlled using automated range checks. The upper and lower limits of the range tests were the same for both platforms (range limits are given in ref. [18]). Values outside of these limits were set to missing. Following the automated QC range test, the timeseries of all the experiments were manually reviewed for data outliers. Outliers were identified by comparison to like sensors. For the temperature, these consisted of the temperatures from all the iMET-XQ sensors and from the 9.5 and 10 m tower sensors. The 10 m wind speed and direction values were compared to 2 m wind speed and direction. Solar radiation was compared to photosynthetically active radiation, also recorded by the South Alabama Mesonet. After completing the range test, it became clear that the pyranometer on the Mesonet tower malfunctioned on the 6 February 2019 and the data was set to missing. The same applied for the iMET21’s (in location “DangleHi”) temperature sensor, which malfunctioned (recorded large negative values) at the beginning on 12 March 2019. Sometimes, the iMET-XQ sensors randomly lost the Global Positioning System (GPS) connectivity; in those cases, no data were collected. On 6 February and 14 May 2019, iMET13, placed in location “Back” on the UAV, recorded temperatures that were up to 2.5 °C higher than the other iMET-XQ temperature sensors and the tower sensor. The iMET-XQ sensor may have been installed incorrectly on that day or the protective sensor cap may not have been removed. Data from this sensor were removed for those two experiment days.
In ref [18], the iMET-XQ sensors were validated in terms of precision and accuracy in outdoor conditions. It was concluded that the instruments are precise and accurate and the aluminum coating on the sensors allows them to be unshielded as long as they are aspirated properly. Optimal aspiration was recommended to be 2.5 m s−1 or greater. In this paper, the performance of the iMET-XQ sensors on a UAV will be investigated.

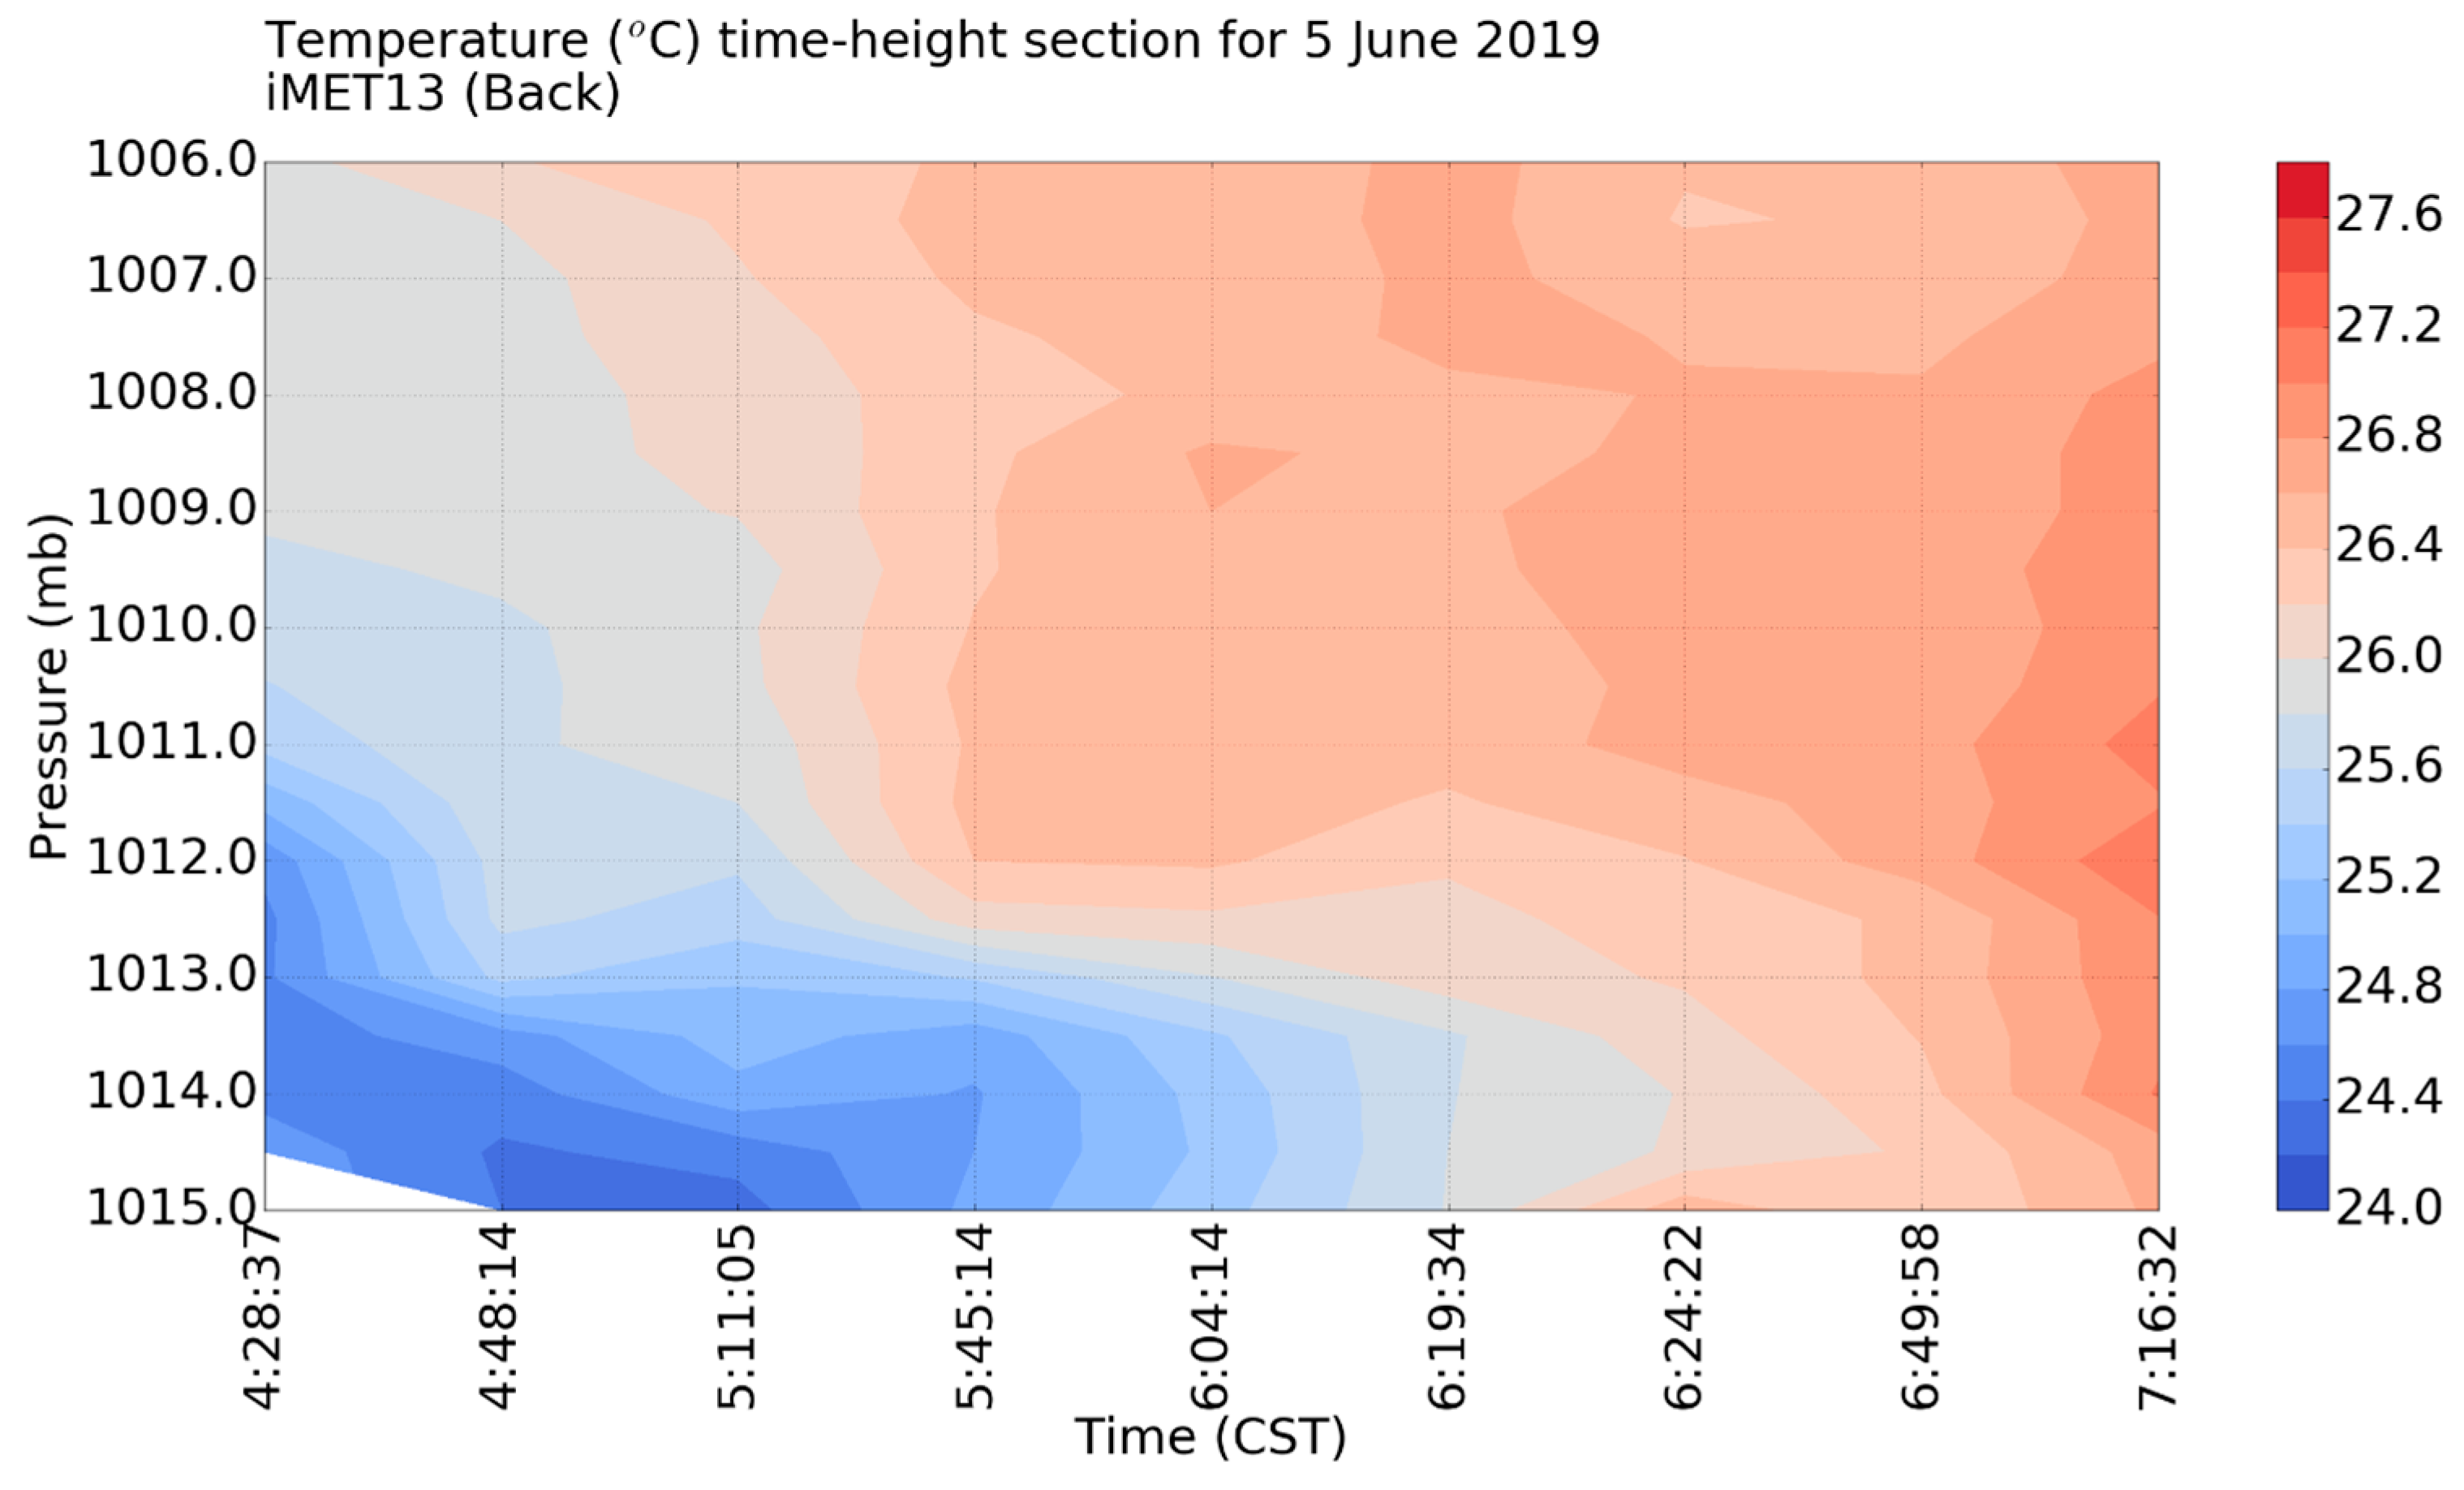
Morning Inversion Experiment

To test the capability of the UAV and the sensor package to take observations of a meteorological phenomenon, nine early morning soundings starting before sunrise, at 10–15 min intervals, up to 122 m (400 ft) were flown from a location in a public park near the University of South Alabama campus on 5 June 2019. The only iMET-XQ sensor that collected data during all nine soundings was the sensor in location “Back”. One of the suspended iMET-XQ sensors was damaged in a landing. Other iMET-XQ sensors intermittently lost GPS connectivity. Only the data from the ascending legs were used as was recommended in previous studies [1]. This way, heat generated by the warm components in the rear half of the UAV body flowed away from the iMET-XQ sensor in the “Back” location of the UAV. The UAV ascent rate varied between 0.5 and 1.2 m s−1; this was not at the recommended optimal aspiration of 2.5 m s−1 [18]. However, solar radiation was also extremely low during the flights, which reduces the need for optimal aspiration. As the UAV ascended and descended, the pressure was measured by the pressure sensor on board the iMET-XQ sensor.

3. Results and Discussion

In this section, the overall sensor accuracy is discussed, as well as the sensor accuracy by experiment date. Influences on the sensor performance due to location on the UAV and from the UAV itself are presented. The effects from local wind speed and solar radiation are discussed and an experiment to demonstrate the sensor performance during a morning inversion is presented.

3.1. Sensor Accuracy Overall and by Experiment Date

The instrumented UAV hovered near the top of the South Alabama Mesonet tower on 18 experiment days (Table 3). The experiments lasted between 6 and 13 min. Flying near the top of the tower meant that the iMET-XQ sensors on the UAV could be compared to either the 9.5 m (thermistor) or 10 m (HMP-45C) sensors on the tower. Figure 3 shows the temperature difference between the two tower temperature sensors as a function of 10 m wind speed and solar radiation. The difference is almost always within manufacturer-specified sensor accuracy (0.3 °C for the thermistor) with the 10 m sensor being slightly warmer. This would not be expected given that the 9.5 m sensor is closer to the ground and hence, would be expected to record warmer temperatures during the day time. Apparently, the 10 m sensor has a slight warm bias, but is still within sensor accuracy specifications. Hence, either sensor could be used. However, because the iMET-XQ temperature sensors are thermistors, they are compared to the 9.5 m thermistor on the tower, which is also a thermistor. The temperature difference is defined as follows: TD = TiMET − T9.5m. The mean ± standard deviation of all ten TD (there are 10 iMET-XQ sensors) sensors and all experiments are −0.23 °C ±0.24 °C. There is an overall cool bias, which will be discussed below. These overall results are compared with other studies in Table 2, which shows that in most other cases, warm biases were found. In some studies, the sensors were not aspirated or it was not reported if they were. Non-aspirated sensors can easily lead to warmer biases. Moreover, in some cases the distance between the UAV flights and the tower/rawinsonde was 100 m or larger and in some cases different size-averaging intervals were used for the UAV-based measurements and the tower measurements. These could explain the larger mean differences that were found in other studies as compared to the current one. In the current study, 64.8% of all TDs are less than 0.3 °C and 93.0% are less than 0.6 °C.
A distribution of TDs for each experiment date is obtained by calculating the TD for each of the ten iMET-XQ sensors, and for each minute in the experiment. In some cases, one or more iMET-XQ sensors malfunctioned (primarily due to the loss of GPS connection). This, along with the different experiment durations, explains the varying sample sizes (N) in Table 3. The distributions of the TDs by date are presented as boxplots in Figure 4. An average solar radiation and 10 m wind speed value have been calculated for each experiment day (Table 3). These values are shown in Figure 4 as red stars (solar radiation) and green triangles (wind speed). Their y axis ranges (0–1200 W m−2 for solar radiation and 0–4 m s−1 for wind speed) correspond to the bottom half of the y axis range for the temperature difference (i.e., TD = −1.8 to 0 °C). This way, the symbols do not overlap the box plots. Labels have been added to the right-side y axis on Figure 4 to show the axis ranges of solar radiation and 10 m wind speed. The mean and standard deviations of the TD distributions for each experiment date are given in Table 4.
The majority of the TDs are smaller than the manufacturer-specified accuracies of both sensors added together (0.6 °C), assuming a worst-case scenario of the sensor biases being in the same direction. On most days, the mean and median TDs are negative, indicating that most of the time the iMET-XQ sensors on the UAV record cooler temperatures than the tower thermistor. The distributions show large variations in the mean/median as well as in the spread (standard deviation/inter-quartile range) of TDs as a function of environmental conditions on a given day. This will be further investigated in Section 3.4.
The average TD values for each flight are listed in Table 4 and they are all less than the manufacturer-specified accuracy of the iMET-XQ temperature sensors (0.3 °C). Since the thermistor on the tower is unaspirated, the accuracy of its measurements varies with wind speed and cloud cover. Therefore, it is not possible to assess if the sensors on the UAV display a cool or warm bias compared to the reference sensor, nor is it possible to assess the true value of the bias. For instance, in low wind and sunny conditions, the tower sensor temperature measurement will likely be warmer than the best location on the UAV. Whereas in overcast and windy conditions, the tower sensor may be cooler than the best location on the UAV. As Figure 4 shows, the TD values vary greatly with wind speed and the solar radiation conditions. Nonetheless, a relative comparison between TDs can still be used to investigate the performance of the sensors in different locations on the UAV. This will be done in the next section.

3.2. Temperature Comparison by UAV Location

Similar to a TD distribution by date, a TD distribution by iMET-XQ location on the UAV can be obtained by calculating TD = TiMET − T9.5 m for each iMET-XQ and all the experiment dates. These TD distributions are presented as boxplots in Figure 5. The majority of the TDs are smaller than the manufacturer-specified accuracies of both sensors added together (0.6 °C).
Additionally, the temperature difference among iMET-XQ sensors can be compared: TD = TiMETx − TiMETy for all y unequal to x. This is shown in Figure 6. Similar trends can be seen as in Figure 5, but the TD values are generally larger than those in Figure 5. The smaller TD values in Figure 5 are caused by a warmer 9.5 m temperature, as would be expected for an unaspirated sensor. The large negative TD outliers in Figure 6 are caused by the large positive outliers of iMET17 (location RightSide). Both Figure 5 and Figure 6 indicate a warm bias for iMET17 and a larger spread in TD values. In ref. [18] a tower experiment was conducted where the iMET-XQ sensors were placed side-by-side at 1.5 m above ground level on a wooden board suspended from the tower’s 2 m cross-arm. Figure 4 of ref. [18] is similar to Figure 6 in the current paper; it shows TD = TiMETx − TiMETy for all y unequal to x, except that all iMET-XQ sensors are stationary and attached to the tower. In the stationary experiment, between 90.5% and 96.31% of the absolute value of the stationary iMET-XQ sensors, the TDs are below 0.6 °C (twice the manufacturer-specified sensor accuracy) and between 68% and 83.76% of the |TD| values are below 0.3 °C. All the mean |TD| values are less than 0.3 °C. For these reasons, the warm/cool biases from the iMET-XQ sensors themselves are considered small. Hence, the larger bias seen in Figure 5 and Figure 6 for iMET17 is concluded to be the result of iMET17’s location on the “RightSide” of the UAV. Large differences can be seen in the TD distributions as a function of location on the UAV (Figure 5). This is investigated further in Section 3.3.

3.3. Influences from the UAV

The Front, Back, LeftFront, RightFront, DangleHi, and DangliLo locations all show negative mean and median TDs (Figure 5), meaning that the iMET-XQ sensors in these locations record cooler temperatures than the tower, most of the time. The means and medians of the TDs for the remaining locations (LeftSide, LeftRear, RightSide, and RightRear) are at or slightly above zero. The RightSide location has the largest positive mean/median as well as the largest spread. This location is not propwash aspirated (Appendix A) and faces directly into the sun during most experiments (Figure 2). However, cool biases are also observed a little under 50% of the time. In Figure 7, the TD magnitudes are shown in color as a function of the 10 m wind direction (y axis) and solar azimuth angle (x axis) for the iMET-XQ in location “RightSide”. The red dots indicate positive TD values, i.e., warmer iMET-XQ measurements. The blue dots indicate negative TDs, i.e., cooler iMET-XQ measurements. A very distinct relationship was observed between the TD and the 10 m wind direction: for the wind directions between about 112° (ESE) and 247° (WSW), the dots are primarily blue (cooler iMET-XQ temperatures, see horizontal black lines in Figure 7) and for the wind directions ESE through NW, the dots are primarily red (warmer iMET-XQ temperatures). The same pattern is seen for the location RightRear (iMET10, not shown), in spite of this sensor being aspirated by rotor wash. From Figure 2 it can be seen that when the wind direction ranges from ESE through WSW, the iMET-XQ sensors in the RightSide and RightRear locations are facing directly into the wind and observe cooler temperatures in spite of the iMET-XQs facing into the sun.
Interestingly, the reverse to Figure 7 is seen (not shown) for the LeftSide and LeftRear locations: warmer iMET-XQ temperatures are observed for wind directions between about ESE and WSW, and cooler iMET-XQ temperatures are observed for wind directions ESE through NW. This means that the iMET-XQ sensors in all four of these locations experience the same phenomenon: when the wind impinges directly onto the iMET-XQ sensor (i.e., when it is located upwind from the UAV body), it records cooler temperatures. When the wind comes in from the opposite side of the UAV, the iMET-XQ is located downwind from the UAV body and records warmer temperatures. The latter is true even when the iMET-XQ is not facing directly into the sun or if it is aspirated by prop wash (LeftRear and RightRear). The pattern seen in Figure 7 is not observed for the iMET-XQ sensors located on the front of the UAV: “LeftFront” and “RightFront”. In fact, these two locations almost always observe cooler temperatures than the tower (primarily negative TDs, Figure 5).
Upon close inspection of the UAV, two vents can be seen towards the rear of the UAV body where the power distribution board, battery compartment, flight controller (Pixhawk 4), and radio control receiver (RC receiver) are located (Figure 8). To test the effects from these vents, the UAV was placed in the laboratory without rotors. The motors were run at half throttle for about 15 min. Infrared photographs were taken (Figure 9) which show that the rear half of the UAV body warmed up significantly. Hotspots near the exhaust vents, RC controller on the left rear side, and the four rotor motors are clearly visible in the infrared image. When in flight, more heating likely occurs as the UAV has to keep its own body weight suspended against gravity and against the forces from the atmospheric winds, causing the motors to work harder.
When the iMET-XQ sensors are facing into the wind, i.e., upwind from the warm UAV body, the wind aspirates the sensors by removing heat away from them. When located downwind from the UAV body, the heat from the body and exhaust vents will drift towards the iMET-XQ sensors located on that side of the UAV body. It is possible that the wind flows through both vents, pushing additional warm air towards the downwind side which then reaches the iMET-XQ sensors on that side. Even the aspirated sensors on the rear rotor arms (“RightRear” or “LeftRear”) are impacted by the heat from the rear half of the UAV body. The warm air may get entrained into the propwash of the rear propellers. Since the heat-generating components are located in the back half of the UAV body, they do not impact the “LeftFront” and “RightFront” locations. The iMET-XQ sensors in these latter two locations almost always record cooler temperatures than the tower thermistor, because they are properly aspirated by the propeller wash from the UAV (Appendix A). Because the tower thermistor is not aspirated, it may warm up during sunny and calm conditions causing the TD = TiMET − T9.5 to be more negative. Figure 10 confirms that larger negative TD values are observed during weaker winds. The correlation coefficient between the TD and wind speed is weakly positive (0.20).
The pattern seen in Figure 7 is not apparent for the iMET-XQ sensors located in the Back and Front locations. Furthermore, these two sensors record primarily cooler temperatures than the tower sensor (Figure 5). The front half of the UAV body does not get as warm as the back, explaining the lack of heating of the sensor in the Front location. The lack of heating of the “Back” sensor is less obvious, because it is located close to all UAV body hotspots seen in the infrared image (Figure 9). However, the exhaust vents on the back (Figure 8) are directed away from the back of the UAV and this is perhaps the reason why the sensor in the Back location is not subjected to warm air flow. Moreover, for the Back sensor to be downwind, the wind would have to come in from the front of the UAV. Propwash and turbulence around the UAV body may have prevented the air from flowing towards the sensor on the back on top of the UAV body. Furthermore, the iMET-XQ sensors on the body of the UAV are attached to a balsam wood board (Figure 8), which may have insulated the sensor from direct contact with the heat sources below. However, since the Front and Back locations are not aspirated, they record slightly warmer temperatures on average than RightFront and LeftFront (Figure 5), but are still mostly cooler than the tower thermistor.
The UAV body warming effect is further illustrated in Figure 11 and Figure 12, which show the time series of various variables measured by the Mesonet tower as well as the iMET-XQ temperatures on the UAV during two different flight experiments. The various temperatures are shown in solid colored lines with values given on the inner left y axis. Various shades of red are used for the iMET-XQ sensors on the left side of the UAV. Various shades of green are used for iMET-XQs on the right side of the UAV. All other variables are shown in dashed lines. Solar radiation (mustard colored) is measured on the outer left y axis. The inner right y axis shows 10 m wind speed (cyan color). The outer right y axis shows angles and is shared by the wind direction (blue dots), solar azimuth (orange) and the solar elevation (brown). On 23 April 2019 (Figure 11) the wind direction (dark blue dots) is primarily from the south to southwest, meaning that the heat from the UAV body impacts the LeftSide and LeftRear sensors downwind (Figure 2), which, therefore, record warmer temperatures than the other iMET-XQ sensors and the tower thermistor. The wind speed on this day is below the optimal aspiration speed of 2.5 m s−1, but the solar radiation is also low (≤250 Wm−2). The remaining iMET-XQ sensors record cooler temperatures than the tower (as they are better aspirated than the tower due to propwash and/or airflow around the slightly bobbing UAV). On 6 March 2019 (Figure 12), the winds are between north and northeast. Hence, the right side of the UAV body is downwind (Figure 2), and the sensors in the RightSide and RightRear locations warm by a considerable amount compared to the remaining sensors and the tower sensor.
The LeftFront and RightFront sensors are not impacted by heating from the electronic components located in the rear half of the UAV body, plus they are well aspirated by the rotors of the UAV. Additionally, most of the 10 m flight experiments was carried out in the afternoon when the solar angle was between 180° (south) and 270° (west). The UAV was consistently flown facing east, meaning that the sun almost never directly shone on the front of the UAV (Figure 2). In addition to the favorable sun angle and the propwash-driven aspiration, the wind direction was rarely from behind the UAV (270°–315°, Figure 7), meaning that the heat generated by the propeller tip friction, heating the body of the UAV due to solar heating, and the heat from the electronic components were not advected towards the front-facing iMET-XQ sensors mounted on the rotor arms. Hence, they record significantly cooler temperatures (negative mean and median TDs in Figure 5) than the tower thermistor in its non-aspirated radiation shield. Larger negative TD = TiMET − T9.5 m values for the sensors in these locations are most likely caused by the warming of the tower thermistor (T9.5 m). On the 3 April 2019 (Figure 13), this can be seen quite clearly: the wind speeds are higher during the first 6 min of the flight, therefore, the tower sensor is well aspirated and agrees well with the iMET-XQ measurements. During the last 5 min of the flight, the wind speeds drop significantly, and the tower sensor temperature was observed to steadily increase above that of the iMET-XQ sensors.
Besides the eight iMET-XQ sensors mounted on the structure of the UAV itself, there were two sensors flown suspended underneath the UAV from a wire fastened to the front end of the UAV: “DangleHi” and “DangleLow”. Figure 5 shows that these two sensors displayed relatively cool biases compared to the tower thermistor in most cases. The advantage of suspended iMET-XQs is that they are far removed from the UAV’s warm components (motors, battery, electronic components, propeller friction, and the black main body heating up by the sun), but perhaps still susceptible to rotor wash if the latter was pushed towards the sensors by the environmental winds. Rotor wash typically reaches down a length of two times the propeller radius. The Iris+ propeller radius is 12.7 cm, so the rotor wash reaches approximately 25 cm down, which is right between “DangleHi” and “DangleLo”. Secondly, the sensors were suspended from the front of the UAV body and therefore, were far removed from the infrared radiation hot spots in the rear half of the UAV body. Thirdly, the suspended iMET-XQ sensors (DangleHi and DangleLo) were observed to sometimes swing around significantly while the UAV was in flight (directly observed by authors Kimball and Montalvo) causing them to intermittently receive aspiration when the amplitude of the swings was large, but to also intermittently face the sun directly. No clear discernable patterns of suspended iMET-XQ performance as a function of wind speed (which perhaps caused larger sways) were found. Unfortunately, no data were recorded during the flights regarding the presence and degree of swing of the suspended iMET-XQs or the direction the suspended iMET-XQ sensors were facing relative to the sun. All of the above may have contributed in varying degrees to the relatively good performance of the suspended iMET-XQ sensors.
DangleHi (iMET21) collected data for only 52 out of 190 min due to a temperature sensor failure sometime after 12 March 2019; it collected data on the first five experiment days shown in Figure 4. During those experiments, DangleHi was almost always cooler than DangleLo. DangleHi was located closer (21 cm below the UAV body) to the UAV body and may have been aspirated by some of the prop wash, whereas DangleLo (44 cm below the UAV body) was possibly too far below the UAV to feel the effects from propwash. However, it possibly experienced better aspiration from larger amplitude swings (being located at the bottom of the wire). However, during the five experiments, when it collected data, this sensor did not experience the same range of wind, stability, solar radiation, and sun angle conditions that the sensor in the DangleLo position did, making the comparison difficult.
The Front, Back, DangleHi, and DangleLo locations are not impacted by UAV body heat, but are not aspirated by the UAV rotors either. Hence, they record slightly cooler temperatures than the tower but not to the extent that the LeftFront and RightFront do (the median and mean TDs are negative in Figure 5, but not as large negative as the aspirated sensors in the RightFront and LeftFront locations).

3.4. Influences of Local Wind Conditions and Solar Radiation

As mentioned earlier, it can be seen in Figure 4 that on some days the spread in TDs is larger than in others. Moreover, most days show a cold bias of the iMET-XQ sensors compared to the tower sensors but this is more extreme on some days than others. Recall that on each experiment day, the TDs for each iMET-XQ and for each minute in the experiment were included in the boxplot. Therefore, the spread of the boxplot indicates how well the iMET-XQ sensors compare to one another; a small spread means the iMET-XQ sensors agree well. The value of the mean or median indicates how well the iMET-XQ sensors agree with the tower sensor; if the mean/median is close to zero, the tower sensor agrees well with all iMET-XQ sensors, at least on average. On the 14 March 2019, for example, the iMET-XQ sensors agree well with one another (small spread), but also with the tower sensor (a mean very close to zero). Figure 4 and Table 3 show that on this day, the solar radiation was relatively low and the wind speed high enough to sufficiently aspirate the tower sensor in its non-aspirated radiation shield. The wind direction is primarily from the southeast, therefore, the LeftSide and LeftRear sensors show a slight warm bias (not shown) due to their location downwind from the warm UAV body.
Lower TD spreads (Figure 4) are seen on other low radiation dates as well (12 March, 14 March, 25 March 23 April, and 9 May 2019). However, this is not the case on the 1 August 2019. On this day, the 10 m flight experiment took place during low solar radiation values (less than 250 W m−2). However, two minutes prior to the start of the 8-min flight, the solar radiation values were almost as high as 1000 W m−2 (Figure 14). This caused the tower sensor to warm, especially when the winds dropped to almost zero during the second and third minutes (12:10 and 12:11 CST equivalent to 18:10 and 18:11 UTC) of the flight. Once the winds picked up, the tower sensor became well aspirated and the temperature dropped to agree better with the iMET-XQ sensors. On this day, significant variability in the wind direction was observed, causing the iMET-XQ locations affected by the warm UAV body to warm up as they became positioned downstream from the UAV body. This further contributed to the large spread in TD values seen on that day.
An unexpected low spread was seen on 27 June 2019, a day with high solar radiation values and a relatively weaker wind speed. However, on this day, four of the ten iMET-XQ sensors malfunctioned. Three of these were in locations impacted by the UAV body heat. This meant that the remaining iMET-XQ sensors agreed well with one another (not shown). The cool bias on that day was caused by the strong solar radiation and weaker winds allowing the tower sensor to become warmer due to limited aspiration.
Another interesting observation is the slightly larger spread seen on the 25 March 2019 as compared to 14 March. Both days have almost the same (low) radiation value, but it was much windier on the 25 March (Table 3 and Figure 4). The large spread was primarily caused by the iMET-XQ in the LeftSide location; the LeftRear iMET-XQ sensor malfunctioned during this flight (not shown). The strong winds from the southwest caused the UAV to have to work hard at maintaining its position next to the tower. Therefore, the rotor motors were likely drawing more battery power, causing the electronic components in the UAV to warm up more. The winds were coming from the southwest, placing location the LeftRear on the downwind side of the UAV body. A cool bias of the iMET-XQ sensors on the 25 March as compared to the 14 March was caused by the same phenomenon as on the 1 Aug 2019: prior to the flight, the solar radiation was higher and the winds weaker than those during the flight. This caused the tower sensor to be slightly warmer during the first few minutes of the flight. Strong winds soon managed to cool the tower sensor so that better agreement with the iMET-XQs was seen in the second half of the flight. This resulted in a smaller overall cooler bias than on the 1 August 2019.
Larger TD spreads are observed on days with strong solar radiation (27 February, 6 March, 27 March, 3 April, 17 April, 3 May, and 14 May 2019). Not only do the iMET-XQs downwind from the warm UAV body record warmer temperatures, more spread is also seen in the temperature measurements of the remaining iMET-XQ sensors. In low solar radiation conditions, the iMET-XQ temperature measurements tend to be clustered close together (e.g., 23 April 2019, Figure 11). Comparing 23 April 2019 to 6 March 2019 (Figure 12), when the solar radiation was higher (just over 500 W m−2), much larger differences were seen between the iMET-XQ temperature measurements. Higher solar radiation typically causes atmospheric instability leading to turbulent eddies which unevenly transport heat, possibly resulting in a larger spread in iMET-XQ temperature measurements (Figure 4). The turbulence perhaps also advected heat from the rotor motors over different sensors at different times. Additionally, iMET-XQ sensors in the locations Front and Back, which do not experience aspiration from propwash, record warmer temperatures in sunny conditions when they are not pointed directly into the wind (e.g., 6 March 2019, Figure 12). In other words, they record warmer temperatures when it is sunny and they are not aspirated sufficiently. The iMET-XQ sensors on the front, which are not affected by the warm UAV body and are aspirated by the rotors (LeftFront and RightFront), record lower temperatures. This can also be seen in Figure 12.
Strong solar radiation days with low TD spreads occurred on the 27 June 2019 and 26 April 2019. The unexpected low TD spread on the 27 June 2019 was already discussed. On the 26 April 2019, the conditions were very similar to those on the 6 March 2019 (Figure 12). On both days, the solar radiation was relatively strong (around 550 W m−2) and the wind direction ranges between north and northeast on both days. The latter causes heat from the UAV body to increase the temperature measured by the sensors on the right side of the UAV (RightSide and RightRear) on both days. However, on the 6 March 2019 these two sensors were much warmer than on the 26 April 2019, leading to more inconsistent measurements and explaining the larger spread observed on the former date (Figure 4). The reason for these sensors being warmer on the 6 March is unclear. The wind speeds were stronger on the 26 April, meaning that the UAV was working harder to hover, causing the electronic components to warm up more. This would mean that the sensors downwind from the UAV would warm up more than in lower wind speeds. However, this was not the case. Another difference was the solar azimuth angle: on the 6 March, it was closer to southwest (Figure 12) while on the 26 April it was almost west (not shown). As a result, the right (downwind) side of the black UAV body was facing the sun on the 6 March. This may have caused the body of the UAV to warm from being exposed to the sun. in addition to warming from the electronic components inside. This perhaps contributed to the additional warming of the sensors on that side as well, as a result of both direct warming from the sun and additional downwind warming from the black UAV body.
The experiment on the 16 May 2019 shown in Figure 15 is interesting because two flights occurred back to back on the same day; the first during weak solar radiation conditions, and the second during relatively strong solar radiation. Solar elevation angle and solar azimuth remain fairly constant during the flights. During the first flight, the low solar radiation allows the iMET-XQ sensors to record very similar temperatures except for LeftSide, the iMET-XQ located downwind from the UAV body (LeftRear malfunctioned during the first flight). During the second flight, the increased solar warming of the surface caused more turbulence as evidenced in a more changeable wind direction. Even though the wind direction was more changeable, the LeftSide and LeftRear sensors remained downwind from the UAV body and warmed up more than the other sensors. Increased turbulence and uneven heating by turbulent eddies caused more spread in the temperature measurements of the iMET-XQ sensors during the second flight. The increase in solar radiation at the beginning of the second flight caused the temperatures measured by the tower sensor and the iMET-XQ sensors to increase. The well aspirated LeftFront and RightFront sensors warmed the least. However, when the wind speeds increased around 15:09 CST, improved aspiration caused the temperature measurements from all sensors (including the tower sensor) to converge towards the temperatures of the LeftFront and RightFront sensors.

3.5. Sensor Testing during a Morning Inversion

Nine early morning soundings were flown starting just before sunrise and ending almost 2.5 h after sunrise. The resulting pressure–time section of the temperature was produced using simple linear interpolation and is shown in Figure 16. The start times of the soundings are shown on the x axis. Local sunrise on that day occurred at 4:49 CST (10:49 UTC). An early morning inversion can clearly be seen until about two hours after sunrise. After that, the boundary layer mixing takes over and the temperature becomes more evenly distributed with height.
This example illustrates that unshielded iMET-XQ sensors mounted on an off-the-shelf UAV are capable of observing realistic meteorological phenomena. It also illustrates the usefulness of using multiple iMET-XQ sensors since sometimes GPS connectivity is lost and/or sensors get damaged during the flight or landing.

4. Conclusions

In ref. [
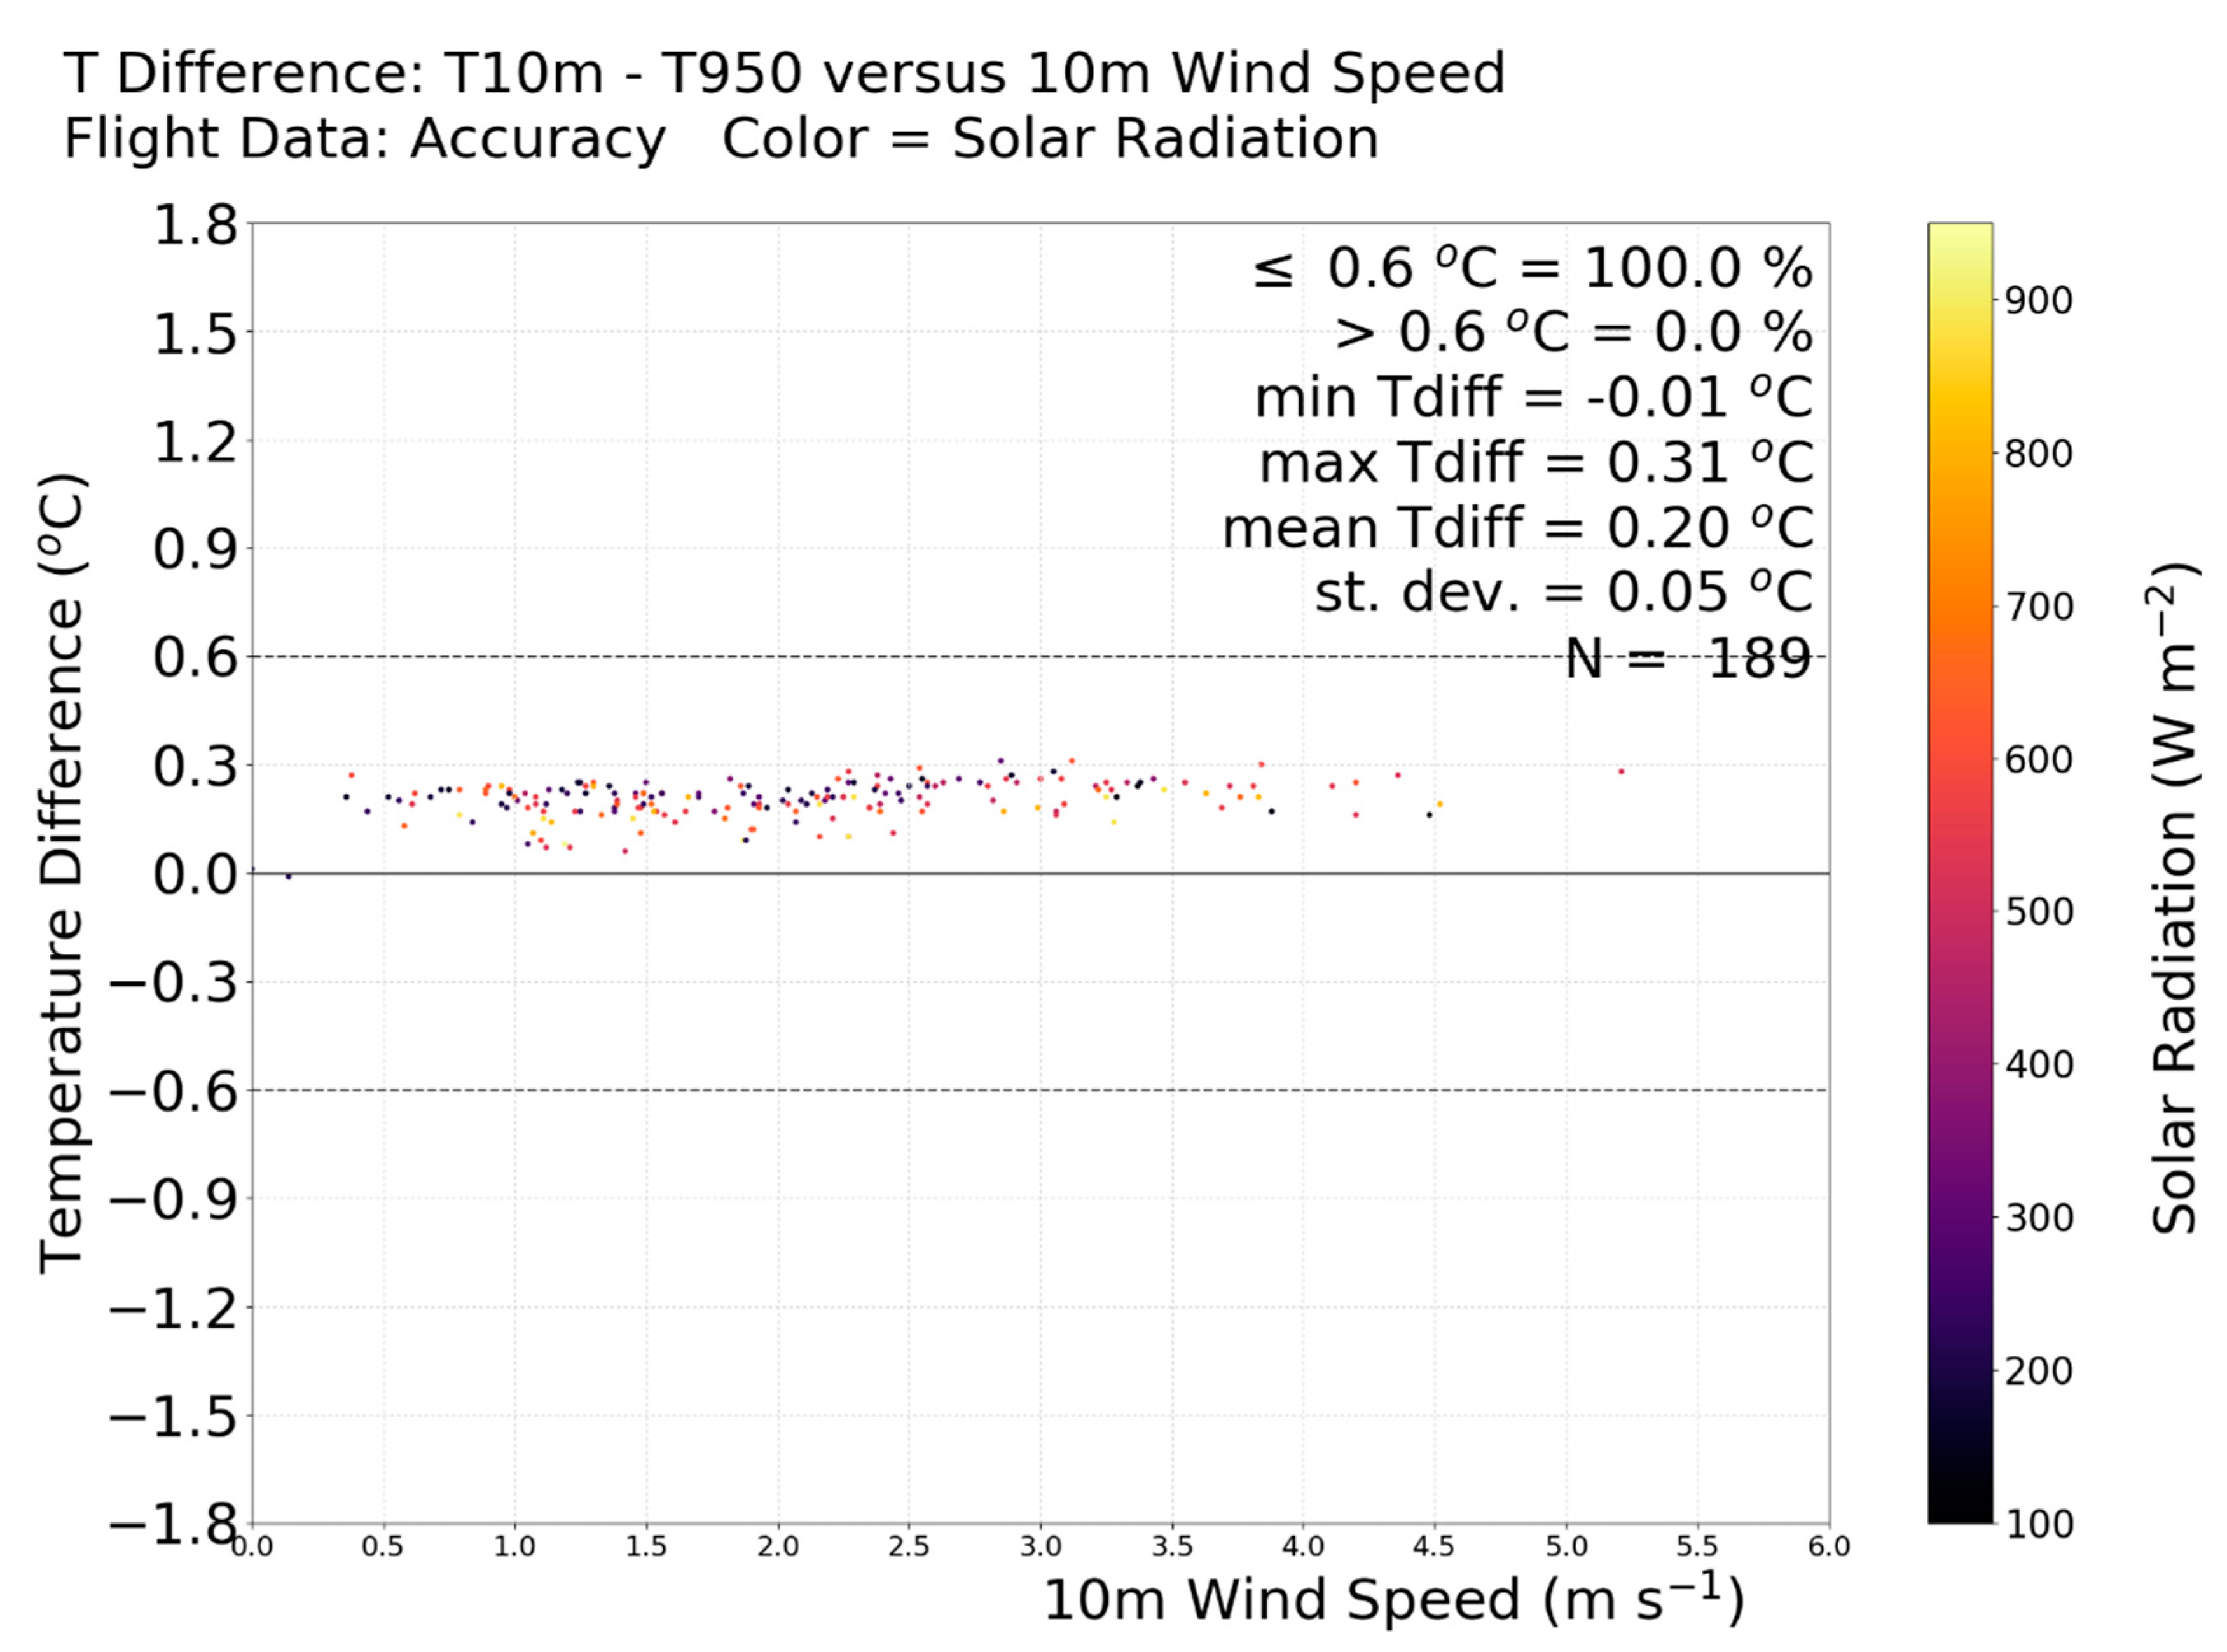
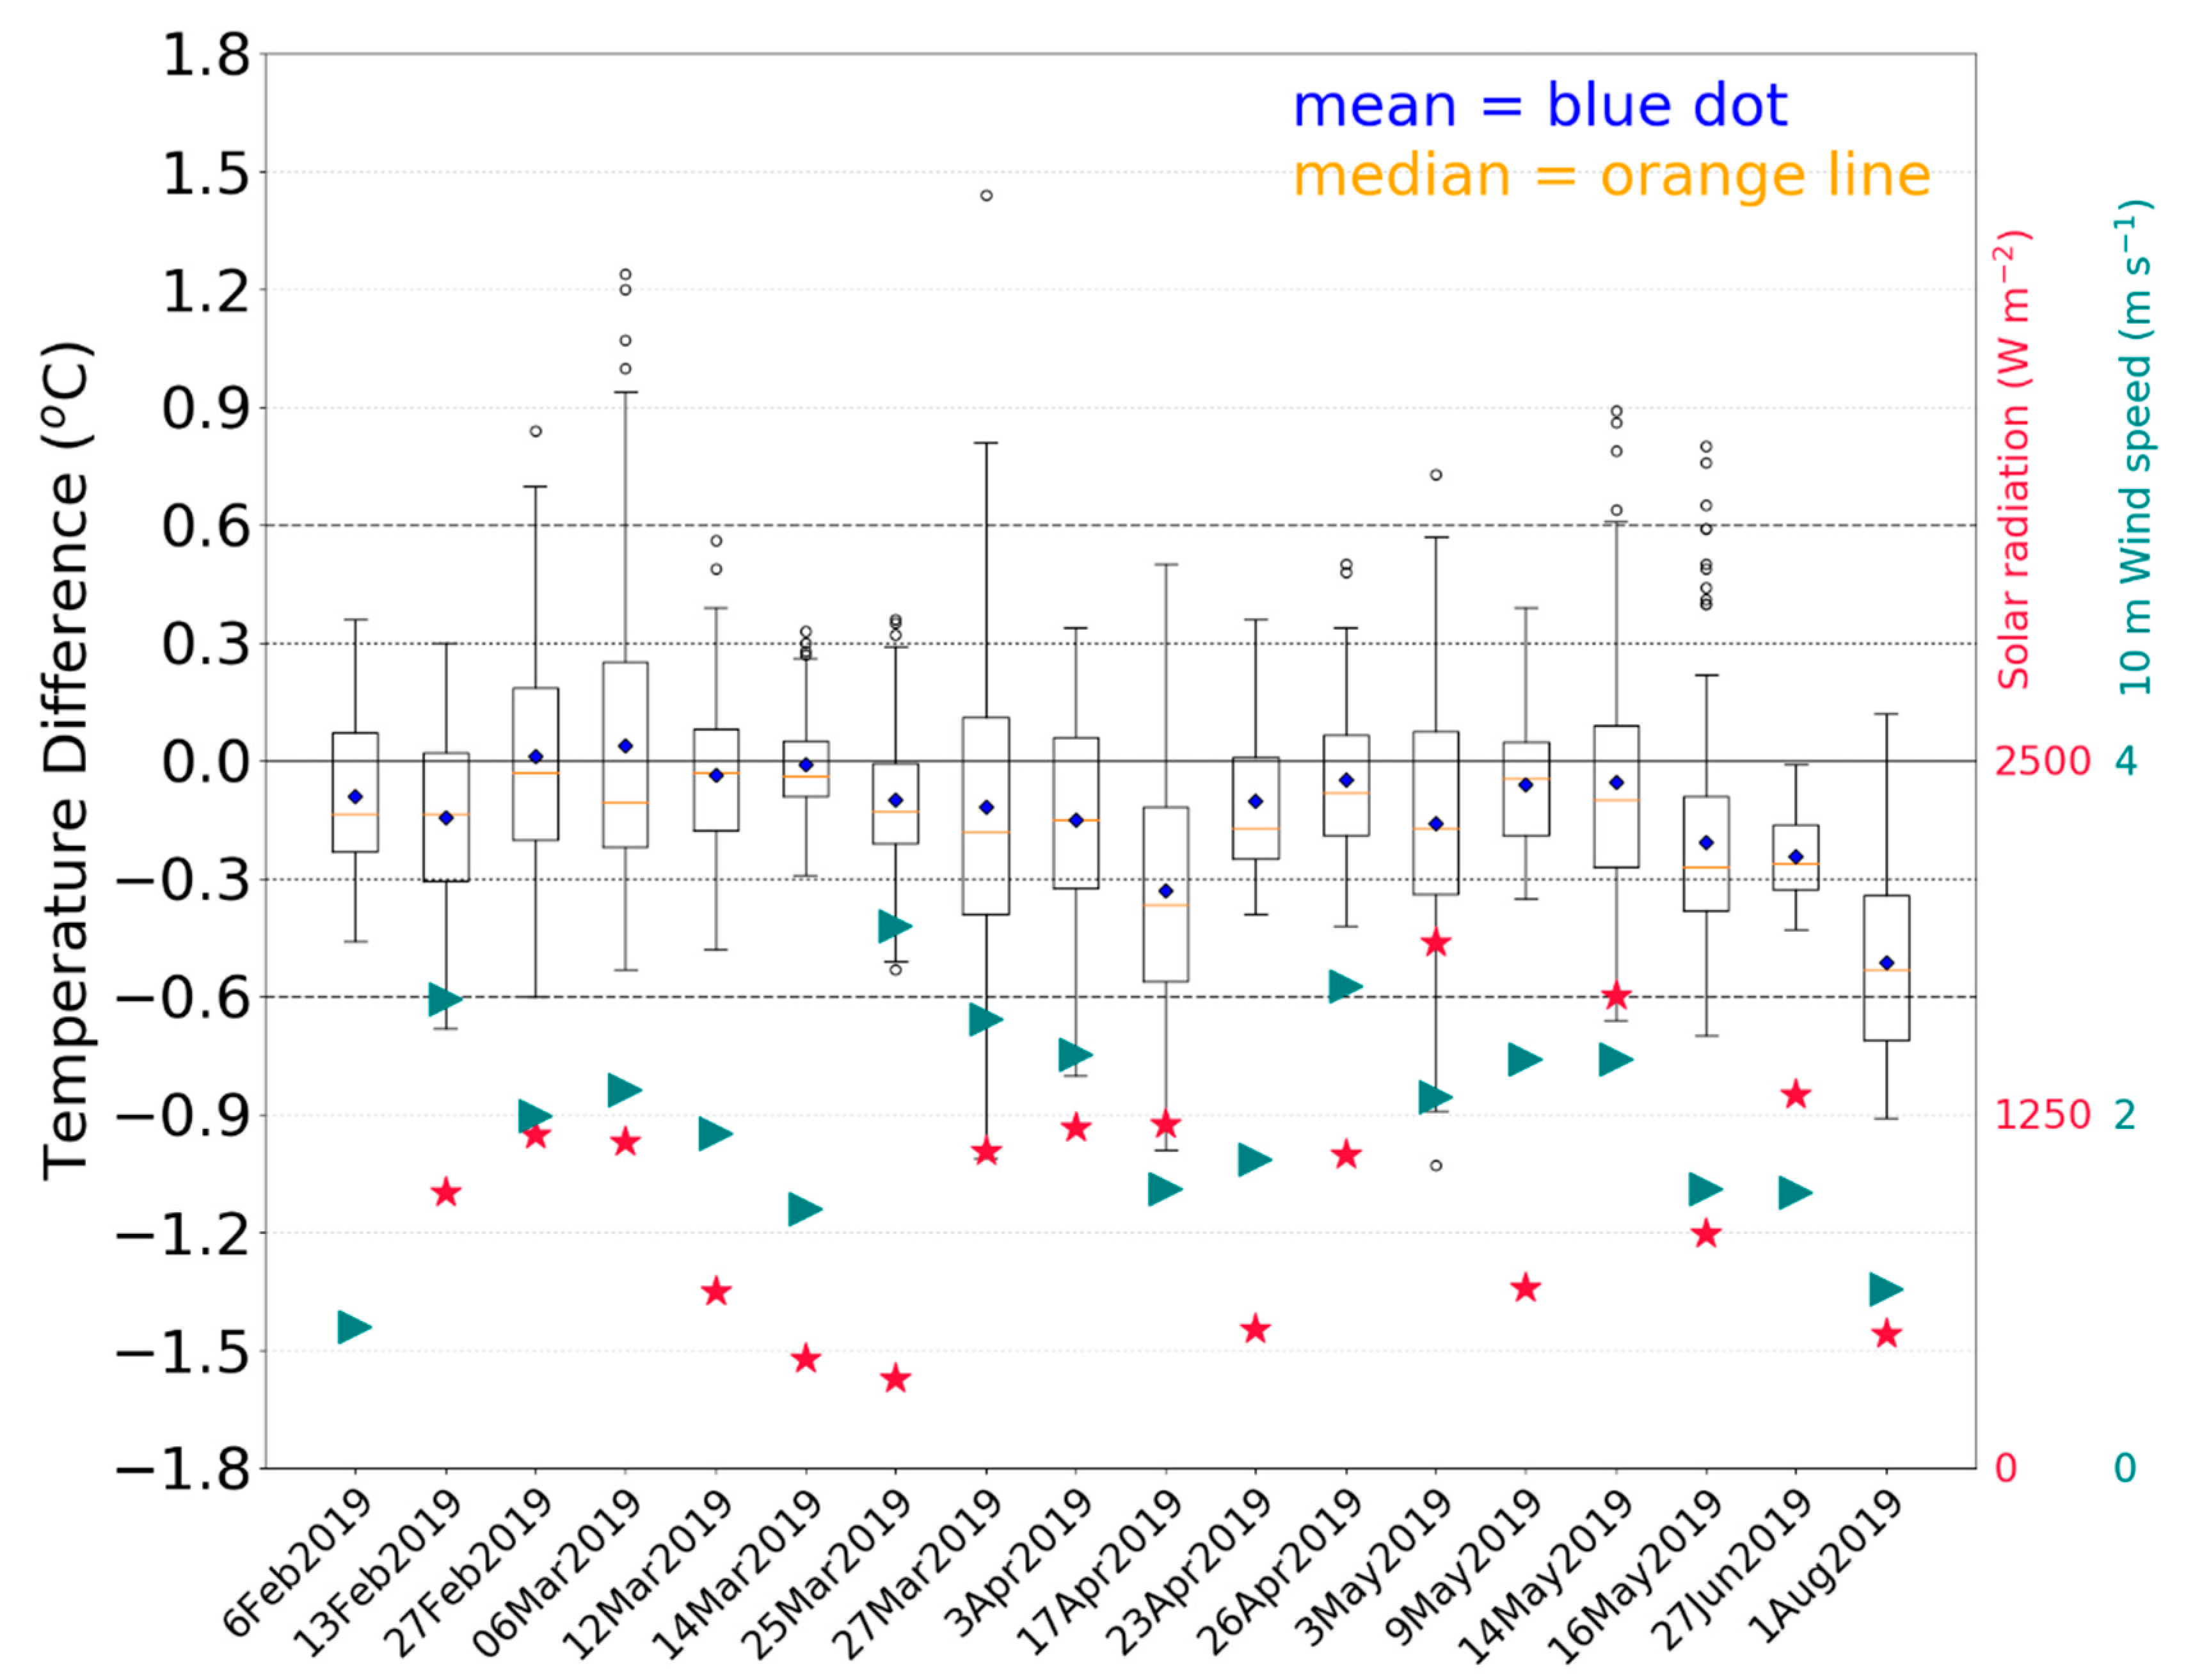
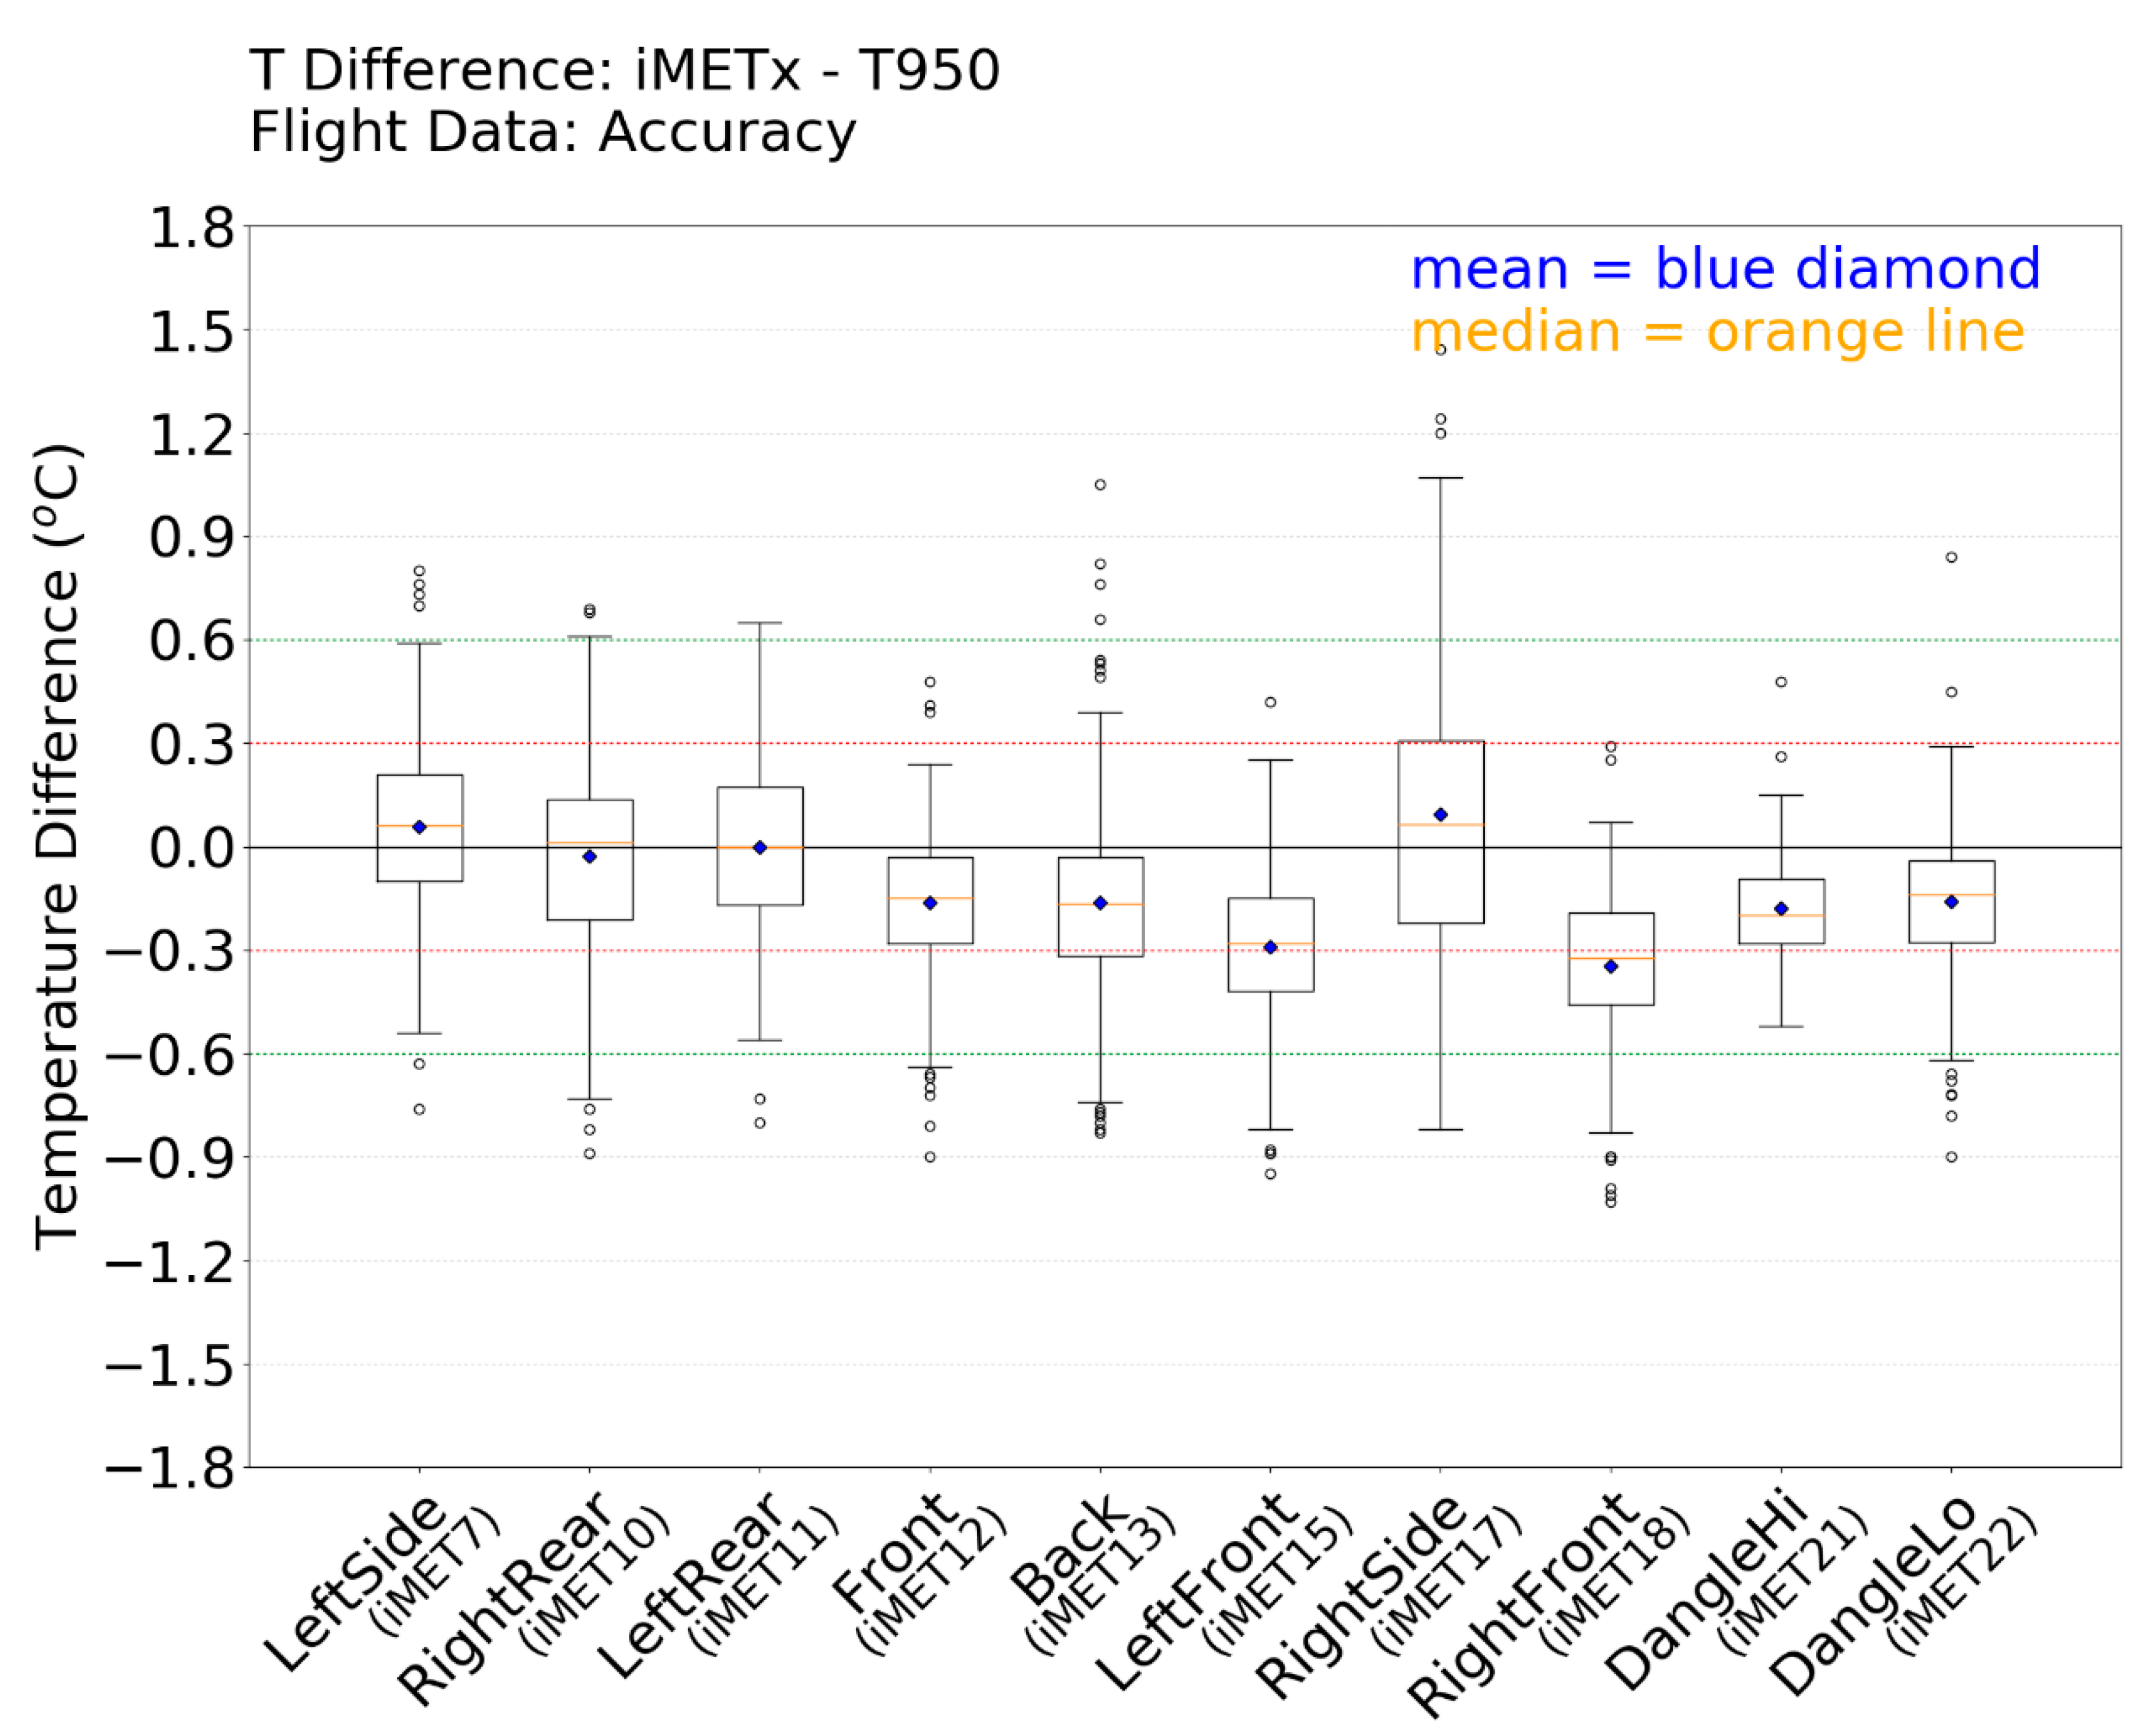
18], it was shown that for stationary experiments, the iMET-XQ sensors (1) are most precise and accurate under overcast conditions and (2) do not need to be shielded from solar radiation as long as they are properly aspirated. Here it is shown that overall (all UAV locations and all experiment days together), the iMET-XQ sensors show excellent agreement with the tower standard: 64.8% of all temperature differences are less than 0.3 °C and 93.0% are less than 0.6 °C. The mean plus or minus the standard deviation of the temperature differences is −0.23 °C ±0.24 °C. However, limiting the use of UAVs to overcast conditions is not a practical solution, because in many cases the objective of field campaigns is to measure phenomena that vary with solar intensity including land-use change studies, urban heat island effects, atmospheric turbulence, and surface heat/moisture fluxes.
Both the UAV and the environment influence the accuracy (agreement with reference sensor on the Mesonet tower) and precision (agreement amongst iMET-XQ sensors) of iMET-XQ temperature measurements. The interplay between the effects from the warm UAV elements and the environmental conditions can be complex.
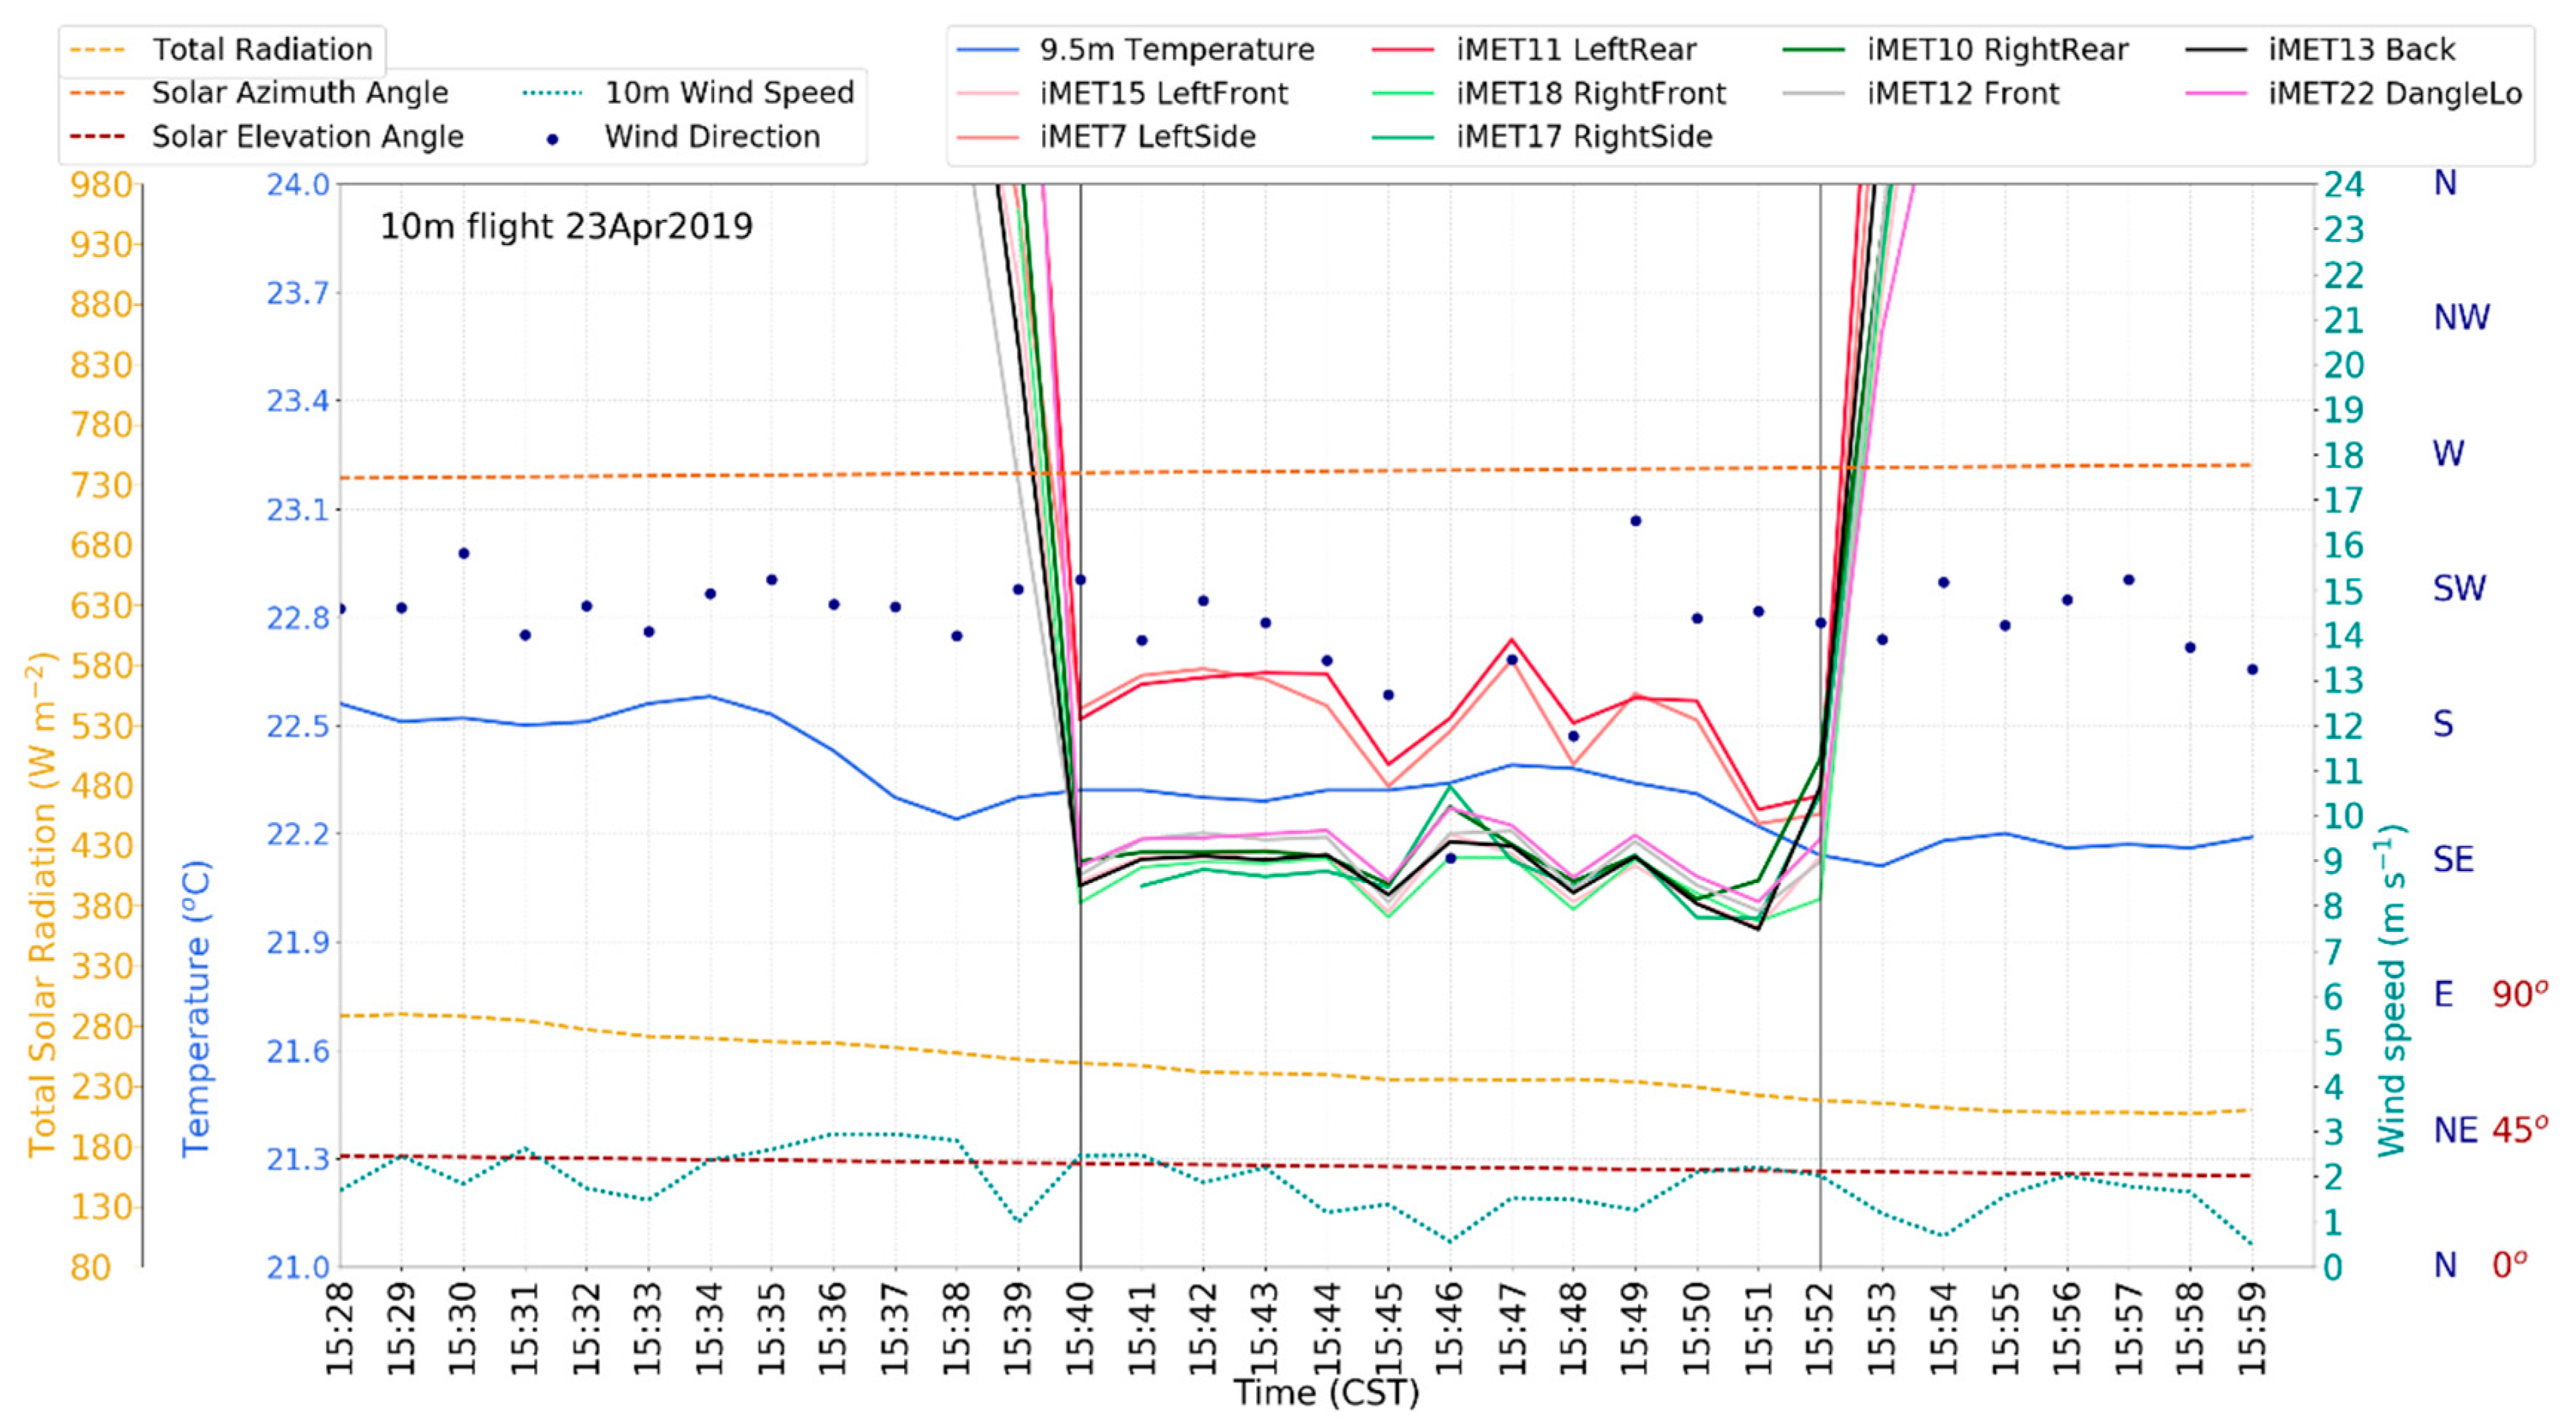
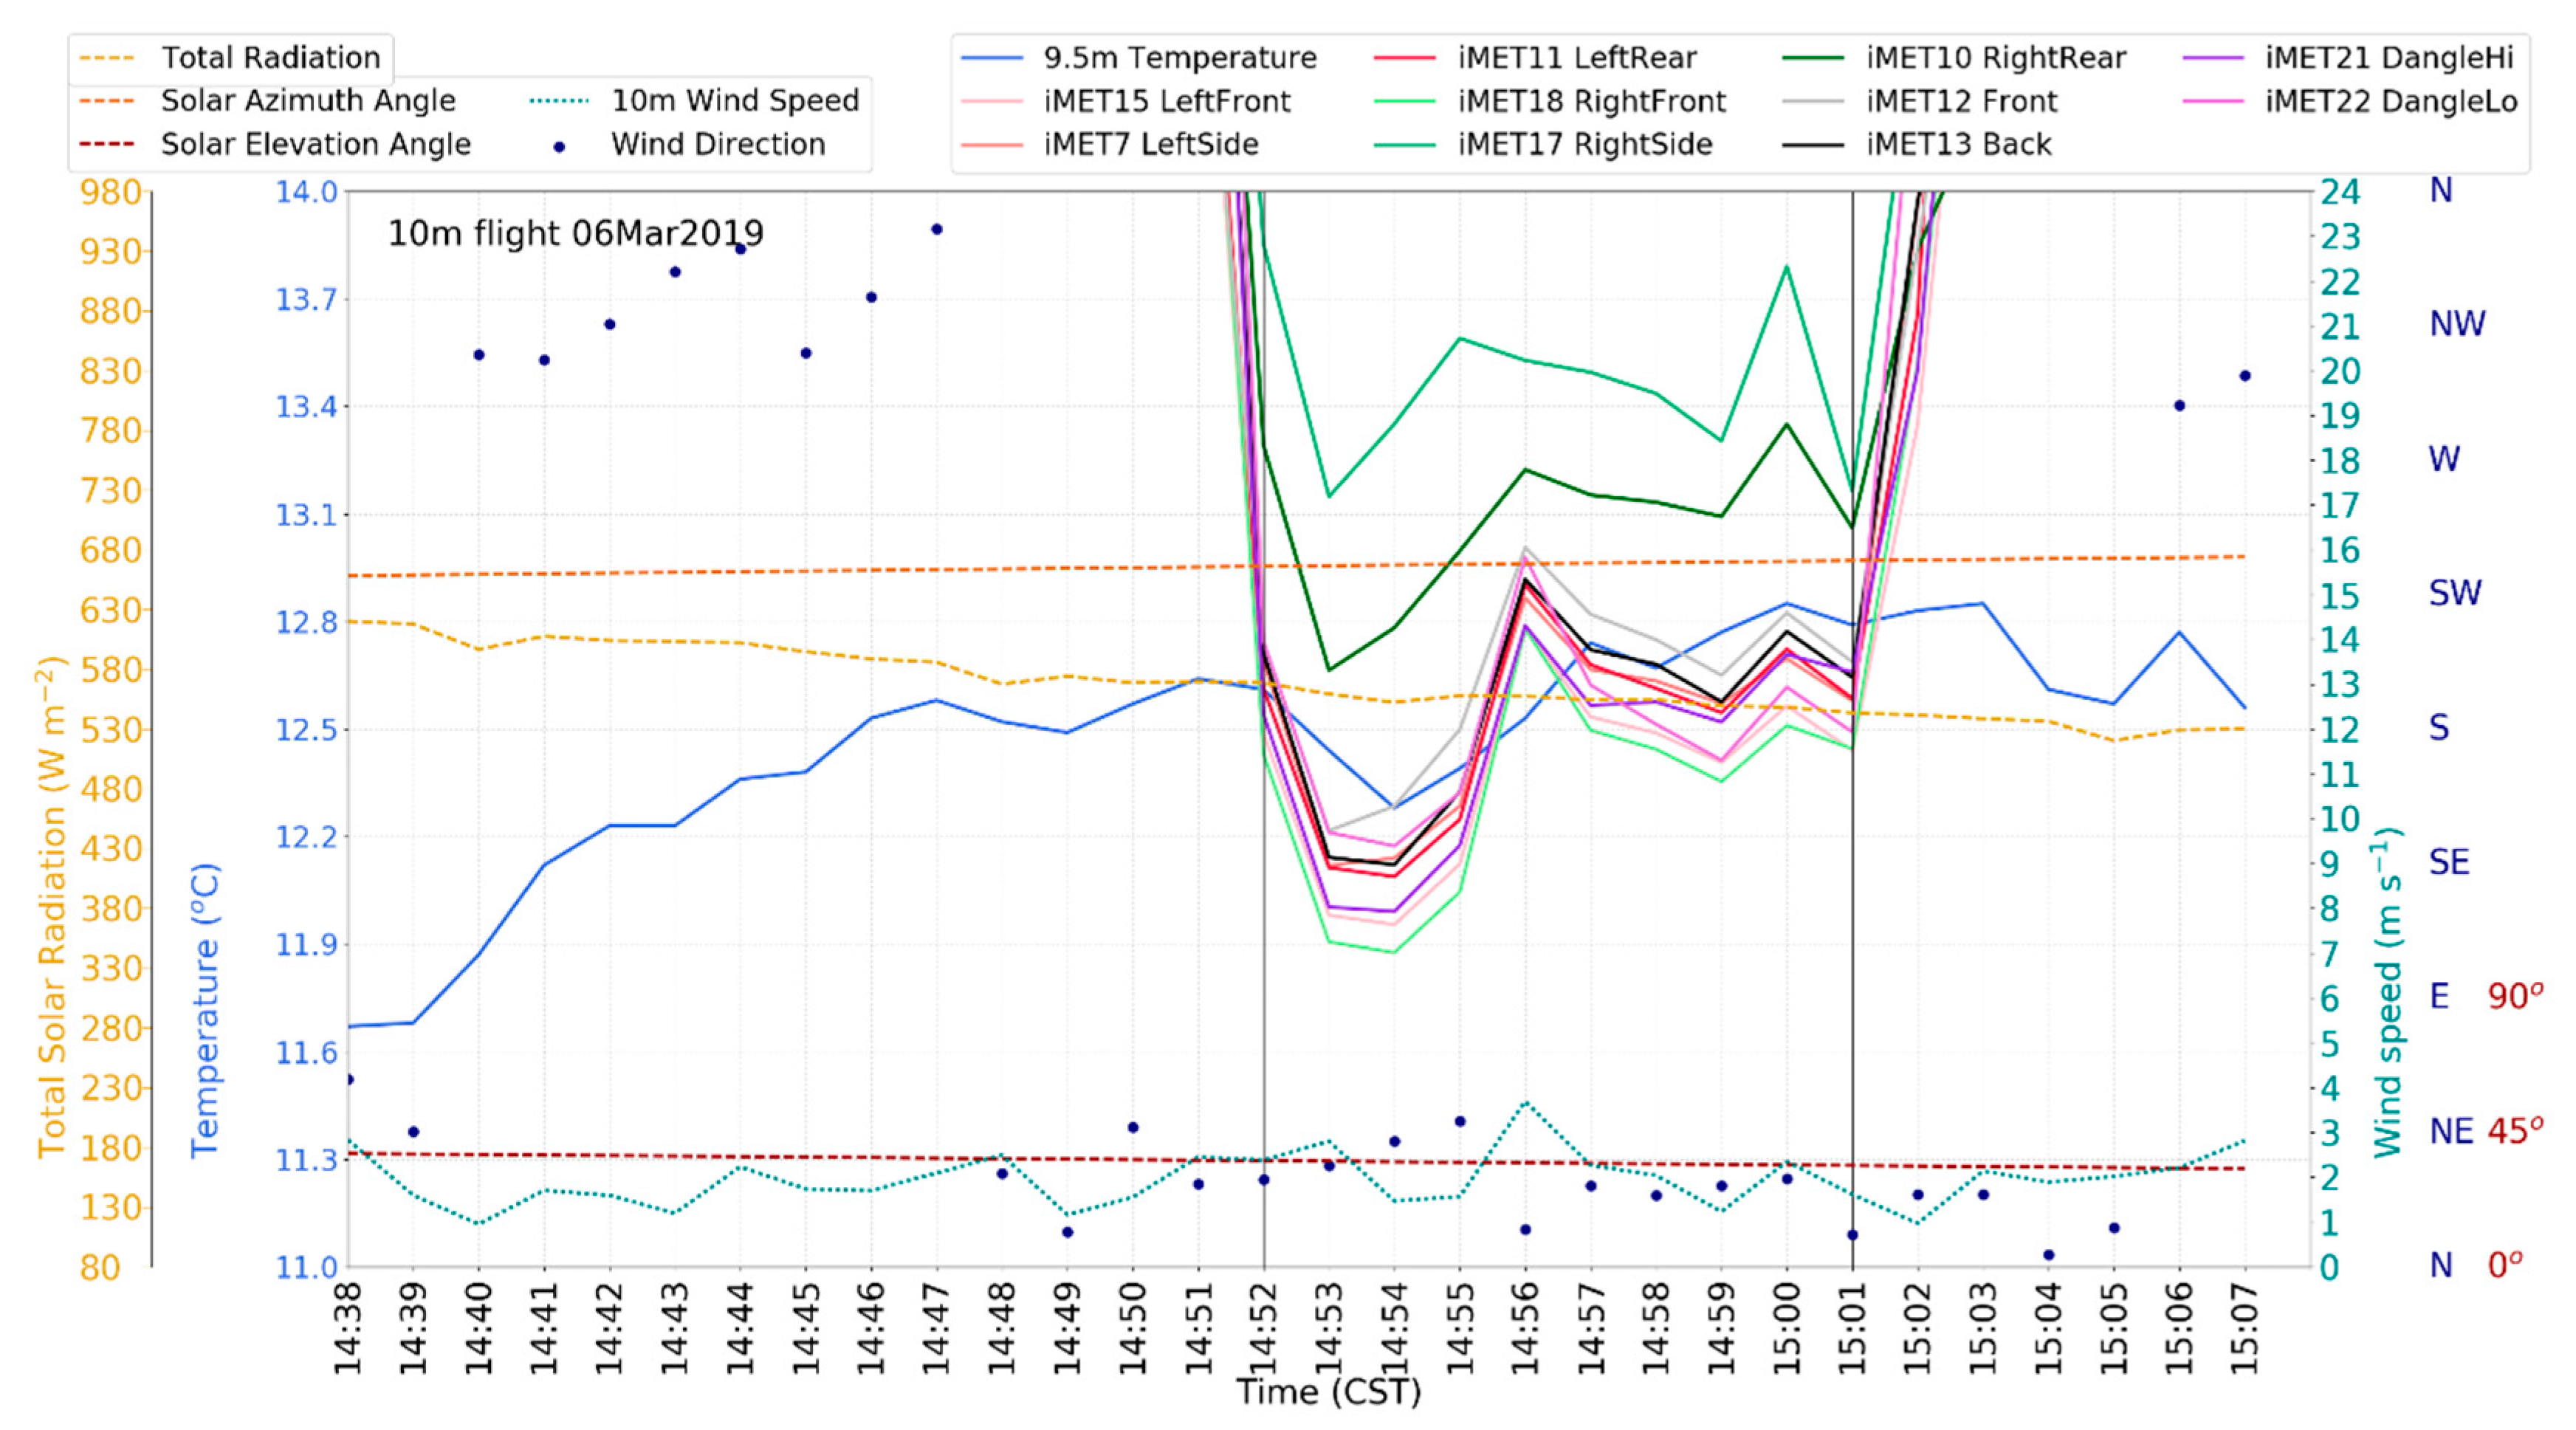
Infrared radiation, or heat, generated by the electronic components in the rear half of UAV body has a significant influence on the iMET-XQ temperature measurements, regardless of solar radiation conditions. However, this is highly dependent on wind direction. If the sensors located on the rear half of the UAV body are downwind from the UAV body, they record temperatures that are warmer than the other iMET-XQ sensors and warmer than the Mesonet tower sensor. This is the case even if the sensors are aspirated by propwash. This is in agreement with the conclusions from ref. [3], where the authors suggested that the grey plastic shell of the UAV body may have absorbed heat from the sun, that was subsequently transported towards the downwind sensors. In their study, however, there was no mention of heat generated by electronic components inside the UAV body.
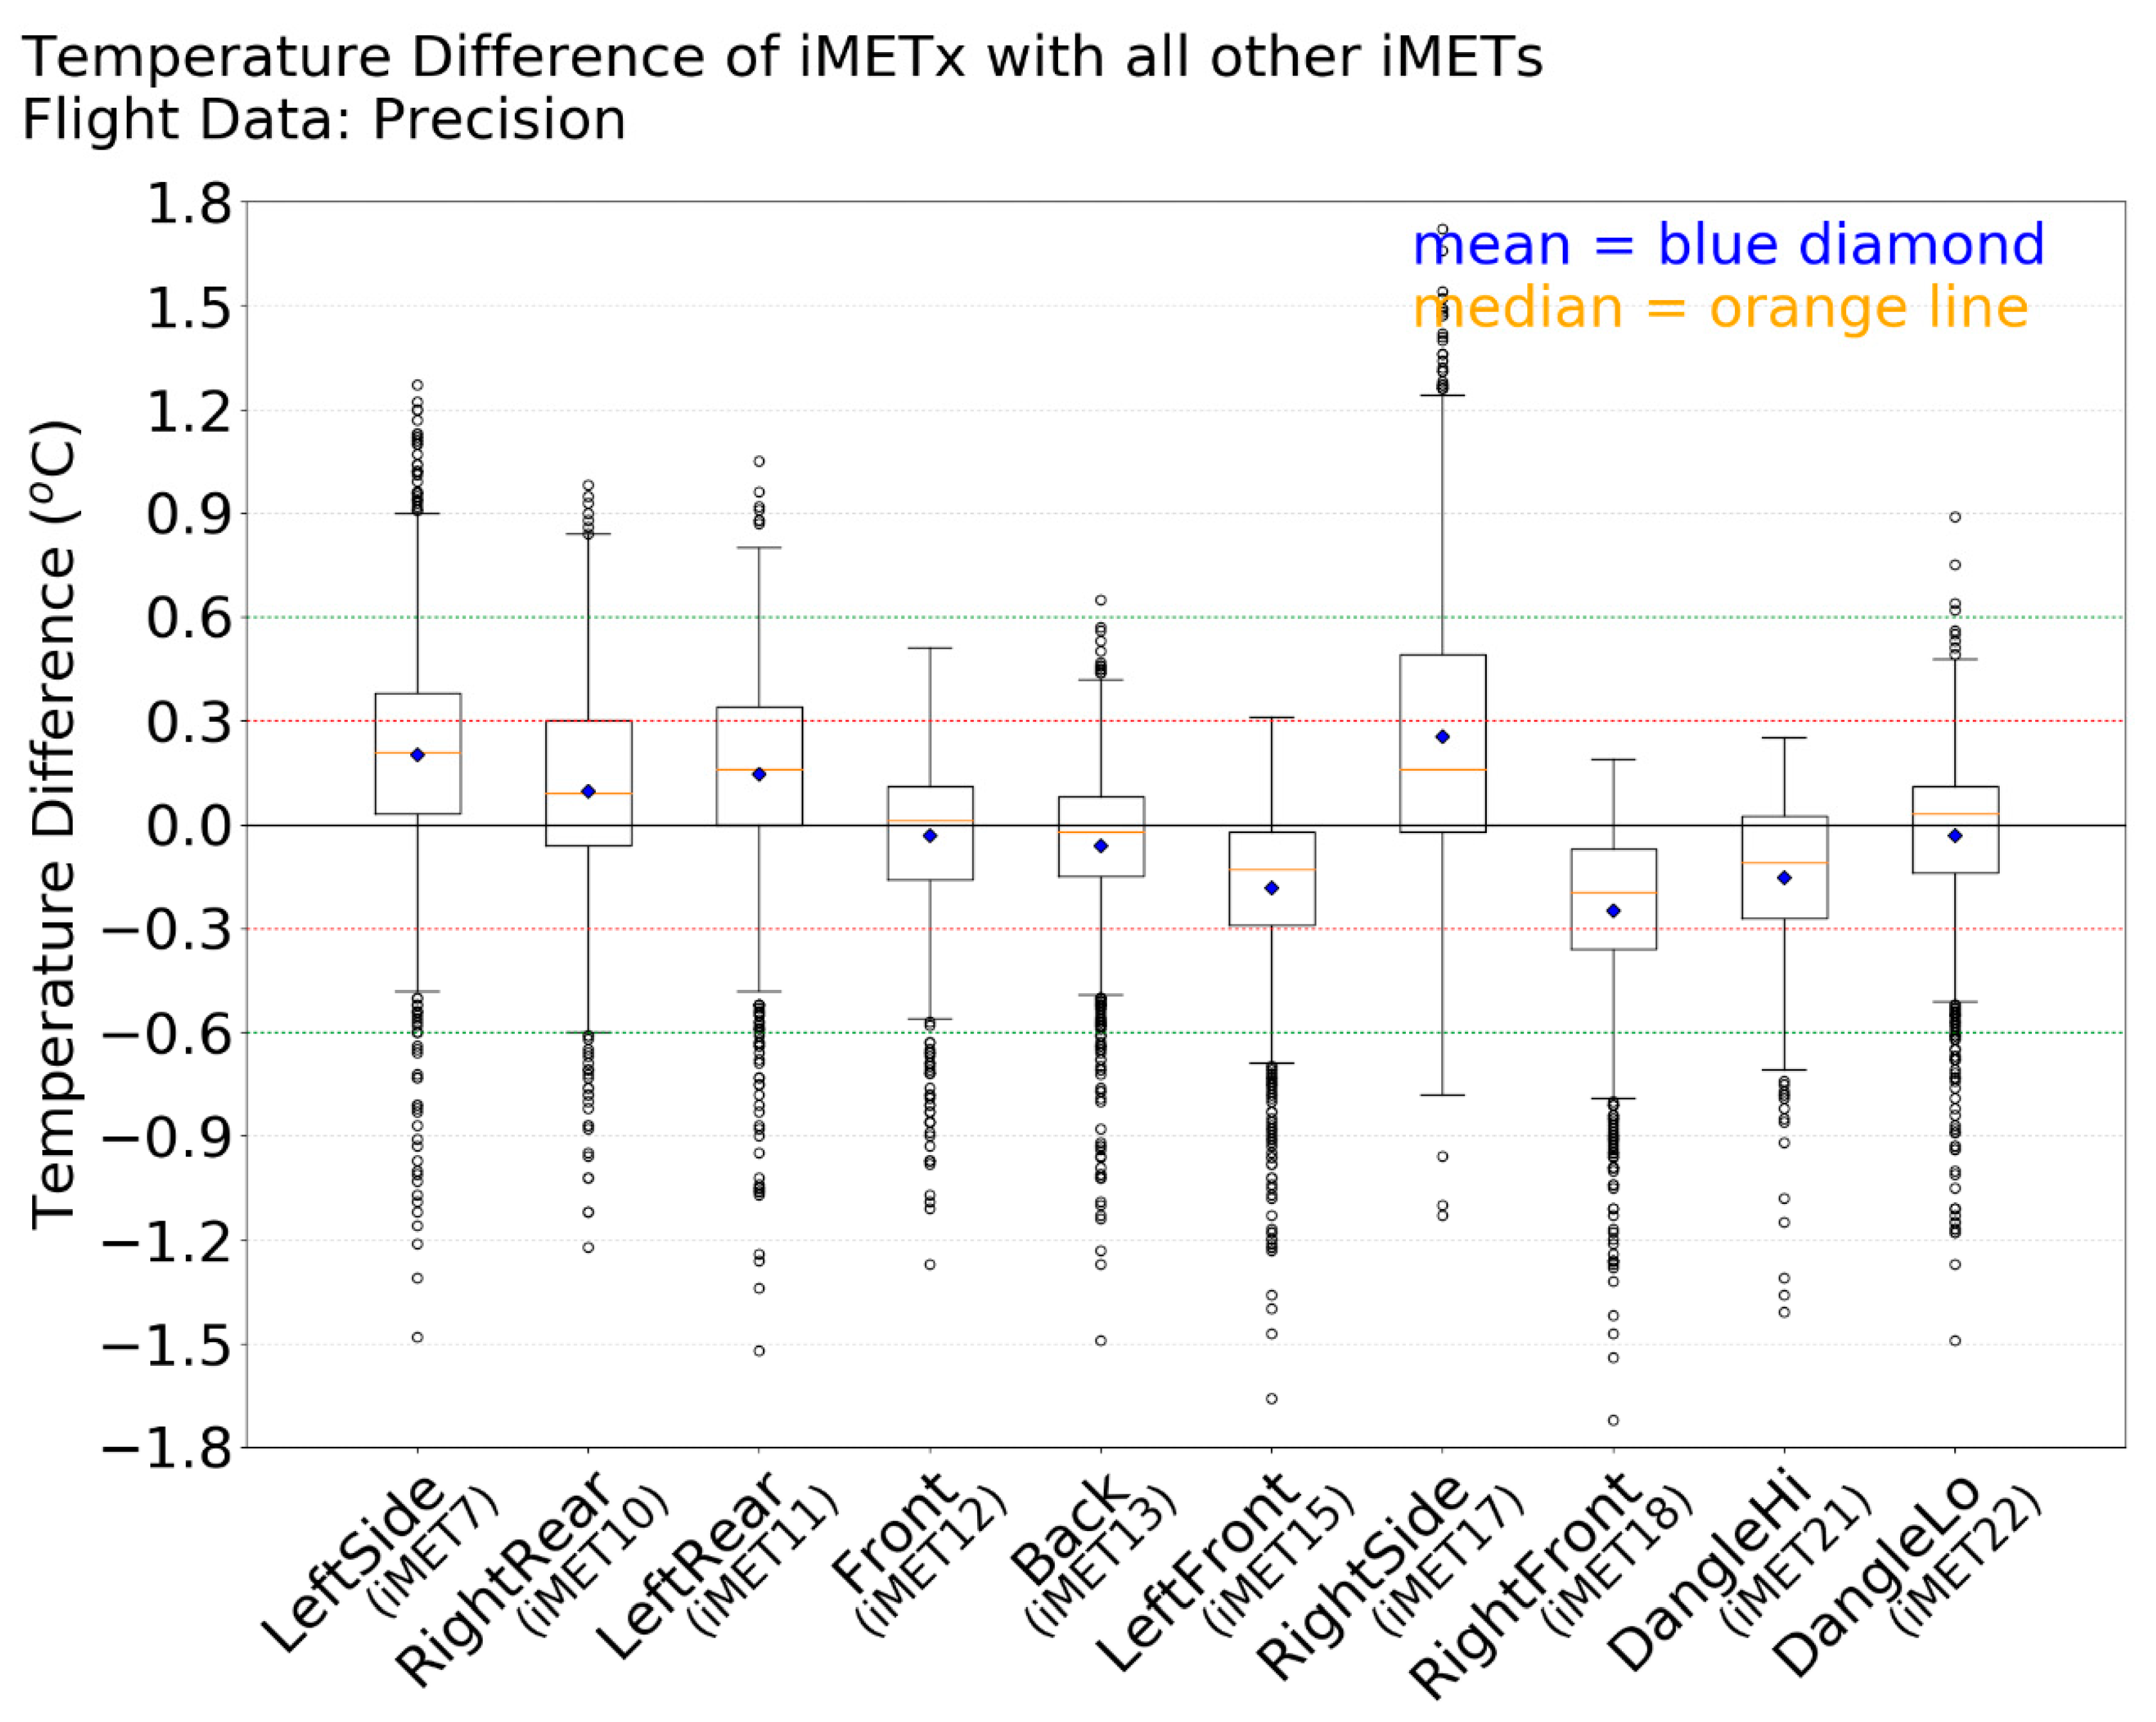
During high solar radiation conditions, the iMET-XQ sensors are less precise and larger differences between the temperature measurements from the iMET-XQ sensors in different locations on the UAV are seen. Turbulent eddies transport heat unevenly, causing the different sensors to record warmer temperatures at different times. Changing wind directions may also unevenly distribute the heat generated from the UAV body, from the rotor motors on the end of the UAV propeller arms, and from propeller friction.
Measurements from the iMET-XQ sensors suspended below the UAV perform quite well, especially if located far enough from the body of the UAV to not be susceptible to heat being advected or blown from the body of the UAV, but close enough to benefit from propwash.
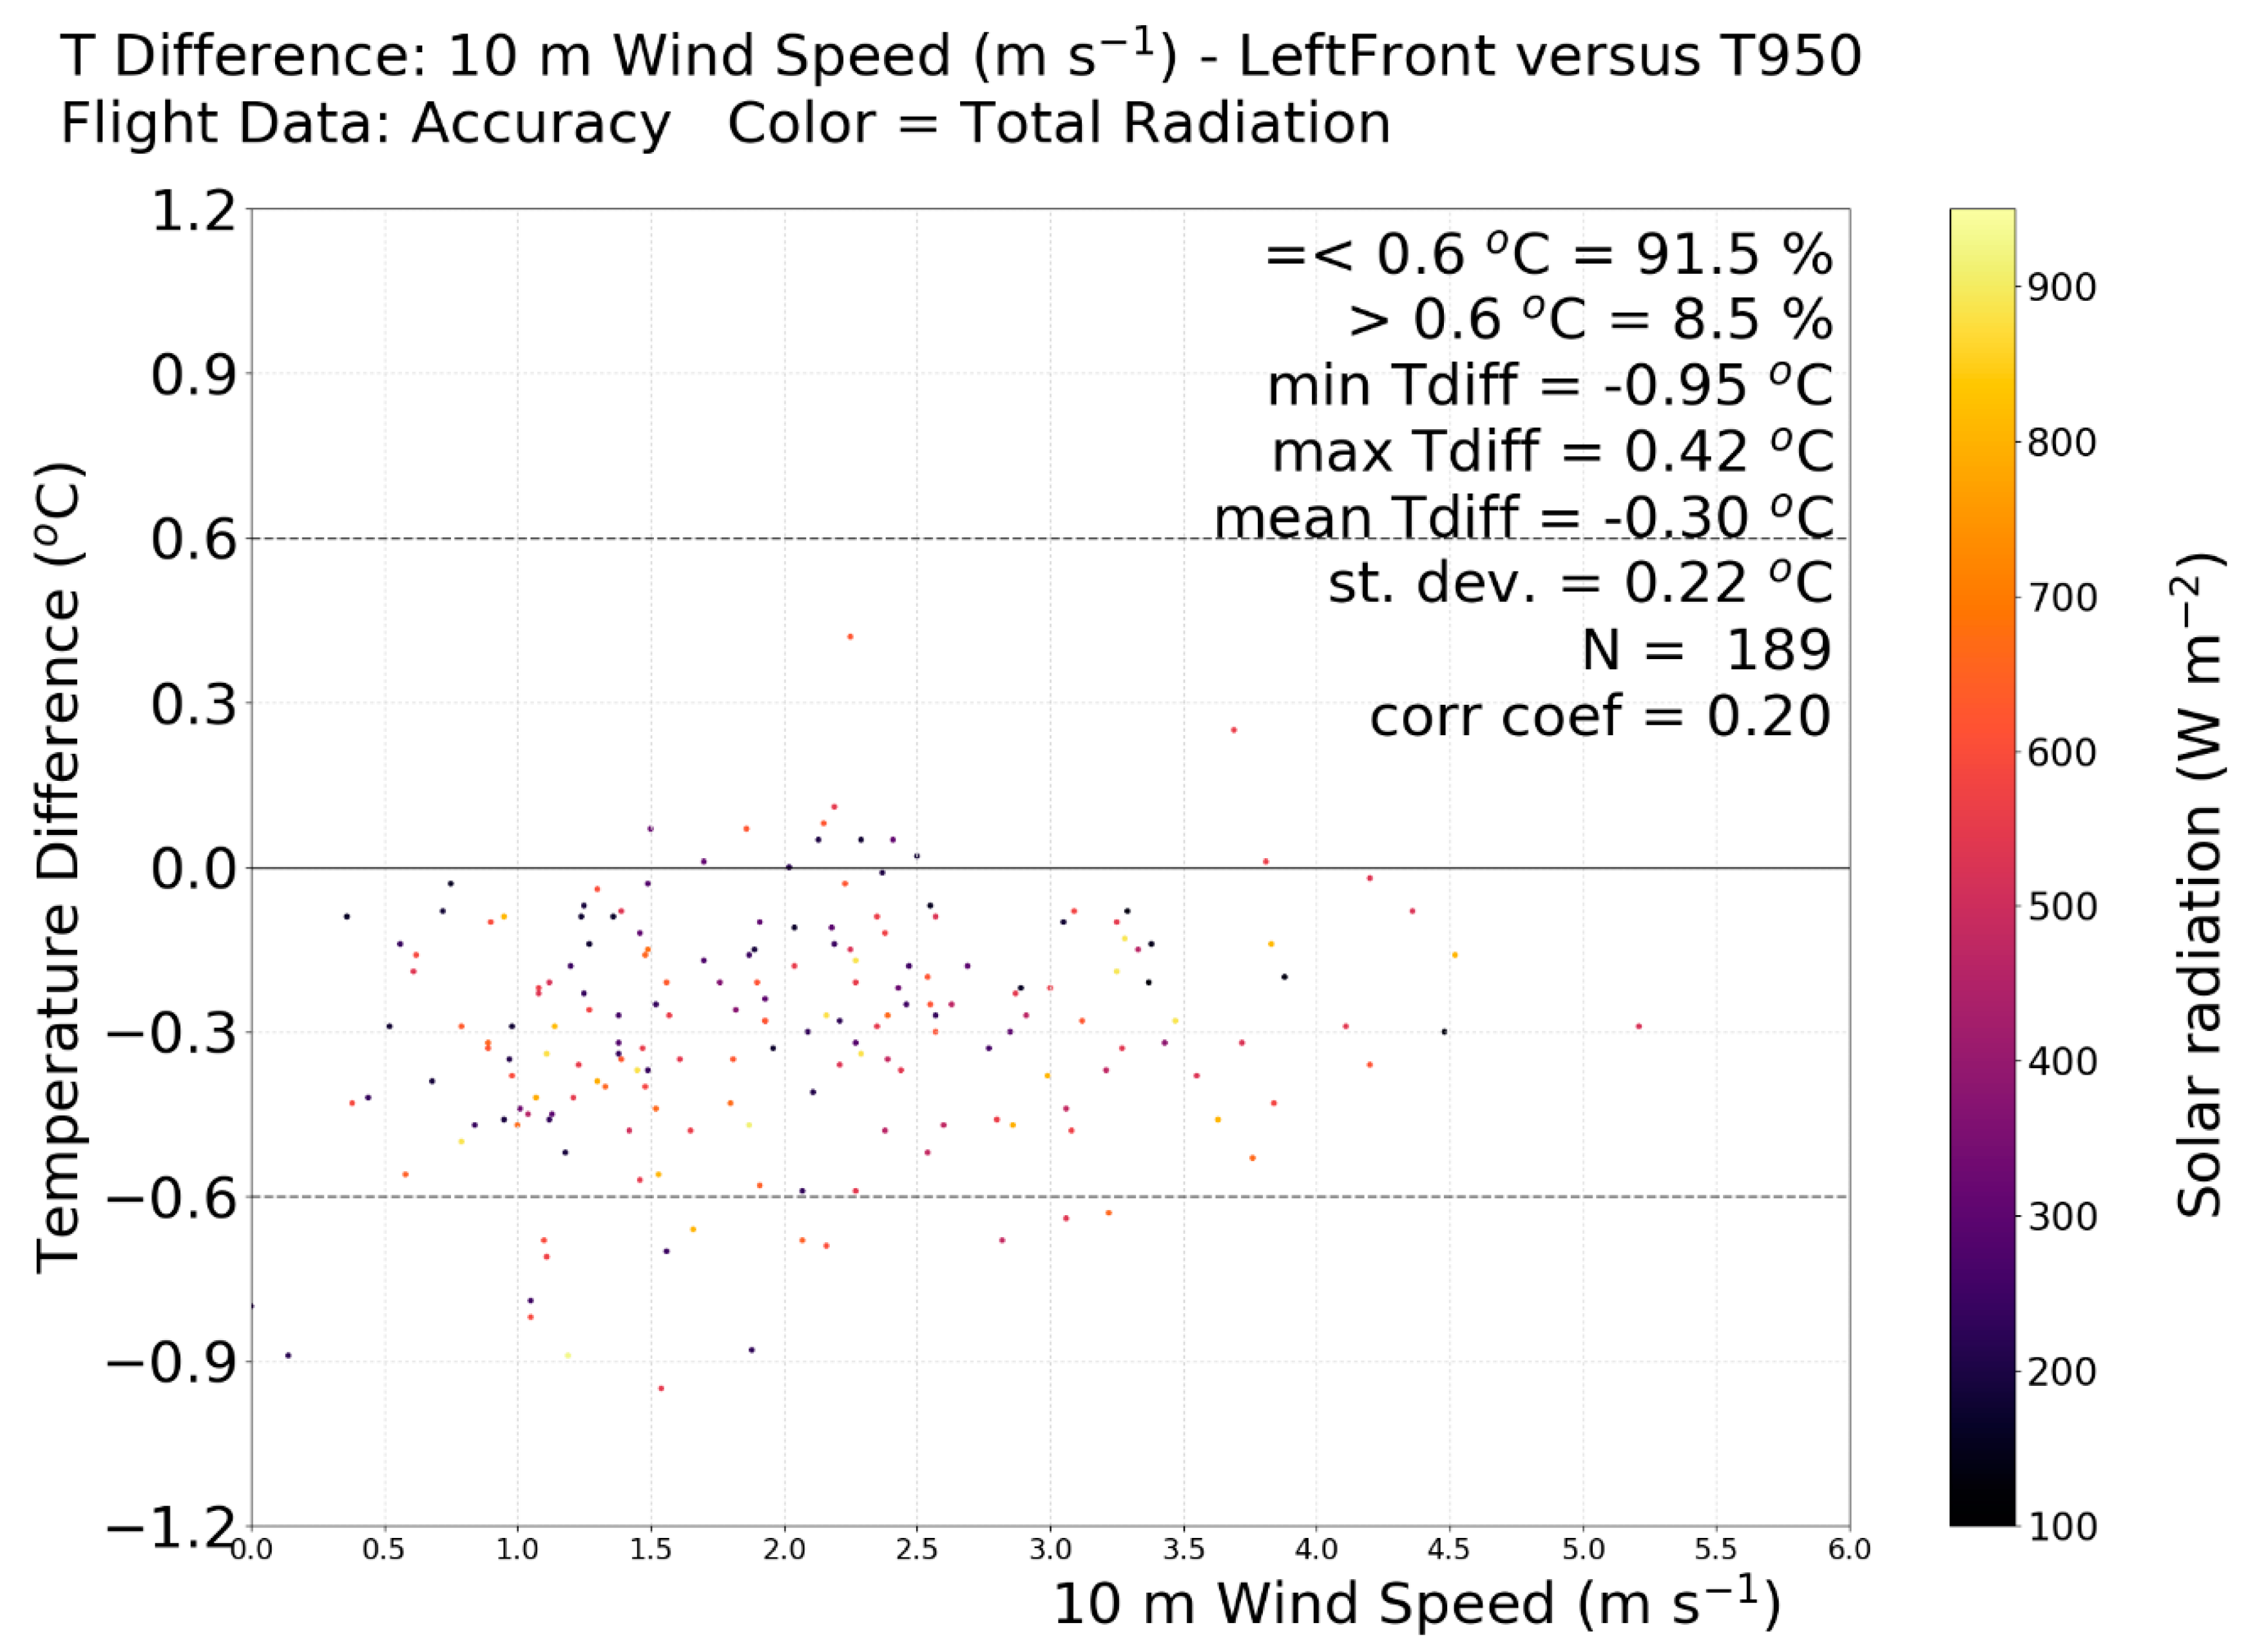
iMET-XQ sensors placed on the front rotor arms perform best, because (1) they are far enough removed from the rear half of the UAV body where the heat sources from the electronic components are located and (2) they benefit from aspiration from the propeller wash. These sensors show a strong cool bias compared to the tower standard, primarily because the tower sensor is aspirated by natural wind flow, causing it to warm up more than the well aspirated iMET-XQ sensors on the front-facing rotor arm. It was shown that during stronger winds, the measurements of all three sensors converge.
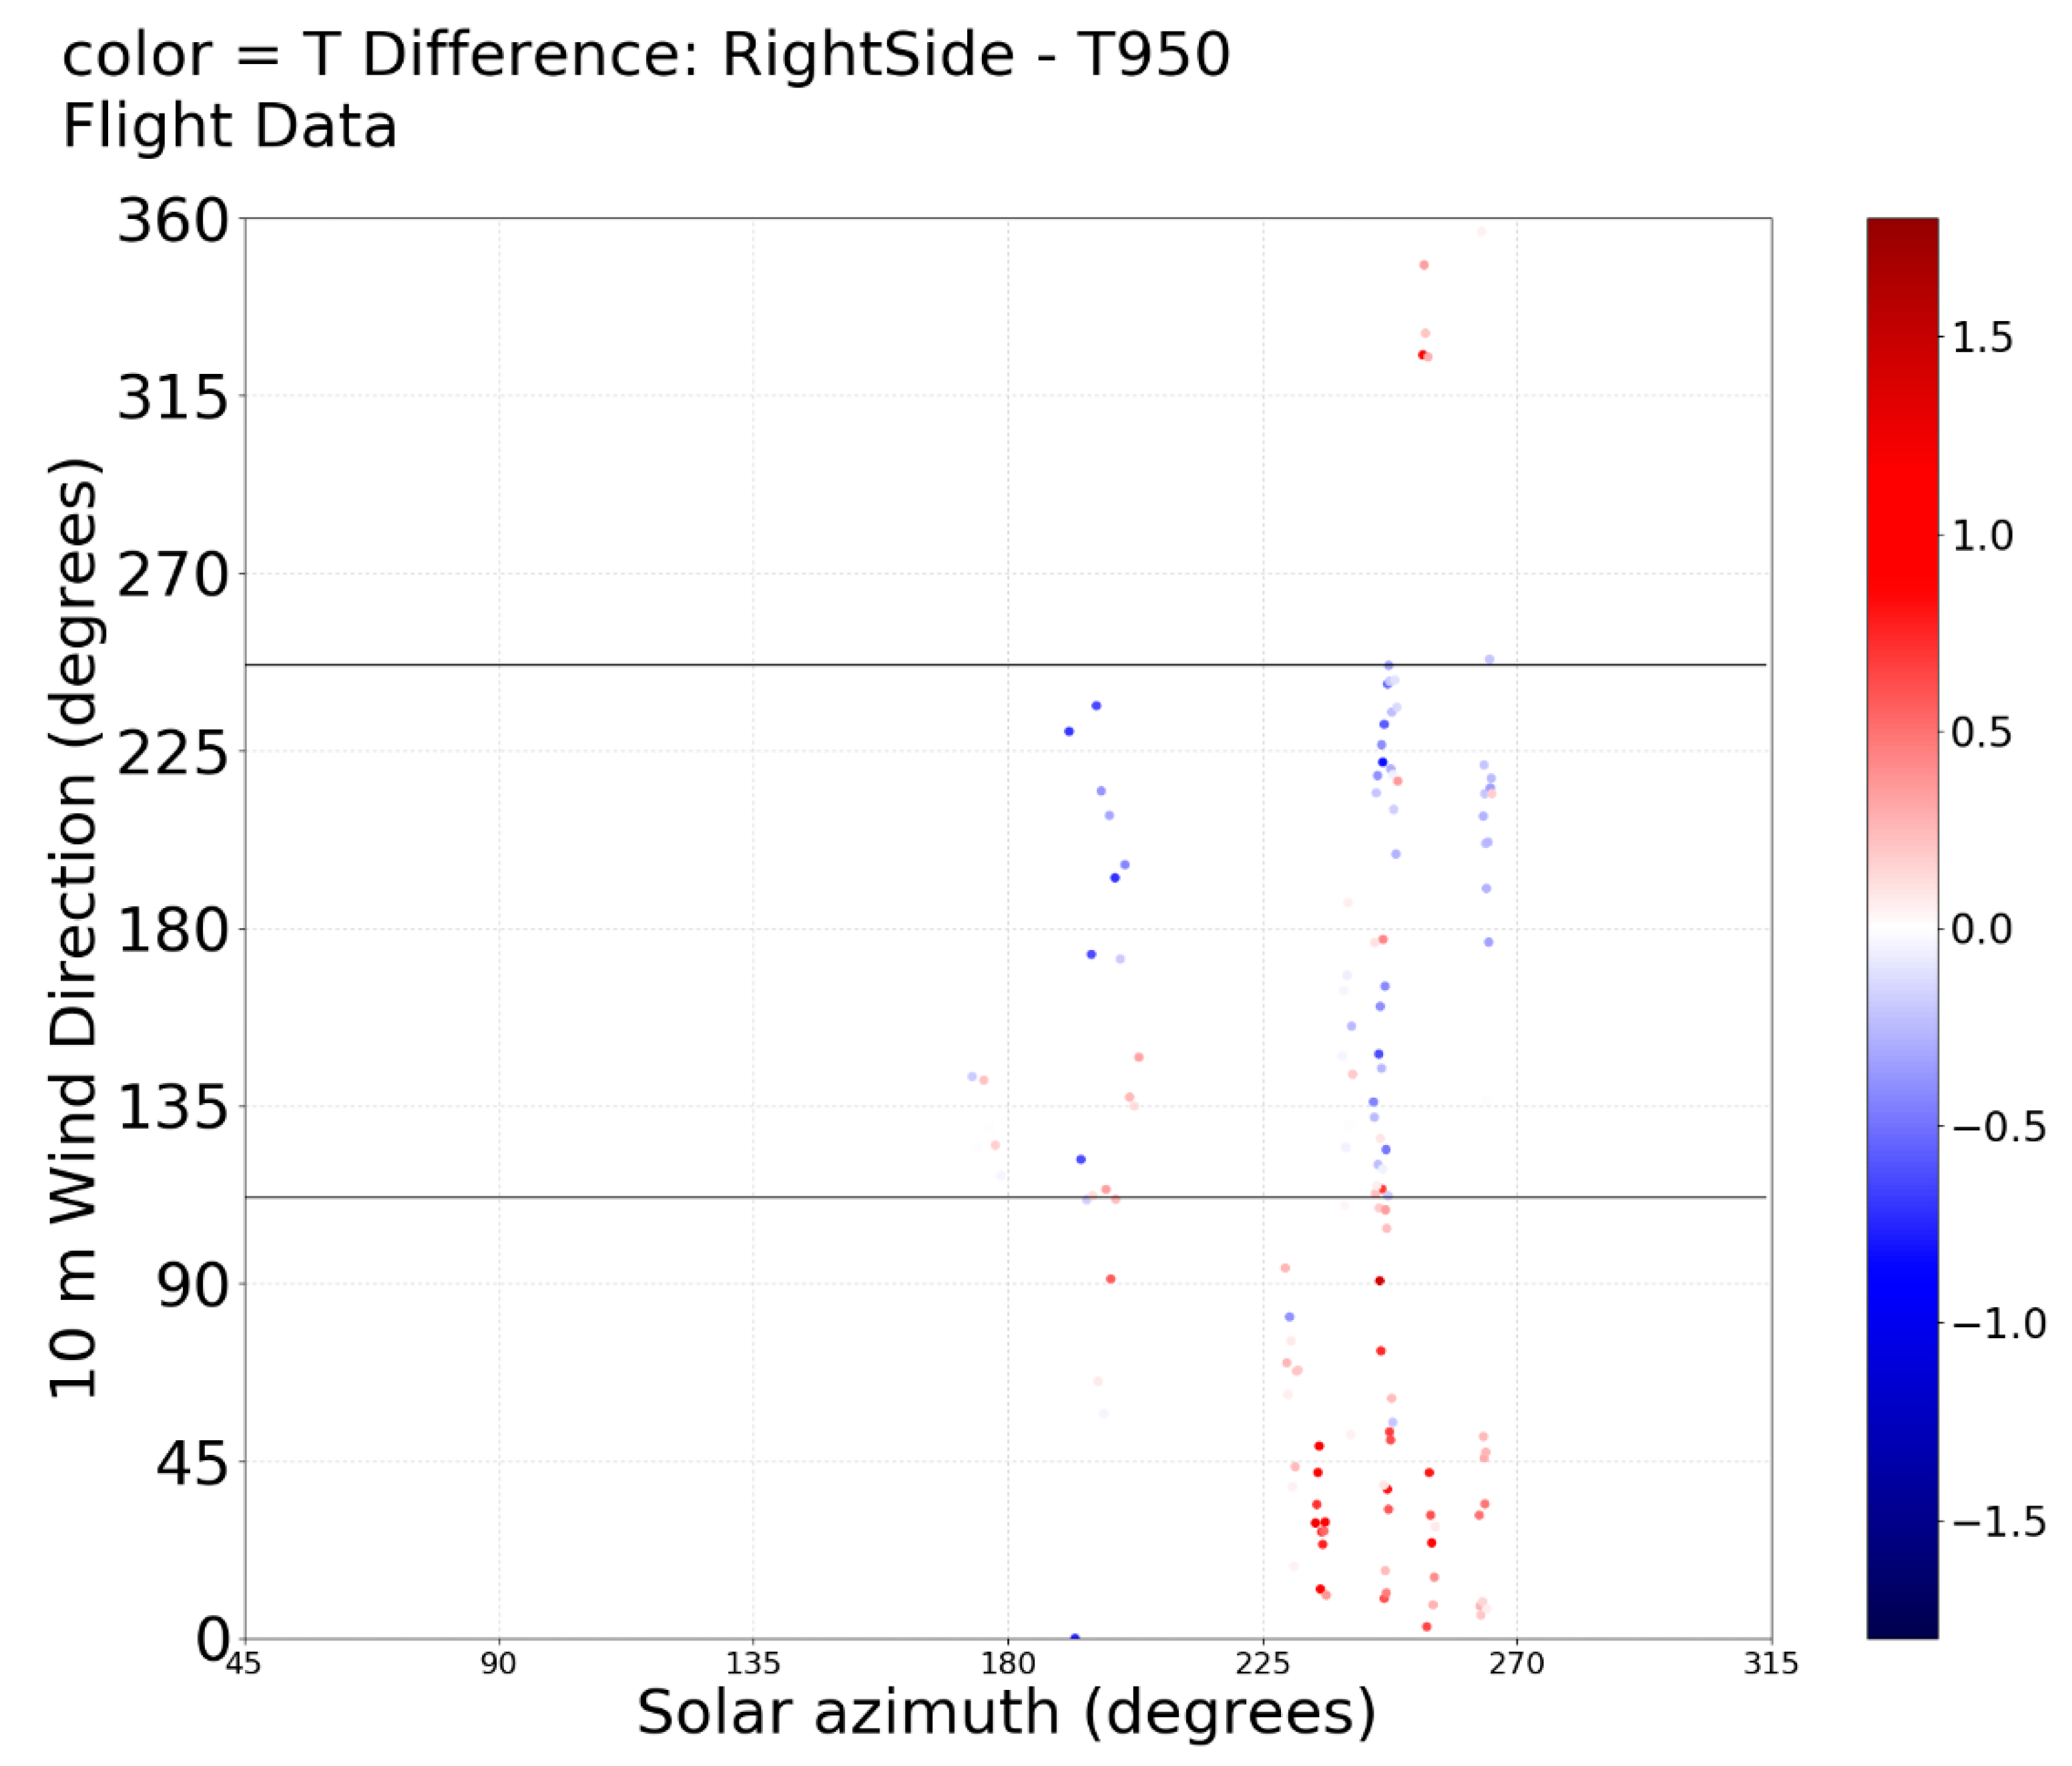
It is likely that the orientation of the iMET-XQ units relative to the sun plays a role in the accuracy of its temperature measurement. This was seen for the location RightSide in Section 3.3. In ref. [18], the stationary sensors were configured so that they always faced in the same direction. In future work, the experiments to assess the bias resulting from sensor orientation, could consist of iMET-XQ sensors mounted on a horizontal round board near the tower and placed in 30 degree increments (12 sensors) around the periphery of the board, in varying weather conditions, solar azimuth and elevation angles. By comparing the iMET-XQ temperature measurements to the tower reference, it can be determined if the iMET-XQ orientation relative to the azimuthal solar angle and solar elevation angle has an impact on the temperature measurements.
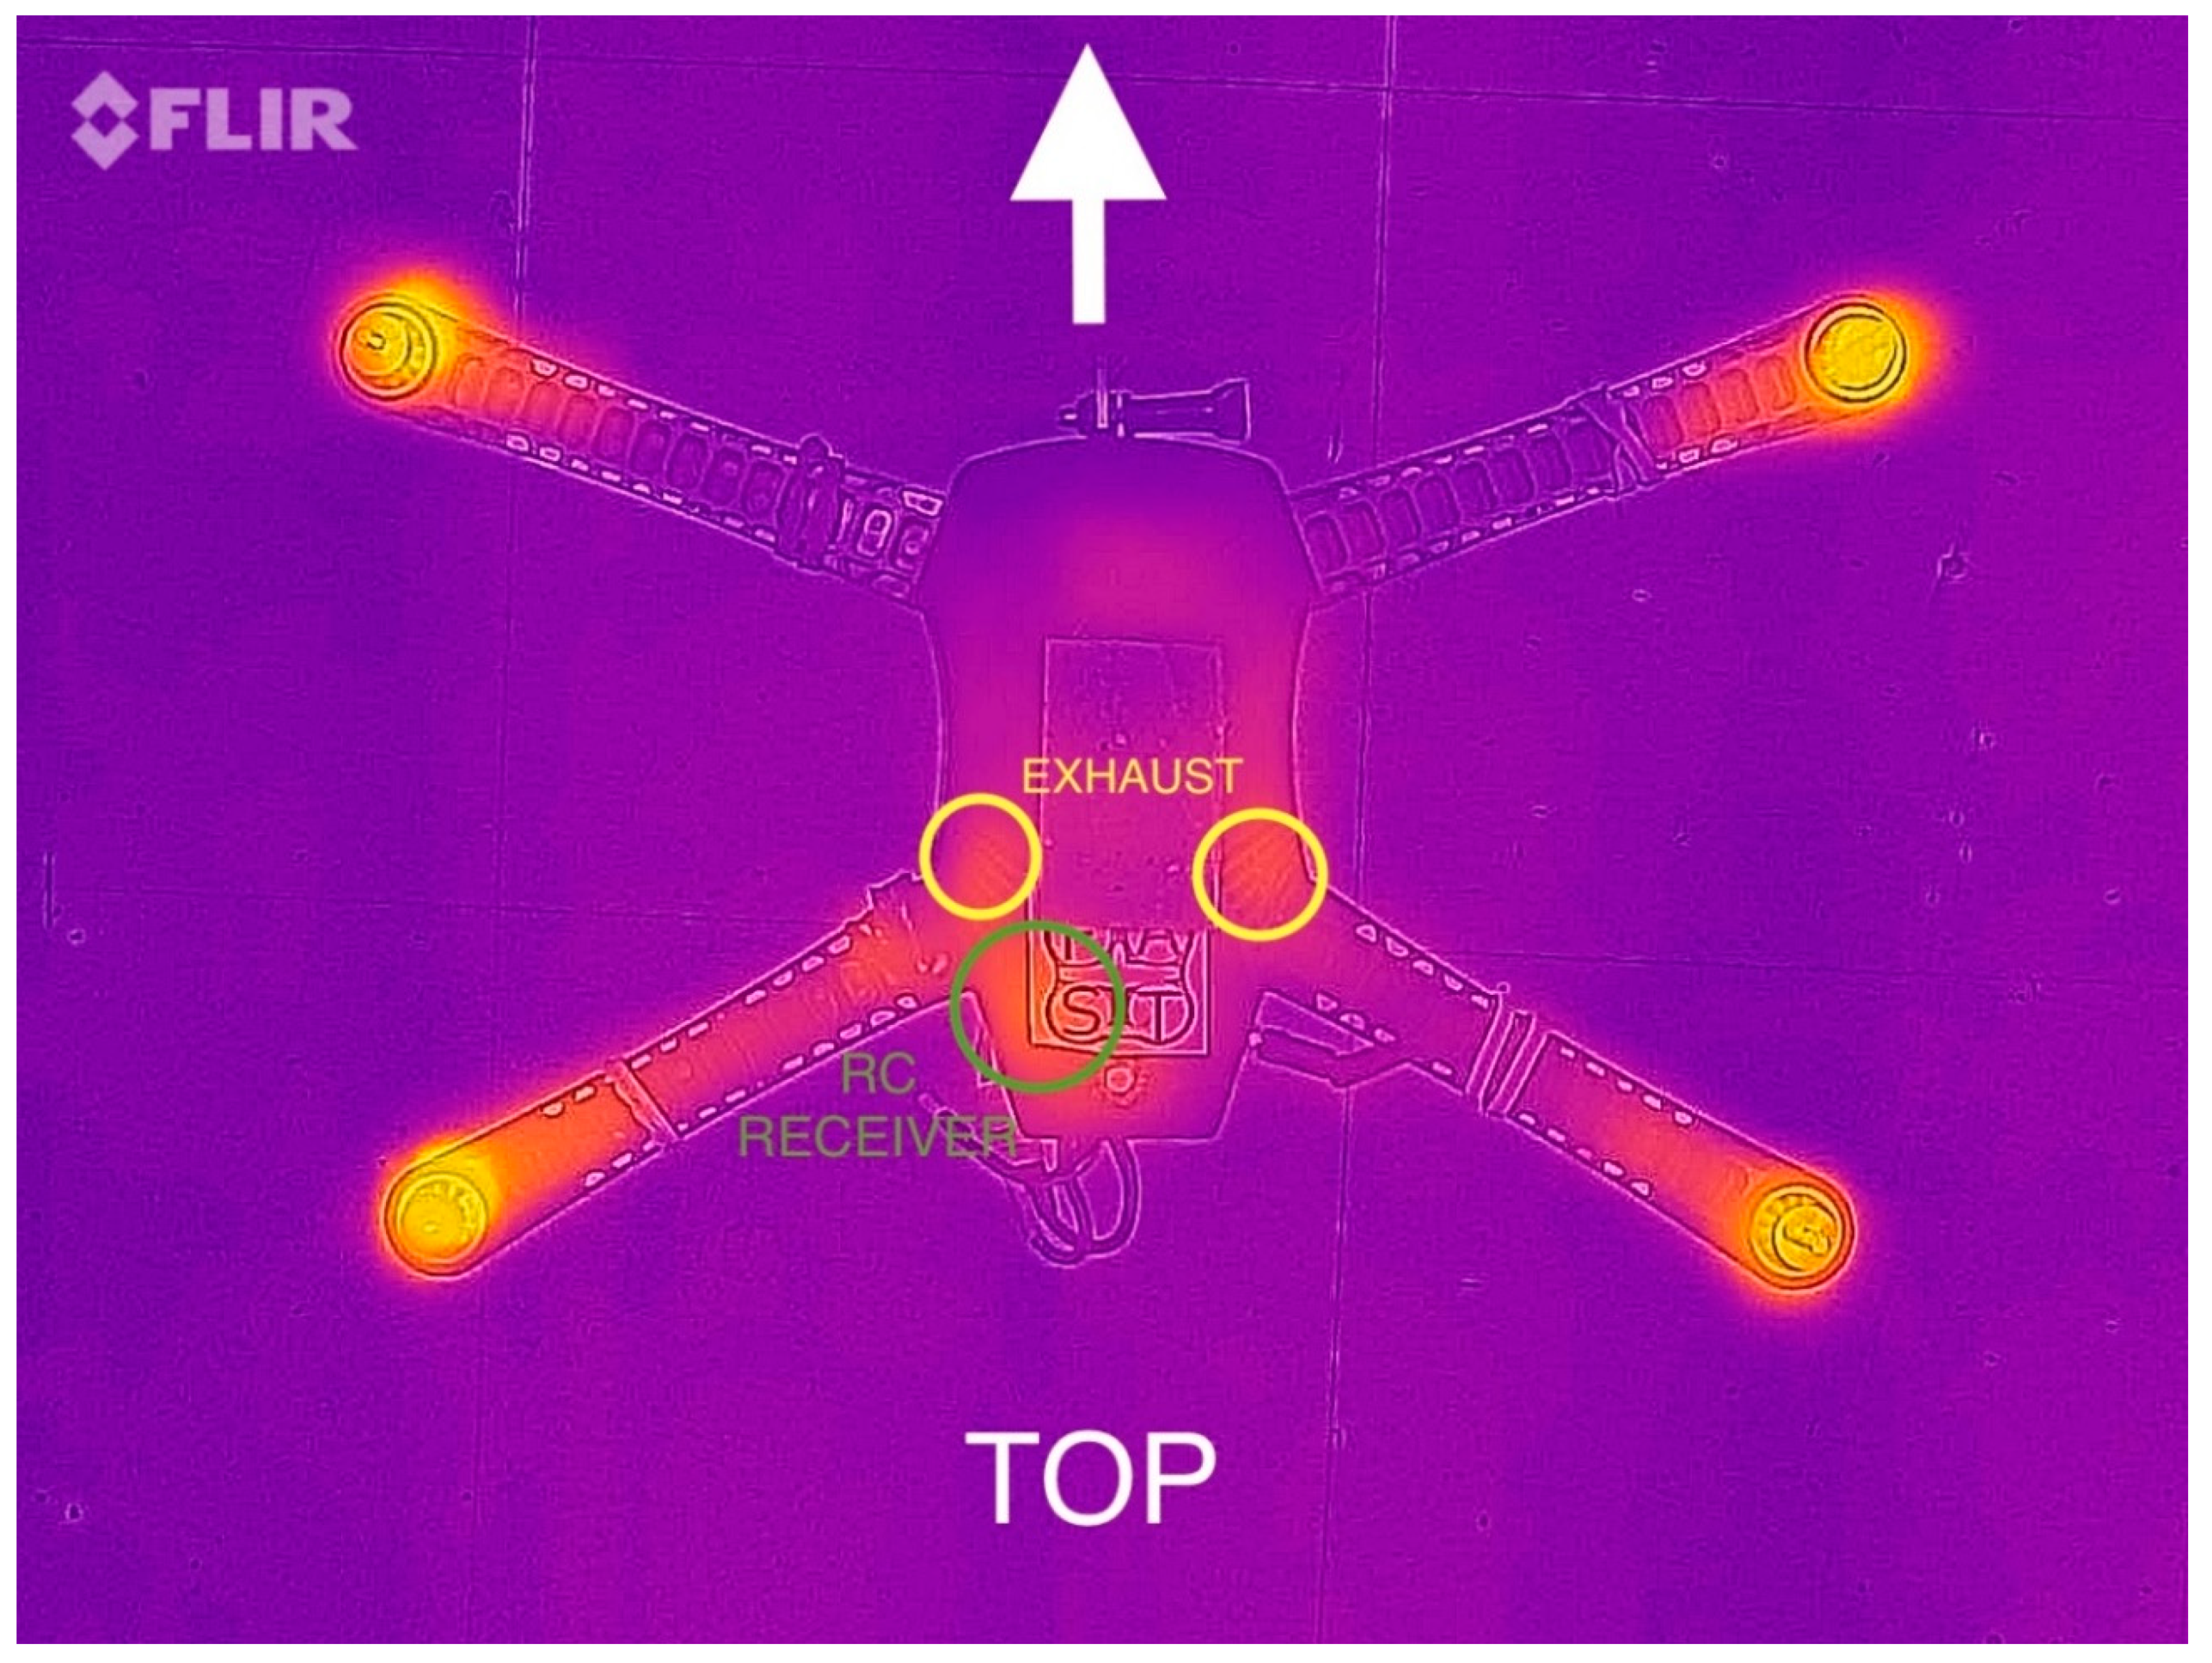
It is imperative that when using an off-the-shelf UAV for atmospheric sensing, the electronic components inside the body of the UAV are properly located. Exhaust vents can be helpful in locating these components. A more accurate procedure for locating hotspots within the UAV body is running the UAV indoors without propellers and using an infrared camera to locate the hotspots.
Based on the results from this study, we provide the following advice for other researchers using the iMET-XQ sensor on a UAV. After the UAV body hotspots have been located, position the iMET-XQ underneath the rotor arms that are the furthest away from any heat sources in the UAV body. Following the recommendations from [2], position the sensors one third of the length of the propeller away from the propeller tip to prevent influences from propeller friction. Suspending sensors below the UAV body may also be viable, but further testing to determine the optimal distance beneath the UAV body is required. Additionally, when ascending, heat from the UAV body may flow downstream, affecting suspended instruments.
It is recommended that as many sensors as affordable be placed on the UAV. Additionally, if only two rotor arms are viable (due to UAV body heat sources), mount two sensors under each arm with the sensing elements facing in opposite directions. Sensor redundancy will prevent data loss in case sensors momentarily or permanently lose GPS connectivity or break during flight. In this study, unexpected strong wind gusts have caused two crash landings, leading to the permanent loss of at least one sensor.
Sensor redundancy also allows for quality control. By comparing time series or temperature difference distributions (boxplots), any outlying sensors can readily be identified and data from these sensors can be removed. The averages of observations from the remaining sensors will provide accurate data. By systematically removing one sensor at a time and plotting the boxplots of the temperature differences of all unique sensor pairs, bad sensors can be identified. If the boxplot displays a smaller spread (length of box equals inter-quartile range) and/or shorter whiskers after removing a given sensor, this is an indicator that a particular sensor collected invalid or outlying data values. This bad data can be the result of the sensor being located downwind from the UAV body. Wind direction cannot always be determined because the UAV will either need to be equipped with a wind sensor or flown near a tower. In many scenarios, this will not be the case. The above described technique will allow such locations to be identified and removed from the data sample.
When hovering a UAV in a fixed position next to an instrumented tower, the shaded and upwind side of the UAV can easily be identified. Placing unshielded temperature sensors in that location on the UAV would provide good results. However, when there is no instrumented tower in the vicinity and/or the UAV is flying transects that cause the shaded and upwind sensors to switch sides, obtaining quality temperature measurements will be a bigger challenge. This is where placing a sensor in an aspirated radiation shield would come into its own, except for the addition of weight and power consumption. Alternatively, it might be possible to postprocess the data using an algorithm that calculates the best (i.e., shaded) sensor location, based on the solar angle and the azimuth (calculated from the GPS time and date stamp) and the UAV heading, pitch, and roll (calculated from the on-board IMU). Additionally, thermal inertia could be taken into account by discarding a few observations when the location of the best/shaded sensor changes. The impacts from the heat of propeller friction or rotor motors were not quantified in this study. However, it was shown in infrared photography that rotor motors generated significant hotspots in laboratory settings. If these two heat sources turn out to be significant in-flight conditions, quadcopters may be better options than octocopters for a choice of UAV. This should be further investigated. Future work should include determining the magnitude and location of thermal hot spots within the UAV body and from rotors and rotor engines while the UAV is in flight. Experiments could consist of flying the UAV in a large indoor chamber where infrared cameras are suspended from walls and ceilings to observe all sides of the hovering UAV.
Rotary wing UAVs are not typically going to hover in practical applications; they will either take vertical profiles or fly in horizontal transects. Therefore, the sensors will be naturally aspirated by the relative airflow in a manner analogous to rawinsonde technology, which the iMET-XQ sensors are based on. In other words, the hover validations presented in this study are worst case; the iMET-XQ sensors likely perform even better in real applications.
Refs. [20,21] show that the temperature sensors placed within well aspirated solar shields are the gold standard for in situ measurements. They document that unaspirated temperature sensors have a warm bias during the day and a cool bias at night. Unfortunately, both radiation shields and fans add weight and fans require power. Both are challenging when using small UAV-based sensing. Small UAVs have a limited payload capacity (400 g in the case of the Iris+ used in the current study) and the power supply is limited by battery technology. The challenge with UAVs is that they have to carry their power supply with them. Every gram carried on a UAV translates to a reduction in flight time. The use of unshielded, rotor wash-aspirated, aluminum-coated iMET-XQ sensors may be the next best solution, for now. In ref. [18], the temperature measurements of a shielded iMET-XQ sensor and an exposed iMET-XQ sensor were compared. As expected, a shielded iMET-XQ records cooler temperatures than an exposed unit. This is especially true in weak winds when the exposed iMET-XQ sensor, as expected, heats up too much. However, as the wind speed increases, the temperature differences between a shielded and exposed unit approach zero. This confirms that the aluminum-coated iMET-XQ sensors do not need to be shielded as long as they are properly aspirated; an exposed unit records almost identical temperatures to a shielded unit as long as the aspiration is adequate (greater than 3.0 m s−1). Radiosondes rely on the same principle as they are ventilated by the relative airflow during the flight [16,17]. In ref. [4], it was found that the UAV-based sensors that were aspirated only (they reported that the majority of aspirated sensors were aspirated by rotor wash), agreed well with the shielded tower reference; showing only a very slight cool bias. It was not mentioned if the tower reference sensors were aspirated or unaspirated.
In order to gain a better understanding of the difference between the UAV-based measurements and a reference sensor, future work could include hovering a UAV in a large indoor chamber without sunshine and without airflow. The iMET-XQ sensors would be placed in the same locations on the UAV as done here. Wind speed and direction and the solar radiation would be introduced using a fan and incandescent light source, respectively. The fan and light source could be mounted on a circular track surrounding the UAV, allowing the azimuthal angle to vary incrementally. A reference sensor in an aspirated shield, an identical sensor in an unaspirated shield, as well as an anemometer and a pyranometer could be installed under the UAV such that they are exposed to the same conditions. A full range of environmental conditions could be simulated by systematically incrementing wind speed, azimuthal angle, and light intensity in steps, producing a full suite of environmental conditions of all possible combinations. Temperature measurements would be compared to the aspirated and shielded reference sensor. Additionally, the unaspirated and aspirated reference temperature measurements should be compared. This would not only prevent waiting for the atmosphere to produce the required conditions, it would also provide a comparison to a true validated reference standard and assess any biases from not using an aspirated reference sensor.
Another currently available solution is the use of tethered UAVs where gasoline engines on the ground transmit power via a tether. These are not as mobile as a traditional UAV, but definitely more mobile than static towers. However, we foresee a scenario in the near future where battery technology evolves to develop a large enough capacity that shielded, fan-aspirated temperature sensors will become a reality. Ref. [3] underlines that the materials of solar radiation shields may absorb heat that could be emitted to the temperature sensors inside, so a fan is required. In fact, work is in progress to develop effectively aspirated shields for UAV-based temperature sensors where the sensors are properly aspirated to reduce the effects from solar heating [2,3].

Author Contributions

S.K.K. was responsible for providing resources, formal analysis, software development, visualization, and original draft preparation. C.J.M. was responsible for the UAV system and the flight operations, providing flight resources, as well as review and editing. M.S.M. was responsible for statistical analysis, as well as review and editing. All authors have read and agreed to the published version of the manuscript.

Funding

The South Alabama Mesonet is funded by the National Oceanic and Atmospheric Administration’s National Mesonet Program.

Acknowledgments

The authors would like to acknowledge Lisa Schibelius, Caroline Carithers, Collin Carithers, and William Sherman for assistance with analysis and/or serving as pilots.

Conflicts of Interest

The authors declare no conflict of interest. The funders had no role in the design of the study; in the collection, analyses, or interpretation of data; in the writing of the manuscript, or in the decision to publish the results.

Appendix A

Figure A1 shows the results from a laboratory experiment to measure the propeller wash from the four rotors. The UAV was secured to a stand with its rotors running. Wind speed measurements were made using a Kaindl electronic Windtronic 2 wind sensor. Propwash speed was observed in a plane 1 inch above the quadrotor. Note that the aerodynamic theory shows that the prop wash directly above the rotor plane is identical to the propeller wash directly below the rotors. It was much easier and safer to obtain measurements above the rotors. A 40 × 30 inch grid was created to map the data observation points of the wind speed above the quadrotor. Data points were taken every 2 inches for a total of 16 data points along the axis pointing towards the nose of the aircraft and 21 data points along the lateral axis of the aircraft. With the quadrotor fixed to the test bench, a total of 336 data points were manually recorded from the Windtronics anemometer. As expected, the highest measured windspeeds from the propwash are located above the spinning rotors and decrease parabolically moving away from the rotors. The maximum windspeed around the rotors ranges from 3.2 to 3.7 m s−1. The location of the iMET-XQ sensors (iMET 11, 15, 10, and 18) on the rotor arms were in accordance with the recommendations from [2] meaning that under the propellers, the propwash was between 2.5 and 3.5 m s−1. The iMET-XQ sensors are located 4.5 cm (1.8 inch) under the propellers, thus the speed of the wash would be around 2.5 m s−1 in hover. Therefore, the iMET-XQ sensors in the locations RightFront, RightRear, LeftFront, and LeftRear were aspirated with the optimal flow speed (>2.5 m s−1) as recommended in ref. [18].
Figure A1. Propwash speed measurements (color, m s−1) made using Kaindl electronic Windtronic 2 wind sensor in a plane 1 inch above the quadrotor. A 40 × 30 inch grid was created to map the data observation points of the wind speed above the quadrotor. Data points were taken every 2 inches for a total of 16 data points along the y axis and 21 data points along the x axis.
Atmosphere 11 00660 g0a1

References

  1. Lee, T.R.; Buban, M.; Dumas, E.; Baker, C.B. On the use of rotary-wing aircraft to sample near-surface thermodynamic fields: Results from recent field campaigns. Sensors 2019, 19, 10. [Google Scholar] [CrossRef] [PubMed] [Green Version]
  2. Greene, B.R.; Segales, A.R.; Waugh, S.; Duthoit, S.; Chilson, P.B. Considerations for temperature sensor placement on rotary-wing unmanned aircraft systems. Atmos. Meas. Tech. 2018, 11, 5519–5530. [Google Scholar] [CrossRef] [Green Version]
  3. Greene, B.R.; Segales, A.R.; Bell, T.M.; Pillar-Little, E.A.; Chilson, P.B. Environmental and sensor integration influences on temperature measurements by rotary-wing unmanned aircraft systems. Sensors 2019, 19, 1470. [Google Scholar] [CrossRef] [PubMed] [Green Version]
  4. Barbieri, L.; Kral, S.T.; Bailey, S.C.C.; Frazier, A.E.; Jacob, J.D.; Reuder, J.; Brus, D.; Chilson, P.B.; Crick, C.; Detweiler, C.; et al. Intercomparison of small unmanned aircraft system (sUAS) measurements for atmospheric science during the LAPSE-RATE campaign. Sensors 2019, 19, 2179. [Google Scholar] [CrossRef] [PubMed] [Green Version]
  5. Houston, A.L.; Keeler, J.M. The impact of sensor response and airspeed on the representation of the convective boundary layer and airmass boundaries by small unmanned aircraft systems. J. Atmos. Ocean. Technol. 2018, 35, 1687–1699. [Google Scholar] [CrossRef]
  6. Brosy, C.; Krampf, K.; Zeeman, M.; Wolf, B.; Junkermann, W.; Schafer, K.; Emeis, S.; Kunstmann, H. Simultaneous multicopter-based air sampling and sensing of meteorological variables. Atmos. Meas. Technol. 2017, 10, 2773–2784. [Google Scholar] [CrossRef] [Green Version]
  7. Jacob, J.D.; Chilson, P.B.; Houston, A.L.; Weaver Smith, S. Considerations for atmospheric measurements with small unmanned aircraft systems. Atmosphere 2018, 9, 252. [Google Scholar] [CrossRef] [Green Version]
  8. Carbajo Fuertes, F.; Wilhelm, L.; Porte-Agel, F. Multirotor UAV-Based Platform for the Measurement of Atmospheric Turbulence: Validation and Signature Detection of Tip Vortices of Wind Turbine Blades. J. Atmos. Ocean. Technol. 2019, 36, 941–955. [Google Scholar] [CrossRef]
  9. de Boer, G.; Diehl, C.; Jacob, J.; Houston, A.; Smith, S.W.; Chilson, P.B.; Schmale, D.G.; Intrieri, J.; Pinto, J.; Elston, J.; et al. Development of community, capabilities and understanding through unmanned aircraft-based atmospheric research: The LAPSE-RATE campaign. Bull. Am. Meteorol. Soc. 2019, 101, 684–699. [Google Scholar] [CrossRef] [Green Version]
  10. Koch, S.E.; Fengler, M.; Chilson, P.B.; Elmore, K.L.; Argrow, B.; Andra Jr., D. L.; Lindlet, T. On the use of unmanned aircraft for sampling mesoscale phenomena in the preconvective boundary layer. J. Atmos. Ocean. Technol. 2018, 35, 2265–2288. [Google Scholar] [CrossRef]
  11. Flagg, D.D.; Doyle, J.D.; Holt, T.R.; Tyndall, D.P.; Amerault, C.M. On the impact of unmanned aerial system observations on numerical weather prediction in the coastal zone. Mon. Weather Rev. 2018, 146, 599–622. [Google Scholar] [CrossRef]
  12. Hemingway, B.L.; Frazier, A.E.; Elbing, B.R.; Jacob, J.D. Vertical Sampling Scales for Atmospheric Boundary Layer Measurements from Small Unmanned Aircraft Systems (sUAS). Atmosphere 2017, 8, 176. [Google Scholar] [CrossRef] [Green Version]
  13. Lee, T.R.; Buban, M.; Dumas, E. A New Technique to Estimate Sensible Heat Fluxes around Micrometeorological Towers Using Small Unmanned Aircraft Systems. J. Atmos. Ocean. Technol. 2017, 34, 2103–2112. [Google Scholar] [CrossRef]
  14. Kim, M.-S.; Kwon, B.H. Estimation of Sensible Heat Flux and Atmospheric Boundary Layer Height Using an Unmanned Aerial Vehicle. Atmosphere 2019, 10, 363. [Google Scholar] [CrossRef] [Green Version]
  15. Hubbard, K.; Lin, X.; Baker, C.; Sun, B. Air temperature comparison between the MMTS and the USCRN temperature systems. J. Atmos. Ocean. Technol. 2004, 21, 1590–1597. [Google Scholar] [CrossRef]
  16. Jensen, M.P.; Holdridge, D.J.; Survo, P.; Lehtinen, R.; Baxter, S.; Toto, T.; Johnson, K.L. Comparison of Vaisala radiosondes RS41 and RS92 at the ARM Southern Great Plains site. Atmos. Meas. Technol. 2016, 9, 3115–3129. [Google Scholar] [CrossRef] [Green Version]
  17. Nash, J.; Oakley, T.; Vömel, H.; Wei, L. Instruments and Observing Methods Report No. In 107. In Proceedings of the 8th WMO Intercomparison of High Quality Radiosonde Systems, Yangjiang, China, 12 July–3 August 2010. [Google Scholar]
  18. Kimball, S.K.; Montalvo, C.J.; Mulekar, S.M. Evaluating temperature measurements of the iMET-XQ, in the field, under varying atmospheric conditions. Atmosphere 2020, 11, 335. [Google Scholar] [CrossRef] [Green Version]
  19. Kimball, S.K.; Mulekar, M.S.; Cummings, S.; Stamates, J. The University of South Alabama Mesonet and coastal observing system: A technical and statistical overview. J. Atmos. Ocean. Technol. 2010, 27, 1417–1439. [Google Scholar] [CrossRef]
  20. Fiebrich, C.; Crawford, K.C. Automation: A step toward improving the quality of daily temperature data produced by climate observing networks. J. Atmos. Oceanic Technol. 2009, 26, 1246–1260. [Google Scholar] [CrossRef]
  21. Leeper, R.D.; Rennie, J.; Palecki, M.A. Observational perspectives from U.S. Climate Reference NEtwork (USCRN) and Cooperative Observer Program (COOP) Network: Temperature and precipitation comparison. J. Atmos. Ocean. Technol. 2015, 32, 703–721. [Google Scholar] [CrossRef]
Figure 1. Photo of the Iris+ quad-copter with all 10 iMET-XQ sensors.
Atmosphere 11 00660 g001
Figure 2. Schematic of the UAV in hover. Solar azimuth angles (yellow arc) range from 173.7° to 268.18° and from 88.87° to 89.87°. The 10 m wind direction ranges from 0° to 248.9° (solid blue arc) with interspersed observations (only 8 of them) between 262.3° and 356.6° degrees (dashed blue curve). (Note that the day when the solar angle ranged between 88.87° to 89.87° is missing). The Mesonet tower is to the north of the UAV. The iMET-XQ locations are numbered and named.
Atmosphere 11 00660 g002
Figure 3. Temperature difference between the 10 m and 9.5 m temperature sensors (T10 m–T9.5 m) on the Mesonet tower as a function of 10 m wind speed (x axis, m s−1) and solar radiation (color, W m−2).
Atmosphere 11 00660 g003
Figure 4. Boxplots of the temperature differences (°C) between each iMET-XQ and the 9.5 m tower sensor, by date, for the 18 flight experiments. The red stars represent relative solar radiation values, and the green triangles represent relative 10 m wind speed values averaged over the duration of each experiment. Actual values are given in Table 3. The outliers (open dots) are located beyond the edges of the whiskers which are determined by 1.5 times the inter-quartile range (IQR) beyond the first and third quartiles (the edges of the box). The mean and standard deviations for each flight experiment are listed in Table 4. The means are represented by blue dots, the medians are shown by orange lines. A temperature difference of 0.3 °C is marked by a dotted line. A temperature difference of 0.6 °C is marked by a dashed line.
Atmosphere 11 00660 g004
Figure 5. Temperature difference (°C) between each iMET-XQ sensor and the 9.5 m thermistor on the South Alabama Mesonet tower for all flight experiments. The iMET-XQ number and location on the UAV are given on the x axis. The means are represented by blue diamonds, and the medians are shown by orange lines. A temperature difference of 0.3 °C is marked by a red dotted line. A temperature difference of 0.6 °C is marked by a green dotted line.
Atmosphere 11 00660 g005
Figure 6. Temperature difference (°C) boxplots for each iMET-XQ sensor and all other iMET-XQ sensors for all flight experiments. The means are represented by blue diamonds, and the medians are shown by orange lines. A temperature difference of 0.3 °C is marked by a red dotted line. A temperature difference of 0.6 °C is marked by a green dotted line.
Atmosphere 11 00660 g006
Figure 7. Temperature differences (°C, color) between the iMET- XQ in the RightSide location on the UAV (iMET17) and the 9.5 m tower thermistor as a function of the 10 m wind direction (y axis) and the solar azimuth angle (x axis). The black horizontal lines are drawn at the wind directions of 112° and 247°.
Atmosphere 11 00660 g007
Figure 8. Photograph of the UAV showing the battery compartment vent on the left side of the UAV (yellow ellipse) towards the rear of the UAV, and the locations of several iMET-XQ sensors.
Atmosphere 11 00660 g008
Figure 9. Infrared photograph of the top of the Iris+ during a laboratory experiment where the motors of the UAV were running, but no propellers were attached. Warmer elements are indicated in yellow. The locations of the exhaust vents (yellow circles) and the radio-control receiver (RC receiver, green circle) are indicated. The white arrow indicates the front of the UAV.
Atmosphere 11 00660 g009
Figure 10. Temperature differences (°C) for the iMET-XQ location “LeftFront” as a function of 10 m wind speed (x axis, m s−1) and solar radiation (color, W m−2).
Atmosphere 11 00660 g010
Figure 11. Time series from the 23 April 2019 of the tower temperature at 9.5 m (°C, solid blue), iMET-XQ temperatures (°C, various solid colors as shown in the legend), solar radiation (W m−2, dashed mustard yellow), solar azimuth angle (degrees, dashed orange), solar elevation angle (degrees, dashed brown), tower wind speed at 10 m (m s−1, dotted green), and the tower wind direction at 10 m (degrees, dark blue dots). The two vertical black lines indicate the start and end times of the 10 m flight.
Atmosphere 11 00660 g011
Figure 12. Time series from the 6 March 2019 of the tower temperature at 9.5 m (°C, solid blue), iMET-XQ temperatures (°C, various solid colors as shown in the legend), solar radiation (W m−2, dashed mustard yellow), solar azimuth angle (degrees, dashed orange), solar elevation angle (degrees, dashed brown), tower wind speed at 10 m (m s−1, dotted green), the and tower wind direction at 10 m (degrees, dark blue dots). The two vertical black lines indicate the start and end times of the 10 m flight.
Atmosphere 11 00660 g012
Figure 13. Time series from the 3 April 2019 of the tower temperature at 9.5 m (°C, solid blue), iMET-XQ temperatures (°C, various solid colors as shown in the legend), solar radiation (W m−2, dashed mustard yellow), solar azimuth angle (degrees, dashed orange), solar elevation angle (degrees, dashed brown), tower wind speed at 10 m (m s−1, dotted green), and the tower wind direction at 10 m (degrees, dark blue dots). The two vertical black lines indicate the start and end times of the 10 m flight.
Atmosphere 11 00660 g013
Figure 14. Time series from the 1 August 2019 of the tower temperature at 9.5 m (°C, solid blue), iMET-XQ temperatures (°C, various solid colors as shown in the legend), solar radiation (W m−2, dashed mustard yellow), solar azimuth angle (degrees, dashed orange), solar elevation angle (degrees, dashed brown), tower wind speed at 10 m (m s−1, dotted green), and the tower wind direction at 10 m (degrees, dark blue dots). The two vertical black lines indicate the start and end times of the 10 m flight.
Atmosphere 11 00660 g014
Figure 15. Time series from the 16 May 2019 of the tower temperature at 9.5 m (°C, solid blue), iMET-XQ temperatures (°C, various solid colors as shown in the legend), solar radiation (W m−2, dashed mustard yellow), solar azimuth angle (degrees, dashed orange) tower wind speed at 10 m (m s−1, dotted green), and the tower wind direction at 10 m (degrees, dark blue dots). The two vertical black lines indicate the start and end times of the 10 m flight.
Atmosphere 11 00660 g015
Figure 16. Time–pressure section of the temperature (°C) on the 5 June 2019 based on the nine soundings flown up to 122 m (400 ft) near the University of South Alabama campus in Mobile Alabama.
Atmosphere 11 00660 g016
Table 1. Details of the tower versus the unmanned aerial vehicle (UAV) temperature measurement comparison experiments conducted in past studies. Al-coated stands for aluminum coated. Hover height is given in meters above ground level.
StudyUAV SensorShielded/AspiratedHover Height
(m)
Distance from Tower (m)Tower SensorAspirated
This studyiMET-XQneither105Campbell Scientific 107 thermistorno
Lee at al 2019 [1]iMET-XQ (not Al-coated) neitherN/A300Vaisala HMP110yes
Barbieri et al. 2019 [4]iMET-XQ, iMET-XQ2, othervarying18 15Gill MetPak Prounknown
Carbajo Fuertes et al. [8]Type-E thermocoupleunknown/
unknown
255unknownunknown
Kim and Kwon [14]HOBO H8 Prounknown/
rotor wash
1015Vaisala
HMP45C
unknown
Table 2. Mean and standard deviations of temperature differences (°C) between the UAV-based sensors and the tower or rawinsonde temperature measurements (TUAV–TTower) for the current study and the previous studies summarized in the introduction. Sample size (N) for each flight period is also reported in most cases. References are given behind the author names in square brackets. AERI stands for Atmospheric Emitted Radiance Interferometer.
StudyMean (°C)St. Dev. (°C)N
This study tower −0.230.241021
Lee et al. (2019) tower [1]0.650.2110
Barbieri et al. (2019) tower [4]1.652.60-
Carbajo Fuertes et al. (2019) tower [8]−0.50--
Kim and Kwon (2019) tower [14]−1.10--
Lee et al. (2019) rawinsonde 1 [1]0.590.4121
Lee et al. (2019) rawinsonde 2 [1]0.330.3021
Lee et al. (2019) rawinsonde 3 [1]0.400.0821
Lee et al. (2019) rawinsonde 4 [1]−0.280.1321
Koch et al. (2018) rawinsonde [10]0.20--
Koch et al. (2018) AERI [10]0.20--
Table 3. Ten meter flight experiments by date with the solar conditions and meteorological conditions from the South Alabama Mesonet tower, as well as the experiment times averaged over the length of the experiment. The experiment duration, the sample size (N), and the missing values are also listed. * On 16 May 2019, the two experiments were flown back to back.
DateSolar
Radiation
(W m−2)
Solar Elevation
(Degrees)
Solar Azimuth
(Degrees)
10 m Wind Speed
(m s−1)
10 m Wind Dir.Vert. Wind Speed
(m s−1)
9.5 m Temp.
(°C)
10 m Dew Point (°C)10 m T–9.5 m T (°C)Exp. Time
(Mins)
NMissing
6 February 2019-30.49223.610.80192.090.2623.3020.660.20931689
13 February 2019468.1529.97228.252.6561.530.1215.552−.670.231036090
27 February 2019565.9039.01224.261.99114.330.1323.9614.090.2512432108
6 March 2019554.4834.70235.382.1427.050.3612.619−.310.20104500
12 March 2019300.0641.80230.201.8961.330.1122.5410.030.23104500
14 March 2019185.1935.21240.081.46145.030.3822.9721.170.2310320130
25 March 2019151.5434.17248.083.07229.530.4023.8316.160.2311308187
27 March 2019538.1836.72246.942.5452.320.2322.475.950.1813468117
3 April 2019577.6242.32245.872.34122.810.3122.133.710.221139699
17 April 2019584.6550.98245.971.58164.920.2824.3112.670.1212432108
23 April 2019235.6833.02264.781.75211.180.3522.319.690.2113460125
26 April 2019532.8536.28264.032.7323.480.3625.477.540.2310304146
3 May 2019891.3674.04199.032.10143.090.4128.1318.340.161139699
9 May 2019305.6276.52176.262.32128.860.3326.4922.660.24621654
14 May 2019802.8258.83254.532.3211.650.4026.1211.600.1911308187
16 May 2019397.8645.18266.581.58209.460.3228.9916.990.2021 *511434
27 June 2019634.8649.8289.371.56206.930.2429.2721.800.199135270
1 August 2019228.6876.81194.941.01141.880.1032.1319.760.129252153
Table 4. Mean and standard deviations of temperature differences (TD, °C) between each iMET-XQ and the 9.5 m tower sensor, by date, for the 18 flight experiments.
Flight DateMean TD (°C)Standard Deviation of TD (°C)
6 February 2019−0.090.20
13 February 2019−0.140.22
27 February 20190.010.30
6 March 20190.040.39
12 March 2019−0.040.21
14 March 2019−0.010.14
25 March 2019−0.100.18
27 March 2019−0.120.41
3 April 2019−0.150.26
17 April 2019−0.330.31
23 April 2019−0.100.20
26 April 2019−0.050.20
3 May 2019−0.160.33
9 May 2019−0.060.17
14 May 2019−0.050.32
16 May 2019−0.210.28
27 June 2019−0.240.11
1 August 2019−0.510.25

