Article

Assessing the Impact of Road Traffic Reorganization on Air Quality: A Street Canyon Case Study

AGH University of Science and Technology, Faculty of Mining Surveying and Environmental Engineering, Department of Environmental Management and Protection, 30-059 Krakow, Poland
*
Author to whom correspondence should be addressed.
Submission received: 29 May 2020 / Revised: 23 June 2020 / Accepted: 25 June 2020 / Published: 30 June 2020
(This article belongs to the Special Issue Particulate Matters Emission in Poland)

Abstract

:
One of the elements of strategy aimed at minimizing the impact of road transport on air quality is the introduction of its reorganization resulting in decreased pollutant emissions to the air. The aim of the study was to determine the optimal strategy of corrective actions in terms of the air pollutant emissions from road transport. The study presents the assessment results of the emission reduction degree of selected pollutants (PM10, PM2.5, and NOx) as well as the impact evaluation of this reduction on their concentrations in the air for adopted scenarios of the road management changes for one of the street canyons in Krakow (Southern Poland). Three scenarios under consideration of the city authorities were assessed: narrowing the cross-section of the street by eliminating one lane in both directions, limiting the maximum speed from 70 km/h to 50 km/h, and allowing only passenger and light commercial vehicles on the streets that meet the Euro 4 standard or higher. The best effects were obtained for the variant assuming banning of vehicles failing to meet the specified Euro standard. It would result in a decrease of the yearly averaged PM10 and PM2.5 concentrations by about 8–9% and for NOx by almost 30%.

1. Introduction

Air quality in Krakow, the capital of Malopolska voivodeship (Southern Poland), has failed for many years to meet legal air quality standards in force in the European Union [1]. The most vulnerable places in this matter are street canyons, through which the routes with high traffic volume run, due to their limited ventilation conditions. Automatic urban traffic air quality monitoring stations in Krakow located within street canyons have been detecting for many years the exceedances of permissible levels of the annually and daily averaged concentrations of the PM10 particulate matter and the annually averaged concentrations of PM2.5 and NO2 [2,3,4]. Road transport is largely responsible for these situations. According to the project of the new Air Protection Program for the Malopolska Voivodeship from 2020 [5], the road vehicle emissions in Krakow are responsible for approximately 20–35% of the background PM10 levels and, on average, for about 43% of the background NO2 concentrations, increasing to 75% in the vicinity of roads.
The impact of road transport on air quality in Krakow is majorly determined by the permanently increasing number of cars on the city streets for many years. In the years 2009–2018 the total number of registered vehicles per 1000 Krakow residents increased from 451 to 641 (by more than 42%), while the city population increased during this period from 754,600 to 771,100 residents (by about 2.1%) [6]. In these years, the number of passengers using public transport increased as well by 24.4%. An additional burden for the Krakow traffic system is vehicles entering the city from external regions. According to the report prepared by the Department of Municipal Management of the Municipality of Krakow, based on the measurements of road transport in 2017 [7], there are 246,000 cars entering the city of Krakow each day, from which about 40,000 are part of transit traffic. Among these vehicles, approximately 16,000 travel through the city center. Despite the construction of new routes, including bypasses to improve traffic flow, transportation system in Krakow is still inefficient in many areas (especially in the city center), which is evidenced by the results of research conducted by the TomTom company in 2019 [8]. In the ranking of the most congested cities worldwide, developed by TomTom, Krakow took 22nd place out of 416 examined cities with a Traffic Index of 45%.
Therefore, one of the present priorities for the Krakow authorities is the improvement of air quality through reduction of pollutants emission from road transport, among other means. In recent years, the introduction of corrective actions aimed at the development of sustainable transportation system in Krakow has intensified. They are focused on the improvement of transport accessibility not only within the city but in the metropolitan area as well, enhancement of the collective transport importance and both the development and promotion of ecological forms of travel [9]. Most of the already carried out and planned actions are based on the reduction and calming the traffic in Krakow. Among them, the promotion of changes in the car traffic management should be implemented, which will result in the actual improvement of air quality in the area of specific transportation routes, including street canyons, along which the roads with heavy traffic are located. Within this type of street canyon, there is an increased local emission of pollutants from vehicles and secondary road dust emission from the street, simultaneously with the presence of unfavorable dispersion conditions. Such a situation results in the increase of pollutant concentrations in the air dependent on the canyon geometry and its location relative to the dominating wind directions, presence of additional green infrastructure and the type and amount of substances inflowing from neighboring regions, which can affect chemical reactions in the air [10,11,12,13,14,15,16,17,18,19]. In effect, within street canyons the concentrations of substances—such as NOx, PM10, and PM2.5—as well as other traffic-related pollutants are commonly higher than their levels observed at the urban background stations, which makes residents and people temporarily staying in the area of street canyons more subjected to these substances [20,21,22,23,24]. A relatively expanded review of the outcomes of empirical studies from recent several years on the impact of different traffic management strategies (operating restrictions and pricing, lane management, speed management, flow control, trip reduction strategies) on the emissions reduction, concentrations in the air, human exposition, and health effects resulting from traffic-related air pollution were presented in the review article [25]. While in many of the analyzed papers a certain reduction of pollutant emission to the air was shown, the expected effects on the improvement of air quality were, in many cases, not assessed or relatively low. Effectiveness of such actions depends on their type and scale of implementation as well as the background levels of considered pollutants in relation to the impact of the road transport alone. Therefore, each action requires an individual approach in terms of changes in traffic management carried out in a given city or in the vicinity of selected districts or streets.
The aim of the study was to determine the optimal strategy of corrective actions in terms air pollutants emission from road transport for selected substances (PM10, PM2.5, and NOx). The assessment was conducted using emission rates of the analyzed substances (including the secondary particulate emission from roads) estimated for each scenario, as well as the results of pollutant concentration modeling using the OSPM model [26,27,28]. OSPM is one of the commonly used models in literature applied for the air quality assessment in street canyons. Moreover, numerous studies [29,30,31,32,33,34,35] indicate that it is characterized by adequate accuracy for this type of research. In particular, this modeling system was used for impact assessment on air quality of the traffic volume changes or scenarios associated with banning or temporal limitation of certain groups of vehicles, among other things [36,37,38]. Previous works concerning traffic-related air pollutants modeling in street canyons were most often aimed at presenting the impact on air quality of the emissions from selected streets usually located near the air quality monitoring stations. In most cases the CALINE4 [39,40] or OSPM [34,35,41,42,43] was used in these studies.
Attempts to estimate the improvement of air quality in Krakow as a result of introduction of the planned clean transport zone based on the Euro and tempo-30 emission standards were also included in the air protection programs for Malopolska voivodeship. According to the modeling outcomes yielded using CALPUFF and presented in the project of the new air protection program (2020) [5], introduction of the abovementioned zone should result in decrease of the annually averaged concentrations of NO2 in the air by approximately 26 µg/m3 (reduction by almost 43% in relation to year 2018) for the Krasinski Av. street canyon, in which the traffic-type air quality monitoring station is located and the highest concentrations of PM10 and NOx in Krakow are observed [2]. In the case of the locations of the remaining air quality monitoring stations in Krakow [44], expected reduction rate of the NOx concentrations in the air as a result of implementation of the clean transport zone ranges from 1–20 µg/m3 [5].

2. Materials and Methods

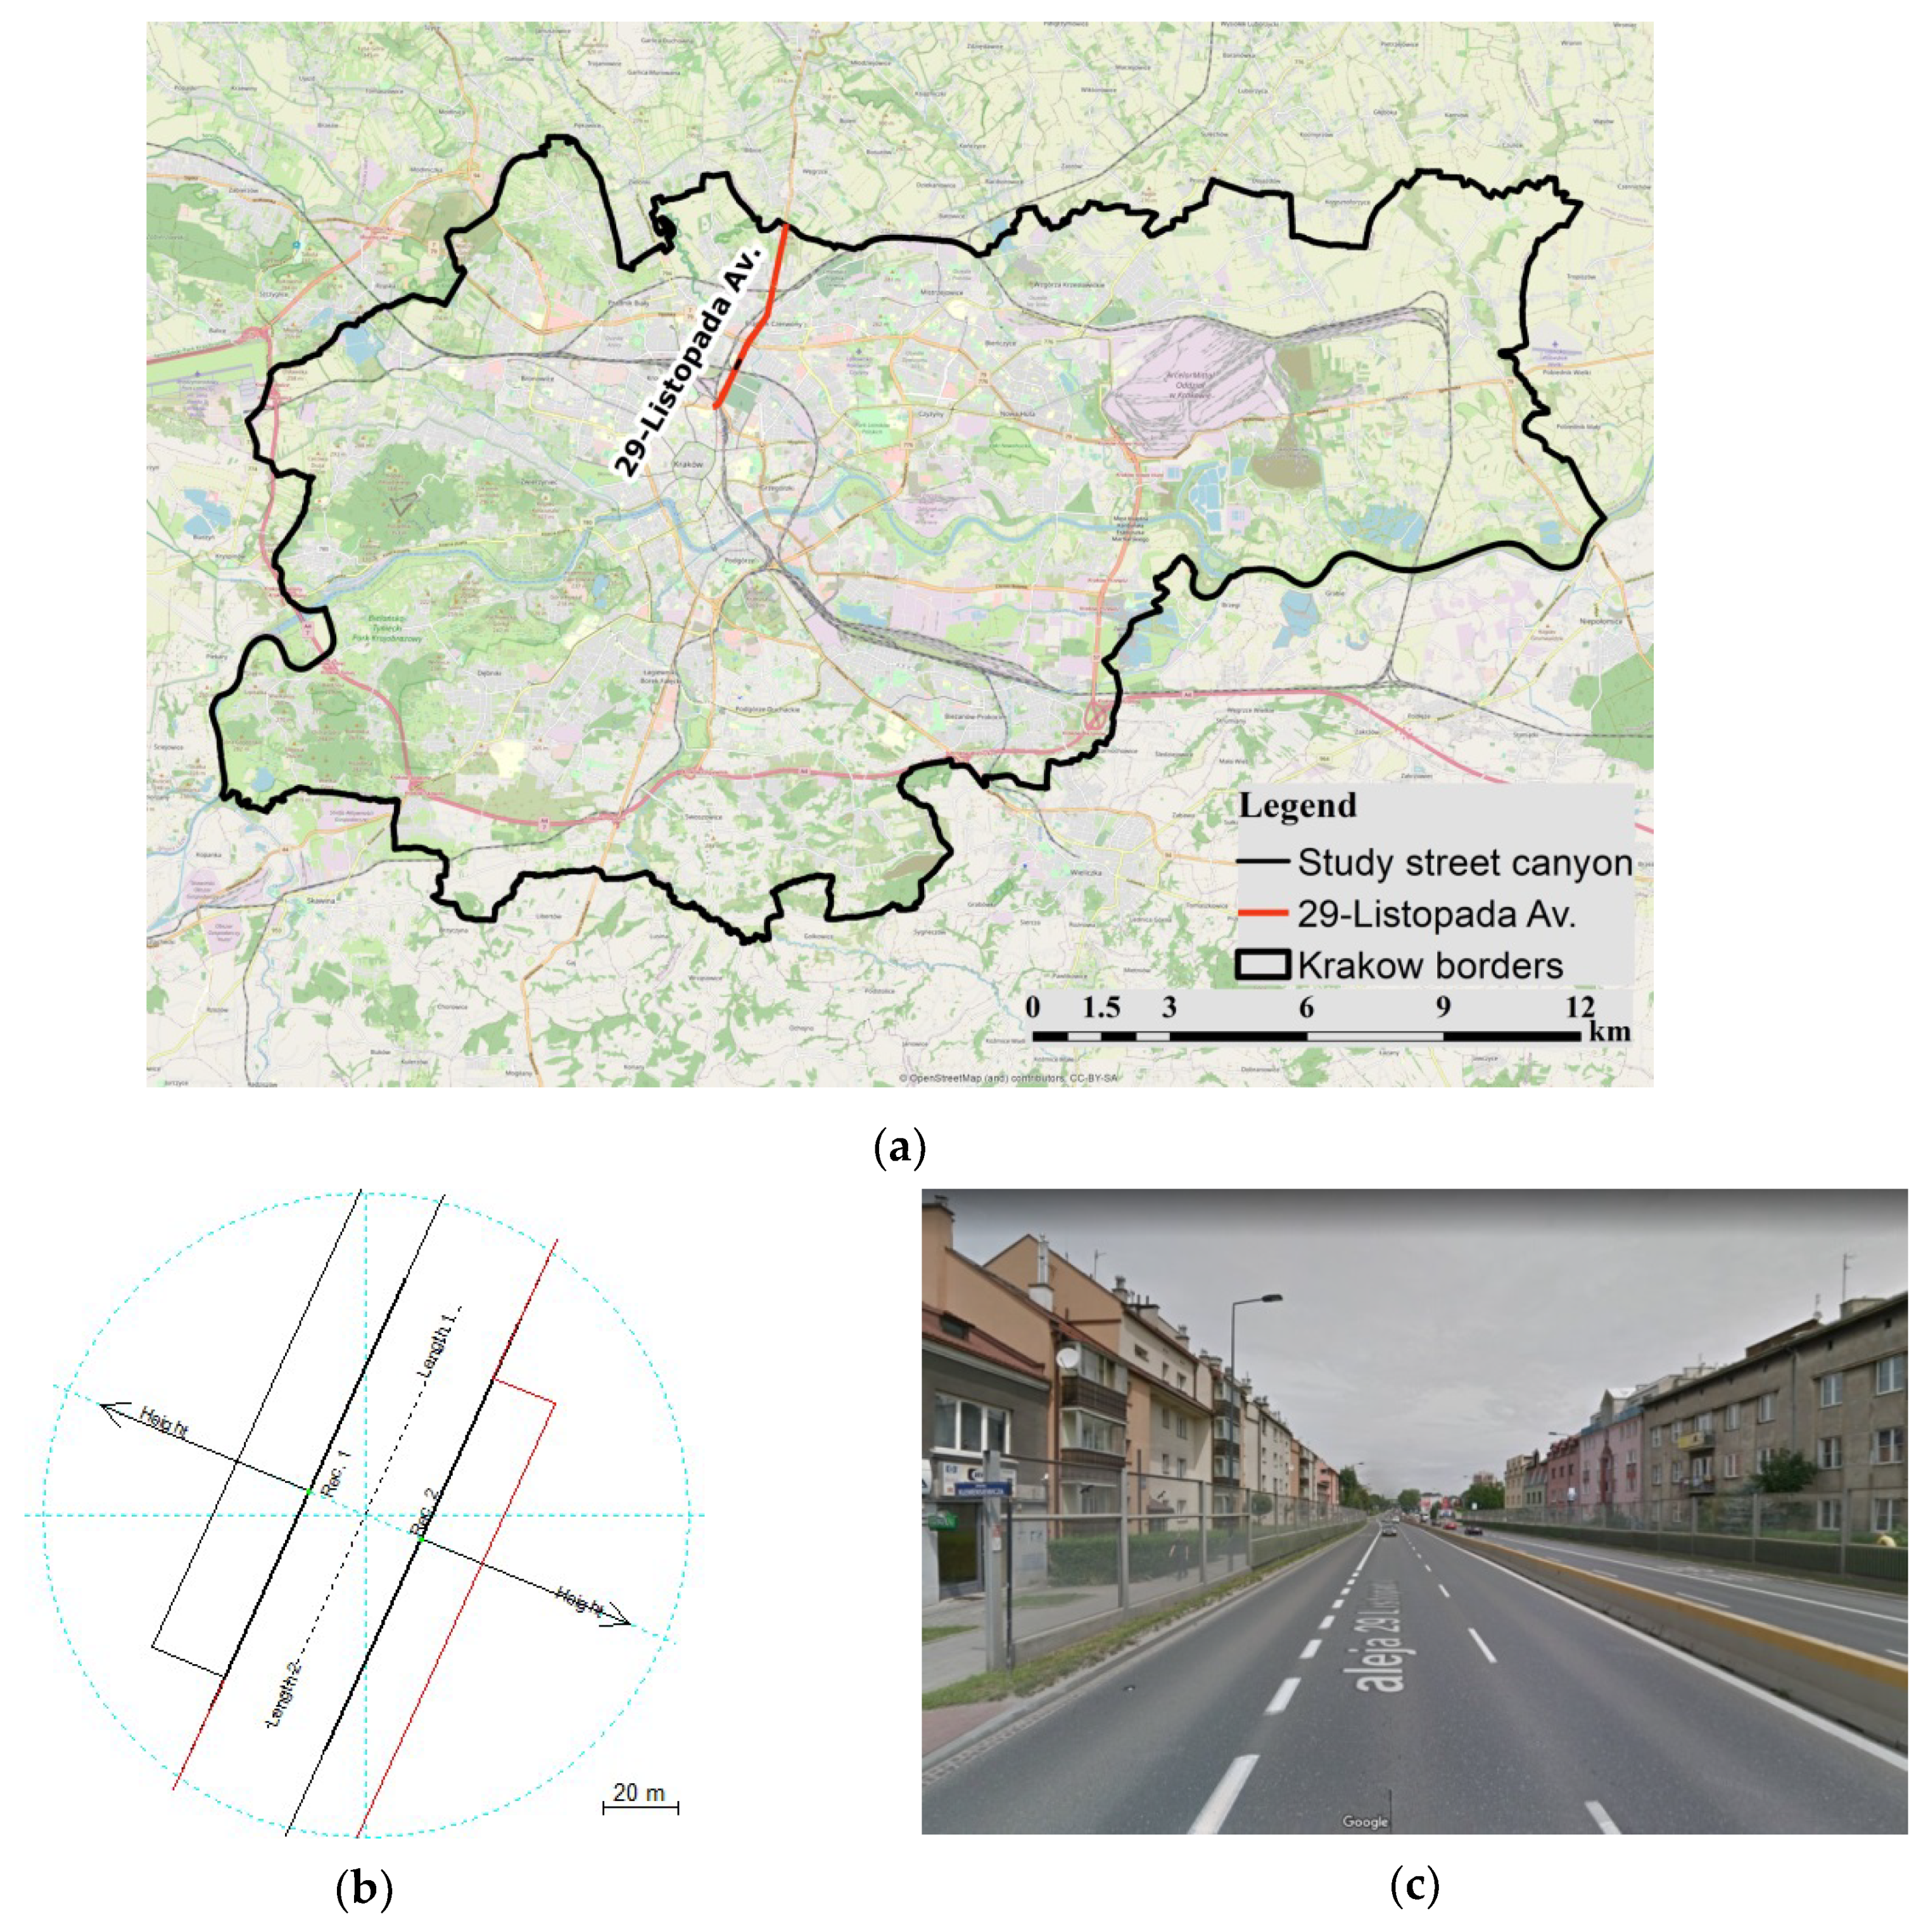
2.1. Street Canyon Characteristics

The object of the study was a street canyon with a width of 36 m, length of 120 m and the height of surrounding buildings of 18–21 m, located in the 29-Listopada Av. (Figure 1), one of the busiest arterial roads in Krakow and an exit route to other large provincial cities (Kielce, Warsaw) as well as a convenient access road to the Krakow center.
Within the analyzed street canyon there is a dual carriageway with three lanes in both directions, including one bus-lane for public transportation buses, taxi-cars, and emergency vehicles. Low height acoustic screens are also situated inside the street canyon, but they were not considered in the canyon geometry required for pollutant dispersion modeling.

2.2. Considered Traffic Reorganization Variants

Three scenarios of the traffic management changes were assessed: narrowing the cross-section of the street by eliminating one lane in both directions (Variant v1), limiting the maximum speed from 70 km/h to 50 km/h (Variant v2) and allowing only passenger and light commercial vehicles on the streets that meet the Euro 4 standard or higher (Variant v3). As a base variant for comparison of Variants v1–v3, the base scenario (Variant v0) was adopted, which is described by actual traffic volume in the analyzed canyon in 2017 based on the results of measurement conducted by the Krakow Road Administration (continuous measurements of the total number of passing vehicles for each carriageway with no division into categories and with a record interval of 1.5 s).
Obtained profiles of temporal variability of the traffic volume were used to determine the variation of hourly averaged vehicle speed during day as well as total hourly emission of the pollutants to the air from the street canyon with the vehicle structure taken into account and based on data from Central Registry of Vehicles and Drivers in Poland (CEPiK) [45] for the area of Krakow (with a weight of 0.75) and the remaining municipalities of Malopolska voivodeship (with a weight of 0.25). It was assumed that the structure is representative for vehicles traveling on the main streets of Krakow. Estimation of changes in the traffic volume and mean vehicle speed for Variants v1–v3 was based on data from Krakow Traffic Model [46] updated for year 2017 and additional assumptions. For example, in case of Variant v3 it was assumed, that 5% of the vehicles excluded from the traffic as a result of failing to meet the Euro 4 exhaust emission standard will be replaced with new vehicles meeting the Euro 6 standard. In addition, for the calculation of pollutants emission to the air it was established, that the variability of traffic speed is constant for every day in a week (according to the determined hourly averaged speed).

2.3. Calculations of the Pollutant Emissions to the Air

Pollutant emissions from a street canyon consists of the vehicle emission and the secondary emission from road. Emissions from vehicles were determined in accordance with the CORINAIR methodology [47] using the COPERT 5.2 software [48]. In the emissions calculations from vehicles, selected particulate (PM10 and PM2.5) and gaseous (NO and NO2) pollutants emissions from fuel combustion (with varying cold and warm emission during the year) were considered as well as the emissions of PM10 and PM2.5 particulate matter from tires, brakes, and road abrasion. These calculations were conducted based on the information concerning traffic volume and average vehicle speed using appropriate emission factors, which determination involved the following stages:
  • Estimation of the total annual emissions for concerned pollutants from the fleets of vehicles registered in Krakow and other communes of the Malopolska voivodeship based on the hourly emissions;
  • Determination of emission factors of analyzed pollutants for one vehicle (veh) in g/(km·veh) for each vehicle category in the fleets with differentiation in the amount of cold emissions from fuel combustion in particular months taken into account;
  • Calculation of the final hourly averaged emission factors divided into three vehicle categories distinguished in the Krakow Traffic Model [46] (passenger cars, light commercial vehicles and heavy trucks with buses) with the assumption that during one hour about 75% of the vehicles on the Krakow streets are registered in Krakow and 25% are from outside of the city (registered in the remaining communes of the Malopolska voivodeship).
In accordance with the CORINAIR methodology [47], in the calculations of emission factors for concerned vehicle fleets their structure was considered with main categories (passenger cars, light commercial vehicles, heavy trucks, buses, motorcycles, and mopeds) and subcategories depending on technical condition of the vehicles and the EURO emission standards they meet. Due to the lack of data concerning the parameter describing vehicle mileage, information about average mileages for some categories were derived from the report [49].
Secondary emission from road induced by mechanical turbulences caused by moving vehicles was estimated based on the U.S. EPA guidelines [50,51] using the relationship
E = k (sL)0.91 (W)1.02,
where E—particulate emission factor for one vehicle (g/(km·veh)); k—particle size multiplier for particle size range; sL—road surface silt loading (g/m2); W—average weight of the vehicles traveling the road (Mg).
In accordance with the U.S. EPA recommendation for the roads of traffic volume greater than 10,000 veh/day the road surface silt loading sL = 0.03 g/m2 was assumed [50,52]. Particle size multiplier k for PM10 was assumed equal to 0.62 [50] and for PM2.5 equal to 0.25 based on the research conducted for selected streets in Krakow [42]. Application of the previously mentioned factors was verified by appropriately accurate results of the modeled concentrations of PM10 and PM2.5 in the air for the Krasinski Av. street canyon in Krakow [35]. Secondary emission from road was determined or each hour in the analyzed period (for the whole year), taking into account hourly variability of the traffic volume in the analyzed variant and meteorological conditions (amount of precipitation). In a situation when precipitation in a given hour was at least 0.254 mm, the secondary emission rate E was assumed as zero.

2.4. Modeling of the Pollutants Concentrations in the Air

Calculations of the pollutants concentrations in the air were conducted for two outermost points of the street canyon cross-section (Figure 1b) at the height of 1.5 m above ground level using the OSPM (Operational Street Pollution Model) microscale dispersion model, which is a combination of the Gaussian plume model and the box model approach. Total concentration of pollutants in the area of street canyon consists of direct impact and the recirculating effects [26,27,28]. OSPM is characterized by relatively simple approach when calculating the concentrations of pollutants and a high computation efficiency. The emission field is here represented by an infinitely long linear source, oriented perpendicularly to wind direction at the street level. Model assumes that the air pollutants caused by car movement accumulate on the leeward side of the street canyon due to the presence of recirculation vortex. In the recirculation zone, the concentrations are calculated based on the assumption that the inflow of pollutants is equal to its outflow. Box model implemented in OSPM allows as well for the calculation of pollutants originating from outside of the street canyon (background pollution) in addition to those produced in the canyon [26]. Dispersion of the PM10 and PM2.5 particles is treated using the same approach, therefore calculated concentrations of these pollutants are proportional to their emission rates. This model does not take into account the processes of homogeneous nucleation, coagulation, condensation, evaporation, as well as wet and dry deposition [53]. However, in case of nitrogen oxides, simple chemical transformation mechanisms were implemented which depend on the ozone concentration and solar radiation intensity [28].
As shown in the work [35], a certain improvement of the prognostic accuracy of the OSPM model in terms of the modeled PM10 and PM2.5 levels is possible through implementation in the modeling process of the secondary emission of particulate matter from road next to the emission from vehicles, which was also applied in this study. A great share of the secondary emission in shaping the levels of PM10 and PM2.5 in the air near traffic routes is confirmed by studies conducted in various regions in the world [11,42,43,54,55].

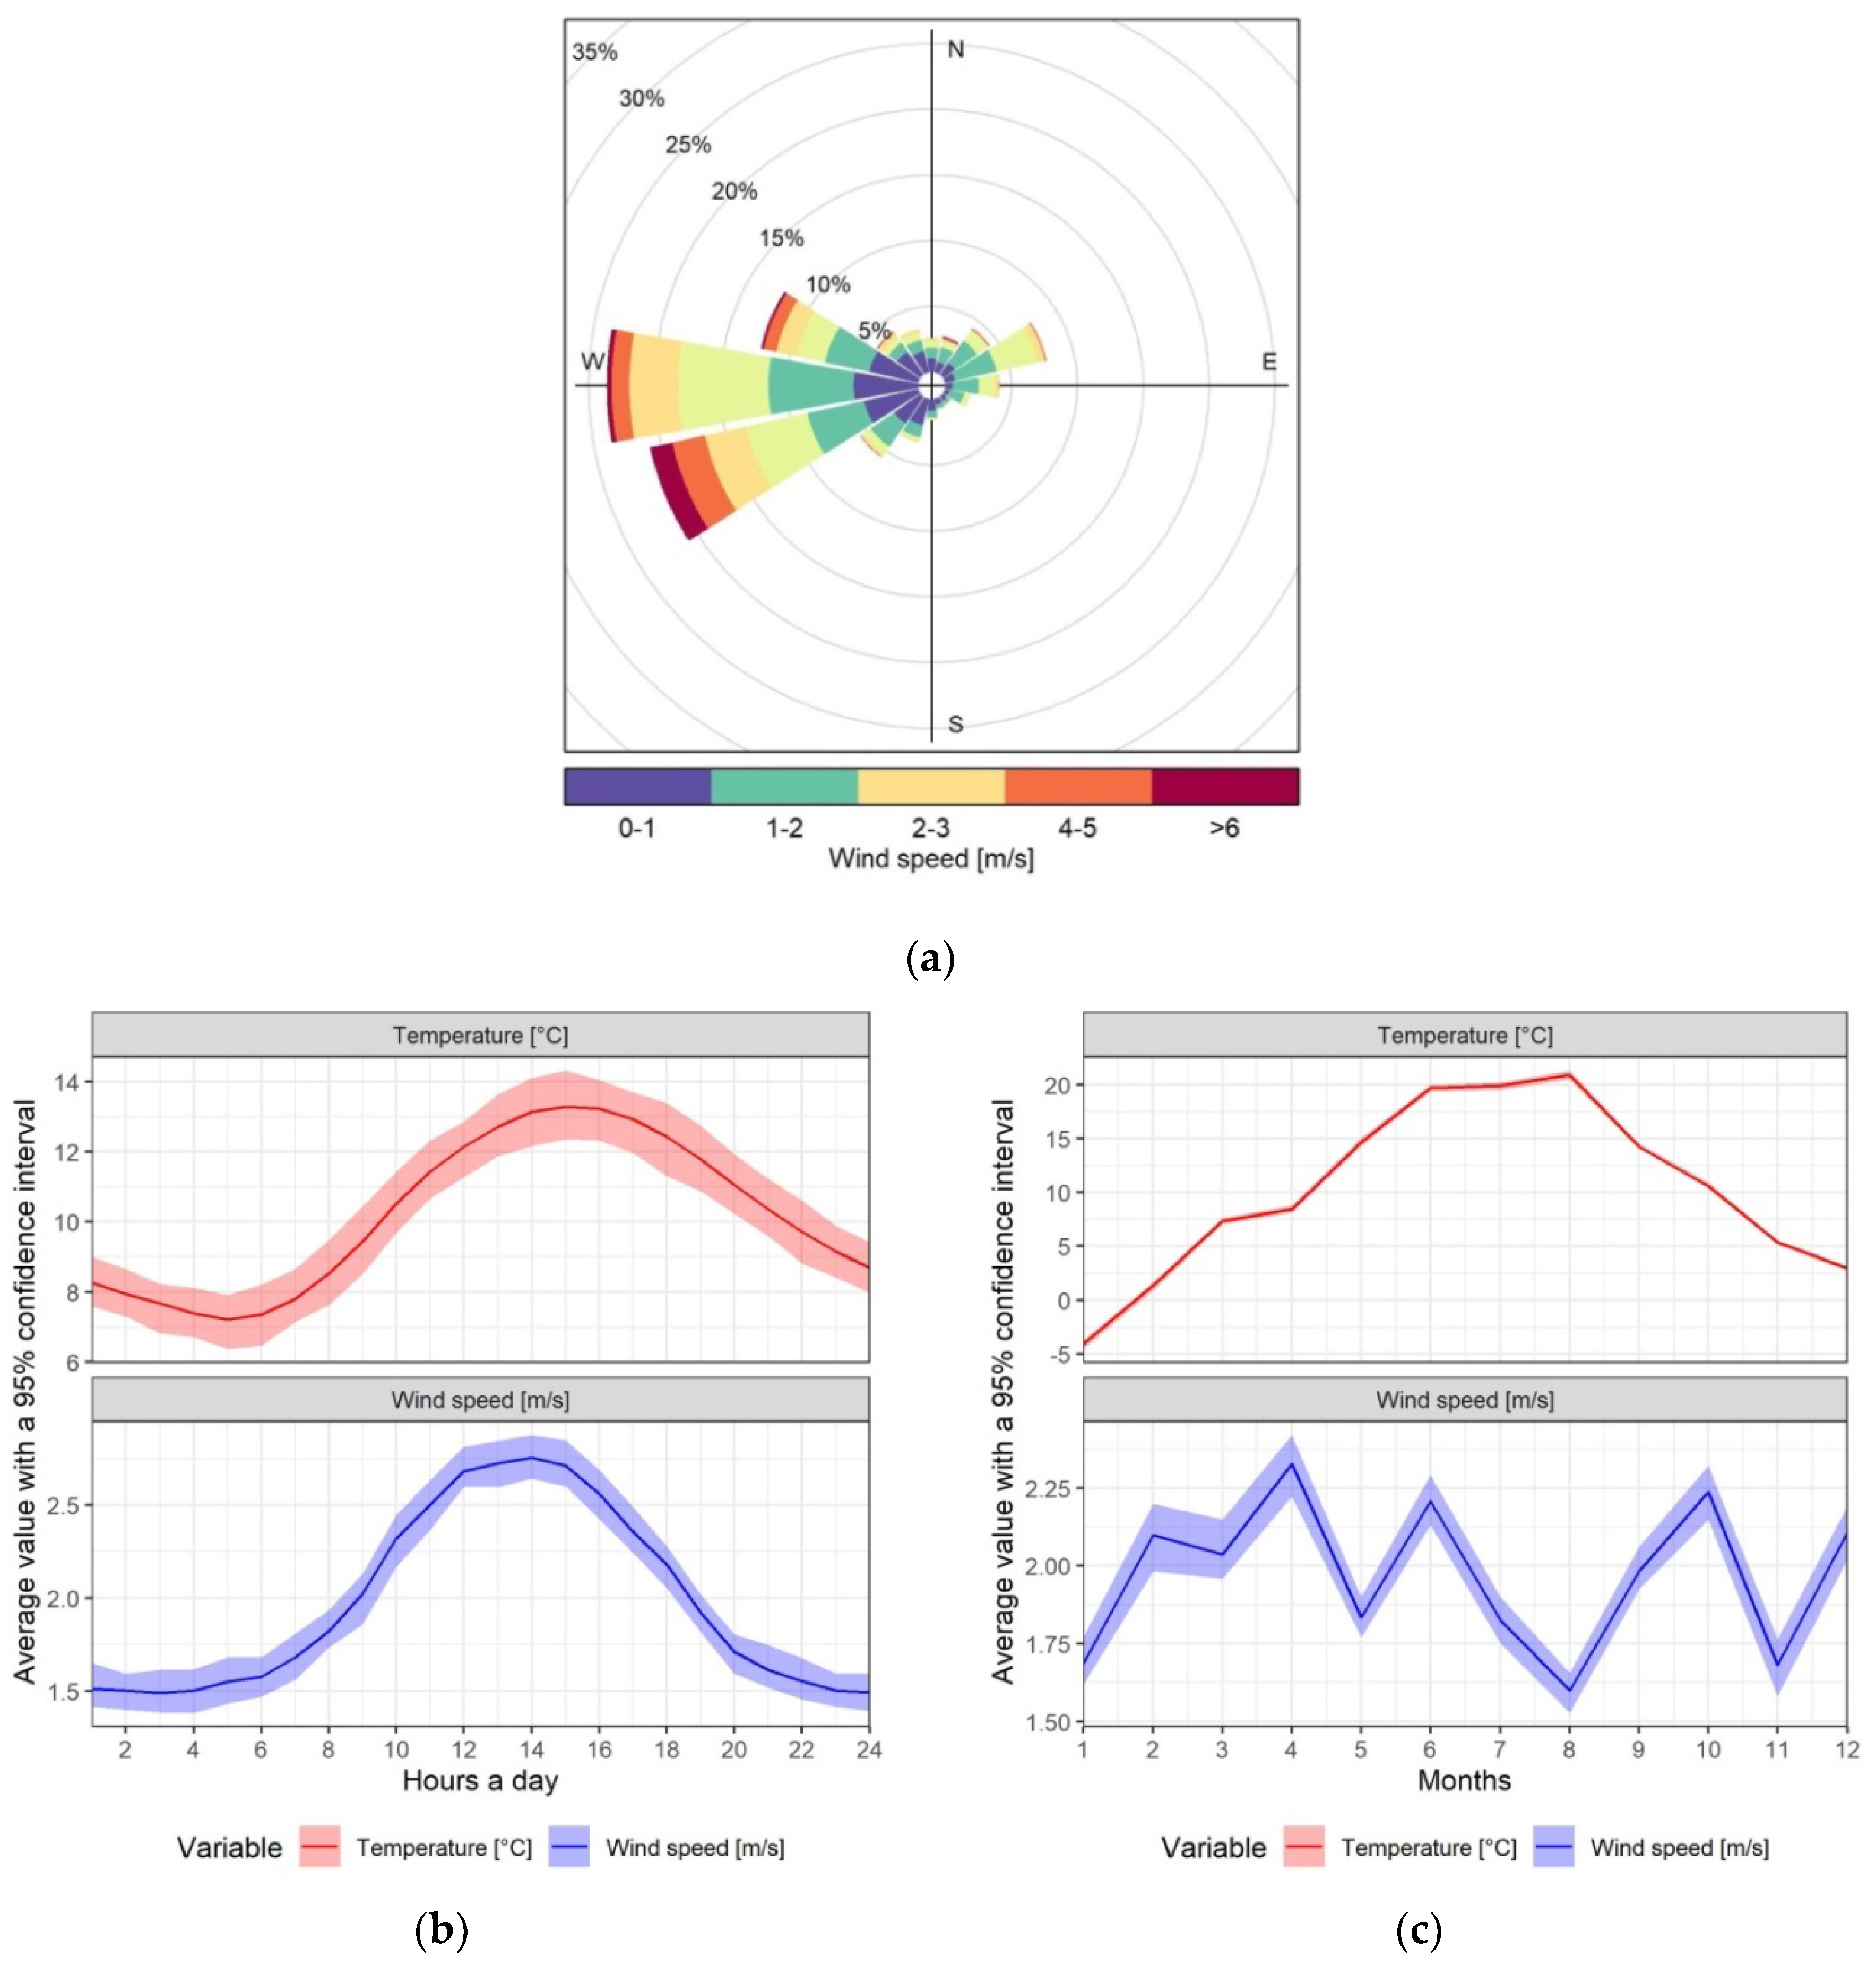
2.5. Meteorological Data

In the calculation of pollutants emission and later for the modeling process of their dispersion in the air, the meteorological conditions characterizing year 2017 were used. Basic meteorological data were assumed based on the measurements derived from the weather station located in the Krakow center (in the vicinity of the AGH University) [56]. The only exception is the total solar radiation, which values originate from the ERA5 meteorological reanalysis provided by the European Centre for Medium-Range Weather Forecasts—ECMWF [57]. Wind rose and time series of selected meteorological parameters used in the study are shown in Figure 2. As stems from Figure 1b and Figure 2a, the analyzed canyon is situated perpendicularly to the dominating wind direction. Therefore, elevated levels of pollutants should be expected in the canyon due to the frequent occurrence of the recirculation vortex.

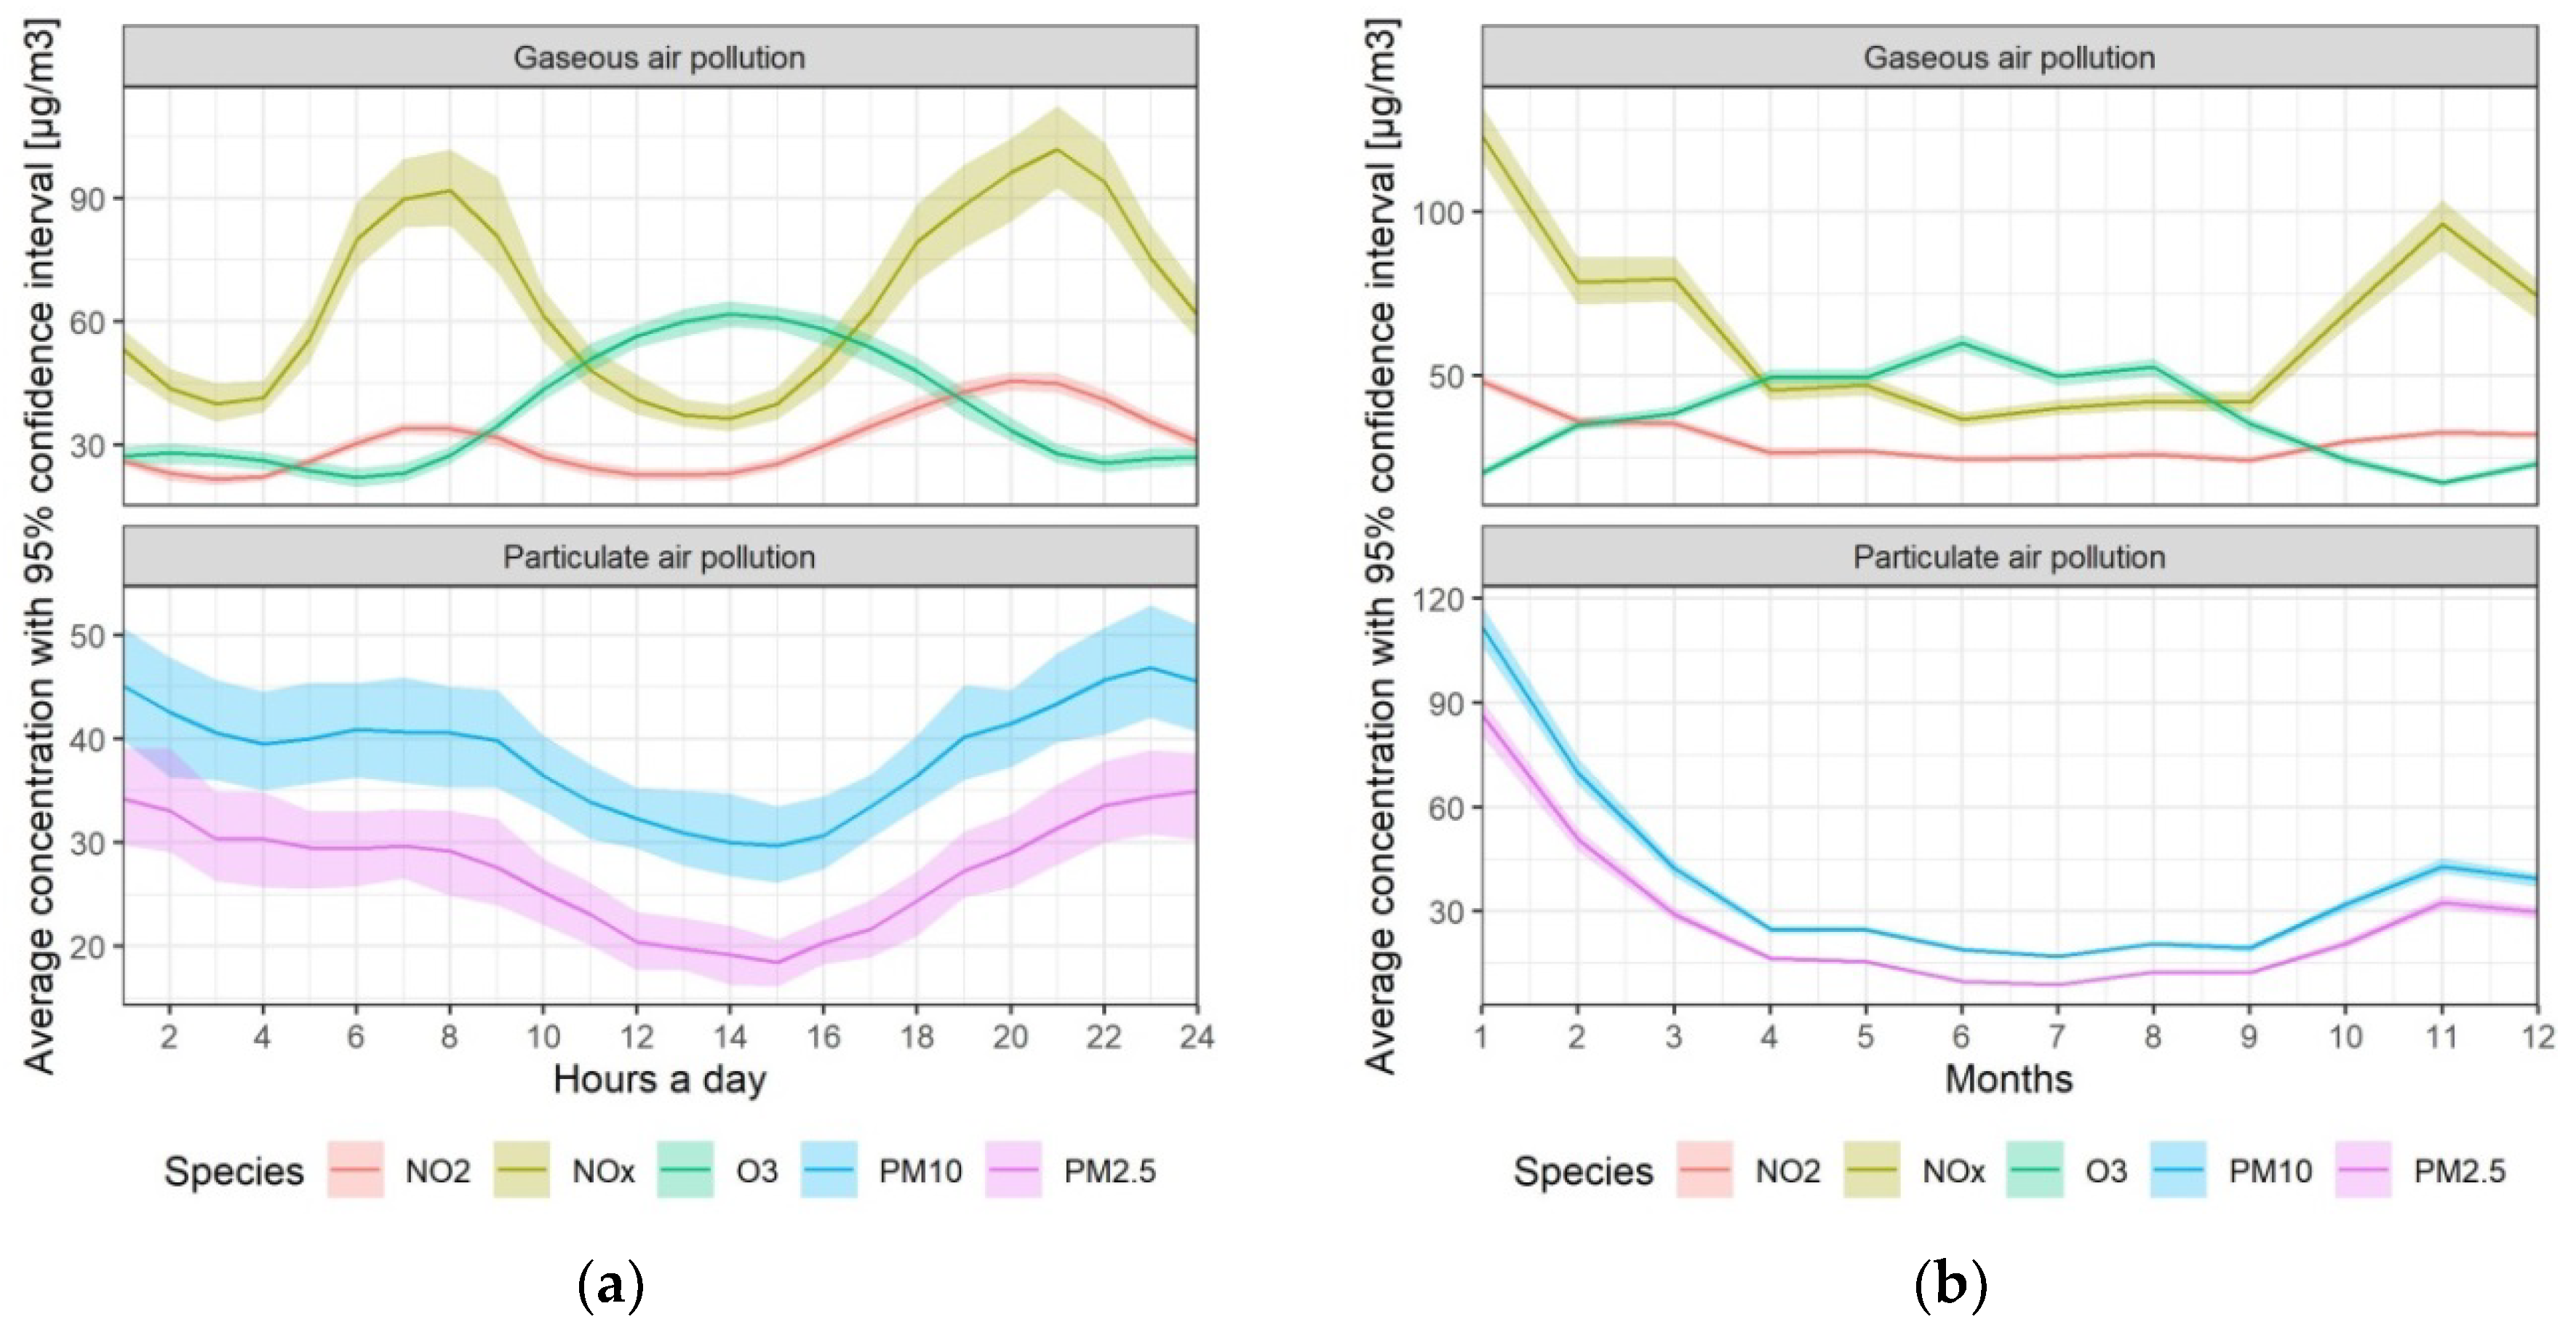
2.6. Background Pollution and Evaluation of the OSPM Model

Background levels of particle and gaseous pollutants for the analyzed street canyon were determined in accordance with the methodology described in [35]. This methodology yielded satisfactory results of the OSPM model accuracy. Its basal assumption was to determine pollution background based on the 1-h measurements for 2017 from the urban background station in Krakow [44]. For most of the year, these data originated from the station located at Bujaka St., which measures all of the pollutants considered in the study and ozone as well. In the case of lack of measurements from this station or when concentrations of the analyzed pollutants were higher at Bujaka St. than at the urban traffic station at Krasinski Av., background levels were determined using data from other selected background or industrial sites operational at that time, whenever it was possible and the measurements from these sites were not excessively differentiated (otherwise these data were omitted when determining the average background). Completeness of data used for the background calculation was greater than 94% of the year. Annually averaged background pollution values with selected descriptive statistics are presented in Table 1, and temporal variability of the 1-h concentrations of concerned substances in Figure 3. In case of NO, the background was assumed based on the difference between background pollution for NOx and NO2 converted to NO. Thus, the annual mean of this background was determined as equal to 22.04 µg/m3.
Evaluation of the OSPM model was conducted using methods of environmental models assessment, mentioned, among others, in the work [35], with the use of results of measurements for the Krasinski Av. street canyon in Krakow where an air quality station is located. For this purpose, separate calculations of the temporal variability of pollutants emissions and their concentrations for the year 2017 were conducted, using analogous methodology as for the 29-Listopada Av. street canyon. As a result of this evaluation, a high prognostic accuracy of the OSPM model was confirmed. In addition, it was found that the fundamental reason for obtained discrepancy between modeled and observed values is the methodology of the background determination, which level is strongly dependent on the seasonal variability of the emissions from the communal-household sector (which applies majorly to the concentrations of PM10 and PM2.5 during heating season, especially during night hours). The results of research in [34] show that the OSPM model is characterized by high prognostic accuracy of the annually averaged NO2 concentrations; however, during summer season, this model tends to overestimate the outcomes of NO2. This finding should be taken into account when analyzing the results of calculations of the maximum hourly averaged concentrations and comparing them to with the permissible levels of NO2 in the air.

3. Results

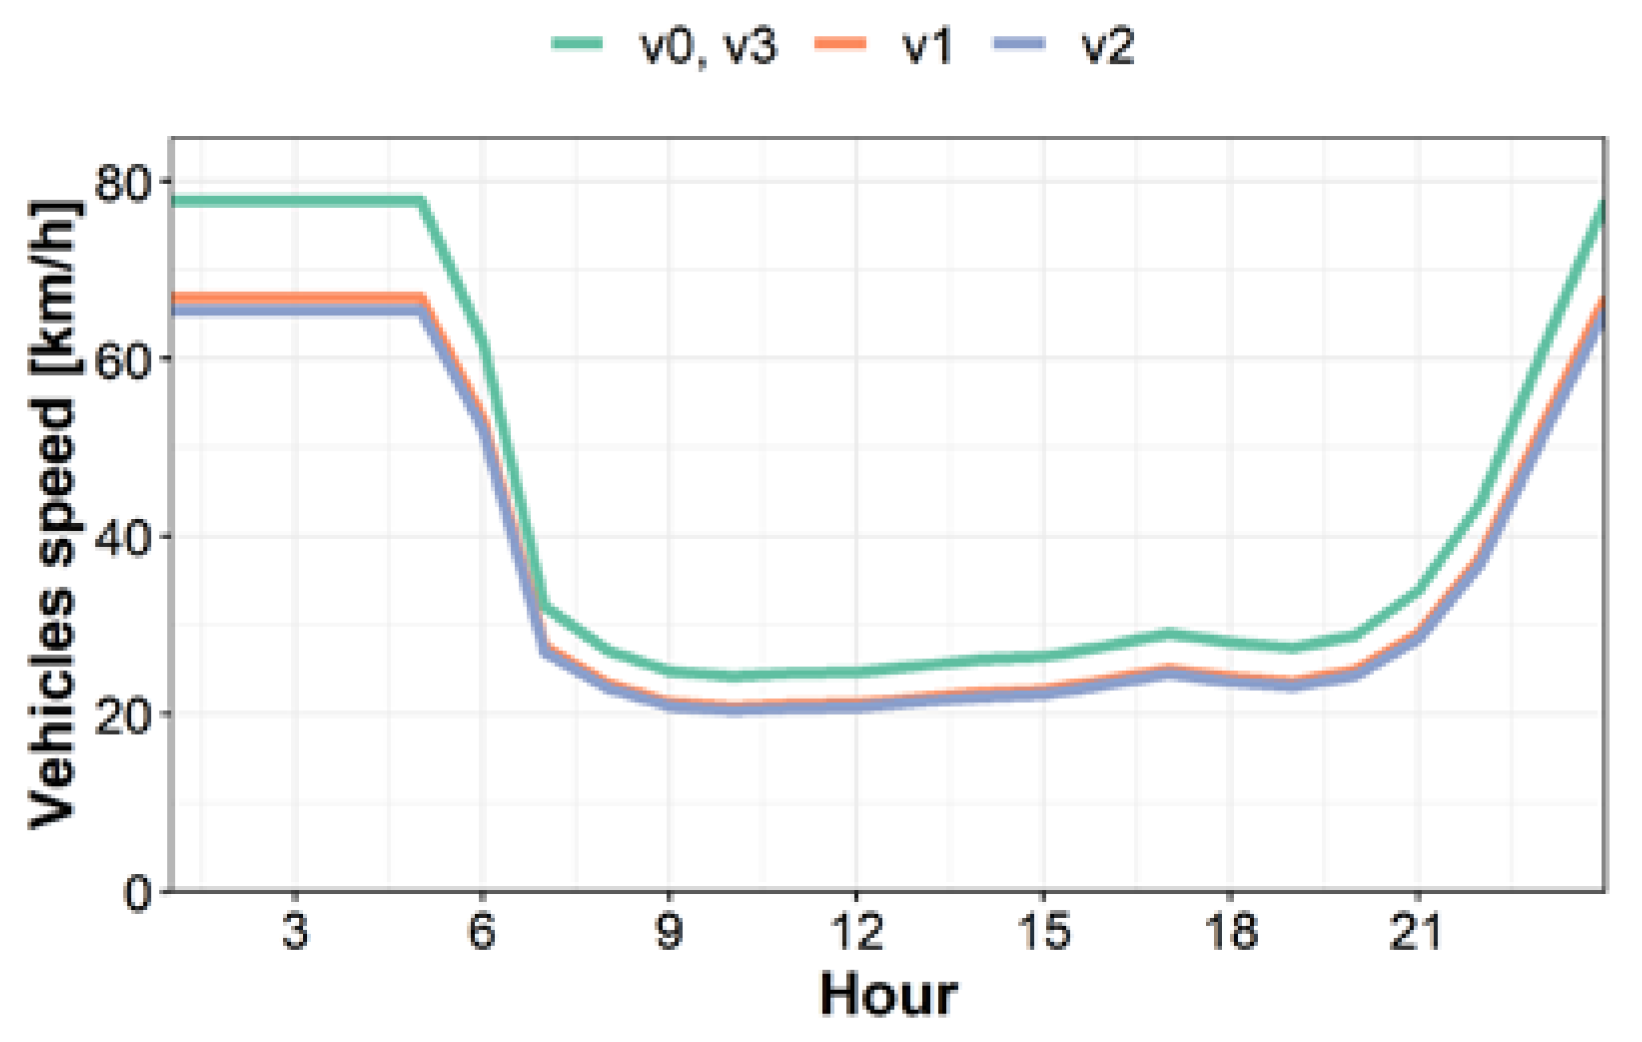
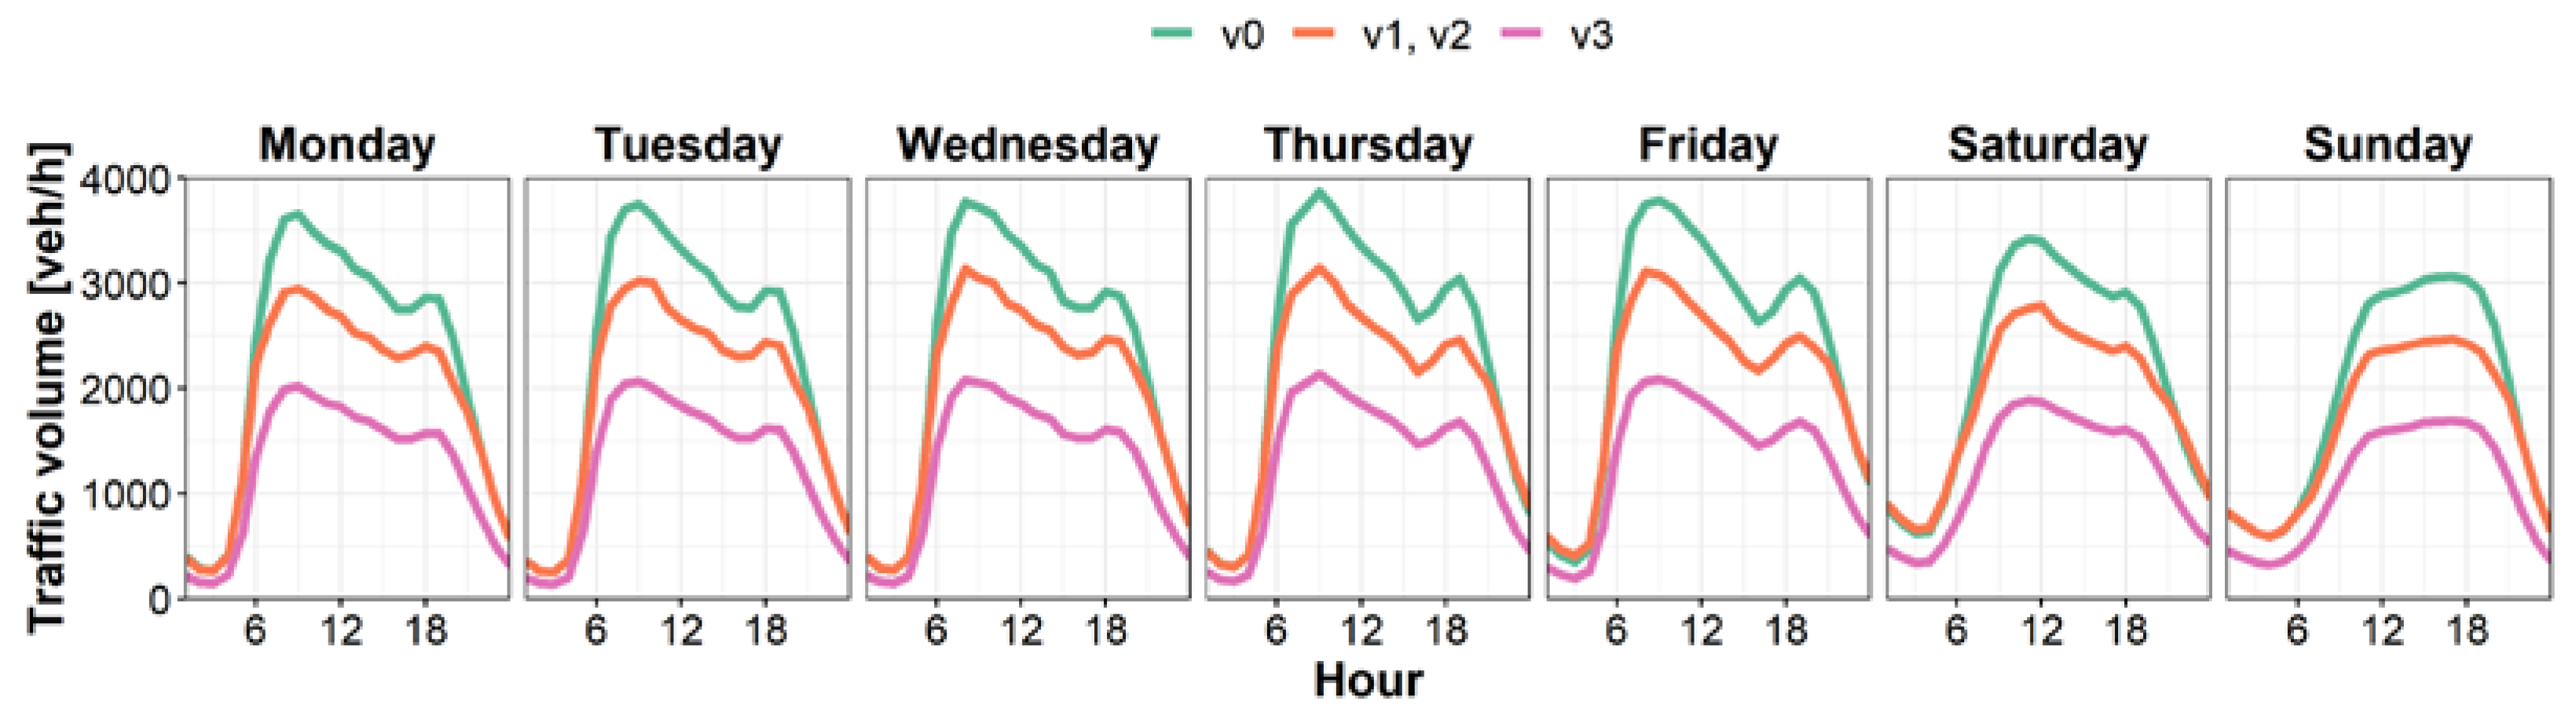
3.1. Comparison of Speed and Traffic Volume Profiles in Considered Variants

Comparison of temporal variability of hourly averaged speed and traffic volume of the vehicles traveling through the 29-Listopada Av. street canyon in Krakow, determined for the base Variant (v0) and considered variants with reorganized traffic (Variants v1–v3) was presented in Figure 4; Figure 5. A complete listing of traffic volumes (estimated values rounded to the full number of vehicles) for different periods of time for the analyzed variants is given in Table 2.
In case of Variant v1 (elimination of one lane in each direction), based on the simulation results conducted using traffic model, it was found that the vehicle speed during morning rush hours was decreased by approximately 20% towards the city center and by approximately 11% in the opposite direction (in relation to Variant v0). Such action would also result in lower traffic volume during morning rush hours by approximately 15–16% depending on the traffic direction. This in turn affects the diurnal profile of hourly averaged speed (Figure 4) and decrease in the daily averaged traffic speed from about 37 km/h (characterizing Variant v0) to about 32 km/h (in case of Variant v1). On the other hand, reducing speed limit from 70 to 50 km/h, assumed in case of Variant v2, results in lower vehicle speed and traffic volume respectively by about 15% and 14% during morning rush hours towards the city center and by about 20% and 17% in the opposite direction (in relation to the base Variant v0). The actual daily averaged vehicle speed in this variant should decrease from 37 to 31 km/h. Weekly distributions of traffic volumes for Variants v1 and v2 are similar (Figure 5), thus the expected reduction in the averaged traffic volume in these scenarios in relation to Variant v0 is comparable and equals to 15% with reduction by about 15.5% during workdays and by about 14.1% during weekends (Table 2).
Introduction of the traffic reorganization scenario described by Variant v3 assumes exclusion from the traffic of passenger cars and light commercial vehicles that do not meet the Euro 4 emission standard and the replacement of 5% of the vehicles with new cars meeting the Euro 6 standard in the first year after its enforcement. Diurnal distribution of the traffic speed for Variant v3 was assumed the same as in the base Variant v0 (overlapping v0 and v3 lines in Figure 4). The resulting reduction in the traffic volume in relation to Variant v0 was about 45% (Table 2).

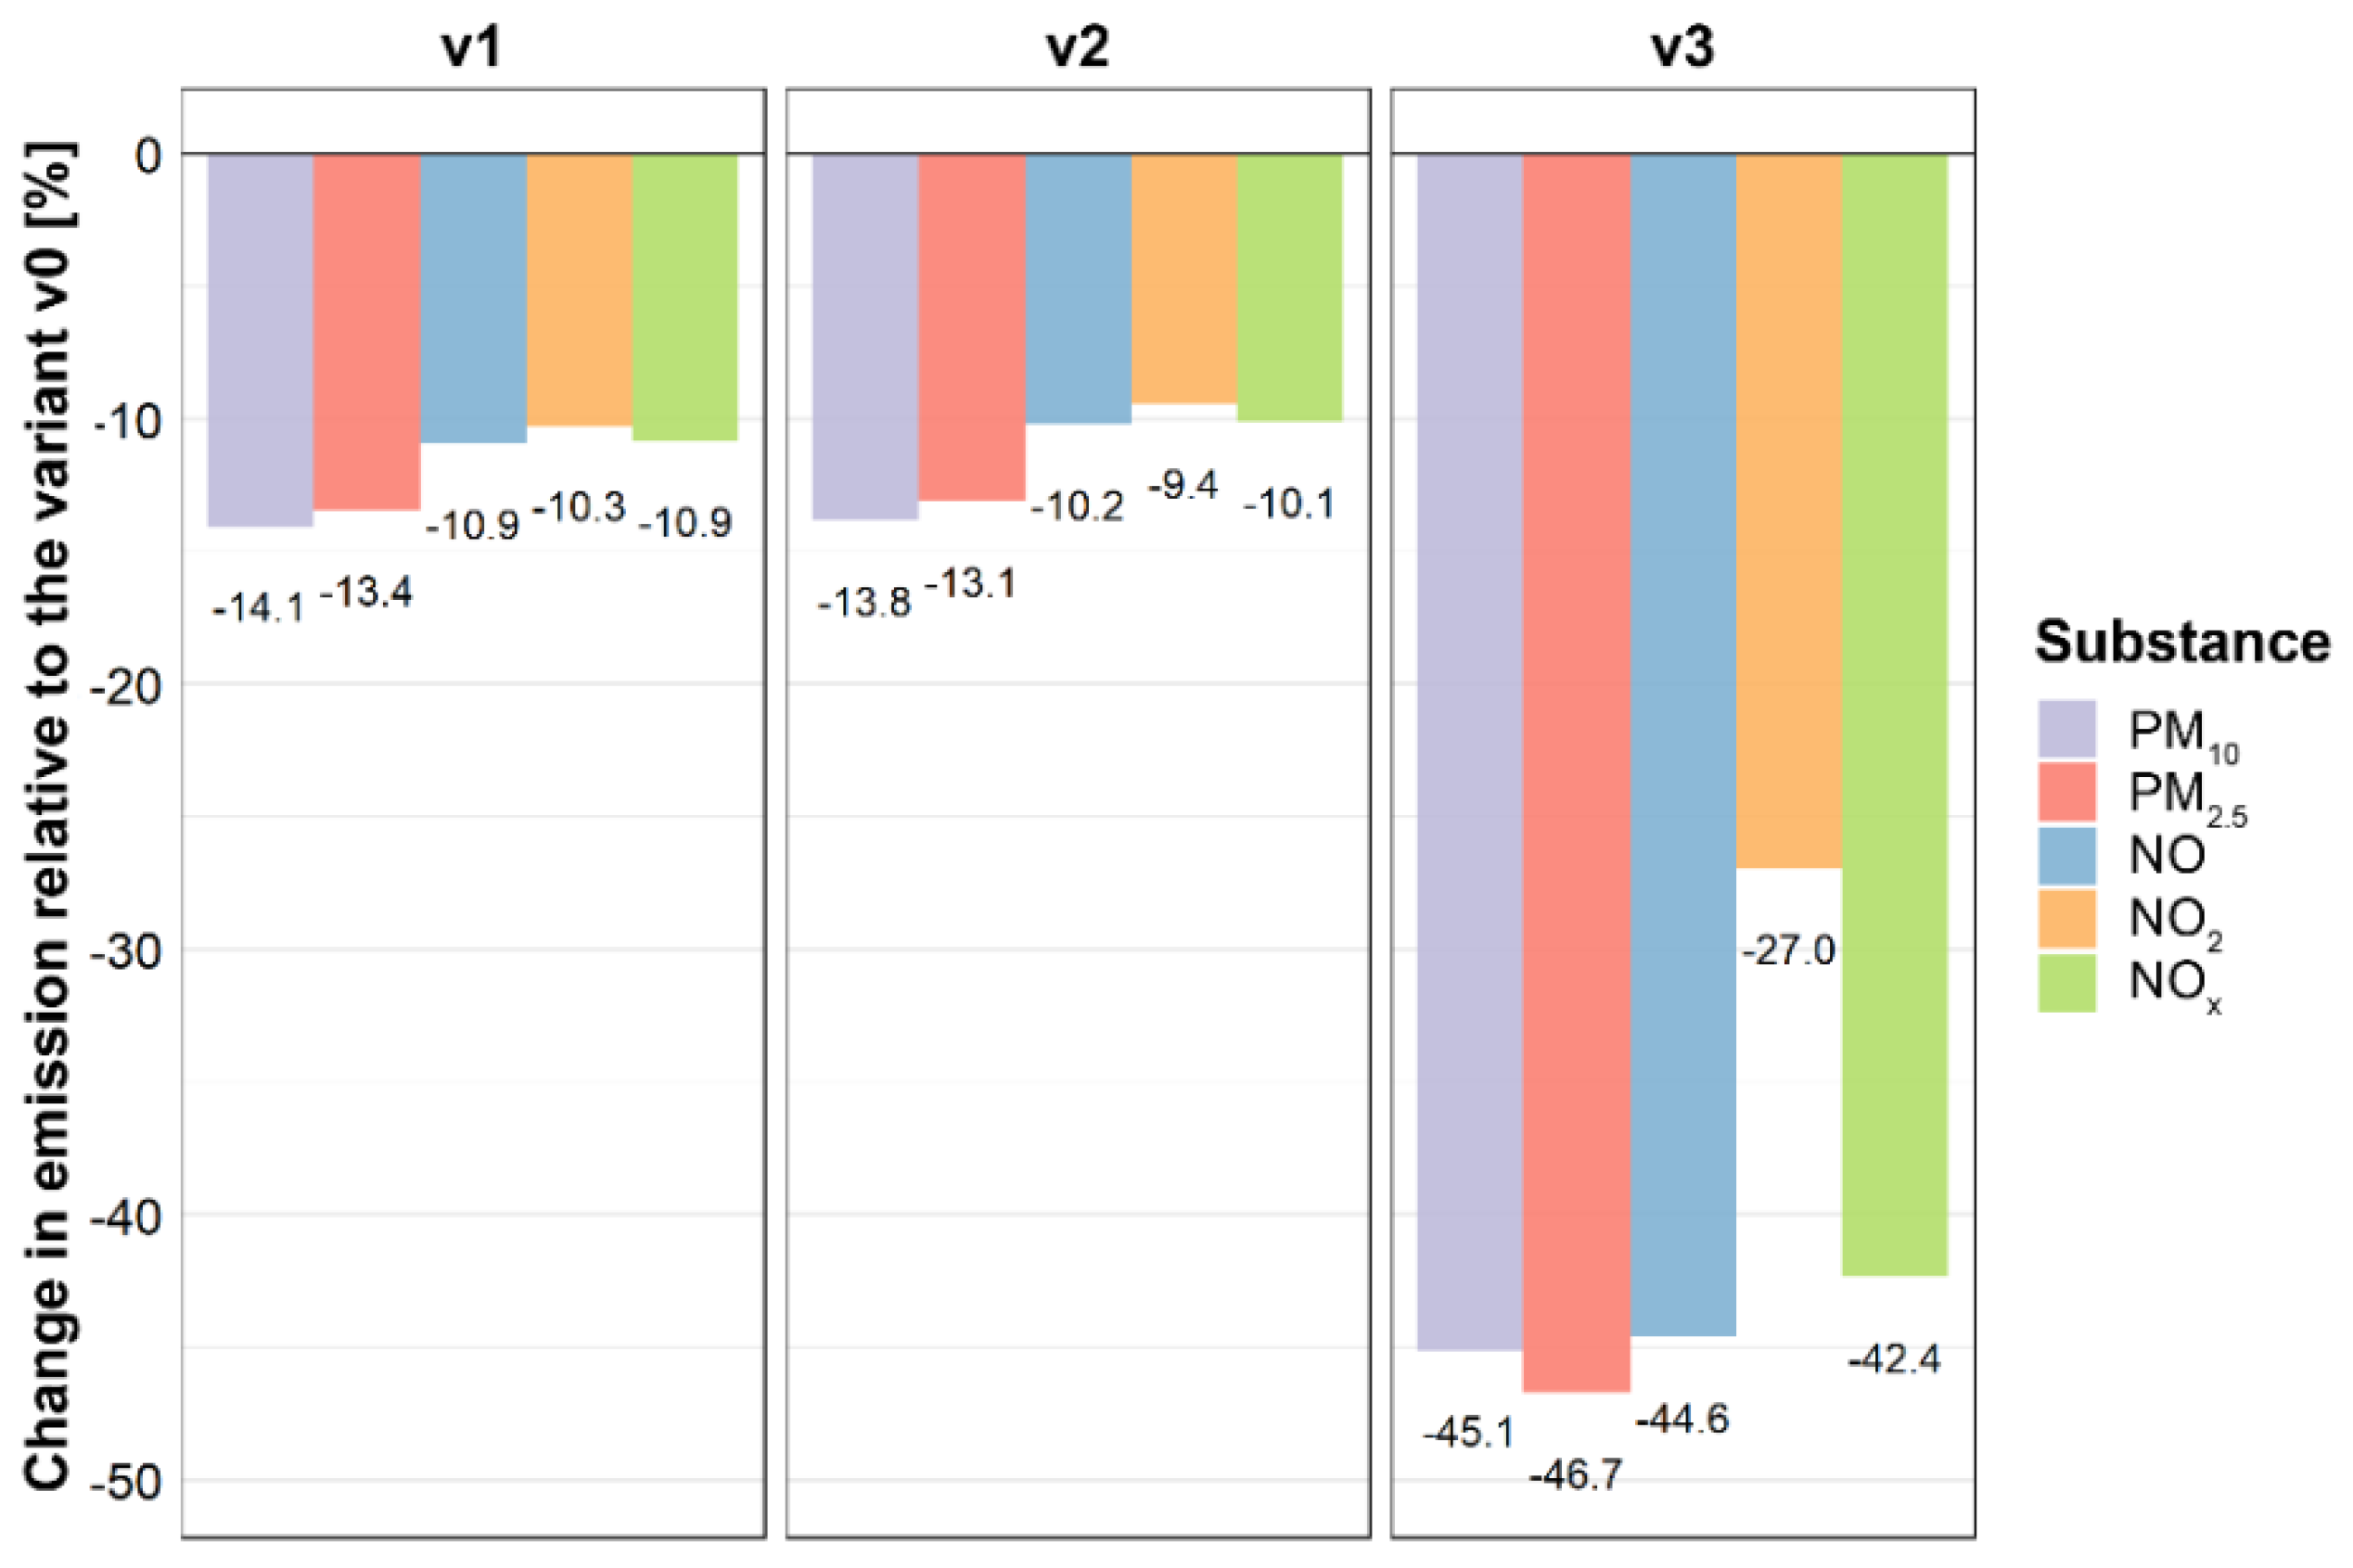
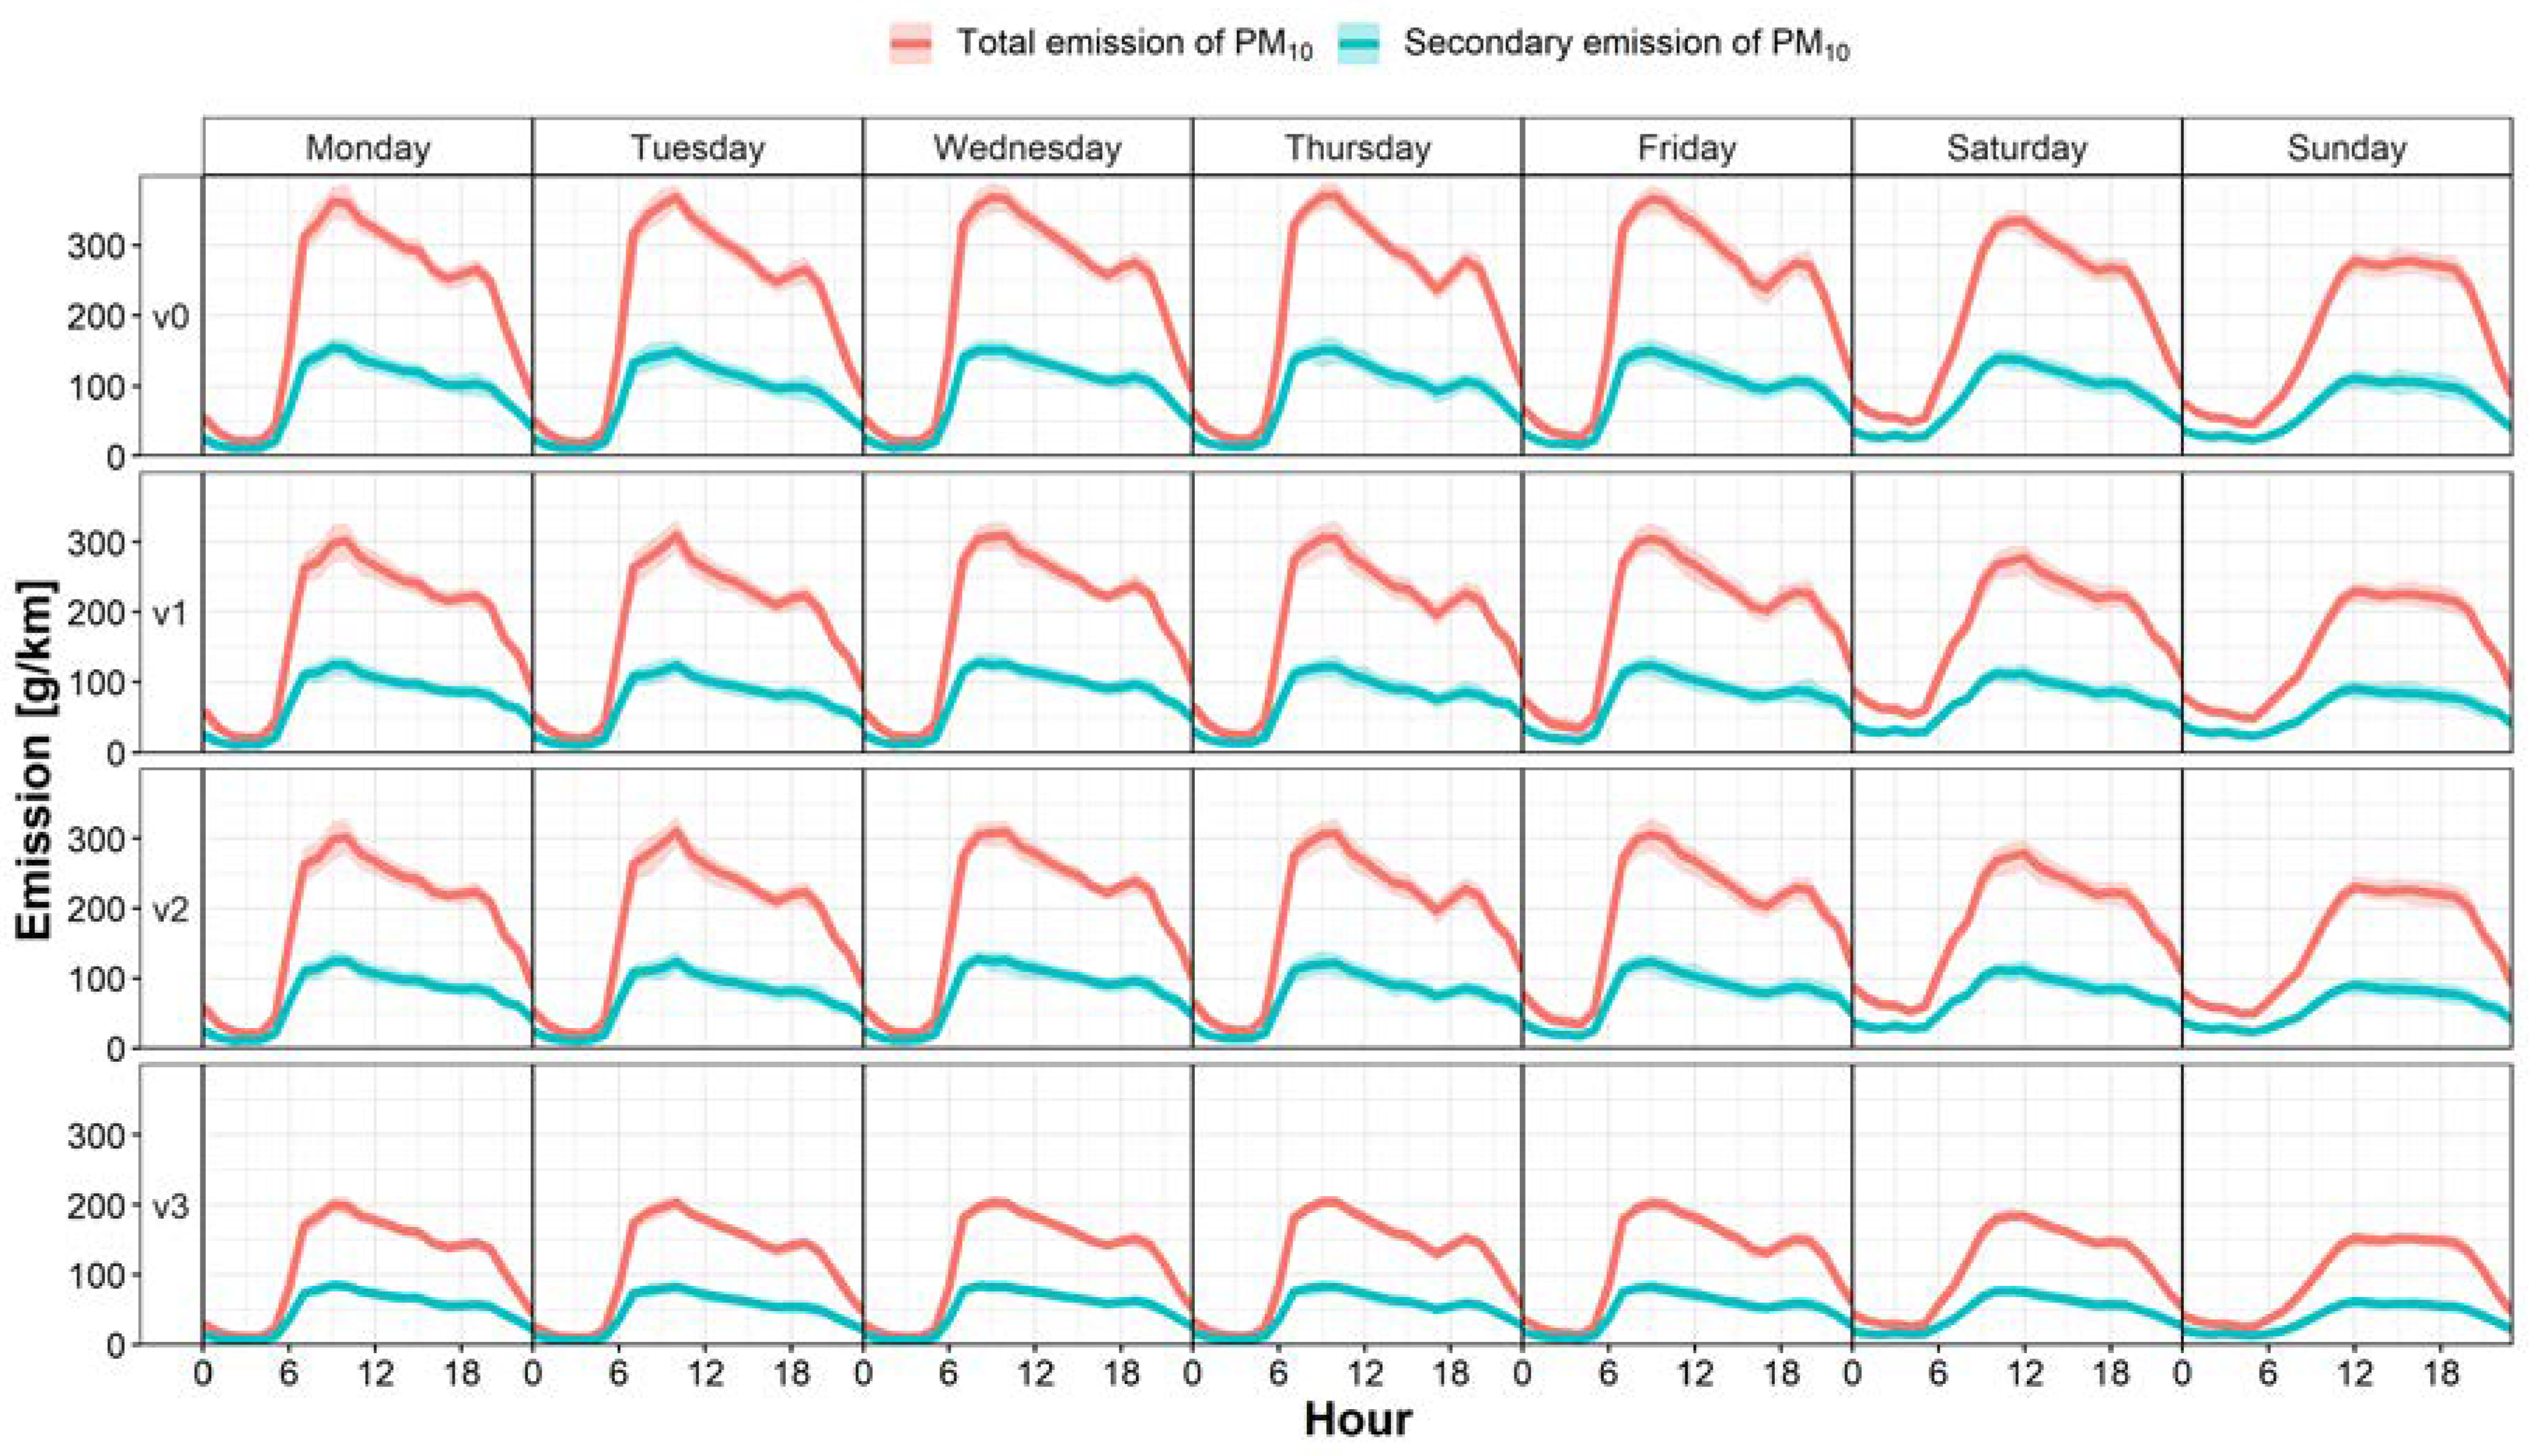
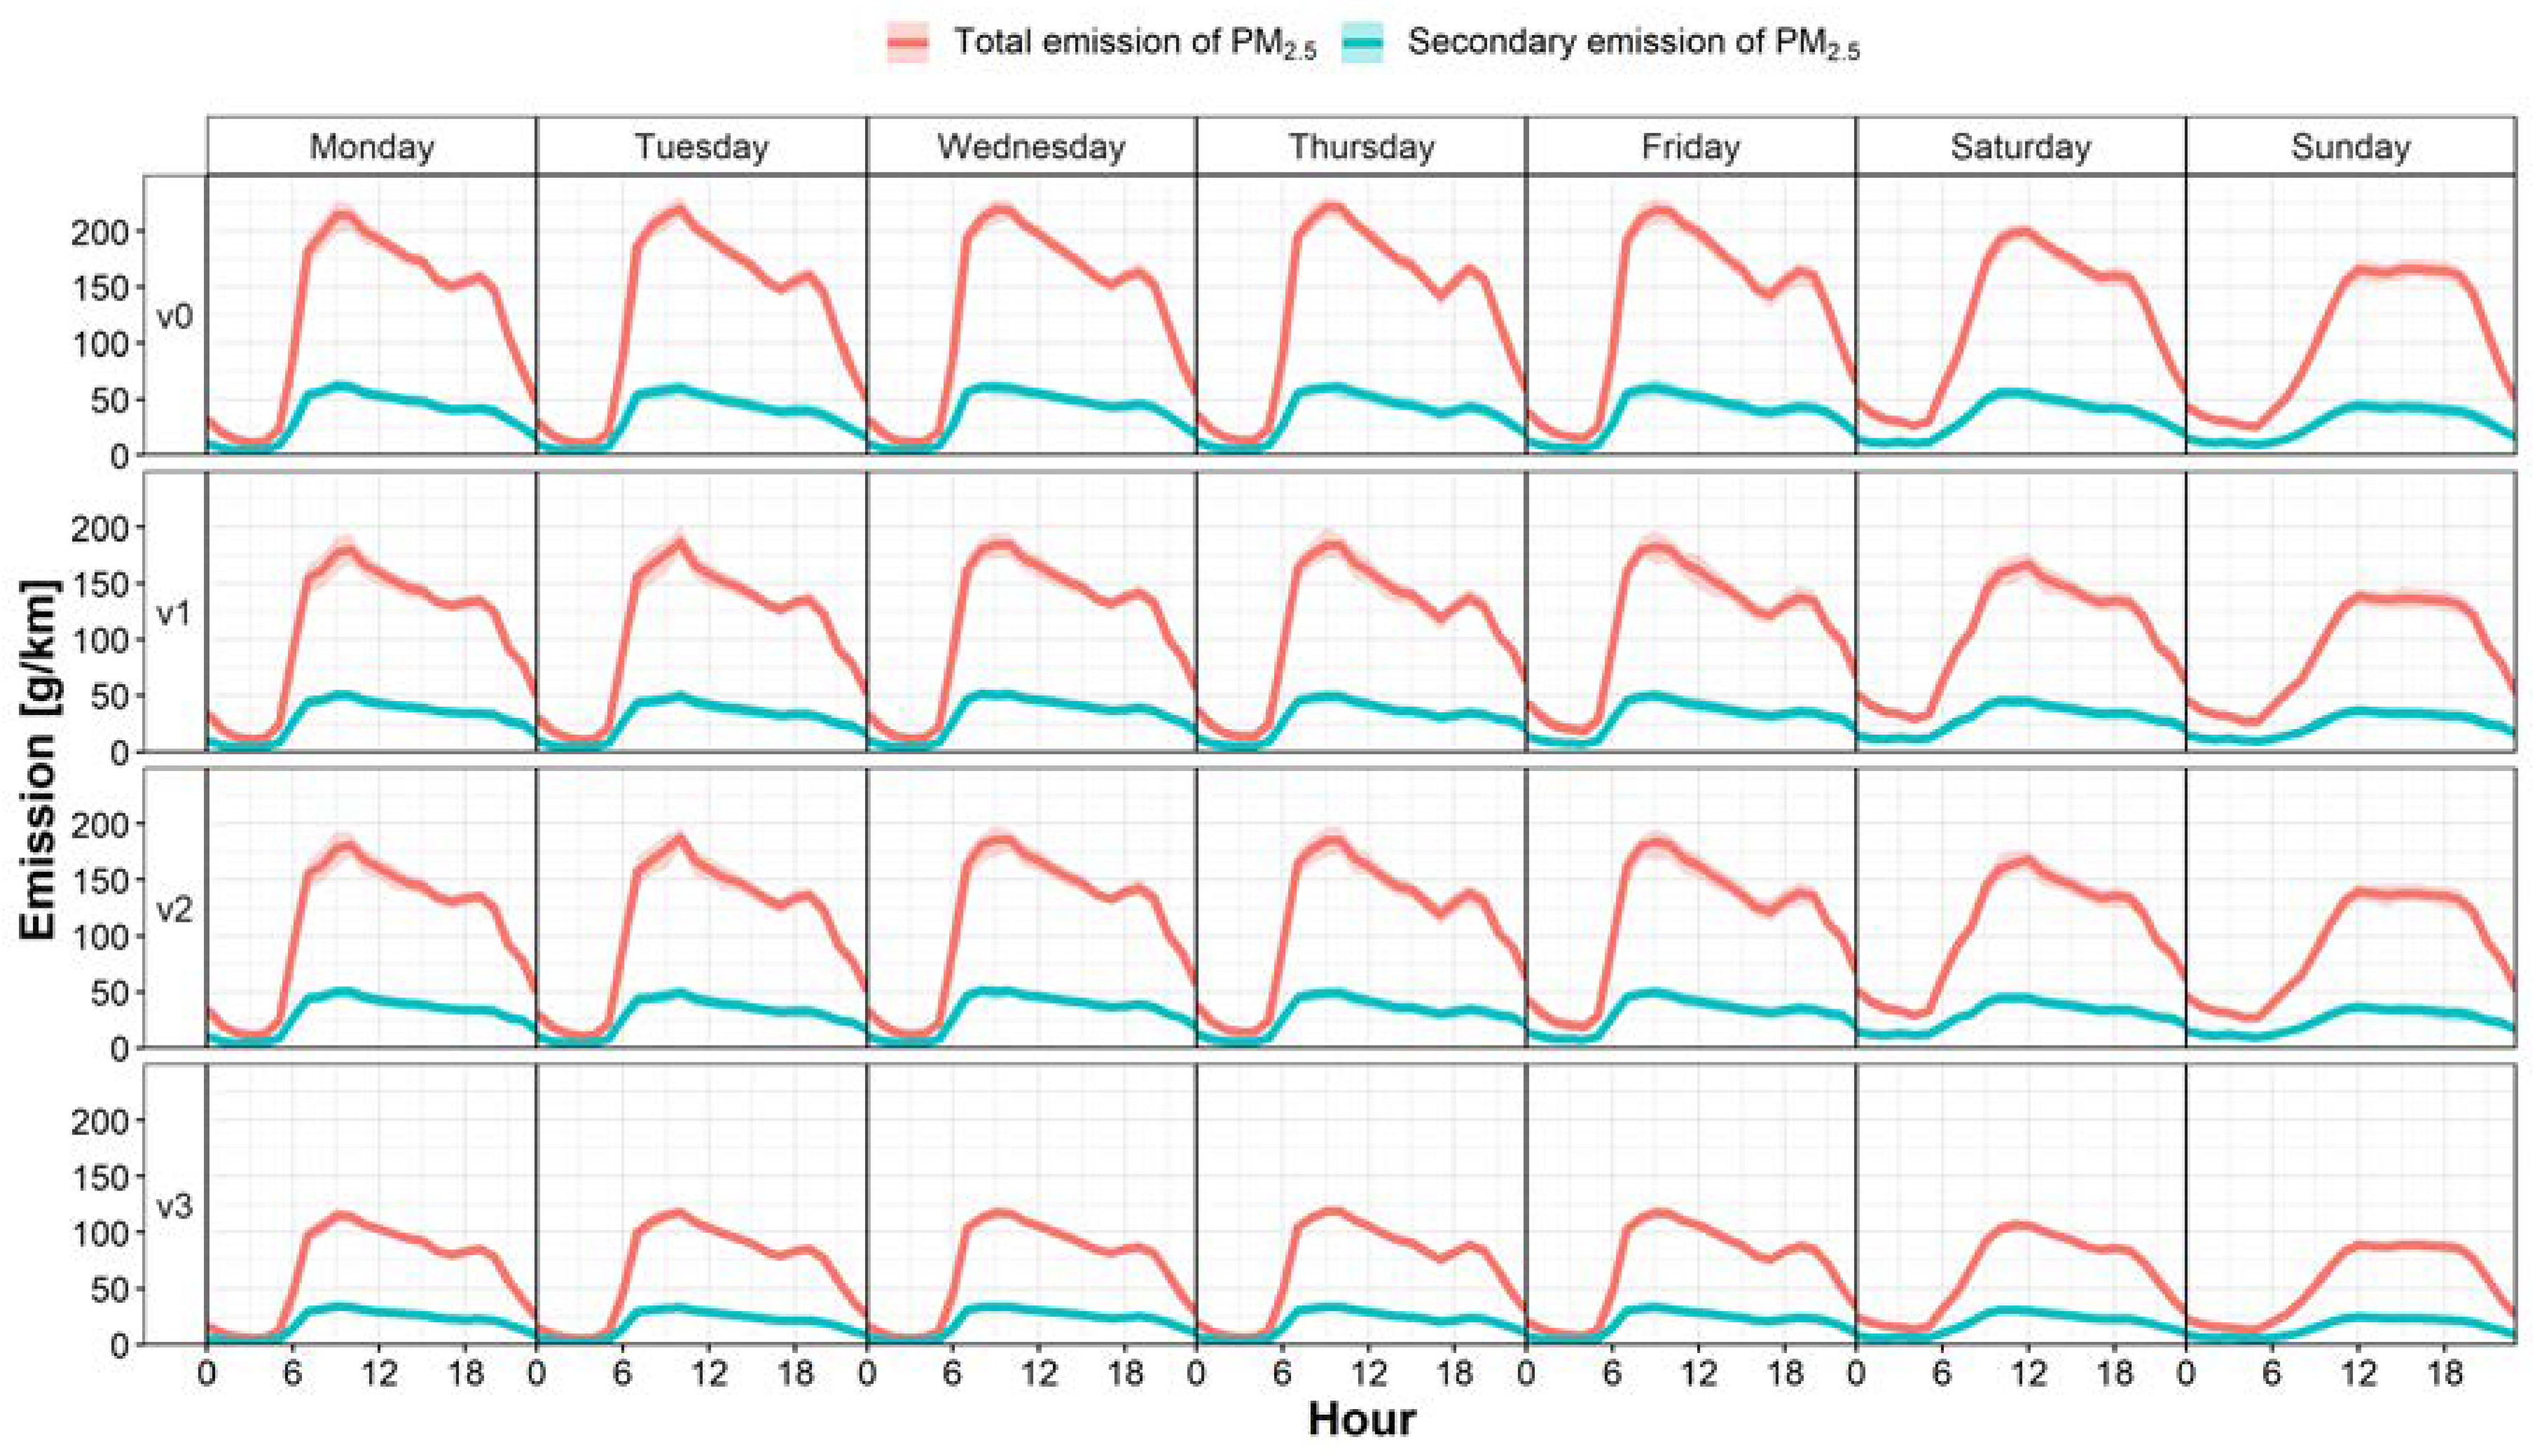
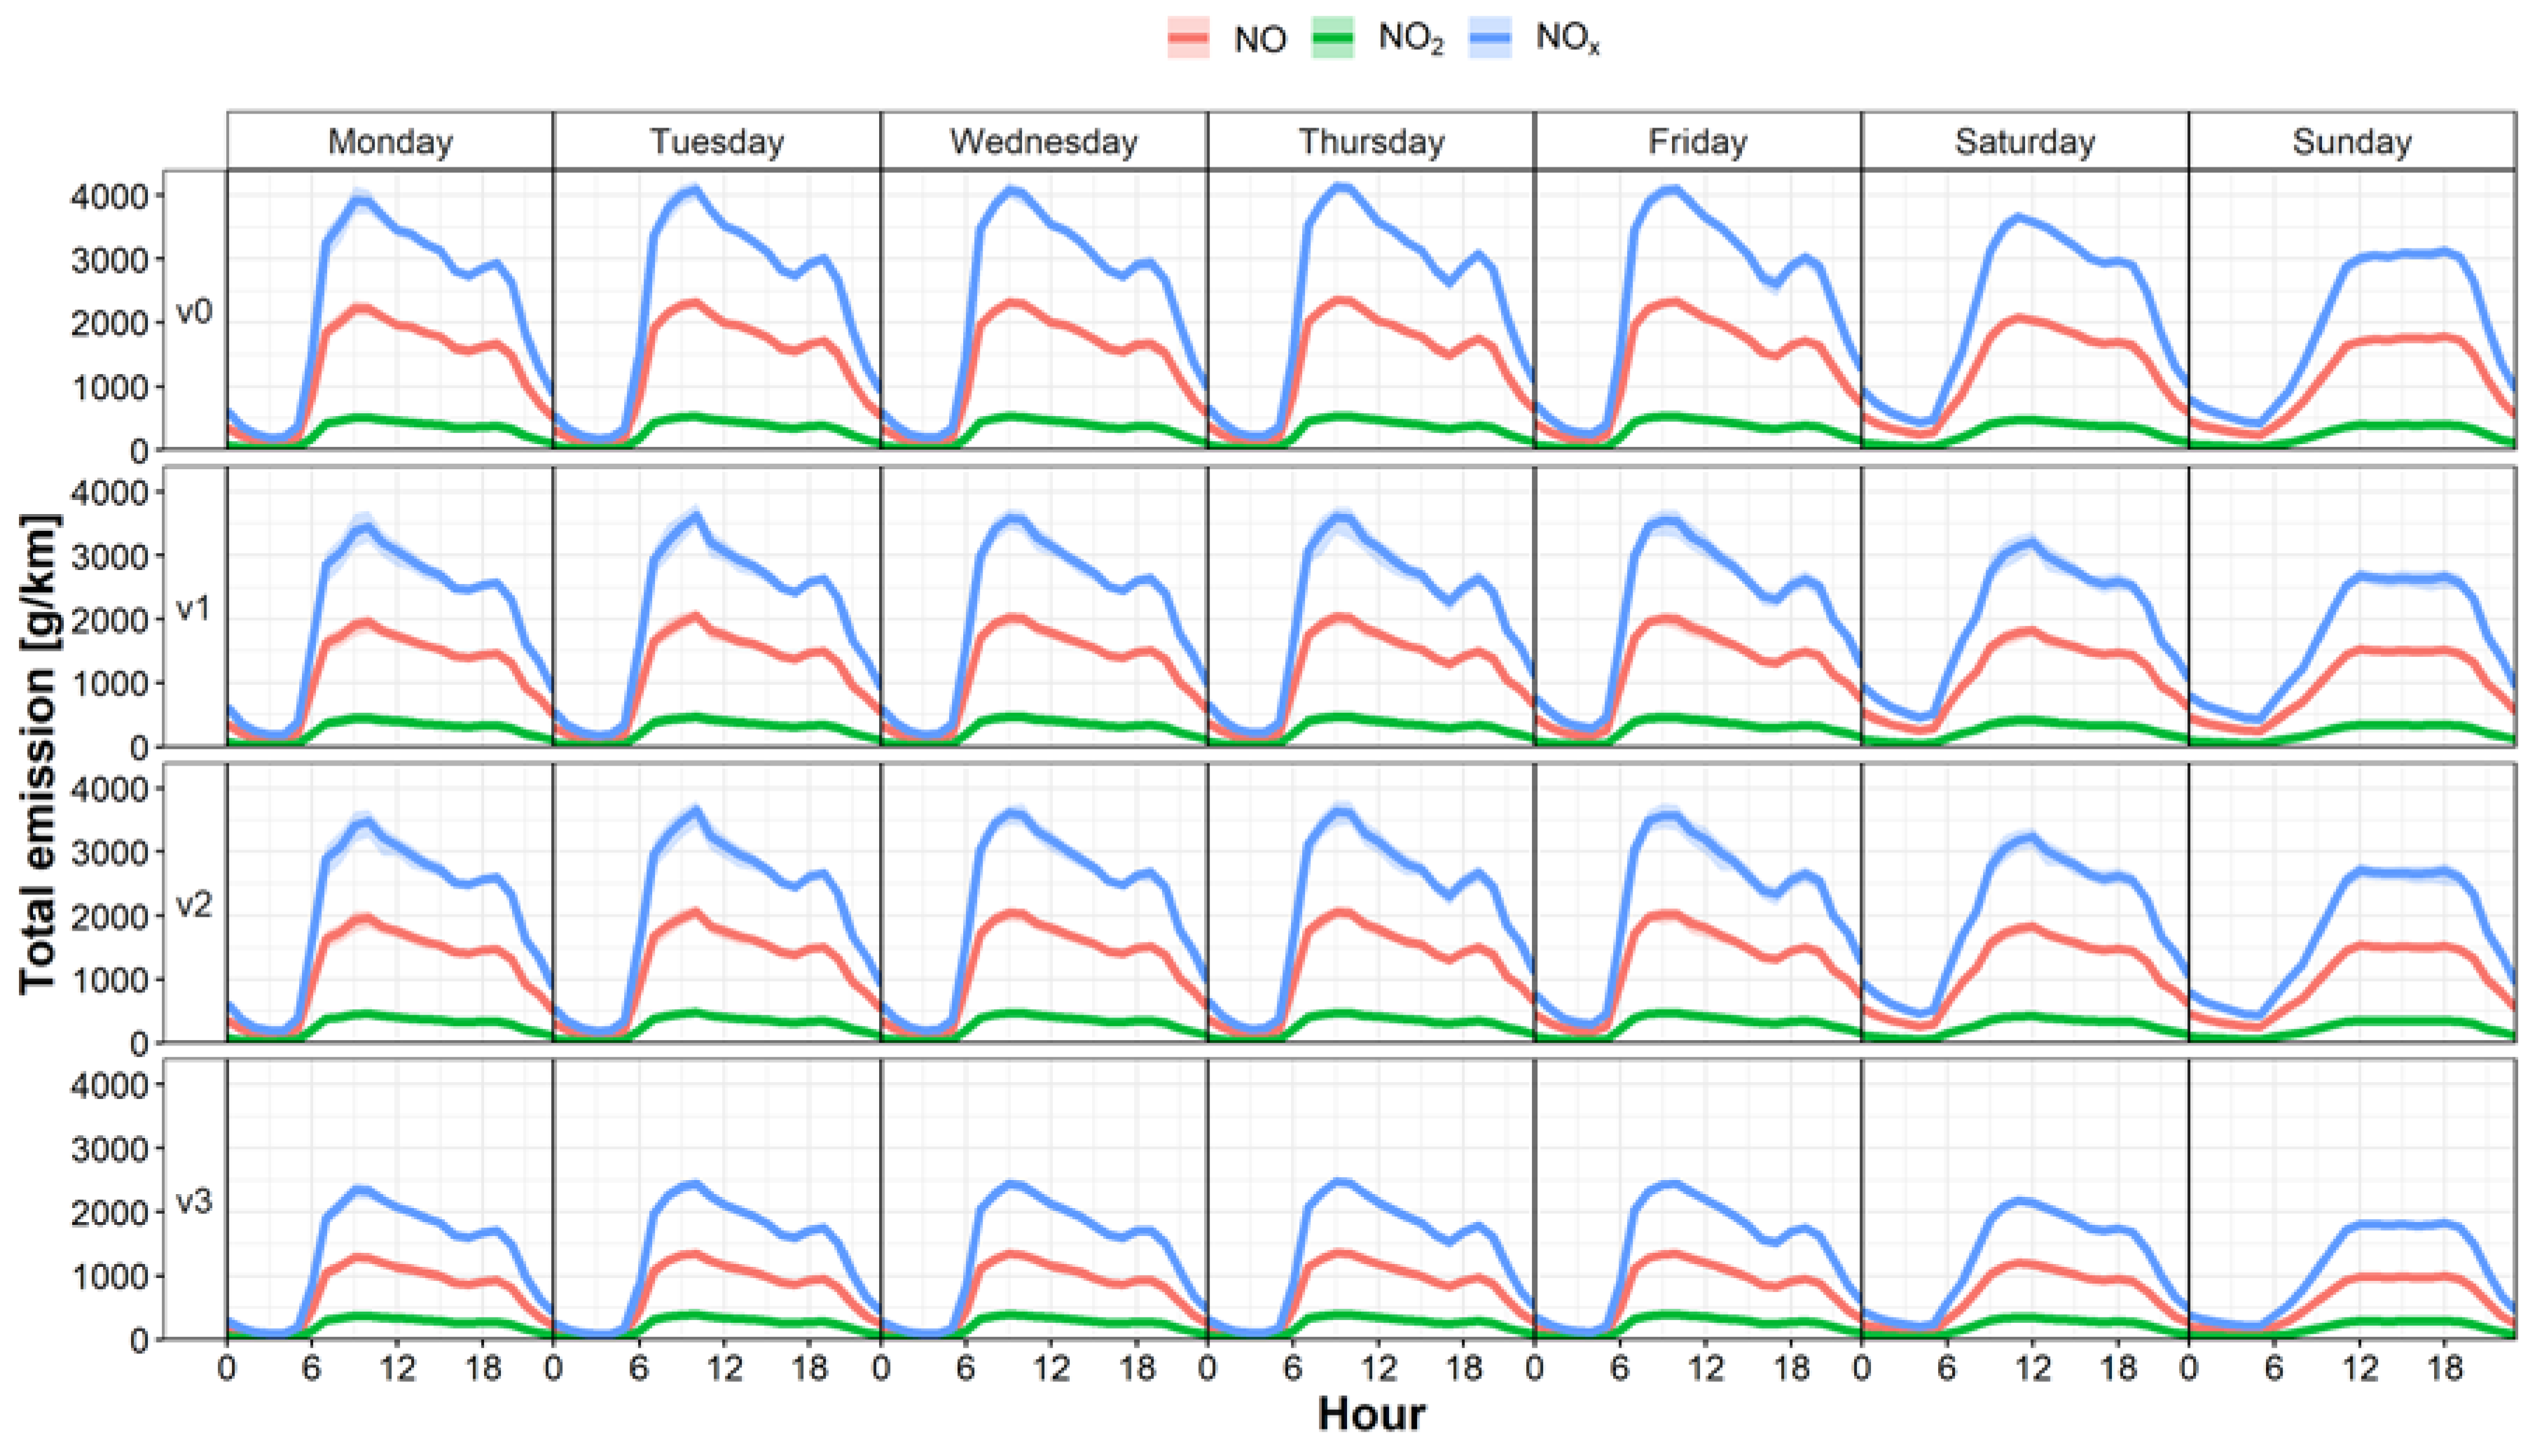
3.2. Reduction of the Air Pollutant Emissions

Results of calculations of the average annual emissions (as factors related to 1 km of the road section) for PM10 and PM2.5 as well as nitrogen oxides (NOx) from road transport obtained for the analyzed street canyon for considered variants are presented in Table 3. In case of the PM10 and PM2.5 fractions in this summary both the primary emission from vehicles (VE) and secondary emission from road (SE) were included. In addition, relative changes in the total emission (TE) from canyon for considered substances and Variants v1–v3 in relation to Variant v0 are presented in Figure 6.
As shown in Table 2, expected reduction in emissions for considered substances for Variants v1 and v2 (in relation to Variant v0) in the analyzed canyon is very similar and equals to about 13–14% in case of the PM10 and PM2.5 particles and about 9–11% in case of NOx. Significantly higher reduction in pollutants emission was found for Variant v3, in case of which the forecasted reduction degree of the PM10 and PM2.5 emission equals to 45–47%, and for the sum of NOx – 42% (at 27% reduction for the NO2).
Annually averaged weekly profiles of emission variability (in the form of emission factors) for PM10 and PM2.5 (with total emission and the emission resulting from the resuspension of particles taken into account) as well as NOx (with consideration of NO and NO2) determined for considered variants of traffic reorganization in the analyzed canyon are presented in Appendix A in Figure A1, Figure A2 and Figure A3. These figures indicate that during workdays two emission peaks are present which correspond with the morning (around 8:00–10:00) and afternoon rush hours (around 18:00-20:00), however the afternoon rush hours are characterized by approximately 25% lower emission compared to the morning rush hours. During weekends there is only one daily peak in the emission, on Saturdays it is noticeable around 10:00–12:00, while on Sundays it is more flattened and lasts through noon and afternoon hours (until 20:00), which corresponds with the variability of the average traffic volume in this period (Figure 5). In case of Variants v1 and v2 the obtained values of emission profiles were very similar. The lowest absolute emission rates in particular days of the week were obtained for Variant v3, which is characterized by a slightly different, more flattened profile of the temporal variability of the pollutants emission compared to other variants.

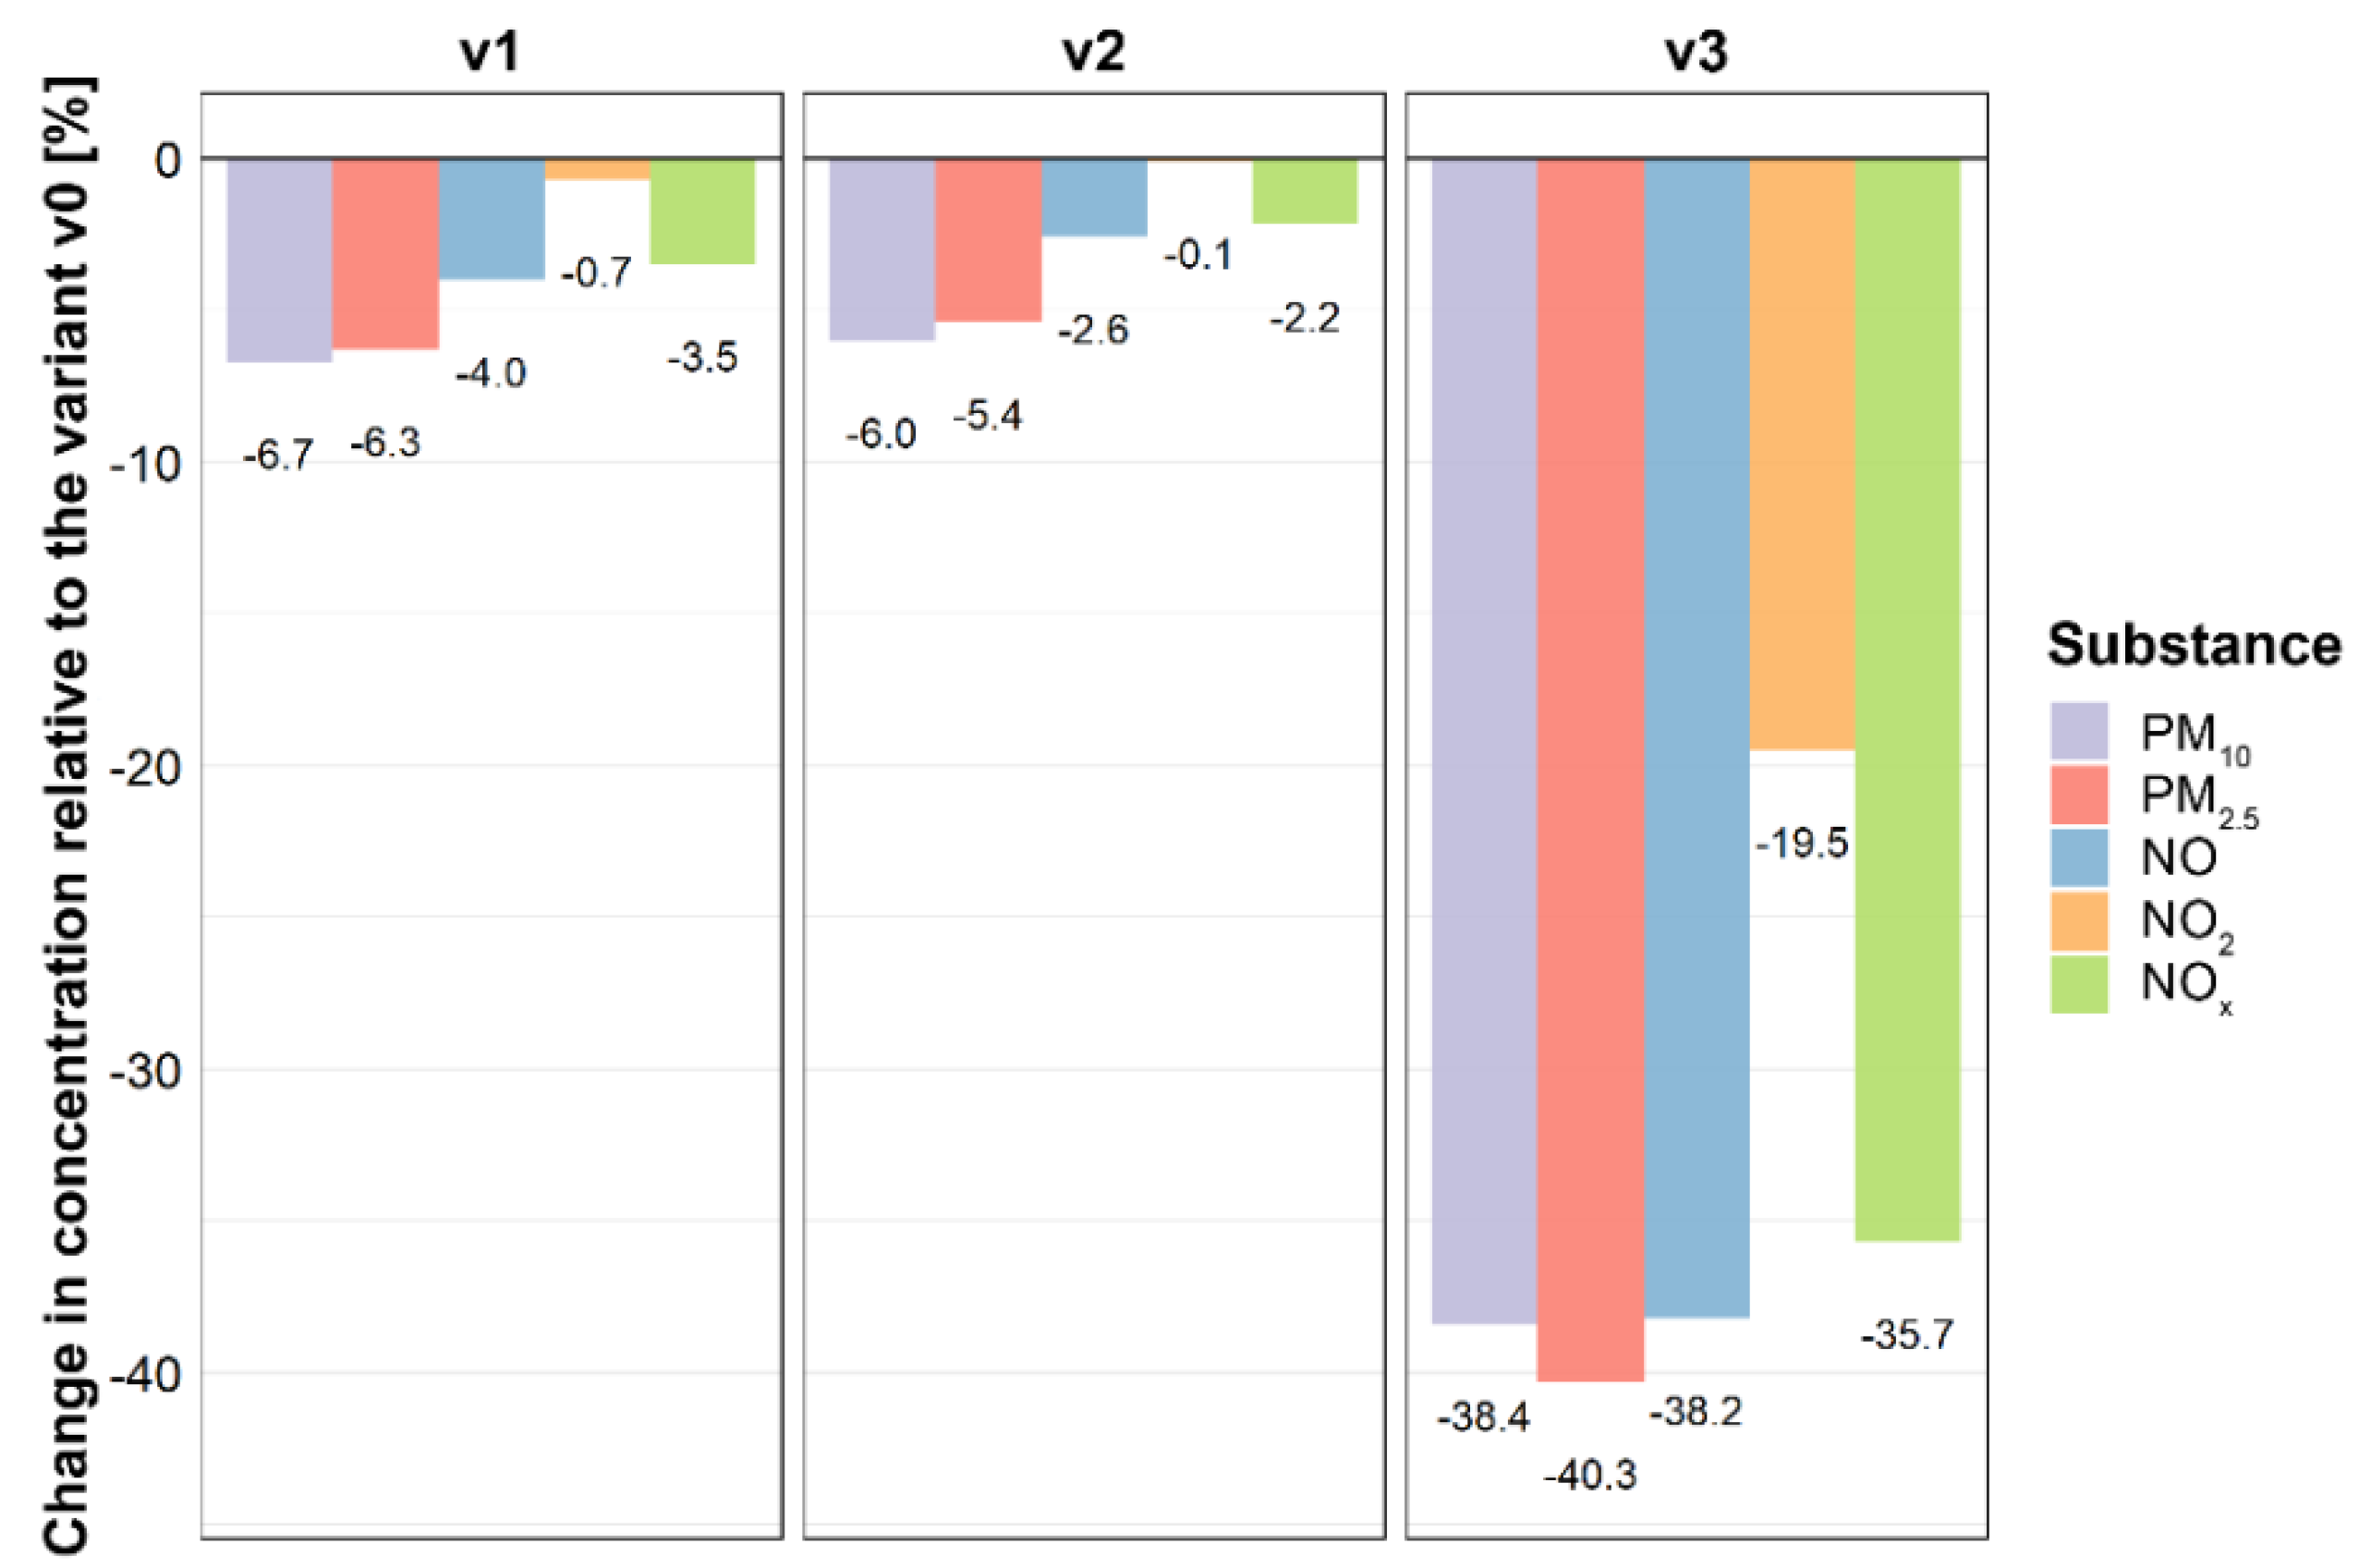
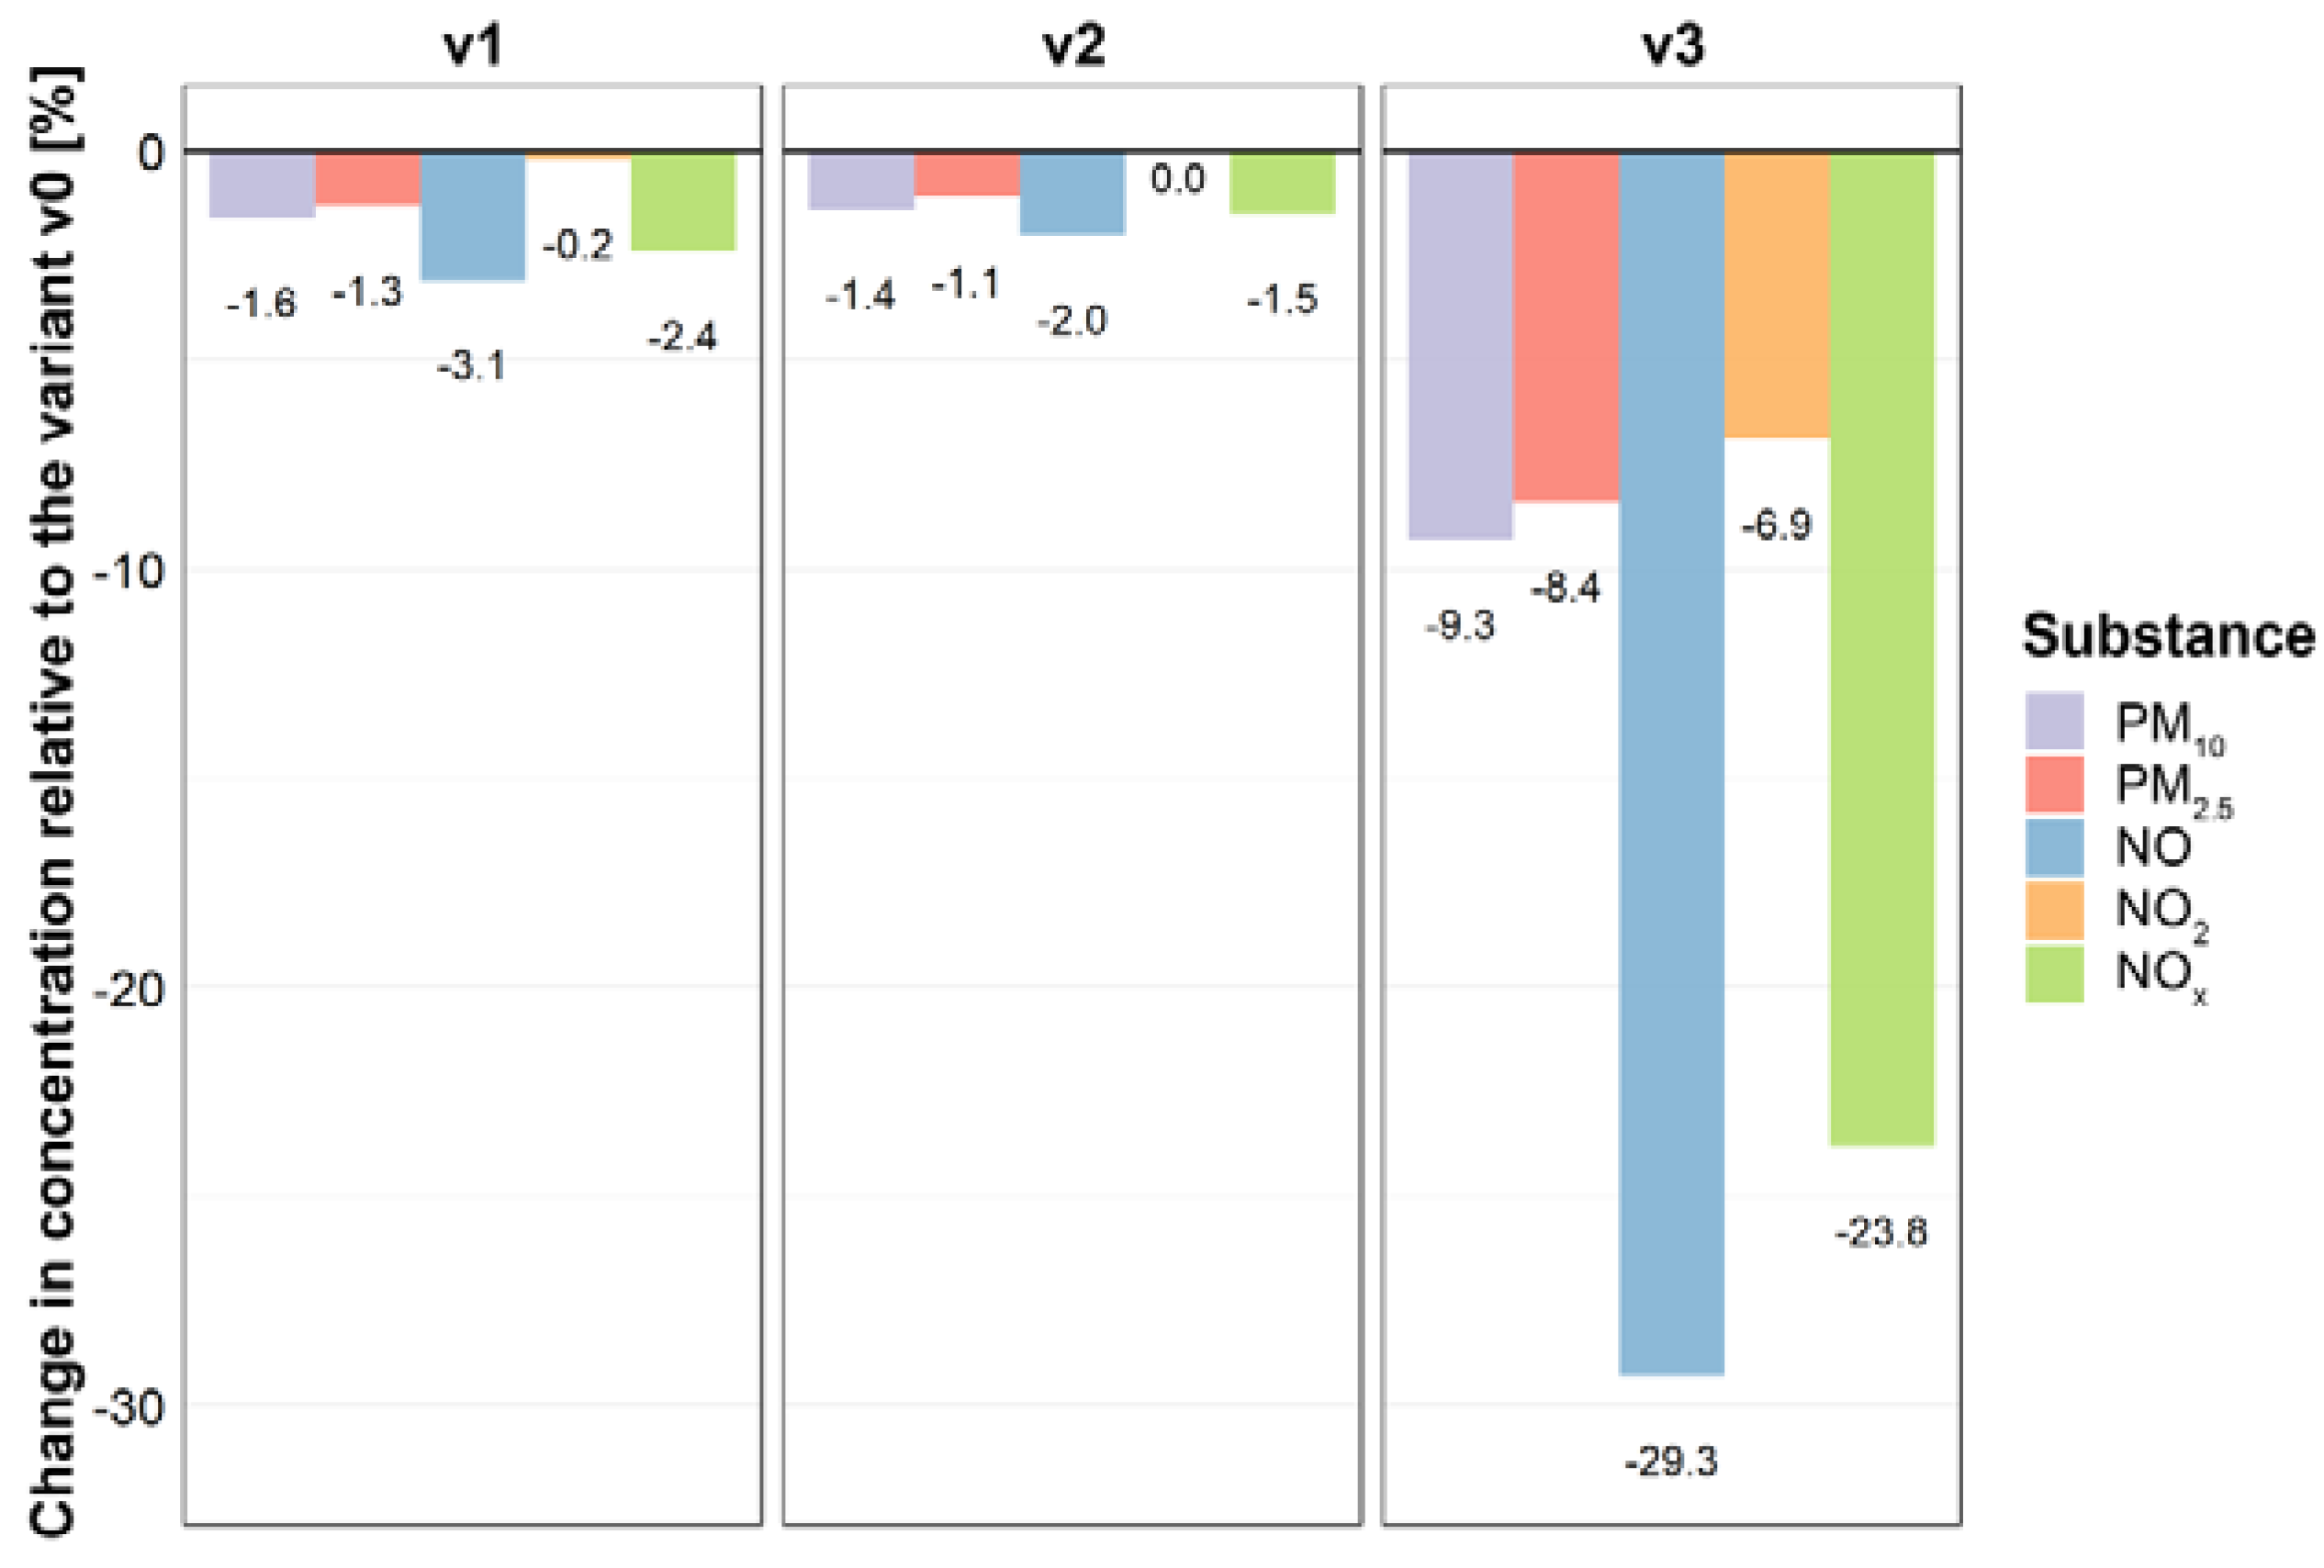
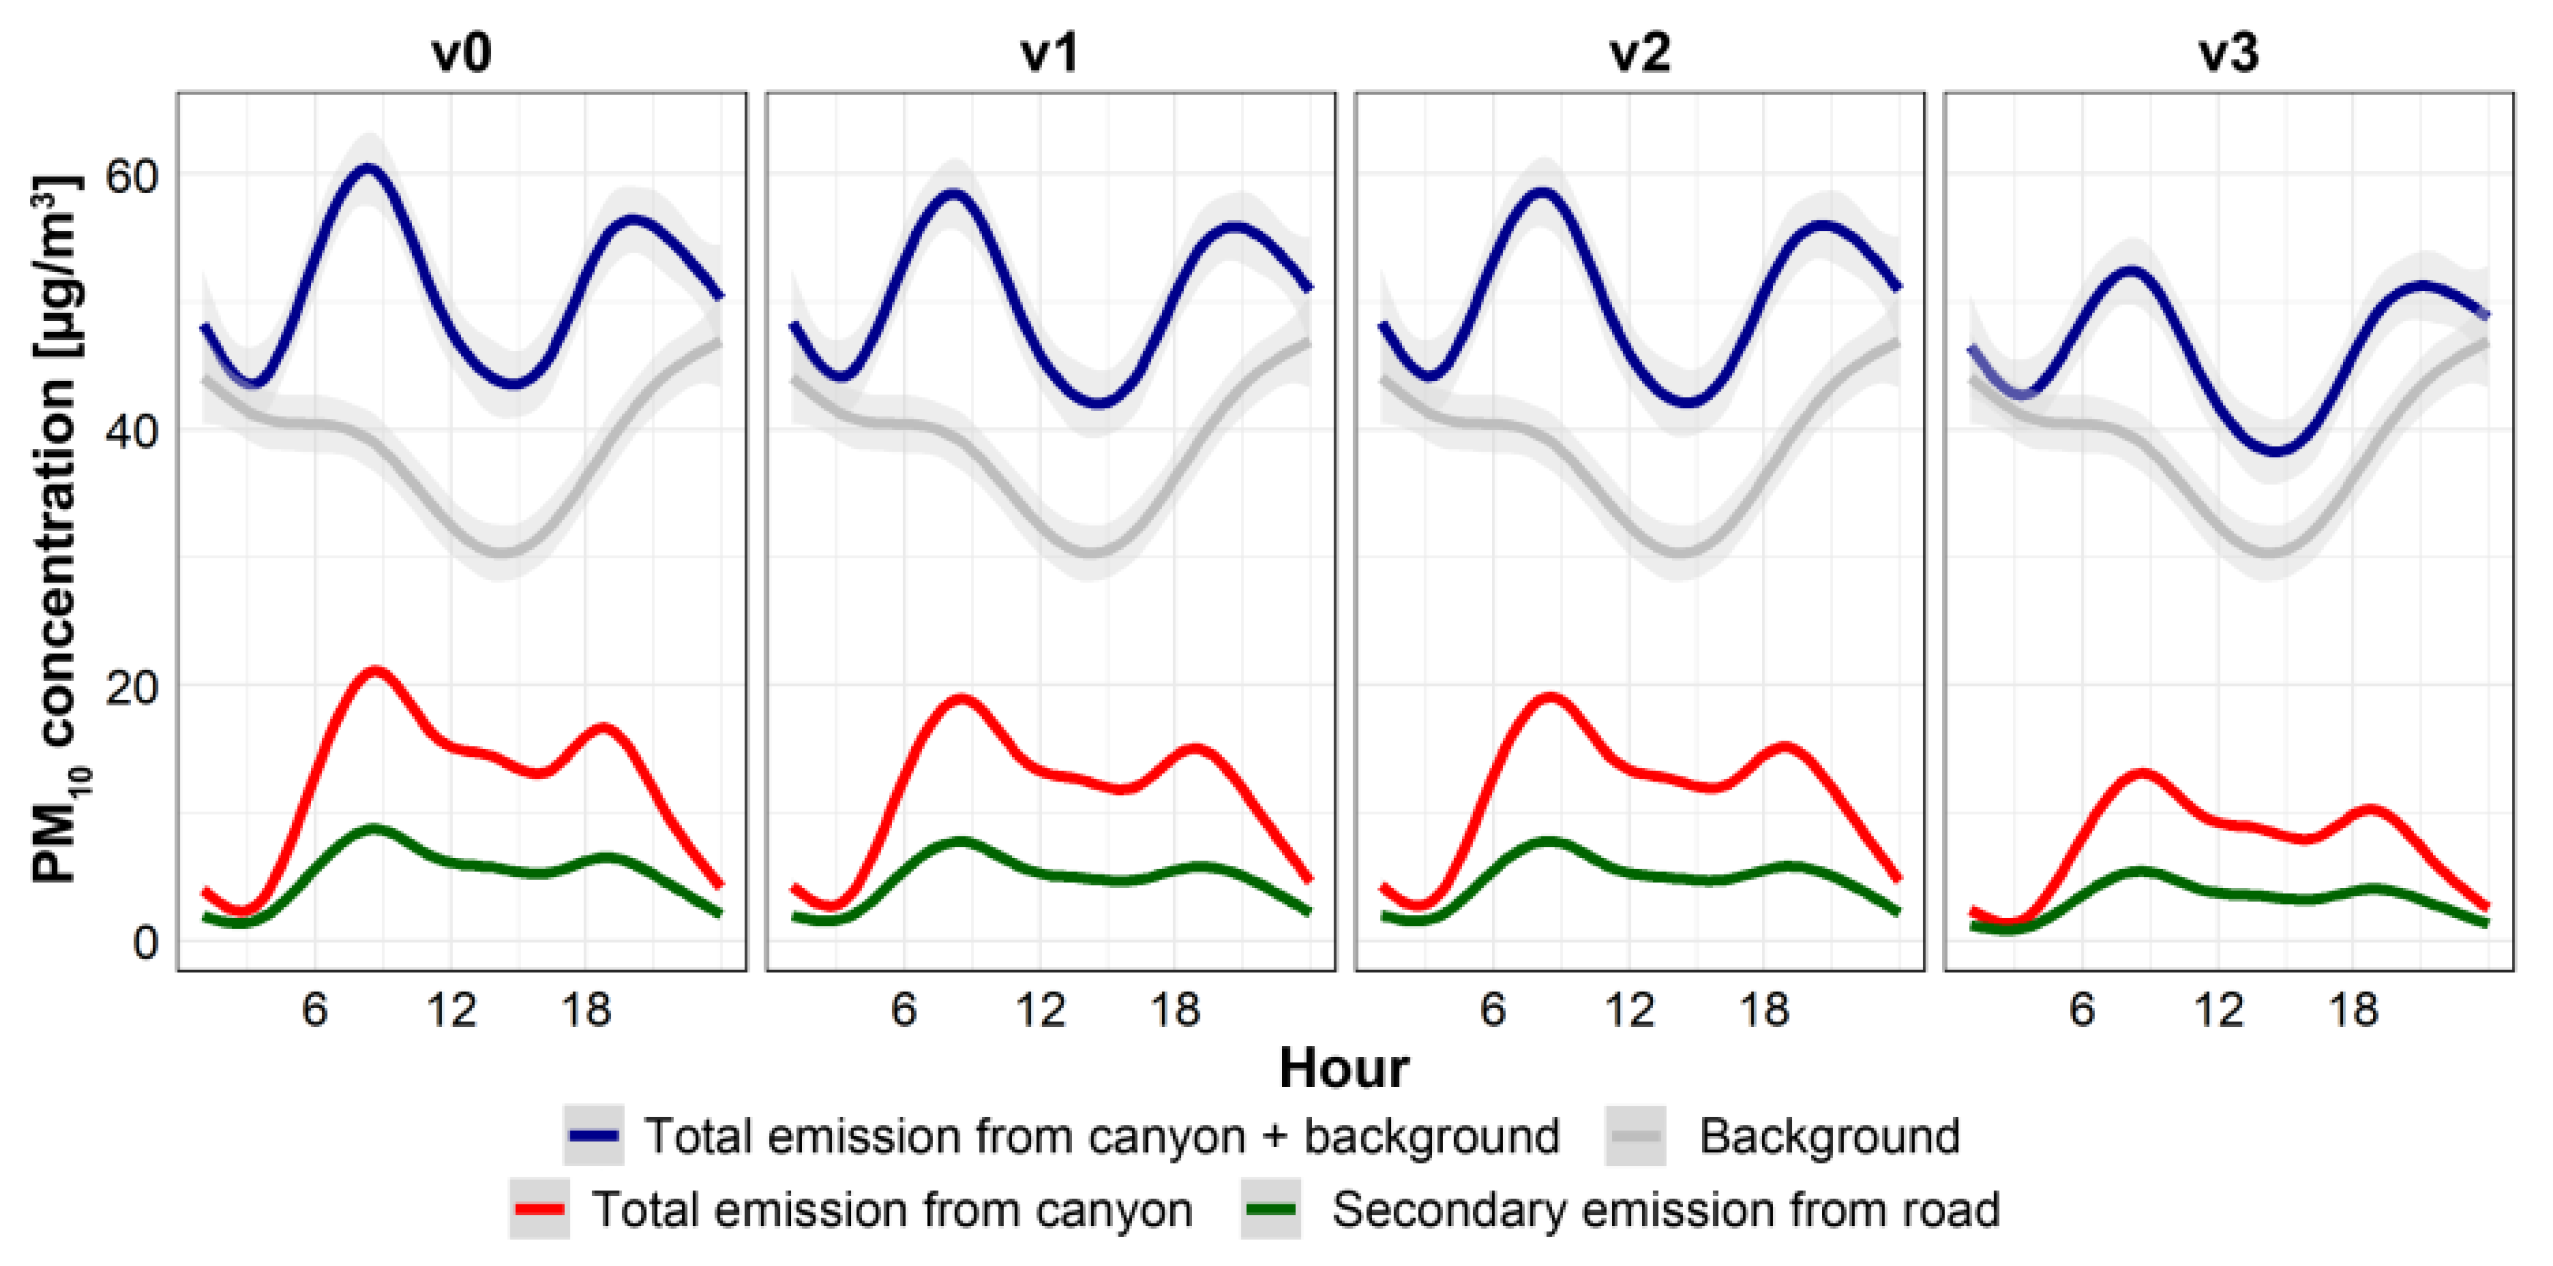
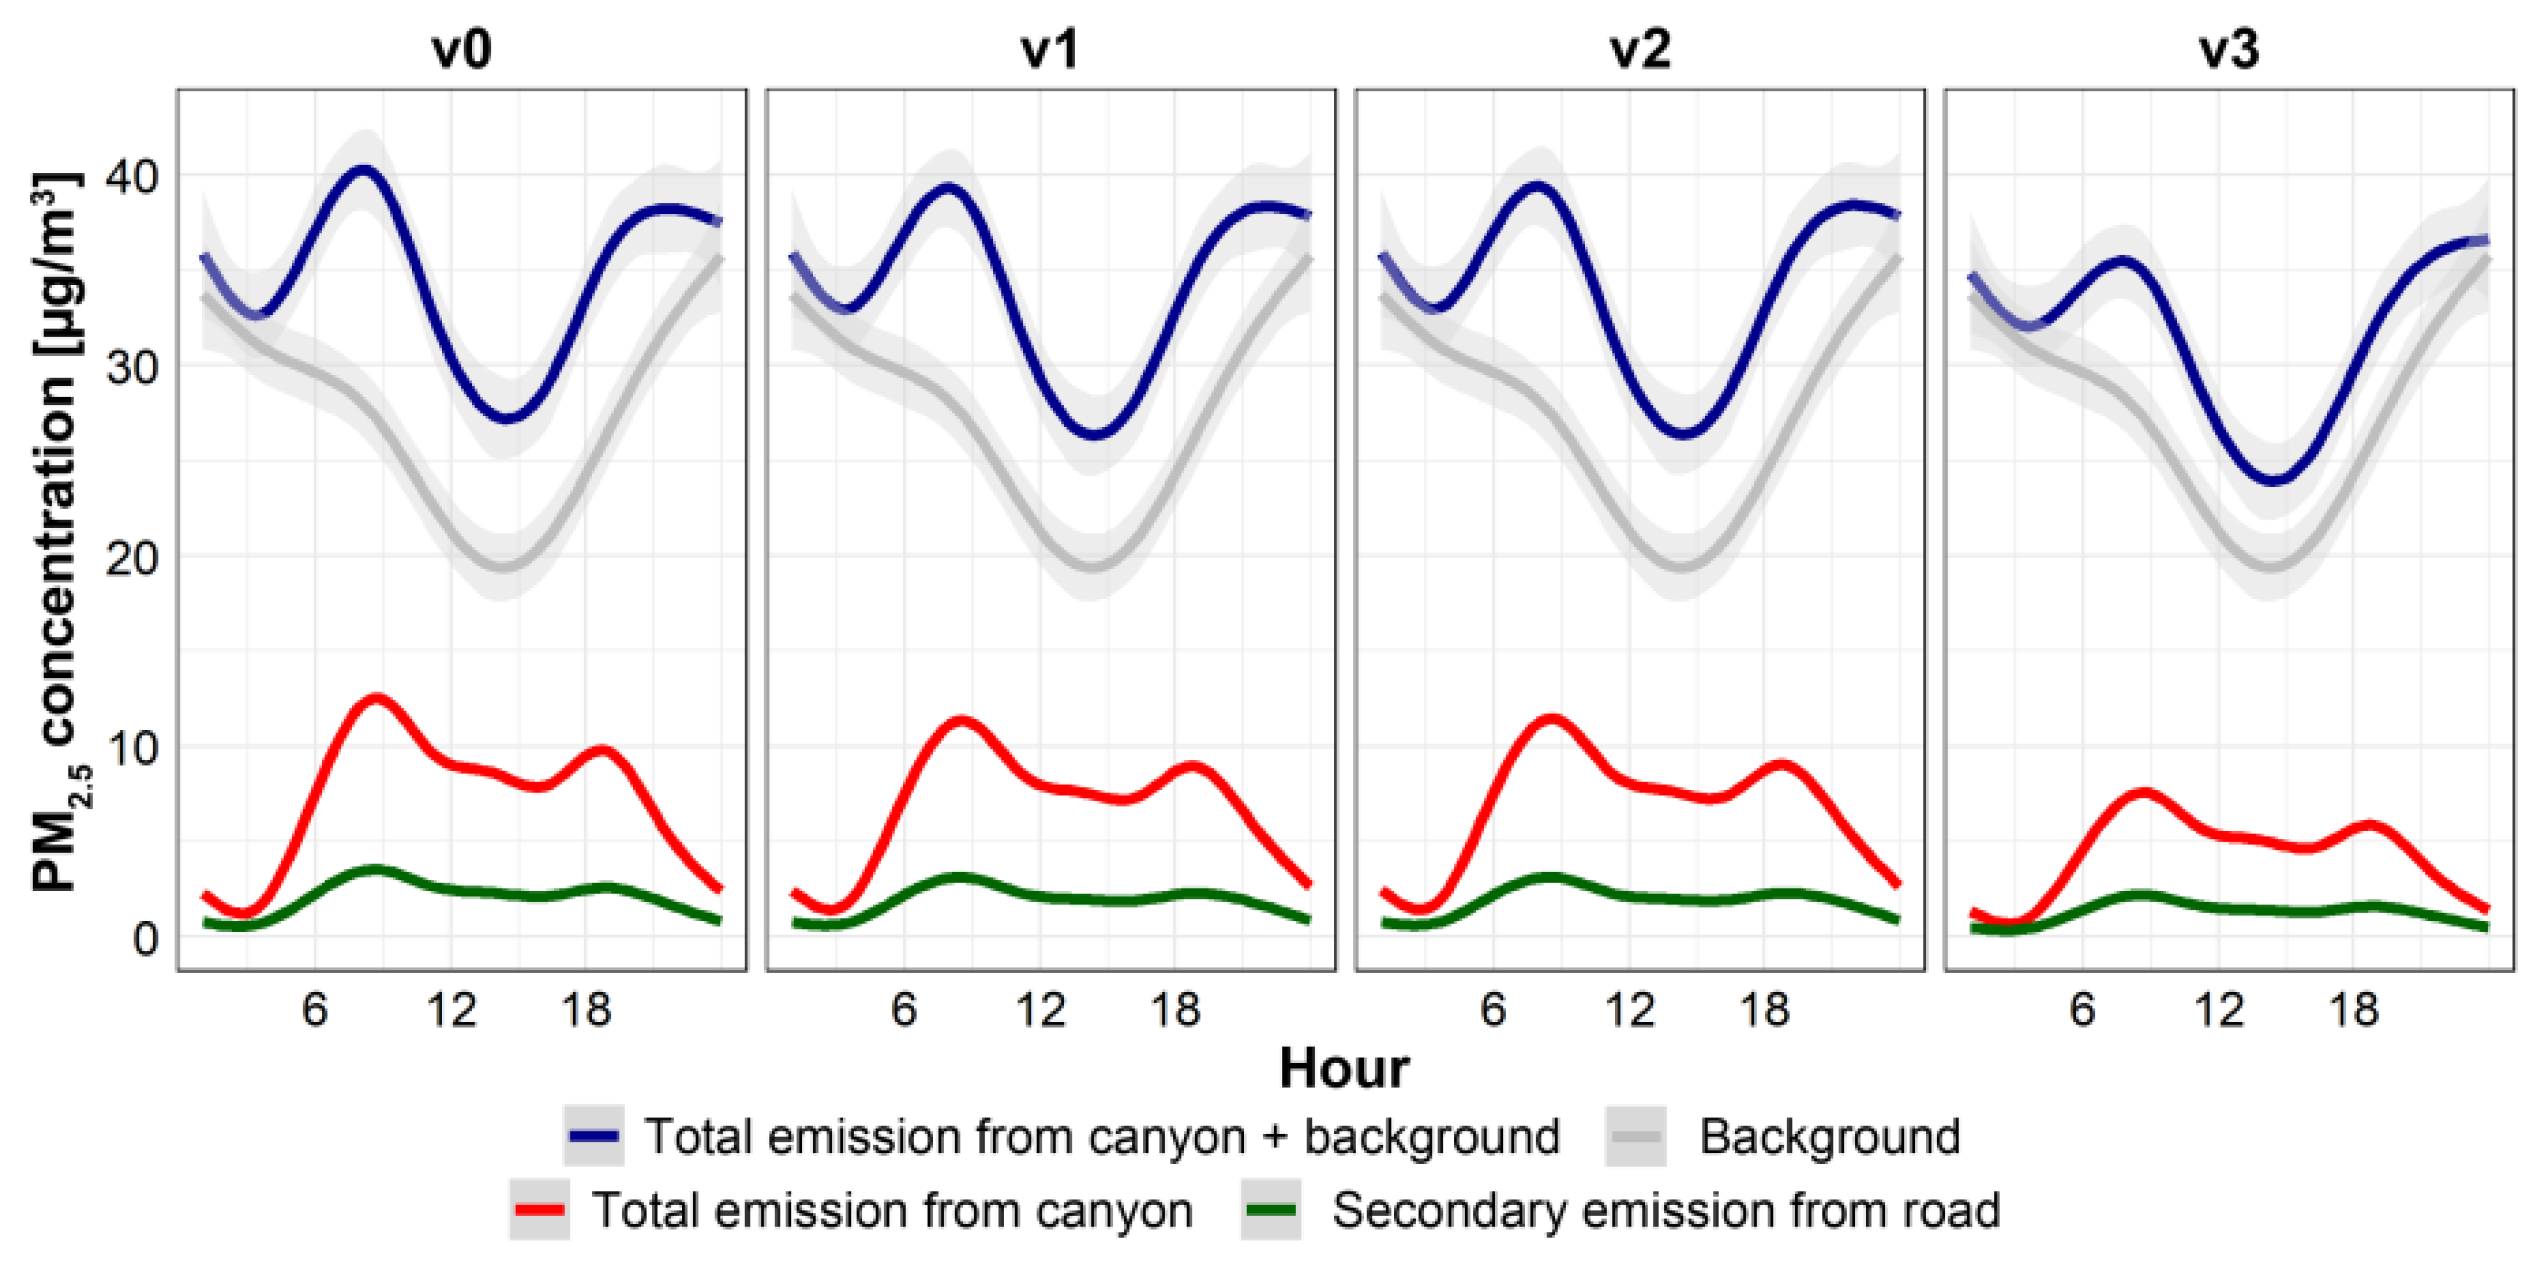
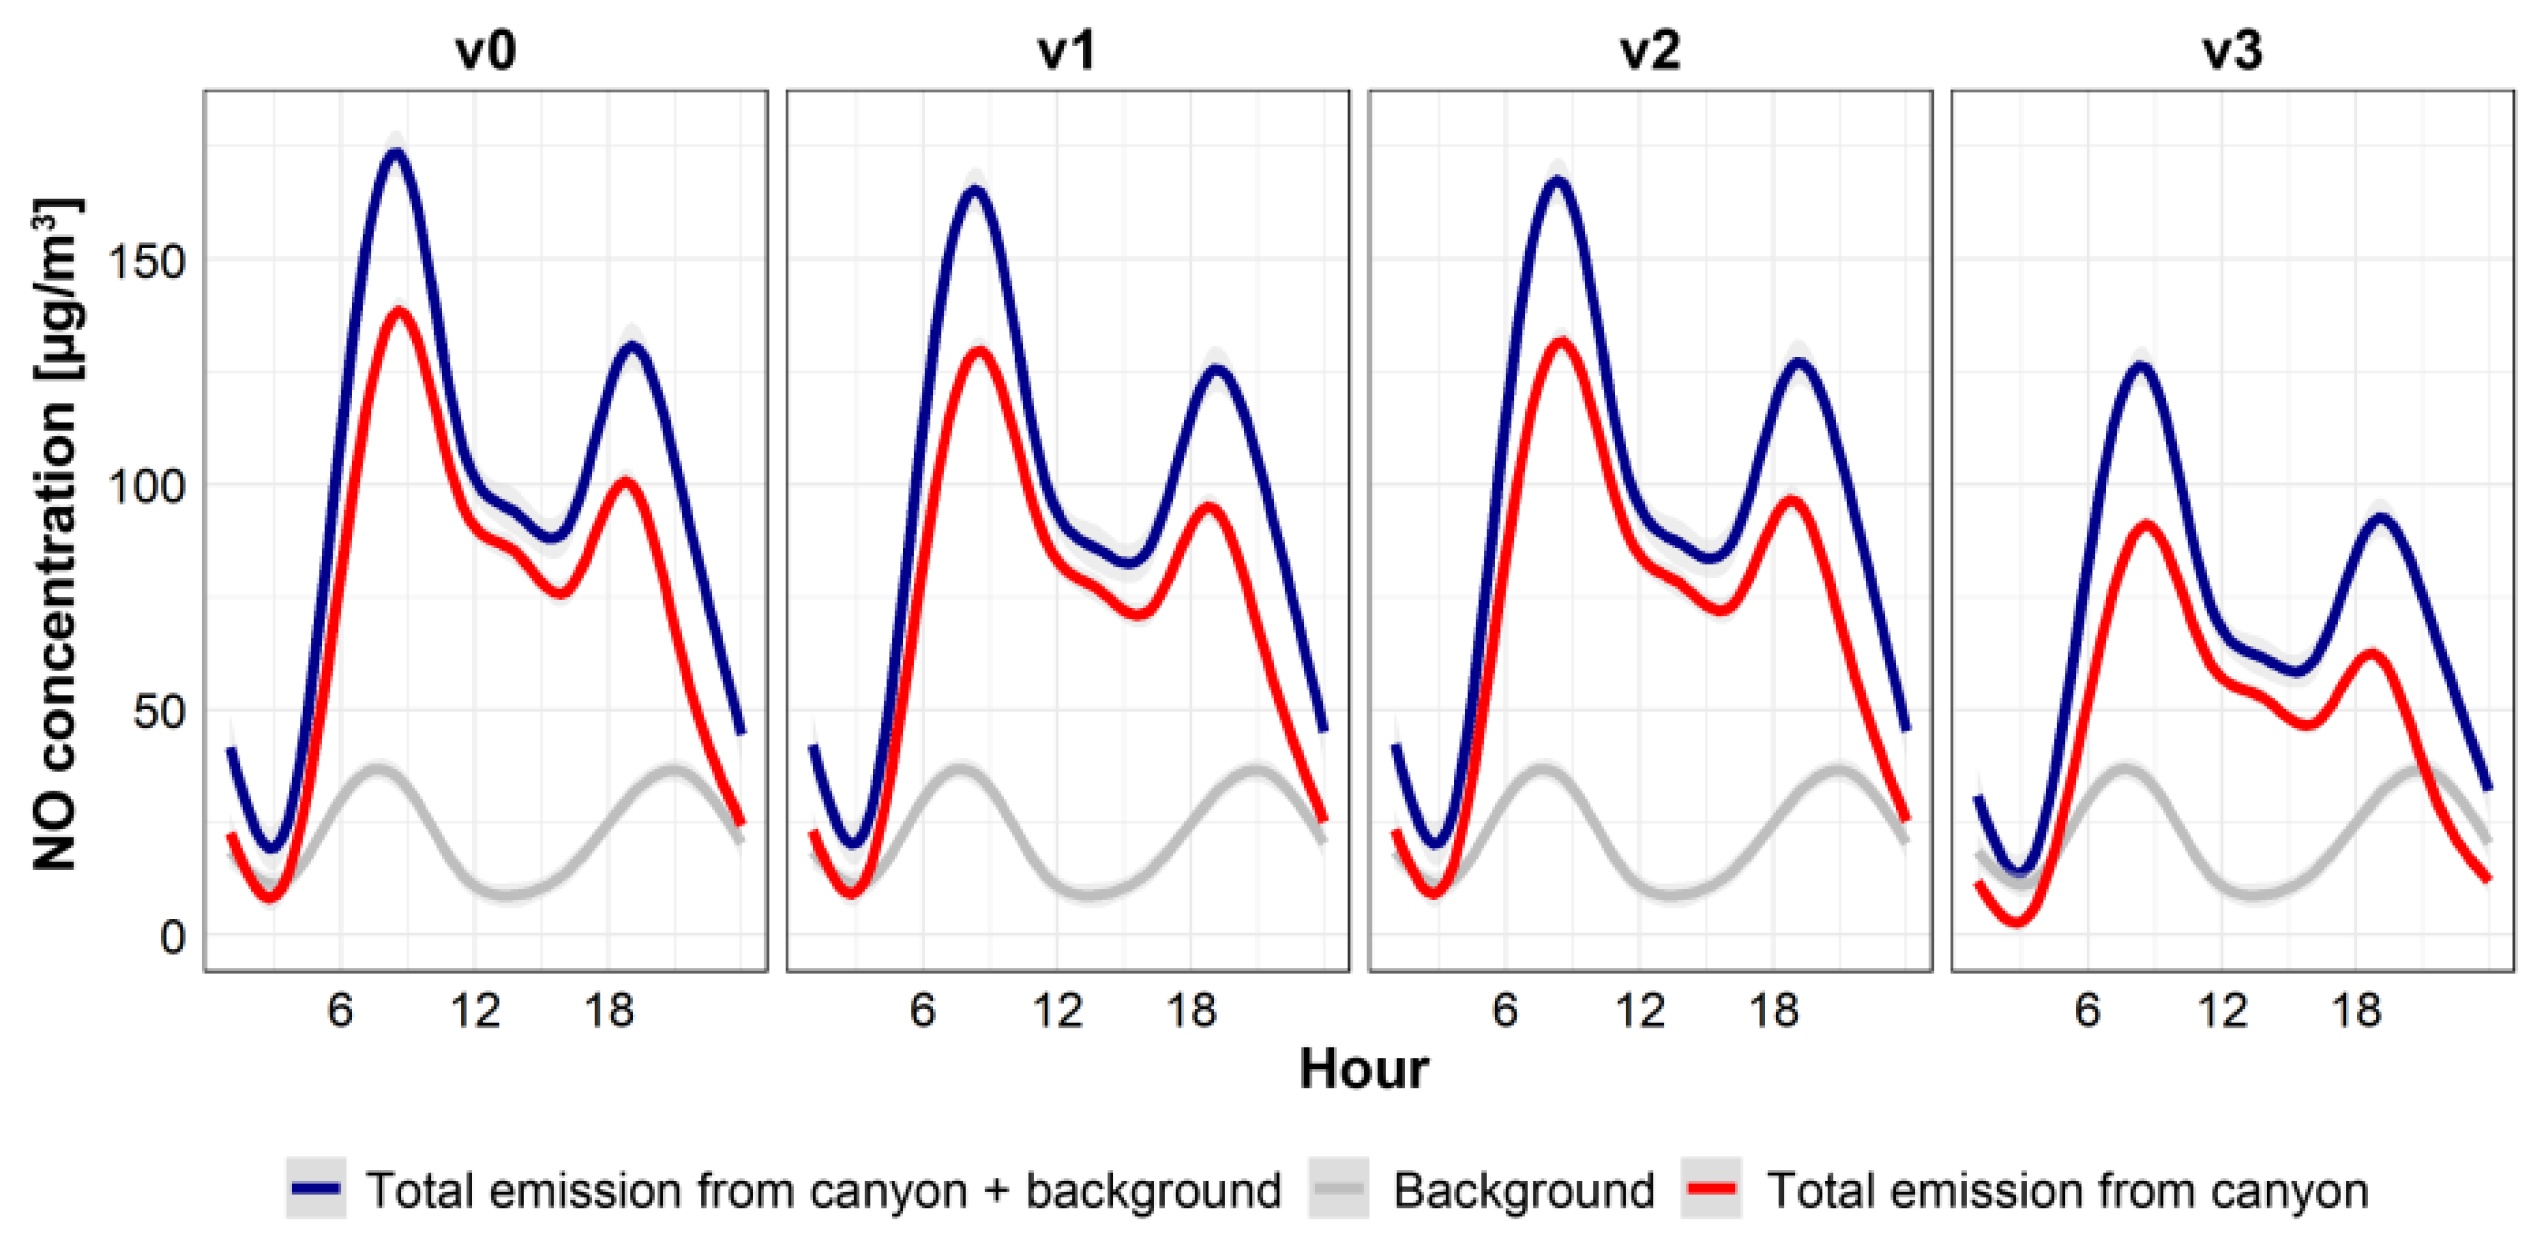
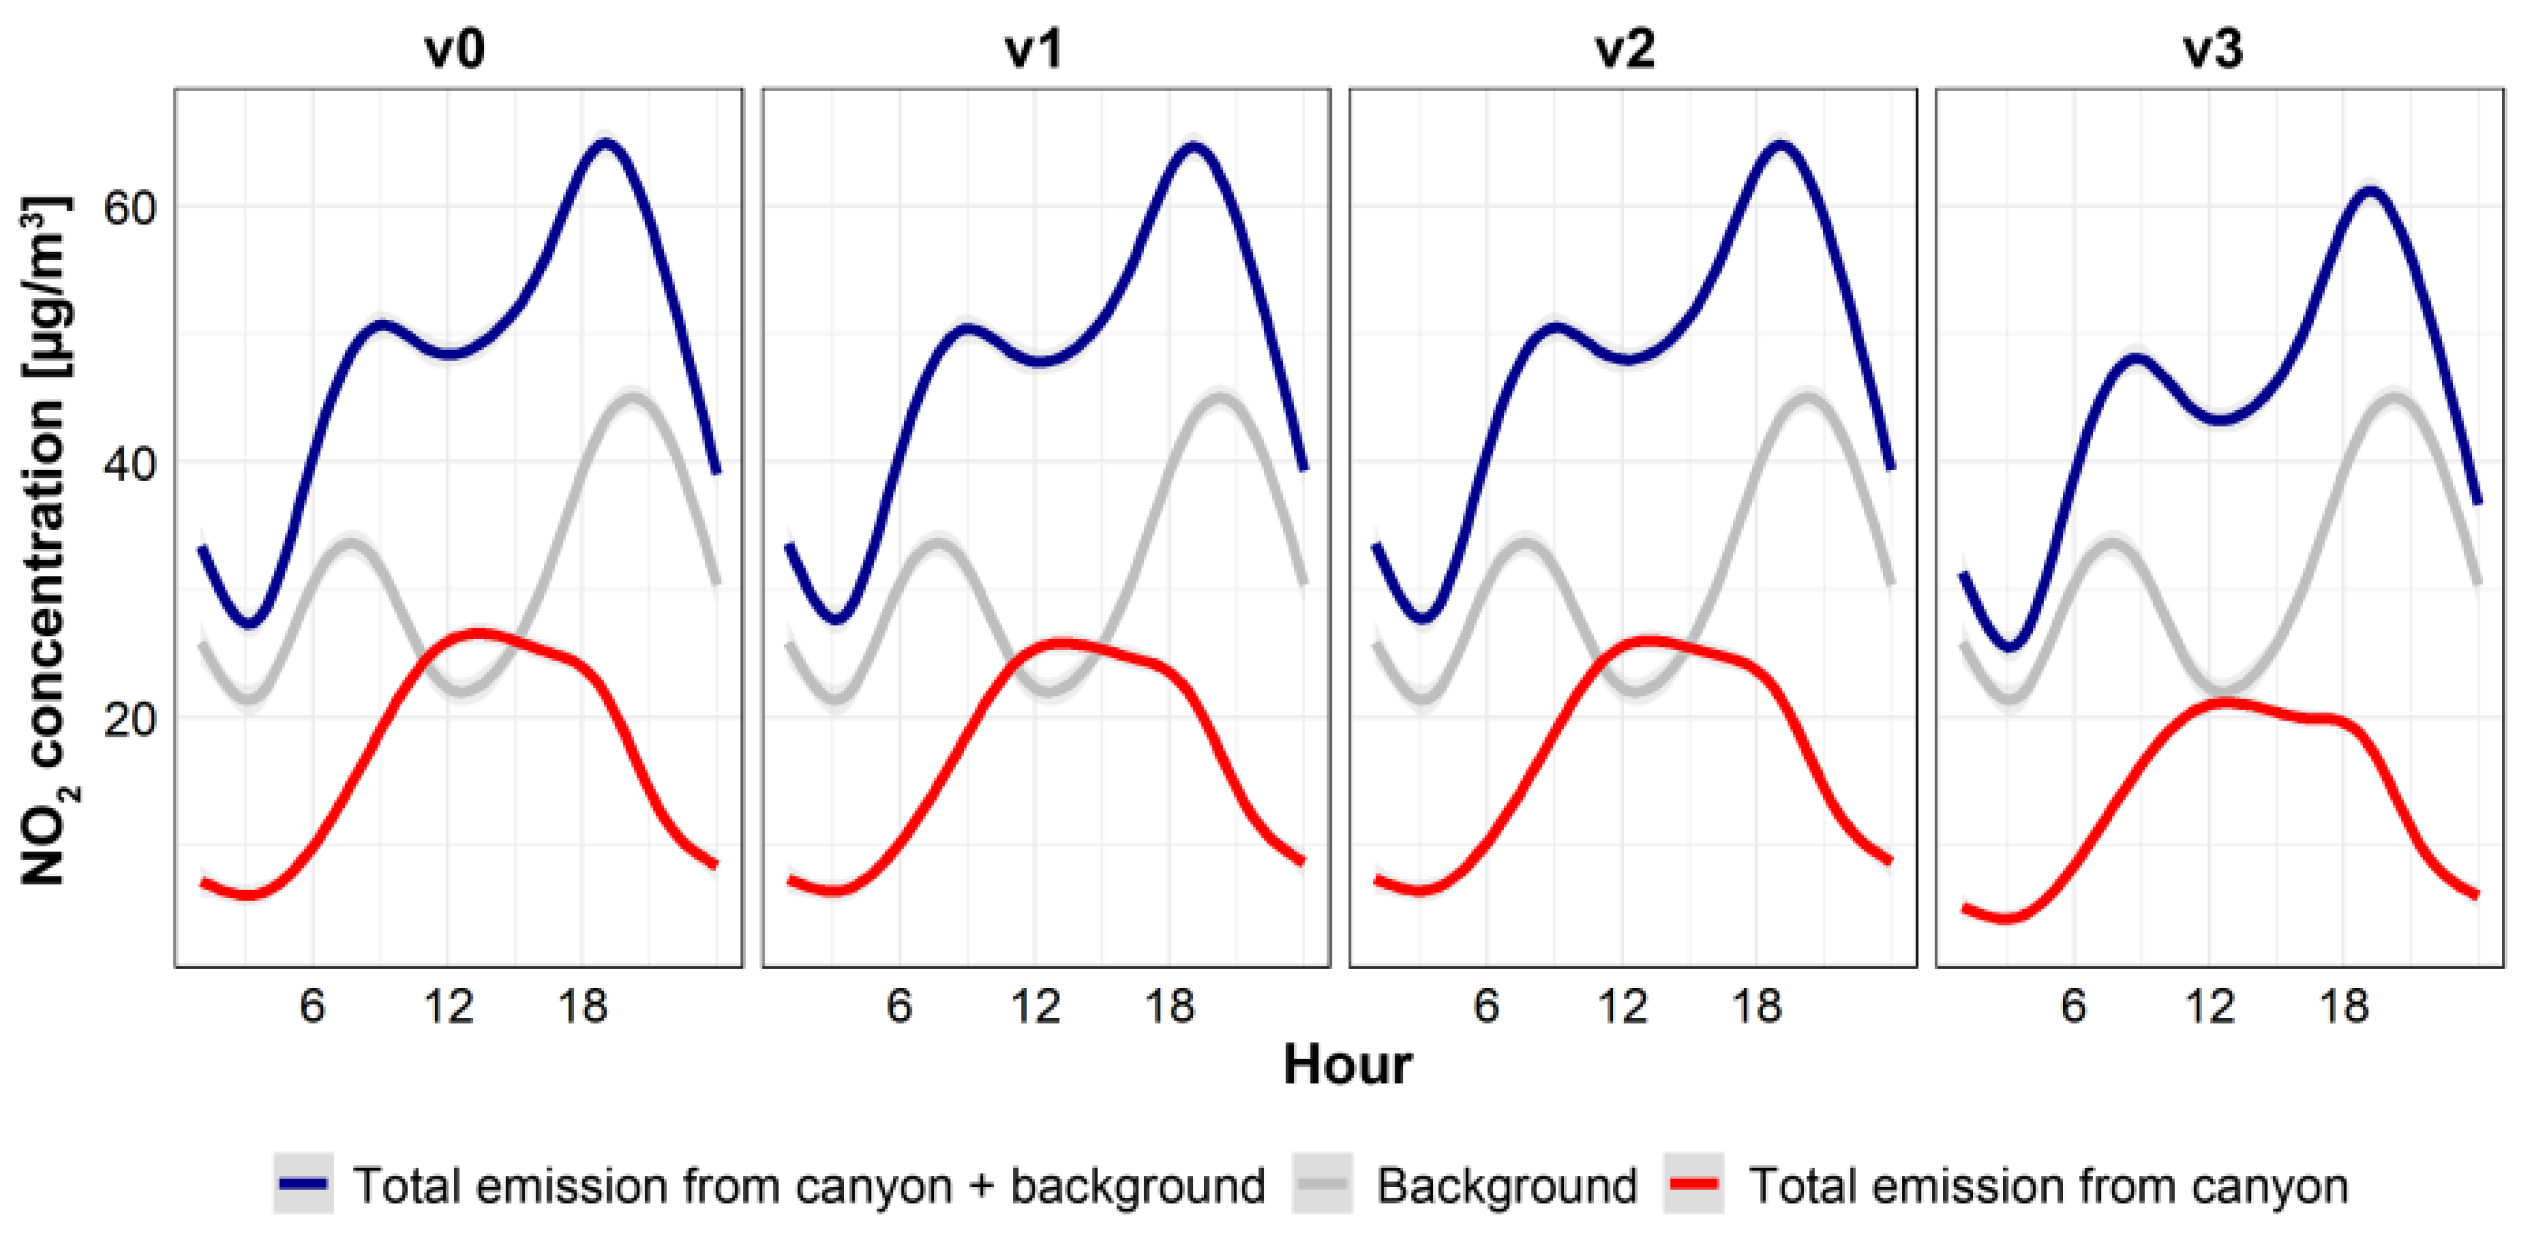
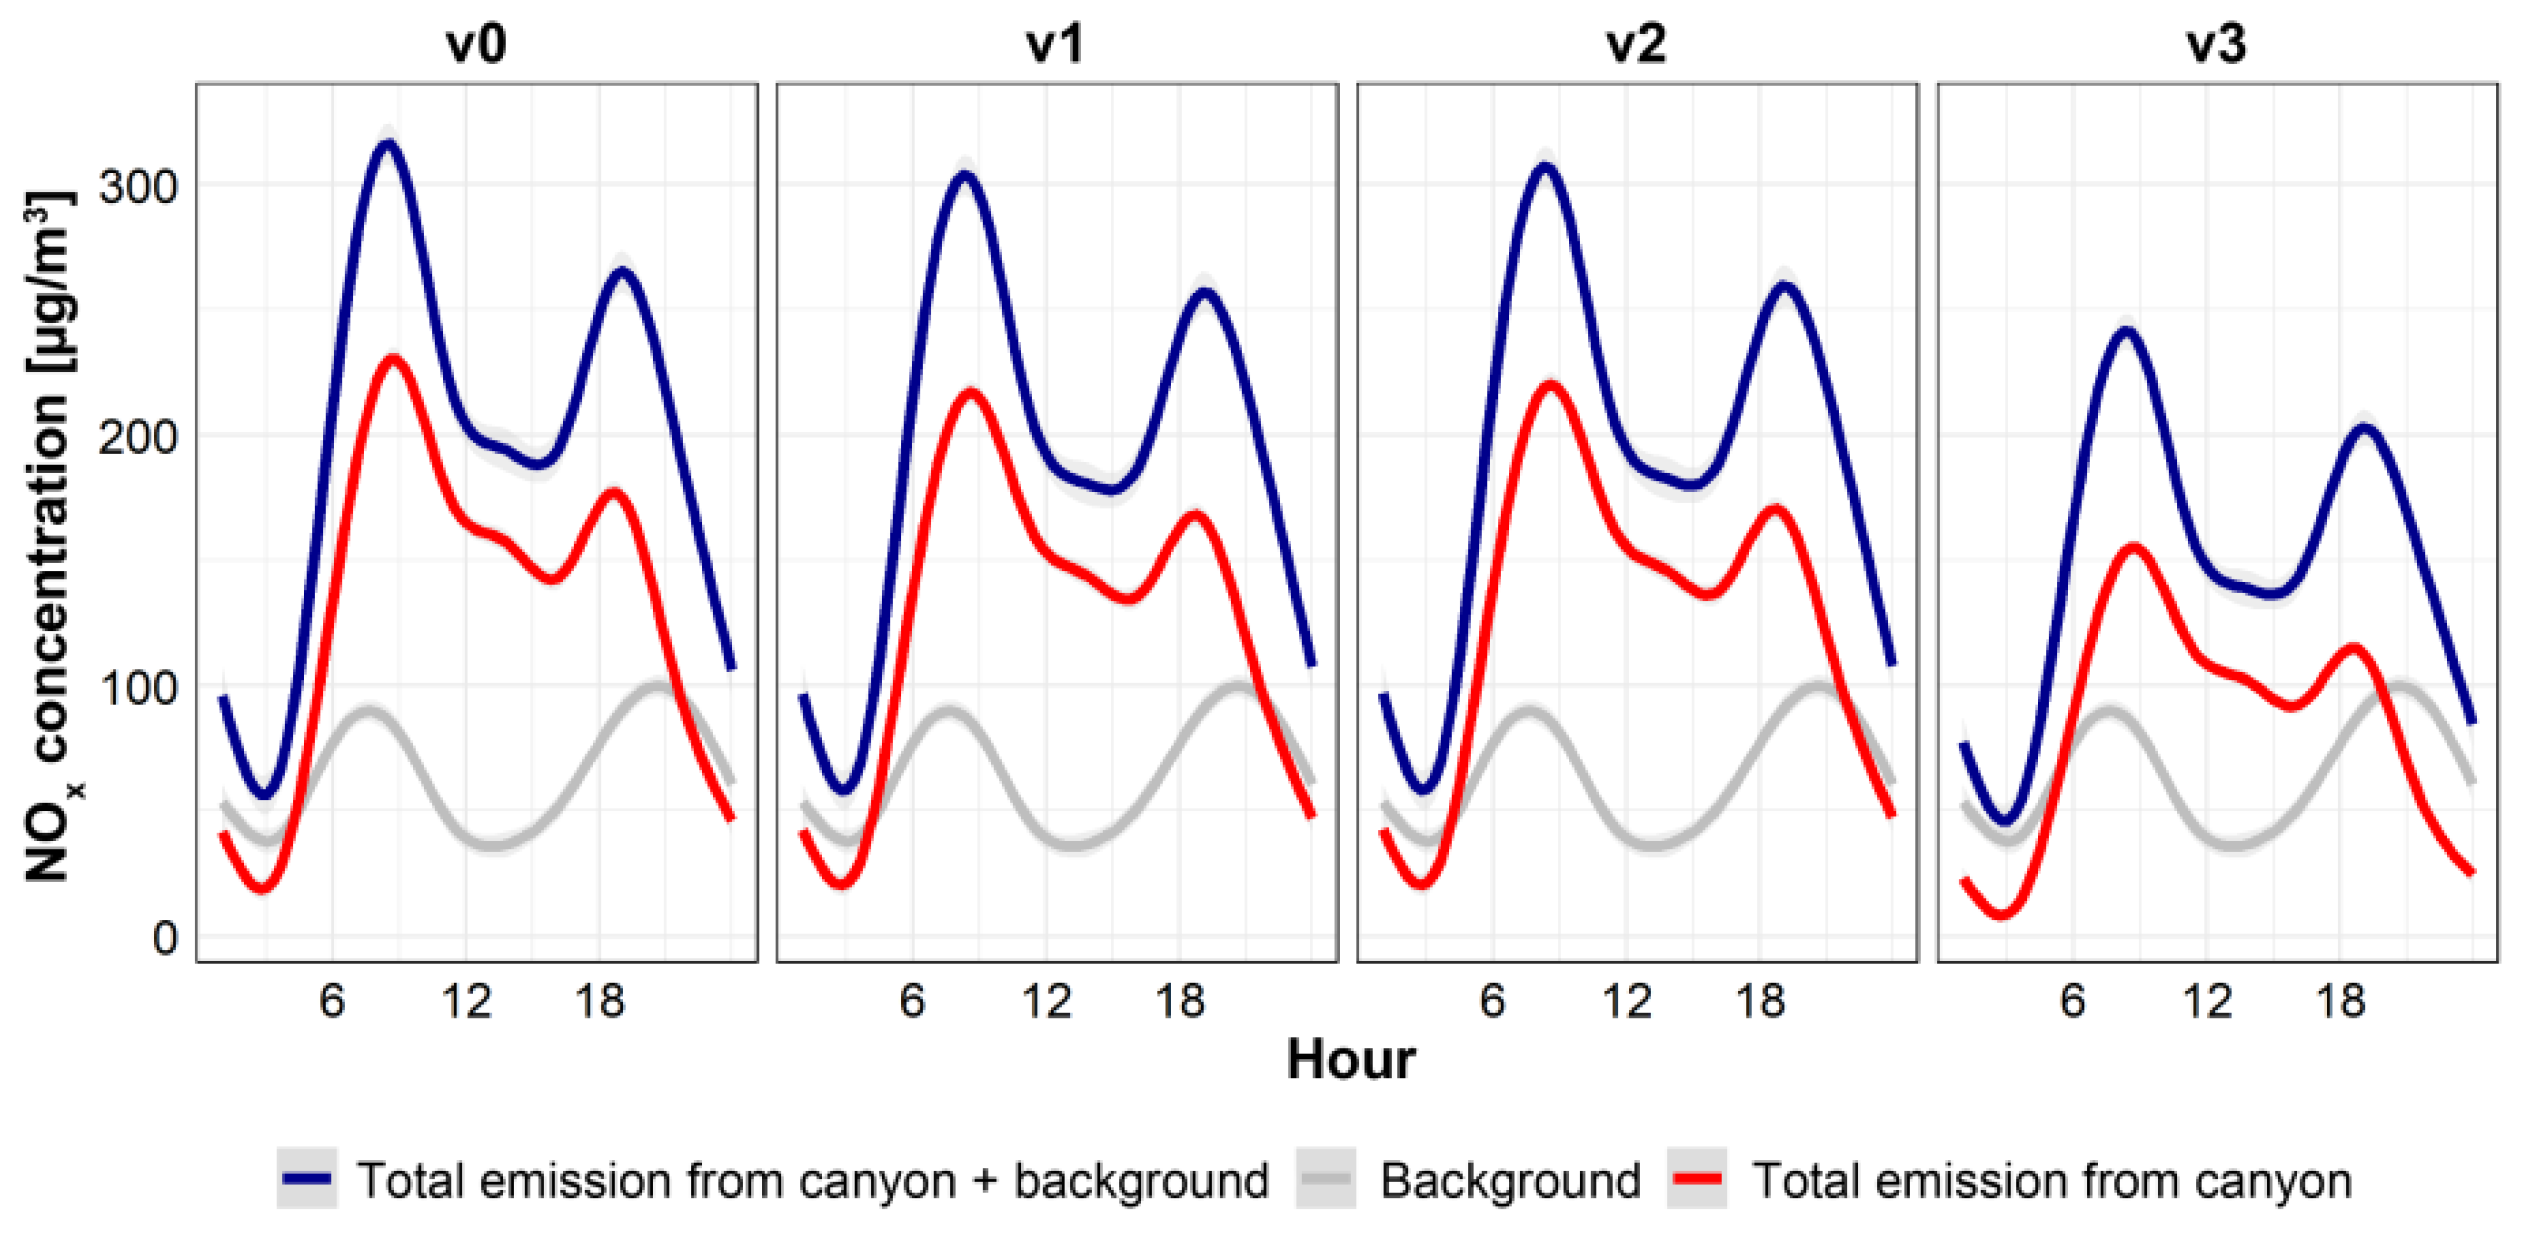
3.3. Expected Improvement of the Air Quality

Annually averaged concentrations of PM10 and PM2.5 obtained by pollutant dispersion modeling in the air of the analyzed street canyon (at the height of 1.5 m) for considered variants of traffic organization are presented in Table 4; Table 5. In these tables the adopted background levels of PM10 and PM2.5 are listed as well, together with the emission source (vehicle emission and secondary emission from road) and background apportionment in total concentration resulting from all emissions from road transport with the background. On the other hand, the results of calculations of the annually averaged NO, NO2, and NOx concentrations in the air for particular variants with consideration of concentrations resulting only from vehicles emissions for the analyzed road section and concentrations both from vehicles and background level are presented in Table 6. In addition, in Table 7 percentage shares of the considered nitrogen oxides concentrations resulting from vehicle emissions (from the street canyon) and background levels related to the total concentration after consideration of the background are listed.
As results from Table 4 Table 5 Table 6, in case of Variants v1 and v2 a minor reduction (at the level of at most a few percent) in the average concentrations of considered substances in the air in the analyzed street canyon compared to the base Variant v0, wherein in the case of NO2, this reduction is very low or close to zero (Figure 7 and Figure 8).
Compared to the changes in emission of considered pollutants (Section 3.2), a significant reduction effect in air pollutants concentrations were obtained only for Variant v3. Average reduction of air concentrations of PM10, PM2.5, NO, NO2, and NOx modeled for this variant equals to 38.4%, 40.3%, 38.2%, 21.5%, and 35.7%, respectively (Figure 7). After taking into account the background pollution of considered pollutants, the forecasted reduction in concentrations ranges from about 7–9% in the case of PM10, PM2.5, and NO2 and about 29% and 24% for NO and NOx, respectively (Figure 8).
Estimated for the base variant (v0) share of total emission from the analyzed canyon in shaping of air quality in this canyon ranges from about 20.8% in case of PM2.5 to about 76.9% in case of NO (Table 4, Table 5, Table 6 and Table 7). This percentage is, in case of Variants v1 and v2, only slightly lower in relation to Variant v0, and for Variant v3—significantly lower (13.6% in case of PM2.5 and 67.4% in case of NO). On the other hand, shares of secondary emission from road in total concentration of particular fraction of particulate matter resulting from road transport emission in this canyon (without background pollution) for considered variants are quite similar and equal to approximately 41–42% in case of PM10 and about 28–30% in case of PM2.5.
In Figure A4, Figure A5, Figure A6, Figure A7 and Figure A8 (Appendix B) the modeling outcomes are presented, which show annually averaged diurnal variability of considered substances in the air in canyon for the analyzed variants of road traffic reorganization with and without background pollution taken into account. This figures indicate, that the yearly averaged 1-h concentrations in the air obtained for consecutive hours of the day reflect diurnal variability of the vehicle volume (Figure 4) and pollutants emission (Figure A1, Figure A2 and Figure A3), for which the highest intensity is during day hours (with morning and afternoon peak), and the lowest during night hours.

4. Discussion

As indicated by simulations conducted using Krakow Traffic Model, among three of the considered variants of traffic reorganization in the vicinity of the analyzed street canyon, two of them (Variants v1 and v2) are associated with similar decrease in the expected traffic volume (on average by approximately 15%) and actual vehicle speed (on average by about 5 and 6 km/h, respectively for Variant v1 and v2) in relation to the status in 2017 (base Variant v0). These reductions stem from determined capacity of two neighboring intersections and assumed traffic restrictions for each variant, which goal is to calm traffic with no significant interference in road vehicle structure. Elimination of one lane in each direction available for unprivileged vehicles with bus lane left (Variant v1) should therefore result in similar traffic calming effect as tightening speed limit from 70 to 50 km/h (Variant v2), causing decrease in average annual traveling speed of vehicles to about 32 km/h (Variant v1) and 31 km/h (Variant v2). Thus, similar expected emission reduction for these variants was observed in terms of primary emission (VE) and secondary emission (SE) of the analyzed air pollutants originating from road transport (by about 9–14% depending on a substance) in relation to Variant v0 (Figure 6), although for Variant v2 the modeled actual average traffic speed results in slightly higher emission of PM10, PM2.5, and NOx from vehicles (VE) compared to Variant v1.
Unfortunately, the abovementioned reduction in the emission rate of considered substances is not reflected at the same level in the modeling results of concentrations of these pollutants in the air obtained using the OSPM model. Modeled decrease in their concentrations in the air (relative to Variant v0) resulting from reduced impact of their total emission from canyon (TE) without background pollution equals to 5–7% in the case of PM10 and PM2.5 fractions and 2–4% in the case of NO and sum of NOx (Figure 7). However, the forecasted improvement of air quality after considering the background pollution of the abovementioned substances equals to 1–3% (Figure 8). This is due to the circulation effect observed in the street canyon which is taken into account in the OSPM model [26,27,28], as well as to the relatively high air pollution in Krakow both in terms of the PM10 and PM2.5 particulate matter and NOx observed at the urban background stations in 2017 [2], which directly affects the background pollution adopted for calculations (Table 1). Similar effect associated with the weakened degree of concentrations reduction in relation to the estimated degree of emission reduction for considered scenarios of the traffic speed management was recognized by, among others, Bigazzi and Rouleau in the review paper [25]. Relatively low forecasted improvement in the air quality in the case of PM2.5 concentrations resulting from, inter alia, decrease in traffic speed, was obtained as well by Mensink and Cosemans [36], who highlighted in their modeling results the dominating influence of the background pollution of this substance.
Emphatically higher effects regarding the road transport emission reduction and the improvement of air quality in street canyons and their surroundings as well were usually found in situations when a significant decrease in traffic volume was either introduced or planned and when older groups of vehicles failing to meet specific emission requirements were eliminated [25,38].
Analogous results were obtained in this study which is confirmed by relatively high both emission and air concentrations reduction for Variant v3, for which the assumption was made that the ordinary lanes may be accessed only by passenger cars and light commercial vehicles that meet the Euro 4 exhaust standard or higher. Introduction of such restriction should bring noticeable improvement in the air quality in the considered street canyon (especially in the initial period) even in situation when the background pollution remains at the same, relatively high level. The highest predicted level of reduction of the analyzed pollutants concentrations in the air for this variant (compared to Variant v0, with background from 2017) is expected in case of NO (approximately 29%) and the lowest―for NO2 (approximately 7%), at the forecasted total emission reduction of these substances from the considered canyon at the level of, respectively 44.6% (NO) and 27% (NO2). On the other hand, the expected improvement of air quality in canyon for Variant v3 in case of the PM10 and PM2.5 particles with the actual levels of their background is slightly above 9% in case of PM10 and slightly above 8% in case of PM2.5 (Figure 8), which is associated with a total reduction of their emission from vehicles traveling through this canyon and the secondary emission from road respectively at the level of about 45% (PM10) and 47% (PM2.5) (Figure 6). Potential improvement in air quality in the region of the analyzed canyon, connected with the traffic reorganization corresponding to that in Variant v3, is therefore partly masked by high pollution background, similarly as it was noticed for Variants v1 and v2. This masking effect is majorly important in the heating season (cold months), when the elevated concentrations of PM10 and PM2.5 are observed (Figure 3), resulting from their additional emission from fuel combustion processes for heating purposes taking place inside the city and in the neighboring towns (inflowing polluted air masses). Assuming the introduction of the low-emission zone for greater number of streets, both decrease in the background level for considered pollutants and higher relative reduction of their concentrations in the canyon may be expected (slightly more similar to data presented in Figure 7).
For all of the analyzed variants of the traffic reorganization, diurnal distribution of the secondary PM10 and PM2.5 emission from road is strongly correlated with the total particulate matter emission profile (Figure A1 and Figure A2). That affects also the diurnal variability of this emission impact on their concentrations in the air (Figure A4 and Figure A5). This statement is valid primarily for day hours. During night hours a higher percentage share of secondary emission in total PM10 and PM2.5 emission from the analyzed road is observed. This results predominantly from the fact of lower road traffic volume at night, thus lower vehicle emission share in total emission. Average for all of the analyzed traffic variants percentages of secondary and vehicle emission in total emission of a given particulate matter type from the analyzed street are respectively 41% and 59% in case of PM10 and respectively 33% and 67% in case of PM2.5. This is confirmed by high importance of the resuspension effect of particulate matter from road in total emission of dust from vehicle transport and shaping the air quality in street canyons recognized in other studies [11,42,43,54,55,58].
Diurnal distribution of concentrations of the analyzed pollutants in the air of considered canyon obtained by modeling (Figure A4, Figure A5, Figure A6, Figure A7 and Figure A8) confirms the fact that the best conditions for dispersion of pollutants in the air typically occur during the day around noon and early afternoon hours, and the worst at night due to, among others, frequent occurrences of stable atmosphere, and lower height of the mixing layer [59,60,61]. This distribution characterizes street canyons [4] and reflect diurnal variability of the vehicle traffic volume (Figure 4) and resulting emission to the air (Figure A1, Figure A2 and Figure A3), as well as diurnal variability of the background pollution (Figure 3). In the case of NO and NO2, additional differences in diurnal distribution of their concentrations in the air occur, including hours of the maximum peaks (Figure 3, Figure A6 and Figure A7), resulting from chemical transformations of nitrogen oxides [59] and daily changeability of the NOx emission from road vehicles (Figure A3). Maximum NO concentrations in the canyon overlap the maximum values of its emissions from canyon and maximum values of the background, and their decrease during afternoon and early afternoon hours is partly due to the conversion from NO to NO2, which degree is dependent on present atmospheric conditions and the availability of oxidants (including ozone).

5. Conclusions

Reduction in the air pollutants emission from road transport can be achieved through various means, including, for example, traffic calming and lowering the volume of traffic, or elimination of the vehicles characterized by excessive emissions. This should lead to an improvement of air quality in the vicinity of roads involved in such actions, especially in the regions of street canyons, within which, depending on wind direction, the accumulation of air pollutants may occur. As results from conducted research, the degree of expected air quality improvement depends on the type of introduced actions as well as the background pollution of considered substances.
A planned approximate 15% decrease in vehicle volume resulting from introduction of such restrictions as narrowing the cross-section of the road (decrease in the number of lanes possible in case of the multilane roadways) or the application of stricter maximum speed limit for the analyzed street fragment by 20 km/h does not yield appropriate reduction in the pollutants emission to the air. Therefore, the forecasted improvement of air quality in terms of the levels of PM10, PM2.5, and NOx is relatively low and to a great extent masked by quite high observed background pollution of these substances in the air. Actions of such kind may bring noticeable effects only in case of cities with low pollution background from other sources.
The greatest effects related to the reduction of pollutant concentrations in the air inside street canyons can be expected after introduction of restrictions eliminating vehicles from road traffic failing to meet the specified Euro standard, assuming that this action will also result in significant decrease in traffic volume. Considering the actual structure of vehicles registered in Krakow and Malopolska voivodeship as well as traffic volume in the considered street canyon (as for 2017), admission of only passenger cars and light commercial vehicles into the traffic that meet the Euro 4 standard or higher should result, at the initial period of its enforcement, in decrease of traffic volume on average by about 45%, assuming 5% of the eliminated cars will be replaced with new vehicles meeting the Euro 6 standard. Determined degree of emission reduction to the air in case of PM10, PM2.5, and NO should be at 45–47%, and for the NO2 and sum of NOx at the level of, respectively, 27% and 42%. Introduction of this restriction should bring a reduction of concentrations for the abovementioned substances in the air of the considered canyon by almost 10% in case of PM10 and PM2.5 and by more than 20% in case of sum of NOx (at the present background pollution). The process of replacing older vehicles failing to meet the specific Euro standard with newer ones will result in gradual increase of traffic volume and its impact on air quality, but simultaneously the vehicle emissions will be lower because the Euro standards they meet will be more strict.
Prospective introduction of such clean transport zone (or even more rigorous in terms of Euro standards) in a larger area of the city should also decrease the background pollution of these substances and bring decisively greater effects in terms of the air quality improvement in relation to the present state, at least at the beginning due to a sudden elimination of a large number of vehicles from traffic. Substantial reduction of the background level obtained through pollutants emission reduction from other significant sources (including household furnaces) influencing air quality in Krakow is necessary so that greater relative changes of the air pollution state near transport routes with large traffic volume could be expected when traffic reorganization measures are undertaken to limit the air emissions. Fortunately, the air protection policy conducted in the city of Krakow and Malopolska voivodeship enforces gradual elimination of the most onerous emission sources connected with the communal-household sector, which is evidenced by, for example, prohibition of solid fuel burning in furnaces and low-power boilers in the city introduced on 1 September 2019 [5].
It should be noted that all actions resulting in decreased road transport emissions to the air of particulate pollutants bring reduction in air concentrations of toxic heavy metals as well as both elemental and total carbon bound in particles emitted from vehicles or resuspended from road [62,63,64]. Thereby, these actions should minimize human exposure to these substances and be beneficial to health. It is advisable to conduct further research on the traffic management strategies in order to assure better recognition of expected effects in terms of the air quality improvement and its impact to human health. Particularly needed are the studies on a larger spatial scale involving cities, for which the clean transport zones have not been introduced yet, in order to optimize decision making in this matter.

Author Contributions

Conceptualization, M.B., R.O., and M.R.; Methodology, M.B., R.O., M.R., and P.B.; Software, M.R., P.B., A.S., and T.G.; Validation, M.R., P.B., and A.S.; Formal analysis, M.B., R.O., M.R., P.B., and A.S.; Investigation, M.B., R.O., and M.R.; Resources, M.B., R.O., M.R., P.B., A.S., and T.G.; Data curation, R.O., M.R., P.B., and A.S.; Writing—original draft preparation, M.B. and R.O.; Writing—review and editing, R.O., M.R., P.B., A.S., and T.G.; Visualization, R.O., M.R., P.B., and A.S.; Supervision, M.B. and R.O.; Project administration, M.B.; Funding acquisition, M.B. and R.O. All authors have read and agreed to the published version of the manuscript.

Funding

The paper has been prepared as part of the research connected with the subsidy of Ministry of Science and Higher Education of Poland to maintain scientific potential (agreement no. 16.16.150.545). In addition, in the article the results of research carried out as part of scientific project financed by Municipality of Krakow (agreement no. 25.25.150.571) were used.

Acknowledgments

The authors would like to express their sincere gratitude to Professor Marian Mazur and workers of the Department of Municipal Management of the Municipality of Krakow for the help in carrying out the research.

Conflicts of Interest

The authors declare no conflict of interest. The funders had no role in the design of the study; in the collection, analyses or interpretation of data; in the writing of the manuscript or in the decision to publish the results.

Appendix A

Figure A1. Weekly profiles of the total PM10 emission from the analyzed canyon and the secondary emission from road determined for considered traffic reorganization variants (1-h means).
Atmosphere 11 00695 g0a1
Figure A2. Weekly profiles of the total PM2.5 emission from the analyzed canyon and the secondary emission from road determined for considered traffic reorganization variants (1-h means).
Atmosphere 11 00695 g0a2
Figure A3. Weekly profiles of the total NO, NO2, and NOx emission from the analyzed canyon for considered traffic reorganization variants (1-h means).
Atmosphere 11 00695 g0a3

Appendix B

Figure A4. Diurnal variability of the yearly averaged PM10 concentrations in the street canyon at the height of the receptor (1.5 m) for the considered traffic reorganization variants and emission sources with and without background pollution taken into account.
Atmosphere 11 00695 g0a4
Figure A5. Diurnal variability of the yearly averaged PM2.5 concentrations in the street canyon at the height of the receptor (1.5 m) for the considered traffic reorganization variants and emission sources with and without background pollution taken into account.
Atmosphere 11 00695 g0a5
Figure A6. Diurnal variability of the yearly averaged NO concentrations in the street canyon at the height of the receptor (1.5 m) for the considered traffic reorganization variants and emission sources with and without background pollution taken into account.
Atmosphere 11 00695 g0a6
Figure A7. Diurnal variability of the yearly averaged NO2 concentrations in the street canyon at the height of the receptor (1.5 m) for the considered traffic reorganization variants and emission sources with and without background pollution taken into account.
Atmosphere 11 00695 g0a7
Figure A8. Diurnal variability of the yearly averaged NOx concentrations in the street canyon at the height of the receptor (1.5 m) for the considered traffic reorganization variants and emission sources with and without background pollution taken into account.
Atmosphere 11 00695 g0a8

References

  1. Directive 2008/50/EC of the European Parliament and of the Council of 21 May 2008 on Ambient Air Quality and Cleaner Air for Europe OJ L 152, 11.6.2008. pp. 1–44. Available online: https://eur-lex.europa.eu/eli/dir/2008/50/oj (accessed on 31 December 2019).
  2. Chief Inspectorate for Environmental Protection (Poland)—Measurement Data Archives. Available online: http://powietrze.gios.gov.pl/pjp/archives (accessed on 31 March 2020).
  3. Chlebowska-Styś, A.; Sówka, I.; Kobus, D.; Pachurka, L. Analysis of concentrations trends and origins of PM10 in selected European cities. E3S Web Conf. 2017, 17, 00013. [Google Scholar] [CrossRef] [Green Version]
  4. Oleniacz, R.; Gorzelnik, T.; Szulecka, A. A comparative analysis of air pollutant concentrations and inflow trajectories: A case study of selected cities in South-Eastern Poland. E3S Web Conf. 2018, 45, 00060. [Google Scholar] [CrossRef]
  5. Marshal Office of the Malopolska Region, Malopolska in Healthy Atmosphere—Air Quality Plan for the Malopolska Region—The Project of the New Air Quality Plan from 2020. Available online: https://powietrze.malopolska.pl/program-ochrony-powietrza/ (accessed on 31 March 2020). (In Polish).
  6. Krakow City Office, Department of Strategy. Planning and Monitoring of Investments—Krakow in numbers 2009–2018. Available online: https://www.bip.krakow.pl/?mmi=6353 (accessed on 31 March 2020). (In Polish).
  7. Krakow City Internet Platform. Magiczny Krakow—Statement of 20 December 2017: Do Krakowa Wjeżdża Dziennie Ćwierć Miliona Samochodów. Available online: https://www.krakow.pl/aktualnosci/216234,26,komunikat,do_krakowa_wjezdza_dziennie_cwierc_miliona_samochodow.html (accessed on 31 March 2020). (In Polish).
  8. TomTom. Traffic Index 2019. Available online: https://www.tomtom.com/en_gb/traffic-index/ranking/ (accessed on 31 March 2020).
  9. Bździuch, P.; Bogacki, M. Autobusowy transport publiczny w Krakowie na tle najlepszych światowych systemów komunikacji miejskiej oraz ocena wpływu jego modernizacji na wielkość emisji zanieczyszczeń do powietrza. Transp. Miej. I Reg. 2017, 4, 26–31. (In Polish). Available online: http://yadda.icm.edu.pl/yadda/element/bwmeta1.element.baztech-04fb1d02-a7dc-4c03-8e6f-933a6a66a95e (accessed on 31 December 2019).
  10. Vardoulakis, S.; Gonzalez-Flesca, N.; Fisher, B.E.A. Assessment of traffic-related air pollution in two street canyons in Paris: Implications for exposure studies. Atmos. Environ. 2002, 36, 1025–1039. [Google Scholar] [CrossRef]
  11. Bukowiecki, N.; Lienemann, P.; Hill, M.; Furger, M.; Richard, A.; Amato, F.; Prévôt, A.S.H.; Baltensperger, U.; Buchmann, B.; Gehrig, R. PM10 emission factors for non-exhaust particles generated by road traffic in an urban street canyon and along a freeway in Switzerland. Atmos. Environ. 2010, 44, 2330–2340. [Google Scholar] [CrossRef]
  12. Crippa, M.; Decarlo, P.F.; Slowik, J.G.; Mohr, C.; Heringa, M.F.; Chirico, R.; Poulain, L.; Freutel, F.; Sciare, J.; Cozic, J.; et al. Wintertime aerosol chemical composition and source apportionment of the organic fraction in the metropolitan area of Paris. Atmos. Chem. Phys. 2013, 13, 961–981. [Google Scholar] [CrossRef] [Green Version]
  13. Vos, P.E.; Maiheu, B.; Vankerkom, J.; Janssen, S. Improving local air quality in cities: To tree or not to tree? Environ. Pollut. 2013, 183, 113–122. [Google Scholar] [CrossRef] [PubMed]
  14. Rakowska, A.; Wong, K.C.; Townsend, T.; Chan, K.L.; Westerdahl, D.; Ng, S.; Močnik, G.; Drinovec, L.; Ning, Z. Impact of traffic volume and composition on the air quality and pedestrian exposure in urban street canyon. Atmos. Environ. 2014, 98, 260–270. [Google Scholar] [CrossRef]
  15. Střižík, M.; Zelinger, Z.; Kubát, P.; Civiš, S.; Bestová, I.; Nevrlý, V.; Kadeřábek, P.; Čadil, J.; Berger, P.; Černý, A.; et al. Influence of photochemical processes on traffic-related airborne pollutants in urban street canyon. J. Atmos. Sol.-Terr. Phys. 2016, 147, 1–10. [Google Scholar] [CrossRef]
  16. Ortolani, C.; Vitale, M. The importance of local scale for assessing, monitoring and predicting of air quality in urban areas. Sustain. Cities Soc. 2016, 26, 150–160. [Google Scholar] [CrossRef]
  17. Abhijith, K.V.; Kumar, P.; Gallagher, J.; McNabola, A.; Baldauf, R.; Pilla, F.; Broderick, B.; Di Sabatino, S.; Pulvirenti, B. Air pollution abatement performances of green infrastructure in open road and built-up street canyon environments—A review. Atmos. Environ. 2017, 162, 71–86. [Google Scholar] [CrossRef]
  18. Lee, C. Impacts of urban form on air quality: Emissions on the road and concentrations in the US metropolitan areas. J. Environ. Manag. 2019, 246, 192–202. [Google Scholar] [CrossRef]
  19. Gulia, S.; Goyal, P.; Goyal, S.K.; Kumar, R. Re-suspension of road dust: Contribution, assessment and control through dust suppressants—A review. Int. J. Environ. Sci. Technol. 2019, 16, 1717–1728. [Google Scholar] [CrossRef]
  20. Namdeo, A.; Bell, M.C. Characteristics and health implications of fine and coarse particulates at roadside, urban background and rural sites in UK. Environ. Int. 2005, 31, 565–573. [Google Scholar] [CrossRef] [Green Version]
  21. Kassomenos, P.; Vardoulakis, S.; Chaloulakou, A.; Grivas, G.; Borge, R.; Lumbreras, J. Levels, sources and seasonality of coarse particles (PM 10–PM 2.5) in three European capitals–Implications for particulate pollution control. Atmos. Environ. 2012, 54, 337–347. [Google Scholar] [CrossRef] [Green Version]
  22. Keuken, M.P.; Jonkers, S.; Zandveld, P.; Voogt, M. Elemental carbon as an indicator for evaluating the impact of traffic measures on air quality and health. Atmos. Environ. 2012, 61, 1–8. [Google Scholar] [CrossRef]
  23. Cyrys, J.; Eeftens, M.; Heinrich, J.; Ampe, C.; Armengaud, A.; Beelen, R.; Bellander, T.; Beregszászi, T.; Birk, M.; Cesaroni, G.; et al. Variation of NO2 and NOx concentrations between and within 36 European study areas: Results from the ESCAPE study. Atmos. Environ. 2012, 62, 374–390. [Google Scholar] [CrossRef]
  24. Chart-asa, C.; Gibson, J.M.D. Health impact assessment of traffic-related air pollution at the urban project scale: Influence of variability and uncertainty. Sci. Total Environ. 2015, 506, 409–421. [Google Scholar] [CrossRef] [PubMed]
  25. Bigazzi, A.Y.; Rouleau, M. Can traffic management strategies improve urban air quality? A review of the evidence. J. Transp. Health 2017, 7, 111–124. [Google Scholar] [CrossRef]
  26. Berkowicz, R.; Hertel, O.; Larsen, S.E.; Sørensen, N.N.; Nielsen, M. Modeling Traffic Pollution in Streets; Technical Report; National Environmental Research Institute: Roskilde, Denmark, 1997; Available online: https://orbit.dtu.dk/files/128001317/Modeling_traffic_pollution_in_streets.pdf (accessed on 31 December 2019).
  27. Berkowicz, R. OSPM—A parameterised street pollution model. Environ. Monit. Assess. 2000, 65, 323–331. [Google Scholar] [CrossRef]
  28. Berkowicz, R.; Ketzel, M.; Jensen, S.S.; Hvidberg, M.; Raaschou-Nielsen, O. Evaluation and application of OSPM for traffic pollution assessment for a large number of street locations. Environ. Model. Softw. 2008, 23, 296–303. [Google Scholar] [CrossRef]
  29. Vardoulakis, S.; Valiantis, M.; Milner, J.; ApSimon, H. Operational air pollution modeling in the UK—Street canyon applications and challenges. Atmos. Environ. 2007, 41, 4622–4637. [Google Scholar] [CrossRef]
  30. Elbir, T.; Kara, M.; Bayram, A.; Altiok, H.; Dumanoglu, Y. Comparison of predicted and observed PM10 concentrations in several urban street canyons. Air Qual. Atmos. Health 2011, 4, 121–131. [Google Scholar] [CrossRef]
  31. Hu, W.; Zhong, Q. Using the OSPM model on pollutant dispersion in an urban street canyon. Adv. Atmos. Sci. 2010, 27, 621–628. [Google Scholar] [CrossRef]
  32. Kakosimos, K.E.; Hertel, O.; Ketzel, M.; Berkowicz, R. Operational Street Pollution Model (OSPM)—A review of performed application and validation studies, and future prospects. Environ. Chem. 2010, 7, 485–503. [Google Scholar] [CrossRef]
  33. Ottosen, T.B.; Kakosimos, K.E.; Johansson, C.; Hertel, O.; Brandt, J.; Skov, H.; Berkowicz, R.; Ellermann, T.; Jensen, S.S.; Ketzel, M. Analysis of the impact of inhomogeneous emissions in the Operational Street Pollution Model (OSPM). Geosci. Model Dev. 2015, 8, 3231–3245. [Google Scholar] [CrossRef] [Green Version]
  34. Rzeszutek, M.; Bogacki, M. Ocena modelu dyspersji zanieczyszczeń powietrza OSPM: Studium przypadku, Polska, Kraków. Ann. Set Environ. Prot. 2016, 18, 351–362. Available online: http://towarzystwo.ros.edu.pl/images/roczniki/2016/No2/26_ROS_N2_V18_R2016.pdf (accessed on 31 December 2019).
  35. Rzeszutek, M.; Bogacki, M.; Bździuch, P.; Szulecka, A. Improvement assessment of the OSPM model performance by considering the secondary road dust emissions. Transp. Res. D Trans. Environ. 2019, 68, 137–149. [Google Scholar] [CrossRef]
  36. Mensink, C.; Cosemans, G. From traffic flow simulations to pollutant concentrations in street canyons and backyards. Environ. Model. Softw. 2008, 23, 288–295. [Google Scholar] [CrossRef]
  37. Lazić, L.; Urošević, M.A.; Mijić, Z.; Vuković, G.; Ilić, L. Traffic contribution to air pollution in urban street canyons: Integrated application of the OSPM, moss biomonitoring and spectral analysis. Atmos. Environ. 2016, 141, 347–360. [Google Scholar] [CrossRef]
  38. Steinberga, I.; Sustere, L.; Bikse, J.; Bikse, J., Jr.; Kleperis, J. Traffic induced air pollution modeling: Scenario analysis for air quality management in street canyon. Procedia Comput. Sci. 2019, 149, 384–389. [Google Scholar] [CrossRef]
  39. Méline, J.; Wicherek, S.; Julien-Laferriere, B.; Oudinet, J.P. Assessment of exposure to air pollution from road traffic: Use of air dispersion model CALINE4 at a fine scale in Cracow. Pr. Geogr. 2011, 127, 87–113. Available online: http://cejsh.icm.edu.pl/cejsh/element/bwmeta1.element.ojs-issn-2083-3113-year-2011-issue-127-article-4211 (accessed on 31 December 2019).
  40. Rzeszutek, M.; Kasietczuk, M.; Bogacki, M. Impact assessment of road transport on air quality in the selected area of Krakow. Logistyka 2014, 4, 4864–4873. [Google Scholar]
  41. Bogacki, M.; Rzeszutek, M.; Heba, K. Modelowanie dyspersji zanieczyszczeń powietrza w kanionie ulicznym na przykładzie Alei Krasińskiego w Krakowie. JCEEA 2016, 33, 21–38. Available online: http://doi.prz.edu.pl/pl/publ/biis/585 (accessed on 31 December 2019).
  42. Bogacki, M.; Mazur, M.; Oleniacz, R.; Rzeszutek, M.; Szulecka, A. Re-entrained road dust PM 10 emission from selected streets of Krakow and its impact on air quality. E3S Web Conf. 2018, 28, 01003. [Google Scholar] [CrossRef] [Green Version]
  43. Bogacki, M.; Oleniacz, R.; Rzeszutek, M.; Szulecka, A.; Mazur, M. The impact of intense street cleaning on particulate matter air concentrations: A case study of a street canyon in Krakow (Poland). E3S Web Conf. 2018, 45, 00009. [Google Scholar] [CrossRef]
  44. Gorzelnik, T.; Oleniacz, R. Suitability analysis of new air quality monitoring stations in Krakow as related to assessment of spatial and temporal variability of PM 10 concentrations. Geomat. Environ. Eng. 2019, 13, 31–45. [Google Scholar] [CrossRef]
  45. Ministerstwo Cyfryzacji—Centralna Ewidencja Pojazdów i Kierowców. Available online: http://www.cepik.gov.pl/ (accessed on 30 September 2019).
  46. Szarata, A.; Kulpa, T.; Kucharski, R.; Pyzik, M.; Drabicki, A.; Siwek, K.; Wójcik, M.; Banet, K. Krakowski Model Ruchu 2014; Politechnika Krakowska, PBS Sp. z o.o., EKKOM Sp. z o.o., International Management Services Sp. z o.o. 2015. (In Polish). Available online: http://knsk.org/2015/01/krakowski-model-ruchu-2014/ (accessed on 30 September 2019).
  47. EEA. EMEP/EEA Air Pollutant Emission Inventory Guidebook 2016, Part B, Section 1.A.3.b.i-iv, Road Transport; EEA Report No 21/2016; Publications Office of the European Union: Luxembourg, 2018; pp. 1–143. Available online: https://www.eea.europa.eu/publications/emep-eea-guidebook-2016/part-b-sectoral-guidance-chapters/1-energy/1-a-combustion/1-a-3-b-i/view (accessed on 30 September 2019).
  48. EMISIA, S.A.—EMISIA. Conscious of Transport’s Impact, COPERT. Available online: https://www.emisia.com/utilities/copert/ (accessed on 31 December 2018).
  49. Research and Statistical Education Centre (GUS). Development of the Methodology and Estimation of the External Costs of Air Pollution Emitted from Road Transport at National Level; Final report; GUS: Szczecin, Poland, 2018. Available online: https://stat.gov.pl/statystyki-eksperymentalne/uslugi-publiczne/ (accessed on 30 September 2019).
  50. USA EPA. AP-42, Compilation of Air Pollutant Emission Factors, 5th ed.; Chapter 13, Section 13.2.1, Paved Roads; Office of Air Quality Planning and Standards: Research Triangle Park, NC, USA, 2011; Volume I, pp. 1–15. Available online: https://www3.epa.gov/ttn/chief/ap42/ch13/final/c13s0201.pdf (accessed on 30 September 2019).
  51. USA EPA. Emission Factor Documentation for AP-42, Section 13.2.1, Paved Roads; Office of Air Quality Planning and Standards: Research Triangle Park, NC, USA, 2011; pp. 4–54. Available online: https://www3.epa.gov/ttn/chief/ap42/ch13/bgdocs/b13s0201.pdf (accessed on 30 September 2019).
  52. Midwest Research Institute (MRI). Background Document for Revisions to Fine Fraction Ratios Used for AP-42 Fugitive Dust Emission Factors; Tech. Rep. MRI Project No. 110397; MRI: Denver, CO, USA, 2006; pp. 1–15. Available online: https://www3.epa.gov/ttnchie1/ap42/ch13/bgdocs/b13s02.pdf (accessed on 30 September 2019).
  53. Kumar, P.; Ketzel, M.; Vardoulakis, S.; Pirjola, L.; Britter, R. Dynamics and dispersion modeling of nanoparticles from road traffic in the urban atmospheric environment—A review. J. Aerosol Sci. 2011, 42, 580–603. [Google Scholar] [CrossRef] [Green Version]
  54. Fan, S.; Tian, G.; Li, G.; Huang, Y.; Qin, J.; Cheng, S. Road fugitive dust emission characteristics in Beijing during Olympics Game 2008 in Beijing, China. Atmos. Environ. 2009, 43, 6003–6010. [Google Scholar] [CrossRef]
  55. Mancilla, Y.; Mendoza, A. A tunnel study to characterize PM2.5 emissions from gasoline-powered vehicles in Monterrey, Mexico. Atmos. Environ. 2012, 59, 449–460. [Google Scholar] [CrossRef]
  56. Dane Meteo—System Prezentacji Pogody—AGH. Available online: http://meteo.ftj.agh.edu.pl (accessed on 30 September 2019). (In Polish).
  57. Hoffmann, L.; Günther, G.; Li, D.; Stein, O.; Wu, X.; Griessbach, S.; Heng, Y.; Konopka, P.; Müller, R.; Vogel, B.; et al. From ERA-Interim to ERA5: The considerable impact of ECMWF’s next-generation reanalysis on Lagrangian transport simulations. Atmos. Chem. Phys. 2019, 19, 3097–3214. [Google Scholar] [CrossRef] [Green Version]
  58. Patra, A.; Colvile, R.; Arnold, S.; Bowen, E.; Shallcross, D.; Martin, D.; Price, C.; Tated, J.; ApSimon, H.; Robins, A. On street observations of particulate matter movement and dispersion due to traffic on an urban road. Atmos. Environ. 2008, 42, 3911–3926. [Google Scholar] [CrossRef]
  59. Oleniacz, R.; Bogacki, M.; Szulecka, A.; Rzeszutek, M.; Mazur, M. Assessing the impact of wind speed and mixing-layer height on air quality in Krakow (Poland) in the years 2014–2015. JCEEA 2016, 33, 315–342. [Google Scholar] [CrossRef] [Green Version]
  60. Szulecka, A.; Oleniacz, R.; Rzeszutek, M. Functionality of openair package in air pollution assessment and modeling—A case study of Krakow. Environ. Prot. Nat. Resour. 2017, 28, 22–27. [Google Scholar] [CrossRef] [Green Version]
  61. Volná, V.; Hladký, D. Detailed assessment of the efects of meteorological conditions on PM10 concentrations in the northeastern part of the Czech Republic. Atmosphere 2020, 11, 497. [Google Scholar] [CrossRef]
  62. Rogula-Kozłowska, W. Chemical composition and mass closure of ambient particulate matter at a crossroads and a highway in Katowice, Poland. Environ. Prot. Eng. 2015, 41. [Google Scholar] [CrossRef]
  63. Sówka, I.; Chlebowska-Styś, A.; Pachurka, L.; Rogula-Kozłowska, W.; Mathews, B. Analysis of particulate matter concentration variability and origin in selected urban areas in Poland. Sustainability 2019, 11, 5735. [Google Scholar] [CrossRef] [Green Version]
  64. Rybak, J.; Wróbel, M.; Stefan Bihałowicz, J.; Rogula-Kozłowska, W. Selected metals in urban road dust: Upper and Lower Silesia case study. Atmosphere 2020, 11, 290. [Google Scholar] [CrossRef] [Green Version]
Figure 1. Analyzed street canyon: (a) location on the Krakow map; (b) canyon dimensions and its orientation in WinOSP; (c) canyon view (own elaboration).
Atmosphere 11 00695 g001
Figure 2. Wind rose and temporal variability of temperature and wind speed for the Krakow city center prepared based on data for 2017: (a) annual wind rose, (b) temperature and wind speed hourly variation, (c) temperature and wind speed monthly variation (own elaboration based on [56]).
Atmosphere 11 00695 g002
Figure 3. Temporal variability of the background pollution in Krakow adopted in the OSPM model for 2017: (a) hourly variation, (b) monthly variation.
Atmosphere 11 00695 g003
Figure 4. Diurnal profile of hourly averaged vehicles speed in the area of the analyzed street canyon determined for the considered variants of traffic reorganization.
Atmosphere 11 00695 g004
Figure 5. Annually averaged profiles of the vehicle volume in the area of the analyzed street canyon for considered variants of traffic reorganization.
Atmosphere 11 00695 g005
Figure 6. Comparison of relative changes in total emissions from road transport to the air of the analyzed substances obtained for Variants v1–v3 in relation to Variant v0.
Atmosphere 11 00695 g006
Figure 7. Comparison of modeling outcomes of the relative changes in average concentrations of the analyzed substances in the air resulting from total emission from the canyon (TE) with no background pollution considered, obtained for Variants v1–v3 in relation to Variant v0.
Atmosphere 11 00695 g007
Figure 8. Comparison of modeling outcomes of the relative changes in average concentrations of the analyzed substances in the air resulting from total emission from the canyon with background pollution considered (TE + BKG), obtained for Variants v1–v3 in relation to Variant v0.
Atmosphere 11 00695 g008
Table 1. Selected descriptive statistics for the background pollution determined for the analyzed street canyon (year 2017).
SubstanceNumber of Observations NAverage Concentration (µg/m3)Standard Deviation (µg/m3)Standard Error of the Mean (µg/m3)Confidence Interval (µg/m3)
PM10854238.5644.050.480.93
PM2.5826827.3035.910.390.77
NO2868830.7319.810.210.42
NOx869664.5277.610.831.63
O3851438.0831.040.340.66
Table 2. Estimated values of the vehicle volume in selected periods of time determined for considered variants and the analyzed street canyon.
Averaging PeriodUnitVariant
v0v1v2v3
Yearveh/year19,489,43216,543,94816,543,98010,753,984
veh/day53,396 45,32645,32629,463
veh/h2225188918891228
Workdaysveh/year14,352,02712,132,78012,132,8127,919,239
veh/day55,20046,66546,66530,459
veh/h2300194419441269
Weekendsveh/year5,137,4054,411,1684,411,1682,834,745
veh/day48,92842,01142,01126,998
veh/h2039175017501125
Table 3. Average annual emissions of the considered pollutants calculated with regard on the variants of the traffic reorganization and emission sources.
VariantPM10 Emission (g/(km·h))PM2.5 Emission (g/(km·h))NOx Emission (g/(km·h))
VE 1SE 2TE 3VE 1SE 2TE 3NONO2NOx 4
v0119.8383.98203.8186.6433.86120.501249.46281.612197.45
v1104.1271.05175.1775.6728.65104.321112.81252.711959.02
v2104.5871.05175.6376.0728.65104.721122.03255.081975.53
v365.4846.34111.8245.5118.6964.20691.99205.691266.75
1 Emission from vehicles, 2 secondary emission from road, 3 total emission from the street canyon, 4 converted to NO2.
Table 4. Modeling results for the annually averaged PM10 concentrations in the air in the analyzed street canyon for considered variants of traffic reorganization with emission sources and background pollution taken into account.
VariantAverage PM10 Concentration Resulting from Denoted Emission Source (µg/m3)Share in Total PM10
Concentration (%)
VE 1SE 2TE 3BKG 4TE + BKGVE 1SE 2TE 3BKG 4
v07.105.1412.2438.5650.8014.010.124.175.9
v16.694.7311.4238.5649.9813.49.522.877.2
v26.764.7511.5138.5650.0713.59.523.077.0
v34.353.197.5438.5646.109.46.916.483.6
1 Vehicle emission, 2 secondary emission from road, 3 total emission from street canyon, 4 background pollution.
Table 5. Modeling results for the annually averaged PM2.5 concentrations in the air in the analyzed street canyon for considered variants of traffic reorganization with emission sources and background pollution taken into account.
VariantAverage PM2.5 Concentration Resulting from Denoted Emission Source (µg/m3)Share in Total PM2.5
Concentration (%)
VE 1SE 2TE 3BKG 4TE + BKGVE 1SE 2TE 3BKG 4
v05.132.057.1827.3034.4814.95.920.879.2
v14.851.886.7327.3034.0314.25.519.880.2
v24.901.896.7927.3034.0914.45.619.980.1
v33.021.274.2927.3031.599.54.013.686.4
1 Vehicle emission, 2 secondary emission from road, 3 total emission from street canyon, 4 background pollution.
Table 6. Modeling results for the annually averaged NO, NO2, and NOx concentrations in the air in the analyzed street canyon for considered variants of traffic reorganization with emission sources and background pollution taken into account.
VariantAverage Concentration Resulting from Denoted Emission Source (µg/m3)
NONO2NOx
TE 1BKG 2TE + BKGTE 1BKG 2TE + BKGTE 1BKG 2TE + BKG
v073.5122.0495.5516.8030.7347.53129.5264.52194.04
v170.6022.0492.6416.6930.7347.42124.9464.52189.46
v271.6322.0493.6716.7930.7347.52126.6364.52191.15
v345.4722.0467.5113.5330.7344.2683.2564.52147.77
1 Total emission from street canyon, 2 background pollution.
Table 7. Percentage apportionment of the impact of emission from vehicles and background levels in total concentration obtained for NO, NO2, and NOx as a result of modeling of their dispersion in the air in the analyzed street canyon for considered traffic reorganization variants.
VariantShare of Denoted Emission Sources in Total Concentration Resulting from Emission in the Canyon Magnified by the Background Level (%)
NONO2NOx
TE 1BKG 2TE 1BKG 2TE 1BKG 2
v076.923.135.364.766.733.3
v176.223.835.264.865.934.1
v276.523.535.364.766.233.8
v367.432.630.669.456.343.7
1 Total emission from street canyon, 2 background pollution.

