1. Introduction
It is widely recognized that climate change is creating continuous and new challenges for the protection and conservation of cultural heritage. Monumental complexes, archaeological sites, and historic buildings with related collections are at risk as a consequence of the impacts of slow and extreme climate changes, particularly in urban areas, where the effect of multiple pressures is amplified. Research on the quantification of climate change impacts on heritage assets and on the development of future scenarios for setting up protection strategies with a long-term perspective has undoubtedly strengthened during the last 15 years, focusing in particular on slow damage processes, such as surface recession and thermal stress on marble, biological accumulation on architectural surfaces, and metal corrosion [
1,
2,
3,
4,
5,
6]. In this respect, the EU FP6 Project Noah’s Ark (2004–2007) produced a vulnerability atlas with maps by applying the global and regional Hadley climate models (grid resolutions of 295 × 278 km and 50 × 50 km, respectively), along with guidelines for cultural heritage protection towards climate change, coupling climatology with conservation science expertise and acquiring unique knowledge in delivering future projections of damage of outdoor cultural heritage induced mainly by slow climate changes [
1]. The scientific approach developed within Project Noah’s Ark constituted the basis for the research enhancement carried out in the FP7 Project Climate for Culture (2009–2014) [
7,
8]. Within this project, hazard and damage projections were forecasted to assess the impact of the slow ongoing climate change rather than extreme events on historic building envelopes, as well as on artwork preserved indoors. In addition, projections of sea level rise—a potential threat to many coastal regions and to their cultural heritage—up to the year 2100 were calculated using a simulation with a global climate model and data from a regionally coupled atmosphere–ocean model regional model (REMO) run on the horizontal grid of 12.5 km, EUR-11) [
9,
10]. Recent H2020-funded projects (HEritage Resilience Against CLimate Change on Site—HERACLES, Safeguarding cultural heritage through Technical and Organisational Resources Management—STORM) have focused on the development of information and communications technology (ICT) systems and solutions to strengthen the resilience of cultural heritage against climate change effects and natural hazards, and have started to focus on the impacts of extreme events [
11].
The research done within these projects and related publications allowed us to highlight the existing gaps in the knowledge that need to be overcome in this sector, suggesting that solutions should be based on a user-driven approach by meeting the requirements and needs of the different targets of stakeholders involved in the protection and management of cultural heritage at risk from climate change. Among these gaps, the need for further development of damage functions and for identification of extreme climate indices specifically devised to quantify the impact on heritage assets, as well as the generation of future projections with high spatial resolution, should be considered of paramount importance. In addition, it is clear that there is an urgent requirement to invest resources and efforts in the production of tools and solutions to enhance the preparedness of cultural heritage to face events linked to hydrometeorological and climatic extremes (such as storms, floods, drought periods, and heat waves) [
12].
Within this framework, the ongoing Interreg Central Europe ProteCHt2save Project (Risk assessment and sustainable protection of cultural heritage in changing environment, 2017–2020) aims to improve the capacities of the public and private sectors to mitigate the impacts of climate change and natural hazards on cultural heritage sites, including monumental complexes, historic buildings, and related collections in urban and coastal areas in Central European countries. The project focuses primarily on the development of feasible and tailored solutions to build cultural heritage resilience to extreme events linked to climate change by supporting regional and local authorities with preparedness measures and evacuation plans for emergencies.
This overall objective is achieved by performing the following activities:
- (1)
Identification of risk-prone areas in Central Europe where cultural heritage is exposed to extreme weather and climate events (heavy rain, flood, drought);
- (2)
Determination of elements for the vulnerability assessment of cultural heritage, specifically monumental complexes and related collections in historic centers;
- (3)
Set up of evacuation plans and preparedness measures for cultural heritage safeguarding.
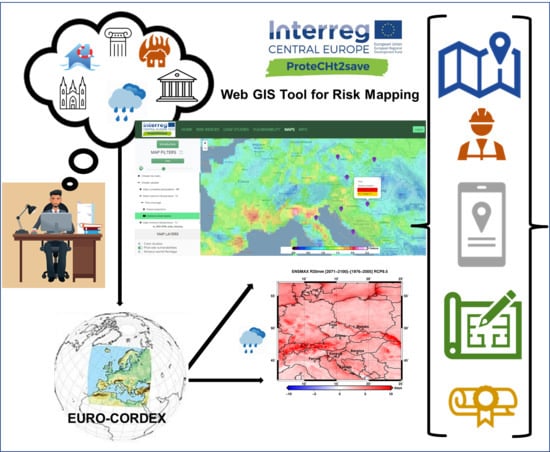
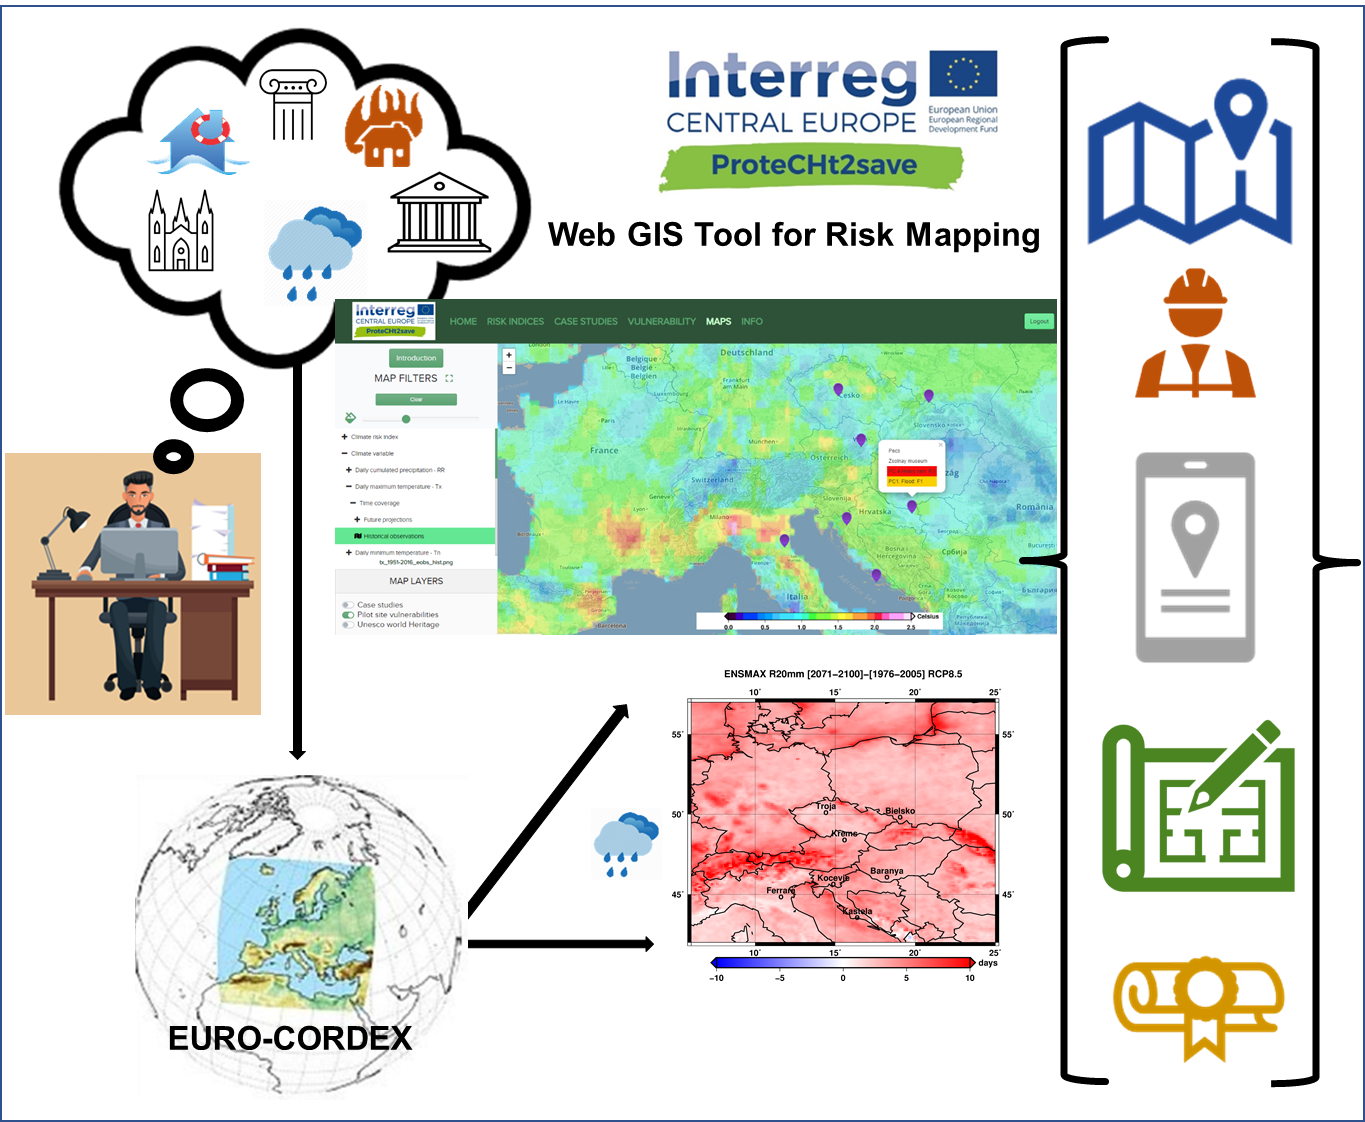
One of the major outputs is a Web GIS risk mapping tool used for the identification of risk-prone areas and vulnerable cultural heritage areas exposed to extreme events linked to climate change, particularly heavy rains, flood, and fire due to drought periods.
In ProteCHt2save, seven pilot heritage sites were selected to test the measures and strategies for protection of at-risk cultural heritage developed in the project. The pilot actions carried out were linked to climate change and the associated variability was linked to hydro-meteorological and climate extremes:
- (1)
Flood events in large basins (sites in the Czech Republic and Austria);
- (2)
Fire due to drought periods (site in Croatia);
- (3)
Extreme events of heavy rain (sites in Italy, Hungary, Croatia, Poland, and Slovenia).
The first pilot action targeted the testing of preparedness strategies for monumental complexes in historic city centers affected by flooding and heavy rain. The second stage of pilot actions tested evacuation plans as measures of emergency phases in museums in historic buildings facing sea flooding, fire due to drought, and heavy rain.
In this contribution, we illustrate the methodological approach followed for the map production integrated in the Web GIS tool, with particular reference to the climate modelling framework used and the climate extreme indices selected.
In addition, potential areas of increased risk of heavy rain regarding cultural heritage in Central Europe in the near and far future under two emission scenarios are discussed as examples of the potential use and outputs of the ProteCHt2save Web GIS tool.
It should be highlighted that while within the ProteCHt2save Project the major area of interest is Central Europe, this tool has been developed to allow end-users to assess the changes of climate extremes and their impacts on cultural heritage at the European and Mediterranean levels.
The provided maps turned out to be significant tools in support of policy and decision makers for the development of measures and strategies of preparedness, with short- and long-term perspectives aiming to protect cultural heritage, with possible applications to landscape protection, urban territorial planning, and emergency management in extreme changing environments.
2. Methodology for Heritage Climatology Mapping
2.1. Index Selection for Extreme Event Analysis
As a first step, we analyzed the changes in climate extremes, such as dry spells or intense precipitation, using indices to evaluate statistics of extreme events for temperature and precipitation and to compare them with observed extremes. In particular, we used standard indices defined by the Commission for Climatology/World Climate Research Programme/Technical Commission for Oceanography and Marine Meteorology (CCI/WCRP/JCOMM) Expert Team on Climate Change Detection Indices (ETCCDI), whose definition can be found on the Climdex Project web site [
13]. The index computation was performed in R using the standard climdex.pcic.ncdf library (
https://github.com/pacificclimate/climdex.pcic.ncdf), which includes a bootstrap procedure for the percentile-based indices according to Zhang et al. [
14].
For the mapping of heritage climatology in ProteCHt2save, we selected 5 extreme climate indices among the 27 standardized indices mentioned above. As shown in
Table 1, they are related to the following extreme events: heavy rain, flooding, drought, and extreme heating. These indices were selected to evaluate statistics of extreme events for temperature and precipitation and to compare them with observed extremes. In addition to the indices, daily precipitation and maximum and minimum temperature were also taken into consideration (
Table 2).
2.2. Climate Modelling
In this study, numerical climate model simulations were analyzed to study the possible future evolution of the climate system. In particular, an ensemble of global climate models (GCMs) driving an ensemble of regional climate models (RCMs) was used to provide regional projections for the European continent. Multi-model ensembles of regional climate projections were based on the WCRP Coordinated Regional Downscaling Experiment (CORDEX), considering the EURO-CORDEX initiative in particular, which provides regional climate projections for Europe at two different spatial resolutions, namely the “standard” resolution of 0.44 degrees (EUR-44, ~50 km) and a finer resolution of 0.11 degrees (EUR-11, ~12 km). Within the EURO-CORDEX experiment, seven RCMs were employed to dynamically downscale the Climate Model Intercomparison Project phase 5 (CMIP5) GCM projections using the CMIP5 Representative Concentration Pathways (RCPs) emission scenarios. When RCMs are driven by a large-scale global model, in addition to the uncertainties inherent in the specific RCM at hand, additional uncertainty is inherited from the driving GCM. In order to estimate this type of uncertainty, a common approach is to consider an ensemble of simulations performed with a given RCM driven by different GCMs. The spread among the RCM outputs provides an estimate of the effects of GCM diversity on the RCM simulations.
Within ProteCHt2save, the Euro-CORDEX simulations at 0.11° resolution were selected among those available [
15].
In this study, 12 different combinations of 6 global models driving 5 regional models were taken into account to elaborate the maps related to the future projections (see
Table 3).
Two future emission scenarios, described in detail in the latest Intergovernmental Panel on Climate Change (IPCC) assessment report (AR5) [
16], were chosen:
RCP 4.5 is a stabilization scenario in which anthropogenic radiative forcing is stabilized at 4.5 W/m
2 after year 2100, without overshooting the long-run radiative forcing target level [
17];
RCP 8.5 is a high pathway scenario characterized by increasing greenhouse gas emissions over time, for which anthropogenic radiative forcing reaches 8.5 W/m
2 at year 2100 and continues to rise for some time. This is also known as the “business as usual” scenario [
18].
2.3. Future Projections and Historical Changes
RCM historical and projection simulations were analyzed to calculate anomalies; that is, changes of future climatologies with respect to past conditions. The historical model period taken into account was 1976–2005. Long-term climatologies around the mid-21st century (e.g., 2021–2050) and end of century (e.g., 2071–2100) were considered. In addition, historical observations for the 30-year-periods of 1987–2016 and 1951–1980 were analyzed using E-OBS, a state-of-the-art observational dataset based on the interpolation of in situ station data available for the European domain, which is a robust and widely used dataset that is regularly updated, with a spatial resolution of 25 × 25 km [
19]. E-OBS provides long-term daily precipitation and near-surface air temperature climatology data (from 1950 to present); its spatial coverage includes all land areas in Europe and in the Mediterranean region. It is supported by a clear documentation of the methods used to derive it (interpolation techniques, underlying stations, etc.), and the underlying orography (elevation data) and individual station data are available as well.
3. Results and Discussion
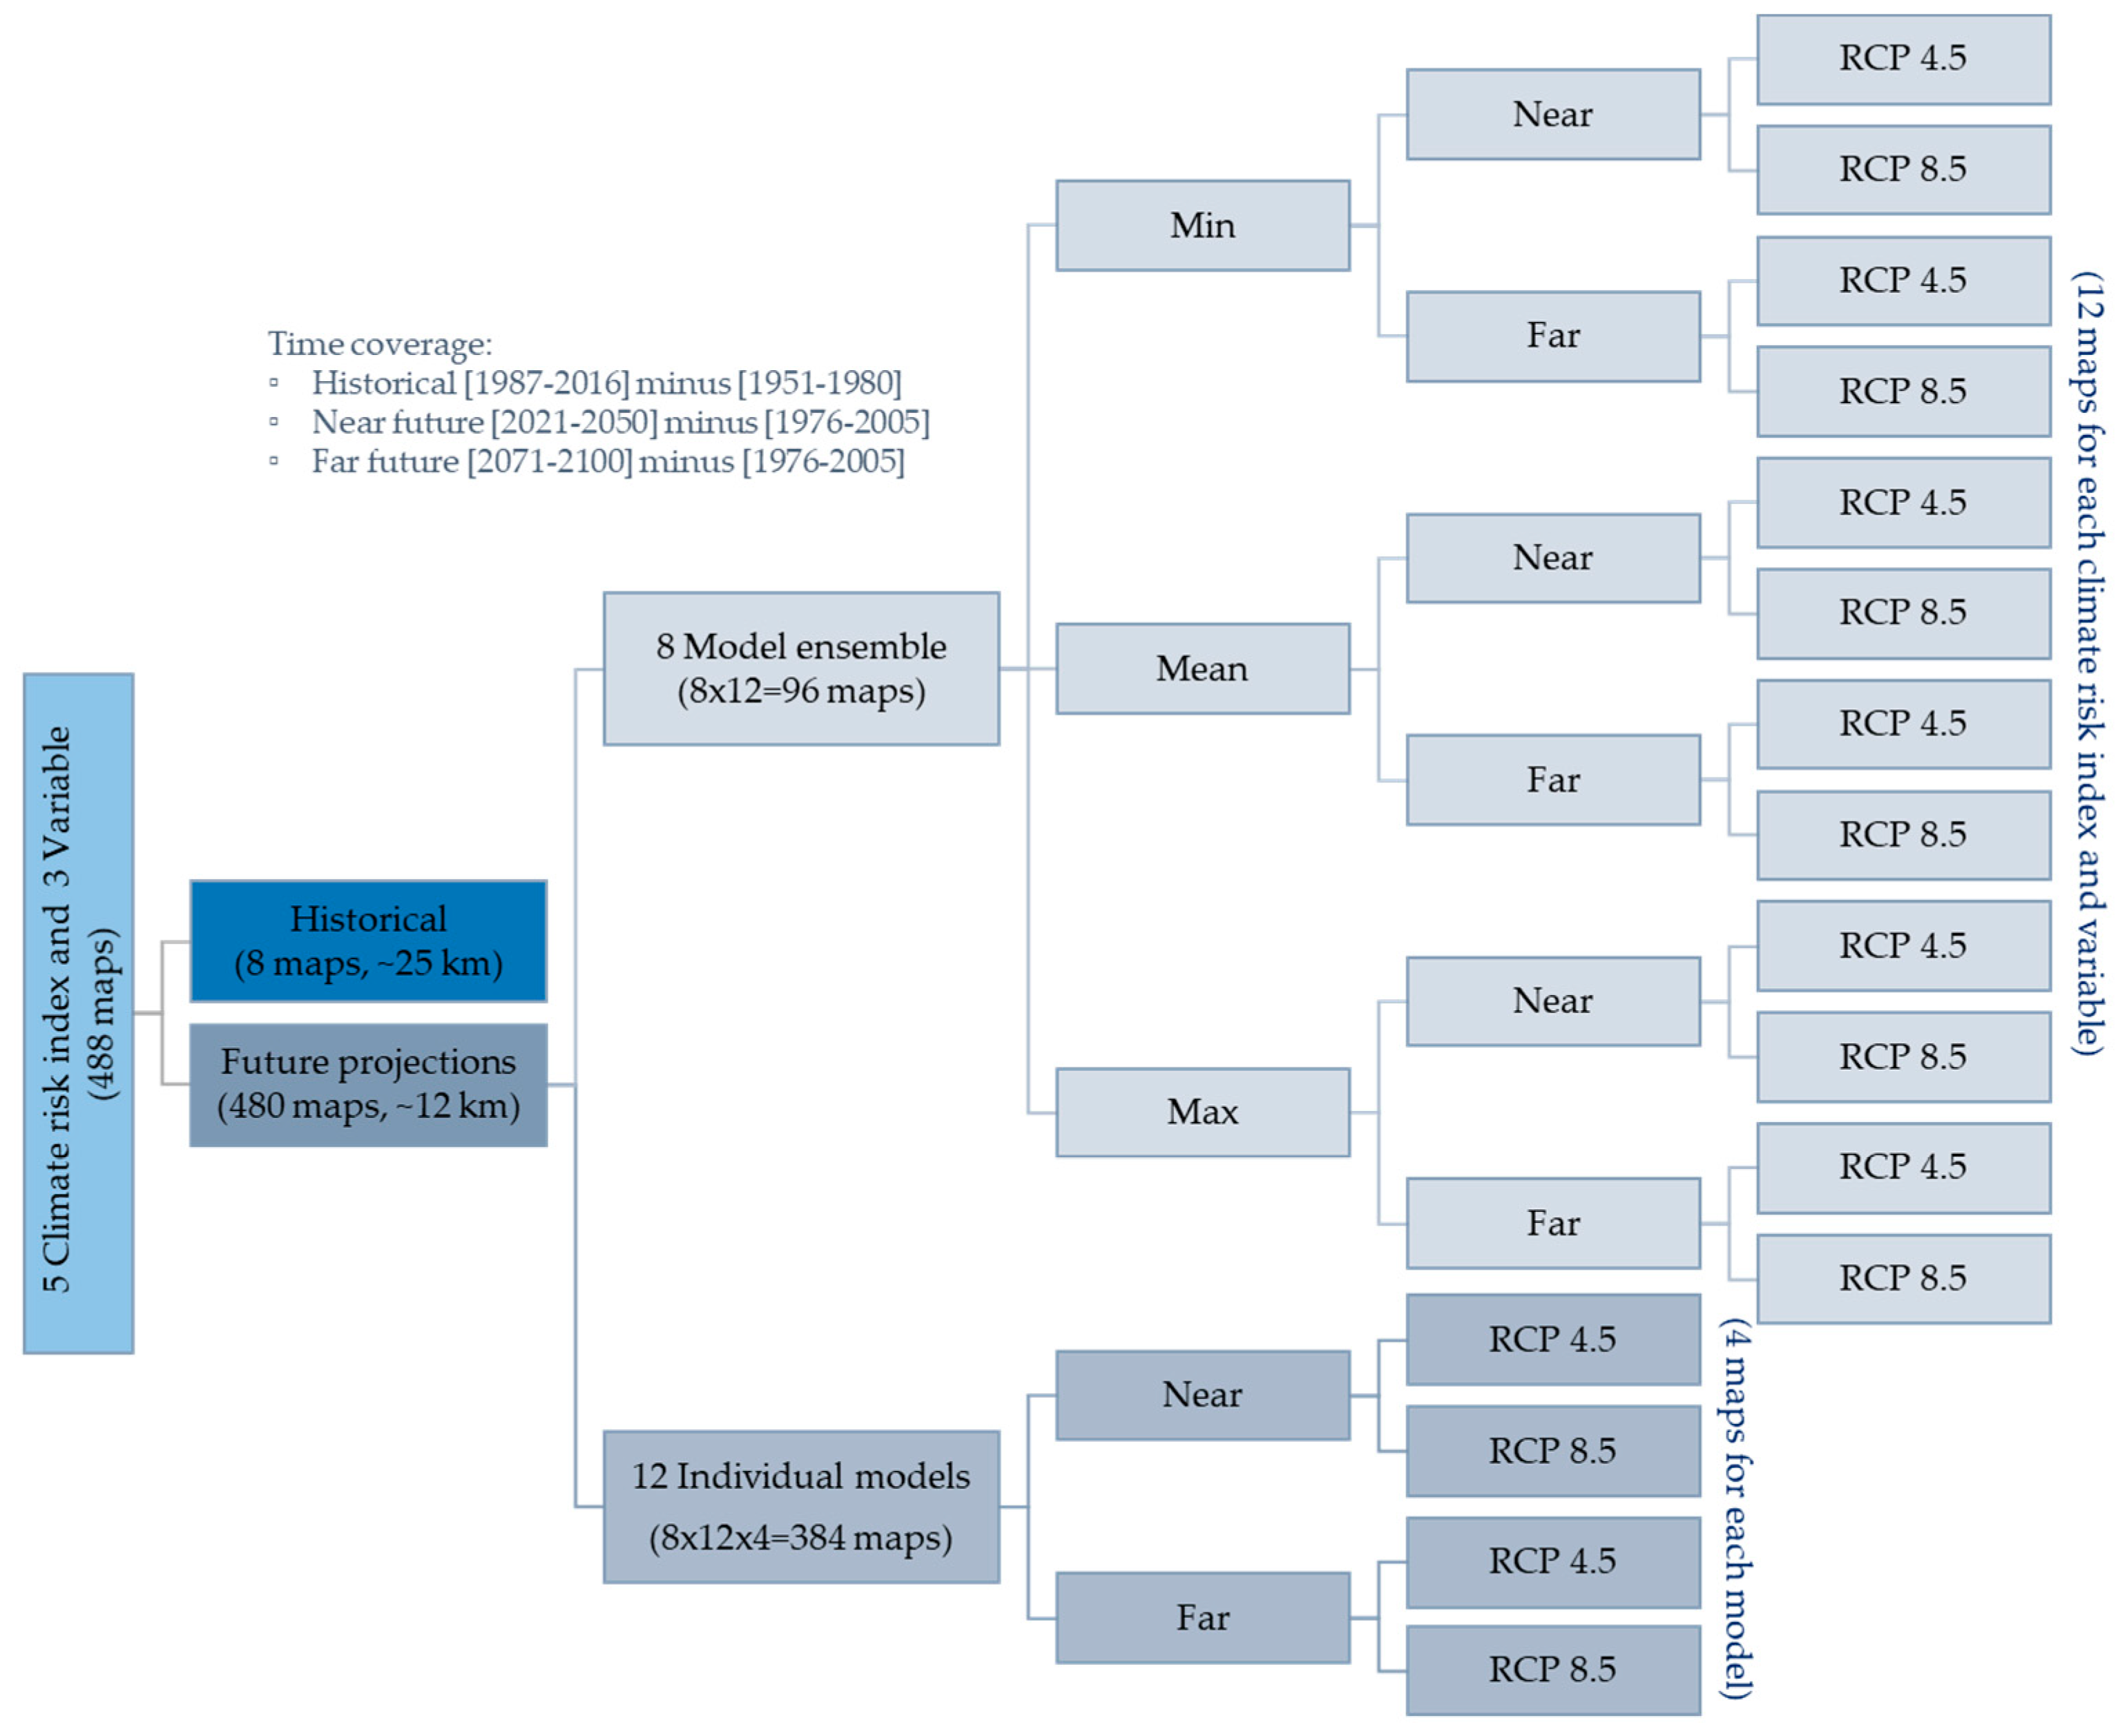
Hazard maps referring to heavy rain, flooding, drought, and extreme heat were elaborated covering the European and Mediterranean areas on the basis of data from the selected combination of models, specifically:
For each of the 5 climate extreme indices and for the 3 climate variables, the past changes were calculated as the difference between the period 1987–2016 and the period 1951–1980, using E-OBS (spatial resolution 25 × 25 km), while future changes were calculated as the difference between the period 2021–2050 and the period 1976–2005 (near future projection) and as the difference between the period 2071–2100 and the period 1976–2005 (far future projection), under both RCP 4.5 and 8.5 scenarios (spatial resolution 12 × 12 km).
A total of 8 maps with historical observations were elaborated, while 4 maps were produced for each combination of models, leading to 36 maps for each of the climate extreme indices and variables considered. As final result, a total of 384 maps related to future climate simulations were produced by individual model projections.
Being aware that each individual GCM/RCM model has its own uncertainties, we kept the entire ensemble and considered all members and their statistics, in particular calculating the minimum, mean, and maximum values of the model ensemble, creating a further 96 maps (
Figure 1) [
20,
21].
This process was also performed in order to provide a useful tool for non-specialized users in climate modelling and to meet the requirements of public authorities, territorial agencies, and policy and decision makers involved in the management of at-risk cultural heritage and urban territorial planning.
All maps reported the position of the ProteCHt2save pilot sites: Troja (Czech Republic), Krems (Austria), Bielsko (Poland), Pecs (Hungary), Kocevje (Slovenia), Ferrara (Italy), and Kastela (Croatia). The maps could include further heritage sites located in Europe and in the Mediterranean Basin, and can be interactively visualized and downloaded in the ProteCHt2save Web GIS tool for the risk mapping described in
Section 3.1.
In this paper, the maps realized at the Central European scale for heavy rain using the R20mm climate extreme index are illustrated and discussed as an example of the products available within the Web GIS tool and its usefulness and potential applicability for at-risk cultural heritage management.
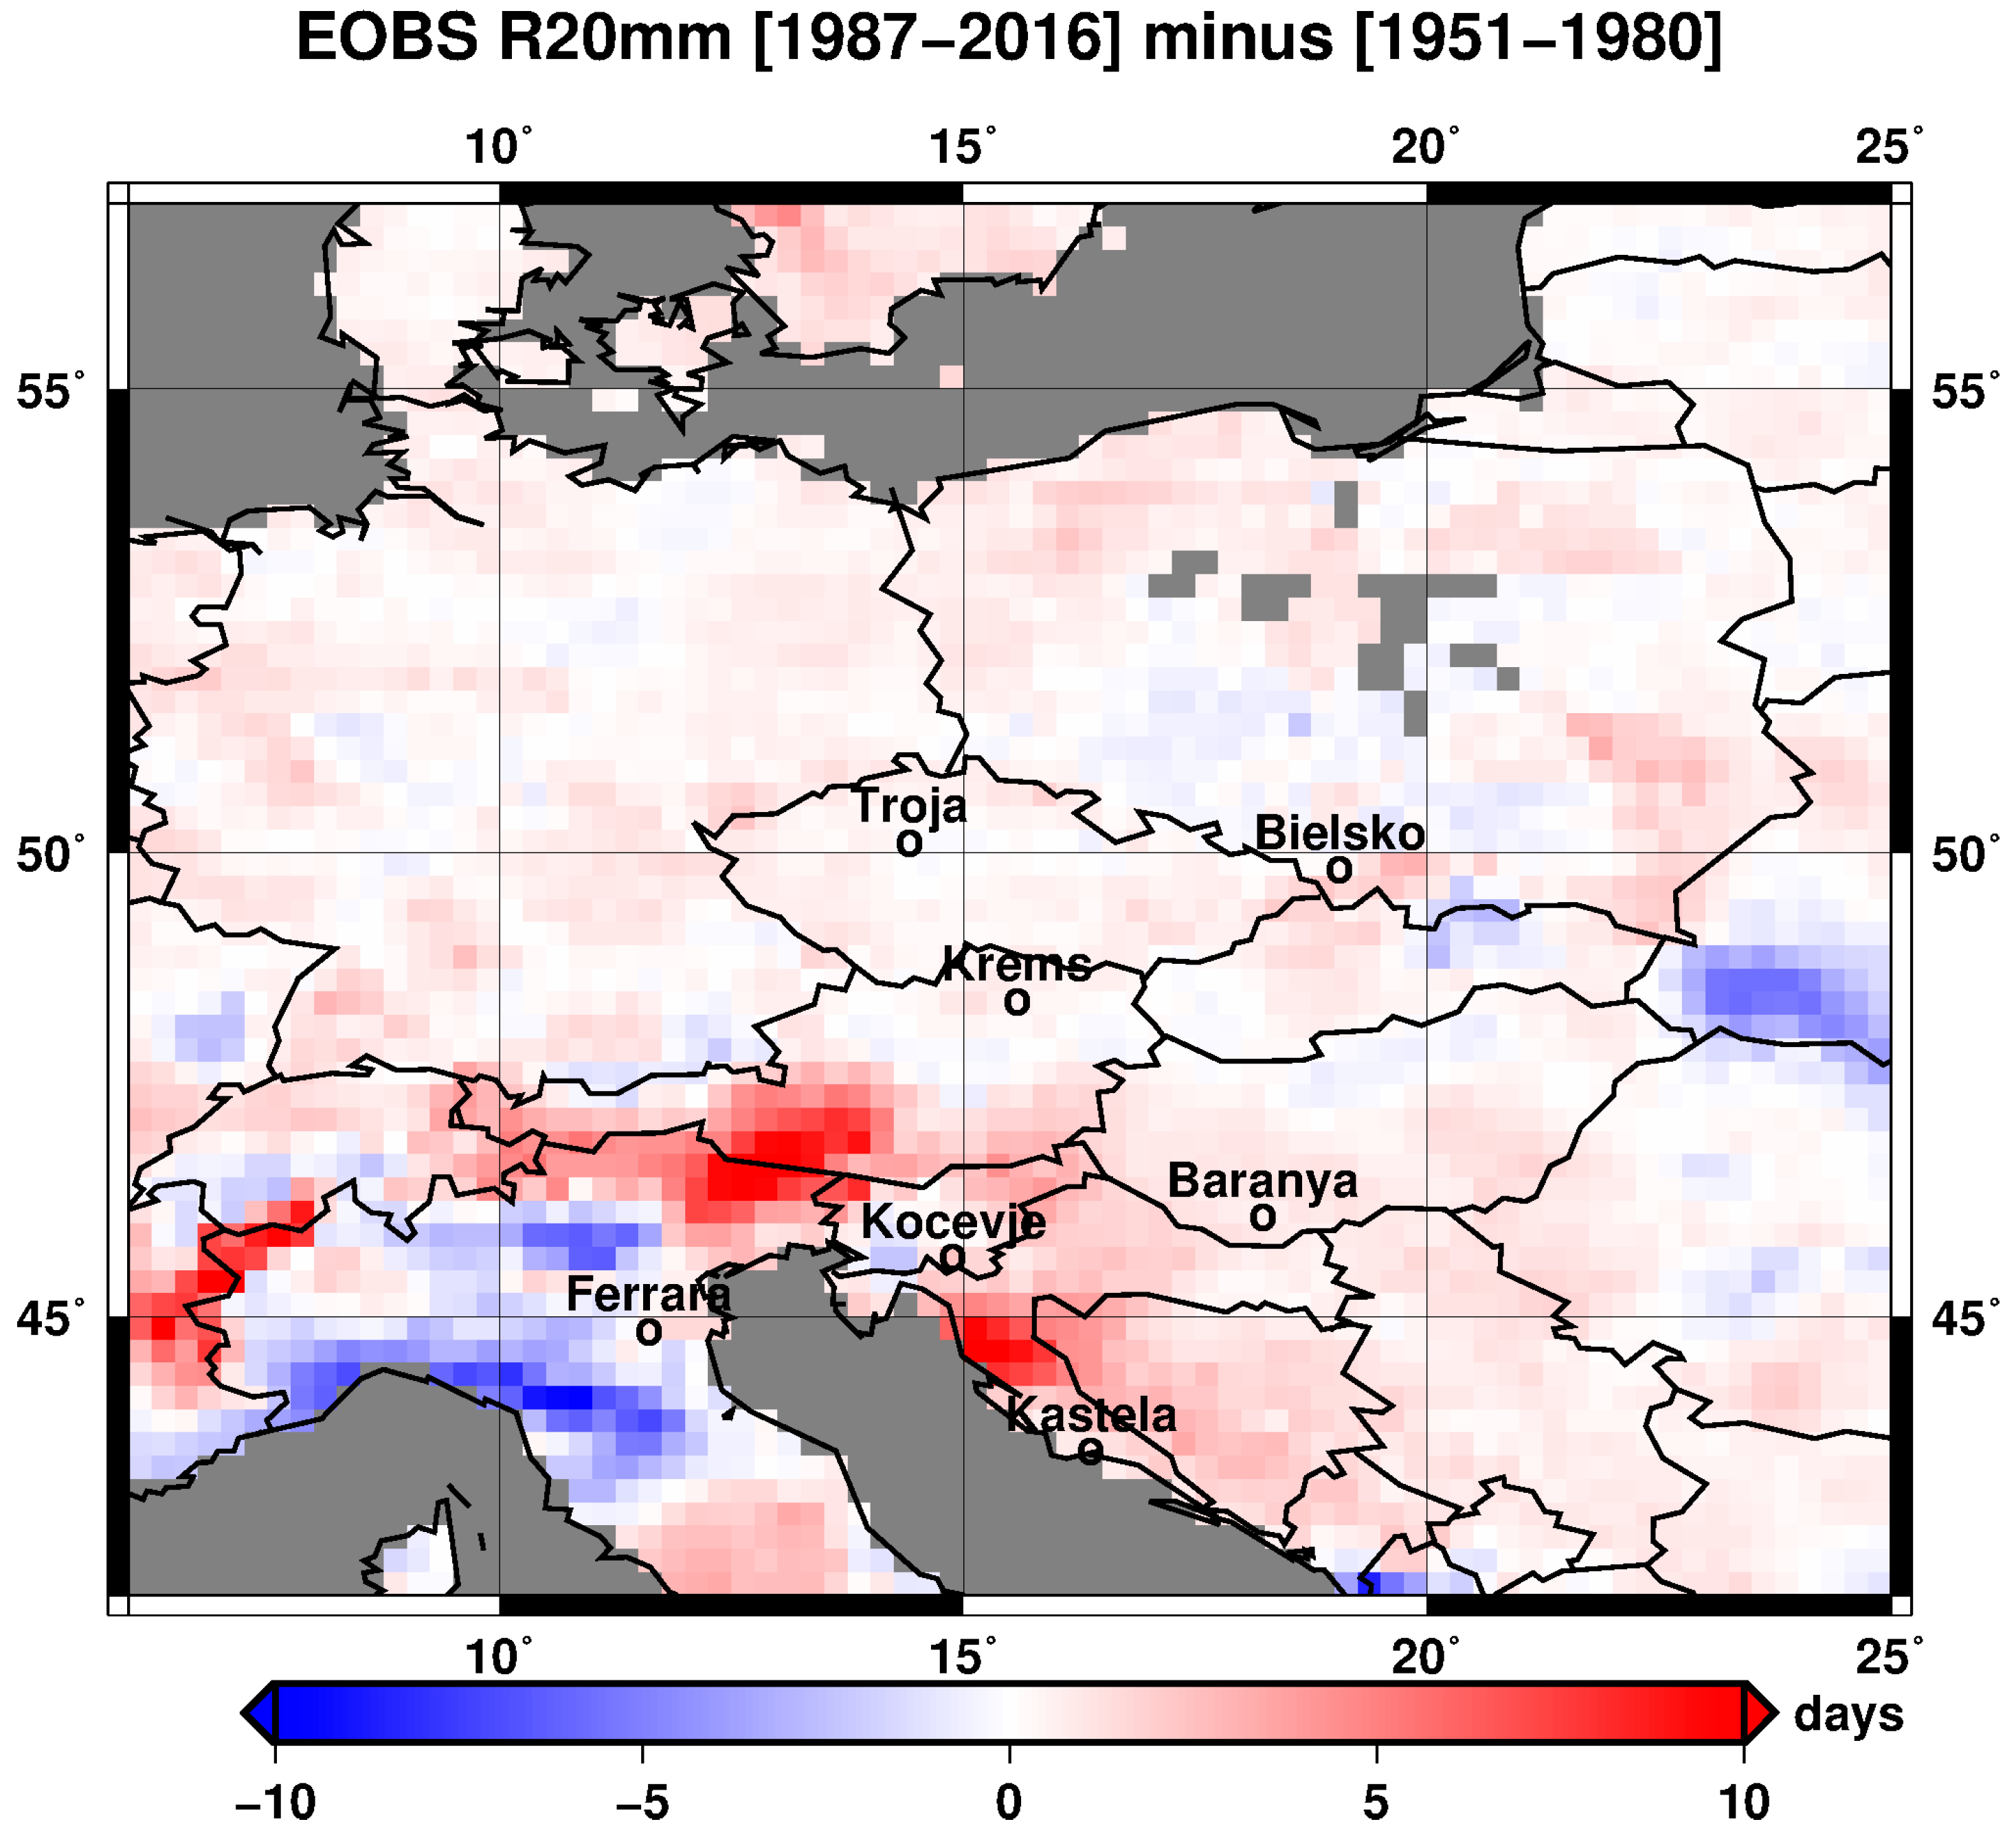
Figure 2 shows the changes of the R20mm index in the past between the 30 year periods 1987–2016 and 1951–1980 by using the E-OBS observational dataset. The map shows that the major changes occur on the Croatian coast of the Adriatic Sea; in the mountain areas at the borders between Italy with Austria and France, with the maximum increase observed >10 days (red); and in Northern Italy, reaching values no greater than 10 days (blue).
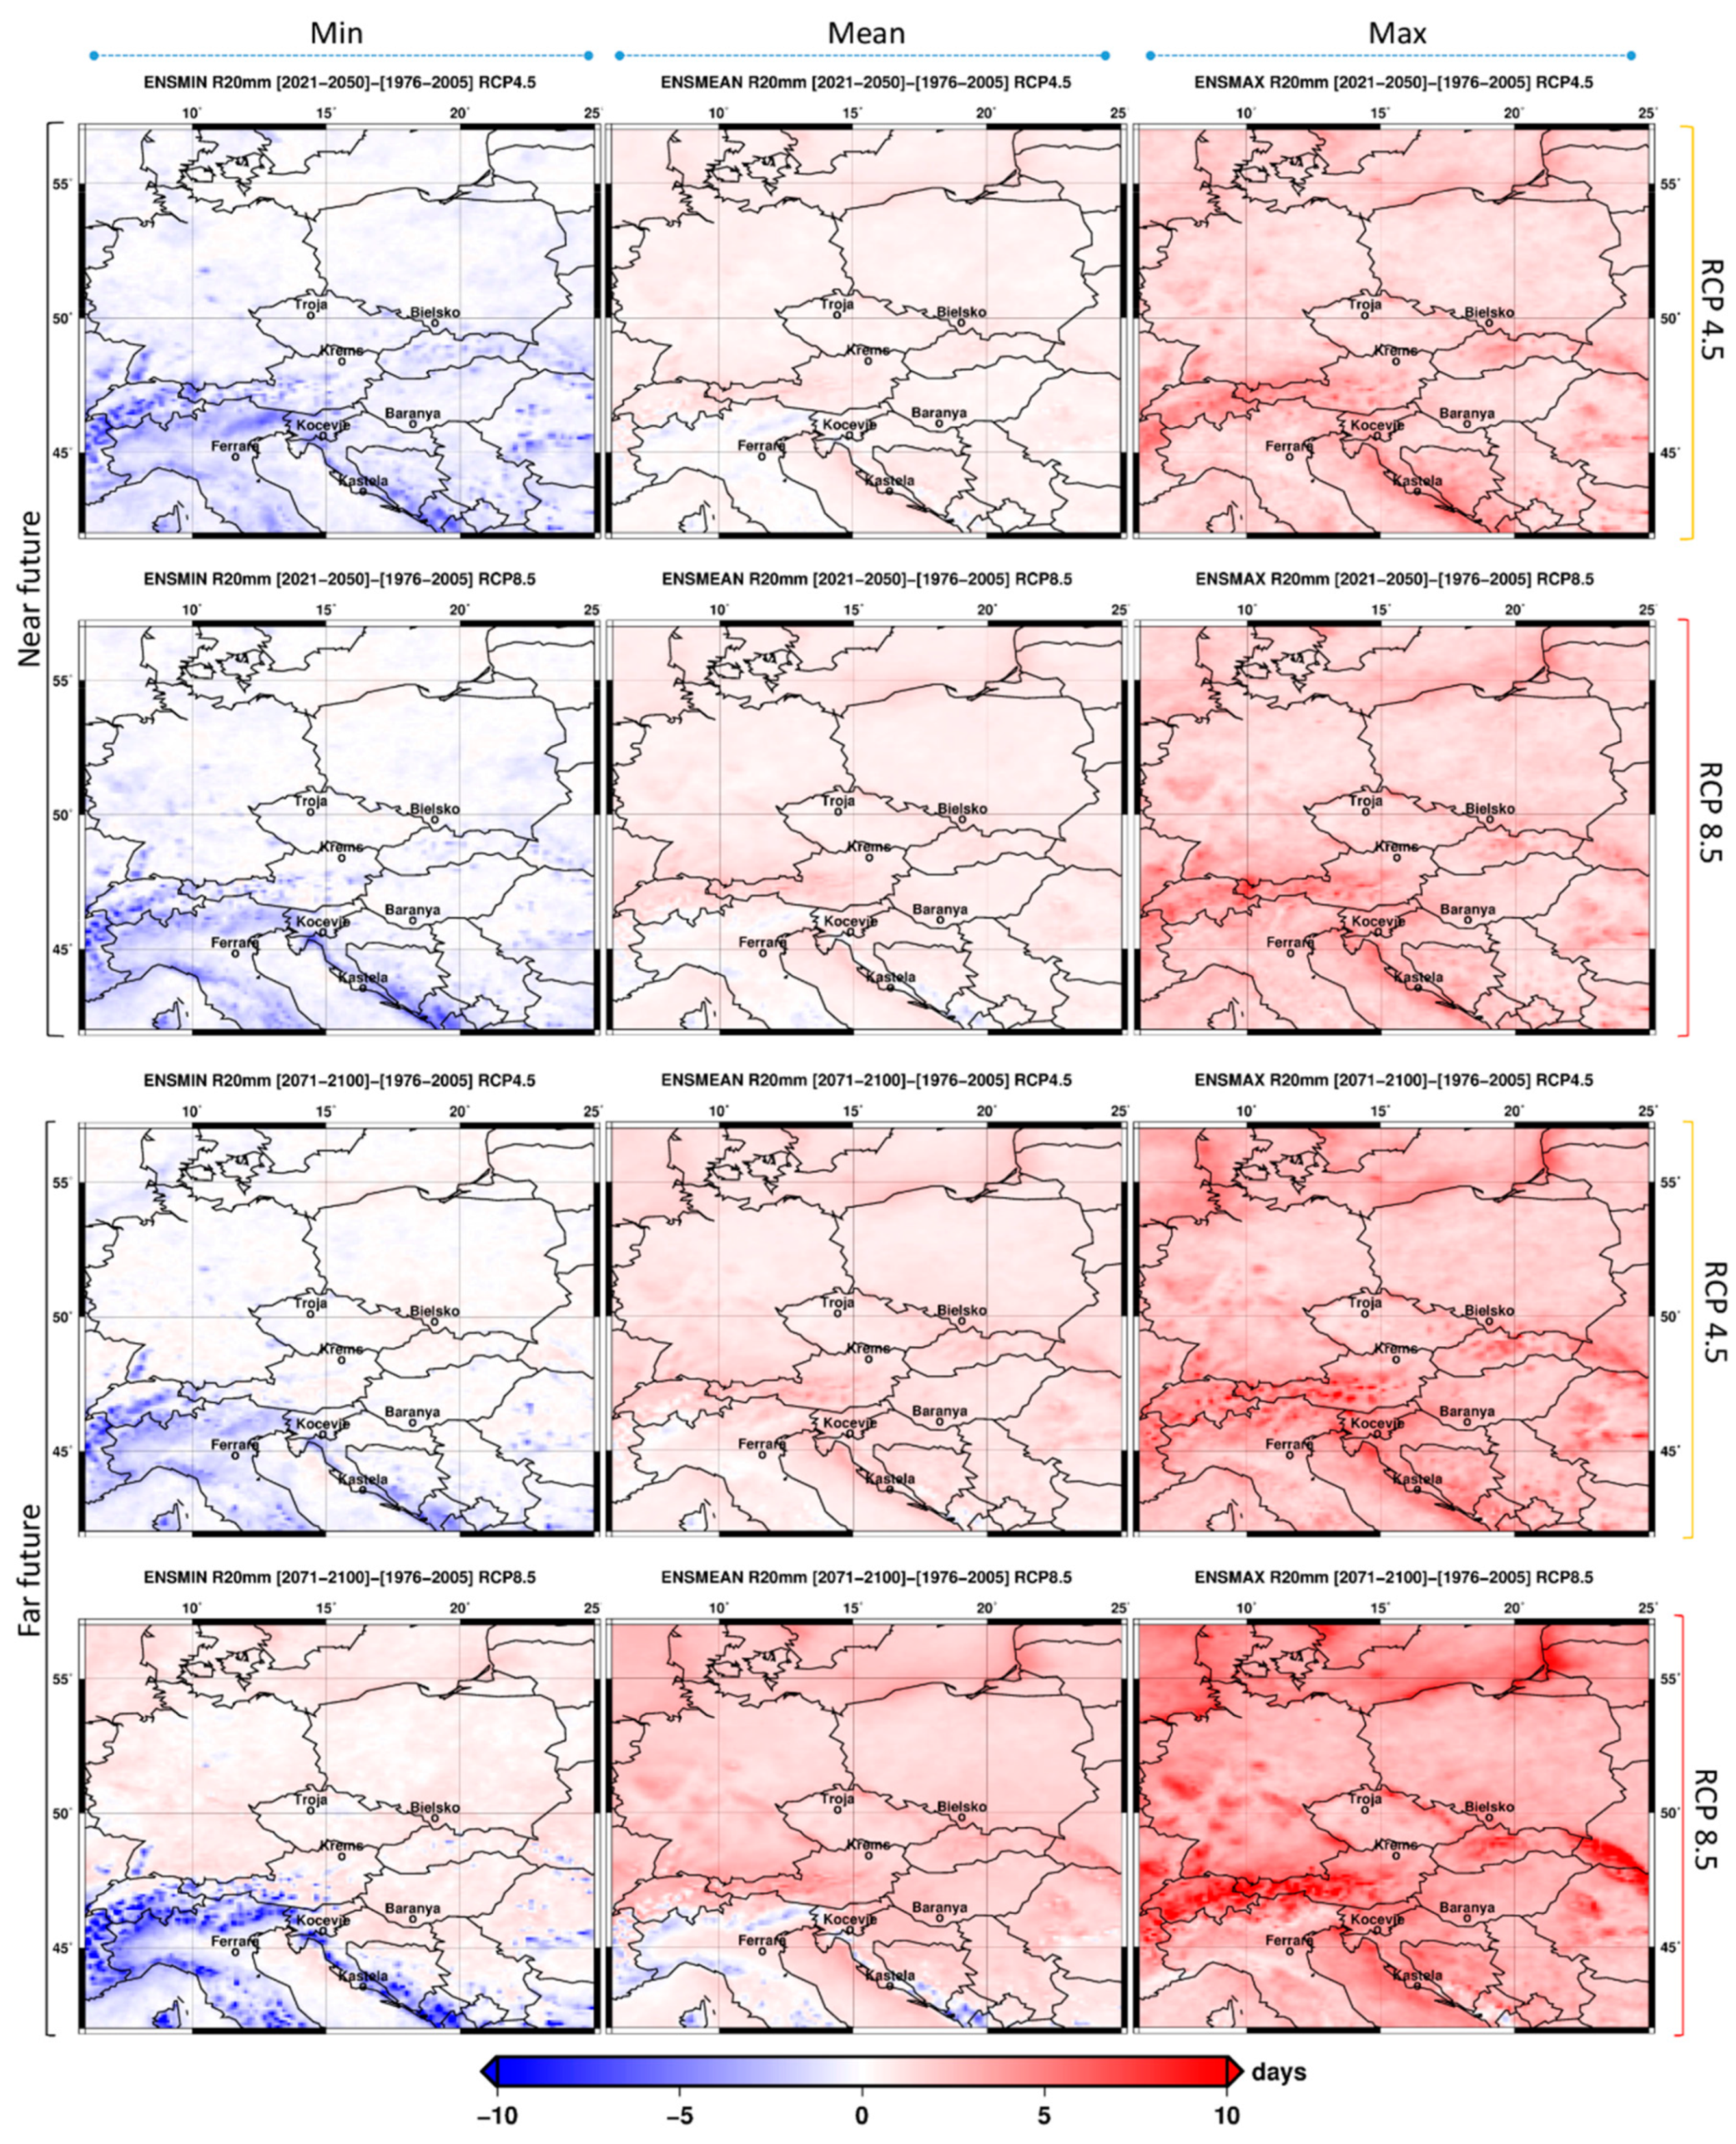
A complete set of maps derived from the model ensemble statistics (minimum, mean, and maximum of the ensemble in the left, middle, and right columns, respectively) for the future changes in the R20mm climate extreme index is shown in
Figure 3. Firstly, the analysis highlights that the model spread is huge, with both negative (as shown by the ensemble minimum output) and positive (as shown by the ensemble maximum output) projected changes. In general, the coastal area of the Adriatic Sea, Northern Italy, and the Alps will continue to experience the highest variations. It should also be noted that major variations are always foreseen in the far future (2071–2100) under the pessimistic scenario (RCP 8.5). Observing the ensemble mean projection for the far future in the pessimistic scenario, a general increase is foreseen for almost all of Central Europe, with the exception of the East Coast of the Adriatic Sea and Northern Italy. It should be pointed out that for an exhaustive assessment of the potential threats, an evaluation of the results from the multi-model ensemble statistics taking into consideration the mean value and its spread should be performed, and in the case of significant differences among the individual models, a deeper analysis that considers all single models beyond the ensemble statistics is recommended, in addition to an evaluation of the data and their variations in the specific area of interest [
21].
With respect to the previous applications, the use of 12 combinations of GCM/RCM models achieving a resolution of 0.11° (EUR-11, ~12 km) undoubtedly constitutes an advancement in the research on the evaluation of climate change impacts on cultural heritage.
3.1. Significance of Changes for Cultural Heritage
Research conducted up to now on the climate change impact on cultural heritage has clearly demonstrated that water-derived parameters are driving factors, being involved in several deterioration processes, such as structural damage and erosion in the case of extreme rain events; surface recession on carbonate stones due to chemical dissolution; decohesion and fracturing in the case of salt crystallization; and freeze–thaw cycling and biological accumulation [
22,
23]. Events of very heavy precipitations days (here studied using the R20mm ETCCDI index) are widely recognized to constitute a major threat to building structures, particularly vernacular architecture, and to be the cause of pluvial flooding [
1]. The type and magnitude of damage created on a building by climate change depends on the building material and its state of conservation, on the surrounding urban or rural landscape, and on the geometry of the building, which is essential in determining the degree of exposure of architectural surfaces to (and shelter from) climate parameters, such as rain, wind, and solar radiation [
24,
25]. Building materials are differentially susceptible to damage processes imposed by climate change, which include stone, mortar, and brick. Chemical composition and porosity, with the associated texture and surface roughness, are recognized as crucial geological controls on weathering [
26]. In the specific case of events of heavy rain, erosion and loss of materials are major effects for stones, while swelling and shrinkage due to moisture gradients can easily occur on wood, with associated biodeterioration [
27]. Physical features of the heritage site under pressure are of paramount importance in determining the vulnerability to climate change; therefore, an exhaustive assessment of the risk cannot disregard an analysis of the existing criticalities at the building level, where managerial issues also have to be taken into consideration.
The work done in this perspective for the ProteCHt2save pilot sites is available in the Web GIS tool, where physical and managerial criticalities are highlighted for each case study. The setup of the methodology for vulnerability ranking of different categories of cultural heritage, such as monumental complexes, archaeological, and natural sites, was one of the major activities in ProteCHt2save and is the focus of the recently funded Interreg Central Europe Project STRENCH (STRENgthening resilience of Cultural Heritage at risk in a changing environment through proactive transnational cooperation) This project will capitalize on and further implement the Web GIS tool developed in ProteCH2save, in addition to the outputs produced in H2020 HERACLES and in the Interreg Central Projects BhENEFIT (Built heritage, Energy and Environmental Friendly Integrated Tools), RUINS (Sustainable reuse, preservation and modern management of historical ruins), and HiCAPS (Historical Castle ParkS). This approach will allow us to identify risk-prone areas of cultural heritage exposed to extreme climate events, as a function of exposure, vulnerability, and hazard for different heritage categories.
3.2. Web GIS Tool
A Web GIS Tool for risk mapping was designed and implemented in order to:
- (1)
create an online platform that visualizes in an interactive way all the climate risk maps produced, as described in the previous section;
- (2)
support policy and decision makers in the identification of risk areas and vulnerabilities for cultural heritage in Europe and in the Mediterranean Basin, exposed to extreme events linked to climate change.
The GIS platform was designed in order to provide user-friendly graphical interfaces published on a website (Web GIS) to meet and satisfy the needs of a large number of users.
The need to visualize and obtain geocoded cartographic data online led us to create a tool that can publish and make information available on the web. Therefore, a Web GIS tool was designed and open source applications and cartographic bases were chosen for its implementation.
In particular, the system architecture comprises:
The website of the “ProteCHt2save Web GIS Tool for Risk Mapping” [
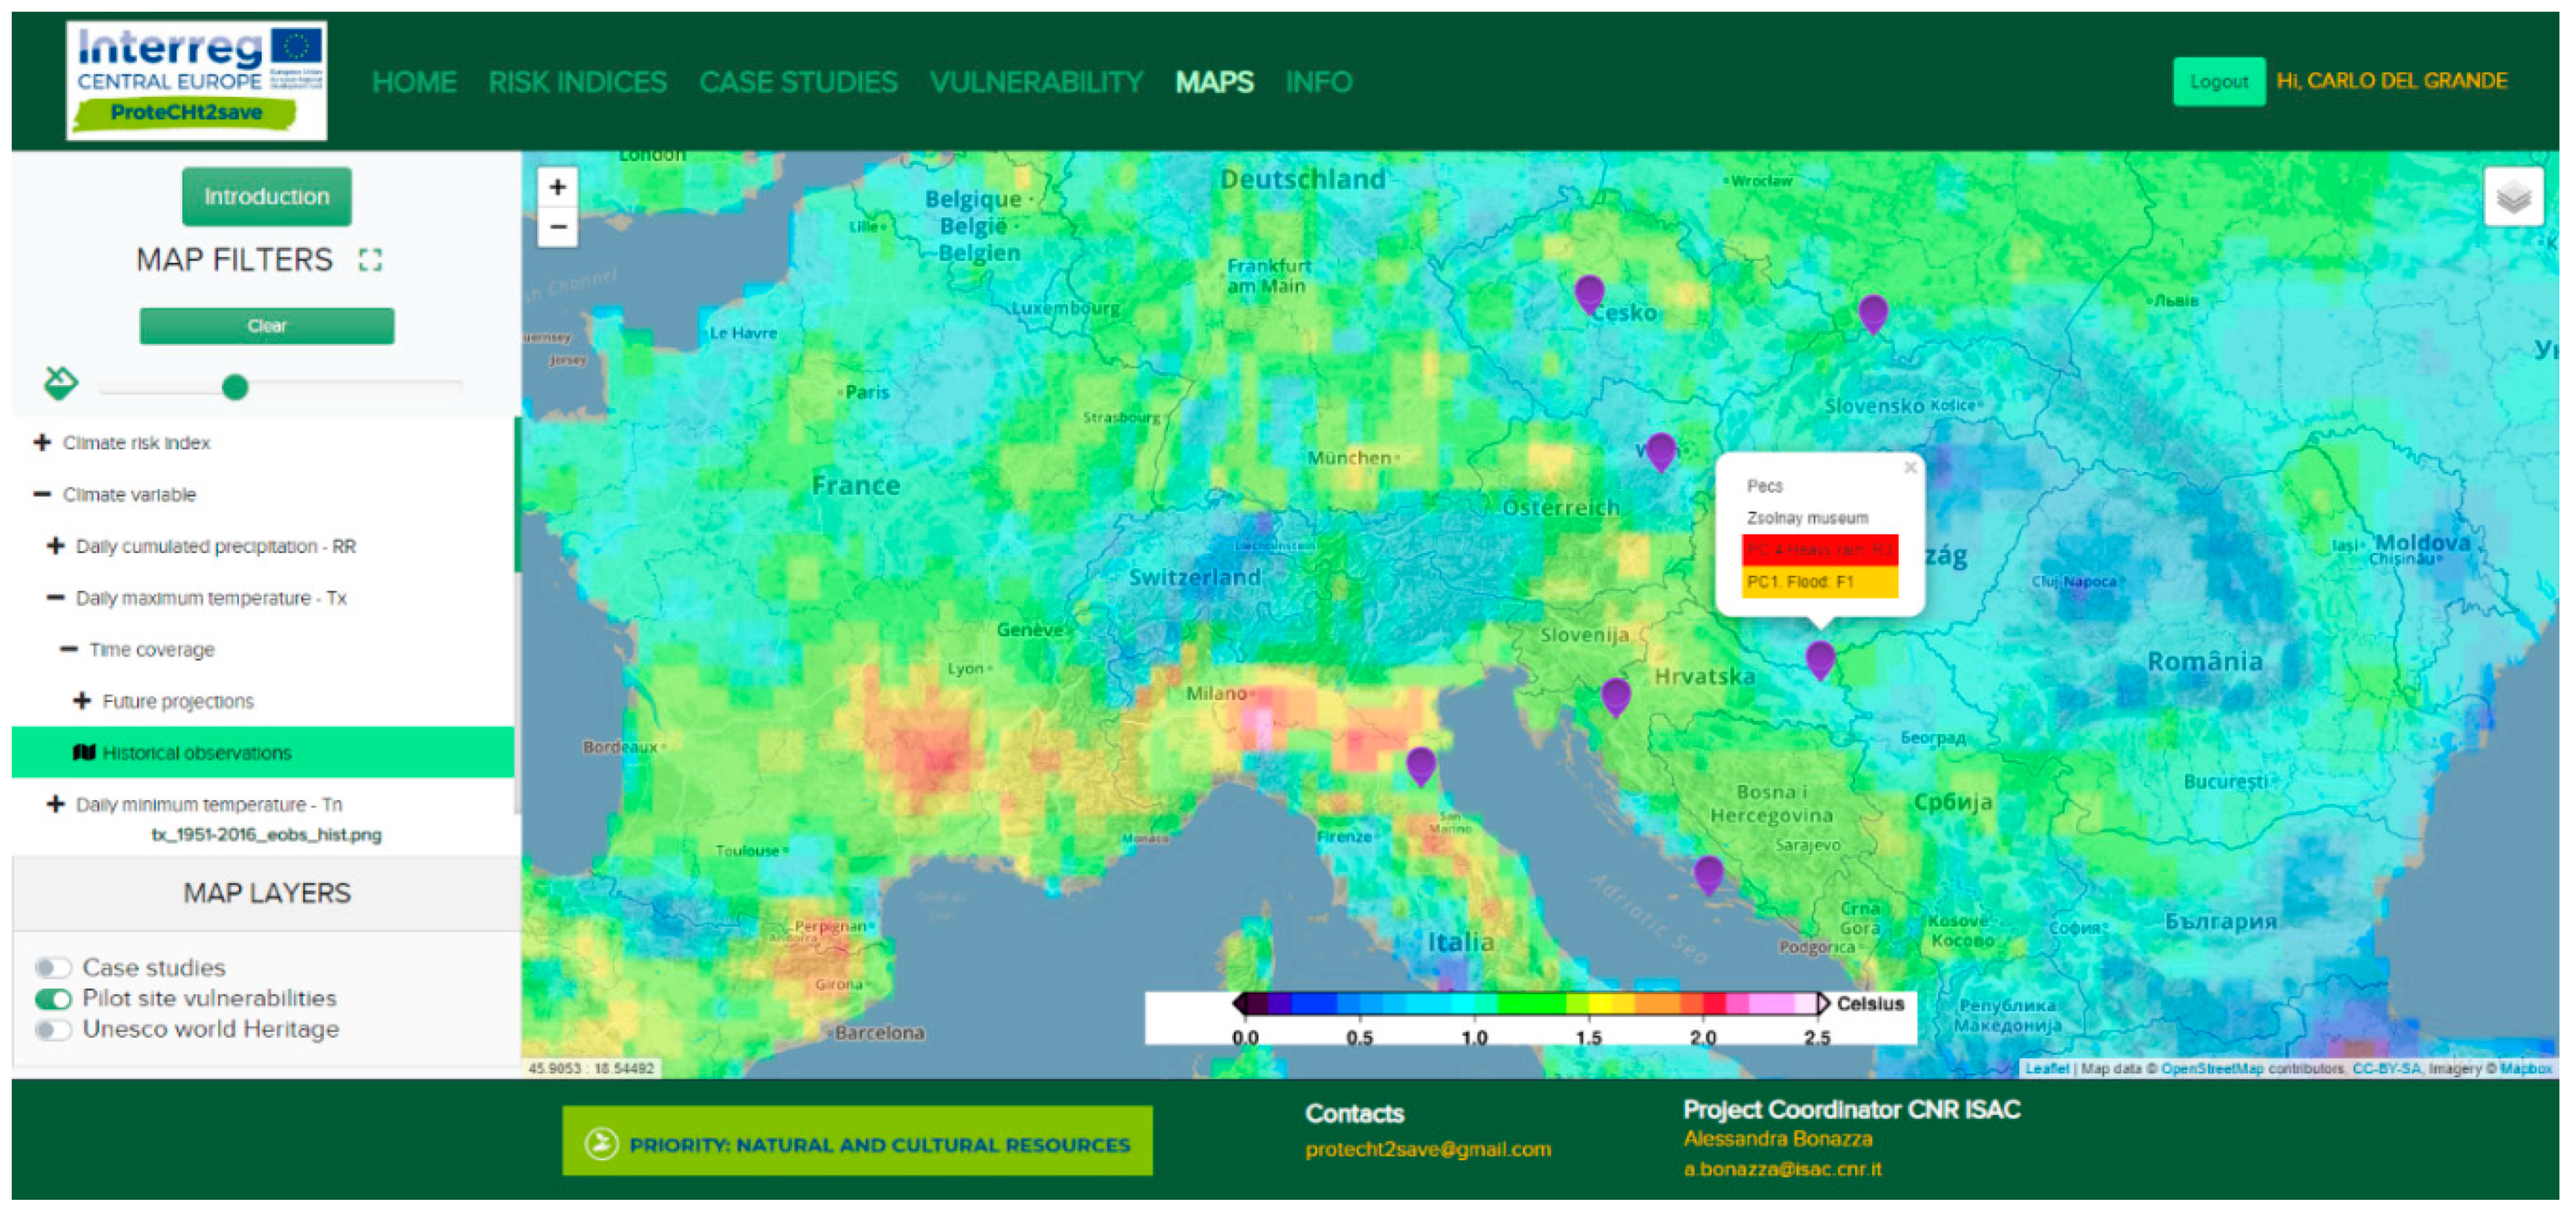
28], which we developed, is composed of 6 pages, including explanations on the utilized climate models, climate extreme indices, and variables; and illustrations cards for the pilot sites with major information on the features of the monuments and historic buildings taken into consideration, their state of conservation, past disasters that occurred in the area, and measures undertaken for protection (
Figure 4). A special focus on the methodology followed to determine the criticalities and rank the vulnerability of each site is also given and a section is completely dedicated to the map creation. Maps related to historical observations and climate projections can be produced by selecting all combinations of individual models and ensemble statistics described in the present contribution. The location of the ProteCHt2save pilot sites can be visualized in addition to the distribution of the UNESCO World Heritage Sites in Central Europe, thanks to the collaboration with the Project Joint Programming Initiatives on Cultural Heritage—Protection of European Cultural Heritage from Geo-hazards (JPI-CH-PROTHEGO) (2015–2018). The tool is accessible at
https://www.protecht2save-wgt.eu/.
4. Conclusions
In this contribution, a methodological approach for the assessment of the potential impacts of climate extreme events (heavy rain, flooding, and drought) on cultural heritage is illustrated. Maps of risk-prone areas in Europe and in the Mediterranean Basin have been elaborated by an accurate selection and analysis of climate variables (Tn, Tx, RR) and climate extreme (standard) indices (R20mm, R95pTOT, Rx5day, CCD, Tx90p).
Maps are available to users via an interactive Web GIS tool, which provides evaluations based on historical observations (E-OBS) and climate projections (near and far future); it is possible to select a series of combinations of individual models and ensembles statistics with a spatial resolution of 12 × 12 km, under RCP 4.5 and RCP 8.5 scenarios.
This tool was conceived and designed in order to contribute to still-existing gaps in knowledge on climate change impacts on cultural heritage by increasing the spatial resolution of the projections as much as possible and by providing insights into the formulation of risk expression by considering the exposure determined by the areal distribution of heritage assets and by laying the foundations for the development of a methodology of vulnerability ranking. A user-driven approach is at the base of all the procedures and the system is open to further implementation and data integration in order to support policy and decision makers in the management of at-risk cultural heritage, in addition to further applications, such as urban territorial planning and landscape protection.
Author Contributions
Conceptualization, A.B. and A.S.; methodology, A.S., E.P., J.v.H., and C.D.G.; software, C.D.G.; formal analysis, A.S., E.P., and J.v.H.; investigation, A.S., C.D.G., P.D.N., and A.B.; resources, A.B., E.P., and J.v.H.; data curation, A.S., E.P., and J.v.H.; writing—original draft preparation, A.S. and A.B.; writing—review and editing, A.B., A.S., E.P., J.v.H., C.D.G., P.D.N., and C.S.; visualization, A.S. and P.D.N.; supervision, A.B.; project administration, A.B.; funding acquisition, A.B. All authors have read and agreed to the published version of the manuscript.
Funding
This research was funded by Interreg Central Europe Programme, grant number CE1127. Within the “Risk Assessment and Sustainable Protection of Cultural Heritage in Changing Environments, ProteCHt2save” project.
Acknowledgments
Authors wish to thank the team members from Partners Institutions of ProteCHt2save Consortium for their fruitful collaboration and support in the project implementation activities.
Conflicts of Interest
The authors declare no conflict of interest.
References
- Sabbioni, C.; Brimblecombe, P.; Cassar, M. Atlas of Climate Change Impact on European Cultural Heritage; Anthem Press: London, UK, 2010; p. 160. ISBN 978927909800-0. [Google Scholar]
- Bonazza, A.; Messina, P.; Sabbioni, C.; Grossi, C.M.; Brimblecombe, P. Mapping the impact of climate change on surface recession of carbonate buildings in Europe. Sci. Total Environ. 2009, 407, 2039–2050. [Google Scholar] [CrossRef] [PubMed]
- Bonazza, A.; Sabbioni, C.; Messina, P.; Guaraldi, C.; De Nuntiis, P. Climate change impact: Mapping thermal stress on Carrara marble in Europe. Sci. Total Environ. 2009, 407, 4506–4512. [Google Scholar] [CrossRef]
- Gomez-Bolea, A.; Llop, E.; Arino, X.; Saiz-Jimenez, C.; Bonazza, A.; Messina, P.; Sabbioni, C. Mapping the impact of climate change on biomass accumulation on stone. J. Cult. Herit. 2012, 13, 254–258. [Google Scholar] [CrossRef]
- Ciantelli, C.; Palazzi, E.; Von Hardenberg, J.; Vaccaro, C.; Tittarelli, F.; Bonazza, A. How can climate change affect the UNESCO cultural heritage sites in Panama? Geosciences 2018, 8, 296. [Google Scholar] [CrossRef] [Green Version]
- Sesana, E.; Gagno, A.S.; Bonazza, A.; Hughes, J.J. An integrated approach for assessing the vulnerability of World Heritage Sites to climate change impacts. J. Cult. Herit. 2020, 41, 221–224. [Google Scholar] [CrossRef]
- Hujibregts, Z.; Kramer, R.P.; Martens, M.H.J.; van Schijndel, A.W.M.; Schellen, H.L. A proposed method to assess the damage risk of future climate change to museum objects in historic buildings. Build. Environ. 2012, 55, 43–56. [Google Scholar] [CrossRef]
- Kramer, R.; van Schijndel, J.; Schellen, H. Inverse modeling of simplified hygrothermal building models to predict and characterize indoor climates. Build. Environ. 2013, 68, 87–99. [Google Scholar] [CrossRef]
- Leissner, J.; Kilian, R.; Kotova, L.; Jacob, D.; Mikolajewicz, U.; Broström, T.; Ashley-Smith, J.; Schellen, H.; Martens, M.; van Schijndel, J.; et al. Climate for Culture: Assessing the impact of climate change on the future indoor climate in historic buildings using simulations. Herit. Sci. 2015, 3, 38–52. [Google Scholar] [CrossRef]
- Jacob, D.; Elizalde, A.; Haensler, A.; Hagemann, S.; Kumar, P.; Podzun, R.; Rechid, D.; Remedio, A.R.; Saeed, F.; Sieck, K.; et al. Assessing the transferability of the regional climate model REMO to different coordinated regional climate downscaling experiment (CORDEX) regions. Atmosphere 2012, 3, 181–199. [Google Scholar] [CrossRef] [Green Version]
- Padeletti, G.; HERACLES Consortium Staff. Heritage Resilience Against Climate Events on Site—HERACLES Project: Mission and Vision. In Transdisciplinary Multispectral Modeling and Cooperation for the Preservation of Cultural Heritage. TMM_CH 2018. Communications in Computer and Information Science; Moropoulou, A., Korres, M., Georgopoulos, A., Spyrakos, C., Mouzakis, C., Eds.; Springer: Cham, Switzerland, 2020; Volume 961, pp. 360–375. ISBN 978-3-030-12956-9. [Google Scholar] [CrossRef]
- Bonazza, A.; Maxwell, I.; Drdácký, M.; Vintzileou, E.; Hanus, C.; Ciantelli, C.; De Nuntiis, P.; Oikonomopoulou, E.; Nikolopoulou, V.; Pospíšil, S.; et al. Safeguarding Cultural Heritage from Natural and Man-Made Disasters a Comparative Analysis of Risk Management in the EU; European Union: Brussels, Belgium, 2018; p. 207. ISBN 978-92-79-73945-3. [Google Scholar] [CrossRef]
- Climdex. Available online: www.climdex.org (accessed on 28 May 2020).
- Zhang, X.; Hegerl, G.; Zwiers, F.W.; Kenyon, J. Avoiding Inhomogeneity in Percentile-Based Indices of Temperature Extremes. J. Clim. 2005, 18, 1641–1651. [Google Scholar] [CrossRef] [Green Version]
- Euro-CORDEX Simulations. Available online: https://euro-cordex.net/imperia/md/content/csc/cordex/20180130-eurocordex-simulations.pdf (accessed on 28 May 2020).
- IPCC. Climate Change 2013: The Physical Science Basis. Contribution of Working Group I to the Fifth Assessment Report of the Intergovernmental Panel on Climate Change; Stocker, T.F., Qin, D., Plattner, G.-K., Tignor, M., Allen, S.K., Boschung, J., Nauels, A., Xia, Y., Bex, V., Midgley, P.M., Eds.; Cambridge University Press: Cambridge, UK; New York, NY, USA, 2013; 1535p. [Google Scholar] [CrossRef] [Green Version]
- Thomson, A.M.; Calvin, K.V.; Smith, S.J.; Kyle, G.P.; Volke, A.; Patel, P.; Delgado-Arias, S.; Bond-Lamberty, B.; Marshall, A.W.; Clarke, L.E.; et al. RCP4.5: A pathway for stabilization of radiative forcing by 2100. Clim. Chang. 2011, 109, 77–94. [Google Scholar] [CrossRef] [Green Version]
- Riahi, K.; Gruebler, A.; Nakicenovic, N. Scenarios of long-term socio-economic and environmental development under climate stabilization. Technol. Forecast. Soc. Chang. 2007, 74, 887–935. [Google Scholar] [CrossRef]
- European Climate Assessment & Dataset. Available online: http://www.ecad.eu/download/ensembles/ensembles.php (accessed on 30 May 2020).
- Rangwala, I.; Palazzi, E.; Miller, J.R. Projected Climate Change in the Himalayas during the Twenty-First Century. In Himalayan Weather and Climate and Their Impact on the Environment; Dimri, A., Bookhagen, B., Stoffel, M., Yasunari, T., Eds.; Springer: Cham, Switzerland, 2020; pp. 51–71. ISBN 978-3-030-29683-4. [Google Scholar] [CrossRef]
- Palazzi, E.; von Hardenberg, J.; Terzago, S.; Provenzale, A. Precipitation in the Karakoram-Himalaya: A CMIP5 view. Clim. Dyn. 2015, 45, 21–45. [Google Scholar] [CrossRef]
- Grossi, C.M.; Brimblecombe, P.; Harris, I. Predicting long-term freeze–thaw risks on Europe built heritage and archaeological sites in a changing climate. Sci. Total Environ. 2007, 377, 273–281. [Google Scholar] [CrossRef] [PubMed]
- Grossi, C.M.; Brimblecombe, P.; Menendez, B.; Benavente, D.; Harris, I.; Deque, M. Climatology of salt damage on stone buildings. Sci. Total Environ. 2011, 409, 2577–2585. [Google Scholar] [CrossRef] [PubMed]
- Tang, W.; Davidson, C.I. Erosion of limestone building surfaces caused by wind-driven rain: 2. Numerical modelling. Atmos. Environ. 2004, 38, 5601–5609. [Google Scholar] [CrossRef]
- Tang, W.; Davidson, C.I.; Finger, S.; Vance, K. Erosion of limestone building surfaces caused by wind-driven rain: 1. Field measurements. Atmos. Environ. 2004, 38, 5589–5599. [Google Scholar] [CrossRef]
- Grossi, C.M.; Bonazza, A.; Brimblecombe, P.; Harris, I.; Sabbioni, C. Predicting twenty-first century recession of architectural limestone in European cities. Environ. Geol. 2008, 56, 455–461. [Google Scholar] [CrossRef]
- Haugen, A.; Bertolin, C.; Leijonhufvud, G.; Olstad, T.; Broström, T. A Methodology for Long-Term Monitoring of Climate Change Impacts on Historic Buildings. Geosciences 2018, 8, 370. [Google Scholar] [CrossRef] [Green Version]
- ProteCHt2save Web GIS Tool. Available online: https://www.protecht2save-wgt.eu/ (accessed on 28 May 2020).
© 2020 by the authors. Licensee MDPI, Basel, Switzerland. This article is an open access article distributed under the terms and conditions of the Creative Commons Attribution (CC BY) license (http://creativecommons.org/licenses/by/4.0/).

 ,
, 


