Air Quality Levels and Health Risk Assessment of Particulate Matters in Abuja Municipal Area, Nigeria


School of Energy and Environmental Engineering, University of Science and Technology Beijing, 30 Xueyuan Road, Haidian District, Beijing 100083, China
*
Authors to whom correspondence should be addressed.
Atmosphere 2020, 11(8), 817; https://0-doi-org.brum.beds.ac.uk/10.3390/atmos11080817
Submission received: 31 May 2020
/
Revised: 25 July 2020
/
Accepted: 29 July 2020
/
Published: 3 August 2020
(This article belongs to the Section Air Quality and Human Health)
Abstract
:This study focuses on assessing the health risk by particulate matter (PM) inhalation within the Abuja municipal area, Nigeria. Particulate matters (PM2.5 and PM10), HCHO and VOCs were collected by A handheld portable smart air quality detector BR-SMART-126. A hybrid single-particle Lagrangian integrated trajectory (HYSPLIT) model for backward trajectory was applied to tract the air flow (transportation) and potential sources. Health risk was estimated by comparing with the air quality index (AQI) stipulated by the World Health Organization (WHO). The result shows that the daily averaged concentrations of PM2.5 varied from 15.30 µg/m3 to 70.20 µg/m3. The top four most-polluted locations (Locations 10, 14, 17 and 18) of the twenty locations were found to be above the acceptable (25 µg/m3) AQI limit stipulated by WHO, which all fell far under the unhealthy AQI value index level. In general, business/commercial locations had the highest PM2.5 level followed by transport/market, offices/mixed use and residential. The results from the backwards trajectories show that the source of local particles for the four most-polluted locations is long-range air transport originating from the Atlantic Ocean. The results of the health-risk assessment implies that for PM2.5, the AQI varied from 73.2 to 280.8 in this assessment. Based on this, the population of workers within the business location are at health risk based on the relatively poor air quality in these areas—especially location 10 and 17. Based on these findings, it is recommended that the regulatory and enforcement agency needs to develop a more robust monitoring mechanism, regulations and enforcement. Furthermore, there is need for a national drive on renewable energy, clean energy for business/commercial district to help reduce fumes from generators and to form cleaner air initiatives in order to ensure a safe environment to live in as well as reduce particulate matters in the city.
1. Introduction
One of the basic and necessary requirements for our well-being human health and the environment is clean air. Starting from the early 1960s, air pollution has become a global issue and has continued to the present, with great significant health and environmental hazards. The current global economic development, industrialization, urbanization, increases in population, energy consumption, transportation and motorization have become the driving factors for increases in air pollution worldwide. According to the World Health Organization (WHO) factsheet on ambient air quality and health, an estimated seven million premature deaths occur annually as a result of air pollution related diseases, such as heart disease, lung cancer, chronic obstructive pulmonary disease, stroke, to mention a few [1,2]. Air pollution is one of the most important environmental health risks of our time, with 9 out of 10 people worldwide breathing polluted air—according to the WHO report. The state of global air report and WHO highlighted that the major sources of air pollutions are vehicle emissions, generators fumes, bush/crop burning and gas-flaring [1,3].
Based on the WHO report, air pollution caused approximately one million more deaths than the total deaths caused by AIDS, malaria and tuberculosis in the same year, combined. About 91% of the world’s population lives in places where the air quality is above the WHO limits for particulate matter (PM2.5 and PM10), ozone (O3), nitrogen dioxide (NO2) and sulfur dioxide (SO2) as a leading pollutants with the greatest health concern [4]. AJ Cohen et al. 2017 reported that of the 4.2 million reported premature deaths caused yearly are as a result of ambient outdoor air pollution and ambient PM2.5 (particulate matter less than 2.5 micrometers in diameter) is responsible for up to 16.5% with an estimate of 1.7 million lung cancer death worldwide [5].
Particulate matter (PM) is a mixture of solid particles and liquid droplets floating in the air. PM comes in different sizes and shapes and can also be made of hundreds of different chemicals [6]. Some particles are released directly from a specific source such as dust, dirt, smokes, construction sites, while others form in the atmosphere as a result of complicated chemical reactions like nitrogen oxides and sulfur dioxide—pollutants emitted from industries and power plants. Particulate matter includes PM2.5, which are 2.5 micrometers in diameter or smaller, normally called fine particles that can only be seen with an electron microscope [6]. These are mainly produced from different types of combustion such as power pants, motor vehicles, residential wood burning and some industrial processes. PM10 are coarse particles that include PM2.5 and particles up to 10 micrometers in diameter. PM10 are inhalable particles that can be from grinding operations or dust from vehicles on roads [6]. In most developed countries like United States, United Kingdom, Canada, Australia, Finland, Sweden and also developing countries like China, Malaysia and South Africa, monitoring and high tech equipment is used to collect and analyze air quality, which in turn, is used to generate information and make policy for general population. However, the lack of this technology in Africa leads to a scarcity of data and information on real air quality in Africa against this modeled or periodic available data [7].
In Africa, they have been increasing level of air pollution due to rapid development, urbanization and industries, however, there have been some recent campaigns, enlightenment, sensitization and awareness initiatives to bring to the people attention of health and environmental risk of air pollution and climate change. The more prominent initiatives are: Global alliance for clean cook-stoves, climate clean air coalition are some of the initiatives supported by WHO in order to reduce air pollution and health related impacts. Air pollution in Nigeria and other African countries has become the world’s 21st century big problem owing to the increased industrial activities, construction and increased quantity of emission sources such as vehicle emission, gas flaring, among others. The recent annual state of the global air report published by the Health Effects Institute put Nigeria as the 4th highest in the world with a fatality of 150 death per 100,000 Nigerians and number one in Africa [3]. In Nigeria, most of the urban pollution comes are mainly from vehicle emission, generator fumes, construction sites among other. It is also a long practice of burning the grassing land in the cattle post as a strategy to speed up the growth of the green grass in the beginning of wet season after a long dry season. This method is very harmful to the environment and a high air pollution in some part of the country has been attributed to such practice, in mostly northern part of Nigeria. Data on air quality are critical in guiding the policy making and formulating the adequate response and need to address the challenges caused by poor air quality in Africa. Nonetheless, with all the laws and regulations in place, the question still remains as to the level of effectiveness.
The objective of this study is to present the ambient air quality monitoring data of particulate matter (PM2.5 and PM10) and VOCs in Abuja municipal area. Furthermore, to determine and establish a baseline for further research on ambient air quality in Abuja Municipal area with respect to the health effects associated with PM above WHO standards.
2. Methodology
2.1. Research Area
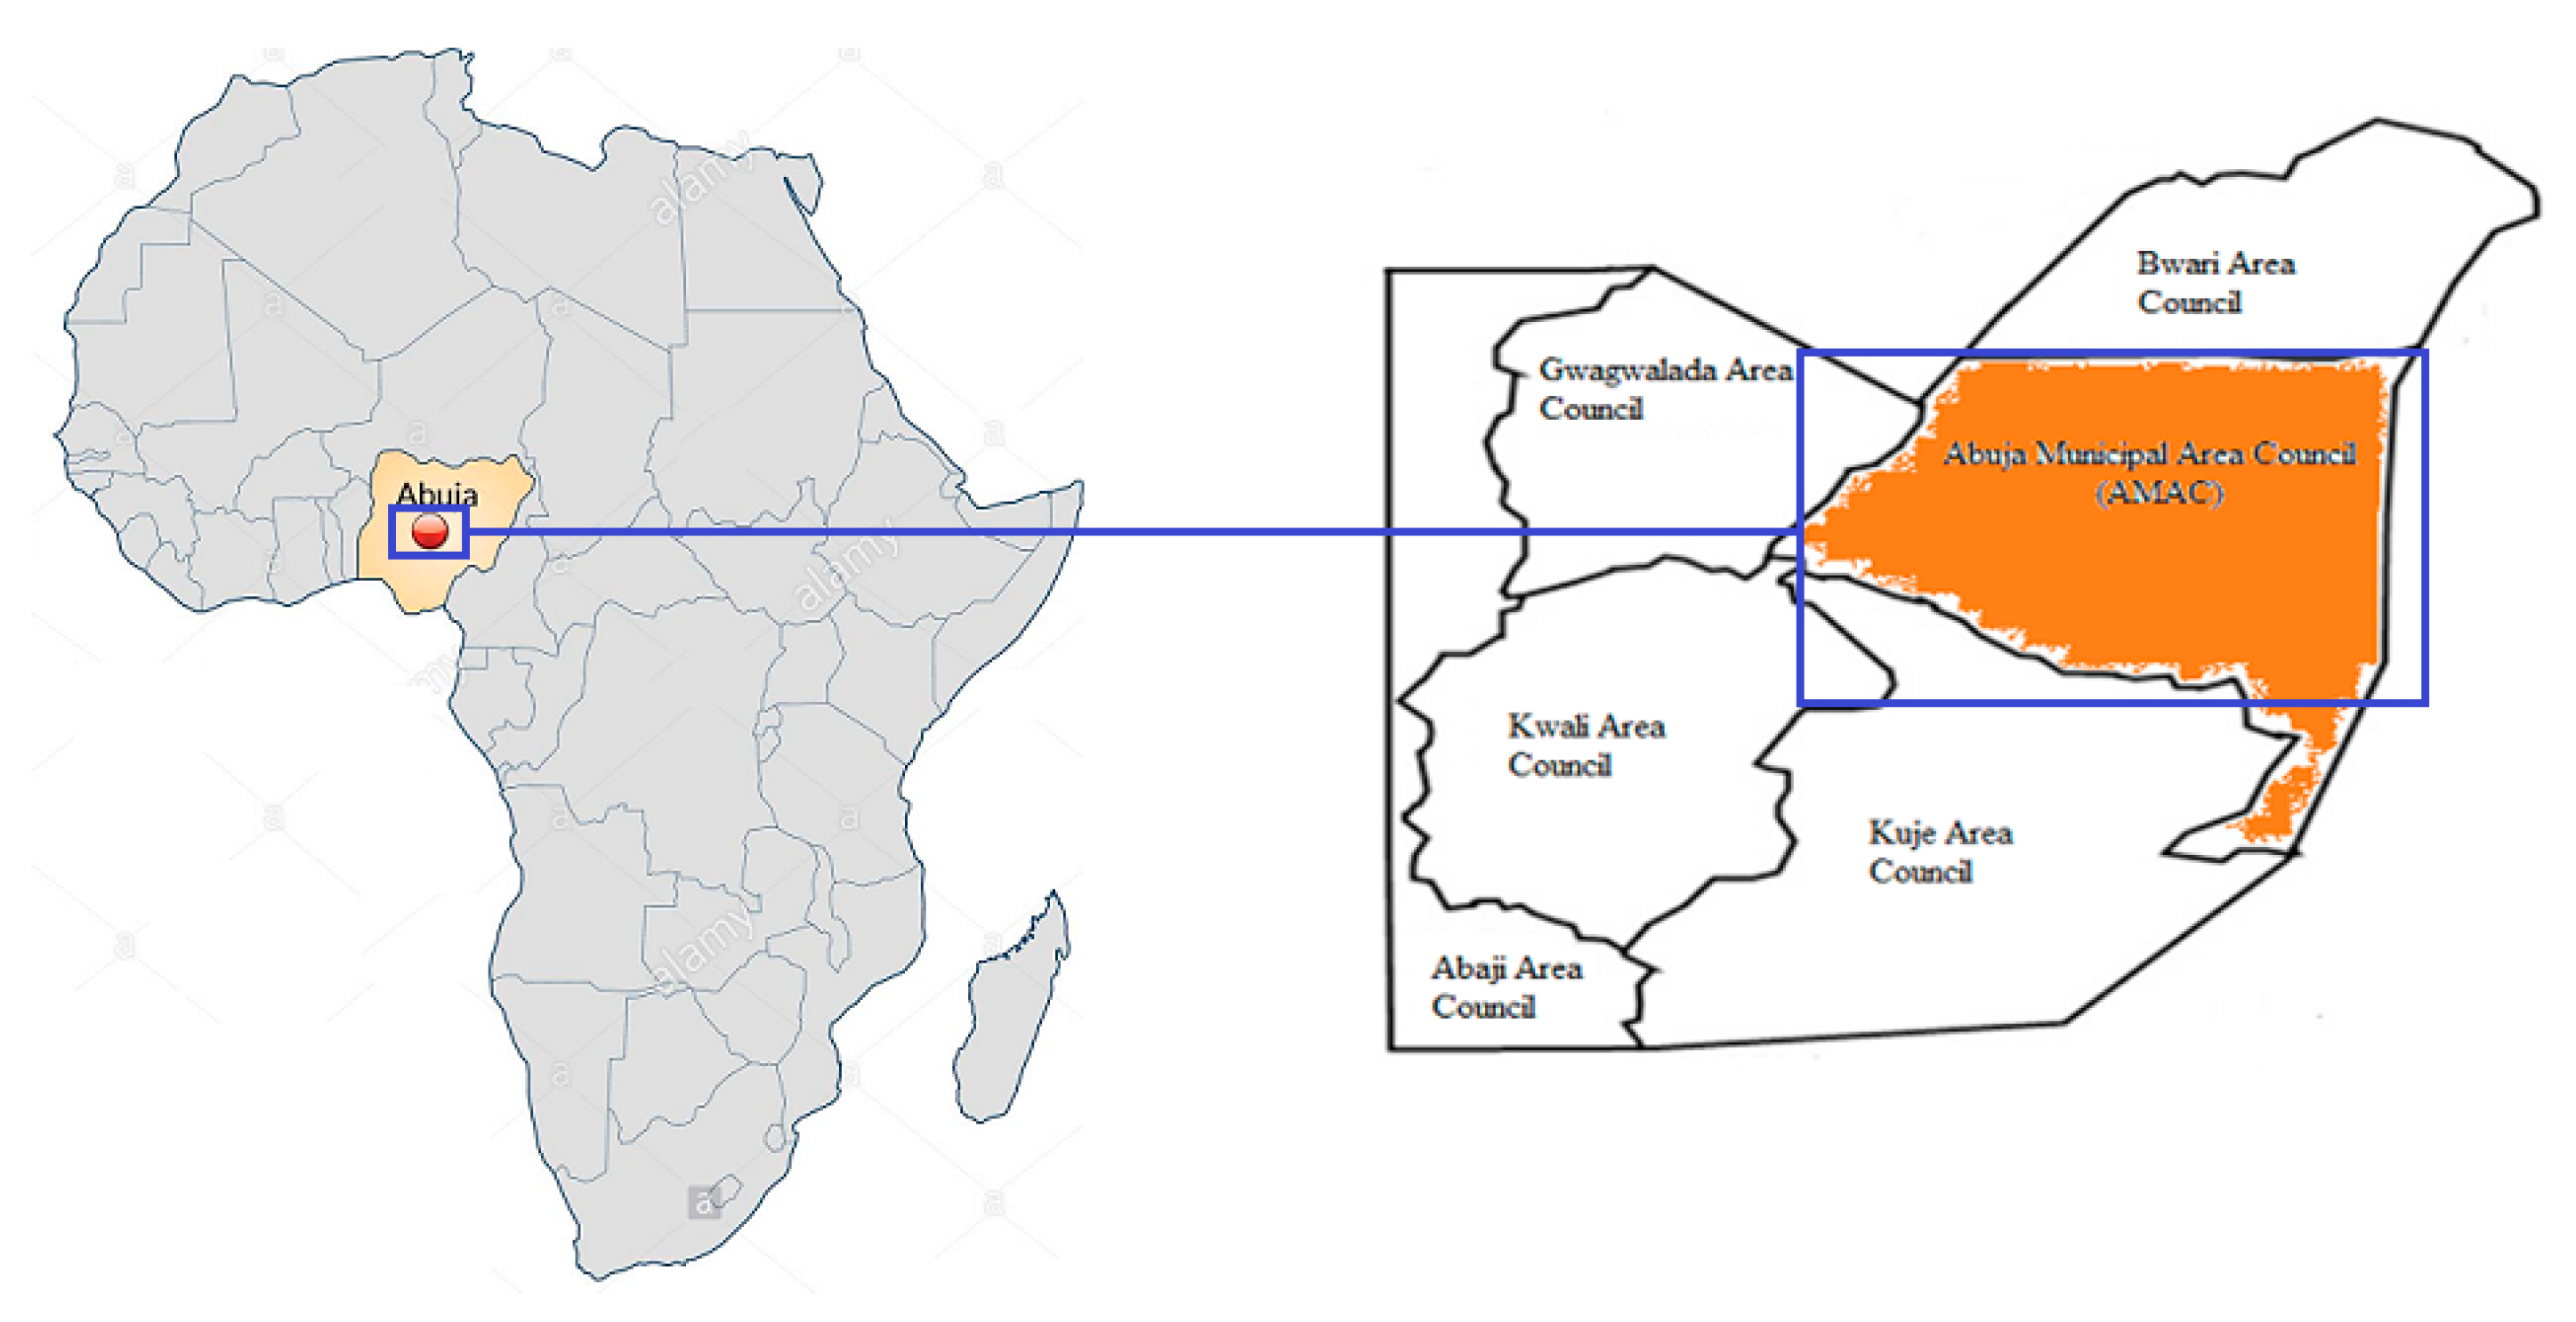
Abuja is the capital city of Nigeria; it is located in the center of Nigeria (Figure 1). Abuja is bounded by four states: Kaduna in the north, in the west by Niger state, in the east and southeast by Nasarawa state and in the southwest by Kogi state. Abuja became the capital of Nigeria on 12th December 1991 [8]. Abuja is also Nigeria’s administrative and political center with GPS coordinates 9°5′ N 7°32′ E and has a total land area of 7315 km2 (2824 sq. mi) [9].
Abuja currently has a population of more than 2.5 million people [9]. The city population has grown with almost 140% making Abuja not just the fastest growing city in Africa, but also one of the fastest growing in the world [9]. Most Abuja residents are civil servants as Abuja is home to all Federal government parastatal and establishment. Abuja experiences two weather conditions in a year, namely rainy season and dry season. The rainy season begins from late March and ends in October and the dry season starts from October and ends in March., within these two seasons there is a brief period of harmattan (dusty haze, dryness, intense coldness) as a result of north east trade wind.
2.2. Sampling
The sampling locations were randomly selected within the heart of Abuja City, taking into consideration of vehicle intersections, Government Office area commercial, business and residential areas. Twenty (20) locations were sampled for PM2.5, PM10 and VOCs (Volatile Organic Compounds). The locations are named Locations 1 to Location 20. All handheld device used was pre calibrated before usage for effectiveness and quality assurance purposes. OMNIPORT 30 Multifunctional handheld meter was used to measure/take the reading for temperature, relative humidity and atmospheric pressure for all sampled locations, this device store measurement values in the internal memory of the device and use the free SmartGraph3 software to manage data on your PC [10]. A handheld automated GPS was used for obtaining sample point coordinates. A handheld portable smart air quality detector produced by BLATN Science & Technology Co., Ltd., (Beijing, China) called The BR-SMART-126 Portable 4-in-1 air quality monitor was used to measure PM2.5, PM10, VOC (volatile organic compound) and formaldehyde (HCHO). This air quality monitor/detector is a real-time air quality monitoring instrument used to detect PM2.5, PM10, formaldehyde (HCHO) concentration and VOCs for both indoor and outdoor environment. This portable handheld device uses high-precision sensor chip and operation and has a capacity to convert PM2.5, PM10, formaldehyde and VOCs concentration in the air into visual data, to monitor the air quality, provide effective protection for family health [11,12].
2.3. Hybrid Single Particle Lagrangian Integrated Trajectory (HYSPLIT) Model
The hybrid single particle Lagrangian integrated trajectory (HYSPLIT) model has become a robust tool in recent years to assess or compute potential source location, transportation trends, complete dispersion, deposition simulations and the extent of contribution to PM2.5 and PM10 [13,14,15]. This model was developed by the National Oceanic and Atmospheric Administration’s (NOAA) Air Resources Laboratory (ARL) [16].
HYSPLIT uses archived 3-dimensional meteorological fields generated from observations and short-term forecasts. It also uses several available meteorological data archives to generate forward or backward trajectories. The HYSPLIT back trajectory capability is useful for identification of possible source locations and regions. HYSPLIT can be accessed via a web based real-time environmental applications and display system (READY) which can be run as a stand-alone application or run interactively on the website through the ARL https://ready.arl.noaa.gov/index.php [17]. The web version has been configured with some limitations to avoid computational saturation of the ARL web server.
2.4. Risk Assessment
In the analysis, mean values of monitoring reading for PM2.5 and PM10 were computed and compared with the world health organization guideline [1] where the annual mean for PM2.5 (fine particulate matter) is 10 μg/m3 and 24-h mean is 25 μg/m3 while that of PM10 (coarse particulate matter) is 20 μg/m3 and 24-h mean is 50 μg/m3. These mean value were used to calculate the air quality index (AQI). The indices for each pollutant (average of the total sum from each sampling location) were derived using the mathematical formula as seen below [18,19]:
The (AQI) according to United State Environmental Protection Agency is an index for reporting daily air quality. This index tells us how clean or unhealthy the air we take in is, the level of concern and the health effects [18,19]. The AQI focuses on “health effects you may experience within a few hours or days after breathing unhealthy air”. Table 1 below shows the air quality index rating [20,21,22]. Furthermore, table shows the AQI pollutant conc. specific range for PM2.5 and PM10. It can be said that the lower the AQI value the better the air quality [18].
The AQI is divided into ranges, this ranges are numbered and then marked with color codes and each color determines the level of health concert and their meaning. The ranges are from a healthy standard level zero to hazardous level of above 300 which indicate the level of health risk associated with air quality.
Table 1 above shows six major classifications which is designated by a color code, levels of health concern and also level of air pollution. Air pollution Level 1 indicates good and healthy air quality as air quality under this category is considered satisfactory and poses little or no risk of health effect. Level 2 air pollution is acceptable however there may be risk or moderate health concern for some people (very small number) particularly those who are usually sensitive to air pollution. Level 3 is termed unhealthy for sensitive groups, this level may not affect the general public, but exposed people with some kind of disease like lung disease, heart disease and vulnerable groups like children and older people are the once at greater risk. Level 4 is called unhealthy; some members of the general public may experience some adverse health effect with this kind of pollution, while sensitive groups may experience more serious health issues. Level 5 with color code purple is very unhealthy for general public and will trigger a health alert, as at this levels the risk of health effects is increased for everyone and more serious. Lastly, Level 6 with hazardous level of health concern, this level of air pollution will trigger a health warning of emergency conditions as everyone or the entire exposed population is more likely to be affected.
3. Results
3.1. Particulate Matters (PM) Concentrations
Details of reading taken from 20 locations for a duration of three to four hours daily with corresponding GPS coordinates provided in Table 2. This study was carried out in Abuja from August to September (rainy season). The mean PM2.5 and PM10 across the locations were calculated and available in Table 2 with other parameters like humidity, temperature and atmospheric pressure.
3.2. Spatial Variation
Most African countries are lagging behind in terms of data gathering as direct monitoring on particulate matters especially PM2.5, however some of the available data are general indication with the intend to help cross country comparison of health risk due to PM and level of pollutant concentration are different from each other which generally are due to country, cities or location conditions. According to the state of global air report 2019, more than 90% of the people worldwide live in areas exceeding the WHO set standard for healthy air [3]. The report highlights difference concentrations of PM2.5 µg/m3 globally. From the report for Africa, it shows that only very little falls within the WHO interim targets 2 (IT-2) range of 25–35 µg/m3 while the rest as we can see are above the 35 µg/m3. Taking a detail look at the report, the annual PM2.5 exposure for sub-Saharan Africa (West Africa) puts Nigeria as the 3rd highest in the region with 72 µg/m3 behind Niger and Cameroon with 94 µg/m3 and 73 µg/m3, respectively. Countries like Nepal (100 µg/m3), India (91 µg/m3), Qatar (91 µg/m3), Saudi Arabia (100 µg/m3), Egypt (100 µg/m3), Bahrain (100 µg/m3), China (100 µg/m3) among other countries were cited as the countries with the highest amount of PM2.5 exposures as pollution varies between region and countries, for example the middle east and north Africa have their cause of particulate matter attributed to dust from the Sahara desert compare the west Africa where it can be attributed to industries (diesel–fossil fuel powered equipment and generators), vehicle emissions gas-flaring, etc. In the same light, Maldives, Sweden, Estonia, Norway, Finland and Brunei were among the countries with the lowest exposure of average 8 µg/m3 or less [3].
Furthermore, from the state of global air report 2019 on exposure to air pollution, the percentage of population living in areas where the PM2.5 concentration is higher than the WHO air quality guideline and each of the three (3) interim target for the eleven (11) most populous countries including the European Union for the year 1990, 2010 and 2017 where the 3 interim targets are IT-1 (>35 µg/m3), IT-2 (>25 µg/m3) and IT-3 (>15 µg/m3) where the annual WHO guideline stays at >10 µg/m3. Nigeria stands third as most of its population remains exposed to WHO guideline, IT-3 and IT-2 while there was a decrease in the percentage exposed to IT-1. Bangladesh and Pakistan as the highest in all categories and show no sign of improvement as the entire population remains exposed to PM2.5 levels above all the guideline and three interim targets. It can be seen that USA had one of the most remarkable decrease in all set guidelines; this shows that proportion of population living in areas which exceeds the guidelines are very low and as of 2017 it was estimated that only 3% leaves in areas exceeding the guidelines from 50% as in 1990. Countries like Mexico, Indonesia, Russia, EU, Japan and Brazil all show sign of improvement and progress since 1990 towards meeting the 3 interim targets with a drastic reduction in population living in IT-1 and IT-2 compare to IT-3 and guideline [3].
Similarly, environmental risk and health statistics by the organization for economic cooperation and development shows that the mean exposure to PM2.5 in Abuja (study area) is 65 µg/m3 and the country is 70.1 µg/m3 compare to neighboring west Africa counties like Cameroon (74.9 µg/m3), Niger (94.1 µg/m3), Chad (66.3 µg/m3), Ghana (35.1 µg/m3), Benin (39.7 µg/m3) among others [23]. The main source for Nigeria was attributed to urban city development with increase in population and increase in vehicle emission as well as the use of generators and gas-flaring in the Niger Delta.
3.3. PM2.5 Relationship with PM10, VOCs and HCHO
Over the years, developed and developing cities around the world have witnessed high concentration of particles in the atmosphere as a result of increased in industrialization, urbanization and population. F. Dominici et al. (2006), Yang et al. (2017; 2018) highlighted the very close relationship between exposure to PM2.5 and PM10, there are strong proven evidence of the health effects of short-term and long-term exposure to high concentration of both PM2.5 and PM10 results in respiratory/cardiovascular diseases, cancer and lung disease, among others [24,25,26].
IBM SPSS statistic software was used to analyze the data. The Pearson’s correlation test was utilized to analyze the linear relationship between PM2.5 concentration and PM10, VOCs and HCHO. The level of significance of the test was conceded 0.05 and 0.01 (confidence level of 95% and 99%) [27].
The result obtained from the study as shown in Table 2 highlights the various location and corresponding mean readings of both PM2.5, PM10, VOCs and HCHO. The calculated mean ± SD using SPSS for all the 20 locations in terms of PM2.5, PM10, VOCs and HCHO were 32.35 µg/m3 ± 16.44 µg/m3, 34.09 µg/m3 ± 18.08 µg/m3, 50.44 mg/m3 ± 30.50 mg/m3 and 3.09 mg/m3 ± 1.90 mg/m3, respectively. The findings of this study have indicated a high concentration for PM2.5 which could be of serious threat to the general population around the study area as the mean result for PM2.5 showed that it is above the WHO 24-h mean guideline and taking a look at each location as seen in Table 2, it could be observed that most the location were above the WHO guideline. Although the mean concentration of PM10 particles in the ambient air was lower than the 24-h guideline presented by WHO (50 µg/m3), but 4 of the 20 locations were found to be above the 24-h mean. The transport service locations had a mean value of 62.10 µg/m3, this could be attributed to various emission from both diesel and petrol vehicles, the location is one of the main transport hub for traveling by road in Abuja municipal area council. One of the main market areas was among the locations with high particulate matter of 60.10 µg/m3, cars emission and generators were found to be the main source of pollution around this locations with dust from human movements, vehicles and natural wind. Printing press business area had a mean reading of 70.20 µg/m3, during the cause of the monitoring it was identified that the use of heavy generators for the printing press machine was the main source of pollution, the business area runs constant generator for almost all working hours due to the current electricity situation in the country. The observation from this studies is that most location are found to be above the guideline for PM2.5 and these raise a serious concern about the potential health effects within the populations. However, the health effect are much more different, going by the results and from Table 2 we can see that most of the population are largely affected by PM2.5 as most of the locations are seen to be above the WHO standard and long term or chronic exposure to PM2.5 has different negative effects on human health which includes; lung cancer, cardiovascular problems and respiratory [27].
According to Cohen 1988, the Pearson correlation produces three significant output with vital piece of information, this three outputs are: the Pearson correlation coefficient, level of statistical significance and sample size. The magnitude of the correlation coefficient determine the strength of the correlation [28]. Cohen further explained that, if coefficient value falls within 0.1 < |r| < 0.3, 0.3 < |r| < 0.5 and |r| > 0.5 it shows small, moderate (medium) and large (strong) correlation, respectively [28].
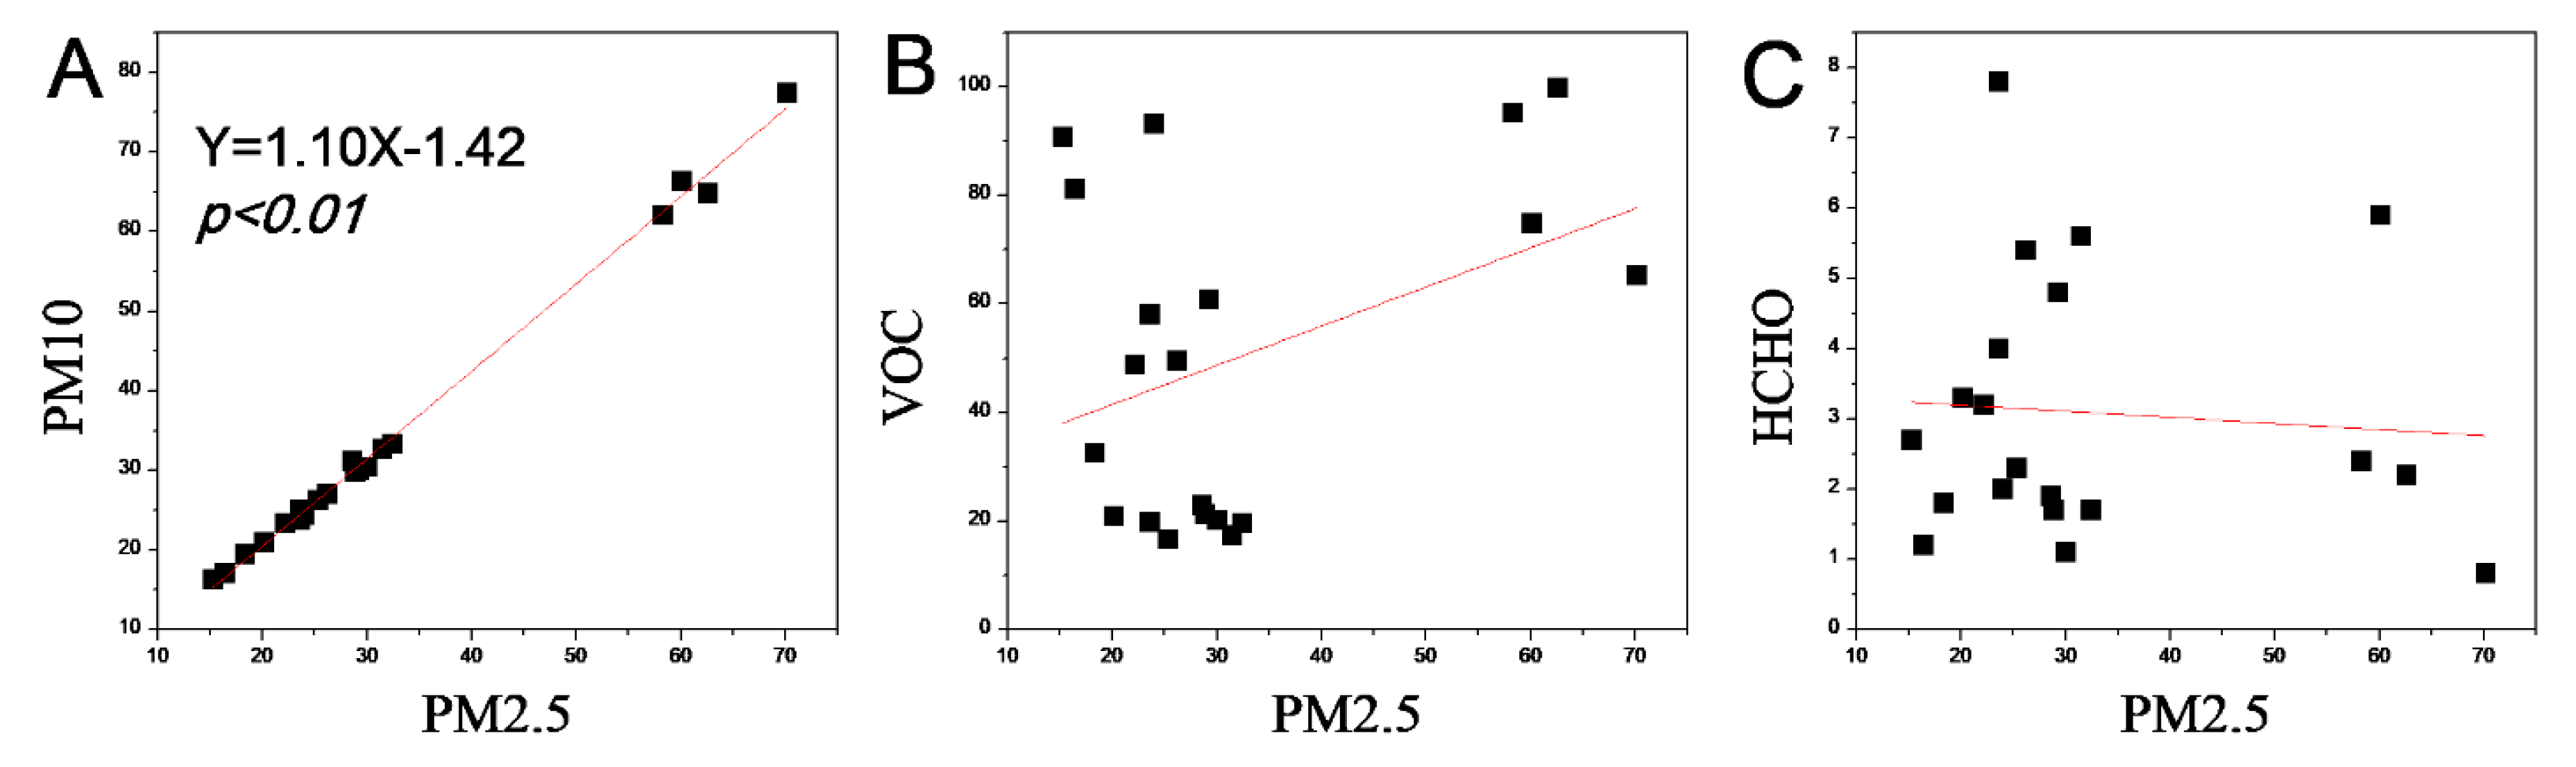
From the correlation for PM2.5 vs. PM10, it was observed that the Pearson correlation coefficient (r) is 0.99**, which is interpreted as large correlation going by Cohen interpretation. (r = 0.99, p < 0.001). It can also be said that the double tailed ** implies that the PM2.5 and PM10 correlation is significant at the 0.01 level. Furthermore, from Figure 2A, we observe that the box on the scatterplot are reasonably closely scattered about an underlying straight line as opposed to a curve or a random scattering, thus this indicates that there is a linear relationship between the two variables. The scatterplot implies that as the level of PM2.5 increases so the level of PM10 increases as well. This study highlight similar results as of those reported by Yang et al. 2018 and Zhou et al. 2017, which shows strong correlation between PM2.5 and PM10 concentration for China (0.92) and India (0.64), also this correlation can be attributed to similar sources of PM2.5 and PM10 which are mainly emission from coal, vehicle exhaust and biomass [26,29].
For PM2.5 and VOCs, it was observed that the Pearson correlation coefficient (r) was 0.39. There was a moderate Pearson correlation coefficient between PM2.5 and VOCs which can be seen in Figure 2B. For PM2.5 and HCHO, a negative correlation was observed between the indicators of PM2.5 and HCHO concentration, the Pearson correlation coefficient (r) was −0.75 (25% shy of a perfect negative correlation) this indicates a rather strong relationship between the PM2.5 and HCHO as shown in Figure 2C scatterplot.
3.4. Source Appointment—Backward Air Flow Trajectory
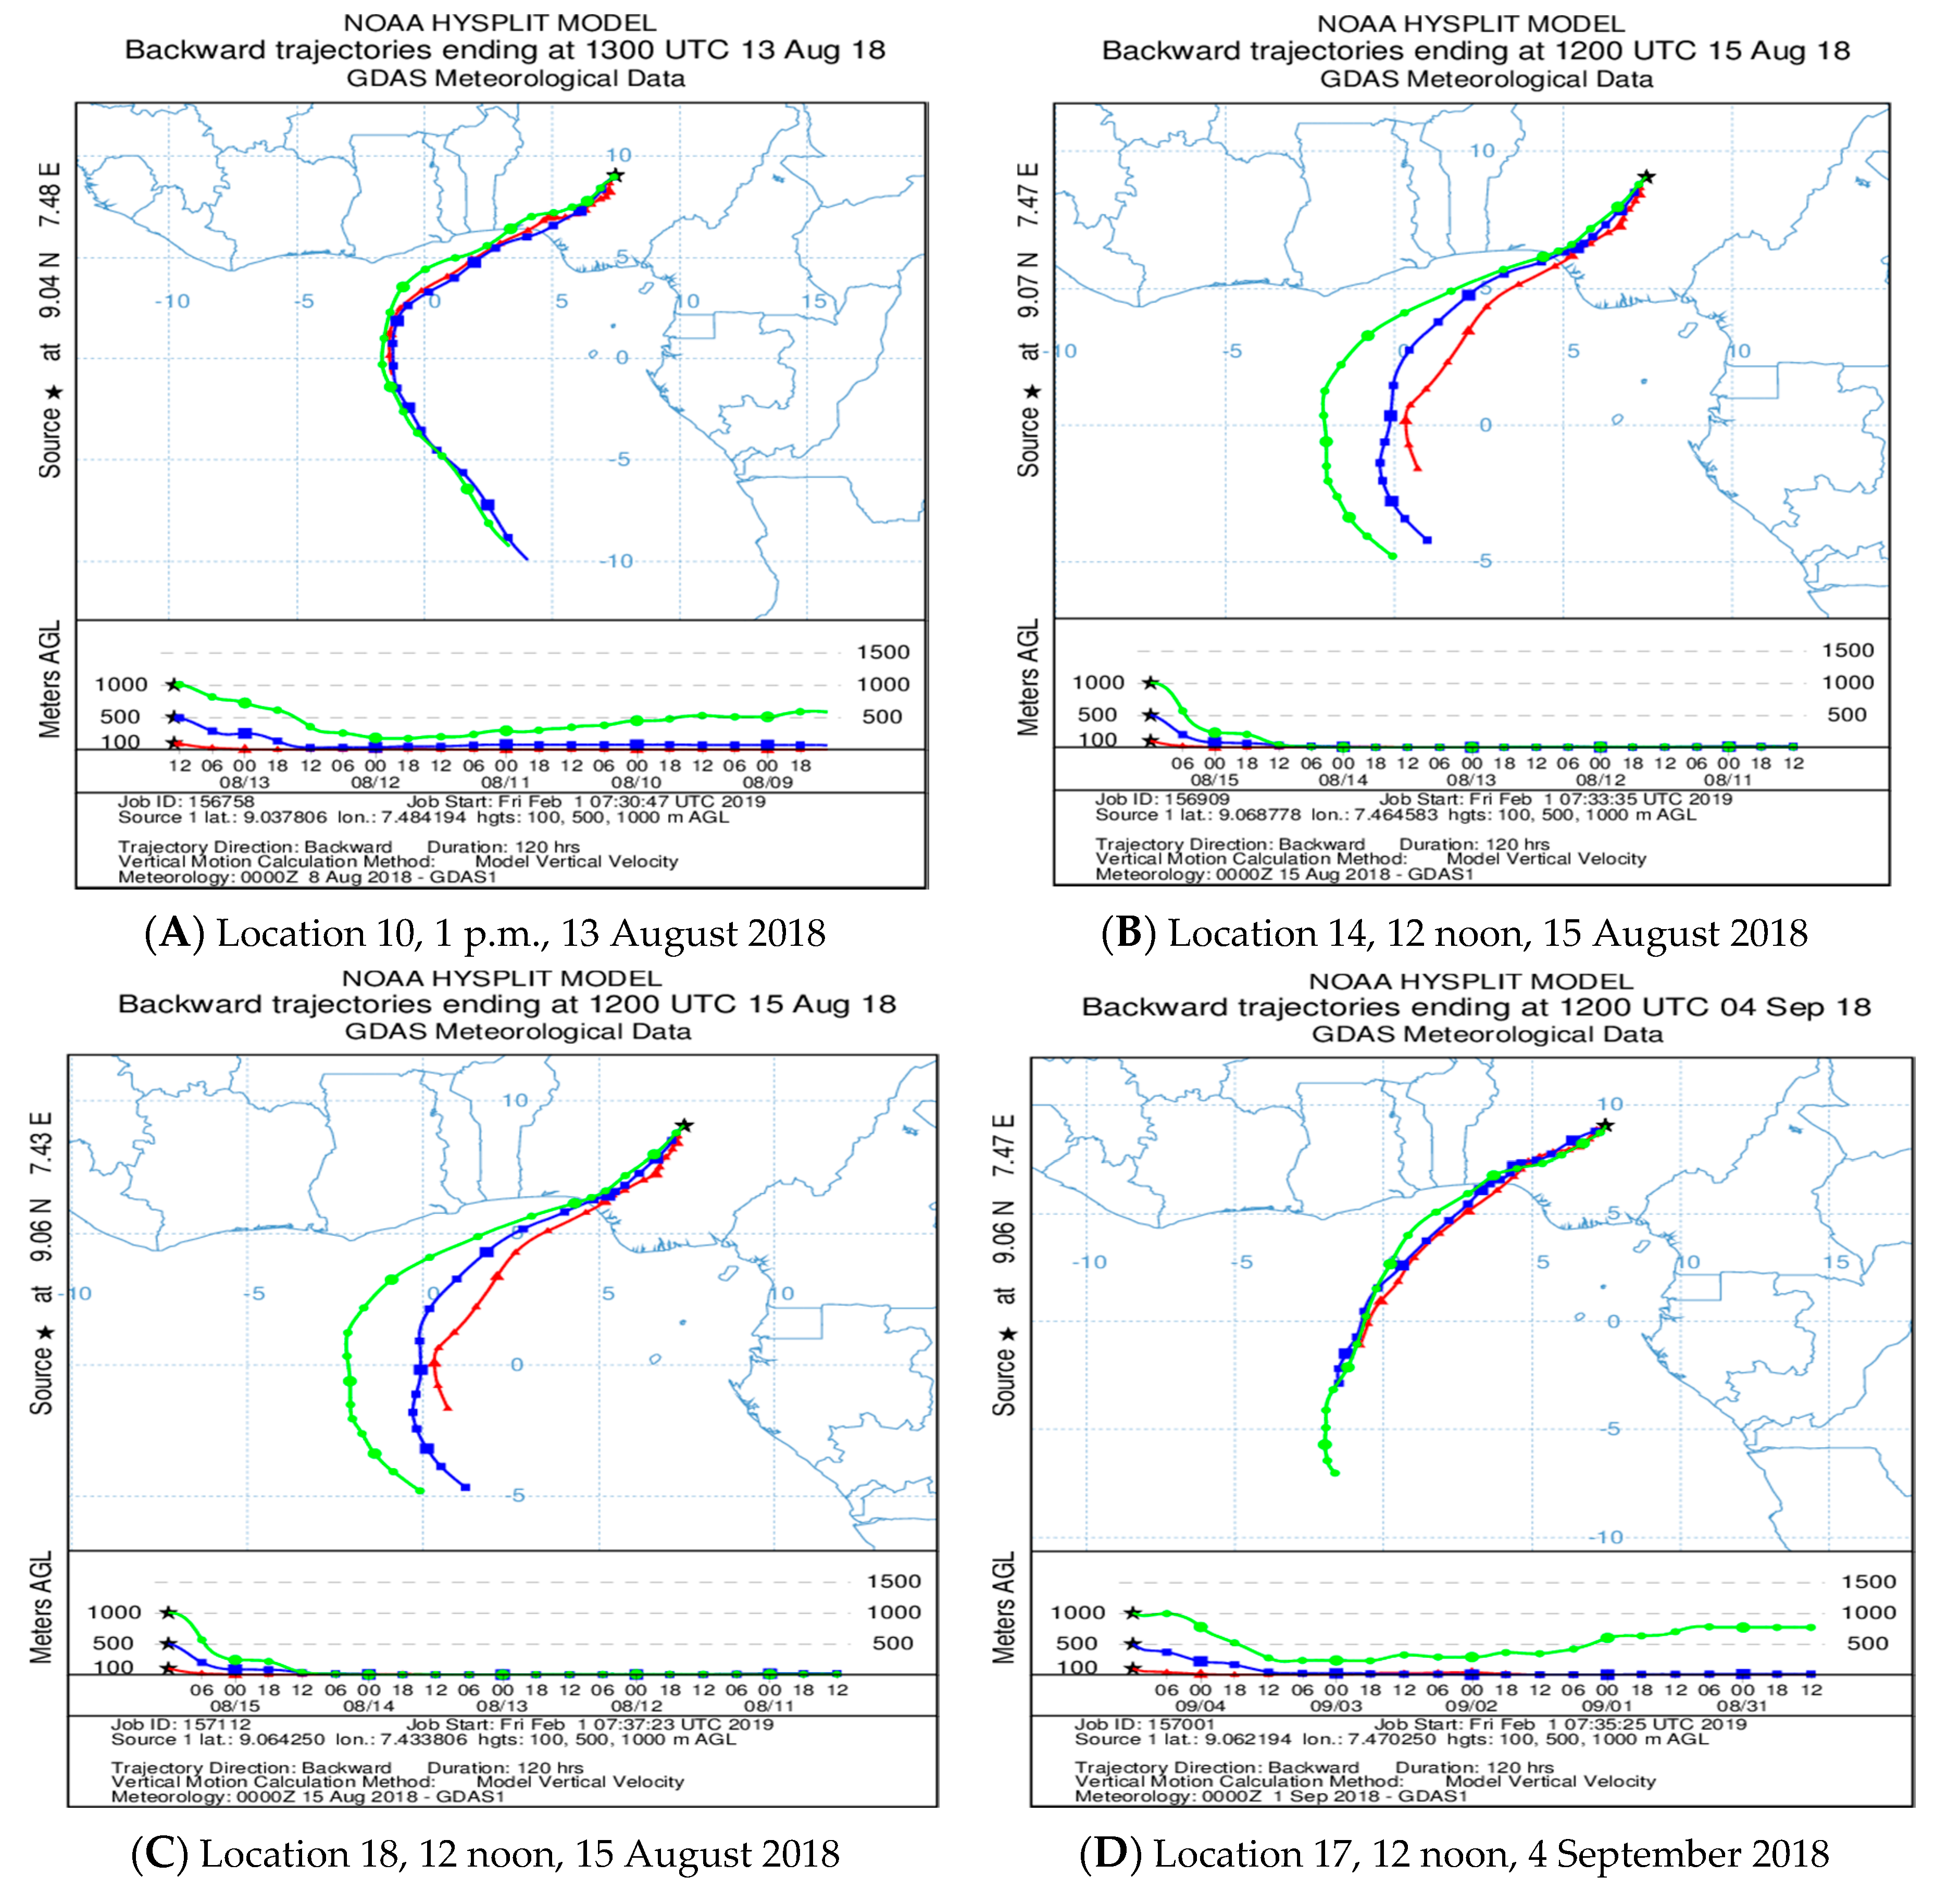
Using the hybrid single particle Lagrangian integrated trajectory (HYSPLIT) model to analyze the top four (4) most-polluted locations, namely location (10, 14, 17 and 18) for PM2.5 as seen in Table 2. Backward trajectories could identify the air mass movements and according to Perrone et al. 2013, short trajectories were indicatives of slow moving air masses while long trajectories usual have a fast spend flows and may be unfavorable for the deposition of particles based on dynamic principles which has a difference in direct implications for air quality however, the air flow trajectory length means the capacity of deposition of PM2.5 particles while different source regions means different kinds of components in PM2.5 [30].
Figure 3 shows the backwards trajectories of location (10, 14, 17 and 18) being the top four (4) most-polluted locations for PM2.5 using three (3) different heights (100 m, 500 m and 1000 m). It can be seen that the air flow into the city of Abuja originated from the Atlantic Ocean as Nigeria is bordered to the south by the Atlantic Ocean [31]. The air flow passes through the over populated Lagos sea port also through some Niger Delta oil producing regions. Study shows that Lagos sea port area generates many emissions due to its activities (trucks, cars, heavy sea port machines and generators) [32]. It will be recalled that the backwards trajectories can only be used to identify the movements of air flow or masses from a potential source however, based on the air flow pathway from Niger Delta and sea port area in Lagos some assumption about potential sources of pollutants could be derived. The air flows from the ocean through to the nation’s capital Abuja may be carrying many pollutants as a result of their transport pathways.
The Niger delta area of Nigeria is known for oil and gas production owing to the huge deposits of crude oil. Furthermore, country analysis brief reported Nigeria as the seventh proved reserves of natural gas with about 182 trillion cubic meter and also ranked fifth globally for gas-flaring over half a century [33,34]. Similar research also highlights how flared gas (FG) contribute to global warming, climate change and also sources of black carbon, particulate matter (PM), volatile organic chemicals (VOCs), greenhouse gases and polycyclic aromatic hydrocarbon (PAH) among others that pollutes the air, soil and water [35,36]. Flared gas contains over 250 toxins such benzene, sulfur dioxide, nitrogen dioxides, xylene, hydrogen sulfide, toluene, etc. The few studies conducted at some of the communities showed that the ambient level of some pollutant like PM, CO2, SO2, NO2 were all higher that the recommend values. The need for clean air cannot be over-emphasized as clean air will reduce the risk of respiratory diseases and other diseases associated with air pollution [37,38].
Furthermore, the health implications and longtime exposure to gas-flaring and particulate matter. Some of the findings includes respiratory difficulty, eye and skin irritation, asthma, cough and other related health risks. From the above studies and references, it can be presumed that air flow through the Lagos sea port and the Niger delta gas-flaring regions to the survey area may go along with few of the known pollutants like particulate matter PM2.5, among others. We intend to do air pollutant analysis in the nearest future to determine various pollutant available at the survey area [39,40,41].
The backward trajectories analysis of air flows in different heights (100 m, 500 m and 1000 m) has different effect on the study population area. Comparing the flow trajectories results at 100 m, 500 m and 1000 m, it could be stated that air flows in lower heights moving over a source area can carry more pollutants than in the higher height (above 1000 m) as air flows in the 100 m and 500 m boundary layers may have the largest influence of the particulate matter (PM2.5) concentration, also height 1000 m contributes to the long range transportation of PM2.5. However, all the height categories considers in this model analysis as shown in Figure 3 has the same airflow pathway which indicates that the important potential source region was the south Atlantic ocean passing through the Niger Delta oil producing region.
Risk analysis by air quality index (AQI). Results of the particulate matter computed in Table 2 shows that:
- PM2.5 has the lowest mean value of 15.30 µg/m3 and 70.20 µg/m3 as the highest value. However, going by the WHO standard of 25 µg/m3 24 h mean, 12 of the 20 location had a mean value higher than the standard with 8 having values lower than the standard;
- PM10– of the 20 locations, 16 location were below the 50 µg/m3 WHO standard 24 h mean value while 4 locations were higher than the standards. The highest mean value was 77.50 µg/m3 with 16.30 µg/m3 as the lowest;
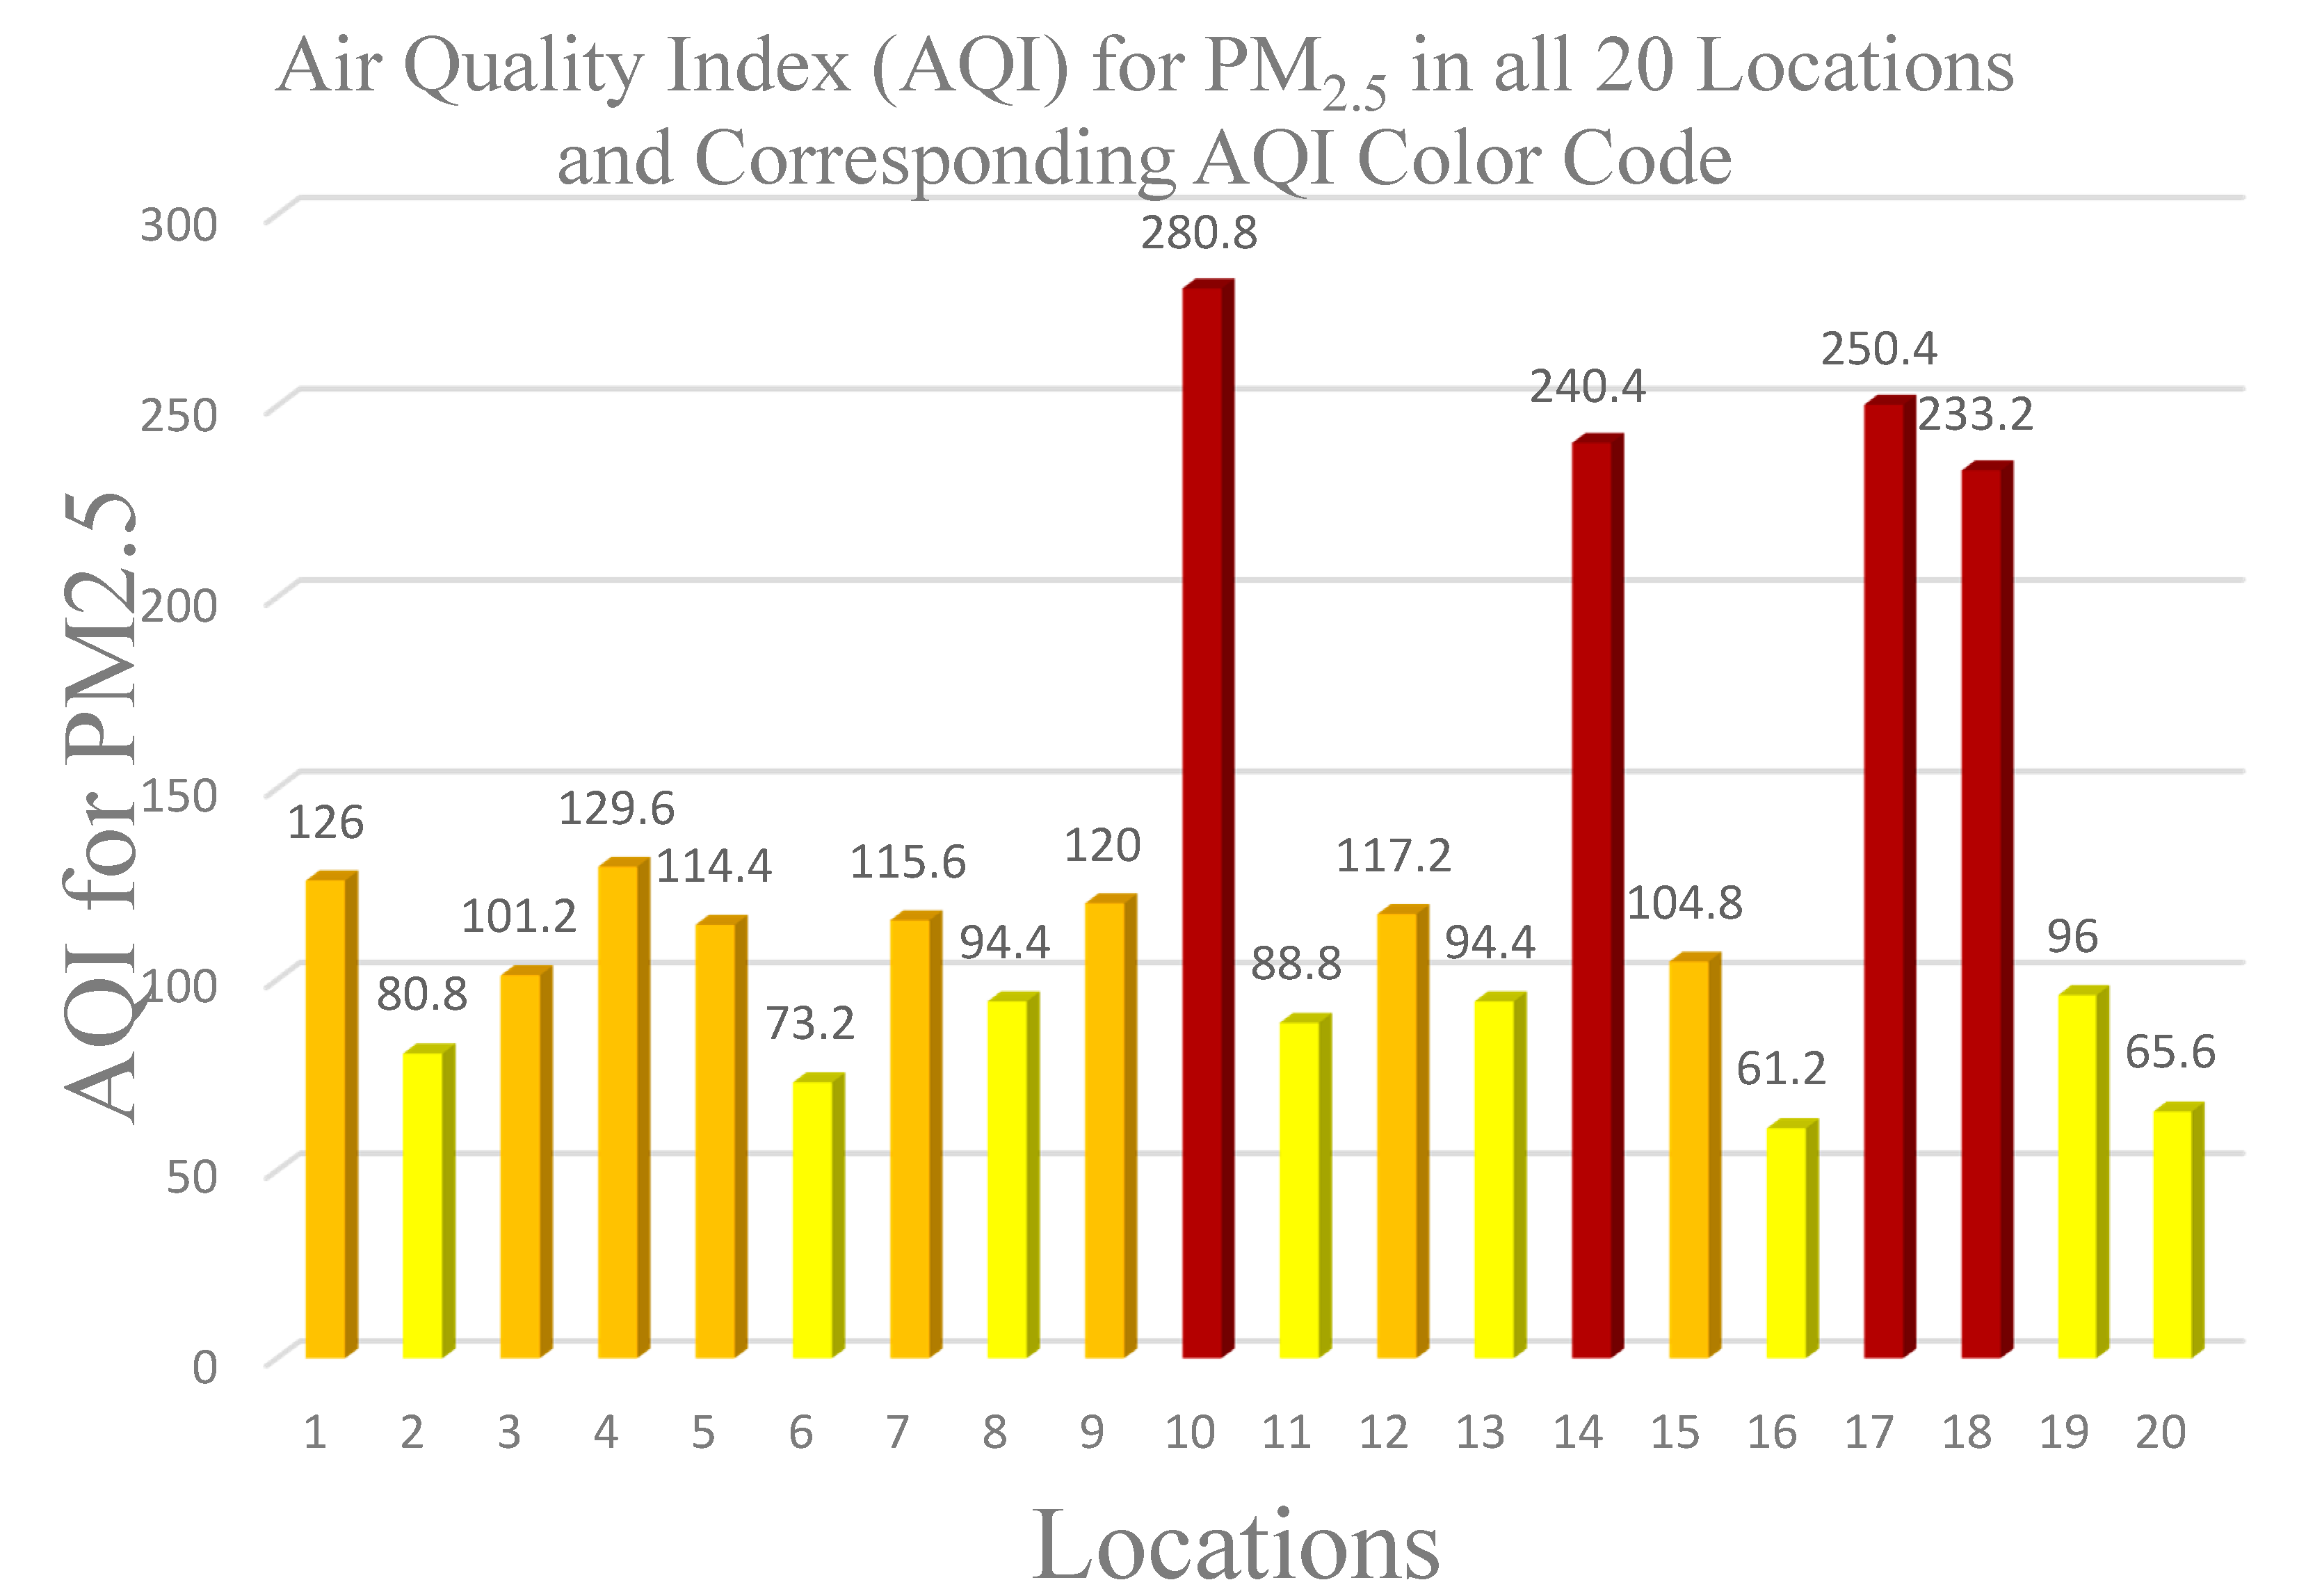
Using Equation (1) above (air quality index pollutant equation), the AQI pollutant value were calculated using the mean monitoring reading in Table 2 as pollutant concentration and WHO standard. The calculated PM2.5 AQI values for all 20 locations was then used to plot a graph of location against PM2.5 as shown in Figure 4 below.
Figure 4 above is used to highlight the specific pollutant range and color index for all 20 locations based on computed values. Locations 10 (with 280.8 index) showed highest level of fine particulate matter pollutant and very unhealthy for the population within that location. It can be seen that for PM2.5 most of the location fall under moderate (yellow), unhealthy for sensitive people (orange) while 4 (four) locations fall under Very unhealthy conditions. Air pollution Level 5 (very unhealthy) as seen in Figure 4 was observed to be from the business district (see Table 2), this is of great concern as most population within this district are exposed and PM2.5 pose the greatest health problems because of its size. Unhealthy air quality can get deep into the lungs and sometimes even the bloodstream and longtime exposure can lead to; increased respiratory problems, asthma and premature death as a result of heart and lung disease.
Exposure to fine particulate matter results in substantial numbers of respiratory health effects and risks. Growing epidemiologic studies has shown that inhalation and exposure to PM2.5 is associated with increase in respiratory health outcomes such as chronic obstructive pulmonary disease (COPD), asthma, lung cancer, etc. [42,43]. A study of the relationship between fine particulate matter and emergency room visits for asthma in the metropolitan Seattle shows strong evidence that exposure to air pollution aggravate respiratory disease especially asthma [44]. Particulate matter is a major contributor to respiratory mortality and morbidity according to many cohort studies [45,46].
Inhalation is the primary exposure mechanism to particulate matters and other particle [42]. Generally, fine particles smaller than 2.5 µm in diameter can easily penetrate the alveoli portion of the lung. These particles can pass directly into the blood in the alveolar capillaries if they are soluble in water and they can be retained deep on the lungs for in they are insoluble in water [47].
Significant aggravation of heart or lung disease and premature mortality in persons with cardiopulmonary disease and the elderly; significant increase in respiratory effects in general population. People with respiratory or heart disease, the elderly and children are the groups most at risk. Based on the monitoring, it was observed that the major source of air pollution within Abuja metropolis are mainly Vehicle emission and fumes from business/commercial district generators.
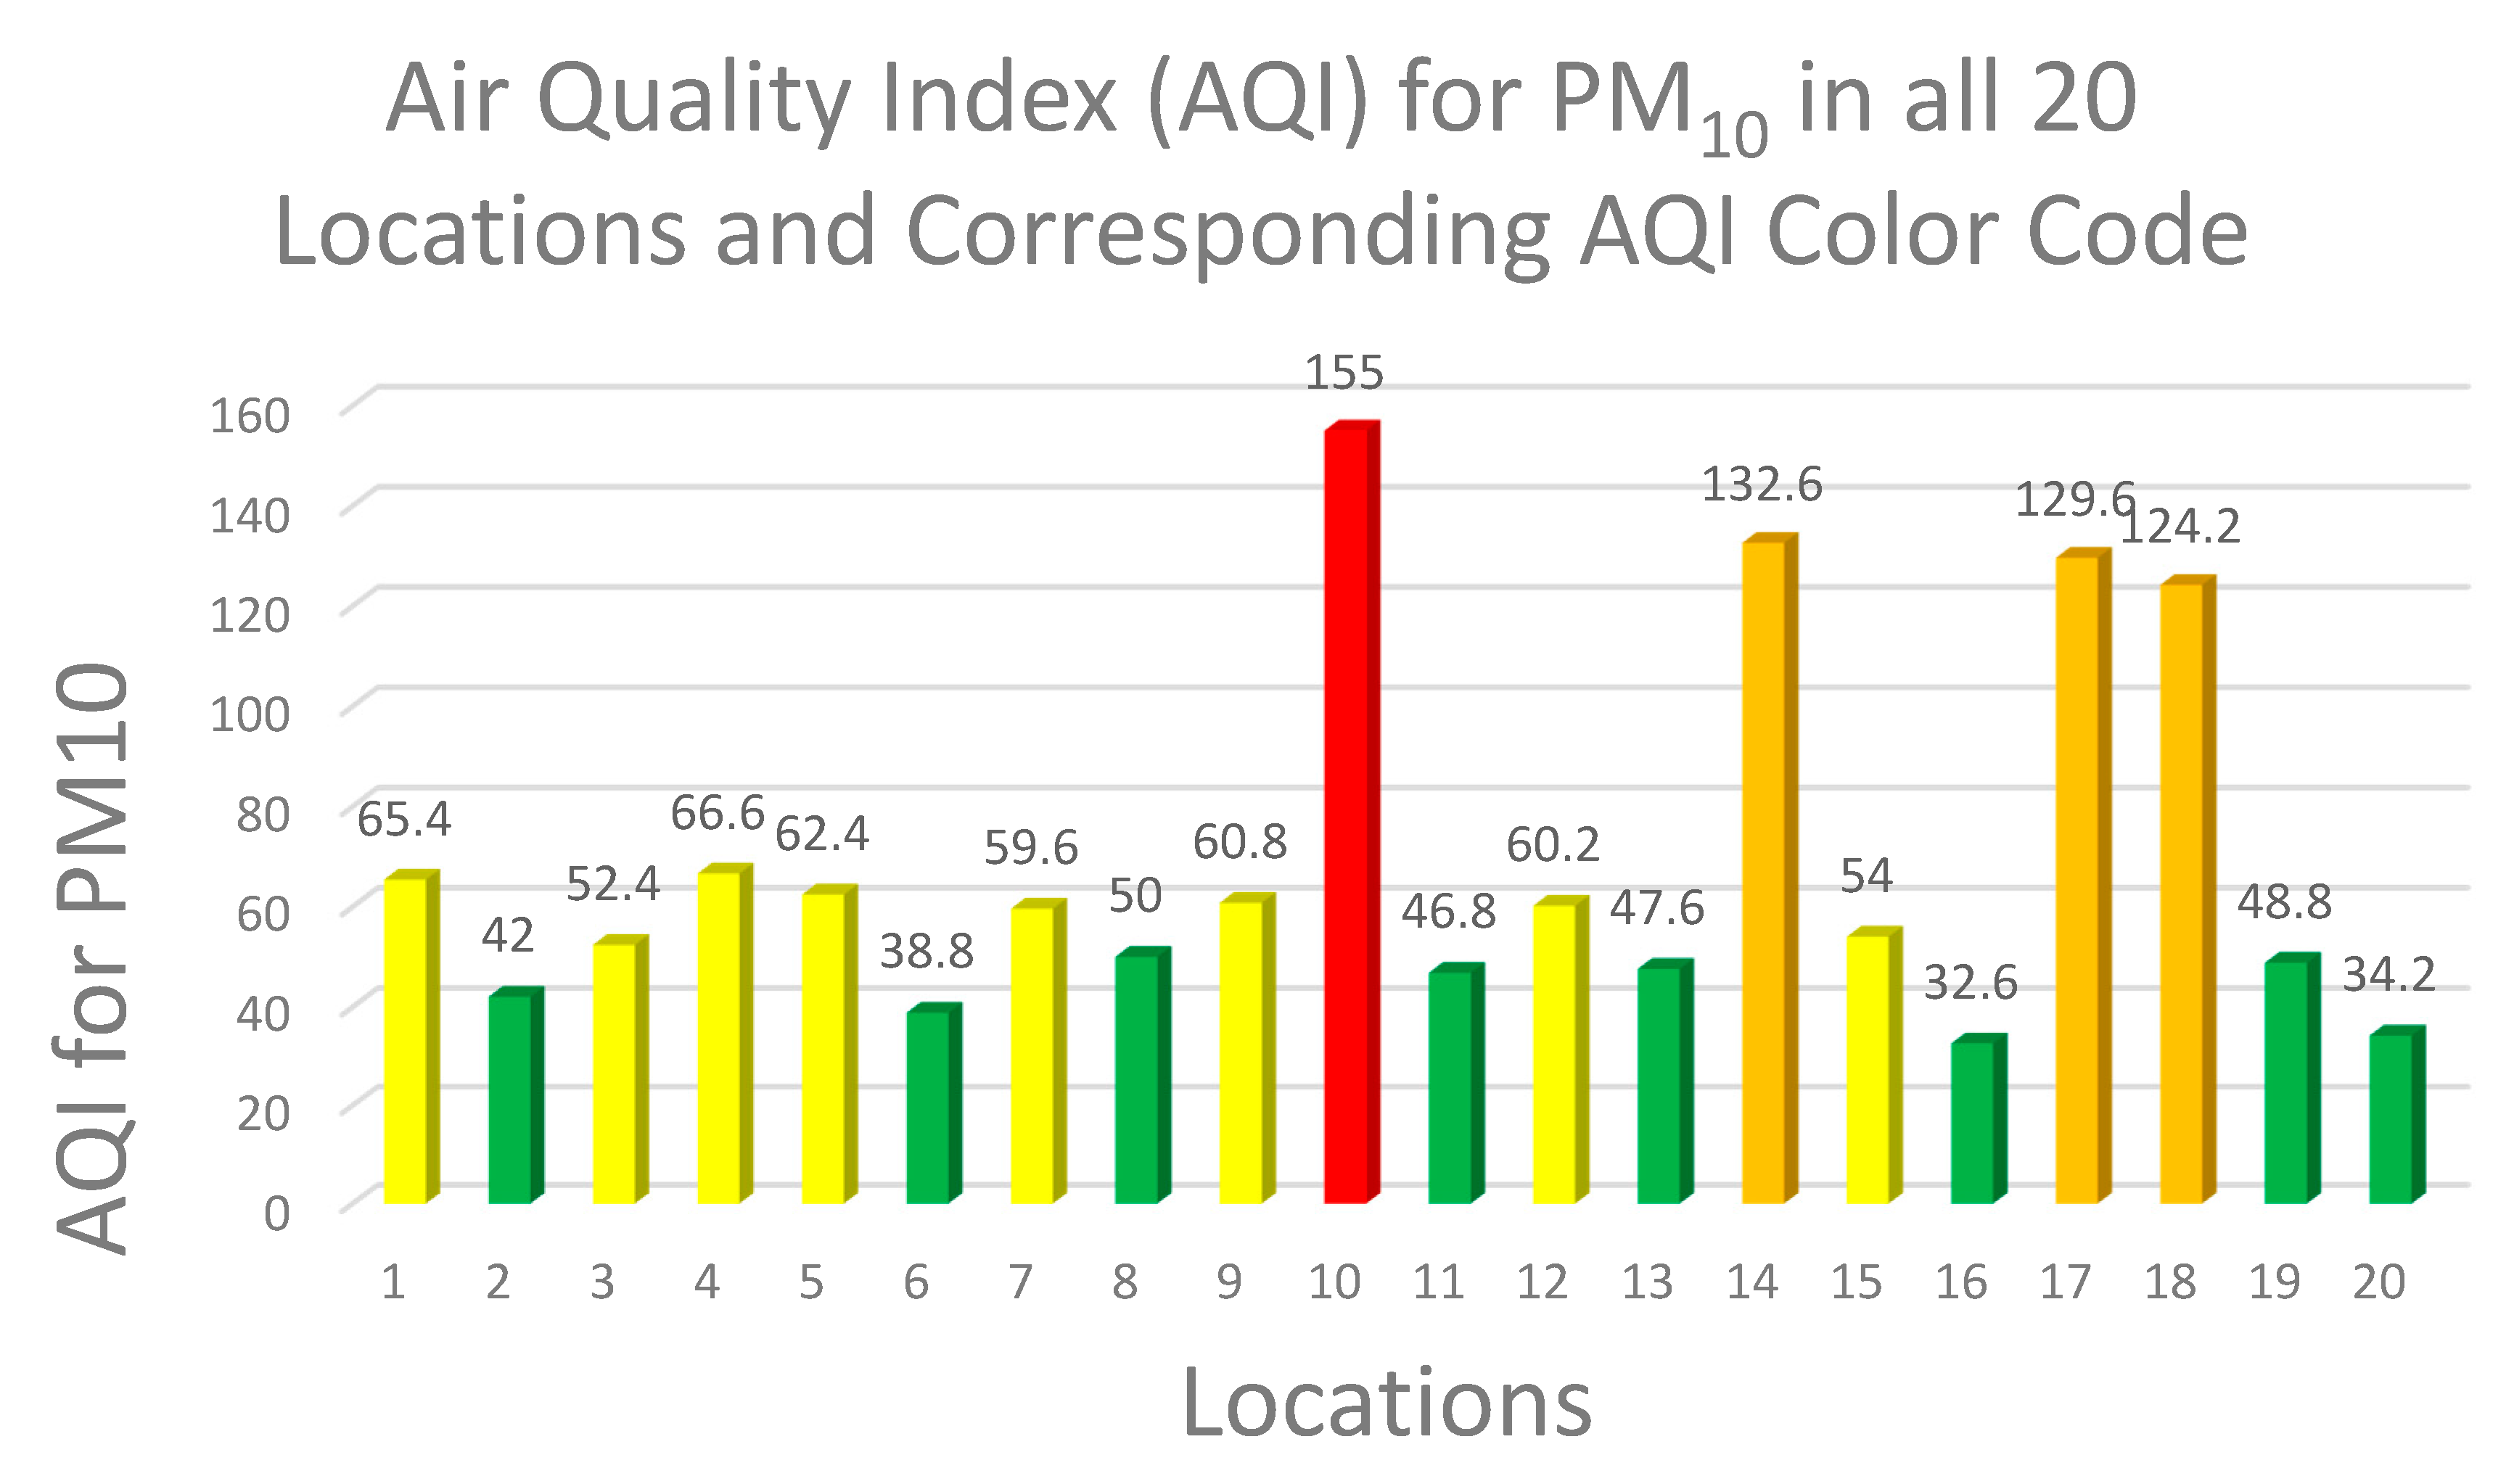
Similarly, for PM10, the calculated values for AQI pollution index in all 20 location was used to plot the graph as seen in Figure 5 below using Equation (1) above, the AQI pollutant value were calculated using the mean monitoring reading in Table 2 as pollutant concentration and WHO standard.
Figure 5 above is used to highlight the specific pollutant range and color index. It can be deduced that the health effect of PM10 is reduced compare to Figure 4 as we can see most location falls under good and moderate condition except for location 10 with the very unhealthy status and three other locations with unhealthy for sensitive groups. However, long time exposure to particulate matter may lead to reduction in life expectancy.
It can also be seen that for PM10 most of the location fell under good (green), moderate (yellow), unhealthy for sensitive people (orange) while Location 10 fell under unhealthy (red) conditions.
4. Relative Humidity, Temperature, Volatile Organic Compounds (VOCs) and Formaldehyde (HCHO)
The relative humidity of the study area as shown in Table 2 is between the ranges of 66% to 97%, the highest recorded at one of the mixed use (commercial/business) areas. The ambient air temperature (°C) is also shown in Table 2, the highest was 28 °C while the lowest was 22 °C it was observed that these recorded temperatures were as a result of the monitoring season which happens to be rainy season. Atmospheric pressure ranged from 101.20 kPa to 101.80 kPa.
Volatile organic compounds (VOCs) are emitted as gases from certain liquids and solids, this compounds may have short and long term adverse health effects depending on the exposure level. According to US EPA 2017, the concentration of VOCs is higher in indoors (ten times higher) than in outdoors as most of the ingredients used for household products are from organic chemicals [48]. Some of the household sources are; paints, solvents, cleansers, disinfectants, pesticide among others while others product includes; furnishings, building materials, offices equipment, etc. Health effects of VOCs varies greatly with exposure with organic chemicals that are highly toxic, and this depends on many factors which includes level of exposure and duration of exposures [49]. Some of the health effects are:
- Short term exposure (hours to days): eye, nose and throat irritation, headaches, nausea/vomiting, dizziness, visual disorders and memory impairment, worsening of asthma symptoms;
- Chronic exposure (years to a lifetime): cancer, liver and kidney damage, central nervous system damage.
Based on monitoring reading obtained and computed in Table 2, it can be observed that VOCs has 1.66 mg/m3 as the lowest and 9.98 mg/m3 as the highest. Taking location 17 with the highest VOC reading falls on >3 mg/m3 range in Table 3 above, also from table it can be seen that most of the high level of concentration takes place at the commercial, transport, markets and officers. From the level of health concern in Table 3, most of this location may pose some harmful effects to the population as some may experience headache, irritation and discomfort or no health effects to the population depending on the exposure level and VOCs components toxicity.
From Table 2, the formaldehyde (HCHO) in this monitoring exercise could be from byproduct of combustion and other process like emission from cars, fuel burning and cigarette smoking. Exposure to formaldehyde may cause adverse health effects like irritation of the skin, eyes, nose and throat. However, the main concerns are usually associated with long term exposure by inhalation. The monitoring results showed 0.08 mg/m3 as the lowest and 0.78 mg/m3 as the highest value.
5. Conclusions
The assessment results reveal that the concentration of PM2.5 and PM10 of some locations were above air quality index (AQI) limits set by WHO especially at the business district. This results from the assessment indicates that most the population leaving around the business district are exposure to high level of pollution. The research outcome demonstrates that the particulate matter pollution situation is not favorable in the study area as there exhibit a wide gap between assessment result of particulate matter concentration and the WHO set standards. The health risk indicates locations 10, 14, 17 and 18 are unsafe for sensitive, unhealthy and very unhealthy groups.
Based on the above, it can be recommended that the regulatory and enforcement agency needs to reexamine current regulation on air quality monitoring as well as develop a more robust monitoring mechanism, regulations and enforcement to determine the most effective and efficient way to improve the air quality. There is also a need for a national drive for renewable energy, clean energy for business/commercial district to help reduce fumes from generators and form a cleaner air initiatives, as well as ensure a safe environment to live in and to reduce particulate matters in the city. It is also recommended that more research carried out to determine the types of VOCs components available in some of the locations.
Author Contributions
Conceptualization, N.M.W.; methodology, N.M.W.; formal analysis, N.M.W.; resources, N.M.W.; data curation, N.M.W.; writing—original draft preparation, N.M.W.; writing—review and editing, N.M.W.; visualization, N.M.W.; supervision, X.D.; All authors have read and agreed to the published version of the manuscript.
Funding
This research received no external funding.
Conflicts of Interest
The authors declare no conflict of interest.
References
- WHO. Factsheet on Ambient Air Quality and Health; WHO: Geneva, Switzerland, 2018; Available online: http://www.who.int/news-room/fact-sheets/detail/ambient-(outdoor)-air-quality-and-health (accessed on 4 October 2018).
- Chen, B.; Kan, H. Air Pollution and population health: A global challenge. Environ. Health Prev. Med. 2008, 13, 94–101. [Google Scholar]
- Health Effects Institute. State of Global Air 2019; Special Report; Health Effects Institute: Boston, MA, USA, 2019; ISSN 2578-6873. [Google Scholar]
- WHO. Air Pollution: Ambient Air Pollution: Health Impacts; WHO: Geneva, Switzerland, 2018; Available online: https://www.who.int/airpollution/ambient/health-impacts/en/ (accessed on 4 October 2018).
- Cohen, A.J.; Brauer, M.; Burnett, R.; Anderson, H.R.; Frostad, J.; Estep, K.; Balakrishnan, K.; Brunekreef, B.; Dandona, L.; Dandona, R.; et al. Estimates and 25-year trends of the global burden of disease attributable to ambient air pollution: An analysis of data from the Global Burden of Diseases Study 2015. Lancet 2017, 389, 1907–1918. [Google Scholar]
- U.S. EPA. Particulate Matter (PM) Pollution; U.S. EPA: Washington, DC, USA, 2017. Available online: https://www.epa.gov/pm-pollution/particulate-matter-pm-basics (accessed on 15 December 2019).
- Andrella Tersoo 2018. Available online: https://www.naija.ng/1176017-causes-effects-air-pollution-nigeria.html#1176017 (accessed on 4 October 2018).
- Aga, C. Nigeria: State by State. 2009. Available online: www.nigeriabookofrecords.com (accessed on 11 October 2018).
- Abuja Population. 17 December 2017. Available online: http://worldpopulationreview.com/world-cities/abuja/ (accessed on 11 October 2018).
- E+E Elecktronik. Omniport 30. 2019. Available online: http://downloads.epluse.com/fileadmin/data/product/omniport30/datasheet_Omniport30.pdf (accessed on 15 June 2020).
- BLATN. Product-BLATN Air Quality Monitoring: BR-Smart Air Quality Detector. 2018. Available online: http://www.blatn.com/Content/details/id/904.html (accessed on 12 October 2018).
- GMM Technoworld Pte Ltd. BRAMC 4-in-1 Air Quality Monitor PM2.5 PM10 Formaldehyde (HCHO) VOCs; GMM Technoworld Pte Ltd.: Trivex, Singapore, 2018; Available online: https://www.testmeter.sg/products/BRAMC-4-in-1-Air-Quality-Monitor-PM2.5-PM10-Formaldehyde-(HCHO)-VOCs/537 (accessed on 12 October 2018).
- Shan, W.P.; Yin, Y.Q.; Lu, H.X.; Liang, S.X. A Meteorological analysis of ozone episodes using HYSPLIT model and surface data. Atmos. Res. 2009, 93, 767–776. [Google Scholar]
- Li, M.M.; Huang, X.; Zhu, L.; Li JFSong, Y.; Cai, X.H.; Xie, S.D. Analysis of the transport pathways and potential sources of PM10 in Shanghai based on three methods. Sci. Total Environ. 2012, 414, 525–534. [Google Scholar]
- Zemmer, F.; Karaca, F.; Ozkaragoz, F. Ragweed pollen observed in turkey: Detection of sources using back trajectory models. Sci. Total Environ. 2012, 430, 101–108. [Google Scholar]
- Air Resources Laboratory. HYSPLIT-2; Air Resources Laboratory: Silver Spring, MD, USA, 2019. Available online: https://www.arl.noaa.gov/hysplit/hysplit/ (accessed on 11 February 2019).
- Ready.arl.noaa.gov.READY—Real-time Environmental Applications and Display sYstem. 2019. Available online: https://ready.arl.noaa.gov/index.php (accessed on 11 February 2019).
- U.S. EPA. Air Quality Index (AQI). A Guide to Air Quality and Your Health; EPA-456/F-14-002; U.S. Environmental Protection Agency Office of Air Quality Planning and Standards Outreach and Information Division Research: Triangle Park, NC, USA, 2014; pp. 1–12. [Google Scholar]
- U.S. EPA. Air Quality Index—A Guide to Air Quality and Your Health; Brochure; EPA-456/F-14-002; U.S. EPA: Washington, DC, USA, 2014. Available online: https://www3.epa.gov/airnow/aqi_brochure_02_14.pdf (accessed on 18 October 2018).
- Longinus, N.K.; John, R.T.; Olatunde, A.M.; Alex, A.A.; Omosileola, J.A. Ambient Air Quality Monitoring in Metropolitan City of Lagos, Nigeria. J. Appl. Sci. Environ. Manage. March. 2016, 20, 178–185. [Google Scholar]
- AirNow. AirNow.gov—Home of the Air Quality Index: AQI Basics. 2018. Available online: https://airnow.gov/aqi/aqi-basics (accessed on 18 October 2018).
- AirNow. AQI to Concentration Calculator. 2018. Available online: https://www.airnow.gov/aqi/aqi-calculator (accessed on 18 October 2018).
- OECD.Stat. Exposure to PM2.5 in Countries and Regions: Exposure to PM2.5 in Macroregions. 2018. Available online: https://stats.oecd.org/index.aspx?queryid=72722 (accessed on 23 May 2019).
- Dominici, F.; Peng, R.D.; Bell, M.L.; Pham, L.; McDermott, A.; Zeger, S.L.; Samet, J.M. Fine particulate air pollution and hospital admission for cardiovascular and respiratory diseases. J. Am. Med. Assoc. 2006, 295, 1127–1134. [Google Scholar]
- Yang, W.; Wang, G.; Bi, C. Analysis of longrange transport effects on PM2.5 during a short severe haze in Beijing, China. Aerosol. Air Qual. Res. 2017, 17, 1610–1622. [Google Scholar]
- Yang, X.; Jiang, L.; Zhao, W.; Xiong, Q.; Zhao, W.; Yan, X. Comparison of Ground-Based PM2.5 and PM10 Concentrations in China, India, and the U.S. Int. J. Environ. Res. Public Health 2018, 15, 1382. [Google Scholar]
- Li, R.; Zhou, R.; Zhang, J. Function of PM2.5 in the pathogenesis of lung cancer and chronic airway inflammatory diseases. Oncol. Lett. 2018, 15, 7506–7514. [Google Scholar]
- Cohen, J. Statistical Power Analysis for the Behavioral Sciences, 2nd ed.; Erlbaum: Hillsdale, NJ, USA, 1988. [Google Scholar]
- Zhou, T.; Sun, J.; Yu, H. Temporal and spatial patterns of China’s main air pollutants: Years 2014 and 2015. Atmosphere 2017, 8, 137. [Google Scholar]
- Perrone, M.R.; Becagli, S.; Orza JGVecchi, R.; Dinoi, A.; Udisti, R.; Cabello, M. The impact of long-range-transport on PM1 and PM2.5 at a central Mediterranean site. Atmos. Environ. 2013, 71, 176–186. [Google Scholar]
- Dublin-Green, C.O.; Awosika, L.F.; Folorunsho, R. Climate Variability Research Activities in Nigeria; Nigerian Institute for Oceanography and Marine Research: Victoria Island, Lagos, Nigeria, 1999. [Google Scholar]
- David, O.; Charles, O.; Esu, O. Estimating greenhouse gas emissions from port vessel operations at the Lagos and Tin Can ports of Nigeria. Cogent Eng. 2018, 5, 1507267. [Google Scholar]
- Oyedepo, S.O. Towards achieving energy for sustainable development in Nigeria. Renew. Sustain. Energy Rev. 2014, 34, 255–272. [Google Scholar]
- U.S. EIA (United States Energy Information Administration). Country Analysis Brief: Nigeria; U.S. EIA: Washington, DC, USA, May 2016. Available online: https://www.eia.gov/beta/international/analysis_includes/countries_long/Nigeria/nigeria.pdf (accessed on 6 March 2019).
- Giwa, S.O.; Adama, O.O.; Akinyemi, O.O. Baseline black carbon emissions for gas flaring in the Niger Delta region of Nigeria. J. Nat. Gas Sci. Eng. 2014, 20, 373–379. [Google Scholar]
- McEwen, J.D.; Johnson, M.R. Black carbon particulate matter emission factors for buoyancy-driven associated gas flares. J. Air Waste Manag. Assoc. 2012, 62, 307–321. [Google Scholar]
- Obanijesu, E.; Adebiyi, F.; Sonibare, J.; Okelana, O. Air-borne SO2 pollution monitoring in the upstream petroleum operation areas of Niger-Delta, Nigeria. Energy Sour. Part A 2009, 31, 223–231. [Google Scholar]
- Sonibare, J.; Adebiyi, F.; Obanijesu, E.; Okelana, O. Air quality index pattern around petroleum production facilities. Manag. Environ. Qual. Int. J. 2010, 21, 379–392. [Google Scholar]
- Gobo, A.E.; Richard, G.; Ubang, I.U. Health impact of gas flares on Igwuruta/Umuechem communities in Rivers State. J. Appl. Sci. Environ. Manag. 2009, 13, 27–33. [Google Scholar]
- Ovuakporaye, S.I.; Aloamaka, C.P.; Ojieh, A.E.; Ejebe, D.E.; Mordi, J.C. Effect of gas flaring on lung function among residents in gas flaring community in Delta State, Nigeria. Res. J. Environ. Earth Sci. 2012, 4, 525–528. [Google Scholar]
- Adienbo, O.M.; Nwafor, A. Effect of prolong exposure to gas flaring on some haematological parameters of humans in the Niger Delta Region of Nigeria. J. Appl. Sci. Environ. Manag. 2010, 14, 13–15. [Google Scholar]
- Ristovski, Z.D.; Miljevic, B.; Surawski, N.C.; Morawska, L.; Fong, K.M.; Goh, F.; Yang, I.A. Respiratory health effects of diesel particulate matter. Respirology 2011, 29. [Google Scholar] [CrossRef] [Green Version]
- Ayres, J.G.; Borm, P.; Cassee, F.R.; Castranova, V.; Donaldson, K.; Ghio, A.; Harrison, R.M.; Hider, R.; Kelly, F.; Kooter, I.M.; et al. Evaluating the toxicity of airborne particulate matter and nanoparticles by measuring oxidative stress potential—A workshop report and consensus statement. Inhal. Toxicol. 2008, 20, 75–99. [Google Scholar]
- Mortimer, K.M.; Neas, L.M.; Dockery, D.W.; Redline, S.; Tager, I.B. The effect of air pollution on inner-city children with asthma. Eur. Respir. J. 2002, 19, 699–705. [Google Scholar]
- Jang, A.-S. Particulate Air Pollutants and Respiratory Diseases, Air Pollution—A Comprehensive Perspective, Budi Haryanto; IntechOpen: London, UK, 22 August 2012; pp. 153–174. Available online: https://www.intechopen.com/books/air-pollution-a-comprehensive-perspective/particulate-air-pollutants-and-respiratory-diseases (accessed on 30 November 2018). [CrossRef]
- Pope, C.A.; Dockery, D.W. Health effects of fine particulate air pollution: Lines thatconnect. J. Air Waste Manage. Assoc. 2006, 56, 709–742. [Google Scholar]
- Breysse, P.N.; Diette, G.B.; Matsui, E.C.; Butz, A.M.; Hansel, N.N.; Mc Cormack, M.C. Indoor air pollution and asthma in children. Proc. Am. Thorac. Soc. 2010, 7, 102–106. [Google Scholar]
- U.S. EPA. Volatile Organic Compounds’ Impact on Indoor Air Quality; U.S. EPA: Washington, DC, USA, 2017. Available online: https://www.epa.gov/indoor-air-quality-iaq/volatile-organic-compounds-impact-indoor-air-quality (accessed on 30 November 2018).
- European Commission Joint Research Centre—Environment. Total Volatile Organic Compounds (TVOC) in Indoor Air Quality Investigations; report 19, Brussels1997 Contract No.: EUR 17675 EN; European Commission Joint Research Centre: Ispra, Italy, 1997; Available online: http://ihcp.jrc.ec.europa.eu/our_activities/publichealth/indoor_air_quality/eca/eca_report_19 (accessed on 30 November 2018).
- Environemntal Analtical Sevrices, Inc. Total Volatile Organic Compounds; Environemntal Analtical Sevrices, Inc.: New York, NY, USA, 2015; Available online: https://easlab.com/iaqref.htm (accessed on 15 June 2020).
Figure 1.
Map of Federal Capital Territory (FCT) showing Abuja and other area councils.

Figure 2.
Pearson correlation coefficients between particulate matters (PM2.5 and PM10), volatile organic chemicals (VOCs) and formaldehyde (HCHO). (A) PM2.5 vs. PM10, has a Pearson correlation coefficient (r) is 0.99**. (B) PM2.5 and VOCs, moderate Pearson correlation coefficient of 0.39. (C) PM2.5 and HCHO, a negative correlation was observed with r = −0.75.

Figure 3.
(A–D)100-, 500- and 1000-m backward trajectories in the top 4 polluted during 13th, 15th August and 4th September air assessment survey in Abuja.
Figure 3.
(A–D)100-, 500- and 1000-m backward trajectories in the top 4 polluted during 13th, 15th August and 4th September air assessment survey in Abuja.

Figure 4.
Air quality index (AQI) for PM2.5 in all 20 locations and corresponding AQI color code.

Figure 5.
Air quality index (AQI) for PM10 in all 20 locations and corresponding AQI color code.


Table 1.
Air quality index (AQI) values, PM2.5 and PM10 conc. color codes, air pollutant level of health concern.
Table 1.
Air quality index (AQI) values, PM2.5 and PM10 conc. color codes, air pollutant level of health concern.
| AQI Value of Index | Levels of Health Concern | PM2.5 Conc. (µg/m3) | PM10 Conc. (µg/m3) | Daily AQI Color | Air Pollution Level |
|---|---|---|---|---|---|
| 0–50 | Good | 0–12 | 0–54 | green | Level 1 |
| 51–100 | Moderate | 12.1–35.4 | 55–154 | yellow | Level 2 |
| 101–150 | Unhealthy for sensitive groups | 35.5–55.4 | 155–254 | orange | Level 3 |
| 151–200 | unhealthy | 55.5–150.4 | 255–354 | Red | Level 4 |
| 201–300 | Very unhealthy | 150.5–250.4 | 355–424 | Purple | Level 5 |
| 301 and Higher | Hazardous | 250.5–Higher | 425–Higher | Maroon | Level 6 |
Table 2.
Locations purpose, GPS coordinate, mean (PM2.5 and PM10), humidity, temperature and atmospheric pressure for all 20 locations.
Table 2.
Locations purpose, GPS coordinate, mean (PM2.5 and PM10), humidity, temperature and atmospheric pressure for all 20 locations.
| Location | Location Purpose | GPS Coordinate | Mean Monitoring Readings (µg/m3) | Mean Monitoring Readings (mg/m3) | Humidity (%) | Temp. (°C) | Atm. Pressure (kPa) | ||
|---|---|---|---|---|---|---|---|---|---|
| PM2.5 | PM10 | VOCs | HCHO | ||||||
| 1 | Mixed use | 9.08, 7.47 | 31.50 | 32.70 | 1.74 | 0.56 | 92 | 24 | 101.80 |
| 2 | Residential | 9.09, 7.49 | 20.20 | 21.00 | 2.09 | 0.33 | 90 | 25 | 101.33 |
| 3 | Residential | 8.99, 7.46 | 25.30 | 26.20 | 1.66 | 0.23 | 96 | 22 | 101.55 |
| 4 | Commercial/business | 9.09, 7.49 | 32.40 | 33.30 | 1.96 | 0.17 | 77 | 27 | 101.30 |
| 5 | Mixed use | 9.08, 7.50 | 28.60 | 31.20 | 2.30 | 0.19 | 85 | 26 | 101.60 |
| 6 | Commercial | 9.08, 7.48 | 18.30 | 19.40 | 3.26 | 0.18 | 80 | 24 | 101.70 |
| 7 | Airport | 9.00, 7.27 | 28.90 | 29.80 | 2.12 | 0.17 | 36 | 27 | 101.70 |
| 8 | Commercial | 9.07, 7.49 | 23.60 | 25.00 | 5.80 | 0.40 | 85 | 25 | 101.40 |
| 9 | Commercial/offices | 9.05, 7.50 | 30.00 | 30.40 | 2.02 | 1.10 | 87 | 28 | 101.60 |
| 10 | Business | 9.04, 7.48 | 70.20 | 77.50 | 6.53 | 0.08 | 90 | 24 | 101.60 |
| 11 | Commercial/business | 9.10, 7.41 | 22.20 | 23.40 | 4.88 | 0.32 | 87 | 26 | 101.30 |
| 12 | Offices | 9.05, 7.46 | 29.30 | 30.10 | 6.08 | 0.48 | 87 | 25 | 101.30 |
| 13 | Offices | 9.06, 7.49 | 23.60 | 23.80 | 1.97 | 0.78 | 93 | 24 | 101.60 |
| 14 | Market | 9.07, 7.46 | 60.10 | 66.30 | 7.49 | 0.59 | 91 | 24 | 101.66 |
| 15 | Commercial | 9.07, 7.46 | 26.20 | 27.00 | 4.96 | 0.54 | 90 | 24 | 101.70 |
| 16 | Commercial/business | 9.12, 7.40 | 15.30 | 16.30 | 9.07 | 0.27 | 86 | 26 | 101.30 |
| 17 | Business | 9.06, 7.47 | 62.60 | 64.80 | 9.98 | 0.22 | 80 | 26 | 101.20 |
| 18 | Transport Services | 9.06, 7.43 | 58.30 | 62.10 | 9.53 | 0.24 | 87 | 25 | 101.70 |
| 19 | Business | 9.07, 7.43 | 24.00 | 24.40 | 9.32 | 0.20 | 88 | 25 | 101.70 |
| 20 | Commercial/business | 9.07, 7.43 | 16.40 | 17.10 | 8.12 | 0.12 | 97 | 24 | 101.70 |
Mixed use—commercial/banks/offices/business/residential and Offices—government offices.
Table 3.
Volatile organic compounds concentration level mg/m3 [50].
Table 3.
Volatile organic compounds concentration level mg/m3 [50].
| VOCs Conc. (mg/m3) | Level of Health Concern |
|---|---|
| <0.3 | No irritation or discomfort |
| 0.3–0.5 | Irritation and discomfort possible if other exposures interact |
| 0.5–1.0 | Exposure effect and probable headache possible if other exposure interact |
| 1.0–3.0 | Headache and additional neurotoxic effects may occur |
| >3 | Irritation and discomfort are very possible |
© 2020 by the authors. Licensee MDPI, Basel, Switzerland. This article is an open access article distributed under the terms and conditions of the Creative Commons Attribution (CC BY) license (http://creativecommons.org/licenses/by/4.0/).
Share and Cite
MDPI and ACS Style
Wambebe, N.M.; Duan, X. Air Quality Levels and Health Risk Assessment of Particulate Matters in Abuja Municipal Area, Nigeria. Atmosphere 2020, 11, 817. https://0-doi-org.brum.beds.ac.uk/10.3390/atmos11080817
AMA Style
Wambebe NM, Duan X. Air Quality Levels and Health Risk Assessment of Particulate Matters in Abuja Municipal Area, Nigeria. Atmosphere. 2020; 11(8):817. https://0-doi-org.brum.beds.ac.uk/10.3390/atmos11080817
Chicago/Turabian StyleWambebe, Nathaniel Mopa, and Xiaoli Duan. 2020. "Air Quality Levels and Health Risk Assessment of Particulate Matters in Abuja Municipal Area, Nigeria" Atmosphere 11, no. 8: 817. https://0-doi-org.brum.beds.ac.uk/10.3390/atmos11080817
Note that from the first issue of 2016, this journal uses article numbers instead of page numbers. See further details here.