Climate and the Global Spread and Impact of Bananas’ Black Leaf Sigatoka Disease


1
Department of Economics, University of Bern, 3008 Bern, Switzerland
2
Sir Arthur Lewis Institute of Social and Economic Studies, University of the West Indies, St. Augustine 82391, Trinidad and Tobago
*
Author to whom correspondence should be addressed.
Atmosphere 2020, 11(9), 947; https://0-doi-org.brum.beds.ac.uk/10.3390/atmos11090947
Submission received: 7 August 2020
/
Revised: 29 August 2020
/
Accepted: 31 August 2020
/
Published: 5 September 2020
(This article belongs to the Special Issue Plant Adaptation to Global Climate Change)
Abstract
:While Black Sigatoka Leaf Disease (Mycosphaerella fijiensis) has arguably been the most important pathogen affecting the banana industry over the past 50 years, there are no quantitative estimates of what risk factors determine its spread across the globe, nor how its spread has affected banana producing countries. This study empirically models the disease spread across and its impact within countries using historical spread timelines, biophysical models, local climate data, and country level agricultural data. To model the global spread a empirical hazard model is employed. The results show that the most important factor affecting first time infection of a country is the extent of their agricultural imports, having increased first time disease incidence by 69% points. In contrast, long distance dispersal due to climatic factors only raised this probability by 0.8% points. The impact of disease diffusion within countries once they are infected is modelled using a panel regression estimator. Findings indicate that under the right climate conditions the impact of Black Sigatoka Leaf Disease can be substantial, currently resulting in an average 3% reduction in global annual production, i.e., a loss of yearly revenue of about USD 1.6 billion.
1. Introduction
While early farming hunter-gatherers were probably aware of the existence of fungal crop diseases and their potential impact, given that they depended on a local natural, often diverse, population of plants, the range for gathering was likely easily extended and thus any impact was minimized (Agrios [1] and Scheffer [2]). However, as the domestication of plants and the development and dissemination of techniques for raising them productively increased around 8000 years ago, resulting in larger areas of plantation as well as the reliance on fewer crops, food security became increasingly more vulnerable to disease outbreaks. As a matter of fact, there are ample references in historical documents that make reference to such events and their often devastating impacts (Agrios [1]). Modern globalization and specialization of agricultural production in the 19th century further encouraged the focus on fewer crop varieties, leading to further susceptibility to crop diseases. In some instances crop disease outbreaks have even been argued to have changed history, as, for example, through massive migration following the 1845 potato famine in Ireland (Gráda and O’Rourke [3]), the near downfall of the wine industry during the Downy Mildew of Grapes outbreak in the Mediterranean for wine in 1865 (Simms [4]), or the switch from drinking coffee to tea in the British Empire as a result of the coffee leaf rust in the 1890s in Sri Lanka (Money [5]). Finally, with the agricultural green revolution in the 1960s, which involved breeding and encouraging specific varieties that had higher yield potential, monocropping became firmly established across the globe (Hunter et al. [6]).
The link between crop monoculture systems and crop diseases is straight forward: by focusing on fewer varieties with higher genetic uniformity, many crops have become substantially more susceptible to both old and newly arising varieties of fungi (Wolfe [7] and Garrett and Mundt [8]). Moreover, with increasing globalization and specialization the transmission of diseases has also increased on a much greater geographical scale (Gergerich et al. [9]). Measures to prevent or dampen crop disease outbreaks through the increasing use of existing and the development of new pesticides, as well as strictly controlling the import of plant related products into countries, have only been partially effective. In terms of the former, many fungi have shown increased resistance to existing pesticides over time (Lucas et al. [10]) (As a matter of fact, despite a clear increase in pesticide use, crop losses have not significantly decreased during the last 40 years (Oerke [11])). For the latter, not only are there arguably inefficiencies in current legislation implementation (Perrings [12]), but for many crop fungi even strictly enforced physical borders may not be effective as these can still spread through the atmosphere over long distances (Brown and Hovmøller [13]). As a matter of fact, rough estimates suggest that currently losses of major crops due to fungal diseases amount to enough to feed 8.5% of the global population (Fisher et al. [14]), and between 10 to 40% of global production (Savary et al. [15]). These losses continue to occur despite the fact that many countries have implemented integrated disease management, including the biological control of many pests and diseases (HE et al. [16]).
Within the context of the important role that fungal diseases play in the evolution of many major crops, bananas are perhaps the most exemplary. More specifically, 160 years ago few people outside banana growing countries would have even known the taste of a banana (Marin et al. [17]). However, after 1870, with the first commercialization of banana exports, the introduction of refrigerated shipping, the growing taste for the tropical fruit, and the expansion of organized cultivation into Central America, bananas became one of the most important crops globally (Abbott [18] and Koeppel [19]). Today it is the most exported fruit, and the fourth most imported crop globally. Bananas earn approximately US$ 8 billion annually from the production of 114 million tonnes on million hectares of land (Authors’ own calculations using data from FAOSTAT), and are produced in more than 100 countries in tropical and subtropical regions, including Africa, Asia, the Pacific islands, Latin America and the Caribbean (Churchill [20]). However, bananas have also been a crop decidedly marked by disease. More precisely, early exports were dominated by a single banana cultivar, the Gros Michel banana, but the appearance of Panama fungal disease in Central America, the main global exporting region of bananas, wiped out vast tracts of plantations (Koeppel [19]). Consequently, most banana exporting plantations replaced the Gros Michel with the Cavendish cultivar, which is resistant to Panama disease. However, in the early 1960s a new fungal disease, Black Sigatoka Leaf Disease (BSLD), to which the Cavendish cultivar is extremely susceptible, started spreading across the banana growing world. It has now been detected in nearly half of all banana producing countries and is likely to further spread through natural and human induced channels (Brown and Hovmøller [13]). The disease can reduce yields by up to 90% and induce early ripening, the latter being an important drawback for a fruit that is usually shipped unripe and then artificially ripened in transport or industrial greenhouses (de Bellaire et al. [21] and Alamo et al. [22]). BSLD is now considered one of the world’s main crop diseases, and while chemical treatment can partially help control it, such measures have increased production costs substantially and fungicide resistance appears to be increasing(Jones et al. [23]).
Despite the potential historical importance of fungi diseases for many crops, apart from rough figures, direct evidence on the actual quantitative impact at a global and long-term scale is virtually non-existent (For example, Savary et al. [15] conduct a survey among crop health experst in order to derive their estimates). For example, in terms of the quantitative impact of BSLD on bananas specifically, there is, as far as we are aware, no existing empirical study, not even at a local scale (The only two econometric studies related to the topic, Edmeades et al. [24] and Kenneth et al. [25], both investigate the impact of the perceived risk of black sigatoka and the adaption of resistant varieties, respectively, on farmers’ banana planting decisions in Uganda). Rather, a few papers have used simulations to predict the economic impact of the disease and possible preventive measures on banana production. For instance, Alamo et al. [22] use an equilibrium displacement model for Puerto Rico and find that even with import prohibition measures and assistance from the government, the introduction of the disease would result in loss of yields of 10%. In their partial equilibrium model for Australia, Cook et al. [26] show that under import restrictions expected damage to the banana industry due to Black Sigatoka would be around USD 40 million dollars, and would increase to USD 130 million, which is about a third of the gross annual value of production, if all quarantine restrictions were removed.
In this paper we, to the best of our knowledge for the first time, estimate the historical global impact of a major crop disease, using the case study of bananas and BSLD. To this end we first construct the history of first time infections across the globe. We then simulate the long distance wind dispersal and local diffusion of the disease using gridded (≈50 km) climate data and known optimal conditions relevant to BSLD. These data allow us to empirically model the risk factors related to the spread of the disease across countries, as well as the impact on banana production once a country becomes infected. The fact that we model variations in the disease spread only based on optimal climatic conditions, while controlling for climatic factors in general, allows us to arguably identify true causal effects. Our results show that trade in agricultural products has played the main role in diffusion across countries, while long distance wind dispersal has only played a minor part. The analysis also demonstrates that once countries are infected, climatic conditions conducive to the local diffusion of BSLD can cause considerable losses, currently on average about a 2–3% reduction in global banana production.
2. Black Sigatoka Leaf Disease & Climate
BSLD is caused by the pathogens Myscosphaerella fijiensis in their sexual state, and by Paracercospora fijiensis in their asexual form. Infection can occur via both ascospores (sexual) and conida (asexual). The evolution of the disease occurs mainly from the top to the bottom of the banana plant, where aerospores first affect the stomata and then ultimately the leaves (de Bellaire et al. [21]). This can lead to the production of conida which further infects the tree. The first symptoms are reddish brown streaks which grow to form large darker lesions. This leaf spotting has two types of impacts on banana yield. Firstly, because it affects the photosynthetic area of the leaves and diminishes the leaf area, which consequently has a strong effect on bunch weight (Ramsey et al. [27]). Secondly, it reduces the greenlife, i.e., the time between harvest and climacteric rise, of harvested fruits from diseased plants, and thus the ability to export the fruit over long distances (de Bellaire et al. [21]).
Importantly spore germination of BSLD crucially depends on the micro-climate and it is this feature that is used in this study to model the aerial dispersion and local diffusion of the disease (de Bellaire et al. [21] and Bebber [28]). More specifically, in order to germinate and infect the leaf spores Myscosphaerella fijiensis requires very high relative humidity or a wet leaf surface, and once these conditions are present the rate of germination and infection will also depend on the temperature. In terms of the spread of the disease, both conida and ascospores seem to play a role, again subject to the right climatic conditions. For conida the principal agents of dispersal appear to be rain wash and rain splash. In contrast, while rainfall still plays a role in the release of ascospores, wind appears to be the primary carrier, where its speed and degree of turbulence appear to be important drivers (Marin et al. [17], Norros et al. [29]). It is common to distinguish between gradual local disease spread (LDS) and much rarer, stochastic long distance dispersal (LDD) (Golan and Pringle [30]).
3. Results
3.1. Descriptive Results
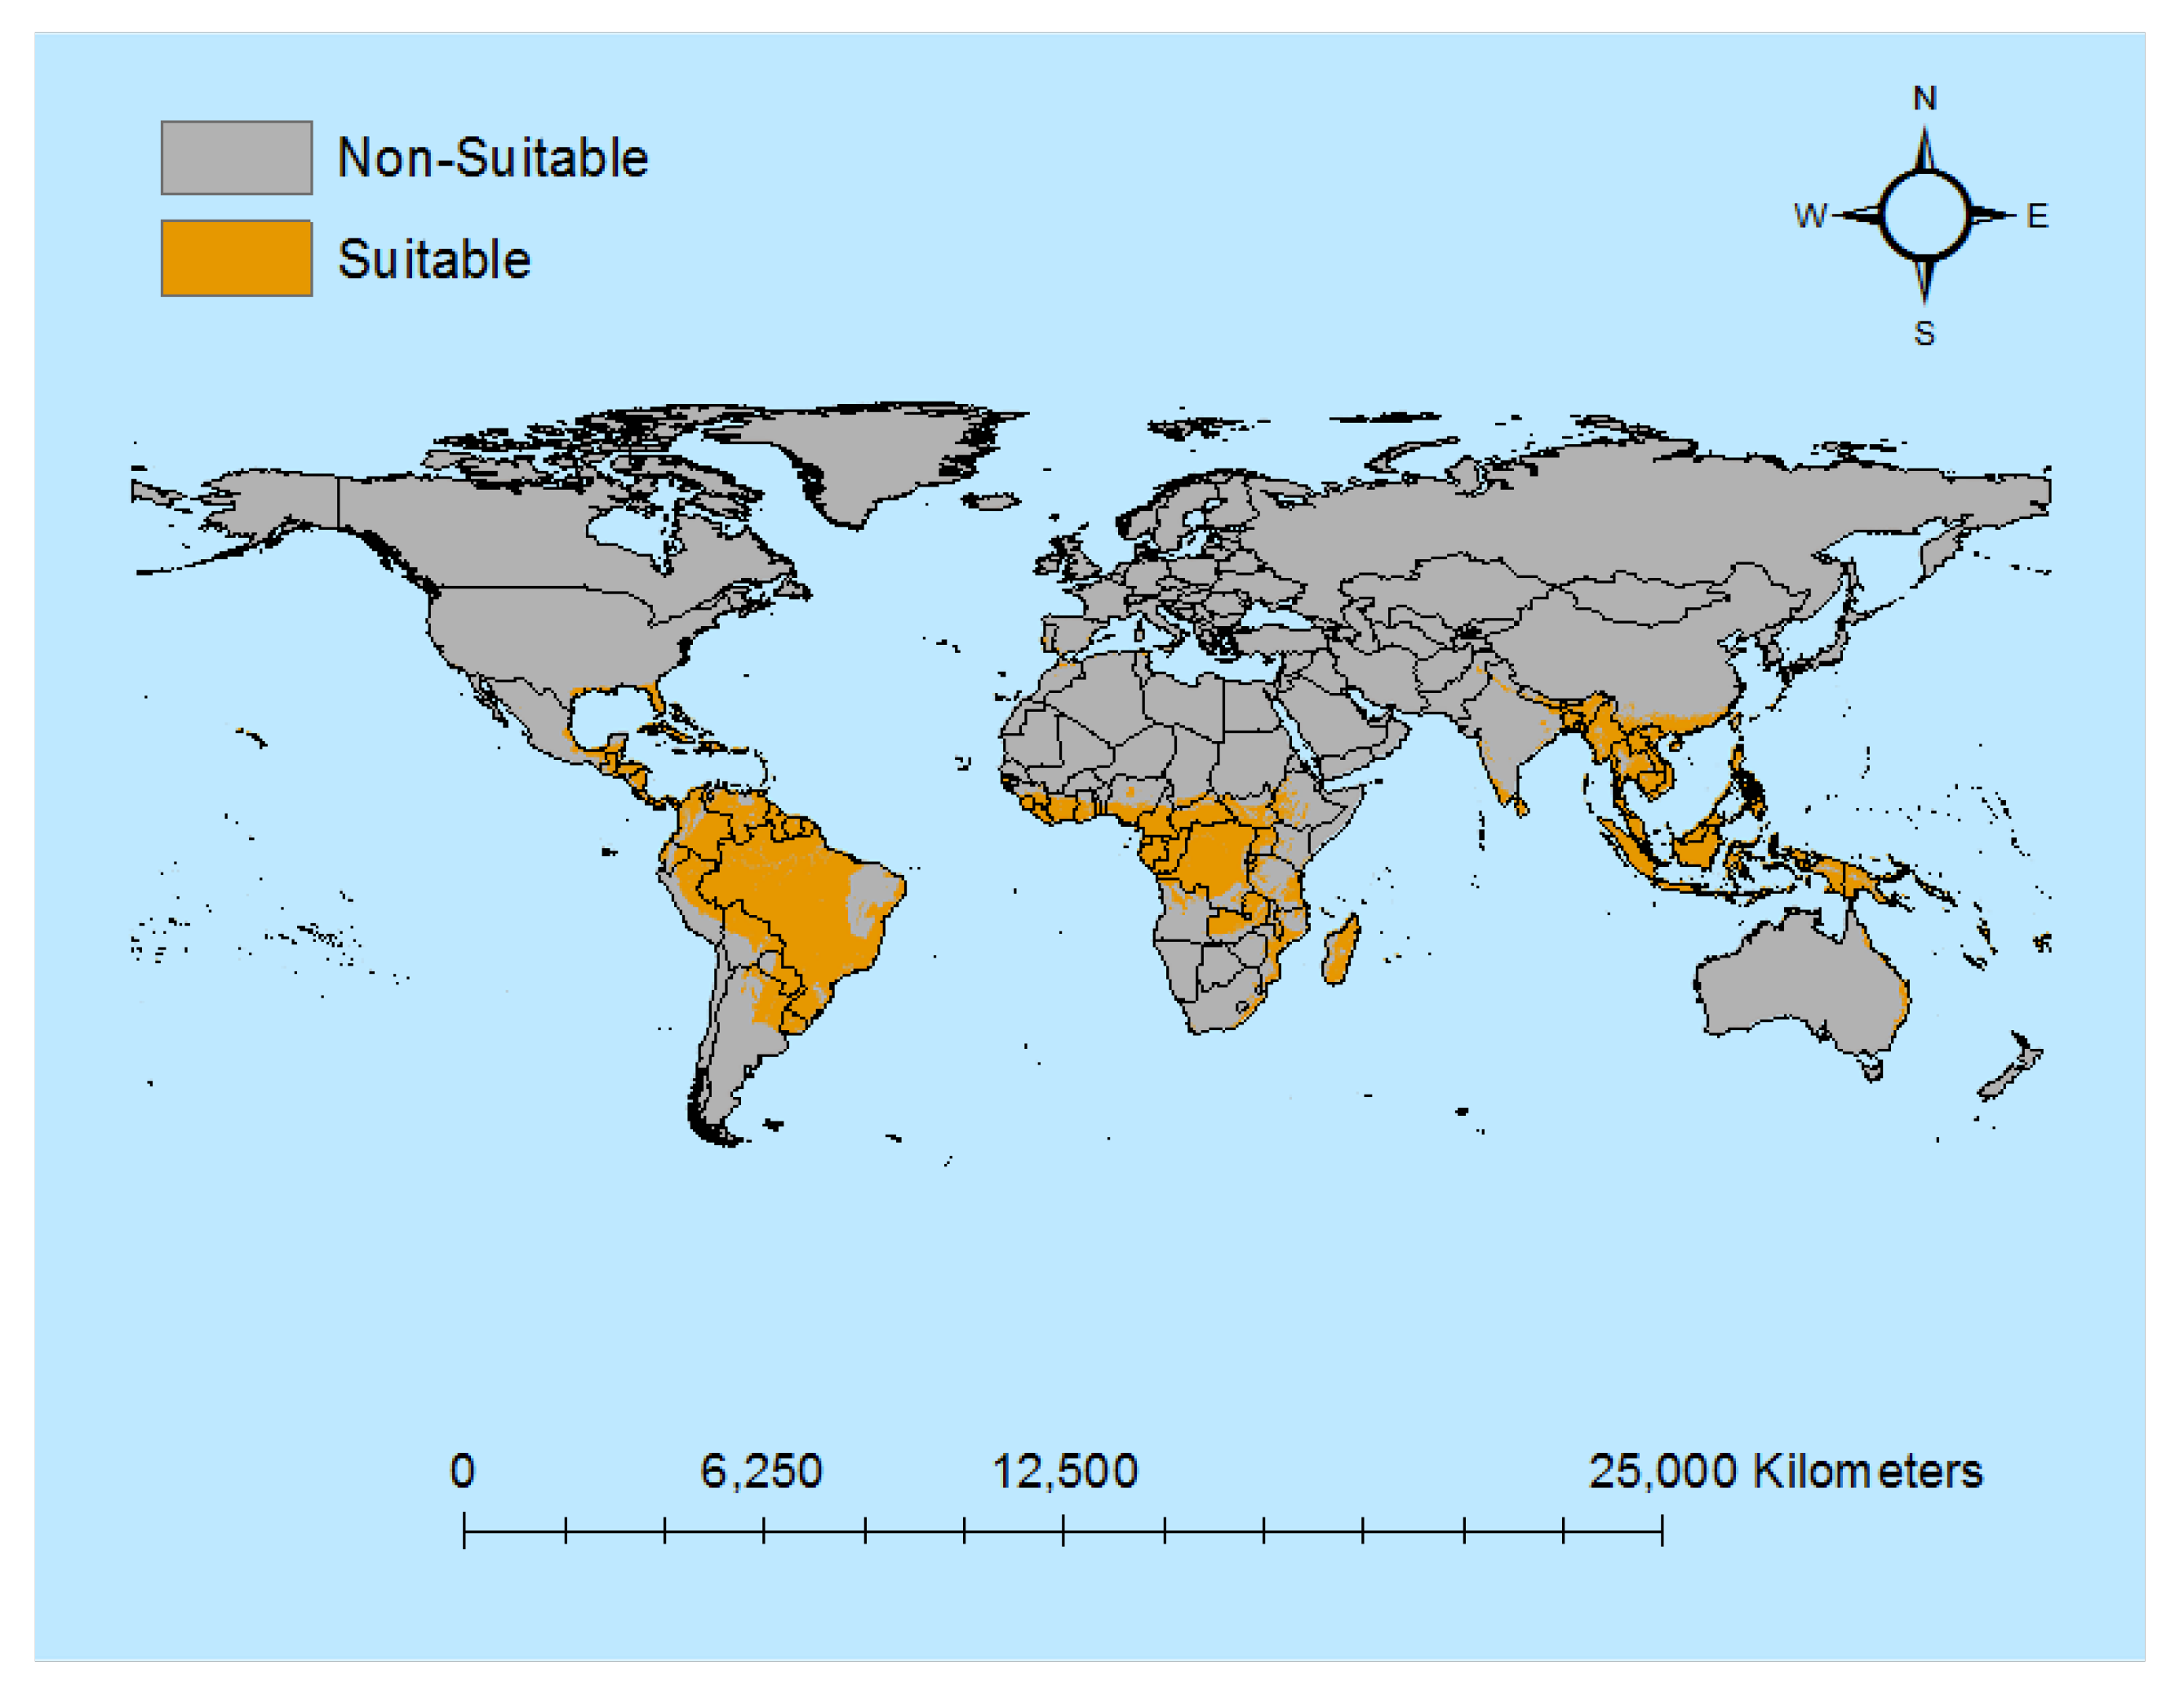
Figure 1 shows the global spatial distribution of areas suitable for banana production that is used as the basis of allocating climate and modelling disease spread for the analysis. As can be seen, these are located in the tropical and sub-tropical regions across Asia, Africa, the South Pacific and the Americas.
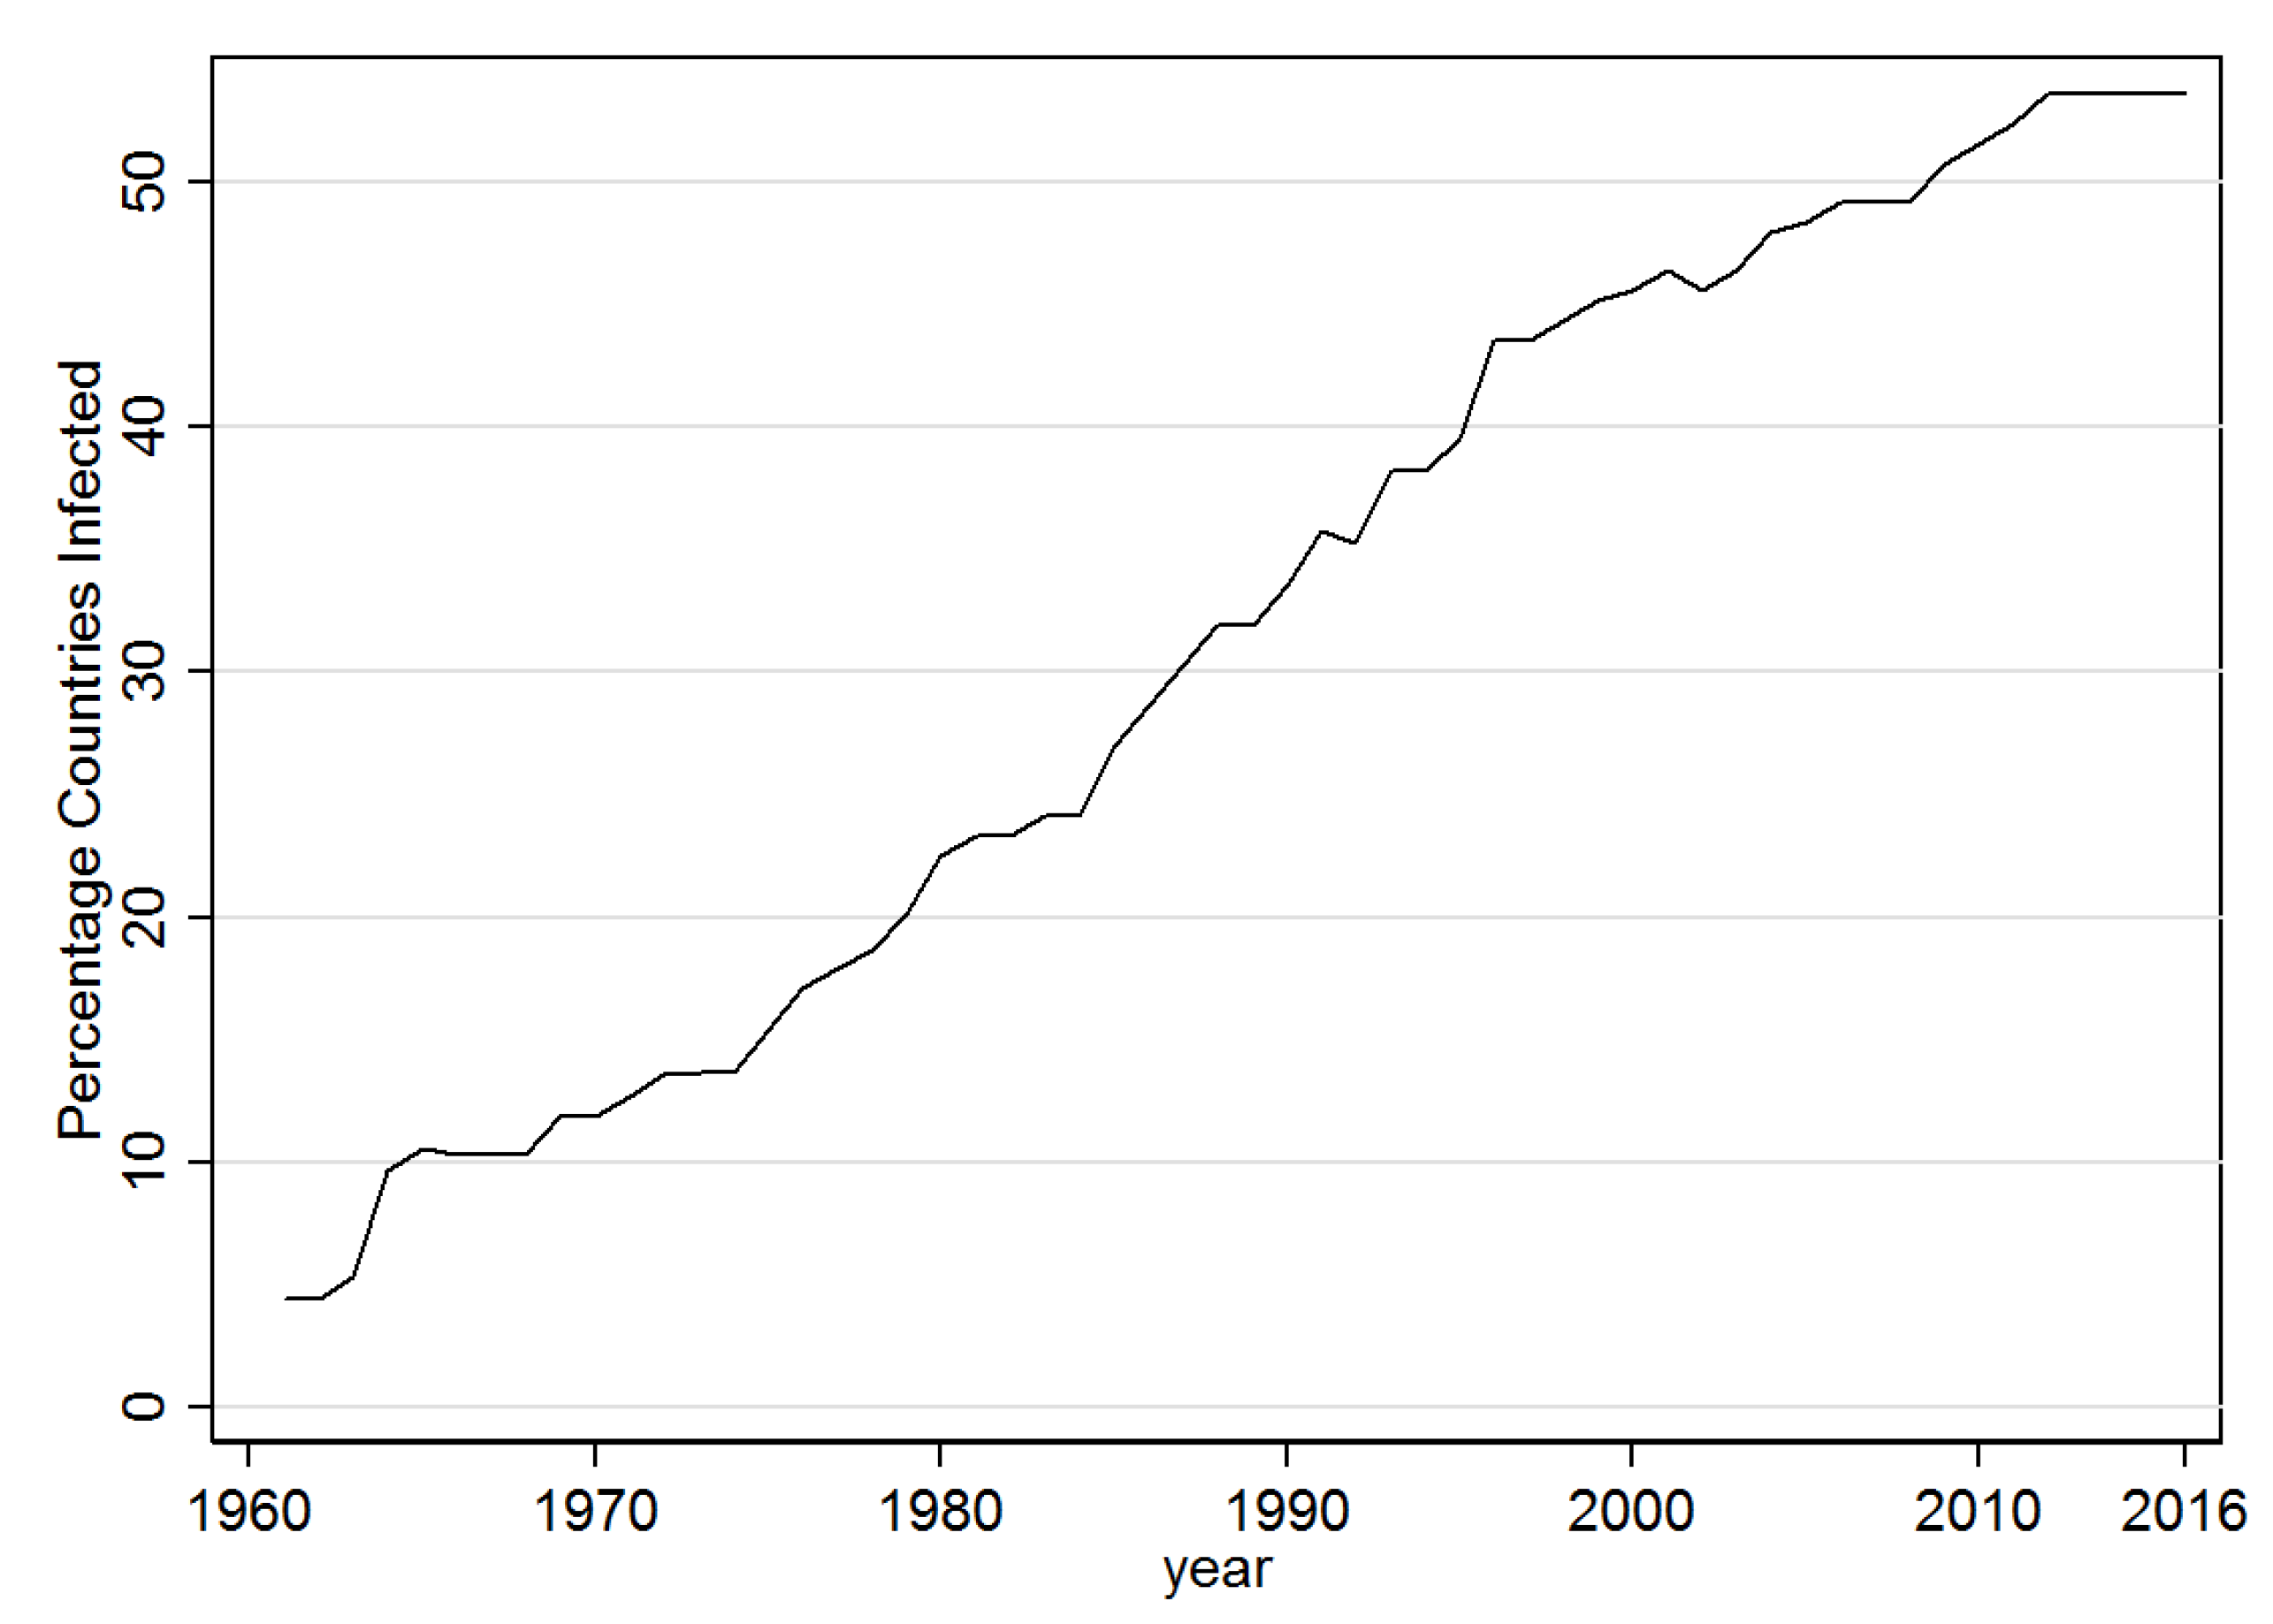
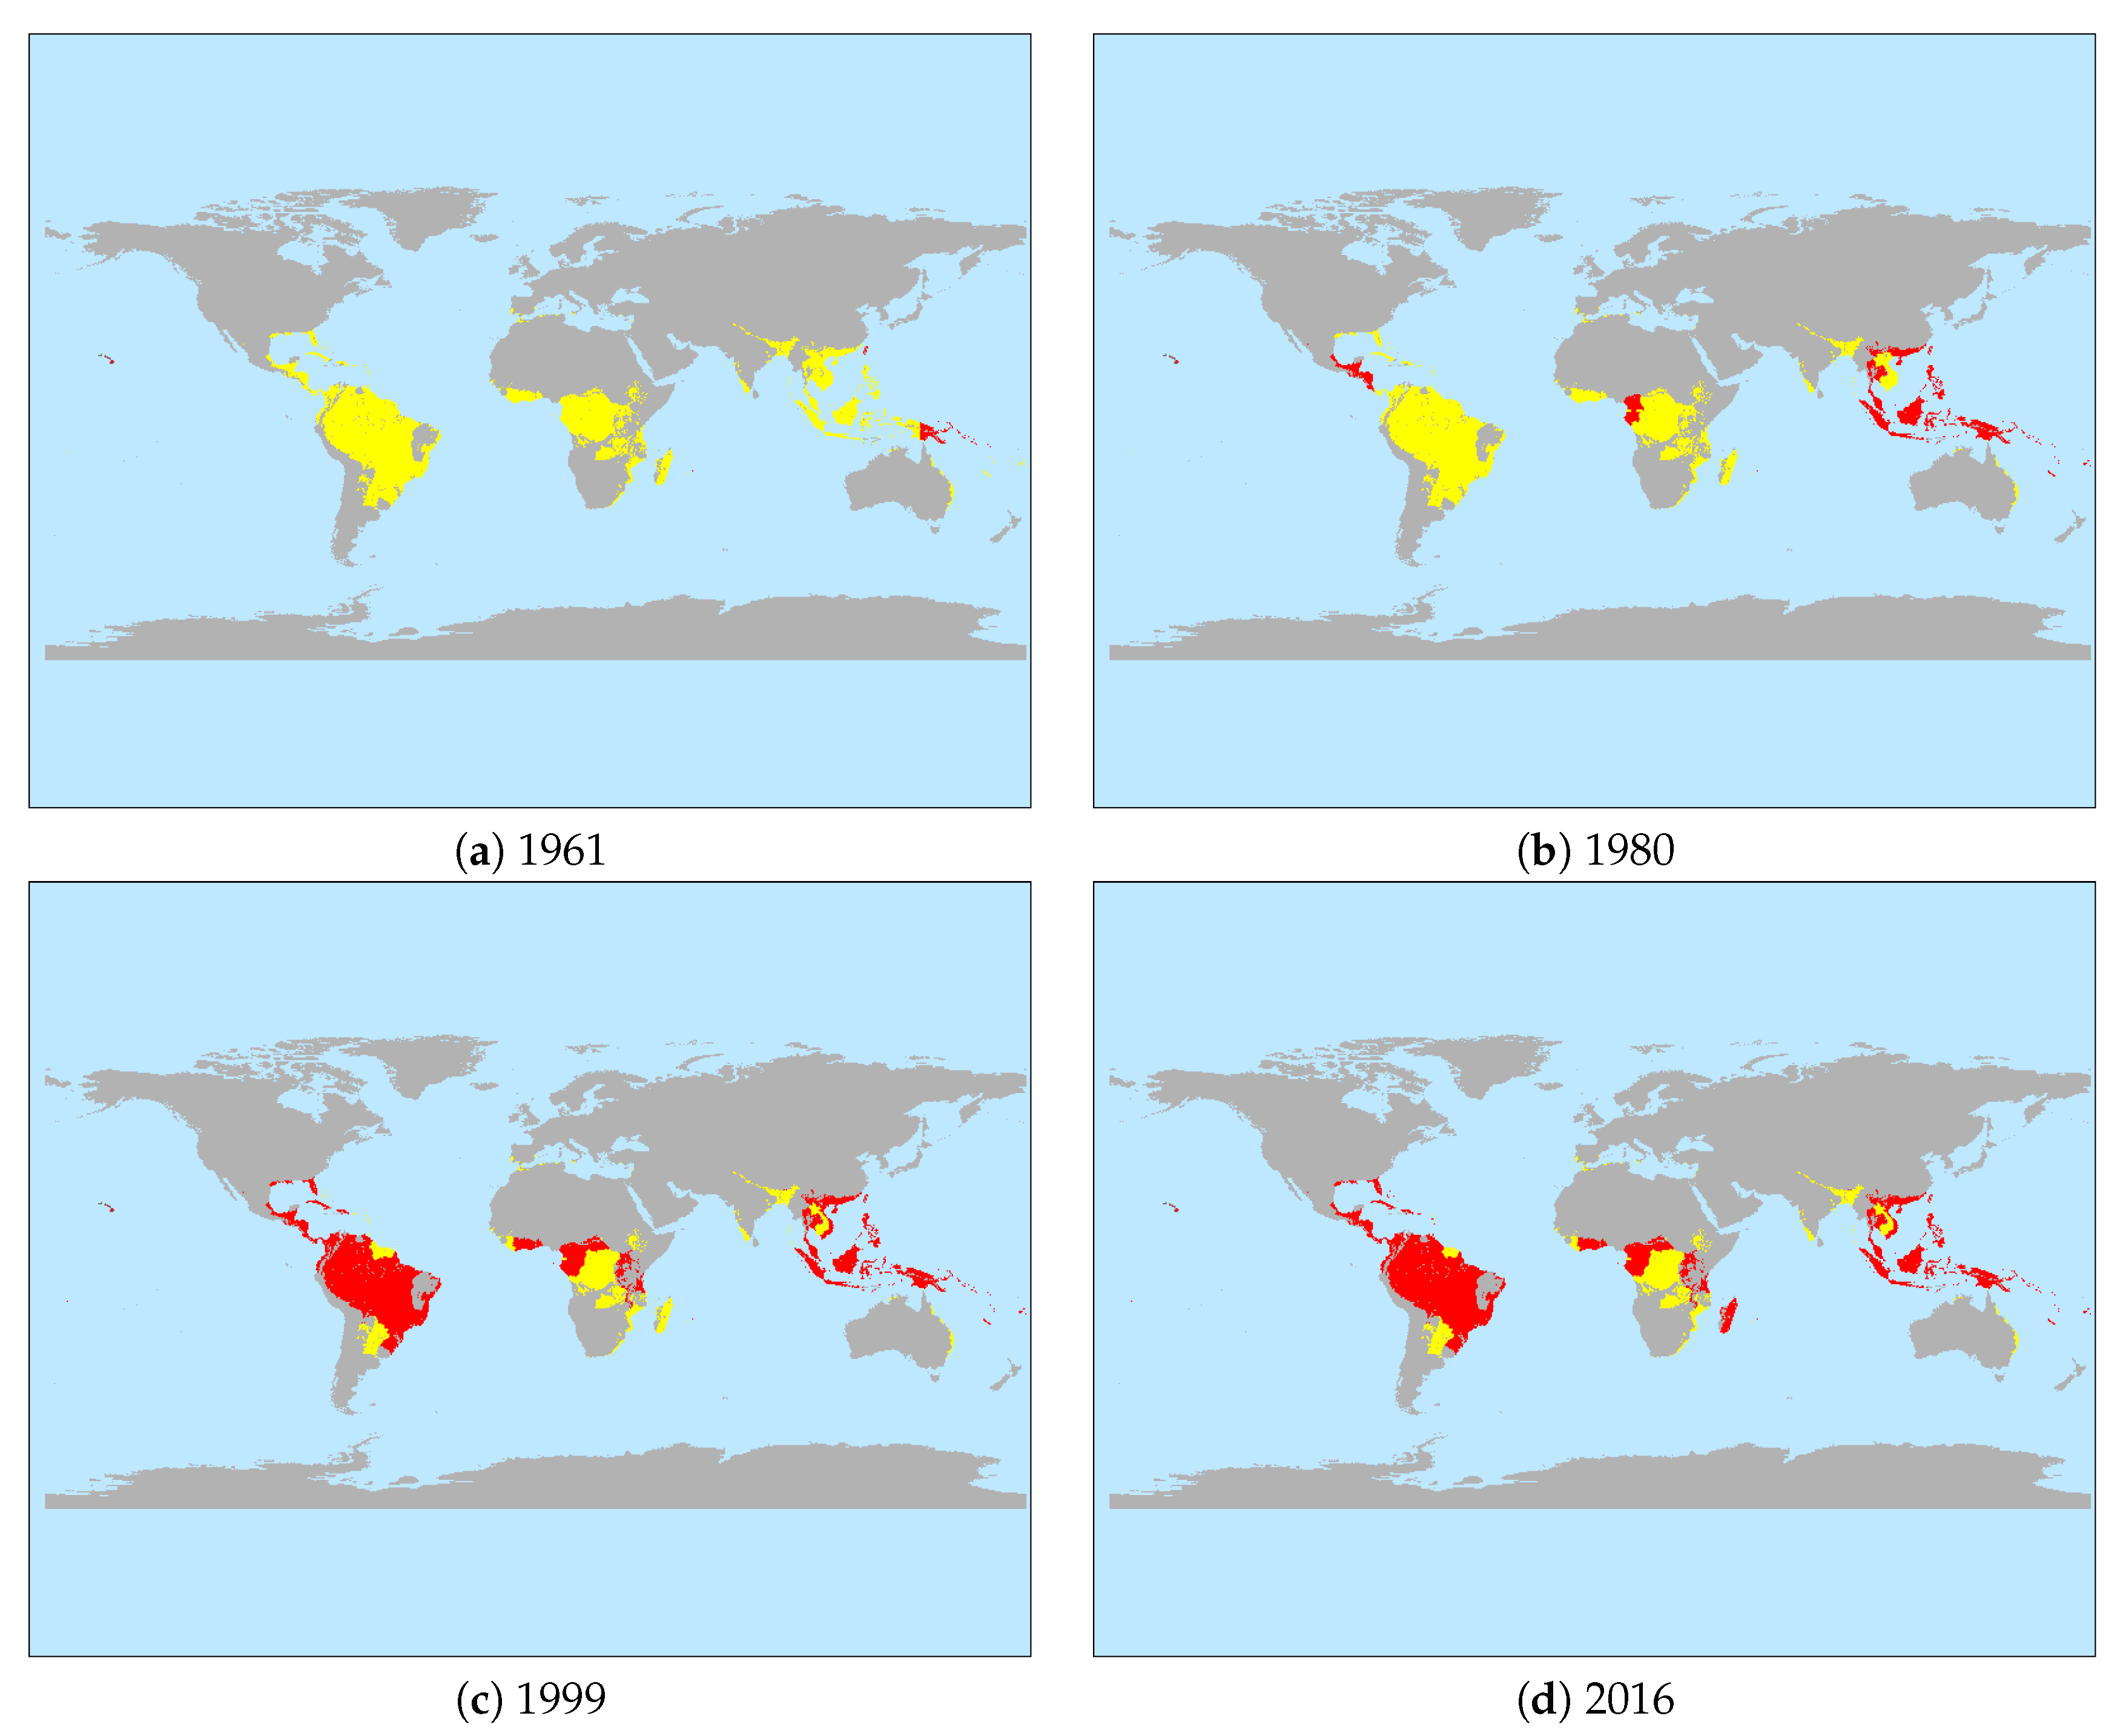
Next the percentage of banana producing countries infected with BSLD is depicted in Figure 2 over the sample period of the analysis (1961–2016). Accordingly, at the start BSLD was present in 4.4% of these, but this rose steadily to over 53% by 2016. The change in geographical distribution of this spread is shown in Figure 3. Accordingly, in 1961 it was essentially only in the United States (Hawaii) and small parts of Asia and the South Pacific that BSLD had been detected. By 1980 Black Sigatoka spread more widely across Asia, and began to additionally appear in Africa. As of 1999, it had further spread to the South American Continent and the Caribbean, as well as expanded more into Africa. At the end of the sample period the Caribbean and Africa had been further affected.
Table 1 provides summary statistics of all the variables used in the analysis. The average annual country level production of bananas is about 465,000 tons, but with considerable variation. This output is comes from harvested areas of on average 3000 hectares. In the data sample the mean first time BSLD infection is 31.7%. The climate optimal for disease diffusion (F) exists about 2.6% of the time, where this is slightly lower in countries that have already been infected. The potential infection rate through long distance dispersal is on average very small (4.09 × 10), but with a large standard deviation. One may also want to note that for more than 48% of the time countries did not have the optimal amount of water available for banana production.
3.2. Regression Results
3.2.1. First Time Infection
For model assessment of Equation (10) the Cox-Snell are plotted against the cumulative Hazard in Figure 4. These are relatively close to the reference line and thus indicate a satisfactory fit.
The estimates from Equation (10) are given in the first column of Table 2. As can be seen, agricultural imports have a significant positive impact on a country becoming infected by BSLD. In contrast, banana imports play no play significant role. One also finds that the long distance dispersal of the fungus from other infected countries under the right climatic conditions is a positive risk factor in becoming infected. All other control variables do not constitute significant risk factors for first time infection. The results of additionally including is included in the last column of Table 2. The coefficient on this variable is significantly negative and increases the estimated coefficient on and .
Converting the estimated coefficients of the Cox model in column 2 to hazard ratios for agricultural imports indicates that a standard deviation increase in raises the (relative) hazard of being infected by over 450%. When the probability of LDD is at its mean value, this would increase the (relative) risk by 18.3%.
The estimated coefficients of the logit model explicitly estimating the baseline hazard (t) are given in the last column of Table 2 provide the basis for conducting the counterfactual analysis of setting and alternatively to zero and comparing the predicted hazards to using their actual values. Noteworthy is that the estimated coefficients of this logit specification are very similar to the estimates of the Cox proportional hazard in terms of all common variables. The coefficients on t and suggest that the baseline hazard takes on an inverted u-shaped function, where it first increases, then after reaching an optimum decreases. Calculating marginal effects from the coefficients suggest a turning point of around 33 years.
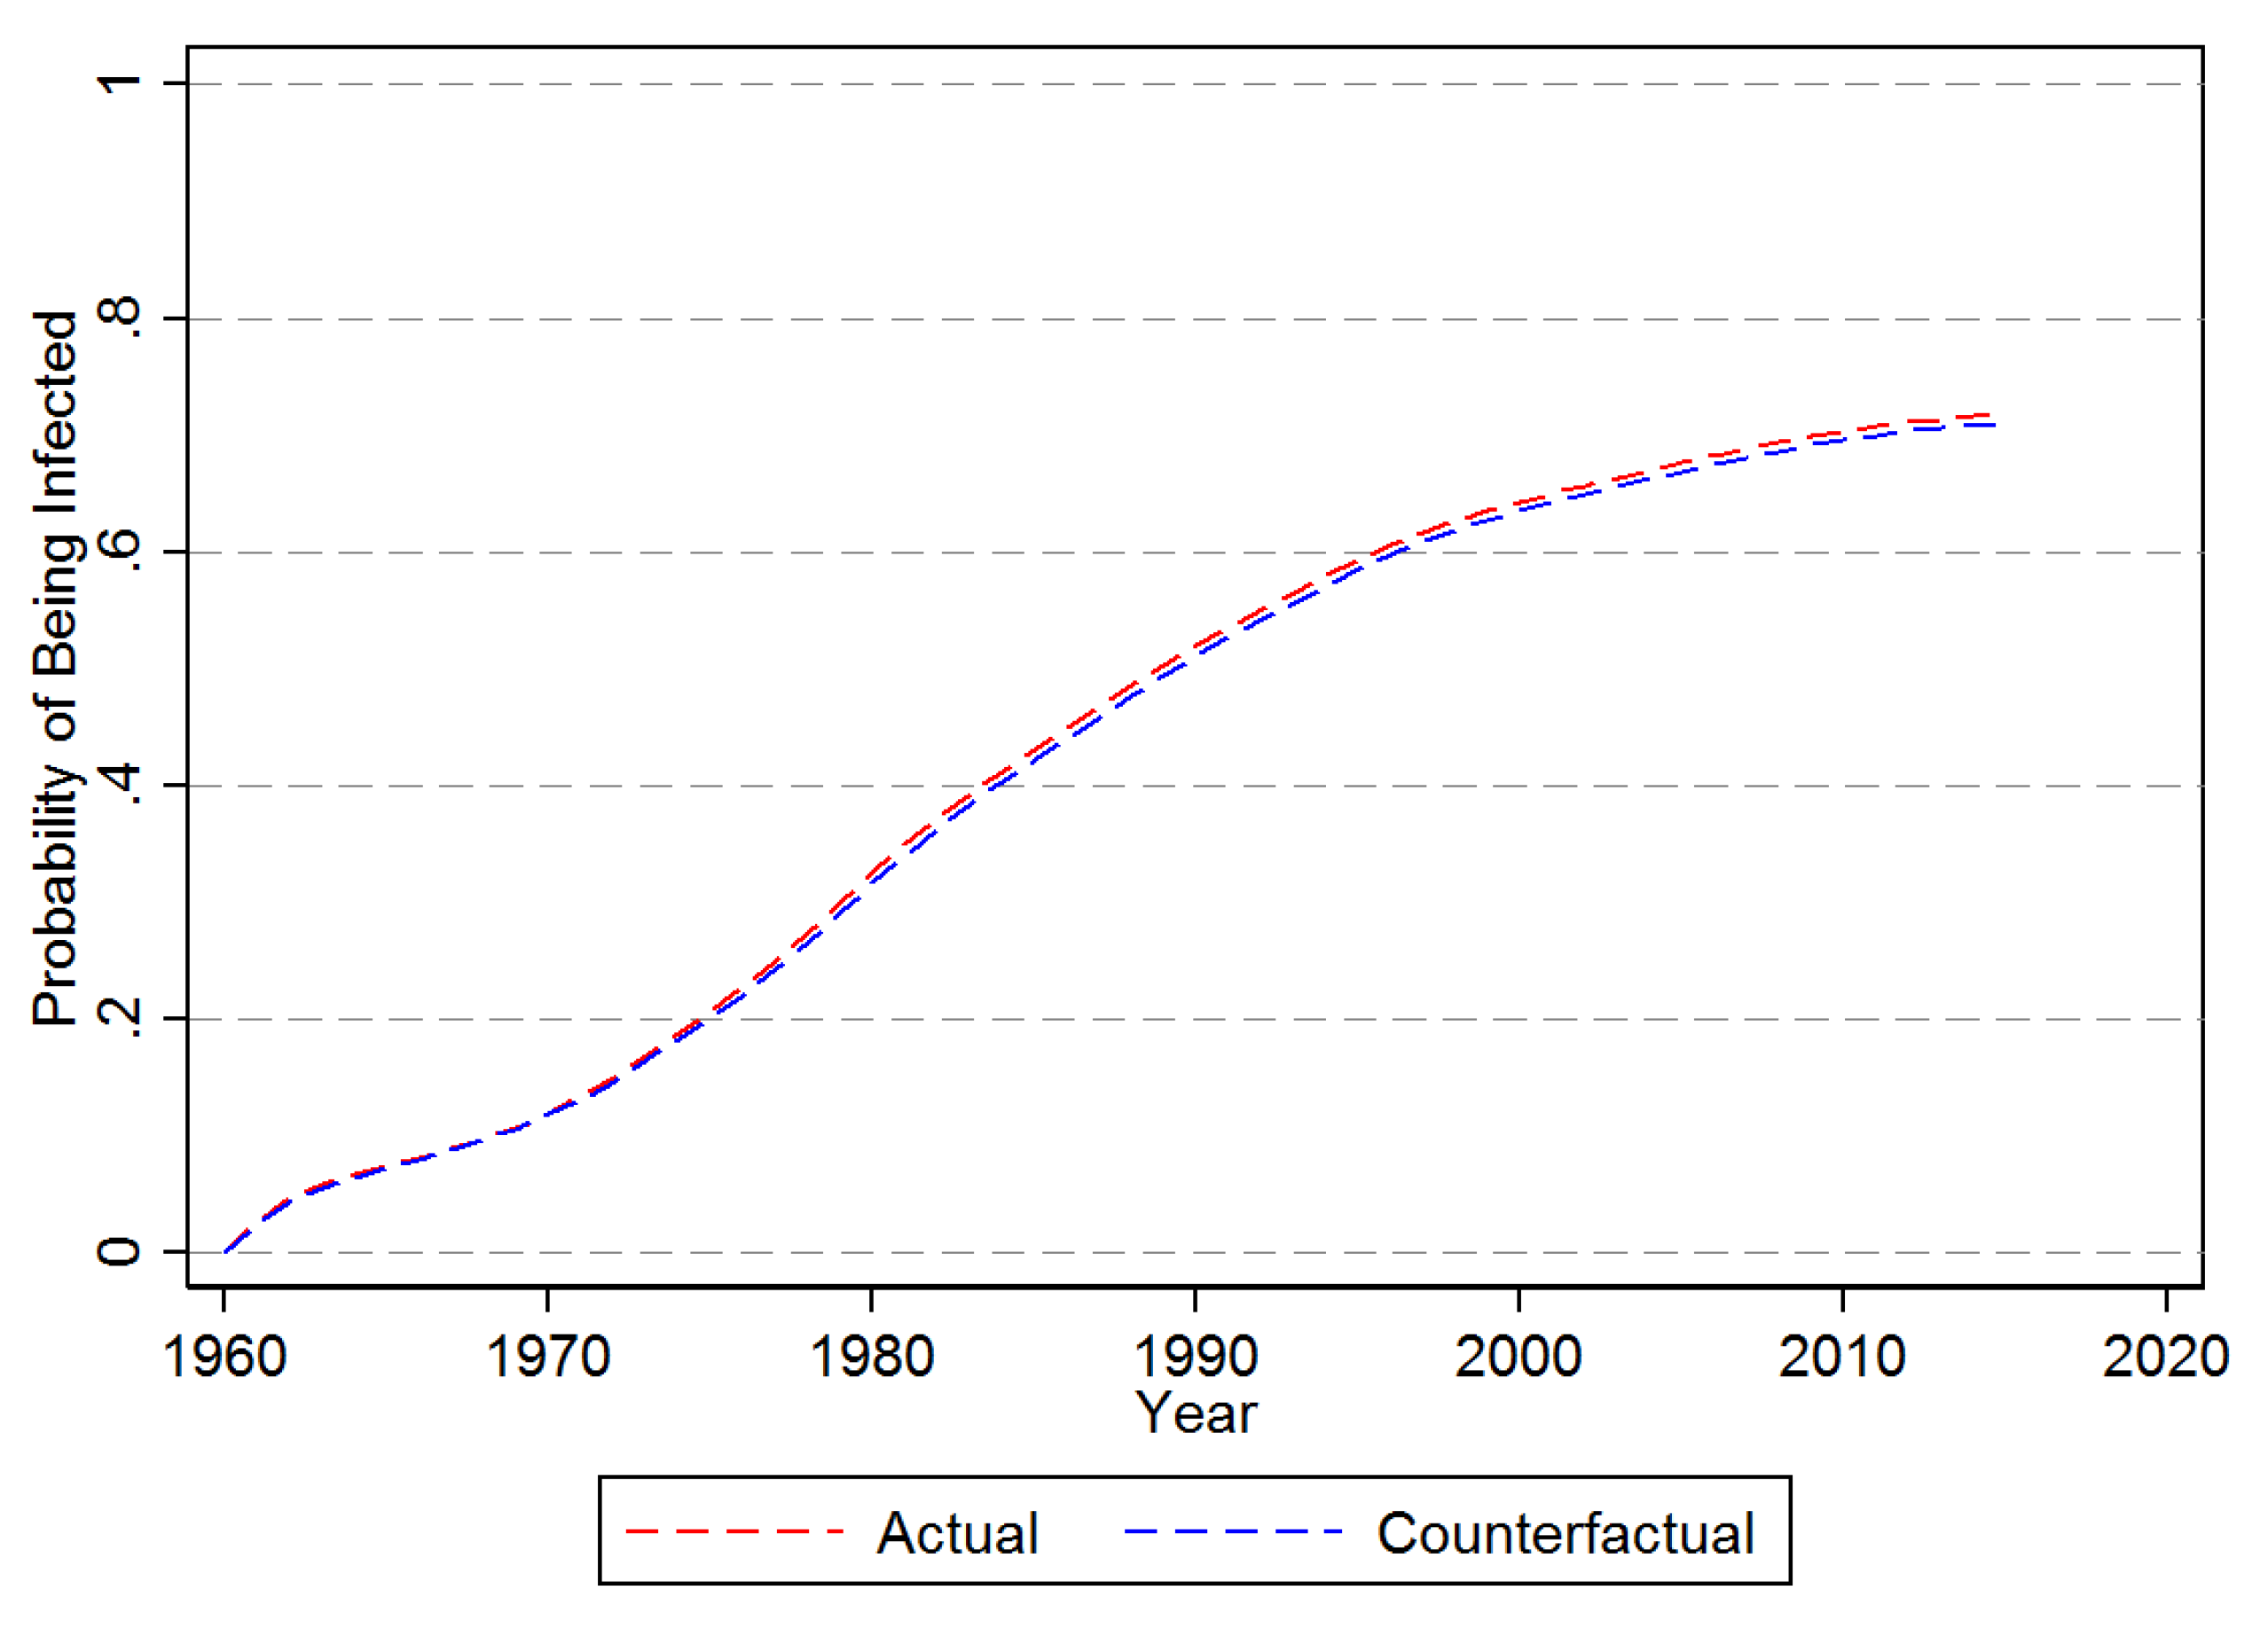
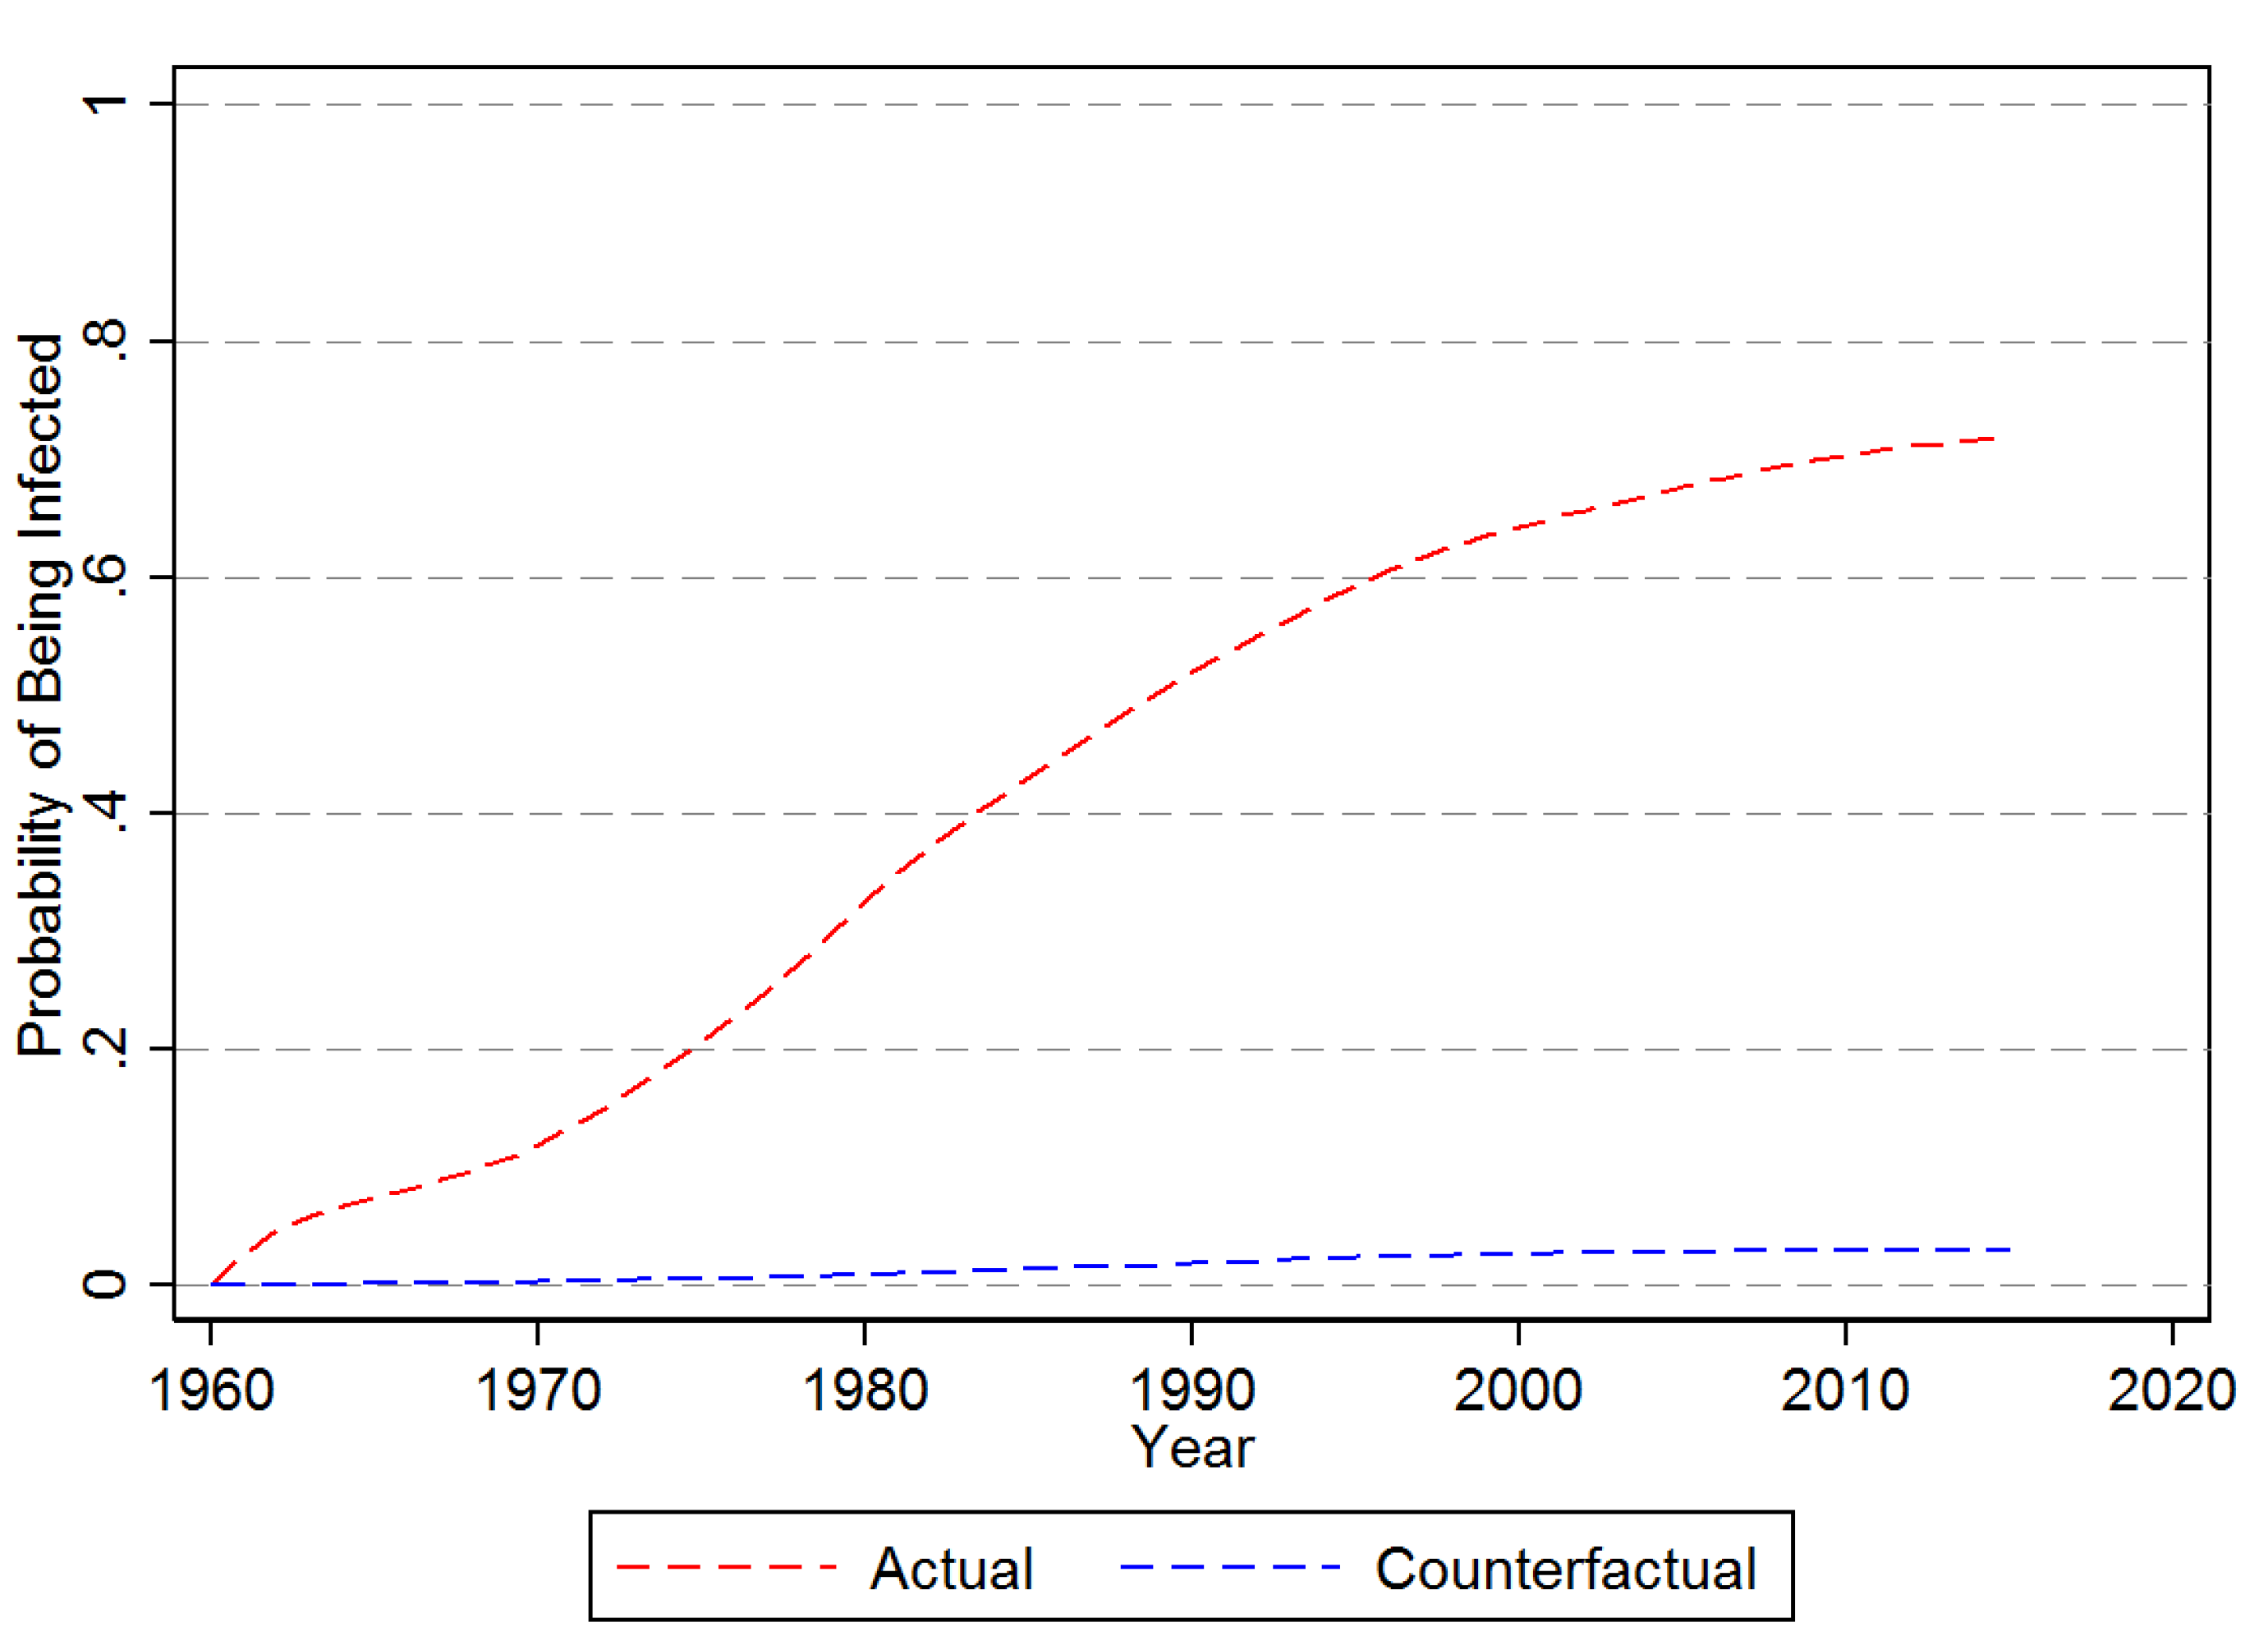
The predicted actual and counterfactual probability of hazard for an average banana producing country are shown in Figure 5. Accordingly, for there is little difference in the actual and counterfactual average probability of being infected. As a matter of fact, by 2016 the actual probability is only about 0.8 per centage points higher than under the counterfactual of no long distance dispersion. The same counterfactual exercise but setting to zero is depicted in Figure 6. With no agricultural imports the average probability of being infected by 2016 is just a little over 2%, compared to 71% when takes on its observed values.
3.2.2. Impact of Disease Diffusion on Banana Production
The results of estimating Equation (11), i.e, the impact on country level banana production once they become infected, are provided in Table 3. The statistic indicates that the model explains around 68% of the variation in banana production. The estimated coefficients show that having first reported BSLD in the past does not per say reduce banana production, as the coefficient on on its own is not significant. Rather it is only its interaction with F that produces a significant (negative) predictor of banana production. Alternatively using (logged) harvested area rather than production as the dependent variable in Equation (11), as shown in the last column, produces the same findings, although the model fit is slightly lower (0.66%). In terms of the other control variables, only the number days that the temperature was below 8 degrees is a significant (negative) predictor of banana production across all three specifications.
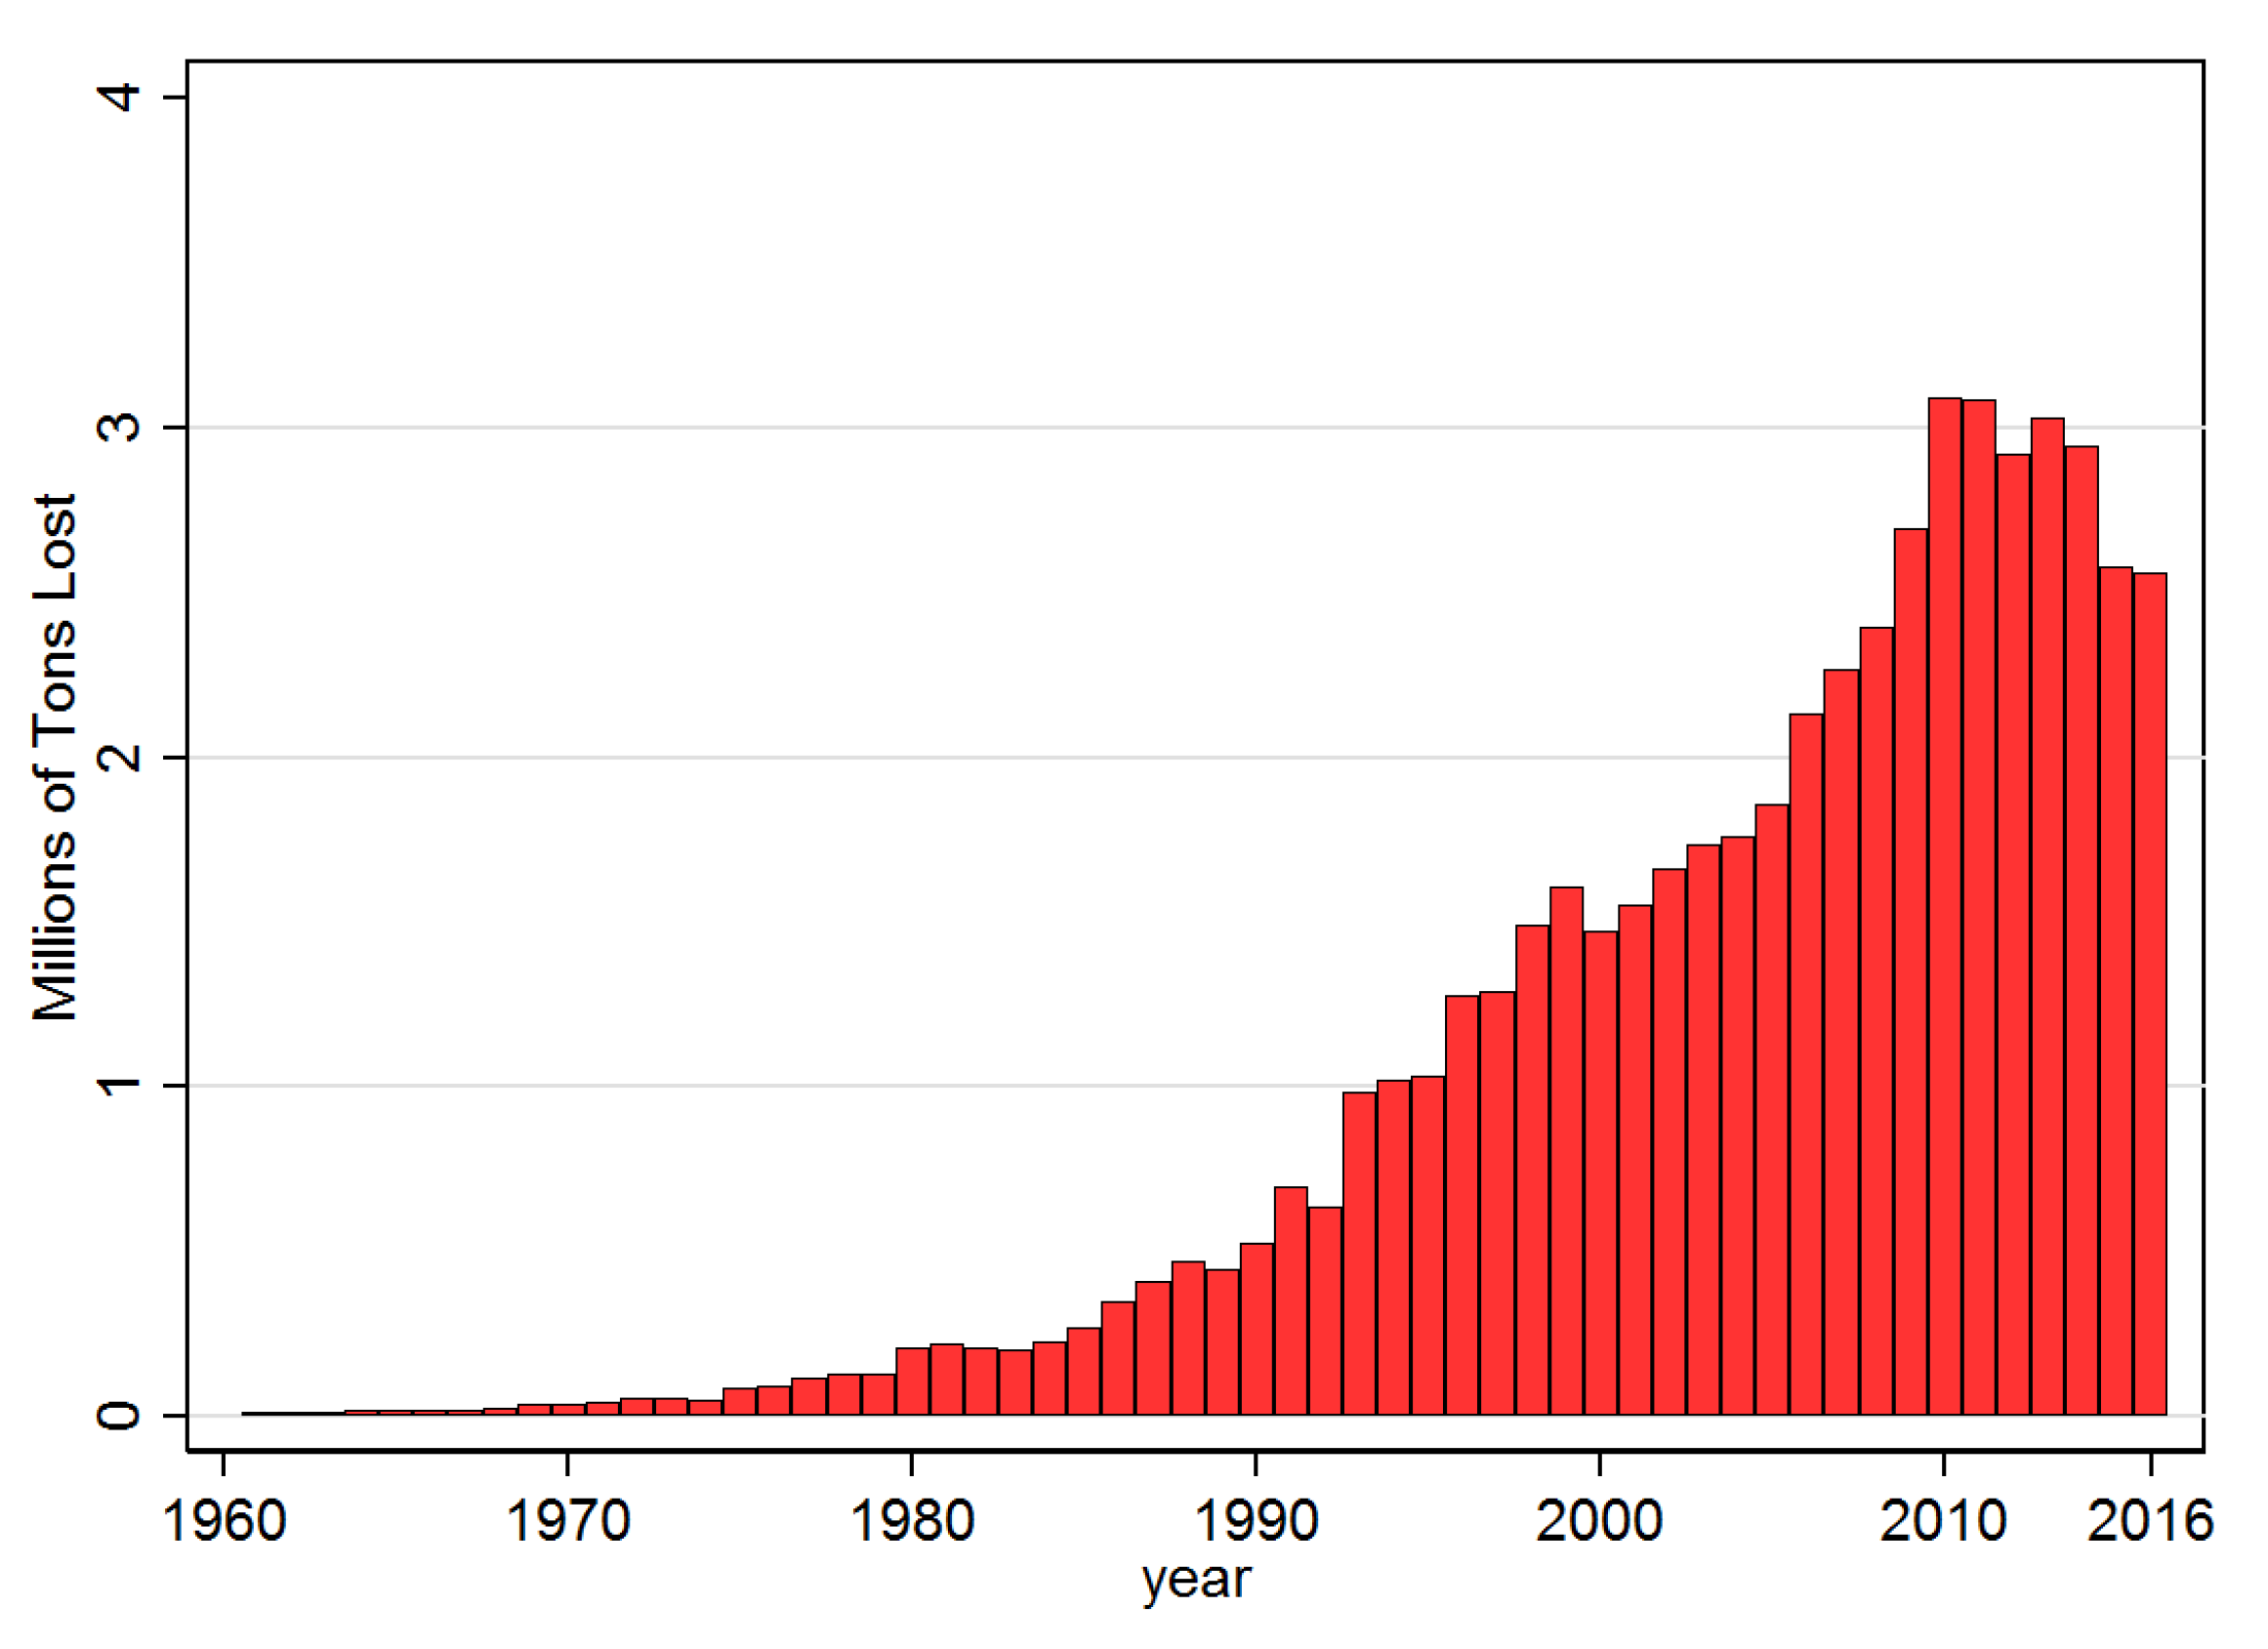
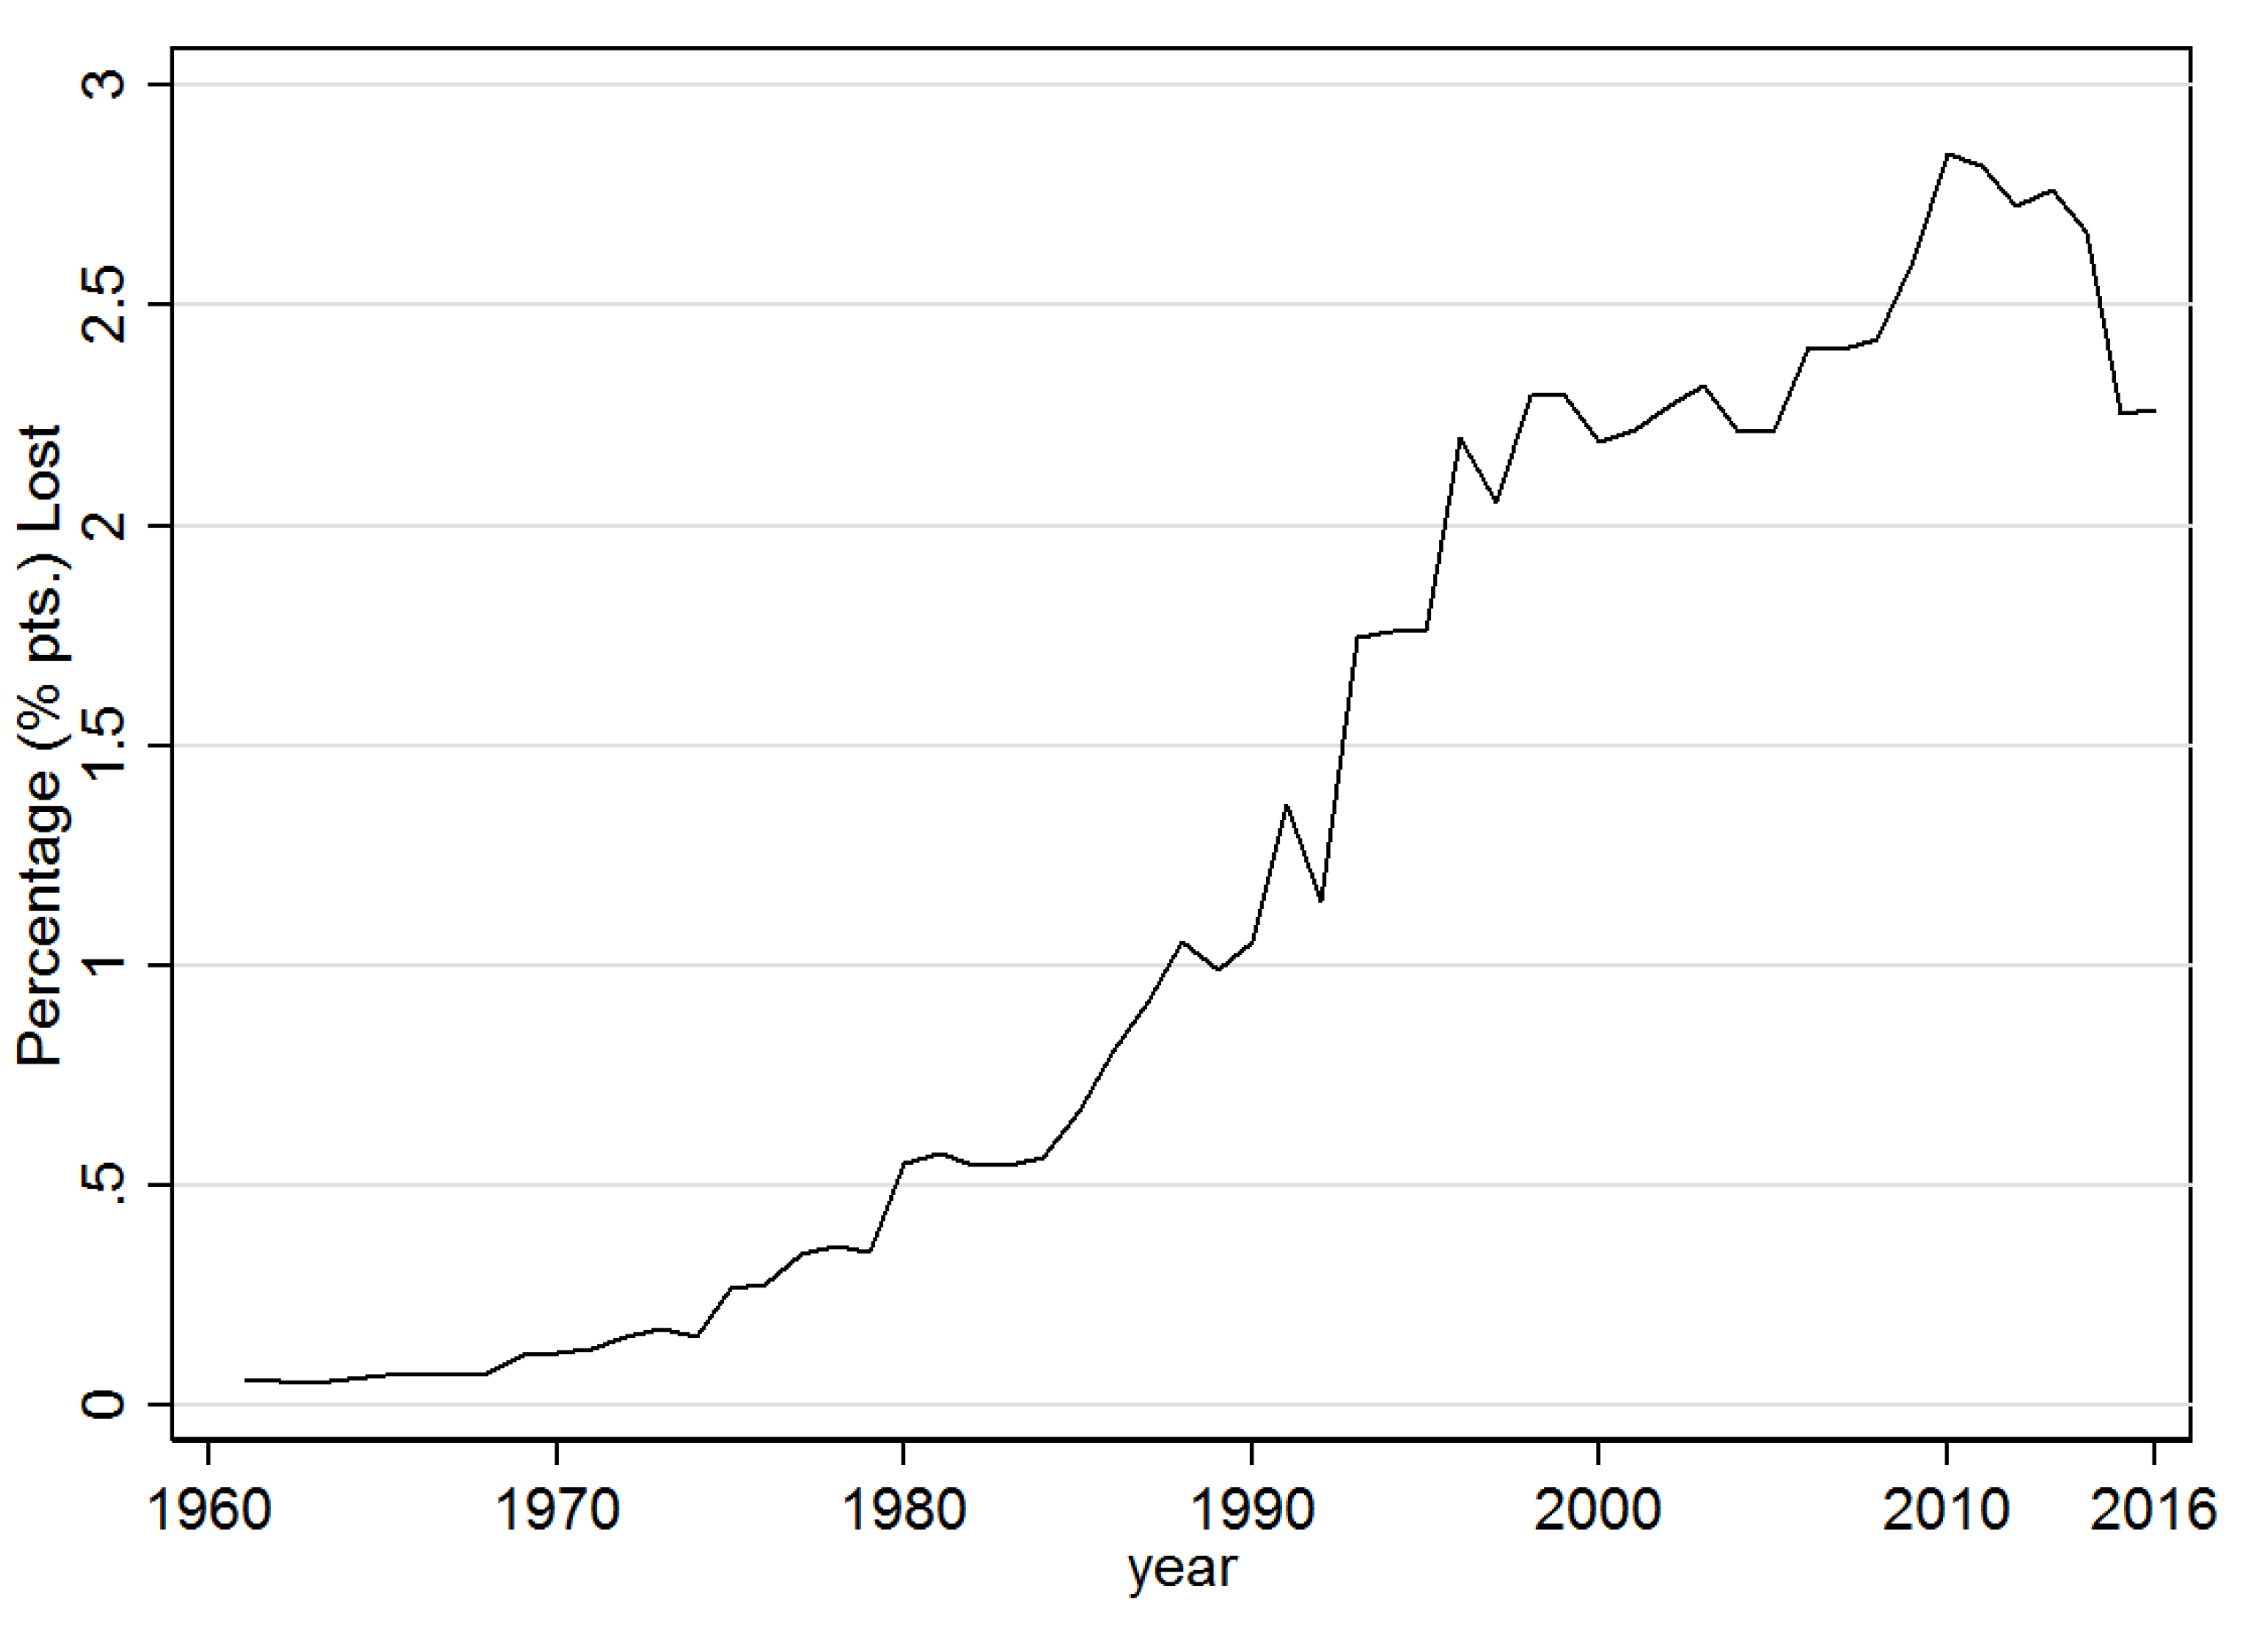
Taking at face value the size of the coefficients in the fourth column of Table 3 suggests that when a country is already infected and the diffusion probability, i.e., , is at the mean of the sample (0.021), banana production falls by nearly 3.8%. In Figure 7 and Figure 8 this estimated coefficient on was used to predict the counterfactual implied losses as a total in tons, and as a percentage of annual production, respectively, over the sample period. Accordingly, since the year 2000 average annual losses have been at least 2, and since 2010 close to 3 million tonnes. As a percentage of total potential productions this translates into annual losses of over 2% since 1998. If one takes the average level of F over the sample time period for each country and assumes that , i.e., that all countries have been at least once infected, then annual expected losses would nearly double to about 4.2% of total global banana production.
4. Discussion
Global agricultural losses of major crops due to crop disease pathogens are believed by experts to be considerable (Savary et al. [15]). As a matter of fact, rough estimates suggest that currently losses of major crops due to fungal diseases amount to enough to feed 8.5% of the global population (Fisher et al. [14]), and between 10 to 40% of global production (Savary et al. [15]). Yet there is no quantitative estimate of what risk factors increase their dispersion, nor what their impact is once regions become infected. Using the case study of Bananas and BSLD-the most important pathogen affecting the industry—this study models the risk factors associated with the historically observed global cross-country spread of the disease using hazard models, as well as the impact on country level banana production once a country is infected using panel linear regression models.
Our results showed that the main driver of first time infection was the import of agricultural products. While long distance diffusion based on climatic factors also played a role, it was small compared to the trade channel. One should note that these two findings support the current literature in that BSLD is likely to have spread over long distances rather than through slow local diffusion. For instance, such claims have not only been substantiated by the sequence of first reporting within and across continents (Jones et al. [23]), but also by genetic evidence. More specifically, Robert et al. [32] showed that the genetic drift between samples across countries and continents was large enough to serve as evidence that the introduction of BSLD in several locations had been over long distances. In other words, rather than a steady diffusion of an epidemic frontier, the evidence is consistent with stochastic spread of the disease [33].
Nevertheless, there is some disagreement as to the exact causes of such spread. Most studies would agree that human drivers, such as the importation of plant material into a country, are likely to have played the most important role- see, for instance, Robert et al. [32] and Burt [34]-and this is certainly supported by our result that the degree of agricultural imports into a country is quantitatively an important predictor of first time infection. However, there is still considerable disagreement if wind dispersal on its own could explain some of the stochastic introductions within and across continents. More specifically, it has been shown that some fungi can be spread over several thousands of kilometers by wind under the right conditions, as, for example, wheat leaf rust (Aylor [35]). In this regard, Burt [34] notes that under optimal conditions it would have taken about 37 days for BSLD to have been carried from Australia to the Caribbean and that perhaps the South Easterly trade winds might have brought BSLD from Africa to the Caribbean. However, importantly Myscosphaerella fijiensis ascospores, unlike many others, are killed by ultraviolet radiation and are thus much less likely to survive being carried across long distance over long time periods by wind unless they happen to be protected by clouds (Parnell et al. [36]). As a matter of fact, some studies, such as Rivas et al. [33], have argued that for BSLD wind dispersal is likely to be limited to just a few hundred of kilometers and thus probably occurred within rather than across continents. The results of our study indicate that long distance dispersal through climatic factors might have still played a role, albeit only a very small one.
Local climate, apart from that incorporated in the long distance dispersal probability measures, was not a significant predictor of first time infection, again pointing to stochastic dispersal as the main cross-country spread channel. We also find that the import of bananas did not increase a country’s likelihood of first time infection. This may not be surprising given that banana fruits themselves, unlike the leaves on their plant, are possibly not infected by the fungus (Robert et al. [32]). Leaves, typically used as packing material for other goods, are unlikely to be captured in the FAO data of banana imports, which strictly refers to imports of the fruit. Nevertheless, any more reliable conclusions in the role of banana imports would require bilateral trade data, so that we would need to be able to trace imports from infected countries. Such trade data would also allow us to more accurately estimate the role of agricultural imports in introducing the disease.
The fact that a distance weighted measure of first time infection of other countries () had a negative impact on first time infection and that its inclusion as a control variable reduced the estimates on agricultural imports and LDD suggests that it is indeed possibly capturing the role that policy may play. More specifically, the presence of BSLD in neighboring countries may have induced uninfected nations to implement greater preventive measures and legislation. For instance, in many banana producing countries in the Caribbean agricultural quarantine precautions became fairly strict after the first outbreaks in the region and may have prevented further spread (Burt [34]). The possible benefits of such measures, even at the cost of reduced trade, should not be overlooked. Using an equilibrium displacement model for Puerto Rico, Alamo et al. [22] show that not having trade restrictions would cause a net loss in welfare. However, in actuality not only are there arguably inefficiencies in current legislation implementation (Perrings [12]), but for many crop fungi even strictly enforced physical borders may not be effective as these can still spread through the atmosphere over long distances (Brown and Hovmøller [13]), as evidence here also indicates. Nevertheless any accurate assessment on the efficacy of trade restrictions and legislation to reduce infection would require detailed historical construction of policies implemented across countries and time.
Our findings from the banana production model revealed that once a country is infected and the right climatic conditions prevail, losses in banana production due to the disease can be substantial. Currently these average about 2-3% of total production a year. If we take the average current producer price of bananas from available FAOSTAT data, i.e., USD 630 per tonne, then this would imply annual expected losses currently of about USD 1.6 billion. This would more than double if the remaining banana producing countries become infected. While this arguably demonstrates that the effects of BSLD on the banana industry are economically important, it is difficult compare this to other major crops since no other comparable global study exists, rather, as noted above, just qualitative estimates by experts (Savary et al. [15]).
Climatic conditions were found to be crucial in terms of the impact of BSLD on banana production. More specifically, even if BSLD has already been reported in a country, it is only when climate is optimal for diffusion that this will have an impact on aggregate banana production of a country. This result is echoed in Yonow et al. [37] who find that there is a strong relationship between climate suitability of BSLD and export ratings for disease pressure. In this regard, Bebber [28], on whose biophysical model our local disease diffusion framework is heavily based, showed that the risk of a disease outbreak has increased by a median of 44.2% in Latin America and the Caribbean since the 1960s. Moreover, using different climate dependent predictive factors of BSLD under two climate change scenarios, Júnior et al. [38] calculate that while the areas favourable to the disease will decrease, extensive areas will continue to be favourable to BSLD.
Surprisingly climate stress factors specific to bananas, as taken FAO [39], were not found to be significant predictors of country level production, except days when the temperature was below 8 C. Assuming that most of them should be, this suggests that there is considerable error in their measurement, leading to attenuation bias and thus leading to Type II errors in our estimated coefficient hypothesis testing; see Wooldridge [40]. One obvious reason is that we only know the banana suitability areas and not actual banana growing areas, so that our climate proxies are not only capturing the relevant local climate variations. Another explanation is that since banana are potentially grown year round except for the sub-tropical regions, but we have no information as to the local growing cycles, this may again introduce some measurement error in our climate variables. Importantly, such measurement error in our climate variables would also have implications for our ability to estimate the impact of the probability of long distance and local disease diffusion, which are also based on climate factors, so that we may be underestimating the true impact these as well.
Although we were not able to investigate this specifically due to data availability, one way to control the spread of BSLD is through chemical control. In this regard, the high susceptibility of the Calvendish crop to the disease necessitates the use of both protectant and systemic fungicides at relatively high frequencies (Marin et al. [17], de Bellaire et al. [21]). However, the costs of such treatment are substantial, so much so that Cavendish cultivars are among the top global inputs of agricultural fungicides (Churchill [20]), and thus making this treatment option not feasible for many smaller banana producers. Moreover, the disease has shown over time to develop increased resistance to the treatment (Jones et al. [23]. For example, experience in Costa Rica has shown that within 20 years of use the amount of fungicide needed to control BSLD increased by around two thirds (de Bellaire et al. [21]).
5. Materials and Methods
5.1. Methods
Local Disease Spread (LDS)
The approach in this study follows Bebber [28] closely and employs a local infection diffusion model based on micro-climate to simulate the spread of BSLD once a country i is infected. Consider a set of localities in country i during days . It is assumed that the diffusion rate of spores at locality m during day d, , follows a probabilistic survival process of spores transitioning to infections, which depends on the number of days, , that passed since the outbreak and temperature, . Moreover, local diffusion is dependent on the occurrence of a sufficiently wet period, . Thus is determined by:
where H is a Weibull hazard function such that:
The temperature dependent rate r depends on ’s value relative to given thresholds of minimum (), optimum (), and maximum () temperatures:
The incidence of a sufficiently wet period, , is contingent on minimum wetness () and humidity () thresholds:
As in Bebber [28], in order to parameterize Equations (1)–(4), , , C, C, C, , and . (These parameters were estimated by Bebber [28] using Brazilian data on Black Sigatoka and temperature) One should note when , is reset to 0 and will start to sequence again only once .
Since the empirical analysis is at the country level, LDS is measured as the country level annual average daily diffusion rate:
where D is the total amount of banana growing days in year t and M the total number of banana growing localities in country i.
5.2. Long Distance Dispersal (LDD)
To model long distance aerial dispersal of BSLD a simplified version of the LDD model of Aylor [35] is employed, where it is ’simple’ in the sense that it does not model the time between release of spores in the source region and target region, but rather simply assumes that the transport happens within the same year. This is in part because only the first infection date by year is known and the banana production data is only annual, but also because climatic data to model the waiting time between release and potential infection is not available. Moreover, there is no data to model the potentially important impediment of ultra-violet radiation along any transport route, and this aspect is thus ignored.
It is assumed that the amount of possible spores released from location m on day d in source country j at time t, , depends on the local diffusion rate , as defined in Equation (5), and appropriate climate conditions conducive to aerospore release :
where is the amount of daily local rainfall and the local wind turbulence measured as the ratio of the standard deviation relative to the mean wind speed. These optimum spore release climatic conditions were chosen since rainfall is necessary for spore release (Burt [34]), and Norros et al. [29] found that LDD of small spores, like those of Myscosphaerella fijiensis, increased within the wind turbulence range between 0.2 to 0.5 m/s.
Along the route to possible destinations it is assumed that there are constant and favourable transport conditions in that the rainfall rate is zero, there is no spores mortality due to ultraviolet radiation or other reasons. This is done since the necessary data, particularly over water bodies, is not available for most the time period of the analysis. The concentration of viable spores located at i at a distance downwind from source countries, , can be described by a Gaussian puff as:
where the Equation (8) is made dependent on the , i.e., the amount of rainy days during the growing season in target country i at time t, since it is well known that the deposition velocity of spores is dependent on the rate of rainfall (Aylor [35]). In order to measures the shortest distance between banana growing areas between countries is used.
5.3. BSLD Presence
A country level indicator of BSLD presence, , takes on the value of zero until the first infection appears in country i in year t and then from a value of one. A distanced weighted measure of BSLD presence in neighboring countries for country i is generated as:
where is defined as in Equation (8).
5.4. Empirical Modeling
5.4.1. First Time Infection Model
A country’s hazard of becoming infected by BSLD for the first time is modelled using a Cox Proportional Hazards Model where time varying and time invariant covariates are allowed to influence a country’s hazard function from the disease free state as:
where is the total area suitable for banana growing, C is a vector of the disease spread optimal climatic conditions (rainfall, evapotranspiration, relative humidity, canopy moisture, canopy temperature, and wind speed), and the vector consists of productivity reducing climatic stress factor thresholds in terms of water availability, temperature, humidity, and wind. Additionally, twelve sub-regional dummy indicators are included to capture regional time invariant differences. In order to make the estimated coefficient on more readable in the estimation output its value is multiplied by . In order to assess model fit we examined the Cox-Snell residuals, as suggested by Grambsch and Therneau [41].
One should note that the Cox Proportional Hazard model is semi-parametric in that the baseline hazard is estimated non-parametrically and only depends on time t, but the risk factors are estimated parametrically, where this parametric function takes on an exponential form. The hazard of country i becoming infected is thus multiplicatively proportional to the baseline hazard . The drawback of this non-parametric flexibility is that the hazard for any country is a fixed proportion of the hazard for any other country, and thus only the relative, and not the absolute, hazard of countries can be estimated. Thus, when the estimates from Equation (10) are used to make counterfactual predictions, as in Zheng and Cai [42] a logit model version of Equation (10) of infection is employed, where the baseline hazard is specified as a linear and quadratic function of time elapsed. The estimated coefficients from this logit model are then used to construct counterfactual predictions by setting alternatively or equal to zero, but keeping all other controls at their observed values, and predicting the probability of a representative country being infected. This is then compared to doing the same prediction but using the observed values of all control variables.
5.4.2. Impact of Disease Diffusion Model
To determine how, once a country is infected, diffusion of BSLD has impacted banana production is estimated using the following regression equation:
where is a vector of country specific time trends, is a vector of year specific indicator variables. In order to purge the vector of country specific effects from Equation (11) a panel fixed effects linear estimator is employed (Wooldridge [40]). To take account of serial correlation due to growing seasons spanning across calendar years and cross-sectional dependence we calculate standard errors as recommended by Driscoll and Kraay [31]. Model fit is assessed by examining the R-squared of the residuals, where a good fit is if these are close to the diagonal intersecting the origin. The estimated coefficients from Equation (11) are also used to predict what banana production would be if there was no local disease spread by setting the interaction term of to zero, but keeping all other control variables at their observed values, and calculating out predicted production. This is then comparing to the predicted banana production when all variables are at their observed values.
5.5. Data
5.5.1. BSLD Presence Data
To construct the history of the BSLD spread across the countries and time a number of sources were resorted to, most prominently Stover et al. [43], Pasberg-Gauhl et al. [44], Jones et al. [23], Jacome [45], Jones et al. [23], Rivas et al. [33], de Bellaire et al. [21], and Blomme et al. [46]. Additionally, the list of first infection reports provided by the European and Mediterranean Plant Protection Organization (EPPO) disease database and the CABI International’s Invasive Species Compendium were consulted. For all banana producing countries that were not on these lists the internet was extensively searched for any information on first time outbreaks and the years of these, if any.
5.5.2. Climatic Data
To construct climatic variables the Japanese 55-year Reanalysis (JRA55) climate reanalysis data set from the National Center for Atmospheric Research (NCAR) Research Data Archive was used, which consists of griddded data with a spatial resolution of TL319 (about 55 km). Unfortunately there is no data set that allows one to know the exact location of banana growing areas within a country at any point in time. In order to nevertheless capture the climate likely to be relevant to local production of bananas, the local banana growing areas are proxied by the local areas suitable for banana production, as given in the FAO’s Global Agro-Ecological Zones (GAEZ) database at the 0.5 degree resolution. This set of cells provides set of (potentially) banana growing localities and thus for which climate data from the JRA55 is extact. To this end 6-hourly data over the time period 00:00 h UTC on 1/1/1960 to 21:00 h UTC on 31 December 2016 on measures of canopy moisture (CMOIST), canopy temperature (CTEMP), relative humidity at 2m (HUMID), rainfall (RAIN), temperature (T), and the u- and v-wind components, which are used to calculate wind speed (WIND), were downloaded. Daily mean values were then calculated for those pixels that fell within the banana growing suitability areas, as derived from the GAEZ map described above. Since the banana growing season may be throughout the year for tropical areas, all daily values within a year for this region where used, while for the sub-tropical region (deliminated by being outside the −34 and 42 latitude zone) we restrict the climatic data to fall within the March to December window. While all the derived climatic variables are employed as potential climatic factors for banana production, canopy moisture and canopy temperature are specifically used to measure and T in order to construct F in Equation (1). The v- and w-wind component data to generate wind turbulence ().
The climatic stress indicators that are likely to retard banana growth for inclusion in Equations (10) and (11) were also constructed, following FAO [39]. More specifically, these were the percentage of days in a year (or the 10 month growing period for sub-tropical regions) that mean wind speed was above 4 m/s (WIND4), canopy temperature was below 8 C (CTEMP8), canopy temperature was above 38 C (CTEMP38), and relative humidity was above 60% (HUMID60). In order to estimate the incidence of water stress, following Allen et al. [47], the daily soil water balance using the appropriate parameters for bananas, and calculated as the percentage of days that the water balance was below absolute optimum level (WSTRESS).
5.5.3. Banana and Agricultural Products Data
Data on banana production, area harvested, exports, and imports are taken from the FAOSTAT database. More specifically, these data provide annual country level banana production in tons (), area harvested area in Ha (), exports in tons (), and imports in tons () from 1961 to 2016 for all 129 major banana producing countries. Additionally information on total agricultural (plant based) imports () and exports () was used. Combining those countries that changed name over the period, and summing production and area harvested for those that split into several territories, left a total sample of 129 nations that produce bananas.
6. Conclusions
Our study of the global spread and impact of Bananas’s Black Sigatoka Leaf Disease highlights the danger and potential cost of relying on just a few varieties with genetic uniformity for production of a specific crop on a global scale. In particular the results show that agricultural trade may play an important role in spreading the disease across countries. In this regard, while strict import restrictions and securities measures may be hypothetically able to prevent the influx of crop diseases across countries due to the transfer of diseased material by humans, there is still nevertheless the chance that the disease is transmitted over long distances from elsewhere under the right climatic conditions. Countries should thus plan for the likely arrival of a debilitating disease at some stage. Of course, once such a disease arrives chemical treatment may be able to keep it partially under control, although costs of such treatments may be prohibitive for some farmers and their effectiveness is likely to fade over time. Hence, international efforts to look for disease resistant crop varieties, such as FAO’s Technical Cooperation program (The Technical Cooperation Programme (TCP) was created to enable FAO to make its know-how and technical expertise available to member countries upon request), should be continuously supported. Nevertheless, if anything, the history of banana crop diseases has shown that, while disease resistant varieties or treatments are eventually likely to be discovered or developed, new or mutations of existing fungi also continuously emerge, thus potentially restarting the vicious circle.
Author Contributions
Conceptualization, E.S.; methodology, E.S.; investigation, E.S. and P.M.; data curation, E.S. and P.M.; writing—original draft preparation, E.S. and P.M.; writing—review and editing, E.S. and P.M.; visualization, E.S. All authors have read and agreed to the published version of the manuscript.
Funding
This research received no external funding.
Conflicts of Interest
The authors declare no conflict of interest.
References
- Agrios, G.N. Plant Pathology; Academic Press: New York NY, USA, 2005. [Google Scholar]
- Scheffer, R.P. The Nature of Disease in Plants; Cambridge University Press: Cambridge, UK, 1997. [Google Scholar]
- Gráda, C.Ó.; O’Rourke, K.H. Migration as disaster relief: Lessons from the Great Irish Famine. Eur. Rev. Econ. Hist. 1997, 1, 3–25. [Google Scholar] [CrossRef]
- Simms, C. The grape depression. New Sci. 2017, 236, 60–62. [Google Scholar] [CrossRef]
- Money, N.P. The Triumph of the Fungi: A Rotten History; Oxford University Press: Oxford, UK, 2006. [Google Scholar]
- Hunter, D.; Guarino, L.; Spillane, C.; McKeown, P.C. Routledge Handbook of Agricultural Biodiversity; Taylor & Francis: New York, NY, USA, 2017. [Google Scholar]
- Wolfe, M. The current status and prospects of multiline cultivars and variety mixtures for disease resistance. Annu. Rev. Phytopathol. 1985, 23, 251–273. [Google Scholar] [CrossRef]
- Garrett, K.; Mundt, C. Epidemiology in mixed host populations. Phytopathology 1999, 89, 984–990. [Google Scholar] [CrossRef] [Green Version]
- Gergerich, R.C.; Welliver, R.A.; Gettys, S.; Osterbauer, N.K.; Kamenidou, S.; Martin, R.R.; Golino, D.A.; Eastwell, K.; Fuchs, M.; Vidalakis, G.; et al. Safeguarding fruit crops in the age of agricultural globalization. Plant Dis. 2015, 99, 176–187. [Google Scholar] [CrossRef] [Green Version]
- Lucas, J.A.; Hawkins, N.J.; Fraaije, B.A. The Evolution of Fungicide Resistance. In Advances in Applied Microbiology; Elsevier: Amsterdam, The Netherlands, 2015; Volume 90, pp. 29–92. [Google Scholar]
- Oerke, E.C. Crop losses to pests. J. Agric. Sci. 2006, 144, 31–43. [Google Scholar] [CrossRef]
- Perrings, C. Options for managing the infectious animal and plant disease risks of international trade. Food Secur. 2016, 8, 27–35. [Google Scholar] [CrossRef]
- Brown, J.K.; Hovmøller, M.S. Aerial dispersal of pathogens on the global and continental scales and its impact on plant disease. Science 2002, 297, 537–541. [Google Scholar] [CrossRef] [Green Version]
- Fisher, M.C.; Henk, D.A.; Briggs, C.J.; Brownstein, J.S.; Madoff, L.C.; McCraw, S.L.; Gurr, S.J. Emerging fungal threats to animal, plant and ecosystem health. Nature 2012, 484, 186. [Google Scholar] [CrossRef]
- Savary, S.; Willocquet, L.; Pethybridge, S.J.; Esker, P.; McRoberts, N.; Nelson, A. The global burden of pathogens and pests on major food crops. Nat. Ecol. Evol. 2019, 3, 430. [Google Scholar] [CrossRef]
- HE, D.C.; ZHAN, J.S.; XIE, L.H. Problems, challenges and future of plant disease management: From an ecological point of view. J. Integr. Agric. 2016, 15, 705–715. [Google Scholar] [CrossRef]
- Marin, D.H.; Romero, R.A.; Guzmán, M.; Sutton, T.B. Black Sigatoka: An increasing threat to banana cultivation. Plant Dis. 2003, 87, 208–222. [Google Scholar] [CrossRef] [PubMed] [Green Version]
- Abbott, R. A Socio-Economic History of the International Banana Trade, 1870–1930; European Union University: Fiesole, Italy, 2009. [Google Scholar]
- Koeppel, D. Banana: The Fate of the Fruit that Changed the World; Penguin: Harmondsworth, UK, 2007. [Google Scholar]
- Churchill, A.C. Mycosphaerella fijiensis, the black leaf streak pathogen of banana: Progress towards understanding pathogen biology and detection, disease development, and the challenges of control. Mol. Plant Pathol. 2011, 12, 307–328. [Google Scholar] [CrossRef] [PubMed]
- de Bellaire, L.d.L.; Fouré, E.; Abadie, C.; Carlier, J. Black Leaf Streak Disease is challenging the banana industry. Fruits 2010, 65, 327–342. [Google Scholar] [CrossRef]
- Alamo, C.; Evans, E.; Brugueras, A.; Nalampang, S. Economic impact and trade implications of the introduction of Black Sigatoka (Mycosphaerella fijiensis) into Puerto Rico. J. Agric. Appl. Econ. 2007, 39, 5–17. [Google Scholar] [CrossRef]
- Jones, D. The distribution and importance of the Mycosphaerella Leaf Spot Diseases of Banana. In Mycosphaerella Leaf spot Diseases of Bananas: Present Status and Outlook; INIBAP: San José, Costa Rica, 2003; pp. 25–41. [Google Scholar]
- Edmeades, S.; Phaneuf, D.J.; Smale, M.; Renkow, M. Modelling the crop variety demand of semi-subsistence households: Bananas in Uganda. J. Agric. Econ. 2008, 59, 329–349. [Google Scholar] [CrossRef]
- Kenneth, A.; Gerald, O.; Edilegnaw, W.; Wilberforce, T. Ex-Ante Adoption of New Cooking Banana (Matooke) Hybrids in Uganda Based on Farmers’ Perceptions; Technical Report; International Association of Agricultural Economists: Foz Do Iguacu, Brazil, 2012. [Google Scholar]
- Cook, D.C.; Liu, S.; Edwards, J.; Villalta, O.N.; Aurambout, J.P.; Kriticos, D.J.; Drenth, A.; De Barro, P.J. Predicted economic impact of black Sigatoka on the Australian banana industry. Crop. Prot. 2013, 51, 48–56. [Google Scholar] [CrossRef]
- Ramsey, M.; Daniells, J.; Anderson, V. Effects of Sigatoka leaf spot (Mycosphaerella musicola Leach) on fruit yields, field ripening and greenlife of bananas in North Queensland. Sci. Hortic. 1990, 41, 305–313. [Google Scholar] [CrossRef]
- Bebber, D.P. Climate change effects on Black Sigatoka disease of banana. Philos. Trans. R. Soc. B 2019, 374, 20180269. [Google Scholar] [CrossRef]
- Norros, V.; Rannik, Ü.; Hussein, T.; Petäjä, T.; Vesala, T.; Ovaskainen, O. Do small spores disperse further than large spores? Ecology 2014, 95, 1612–1621. [Google Scholar] [CrossRef] [Green Version]
- Golan, J.J.; Pringle, A. Long-distance dispersal of fungi. Microbiol. Spectr. 2017, 5. [Google Scholar] [CrossRef]
- Driscoll, J.C.; Kraay, A.C. Consistent covariance matrix estimation with spatially dependent panel data. Rev. Econ. Stat. 1998, 80, 549–560. [Google Scholar] [CrossRef]
- Robert, S.; Ravigné, V.; Zapater, M.F.; Abadie, C.; Carlier, J. Contrasting introduction scenarios among continents in the worldwide invasion of the banana fungal pathogen Mycosphaerella fijiensis. Mol. Ecol. 2012, 21, 1098–1114. [Google Scholar] [CrossRef] [PubMed]
- Rivas, G.G.; Zapater, M.F.; Abadie, C.; Carlier, J. Founder effects and stochastic dispersal at the continental scale of the fungal pathogen of bananas Mycosphaerella fijiensis. Mol. Ecol. 2004, 13, 471–482. [Google Scholar] [CrossRef] [PubMed]
- Burt, P.J.A. Windborne dispersal of Sigatoka leaf spot pathogens. Grana 1994, 33, 108–111. [Google Scholar] [CrossRef]
- Aylor, D.E. Spread of plant disease on a continental scale: Role of aerial dispersal of pathogens. Ecology 2003, 84, 1989–1997. [Google Scholar] [CrossRef]
- Parnell, M.; Burt, P.J.; Wilson, K. The influence of exposure to ultraviolet radiation in simulated sunlight on ascospores causing Black Sigatoka disease of banana and plantain. Int. J. Biometeorol. 1998, 42, 22–27. [Google Scholar] [CrossRef]
- Yonow, T.; Ramirez-Villegas, J.; Abadie, C.; Darnell, R.E.; Ota, N.; Kriticos, D.J. Black Sigatoka in bananas: Ecoclimatic suitability and disease pressure assessments. PLoS ONE 2019, 14, e0220601. [Google Scholar] [CrossRef] [Green Version]
- Júnior, J.; Valadares Júnior, R.; Cecílio, R.A.; Moraes, W.B.; Vale, F.X.R.d.; Alves, F.R.; Paul, P.A. Worldwide geographical distribution of Black Sigatoka for banana: Predictions based on climate change models. Sci. Agric. 2008, 65, 40–53. [Google Scholar] [CrossRef]
- FAO. 2019. Available online: http://www.fao.org/3/y5102e/y5102e04.htm (accessed on 22 March 2020).
- Wooldridge, J.M. Econometric Analysis of Cross Section and Panel Data; MIT Press: Cambridge, MA, USA, 2002. [Google Scholar]
- Grambsch, P.M.; Therneau, T.M. Proportional hazards tests and diagnostics based on weighted residuals. Biometrika 1994, 81, 515–526. [Google Scholar] [CrossRef]
- Zheng, Y.; Cai, T. Augmented estimation for t-year survival with censored regression models. Biometrics 2017, 73, 1169–1178. [Google Scholar] [CrossRef] [PubMed]
- Stover, R. Distribution and probable origin of Mycosphaerella fijiensis in southeast Asia. Trop. Agric. Trinidad Tobago 1978, 55, 65–68. [Google Scholar]
- Pasberg-Gauhl, C.; Gauhl, F.; Jones, D. Black leaf streak: Distribution and economic importance. Dis. Banan. Abaca Enset 2000, 37–44. [Google Scholar]
- Jacome, L. Mycosphaerella Leaf Spot Diseases of Bananas: Present Status and Outlook; Bioversity International: Rome, Italy, 2003. [Google Scholar]
- Blomme, G.; Ploetz, R.; Jones, D.; De Langhe, E.; Price, N.; Gold, C.; Geering, A.; Viljoen, A.; Karamura, D.; Pillay, M.; et al. A historical overview of the appearance and spread of Musa pests and pathogens on the African continent: Highlighting the importance of clean Musa planting materials and quarantine measures. Ann. Appl. Biol. 2013, 162, 4–26. [Google Scholar] [CrossRef]
- Allen, R.G.; Pereira, L.S.; Raes, D.; Smith, M. Crop evapotranspiration-Guidelines for computing crop water requirements-FAO Irrigation and drainage paper 56. Fao Rome 1998, 300, D05109. [Google Scholar]
Figure 1.
Bananas Growing Suitability Area. Note: This figure depicts banana suitability areas.

Figure 2.
Black Sigatoka Detected-% Countries. Note: This figure shows the percent of banana producing countries that have been infected.
Figure 2.
Black Sigatoka Detected-% Countries. Note: This figure shows the percent of banana producing countries that have been infected.

Figure 3.
Temporal Spread of Black Sigatoka. Note: (i) This figures shows the distribution of countries where BSLD has been detected over time. (ii) Detected; Not Detected.
Figure 3.
Temporal Spread of Black Sigatoka. Note: (i) This figures shows the distribution of countries where BSLD has been detected over time. (ii) Detected; Not Detected.

Figure 4.
Cox-Snell Residuals Model Fit Assessment. Note: This figure provides the Cox-Snell Residual Model Fit Assessment of the Cox Proportional Hazard Model from Equation (10).
Figure 4.
Cox-Snell Residuals Model Fit Assessment. Note: This figure provides the Cox-Snell Residual Model Fit Assessment of the Cox Proportional Hazard Model from Equation (10).

Figure 5.
Probability of First Time Infection—No Long Distance Dispersal. Note: This figure provides the counter-factual prediction of the impact assuming of no LDD as estimated from the Cox Proporational Hazard Model in Equation (10).
Figure 5.
Probability of First Time Infection—No Long Distance Dispersal. Note: This figure provides the counter-factual prediction of the impact assuming of no LDD as estimated from the Cox Proporational Hazard Model in Equation (10).

Figure 6.
Probability of First Time Infection—No Agricultural Imports. Note: This figure provides the counter-factual prediction of the impact assuming no agricultural imports as estimated from the Cox Proporational Hazard Model in Equation (10).
Figure 6.
Probability of First Time Infection—No Agricultural Imports. Note: This figure provides the counter-factual prediction of the impact assuming no agricultural imports as estimated from the Cox Proporational Hazard Model in Equation (10).

Figure 7.
Potential Losses. Note: This figure provides the total predicted losses as estimated from the linear regression model in Equation (11).
Figure 7.
Potential Losses. Note: This figure provides the total predicted losses as estimated from the linear regression model in Equation (11).

Figure 8.
Potential Losses (%). Note: This figure provides the percentage of predicted losses as estimated from the linear regression model in Equation (11).
Figure 8.
Potential Losses (%). Note: This figure provides the percentage of predicted losses as estimated from the linear regression model in Equation (11).


Table 1.
Summary statistics.
| Variable | Definition | Mean | Std. Dev. |
|---|---|---|---|
| PROD | Production (tons) | 464,628 | 1,621,986 |
| HAREA | Area Harvested (Ha) | 3,0087 | 79,202 |
| BSLD | Detection Indicator | 0.3169 | 0.4653 |
| F | Disease Diffusion rate | 0.0259 | 0.0526 |
| F (BSLD = 1) | F once Infected | 0.021 | 0.039 |
| LDD | Long Distance Dispersal Probability | 4.09 × 10 | 0.0003 |
| RAIN | Rainfall (mm/day) | 4.0223 | 2.5112 |
| EVAPO | Evapotranspiration (mm/day) | 2.6141 | 1.1214 |
| HUMID | Relative Humidity (%) | 74.9114 | 11.7134 |
| CMOIST | Moisture Storage on Canopy | 2.2819 | 2.513 |
| CTEMP | Canopy Temperature (C) | 24.0699 | 2.4552 |
| WIND | Wind (m/s) | 2.9039 | 1.7498 |
| WSTRESS | % Days Soil Water Stressed | 0.4804 | 0.3589 |
| CTEMP8 | % Days CTEMP < 8 C | 0.0053 | 0.0188 |
| CTEMP38 | % Days CTEMP > 38 C | 0.0001 | 0.0014 |
| HUMID60 | % Days HUMID > 60% | 0.166 | 0.219 |
| WIND4 | % Days WIND > 4 m/s | 0.403 | 0.3092 |
| BIMPORT | Import of Bananas (tons) | 24,006 | 113,401 |
| AIMPORT | Import of Agr. Products (tons) | 1,720,699 | 4,777,477 |
| BSUIT | Area of Banana Suitability (Ha) | 1691 | 4409 |
| DWBS | Distance Weight. Detection | 0.037 | 0.202 |
| DWAEXP | Distance Weight. logged Agricultural Exports | 0.717 | 2.544 |
| DWBEXP | Distance Weight. logged Bananas Exports | 0.406 | 1.785 |
Note: This table provides summary statistics for all variables used in the analysis.
Table 2.
First-Time Infection.
| (1) | (2) | (3) | |
|---|---|---|---|
| LDD | 0.032 * | 0.0397 ** | 0.0411 ** |
| (0.013) | (0.012) | (0.0116) | |
| log(AIMP) | 0.6039 ** | 0.6735 ** | 0.6328 ** |
| (0.1666) | (0.1684) | (0.1554) | |
| log(BIMP) | −0.0031 | −0.0275 | −0.0356 |
| (0.0928) | (0.0991) | (0.0954) | |
| DWBSLD | −1.4895 * | −1.0984 | |
| (0.6779) | (0.7962) | ||
| FT | −0.2109 | −0.3030 | −01.0721 |
| (2.5275) | (2.5928) | (2.6881) | |
| RAIN | 0.13 | 0.1269 | 0.1619 |
| (0.1384) | (0.1399) | (0.1499) | |
| EVAPO | −0.8477 | −0.8978 | −0.7071 |
| (0.6737) | (0.6778) | (0.7295) | |
| HUMID | 0.0759 | 0.0974 | 0.0327 |
| (0.1153) | (0.1116) | (0.1347) | |
| CMOIST | −0.3582 | −0.4000 | −0.3787 |
| (0.2181) | (0.216) | (0.2319) | |
| CTEMP | 0.1954 | 0.2236 | 0.199 |
| (0.1513) | (0.1467) | (0.1605) | |
| WIND | −0.8690 | −01.1943 | −0.9247 |
| (1.0180) | (1.0125) | (0.9748) | |
| WSTRESS | −4.9328 | −5.2234 | −4.3036 |
| (2.8768) | (2.8953) | (3.1743) | |
| CTEMP8 | 2.5629 | 2.7856 | 2.9621 |
| (13.0638) | (12.6117) | (12.5182) | |
| CTEMP38 | −2968.0320 | −2750.2310 | −5314.0590 |
| (5605.0180) | (5690.3960) | (8580.5970) | |
| HUMID60 | 0.2426 | 1.3038 | −1.8477 |
| (6.6567) | (6.5067) | (8.0296) | |
| WIND4 | 2.9073 | 4.7726 | 3.4434 |
| (5.8018) | (5.8627) | (5.6950) | |
| log(HAREA) | 0.0598 | 0.0494 | 0.0122 |
| (0.1316) | (0.1268) | (0.1534) | |
| log(BAREA) | −0.3020 | −0.3588 | −0.3106 |
| (0.2067) | (0.2156) | (0.2671) | |
| t | 0.2261 ** | ||
| (0.073) | |||
| t | −0.0034 ** | ||
| (0.0011) | |||
| MODEL: | COX | COX | LOGIT |
| Obs. | 4137 | 4137 | 4137 |
Notes: (a) This table provides the estimates from the Cox Proportional Hazard model in Equation (10), as well as the logit model of survival; (b) * and ** indicate 1 and 5 per cent significant levels, respectively; (c) All regressions include 12 sub-regional indicator variables and measures of the logged area and the logged banana suitable areas. (d) Standard errors clustered by country in parentheses. (e) COX: Cox Proportional Hazard.
Table 3.
Banana Production.
| (1) | (2) | |
|---|---|---|
| BS | 0.076 | 0.057 |
| (0.047) | (0.041) | |
| F | −1.315 | −0.732 |
| (1.089) | (0.904) | |
| F × BS | −1.846 ** | −2.717 ** |
| (0.545) | (0.611) | |
| RAIN | −0.025 | −0.012 |
| (0.016) | (0.014) | |
| EVAPO | −0.061 | −0.005 |
| (0.148) | (0.108) | |
| HUMID | 0.011 | 0.01 |
| (0.009) | (0.008) | |
| CMOIST | 0.009 | 0.008 |
| (0.019) | (0.017) | |
| CTEMP | −0.051 | −0.046 |
| (0.027) | (0.025) | |
| WIND | −0.005 | 0.042 |
| (0.043) | (0.042) | |
| WSTRESS | −0.082 | 0.101 |
| (0.244) | (0.214) | |
| CTEMP8 | −4.916 ** | −4.845 ** |
| (1.778) | (1.458) | |
| CTEMP38 | −0.127 | 1.202 |
| (4.859) | (3.754) | |
| HUMID60 | 0.531 | 0.718 |
| (0.431) | (0.37) | |
| WIND4 | −0.471 | −0.488 |
| (0.409) | (0.293) | |
| Dep. Var: | PROD | BAREA |
| Obs. | 6793 | 6793 |
| 0.677 | 0.66 |
Notes: (a) This table provides the estimates from the linear regression model in Equation (11), as well as the logit model of survival; (b) ** indicates 1 per cent significant levels, respectively; (c) All regressions yearly indicators as well as country specific time trends. (d) Driscoll and Kraay [31] standard errors allowing for cross-sectional and serial correlation in parentheses.
© 2020 by the authors. Licensee MDPI, Basel, Switzerland. This article is an open access article distributed under the terms and conditions of the Creative Commons Attribution (CC BY) license (http://creativecommons.org/licenses/by/4.0/).
Share and Cite
MDPI and ACS Style
Strobl, E.; Mohan, P. Climate and the Global Spread and Impact of Bananas’ Black Leaf Sigatoka Disease. Atmosphere 2020, 11, 947. https://0-doi-org.brum.beds.ac.uk/10.3390/atmos11090947
AMA Style
Strobl E, Mohan P. Climate and the Global Spread and Impact of Bananas’ Black Leaf Sigatoka Disease. Atmosphere. 2020; 11(9):947. https://0-doi-org.brum.beds.ac.uk/10.3390/atmos11090947
Chicago/Turabian StyleStrobl, Eric, and Preeya Mohan. 2020. "Climate and the Global Spread and Impact of Bananas’ Black Leaf Sigatoka Disease" Atmosphere 11, no. 9: 947. https://0-doi-org.brum.beds.ac.uk/10.3390/atmos11090947
Note that from the first issue of 2016, this journal uses article numbers instead of page numbers. See further details here.