Impacts of Multiple Radiance Data Assimilation on the Simulation of Typhoon Chan-Hom

1
Key Laboratory of Meteorological Disaster, Ministry of Education (KLME)/Joint International Research Laboratory of Climate and Environment Change (ILCEC)/Collaborative Innovation Center on Forecast and Evaluation of Meteorological Disasters (CIC-FEMD), Nanjing University of Information Science & Technology, Nanjing 210044, China
2
Heavy Rain and Drought-Flood Disasters in Plateau and Basin Key Laboratory of Sichuan Province, Chengdu 610225, China
3
The Institute of Atmospheric Environment, China Meteorological Administration, Shenyang 110000, China
4
Shanghai Typhoon Institute, China Meteorological Administration, Shanghai 200030, China
*
Author to whom correspondence should be addressed.
Atmosphere 2020, 11(9), 957; https://0-doi-org.brum.beds.ac.uk/10.3390/atmos11090957
Submission received: 31 July 2020
/
Revised: 27 August 2020
/
Accepted: 3 September 2020
/
Published: 8 September 2020
(This article belongs to the Special Issue Advances in Mesoscale Numerical Weather Prediction and its Applications)
Abstract
:With the module of assimilating AMSU-A (Advanced Microwave Sounding Unit-A) and AIRS (Atmospheric Infrared Sounder) data in the WRFDA (Weather Research and Forecasting Model Data Assimilation) system, the impacts of joint assimilation of the radiance observations from two satellites on the simulation of typhoon Chan-hom (2015) are addressed. For comparison, experiments with the assimilation of solely GTS (Global Telecommunications System) data, AMSU-A data, or AIRS data are also performed. The results show that, compared to other experiments, the analysis field after assimilating multiple radiance data is closer to the observation. The simulated steering flow in its forecast field is conductive to the northeast twist of the typhoon. In addition, the simulated rainband and the FSS (fraction skill score) calculated from the experiment with assimilating multiple radiance data are better. In the deterministic forecast, better performance is obtained from the simulation with multiple radiance data in the forecast of track, MSLP (minimum sea level pressure), and MSW (maximum surface wind).
1. Introduction
In the past two decades, the skill of numerical weather prediction (NWP) has been improved for many reasons [1], such as the progresses in NWP models, the improvement of advanced data assimilation (DA) techniques, and the abundance of remote sensing data, mainly including radar data and satellite data. To some extent, NWP is a problem of initial conditions [2,3]; thus, an accurate description of the initial state of the atmosphere is essential. However, it is still a challenge to improve the accuracy of the initial state in the numerical model. For tropical cyclones, they are over the broad ocean where conventional and radar observations are scarce in most of their life span; thus, it is difficult to detect them by these platforms. Luckily, satellites move along their orbits globally or geostationary, and they can cover oceans [4,5]. Nowadays, satellite observations account for 90–95% of the assimilated data for global NWP models [6,7,8,9], and the NWP forecast skill is greatly improved with the introduction of satellite data [10,11,12]. In current NWP centers worldwide, satellite radiance data have become the most significant data used to improve the accuracy of short- and medium-range weather predictions.
Due to the development of radiative transfer models, the simulated radiance can be acquired by these models. With the satellite scanning model, the state of the atmosphere and the fixed surface attribute are given, thus, the assimilation of satellite radiance data can be realized. At present, the Community Radiative Transfer Model (CRTM) and the Radiative Transfer for Television and Infrared Observation Satellite Operational Vertical Sounder (RTTOV) are the two main radiative transfer models which have been widely used as forwarding operators in DA systems [13,14,15,16,17]. After the obtention of simulated radiance, the background field of numerical models can be modified by comparing the observed radiance and the simulated radiance, making an optimal estimation, which is treated as a representative of truth, on the current atmospheric state [18,19].
In previous studies, many scholars have performed a variety of experiments on single satellite radiance DA to improve the accuracy of NWP with inspiring results [20,21,22,23]. However, the practice of assimilating multiple satellite radiance data is rare, and most of which is based on rainstorm cases [24,25]. The study on multiple satellite radiance DA to improve the forecast of tropical cyclones has not been well performed [4,26,27]. Microwave and infrared radiance data are two primary satellite resources for data assimilation, of which AMSU-A (Advanced Microwave Sounding Unit-A) and AIRS (Atmospheric Infrared Sounder) are two representatives, respectively. Therefore, this study aims to investigate effects of assimilating AMSU-A data and AIRS data, which are operated by NOAA (National Oceanic and Atmospheric Administration) and NASA (National Aeronautics and Space Administration), respectively, on the simulation of tropical cyclones. Typhoon Chan-hom (2015) is selected as a case study, and AMSU-A, AIRS and the combination of the two kinds of satellite radiance data are assimilated.
The remaining parts of this paper are arranged as follows: In Section 2, a brief introduction to the AMSU-A and AIRS data is given, followed by the assimilation system and the 3DVar (three-dimensional variational) methodology. An overview of typhoon Chan-hom and experimental settings are given in Section 3. The results including the analysis field and the forecast field are shown in Section 4. Conclusions and future prospects are raised in Section 5.
2. Radiance Data and the Assimilation System
2.1. AMSU-A and AIRS Radiance Data
In NASA’s EOS (Earth Observing System), AMSU-A, along with its partner AIRS, was launched into the NASA polar-orbit Aqua Satellite in May 2002. Cooperating with AIRS, the AMSU-A instrument is the advanced atmospheric sounding system. AMSU-A is a microwave sensor with 15 channels. Channels 1, 2, and 15 are in window regions and they are sensitive to surface conditions, cloud and precipitation. Channels 3–14 are sensitive to temperature, of which only peak absorption bands of channels 5, 6, 7 are under the model top (10 hPa). The swath width of each channel is 2343 km, and 30 pixels are measured in each swath, with about a 24 km radius footprint at nadir [23]. AIRS is a hyperspectral infrared spectrometer with 2378 channels, and their wavelengths range from 3.7 to 15.4 μm. It has a rotary scanner providing ±49.5° (about 1650 km) ground coverage, and its spatial resolution at nadir is 13.5 km [28,29].
2.2. 3DVar in the Weather Research and Forecasting Model Data Assimilation(WRFDA) System
The WRFDA (WRF Data Assimilation) system is an attached module for DA in the WRF (Weather Research and Forecasting) model. In this study, WRF version 3.9 is adopted, and the data of NOAA ATOVS (Advanced TIROS Operational Vertical Sounder) instruments and EOS Aqua instruments can be read by WRFDA. The 3DVar method is adopted to conduct all DA experiments. By building a cost function, the optimal analysis of atmospheric state is acquired by numerical iterations. In detail, the specific cost function is as follows [30,31,32,33,34,35]:
where x represents analysis field, xb represents background field, yo represents observation field, and B and R are background error covariance and observation error covariance, respectively. To compare the observation field and the background field, observation operator H, which projects model variables to observation space, needs to be built.
In NWP models, the dimension of x is the product of the number of model variables and the number of three-dimensional grids, resulting in the size of B matrix is usually 107 × 107 and its transpose is morbid [36]. In the process of minimization, it is very difficult to calculate B−1 and obtain the optimal solution. To simplify the calculation, scholars suggested selecting variables that are independent of each other, known as control variables, so that B becomes a diagonal matrix, making B−1 relatively easy to obtain. The increments of analysis field are defined as x = UV, where V is called the control variable and meets B = UUT. The control variables usually include momentum control variables, humidity control variables, and air pressure control variables. There are usually two combinations of the momentum control variables: the flow function and potential function scheme (CV5) and the UV wind control variable scheme (CV7). Considering this is a preliminary trial, in the following experiments, the CV5 scheme is used in the WRFDA system with unbalanced surface pressure, unbalanced temperature, and pseudo-relative humidity as nondynamic control variables [1].
3. Overview of the Case and Experimental Settings
3.1. An Introduction to Typhoon Chan-hom
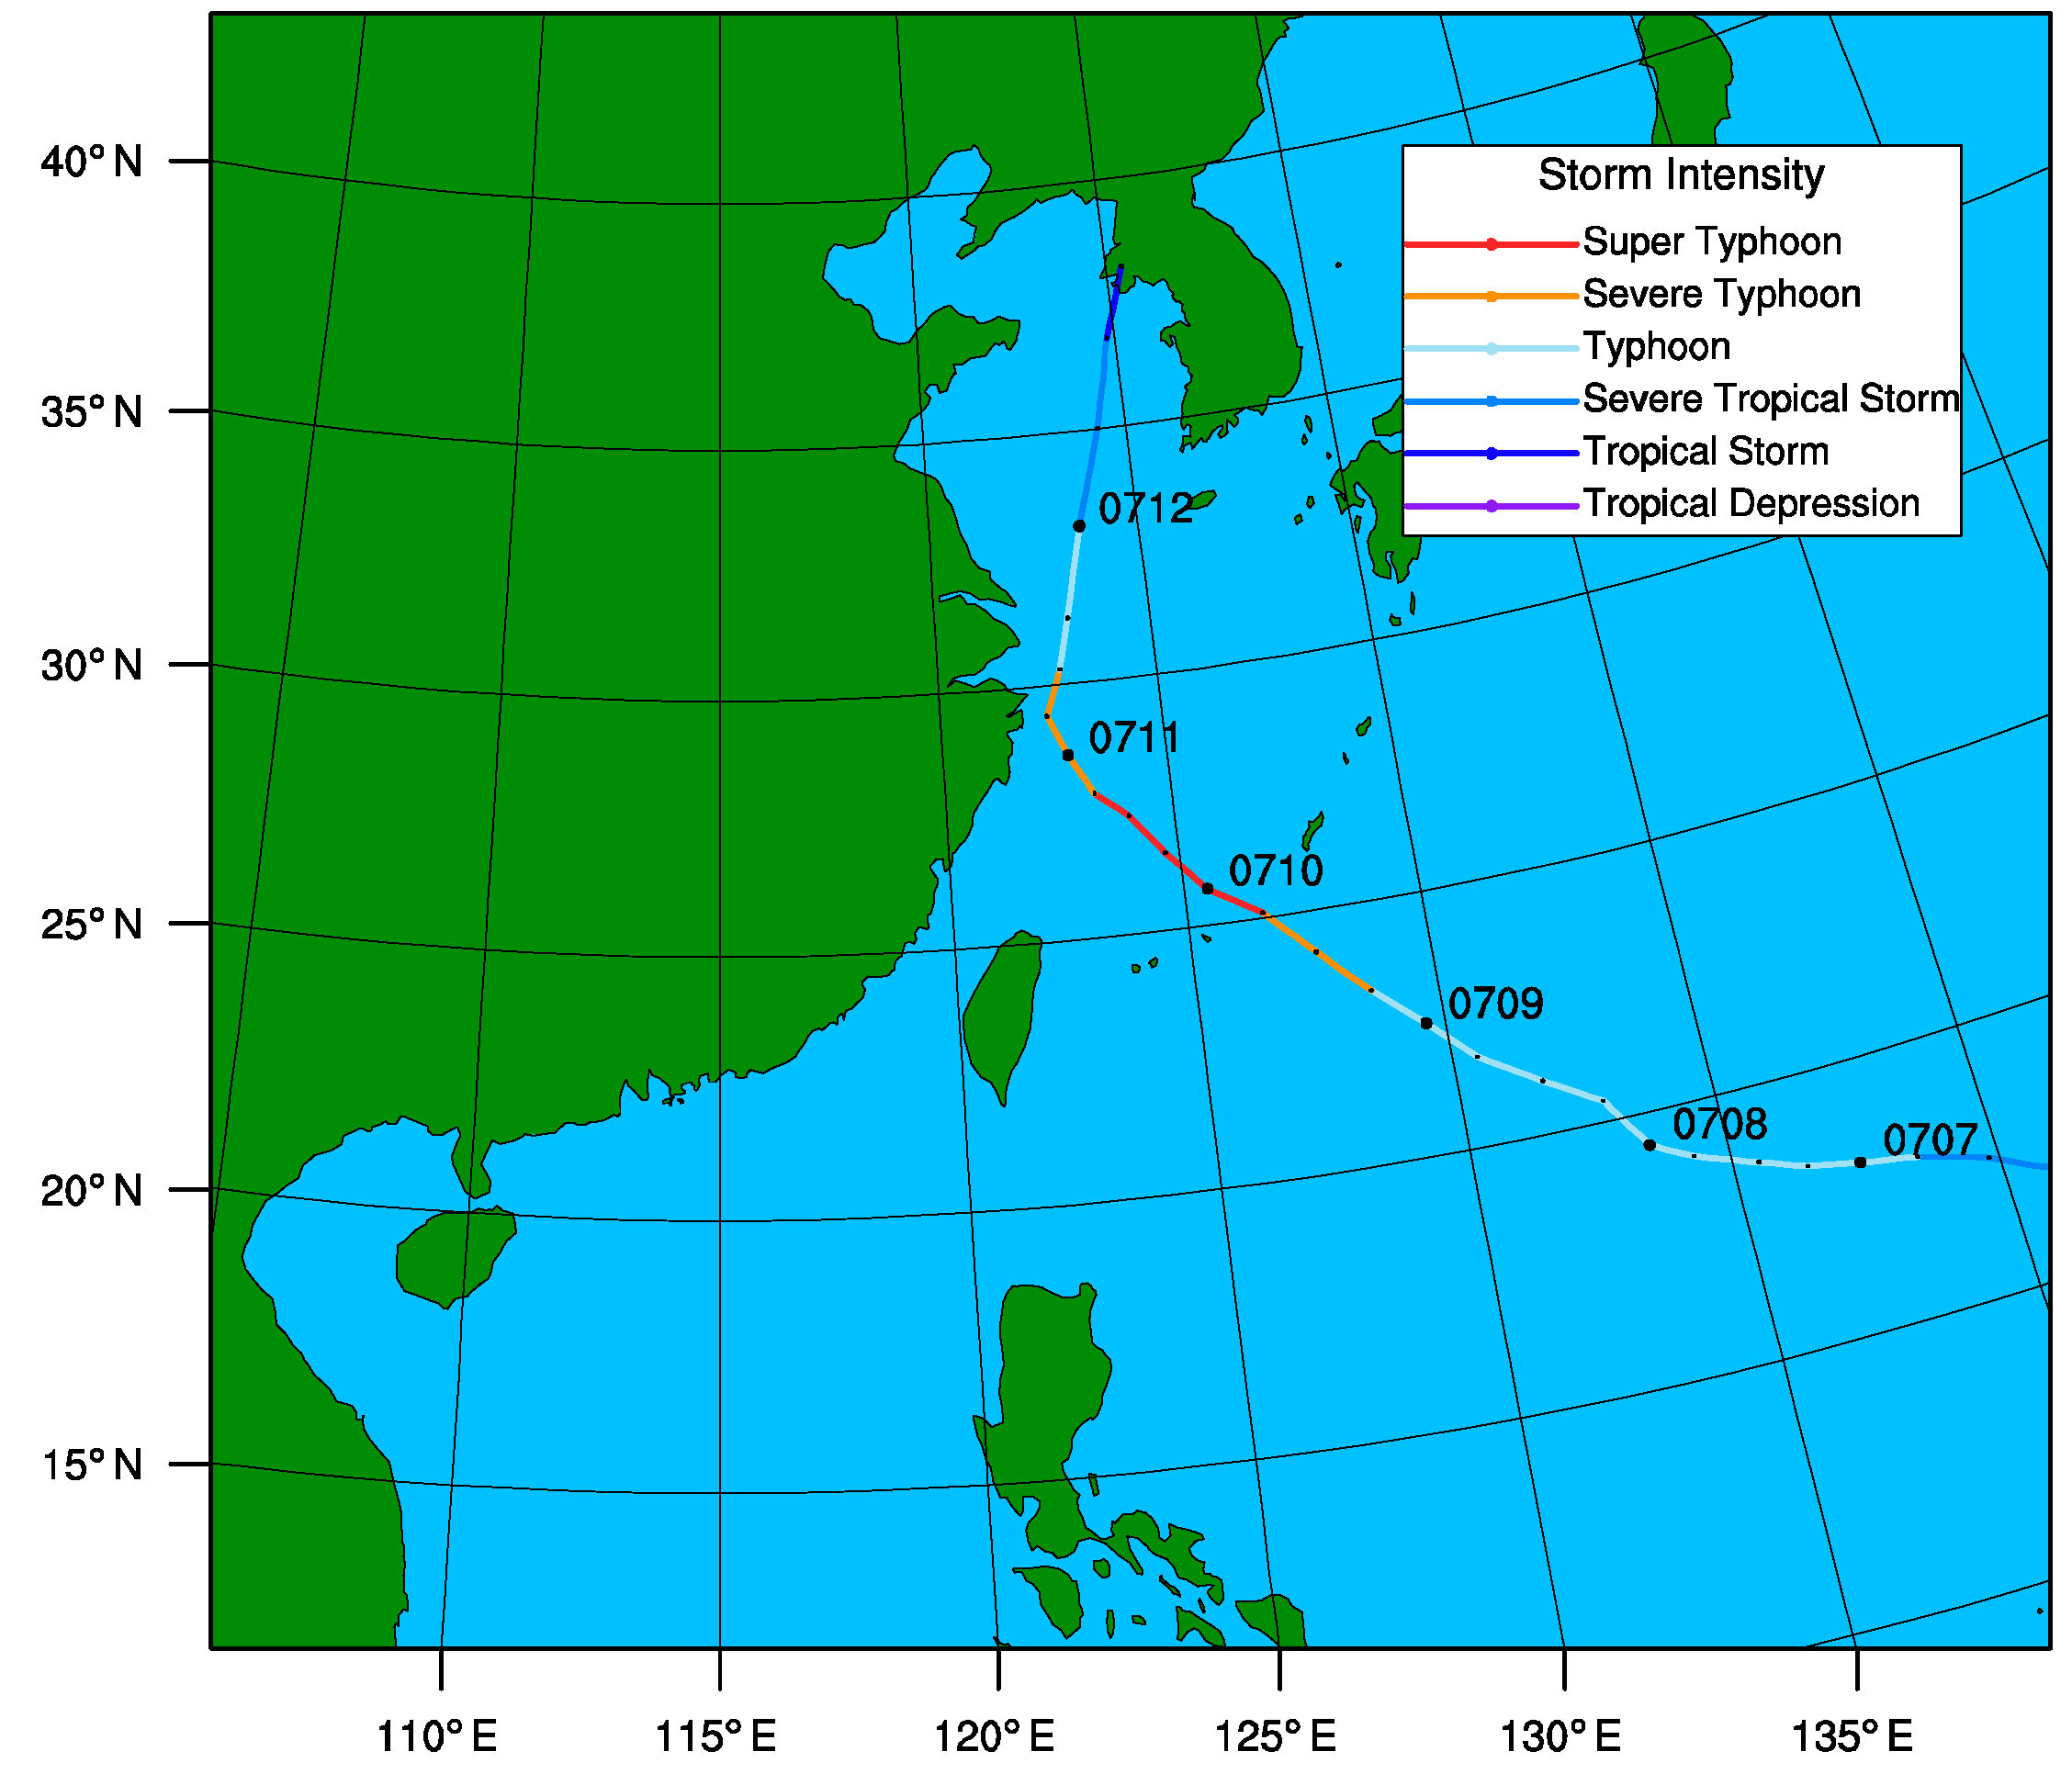
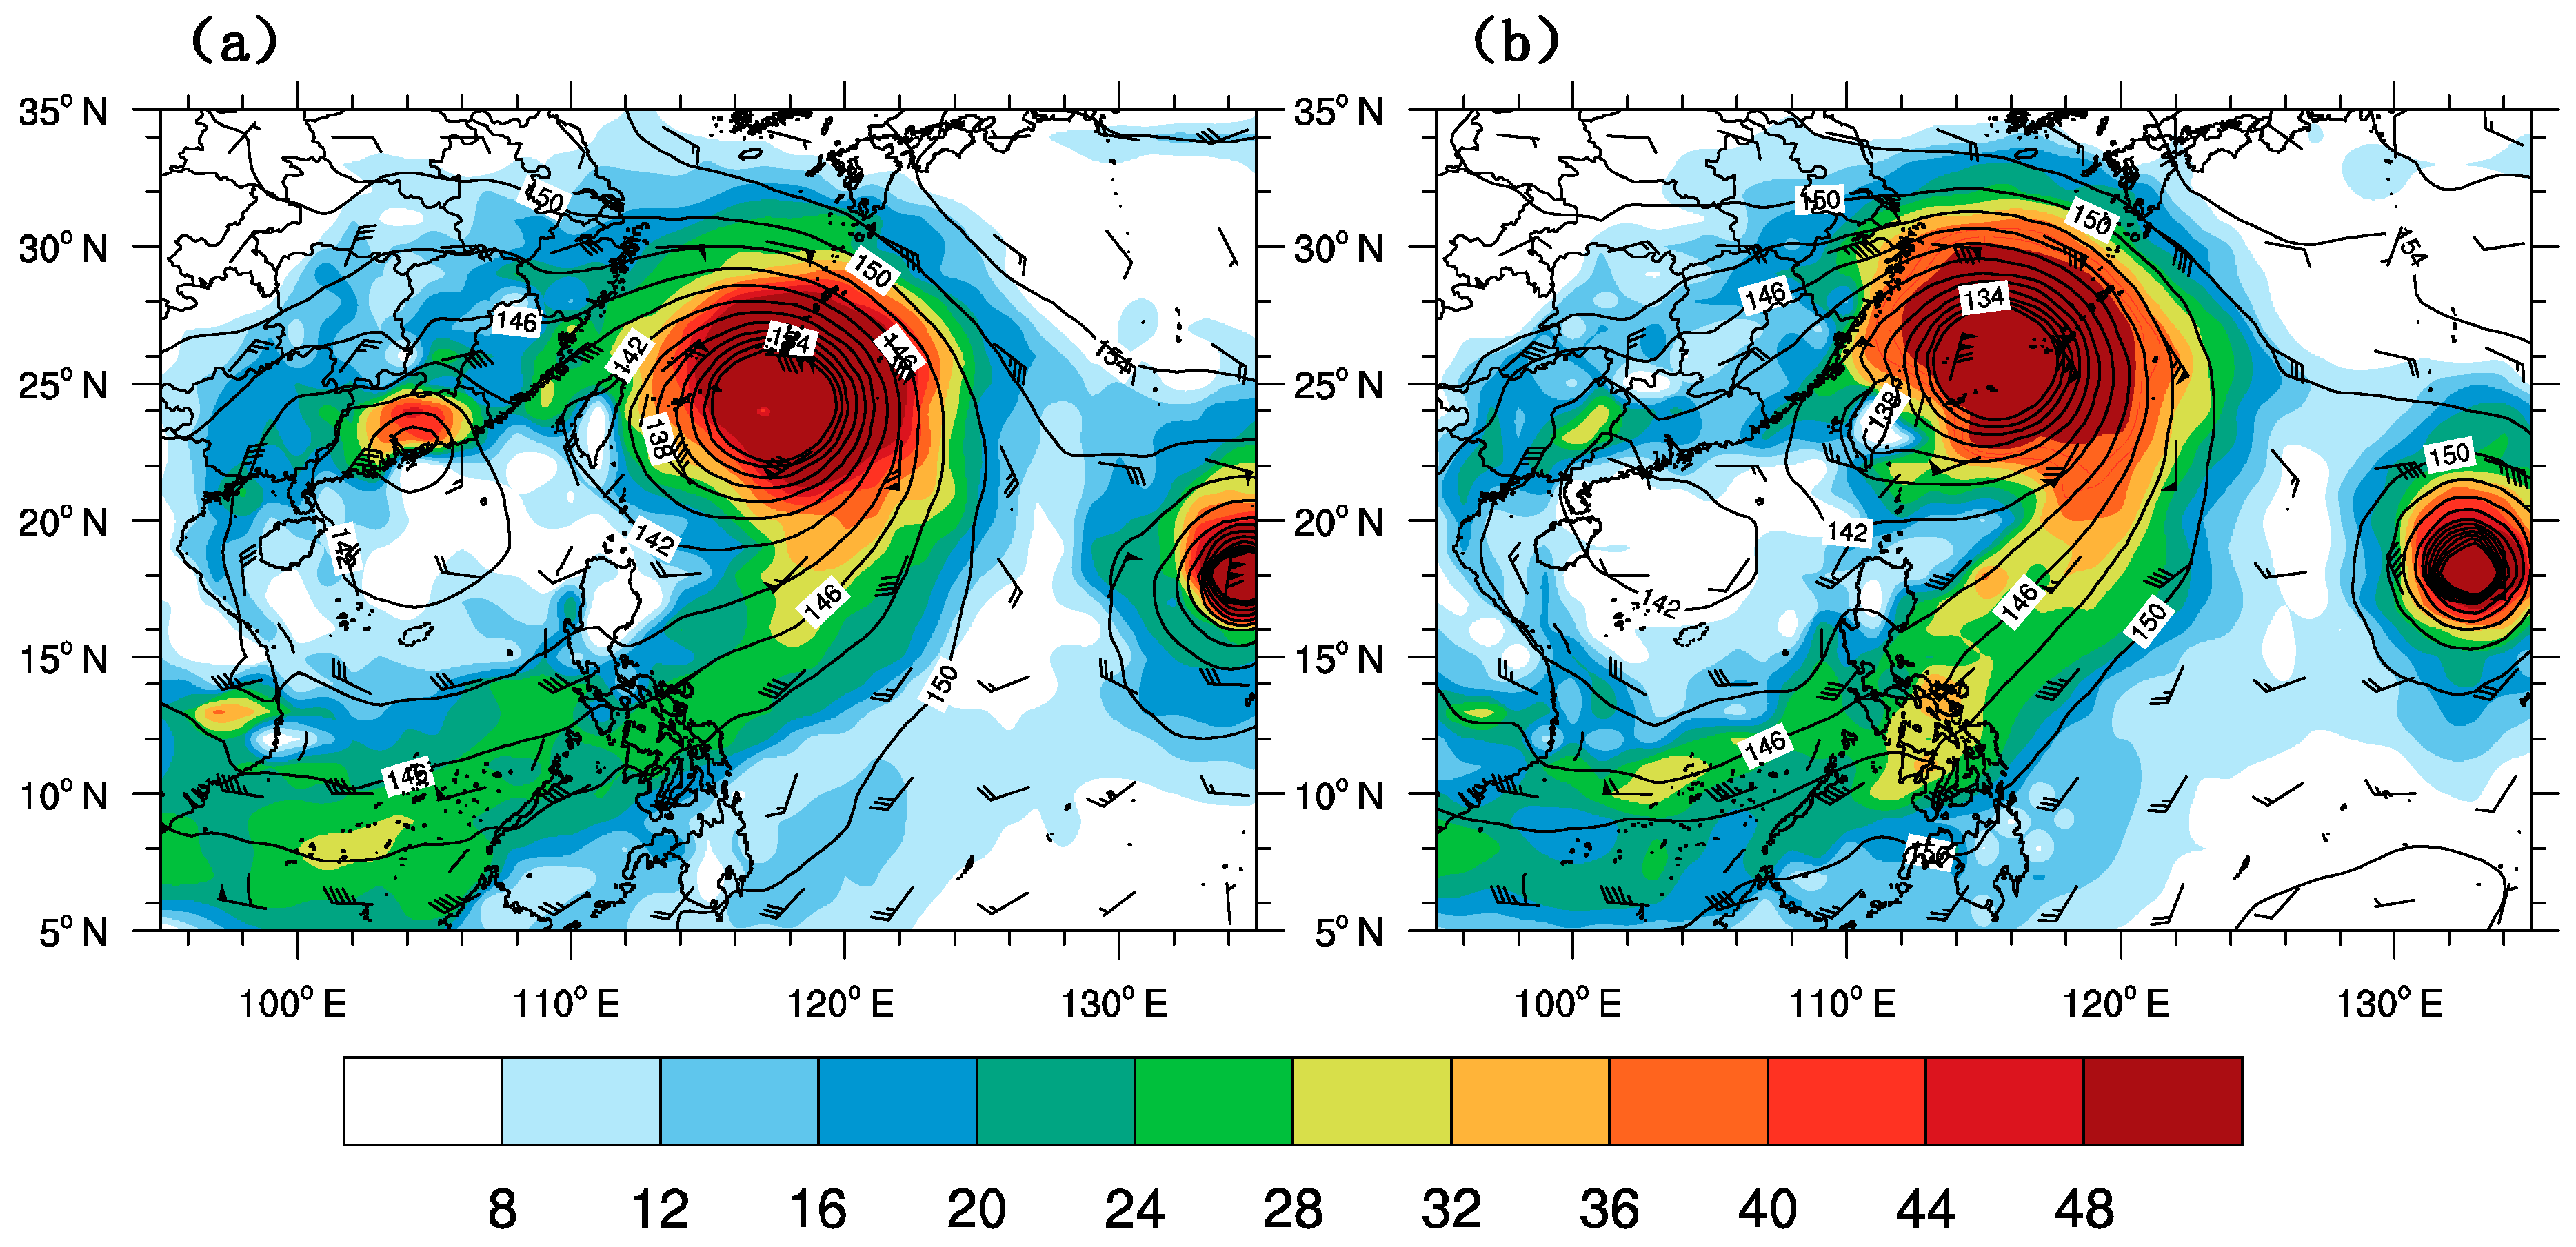
Typhoon Chan-hom, a high impact typhoon, was the 9th named storm in the 2015 Pacific typhoon season. Figure 1 shows the track of typhoon Chan-hom observed by China Meteorological Administration (CMA) [37]. On June 30, it was generated in the east ocean of the Philippines. The MSW (maximum surface wind) was 18 m/s, and its MSLP (minimum sea level pressure) was 995 hPa. After its formation, it moved northwest along the south side of the subtropical anticyclone and gradually strengthened. At about 0900 UTC on July 11, it landed on the northeast of Zhejiang Province as a severe typhoon. The MSW near the center was 45 m/s, and the MSLP was 955 hPa. After its landing, it entered the sea again and continued to move northward along the periphery of the subtropical anticyclone. It landed again on the Korean peninsula at about 1800 UTC on July 12 with an MSW of about 20 m/s and an MSLP of 990 hPa. After the second landing, its intensity continued to weaken and its numbering was stopped. According to official statistics, typhoon Chan-hom caused economic losses of up to RMB 9.8 billion in total and heavy casualties [7]. During the life span of typhoon Chan-hom, another two typhoons, Linfa and Nangka, also existed [16] (shown in Figure 2). Therefore, the circulation situation was very complex and assimilating multiple radiance data to obtain a more accurate forecast is essential.
3.2. Experimental Settings
In this study, the WRF ARW (Advanced Research WRF) version 3.9 is used as the forecast model. As shown in Figure 1, the center of the simulation domain is (27° N, 124° E) with a horizontal grid distance of 9 km. There are 450 grids in the zonal direction and 400 grids in the meridional direction. The domain is divided into 57 layers vertically, and the top of the atmosphere of the model is 10 hPa. The initial and boundary conditions are provided by 0.5° × 0.5° GFS (Global Forecast System) reanalysis data from the National Centers for Environmental Prediction (NCEP). Some parameterization schemes used in the experiment include the Kain–Fritsch cumulus parameterization scheme [38], the WSM6 (WRF Single-Moment 6-class) microphysical scheme [39], the Dudhia shortwave radiation scheme, the RRTM (rapid radiative transfer model) longwave radiation scheme [40], the YSU (Yonsei University) boundary layer scheme [41], and the Noah land-surface model.
Figure 3 shows the flow chart of all experiments. A background field, which is a 6 h forecast field initialized at 1200 UTC on 9 July, is used as the first guess for assimilation. Then, five experiments are carried out for comparison. One experiment is just a warm-start run without assimilation, and it is called the control experiment (CNTL). The other four DA experiments are conducted against the control experiment. These experiments are designed to assimilate GTS (Global Telecommunications System) conventional observation data, AMSU-A radiance data, AIRS radiance data and the combination of AMSU-A and AIRS. They are referred to as GTS_DA, AMSU-A_DA, AIRS_DA and AMSU-A + AIRS_DA, respectively. In all radiance DA experiments, GTS data are also assimilated. Eventually, a 48 h deterministic forecast is carried out. It should be pointed out that the thinning distance of radiance data is 45 km [7,18,20,23] to avoid the potential correlation between neighboring observations.
4. Results
4.1. The Simulation of Radiance Observations
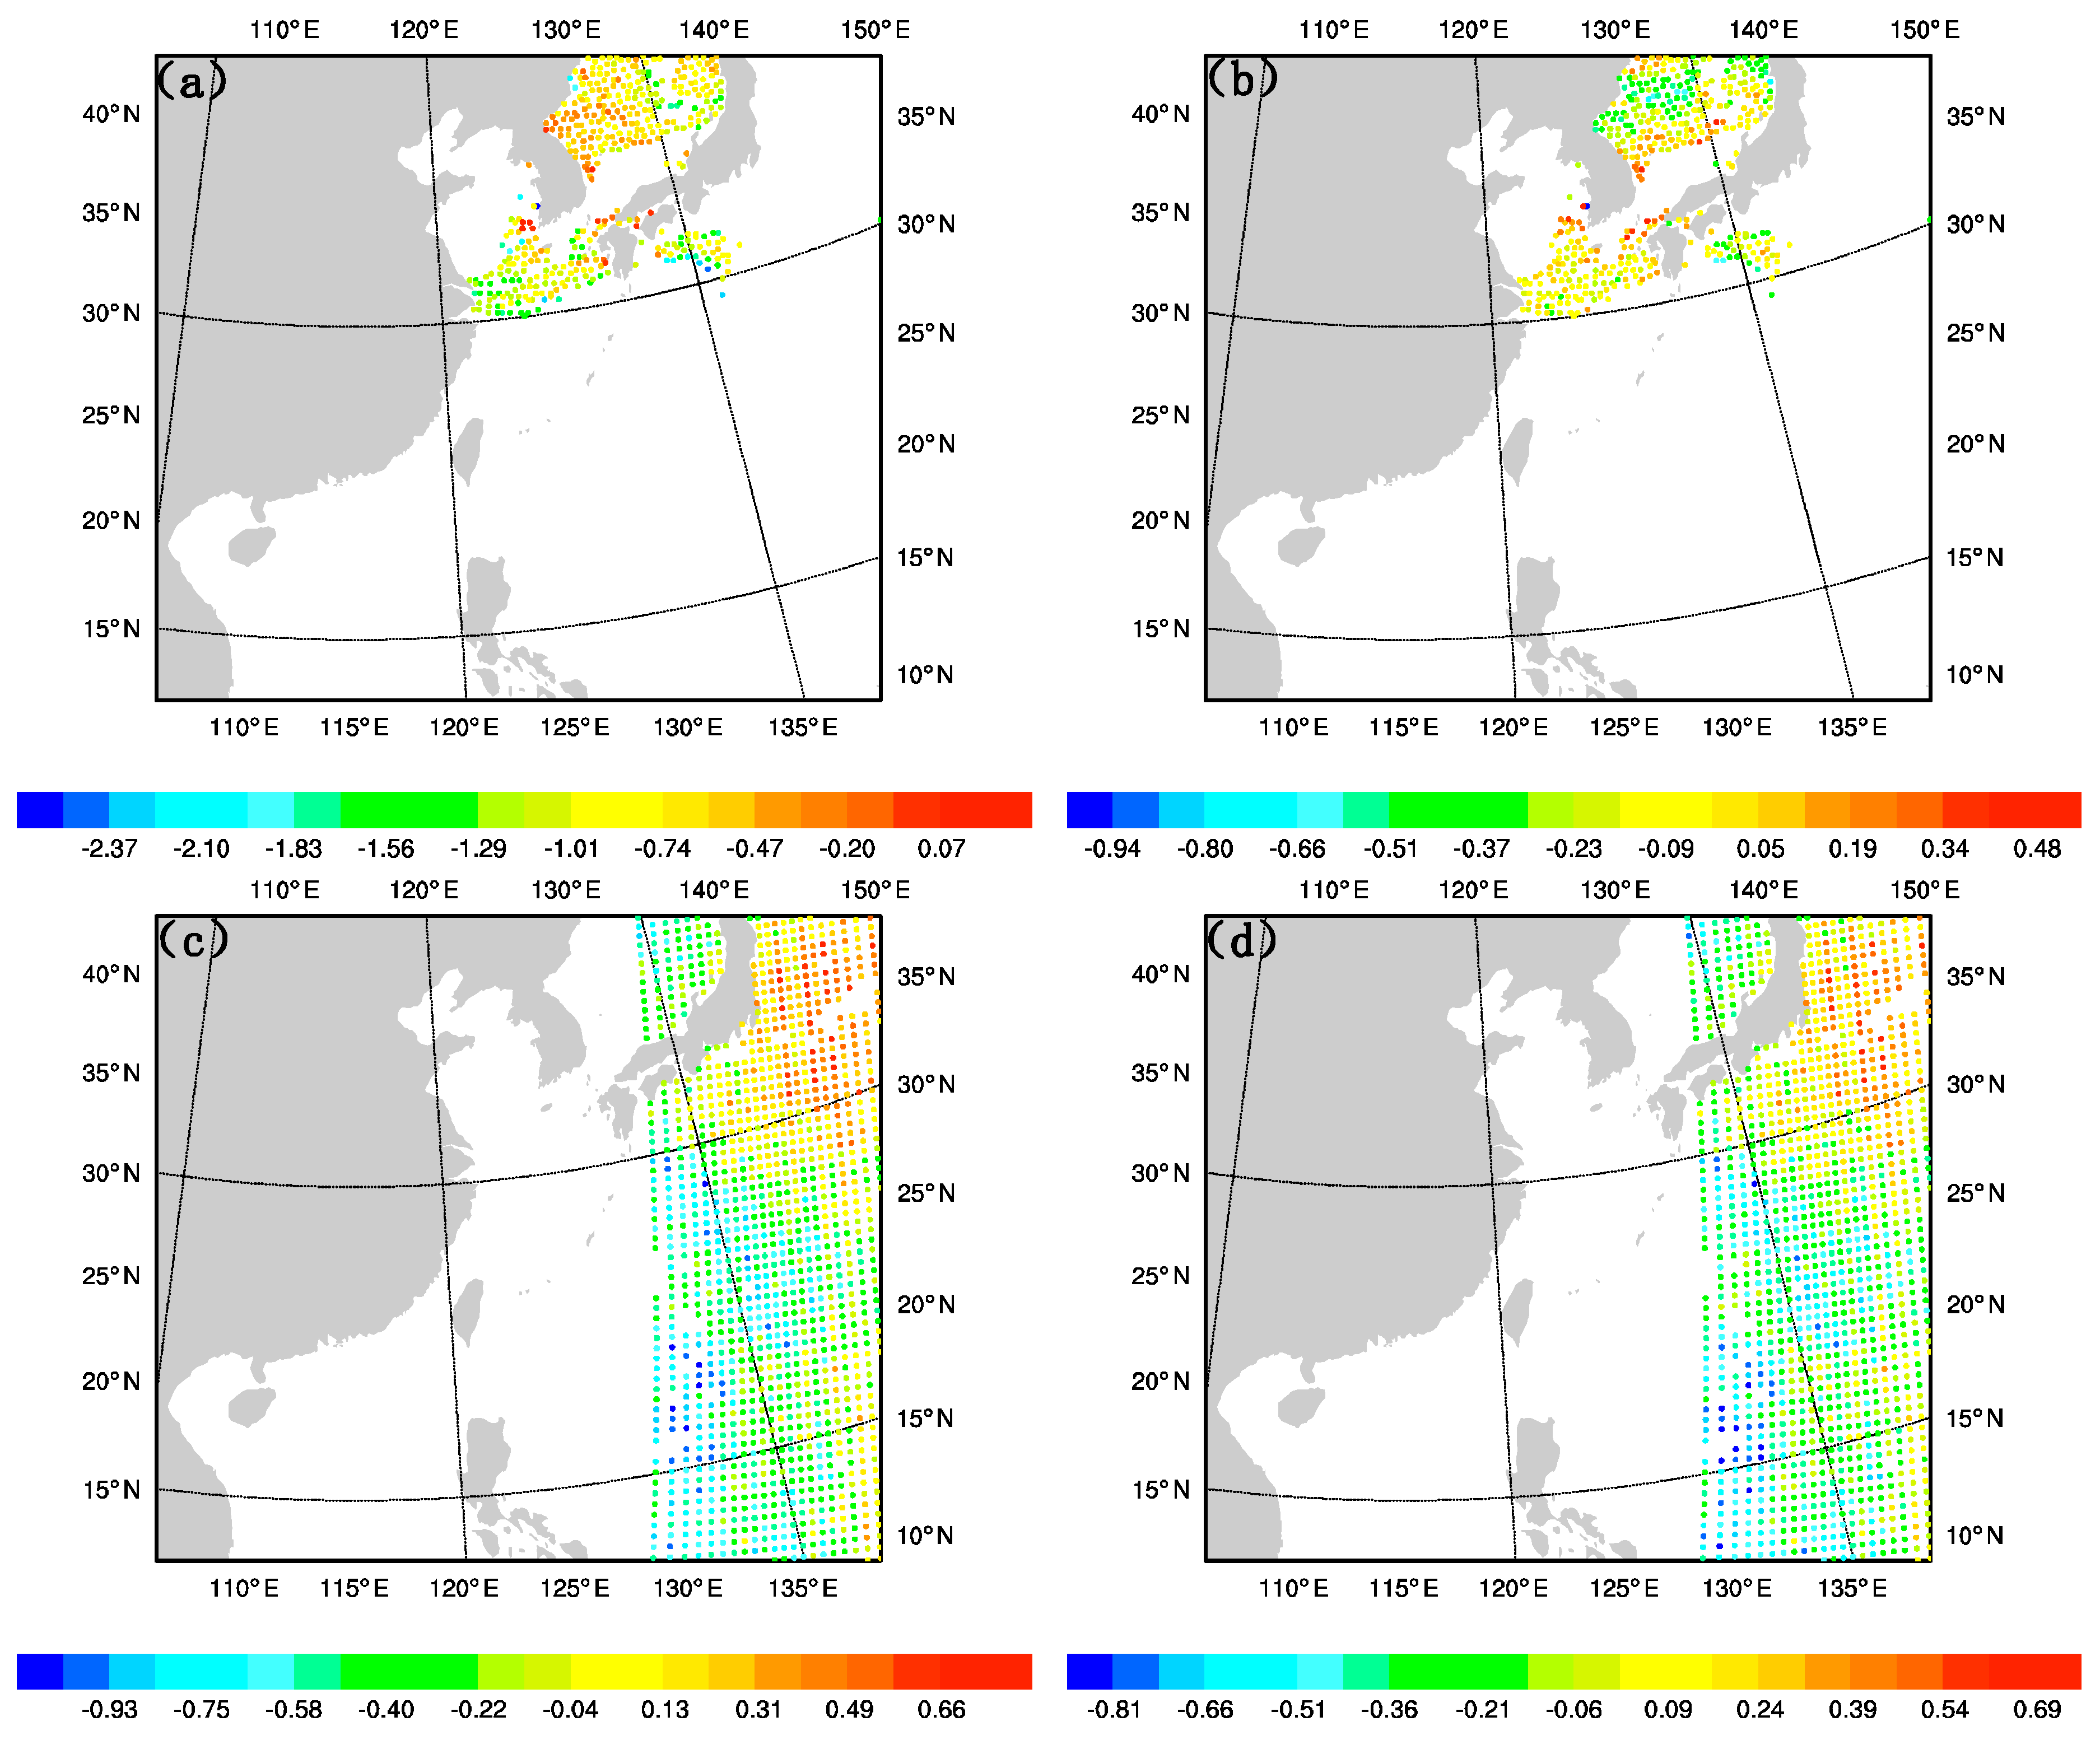
Figure 4 shows the observation of the brightness temperature minus the simulated brightness temperature in the background field (OMB) after the bias correction, and the observation of the brightness temperature minus the simulated brightness temperature in the analysis field (OMA) after the bias correction of AIRS and NOAA 15 AMSU-A at 1800 UTC on 9 July 2015. In Figure 4a,b, the scanning track of AIRS covers the Sea of Japan and the southern part of the Yellow Sea. It can be found that there exist big differences between the observation and the background field. However, after the assimilation, the analysis field is closer to the observation, especially those areas near the turning point of the typhoon with a value about 0 K, indicating less errors in the analysis field. In Figure 4c,d, the scanning track of NOAA 15 AMSU-A covers the eastern part of the typhoon. Since the background field is similar to the observation, after the assimilation, the magnitude of errors in the analysis field is a bit smaller than the background. The assimilation of AIRS and AMSU-A is able to reduce the errors in the background field.
4.2. Bias Correction
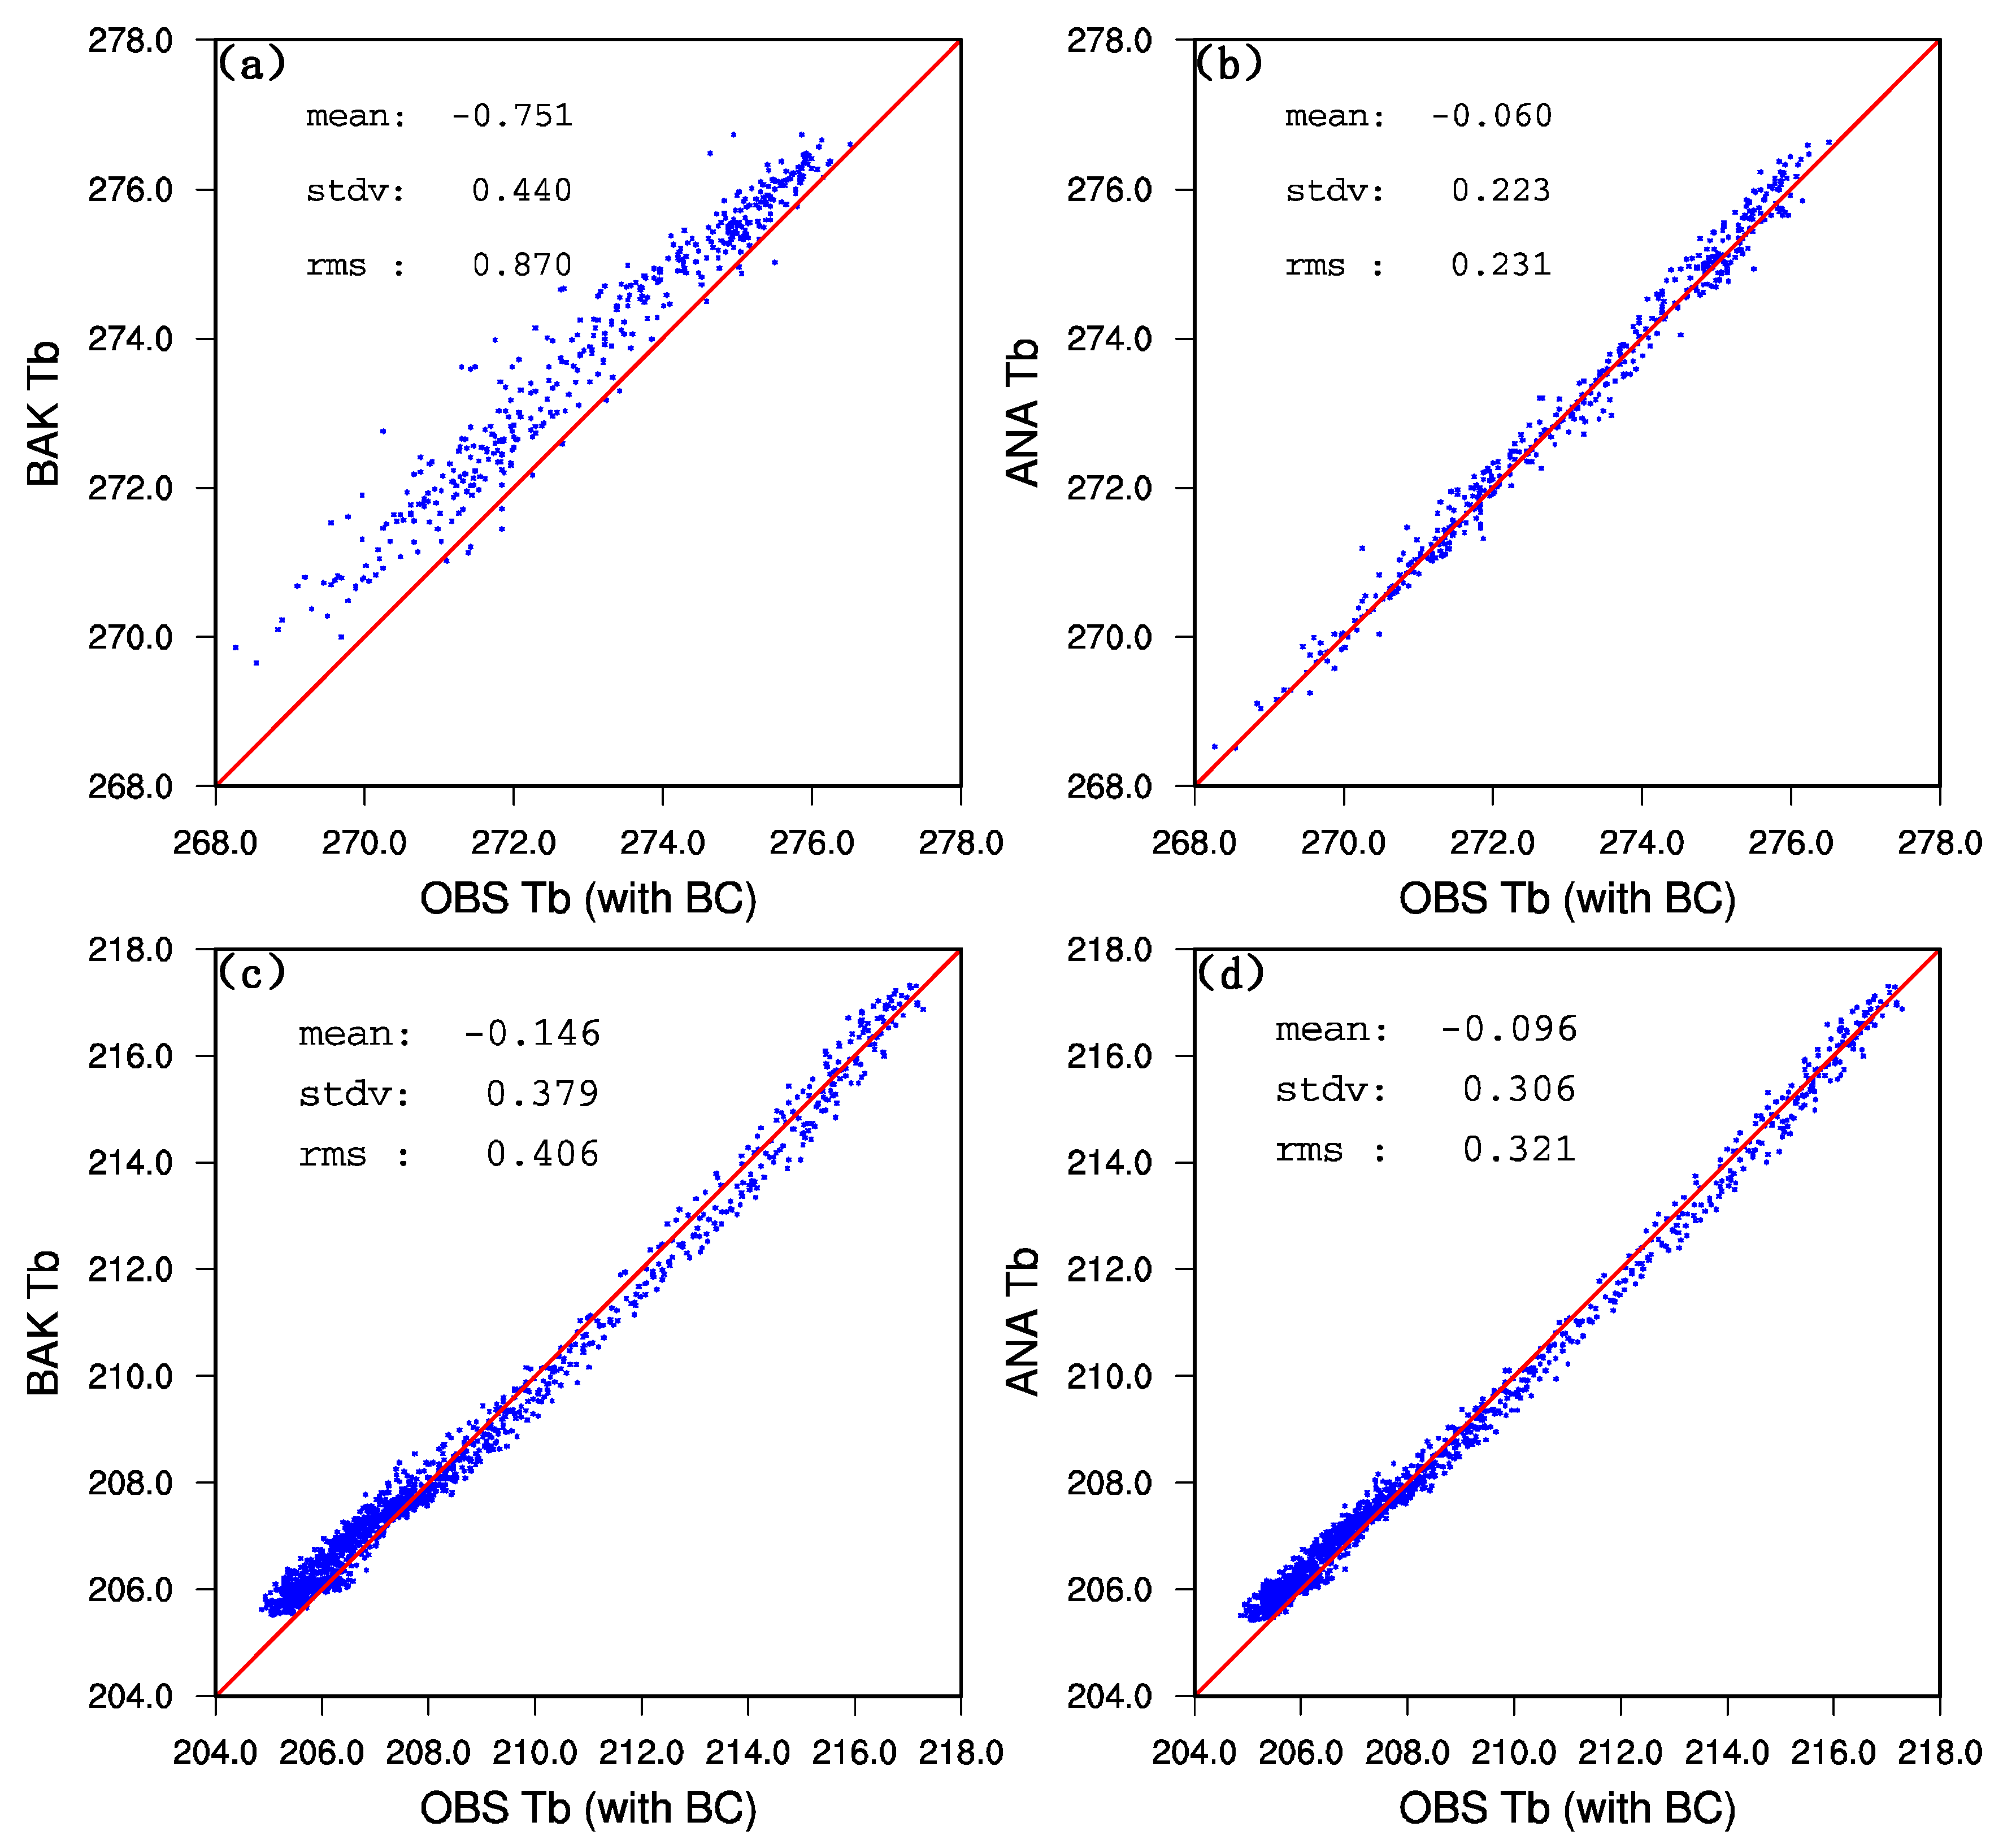
Figure 5 shows the scatter diagram of the simulation and the observation of brightness temperature of AIRS and AMSU-A with the bias correction. The abscissa and the ordinate are the observation and the simulation by the CRTM model, respectively. It can be observed in Figure 5a that most scattered points are above the diagonal, where the slope of the observation and the simulation equals to 1, indicating that the brightness temperature of most points in the background field is higher than the real brightness temperature. After the assimilation of AIRS, it can be observed in Figure 5b that the simulated background brightness temperature in the analysis field and the observed brightness temperature are almost evenly distributed on both sides of the diagonal. In addition, the RMSE (root mean square error) is reduced from 0.870 K to 0.231 K. For AMSU-A (Figure 5c,d), the simulated brightness temperature in the background field and the observed brightness temperature are nearly convergent to the diagonal. Furthermore, after the assimilation of AMSU-A, the RMSE is also reduced from 0.406 K to 0.321 K.
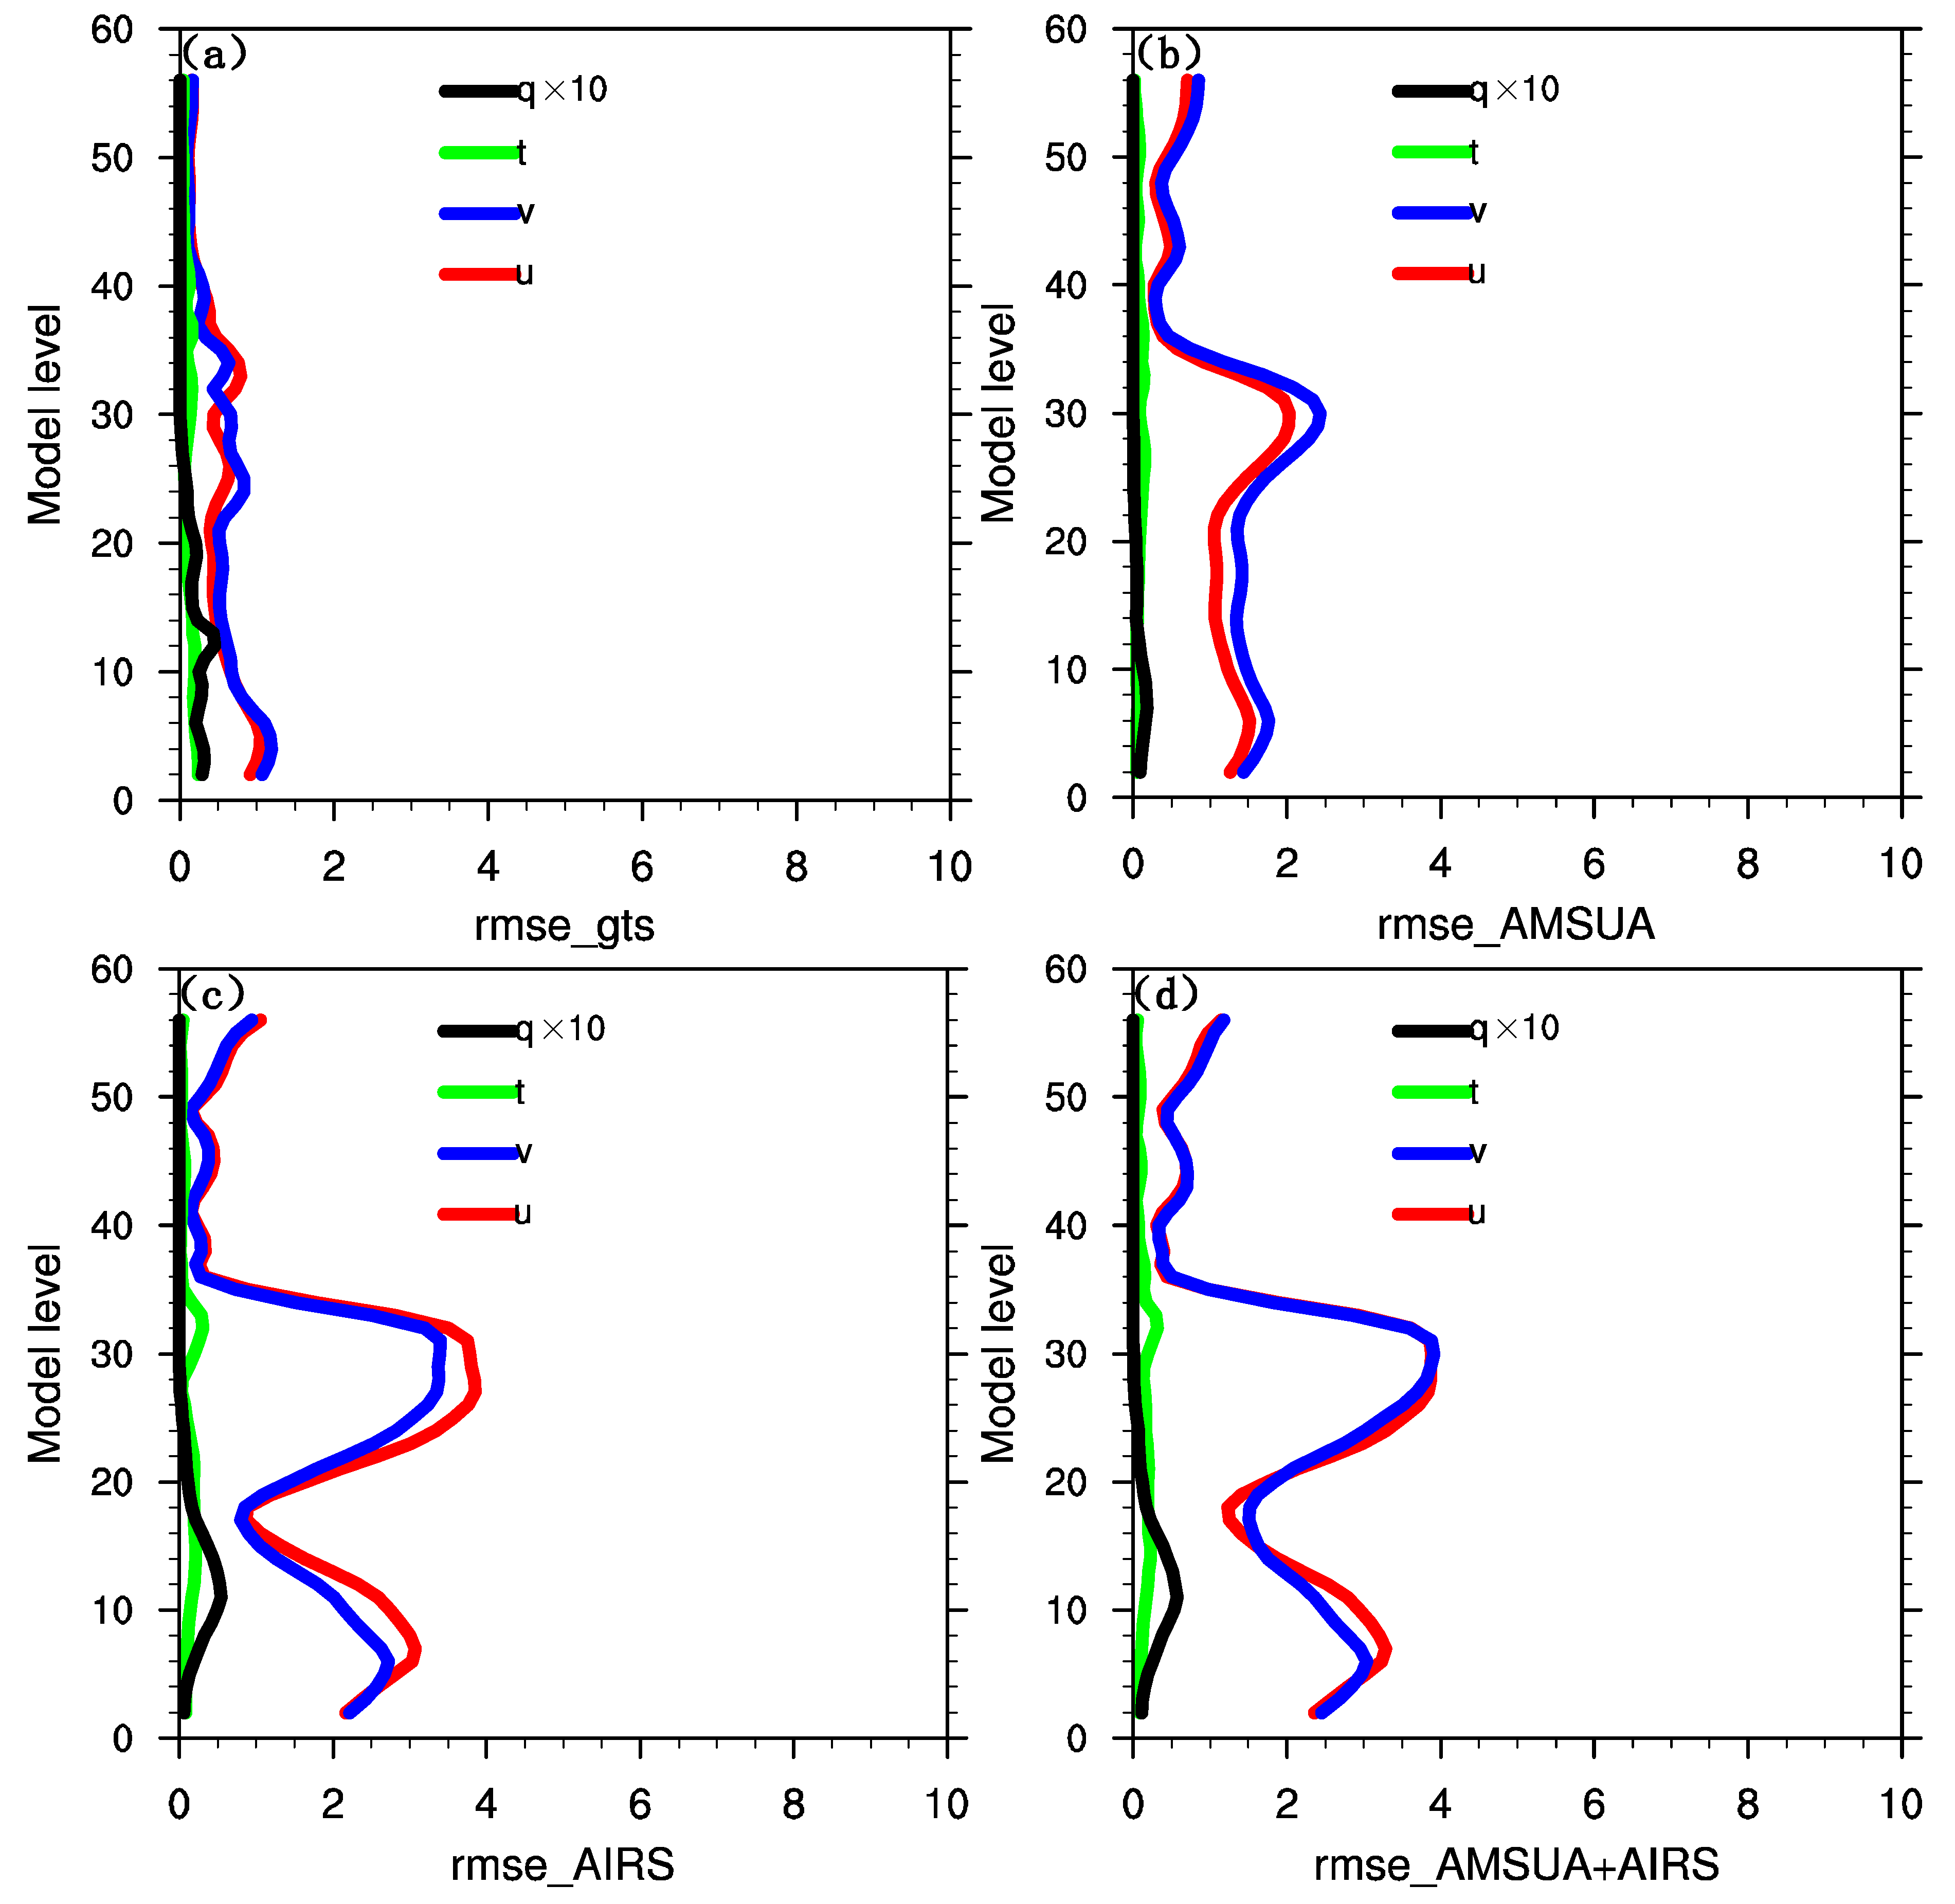
4.3. Increment RMSE
Figure 6 shows the RMSE of increments of some physical variables including specific humidity, temperature, zonal wind, and meridional wind in model levels for GTS_DA, AMSU-A_DA, AIRS_DA, and AMSU-A + AIRS_DA. The values of RMSE of physical variable increments illustrate whether these model levels are sensitive to assimilation. For GTS_DA, the RMSE magnitudes of all variables are less than 1.5, denoting the assimilation of GTS data makes relatively small adjustments to the background. For AMSU-A_DA, the values of its specific humidity and temperature are close to 0, making a slight difference to the moisture field and temperature field of the background. However, there is a peak of zonal wind and meridional wind near the middle of the model about the 30th layer. Below the peak, in lower levels, the RMSE of winds is nearly constant, about 1.5. For AIRS_DA, the specific humidity and the temperature have a peak at the lower level and middle level, respectively. Besides, its RMSE of each component of winds has double peaks. For AMSU-A + AIRS_DA, it possesses the merits of both AMSU-A_DA and AIRS_DA. In detail, it has higher peaks of wind, especially the meridional wind, and similar specific humidity and temperature as AIRS_DA, indicating that it has a better improvement on the background. The background field is able to make more adjustments with the introduction of both AMSU-A and AIRS data.
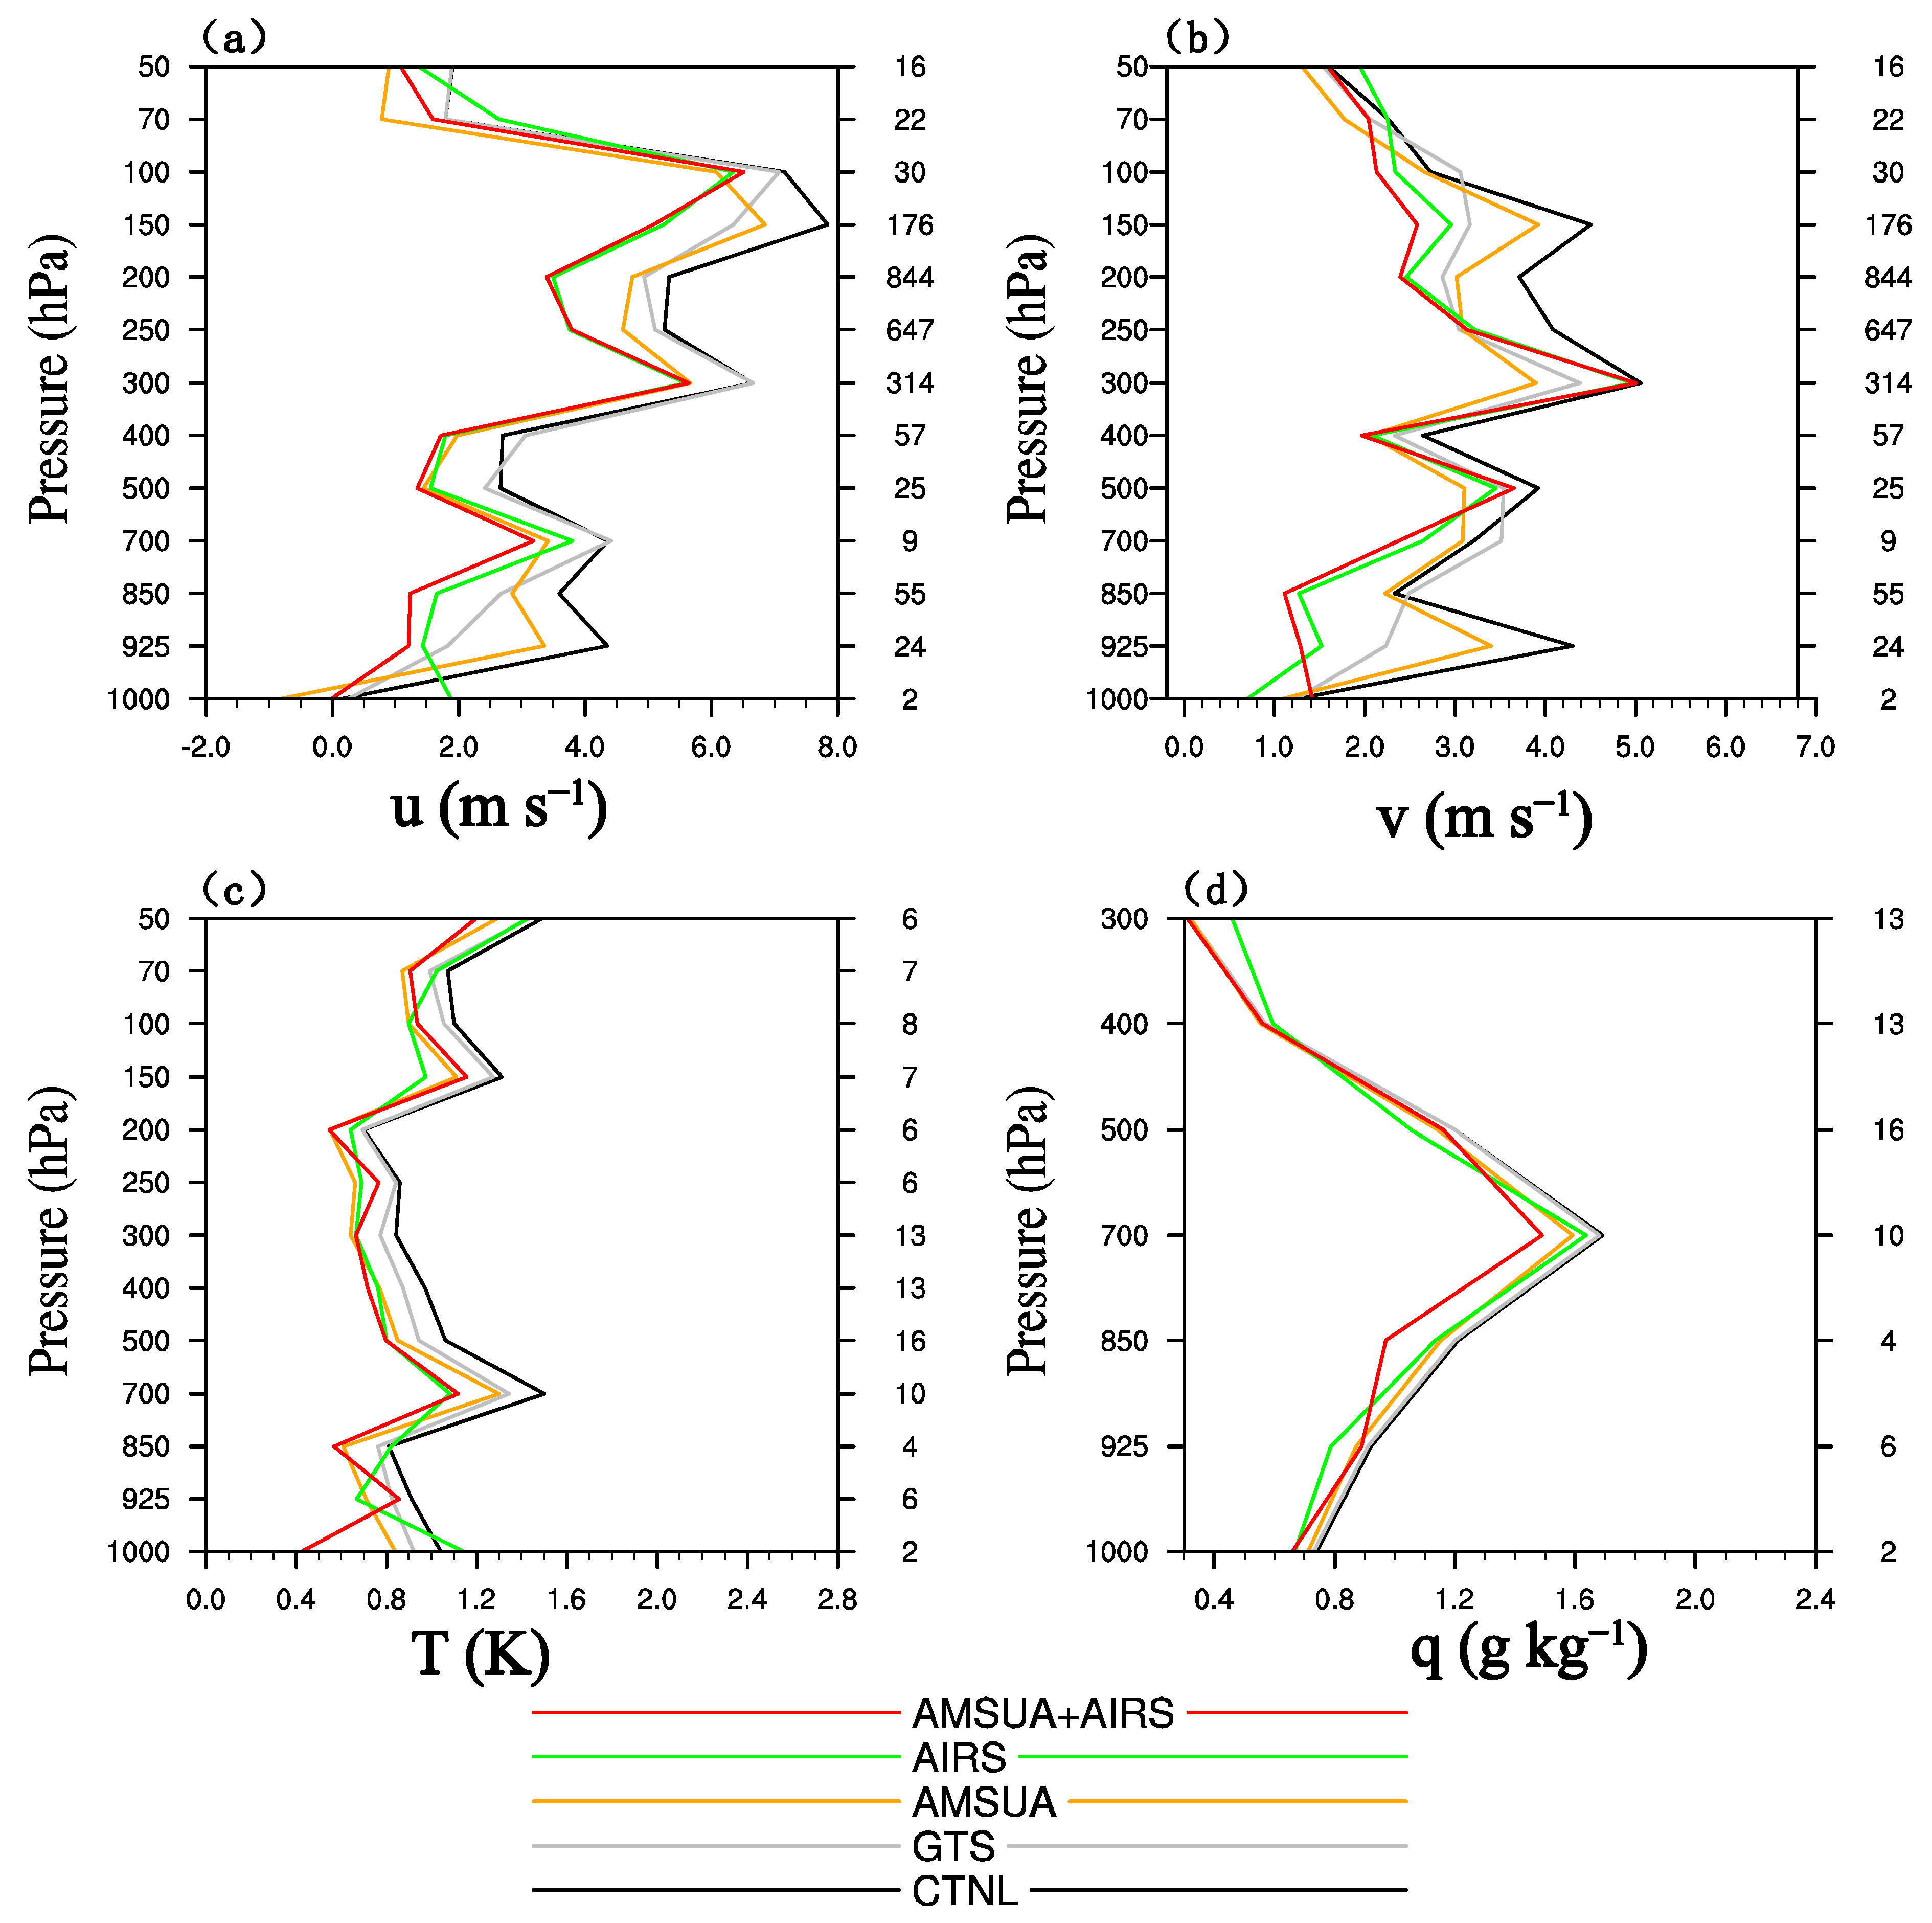
4.4. RMSE Mean Value of Physical Variables
To make an assessment on errors between the analysis field and the observation, the analysis fields after assimilation are compared with conventional data for the 24 h forecast. Figure 7a–d show vertical profiles of the RMSE of some common forecast variables, including zonal wind, meridional wind, temperature, and specific humidity, respectively. As a whole, the RMSEs of CNTL and GTS_DA are relatively larger than other experiments. The RMSE of AMSU-A + AIRS_DA is the smallest in most layers, indicating that its analysis field matches best with the observation. For zonal wind and meridional wind, the RMSE of AIRS_DA is obviously smaller than AMSU-A_DA, especially in the low and high layer. For temperature and specific humidity, however, in some layers, the RMSE of AIRS_DA is smaller than that of AMSU-A_DA, while other layers present the opposite.
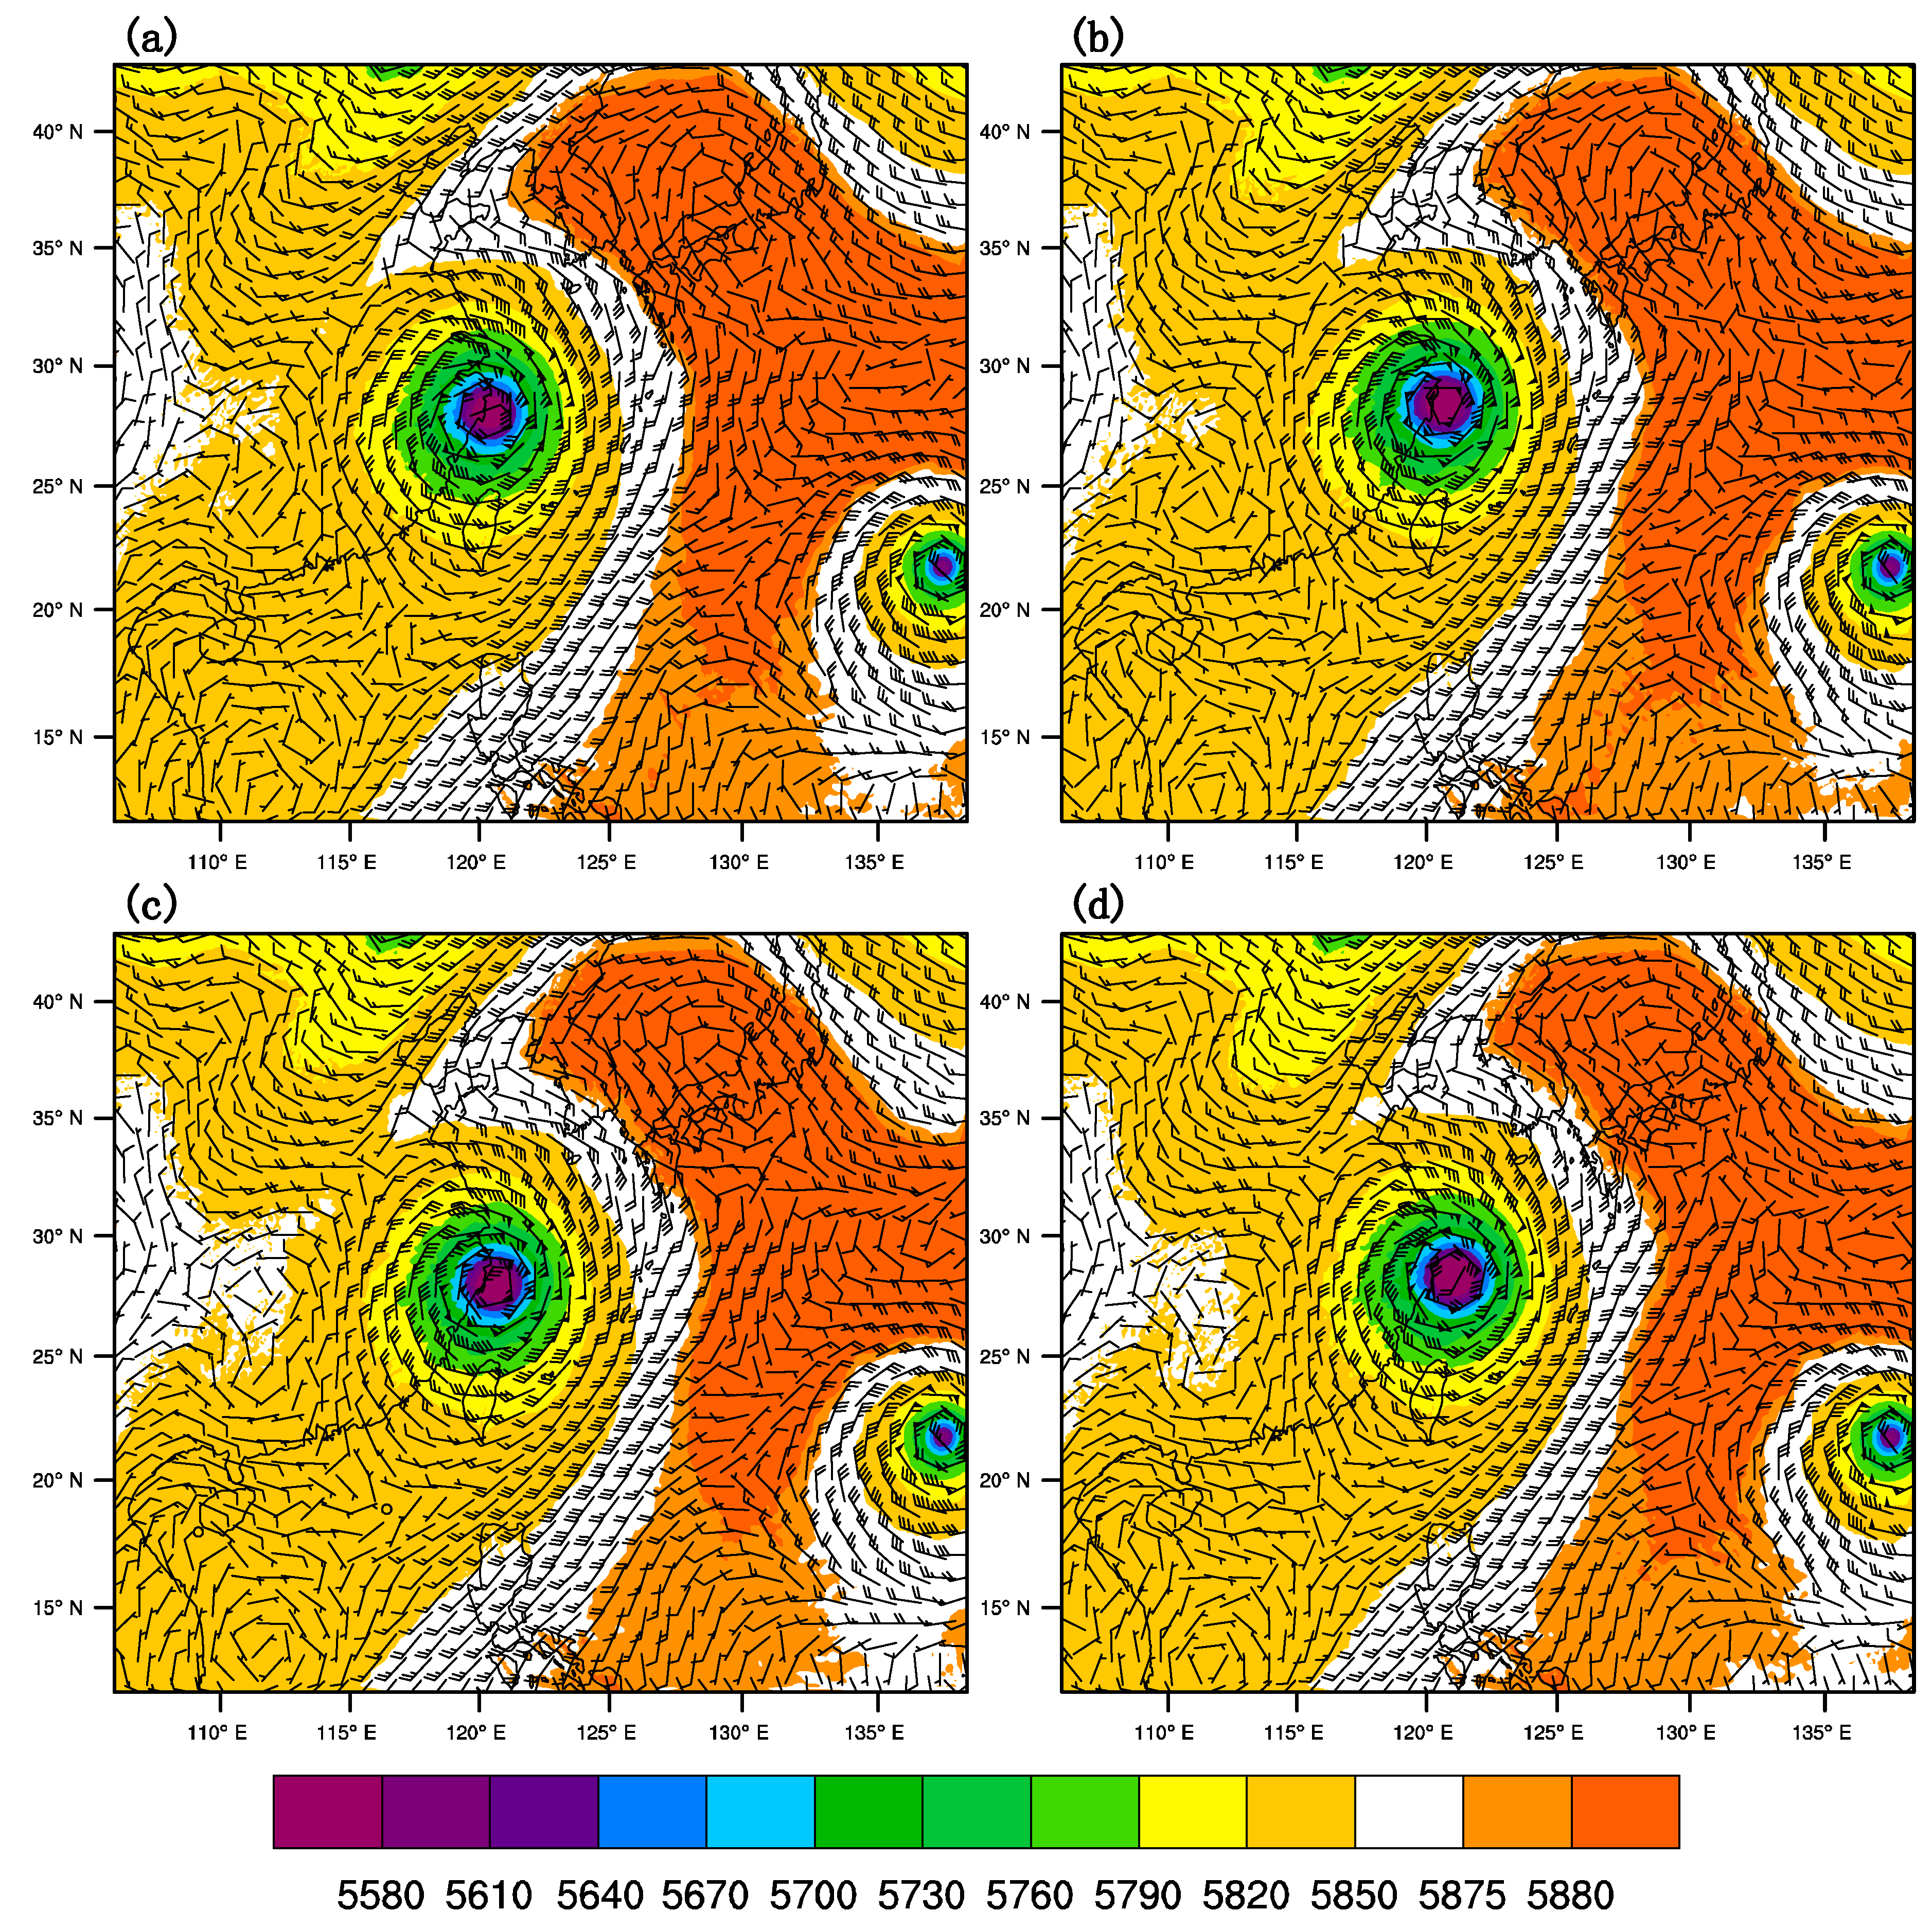
4.5. Geopotential Field and Wind Field at 500 hPa
Steering flow is a fundamental flow near 5880 gpm which is able to exert a major influence on the motion of tropical cyclones and is largely responsible for their actual track. Figure 8 shows the forecast geopotential field and wind field at 500 hPa at 0000 UTC on 11 July 2015. In the GTS_DA experiment, the flow in the orange region (near the periphery of subtropical anticyclone) is almost straightly northward, similar with that in the CNTL experiment (not shown). However, in the AMSU-A_DA, AIRS_DA, and AMSU-A + AIRS_DA experiments, a southwest flow exists in the orange region, which is conductive to the northeast twist of the typhoon. By comparison, the sphere and magnitude of the northeastward flow in the AMSU-A_DA and AIRS_DA experiments are smaller than those in the AMSU-A + AIRS_DA experiment, leading to their southwestward track biases in the forecasts.
4.6. Accumulated Precipitation
4.6.1. Rainband Distribution
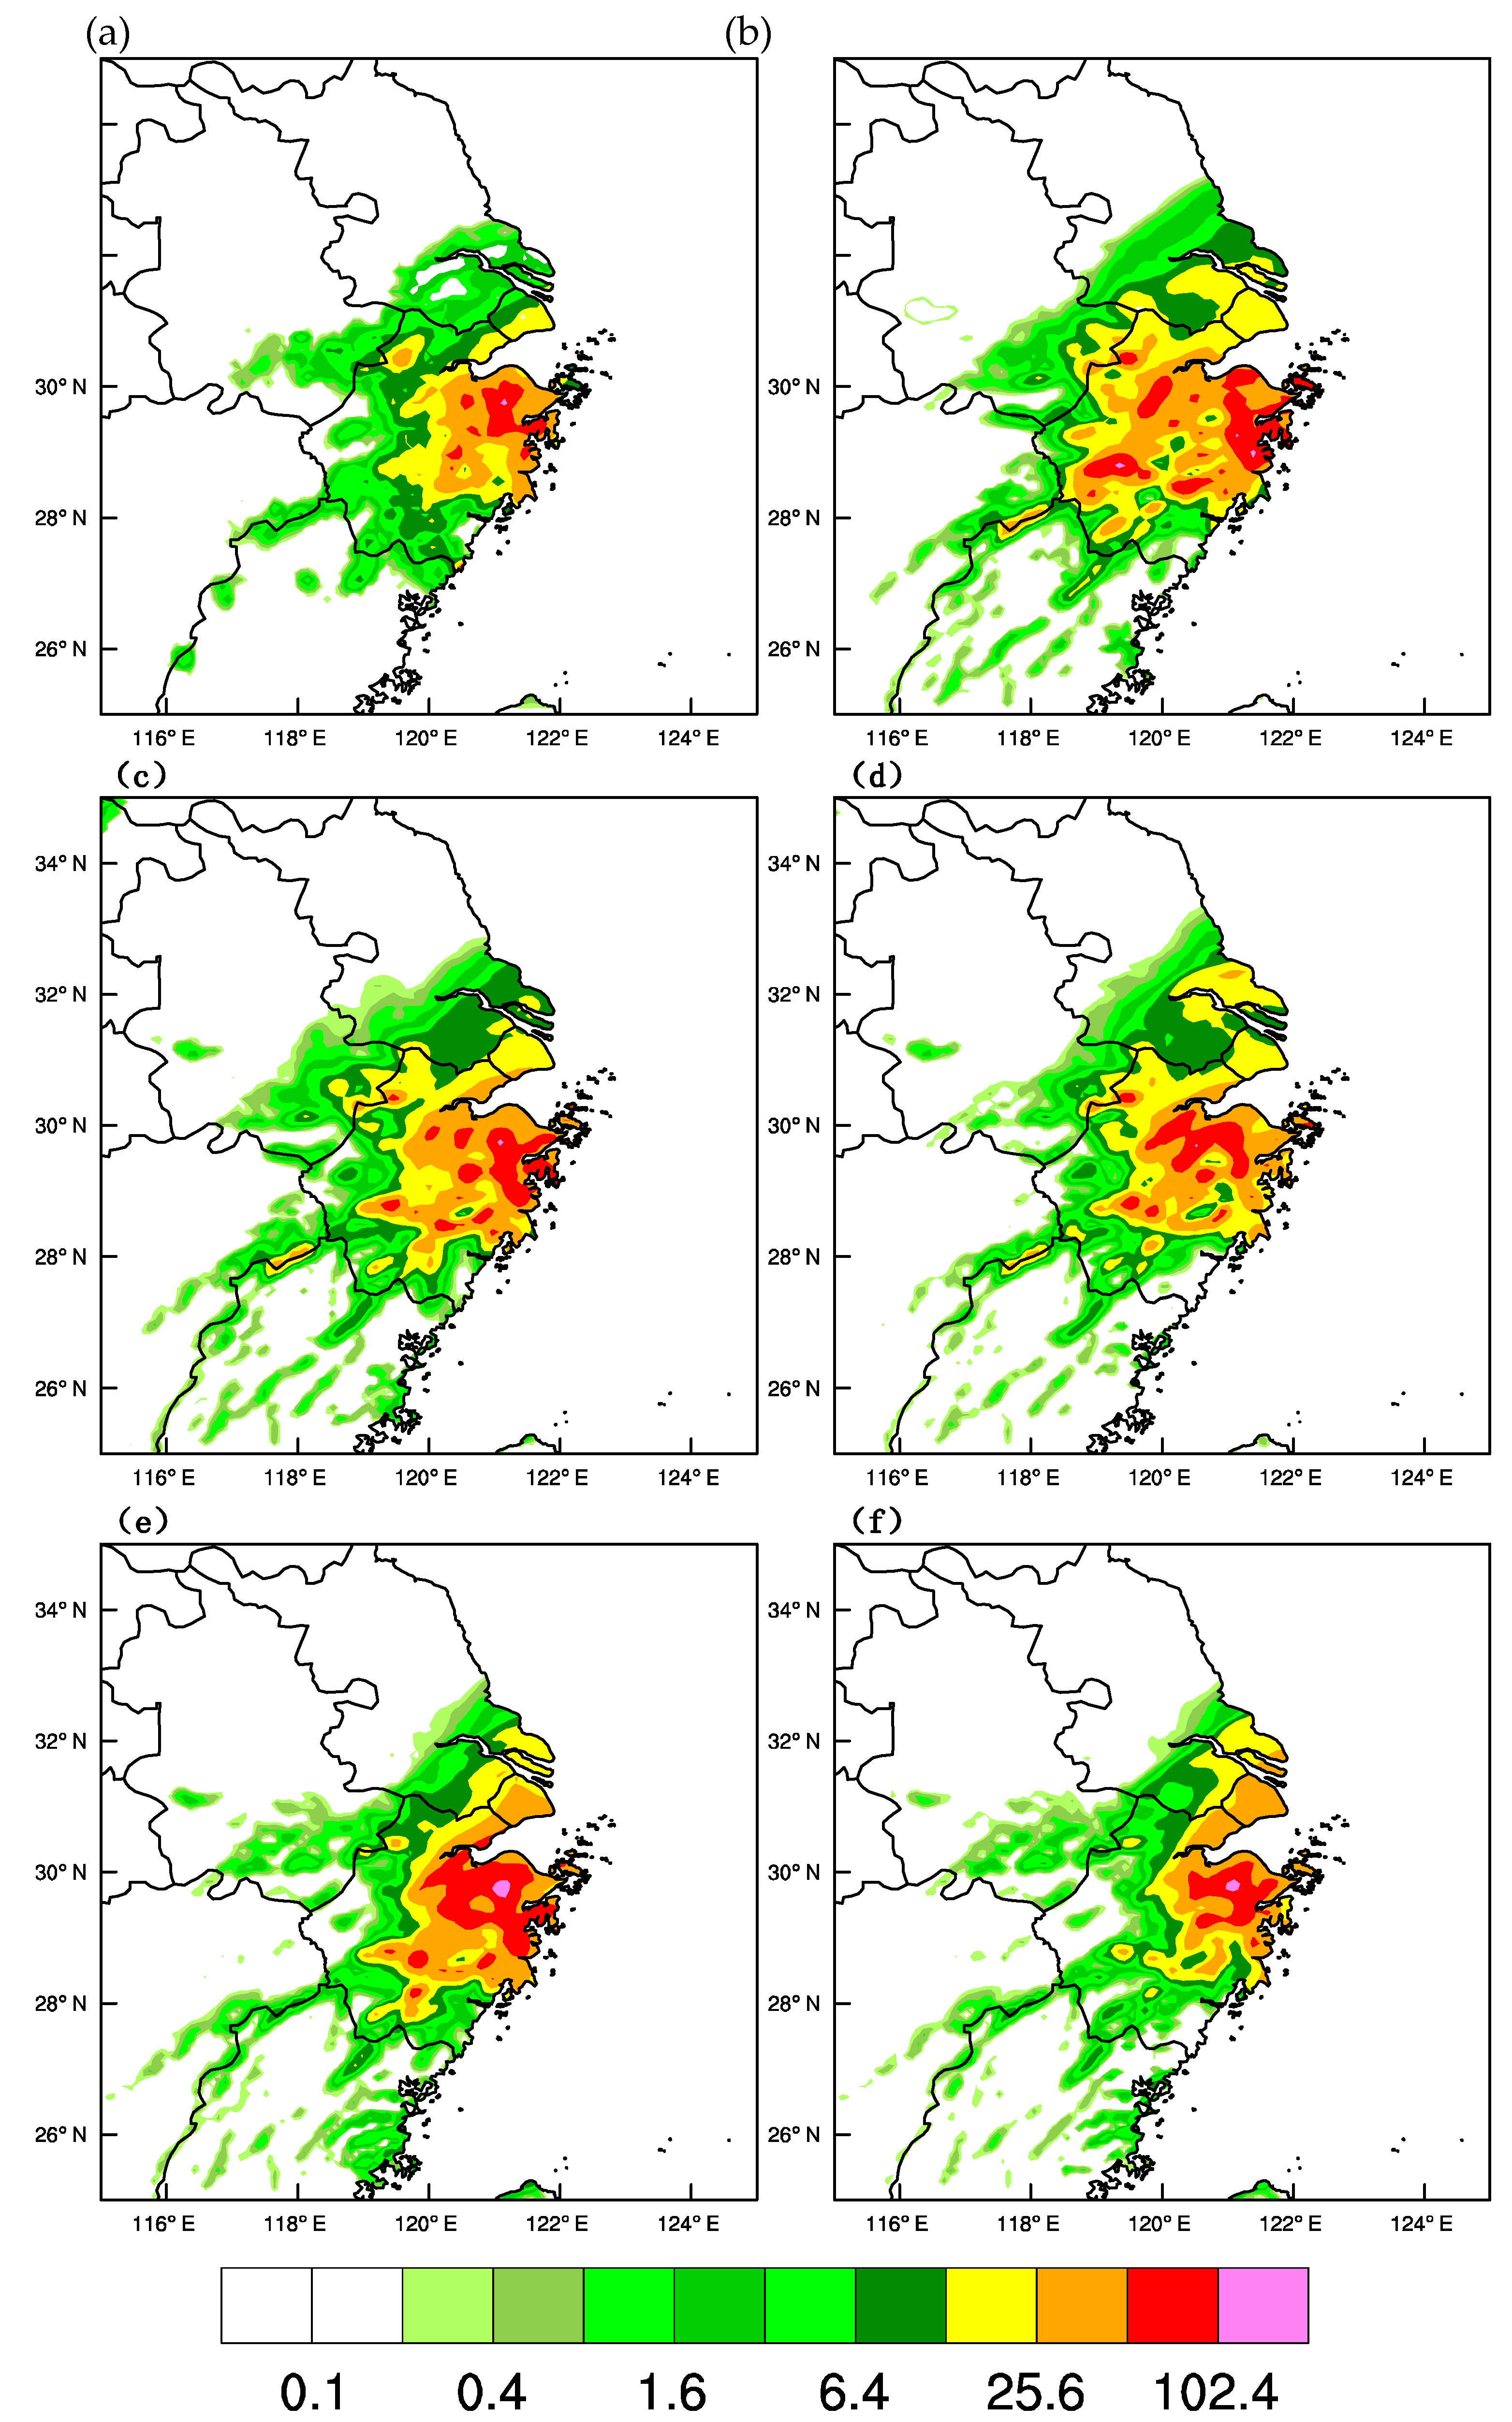
The 6 h accumulated precipitation near the landing of the typhoon when the land observations are abundant from 1500 UTC to 2100 UTC on July 10 is chosen to assess the effects of precipitation simulation of these experiments. The observation, CNTL, GTS, AMSU-A_DA, AIRS_DA and AMSU-A + AIRS_DA are shown in Figure 9, respectively. The observation is from China Meteorological Data Sharing Service System, which applies a combination of Climate Prediction Center (CPC) morphing (CMORPH) technique [42] using low orbiter satellite microwave observations and hourly precipitation from ground automatic weather stations in China. To obtain an accurate analysis, algorithms of probability density function and optimal interpolation are adopted [43,44]. From the observation, the maximum rainfall is in the northeast of Zhejiang Province. On the whole, the further inland, the less rainfall. It seems that all five experiments are able to roughly simulate the location and distribution of the rainband. The precipitation center of CNTL is scattered, and the northern part of Zhejiang Province and Shanghai are relatively overestimated. For GTS_DA, the simulated precipitation in the northern part of Zhejiang Province and Shanghai is improved. However, its precipitation center is still scattered and weaker than the observation. For AMSU-A_DA, the heavy precipitation center is somewhat to the west, deviating from the ocean. Besides, the precipitation north of Zhejiang Province and Shanghai is stronger than that of the observation. For AIRS_DA and AMSU-A + AIRS_DA, their precipitation centers are more concentrated, and the overestimated rainfall in CNTL experiment is greatly reduced. The biggest difference of the two experiments is that the area of precipitation more than 12.8 mm in AMSU-A + AIRS_DA is smaller than AIRS_DA.
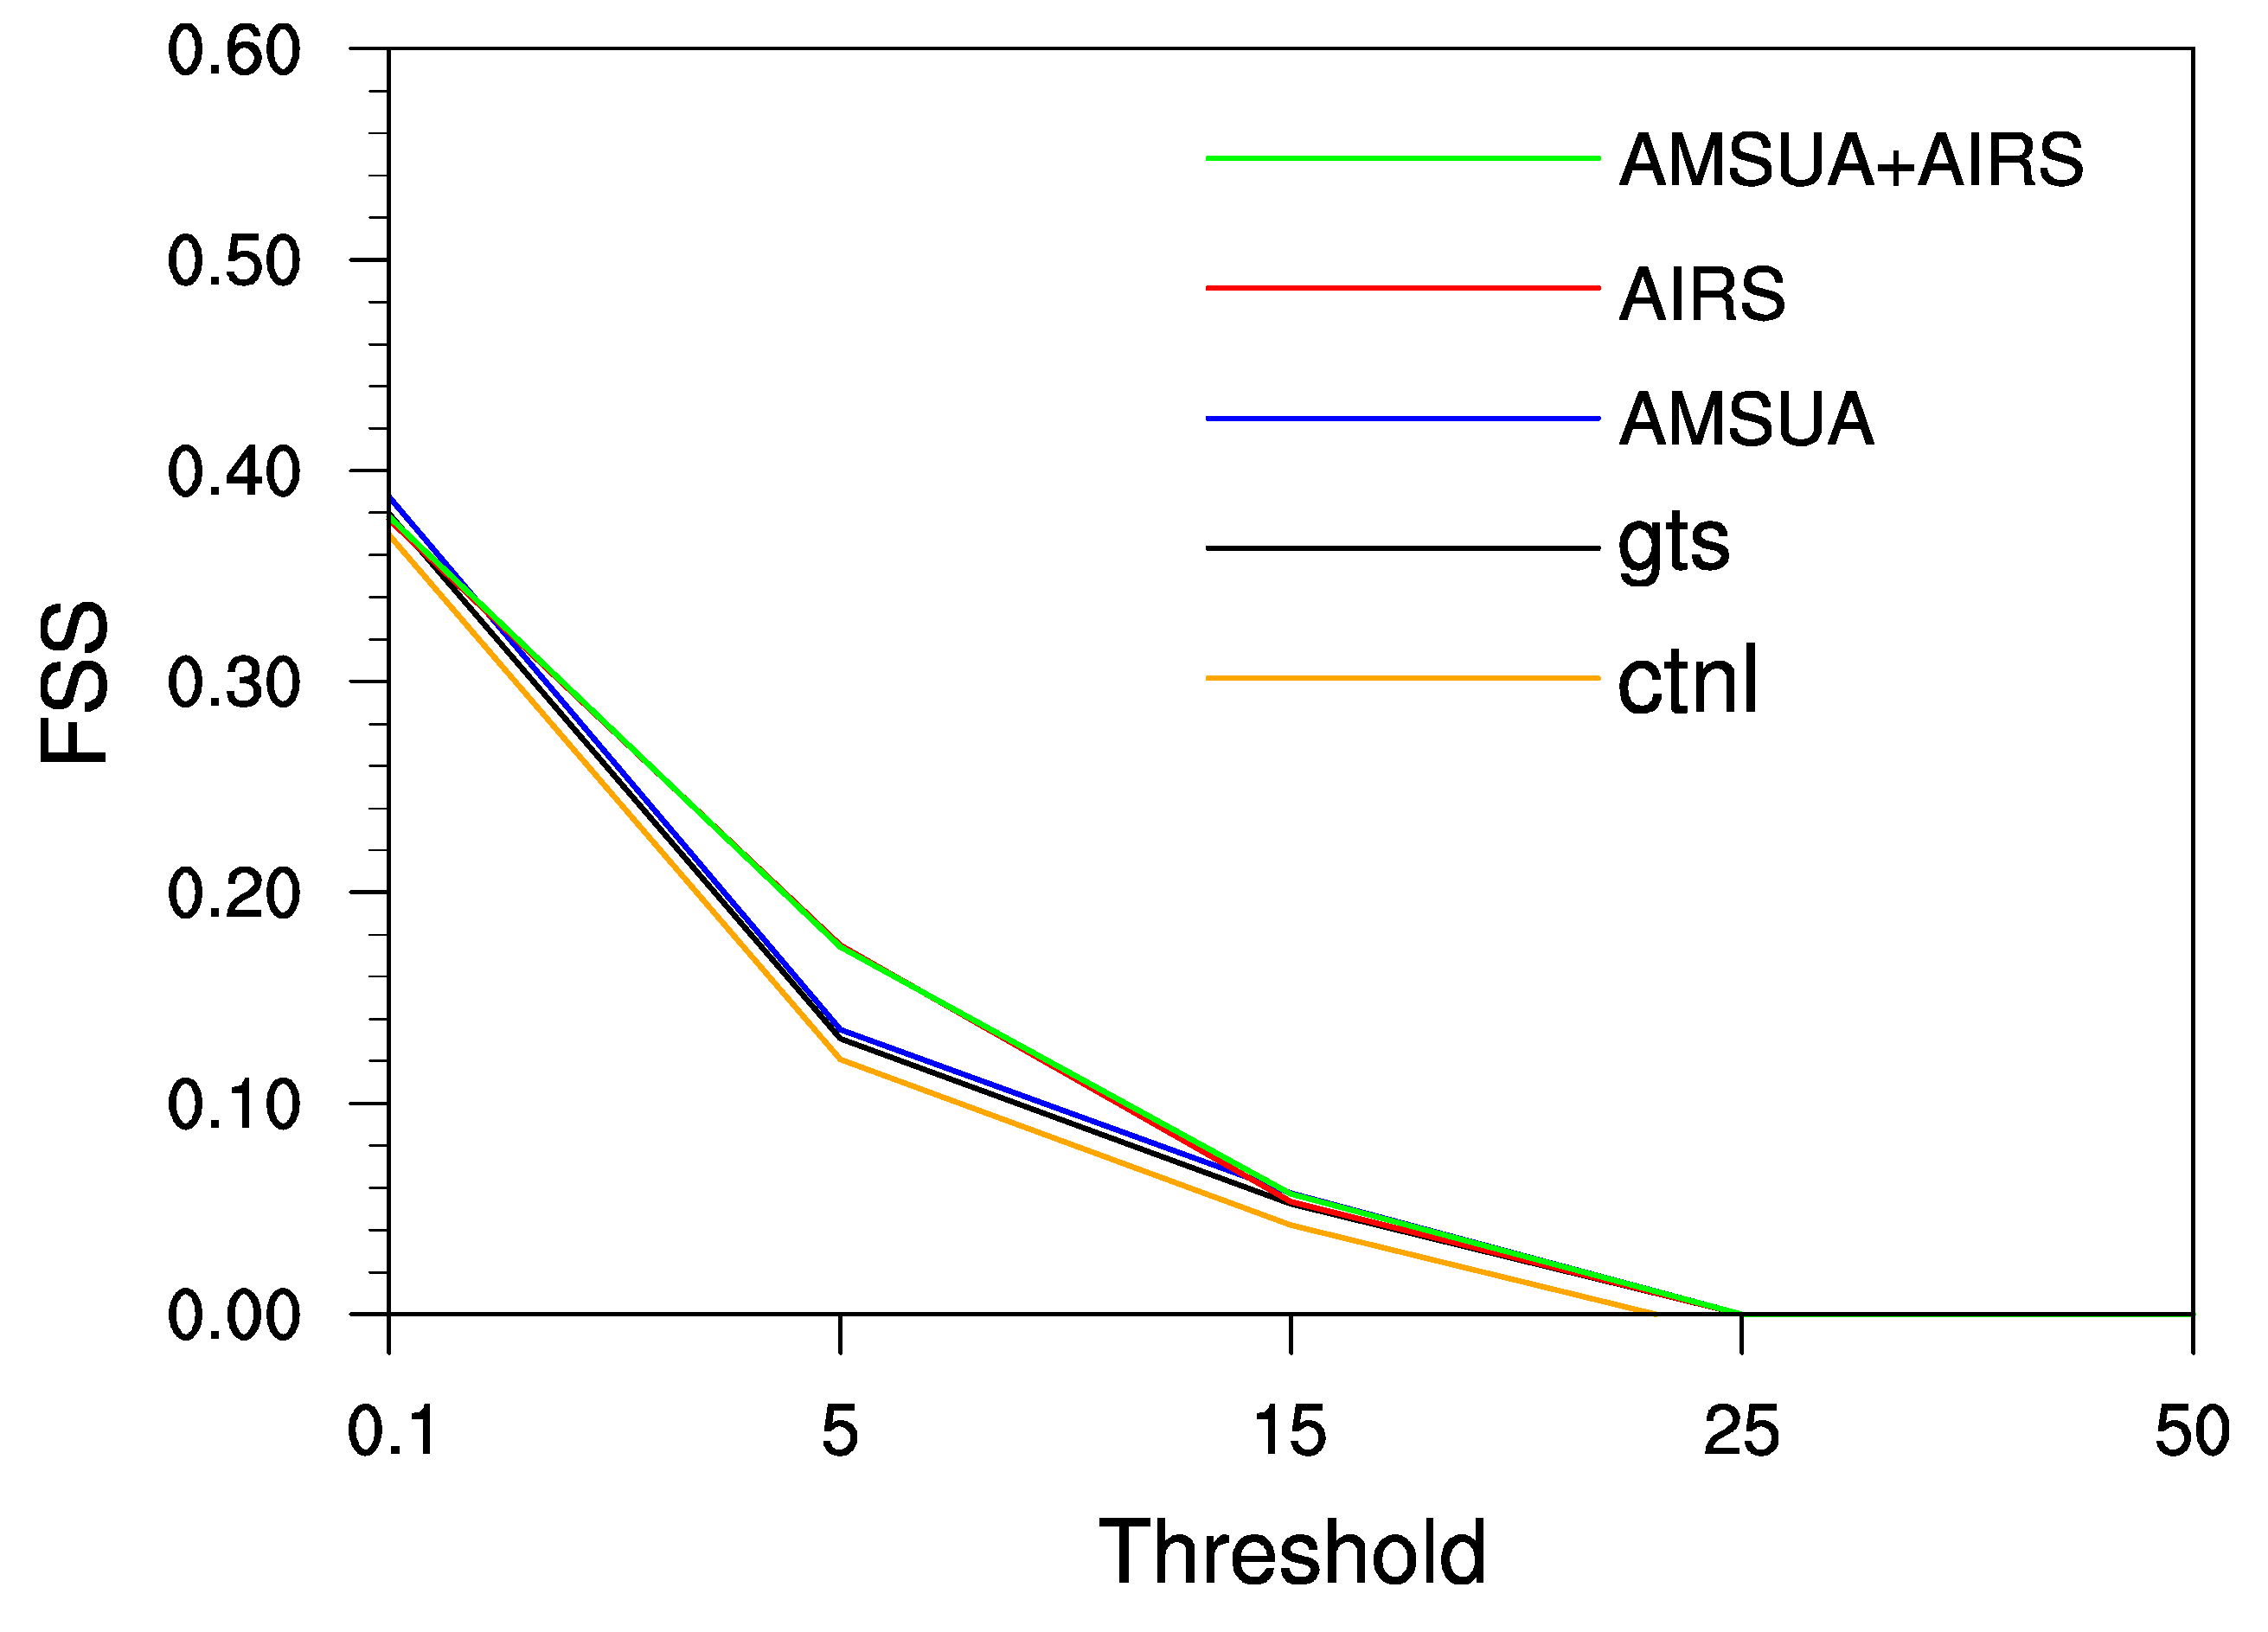
4.6.2. Fraction Skill Score (FSS) Estimation
Furtherly, the impact of multiple radiance DA on precipitation simulation is quantitatively assessed by the fraction skill score (FSS), which is defined as [45]
where and are the neighborhood probabilities of forecasted and observed rainfall area, respectively, that exceeds a given threshold value at the i-th grid box, and N is the total number of grid points in the verification domain. The value of FSS ranges from 0 to 1, with 0 representing no overlap and 1 representing perfect overlap between the forecasted and observed rainfall area, respectively [46].
The FSS (fraction skill score) scores of 6 h accumulated precipitation of five experiments are calculated and shown in Figure 10. For all thresholds, experiments with assimilation have higher scores than the CNTL experiment. In addition, experiments with radiance data assimilation perform better than GTS_DA. In general, the advantages of AMSU-A_DA and AIRS_DA are inherited by AMSU-A + AIRS_DA, especially for the threshold of 5 mm.
4.7. The Forecast of Track and Intensity
4.7.1. Track
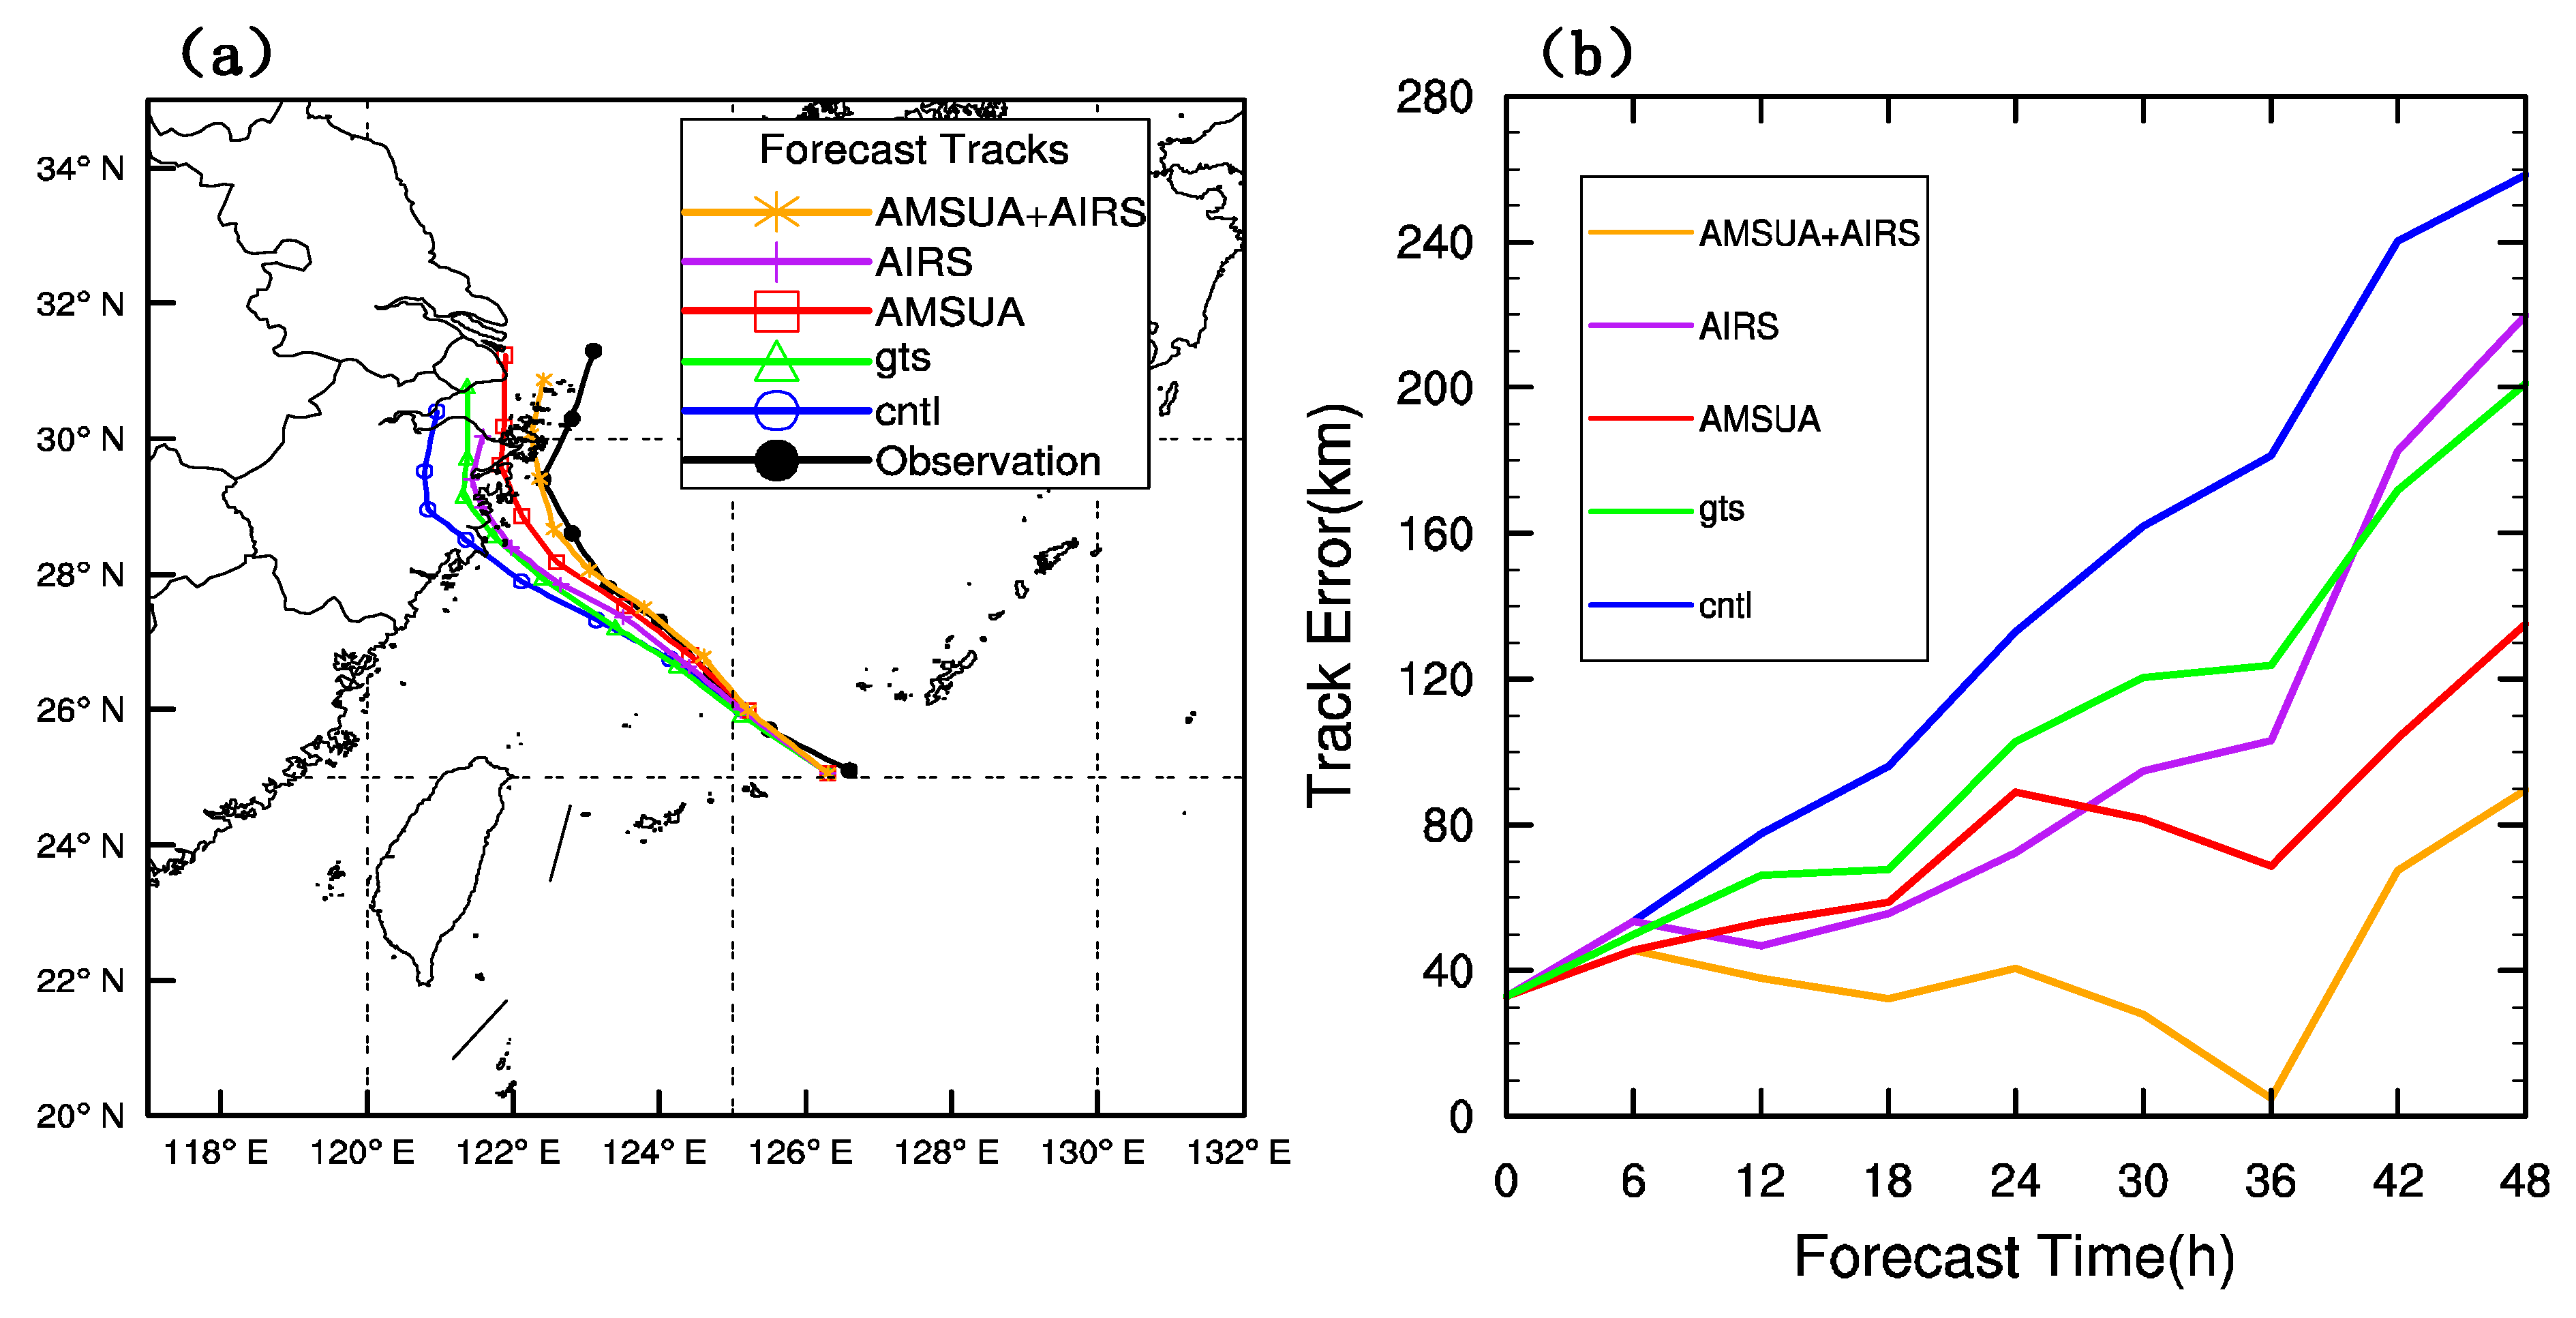
A 48 h deterministic forecast after the warm-start run is carried out to make estimation on the effects of radiance assimilations on the simulation of typhoon Chan-hom. Figure 11a shows the forecast track of typhoon Chan-hom. The characters “AMSU-A + AIRS”, “AIRS”, “AMSU-A”, “GTS”, “CTNL”, and “observation” in the figure represent the assimilation of AMSU-A and AIRS with GTS, the assimilation of AIRS with GTS, the assimilation of AMSU-A with GTS, the assimilation of GTS, the control experiment without assimilation, and the best typhoon observation data from the CMA, respectively. It can be found that all these experiments have a similar trend as the “observation”, and they all have a north twist to some extent near the terminal of the integration of the model. It can be judged preliminarily that for radiance assimilations, AMSU-A + AIRS_DA has the minimum error, followed by AMSU-A_DA, and AIRS_DA has the maximum error. In addition, the errors of all radiance assimilations are less than those of GTS_DA and CNTL. For a quantitative calculation, the errors of all these experiments over time are shown in Figure 11b. It should be pointed that for all experiments, there is an initial error of about 30 km on account of the 6 h warm start. During the whole 48 h, AMSU-A + AIRS_DA has the least errors with a maximum value about 90 km. AIRS_DA has relatively smaller errors in the first 24 h, but the error surpasses AMSU-A_DA because of the sudden error reduction of AMSU-A_DA. Furthermore, the errors of AIRS_DA undergo a sharp increase after 36 h integration and finally overwhelm GTS_DA. In conclusion, all experiments with assimilation are better than those of CNTL. In detail, AMSU-A + AIRS_DA has the best track forecast, followed by AMSU-A_DA. Besides, AIRS_DA performs better than GTS_DA in the first 36 h, and it is transcended by GTS_DA ultimately.
4.7.2. MSLP and MSW
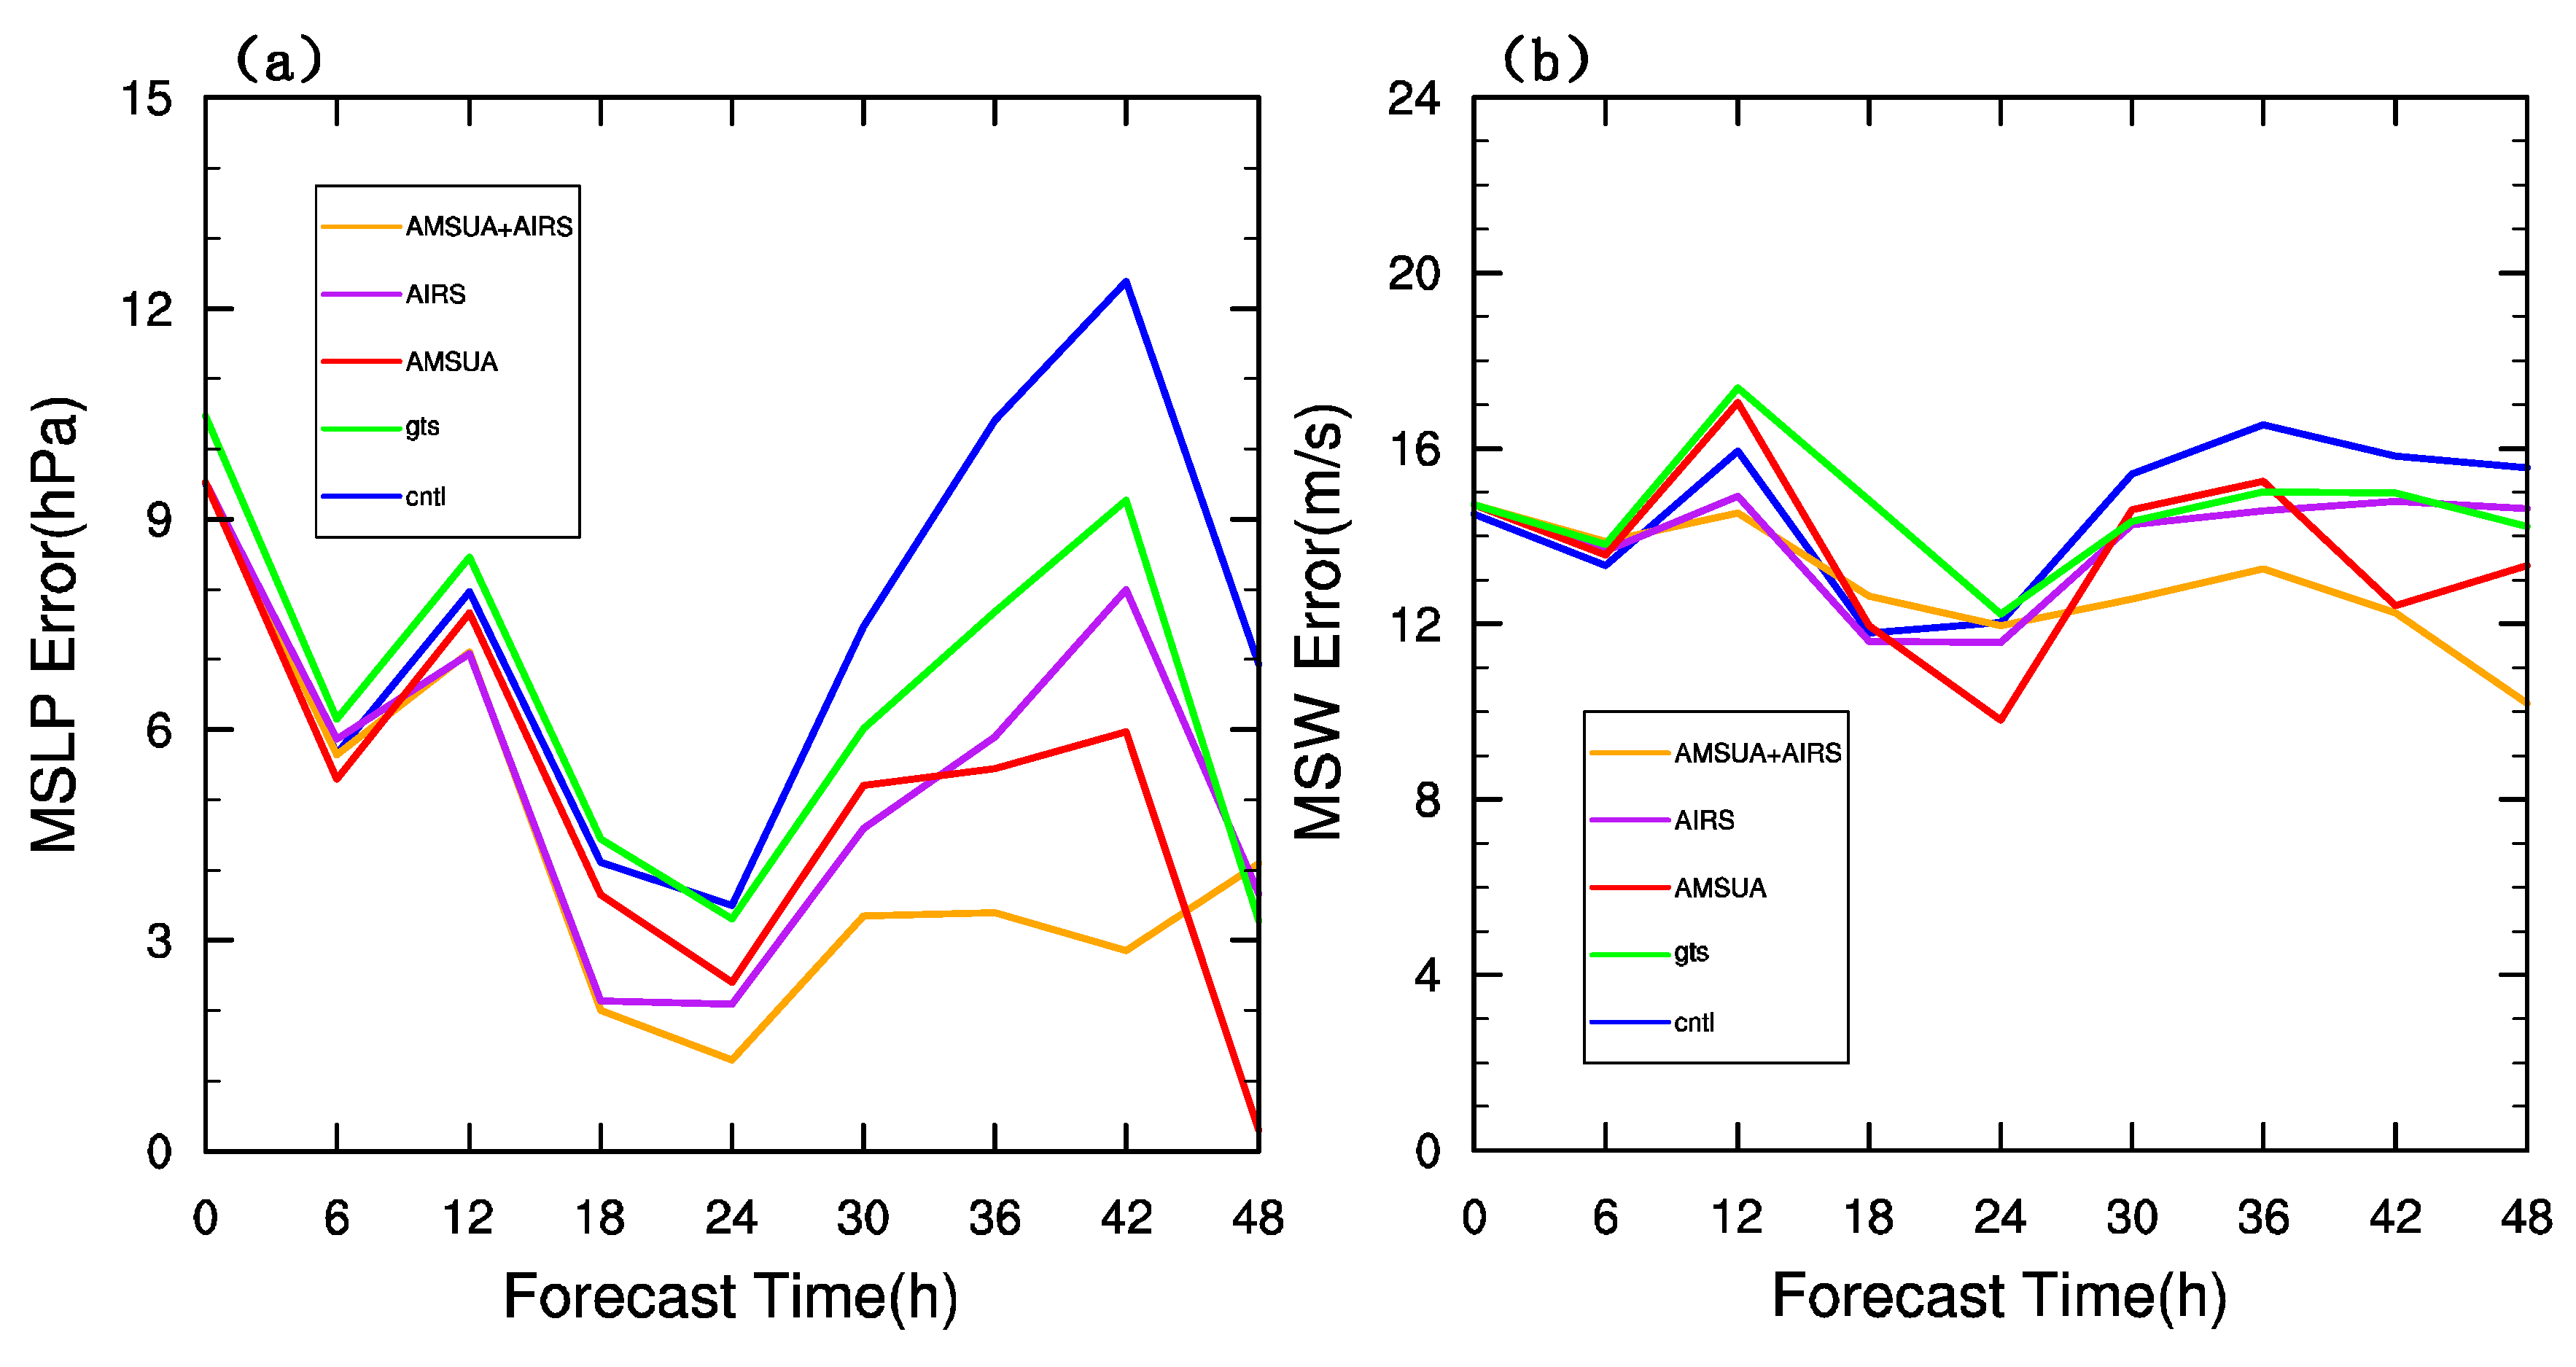
Figure 12a,b show the MSLP error and the MSW error of all experiments over time in the 48 h deterministic forecast. For the MSLP forecast, in the initial 6 h, all experiments have little difference. However, with the integration of the model, their differences appear. In general, for all radiance assimilations, AMSU-A + AIRS_DA is the closest to the observation, except for the final forecast time when the MSLP error of AMSU-A _DA is reduced rapidly. Besides, roughly in the first 30 h integration, AIRS_DA is preferable to AMSU-A_DA, but this situation reverses after 30 h. For the MSW forecast, a similar characteristic can be concluded, that is, overall, AMSU-A + AIRS_DA has the least errors. In addition, AIRS_DA performs better than AMSU-A _DA in the first 18 h, while in the following time, this condition is contrary.
5. Conclusions and Discussion
In this study, the impacts of assimilating AMSU-A and AIRS radiance data on the simulation and analysis of typhoon Chan-hom is addressed by five experiments, including pure simulation, GTS DA, single AMSU-A DA with GTS data, single AIRS DA with GTS data, and joint assimilation of both the two radiance data with GTS data. The following are the main conclusions of these experiments:
- (1)
- After the assimilation of radiance data, both the simulated radiances of AMSU-A and AIRS are closer to the radiance observation. However, the combined assimilation of AMSU-A and AIRS data has a better analysis field than single radiance assimilation because its model levels of analysis field are more sensitive to the assimilation, and the analysis field is closer to the observation with a smaller RMSE of some common physical variables.
- (2)
- In all experiments, the forecast of the geopotential field and wind field at 500 hPa of AMSU-A + AIRS_DA is more preferable because of its larger sphere and magnitude of southwest steering flow, which can explain the better final track forecast. Besides, the simulation of the 6 h accumulated rainband distribution of AMSU-A + AIRS_DA is closer to the observation, and the quantitative FSS for many thresholds is the highest.
- (3)
- In the deterministic forecast, compared with other experiments, not only is the track error of the AMSU-A + AIRS_DA experiment the smallest with a maximum error below 90 km, but the errors of MSLP and MSW are also the smallest.
The results of this study show that the joint assimilation of AMSU-A and AIRS data has great potential to improve the simulation of the typhoon. By the study on typhoon Chan-hom, positive effects of typhoon initialization and prediction can sometimes be found by multiple radiance DA. This study is a preliminary trial, and only the joint assimilation of AMSU-A and AIRS data using the 3DVar method is conducted. In the future, more typhoon cases should be tested to check the value of joint assimilation of AMSU-A and AIRS data. Besides, other multiple sources of radiance data deserve to be assimilated to improve the accuracy of typhoon forecast. Finally, other superior DA techniques such as the hybrid assimilation and EnKF (ensemble Kalman filter) can be adopted to improve the analysis and simulation of typhoons with multiple radiance data.
Author Contributions
Conceptualization, A.S. and D.X.; methodology, A.S., D.X. and F.S.; validation, A.S., D.X., F.S., J.M. and X.X.; supervision, D.X., F.S. and J.M.; project administration, J.M. and H.L. All authors have read and agreed to the published version of the manuscript.
Funding
This research was primarily supported by the Chinese National Natural Science Foundation of China (G41805016); the Chinese National Key R&D Program of China (2018YFC1506603, 2018YFC1506404); the Natural Science Foundation of Jiangsu Province (BK20170940); the Chinese National Natural Science Foundation of China (G41805070); the research project of Heavy Rain and Drought-Flood Disasters in Plateau and Basin Key Laboratory of Sichuan Province in China (SZKT201901, SZKT201904); and the research project of the Institute of Atmospheric Environment, China Meteorological Administration, Shenyang in China (2020SYIAE07, 2020SYIAE02).
Acknowledgments
The numerical calculations in this paper have been done on the supercomputing system in the Supercomputing Center of Nanjing University of Information Science & Technology.
Conflicts of Interest
The authors declare no conflict of interest.
References
- Shen, F.; Xu, D.; Min, J. Effect of momentum control variables on assimilating radar observations for the analysis and forecast for Typhoon Chanthu (2010). Atmos. Res. 2019, 230, 104622. [Google Scholar] [CrossRef]
- Chandrasekar, A. The impact of assimilation of AMSU data for the prediction of a tropical cyclone over India using a mesoscale model. Int. J. Remote Sens. 2006, 27, 4621–4653. [Google Scholar]
- Collard, A.; Hilton, F.; Forsythe, M.; Candy, B. From Observations to Forecasts—Part 8: The use of satellite observations in numerical weather prediction. Weather 2011, 66, 31–36. [Google Scholar] [CrossRef] [Green Version]
- Xie, Y.; Fan, S.; Chen, M.; Shi, J.; Zhong, J.; Zhang, X. An Assessment of Satellite Radiance Data Assimilation in RMAPS. Remote Sens. 2019, 11, 54. [Google Scholar] [CrossRef] [Green Version]
- Weng, F.Z.; Yan, B.H.; Grody, N.C. A microwave land emissivity model. J. Geophys. Res. Atmos. 2001, 106, 20115–20123. [Google Scholar] [CrossRef]
- Yang, C.; Liu, Z.; Bresch, J.; Rizvi, S.R.H.; Huang, X.; Min, J. AMSR2 all-sky radiance assimilation and its impact on the analysis and forecast of Hurricane Sandy with a limited-area data assimilation system. Tellus A 2016, 68, 30917. [Google Scholar] [CrossRef] [Green Version]
- Xu, D.; Shu, A.; Shen, F. Effects of Clear-Sky Assimilation of GPM Microwave Imager on the Analysis and Forecast of Typhoon “Chan-Hom”. Sensors 2020, 20, 2674. [Google Scholar] [CrossRef]
- Aravéquia, J.A.; Szunyogh, I.; Fertig, E.J.; Kalnay, E.; Kuhl, D.; Kostelich, E.J. Evaluation of a strategy for the assimilation of satellite radiance observations with the local ensemble transform Kalman filter. Mon. Weather Rev. 2011, 139, 1932–1951. [Google Scholar] [CrossRef] [Green Version]
- Hoppel, K.W.; Eckermann, S.D.; Coy, L.; Nedoluha, G.E.; Allen, D.R.; Swadley, S.D.; Baker, N.L. Evaluation of SSMIS upper atmosphere sounding channels for high altitude data assimilation. Mon. Weather Rev. 2013, 141, 3314–3330. [Google Scholar] [CrossRef]
- Bauer, P.; Geer, A.J.; Lopez, P.; Salmond, D. Direct 4D-Var assimilation of all-sky radiance. Part I: Implementation. Q. J. R. Meteorol. Soc. 2010, 136, 1868–1885. [Google Scholar] [CrossRef]
- Liu, Z.Q.; Schwartz, C.S.; Snyder, C.; Ha, S.Y. Impact of assimilating AMSU-A radiances on forecasts of 2008 Atlantic tropical cyclones initialized with a limited-area ensemble kalman filter. Mon. Weather Rev. 2012, 140, 4017–4034. [Google Scholar] [CrossRef] [Green Version]
- Xu, D.; Liu, Z.; Huang, X.; Min, J.; Wang, H. Impact of Assimilating IASI Radiance Observations on Forecasts of Two Tropical Cyclones. Meteorol. Atmos. Phys. 2013, 122, 1–18. [Google Scholar] [CrossRef] [Green Version]
- Zou, X.; Weng, F.; Zhang, B.; Lin, L.; Qin, Z.; Tallapragada, V. Impacts of assimilation of ATMS data in HWRF on track and intensity forecasts of 2012 four landfall hurricanes. J. Geophys. Res. Atmos. 2013, 118, 558–576. [Google Scholar] [CrossRef]
- McMillin, L.; Fleming, H. Atmospheric transmittance of an absorbing gas: A computationally fast and accurate transmittance model for absorbing gases with constant mixing ratios in inhomogeneous atmospheres. Appl. Opt. 1976, 15, 358–362. [Google Scholar] [CrossRef]
- Xu, D.; Auligné, T.; Descombes, G.; Snyder, C. A method for retrieving clouds with satellite infrared radiances using the particle filter. Geosci. Model Dev. 2016, 9, 3919–3932. [Google Scholar] [CrossRef] [Green Version]
- Xu, D.; Auligné, T.; Huang, X. A Validation of the Multivariate and Minimum Residual Method for Cloud Retrieval Using Radiance from Multiple Satellites. Adv. Atmos. Sci. 2015, 32, 349–362. [Google Scholar] [CrossRef]
- Xu, D.; Huang, X.; Liu, Z.; Min, J. Comparisons of Two Cloud Detection Schemes for Infrared Radiance Observations. Atmos. Oceanic Sci. Lett. 2014, 7, 358–363. [Google Scholar]
- Kalnay, E. Atmospheric Modeling, Data Assimilation and Predictability; Cambridge University Press: Cambridge, UK, 2003; pp. 51–72. [Google Scholar]
- Derber, J.C.; Wu, W.S. The use of TOVS cloud-cleared radiances in the NCEP SSI analysis system. Mon. Weather Rev. 1998, 126, 2287–2299. [Google Scholar] [CrossRef]
- Xu, D.; Min, J.; Shen, F.; Ban, J.; Chen, P. Assimilation of MWHS radiance data from the FY-3B satellite with the WRF Hybrid-3DVAR system for the forecasting of binary typhoons. J. Adv. Model. Earth Syst. 2016, 8, 1014–1028. [Google Scholar] [CrossRef] [Green Version]
- Yang, C.; Liu, Z.; Gao, F.; Child, P.; Min, J. Impact of Assimilating GOES-Imager Clear-sky Radiance with a Rapid Refresh Assimilation System for Convection-Permitting forecast over Mexico. J. Geophys. Res. Atmos. 2017, 122, 5472–5490. [Google Scholar] [CrossRef] [Green Version]
- Wang, Y.B.; Liu, Z.; Yang, S.; Min, J.; Chen, L.; Chen, Y.; Zhang, T. Added value of assimilating Himawari-8 AHI water vapor radiances on analyses and forecasts for “7.19” severe storm over north China. J. Geophys. Res. Atmos. 2018, 123, 3374–3394. [Google Scholar] [CrossRef]
- Shen, F.; Min, J. Assimilating AMSU-A radiance data with the WRF Hybrid En3DVAR system for track predictions of Typhoon Megi (2010). Adv. Atmos. Sci. 2015, 32, 1231–1243. [Google Scholar] [CrossRef]
- Xie, Y.; Xing, J.; Shi, J.; Dou, Y.; Lei, Y. Impacts of radiance data assimilation on the Beijing 7.21 heavy rainfall. Atmos. Res. 2016, 169, 318–330. [Google Scholar] [CrossRef]
- Xie, Y.; Shi, J.; Fan, S.; Chen, M.; Dou, Y.; Ji, D. Impact of radiance data assimilation on the prediction of heavy rainfall in RMAPS: A case study. Remote Sens. 2018, 10, 1380. [Google Scholar] [CrossRef] [Green Version]
- Newman, K.M.; Schwartz, C.S.; Liu, Z.; Shao, H.; Huang, X. Evaluating forecast impact of assimilating microwave humidity sounder (MHS) radiances with a regional ensemble kalman filter data assimilation system. Wea. Forecast. 2015, 30, 964–983. [Google Scholar] [CrossRef]
- Xu, D.; Huang, X.; Liu, Z.; Min, J. Impact of assimilating radiances with the WRFDA ETKF/3DVAR Hybrid system on the prediction of two typhoons (2012). J. Meteor. Res. 2015, 29, 28–40. [Google Scholar] [CrossRef]
- Singh, R.; Kishtawal, C.M.; Ojha, S.P.; Pal, P.K. Impact of assimilation of Atmospheric InfraRed Sounder (AIRS) radiances and retrievals in the WRF 3D-Var assimilation system. J. Geophys. Res. Atmos. 2012, 117, D11107. [Google Scholar] [CrossRef]
- Jones, T.A.; Stensrud, D.J. Assimilating AIRS temperature and mixing ratio profiles using an ensemble kalman filter approach for convective-scale forecasts. Wea. Forecast. 2012, 27, 541–564. [Google Scholar] [CrossRef]
- Li, X.; Zeng, M.J.; Wang, Y.; Wang, W.L.; Wu, H.Y.; Mei, H.X. Evaluation of Two Momentum Control Variable Schemes and Their Impact on the Variational Assimilation of Radar Wind Data: Case Study of a Squall Line. Adv. Atmos. Sci. 2016, 33, 1143–1157. [Google Scholar] [CrossRef]
- Xu, D.; Shen, F.; Min, J. Effect of background error tuning on assimilating radar radial velocity observations for the forecast of hurricane tracks and intensities. Meteorol. Appl. 2020, 27, e1820. [Google Scholar] [CrossRef] [Green Version]
- Xu, D.; Shen, F.; Min, J. Effect of adding hydrometeor mixing ratios control variables on assimilating radar observations for the analysis and forecast of a typhoon. Atmosphere 2019, 10, 415. [Google Scholar] [CrossRef] [Green Version]
- Shen, F.; Xue, M.; Min, J. A comparison of limited-area 3DVAR and ETKF-En3DVAR data assimilation using radar observations at convective scale for the prediction of Typhoon Saomai (2006). Meteorol. Appl. 2017, 24, 628–641. [Google Scholar] [CrossRef] [Green Version]
- Shen, F.; Xu, D.; Xue, M.; Min, J. A comparison between EDA-EnVar and ETKF-EnVar data assimilation techniques using radar observations at convective scales through a case study of Hurricane Ike (2008). Meteorol. Atmos. Phys. 2018, 130, 649–666. [Google Scholar] [CrossRef]
- Shen, F.; Xu, D.; Min, J.; Chu, Z.; Li, X. Assimilation of radar radial velocity data with the WRF hybrid 4DEnVar system for the prediction of hurricane Ike (2008). Atmos. Res. 2020, 234, 104771. [Google Scholar] [CrossRef]
- Sun, J.Z.; Wang, H.L.; Tong, W.X.; Zhang, Y.; Lin, C.Y.; Xu, D. Comparison of the Impacts of momentum control variables on high-resolution variational data assimilation and precipitation forecasting. Mon. Weather Rev. 2016, 14, 149–169. [Google Scholar] [CrossRef]
- Ying, M.; Zhang, W.; Yu, H.; Lu, X.; Feng, J.; Fan, Y.; Zhu, Y.; Chen, D. An overview of the China Meteorological Administration tropical cyclone database. J. Atmos. Oceanic Technol. 2014, 31, 287–301. [Google Scholar] [CrossRef] [Green Version]
- Kain, J.S. The Kain–Fritsch Convective Parameterization: An Update. J. Appl. Meteorol. 2004, 43, 170–181. [Google Scholar] [CrossRef] [Green Version]
- Hong, S.Y.; Dudhia, J.; Chen, S.H. A Revised Approach to Ice Microphysical Processes for the Bulk Parameterization of Clouds and Precipitation. Mon. Weather Rev. 2004, 132, 103–120. [Google Scholar] [CrossRef]
- Chen, F.; Dudhia, J. Coupling an advanced land surface-hydrology model with the Penn State-NCAR MM5 modeling system. Part I: Model implementation and sensitivity. Mon. Weather Rev. 2001, 129, 569–585. [Google Scholar] [CrossRef] [Green Version]
- Hong, S.Y.; Noh, Y.; Dudhia, J. A new vertical diffusion package with an explicit treatment of entrainment processes. Mon. Weather Rev. 2006, 134, 2318–2341. [Google Scholar] [CrossRef] [Green Version]
- Joyce, R.; Janowiak, J.E.; Arkin, P.A.; Xie, P. Cmorph: A method that produces global precipitation estimates from passive microwave and infrared data at high spatial and temporal resolution. J. Hydrometeorol. 2004, 5, 487–503. [Google Scholar] [CrossRef]
- Xie, P.; Arkin, P.A. Analyses of global monthly precipitation using gauge observations, satellite estimates, and numerical model predictions. J. Clim. 1996, 9, 840–858. [Google Scholar] [CrossRef] [Green Version]
- Shen, Y.; Pan, Y.; Yu, J.J.; Zhao, P.; Zhou, Z.J. Quality assessment of hourly merged precipitation product over China. Trans. Atmos. Sci. 2013, 36, 37–46. [Google Scholar]
- Roberts, N.M.; Lean, H.W. Scale-selective verification of rainfall accumulations from high-resolution forecasts of convective events. Mon. Weather Rev. 2008, 136, 78–97. [Google Scholar] [CrossRef]
- Wang, H.; Sun, J.; Fan, S.; Huang, X. Indirect Assimilation of Radar Reflectivity with WRF 3D-Var and Its Impact on Prediction of Four Summertime Convective Events. J. Appl. Meteorol. Climatol. 2013, 52, 889–902. [Google Scholar] [CrossRef]
Figure 1.
Model domain and best track of the typhoon.

Figure 2.
Geopotential height of 850 hPa (contours, unit: dagpm), wind field (wind bars, unit: m/s), and specific humidity (filled colors, unit: g/kg) (a) at 1200 UTC on 9 July 2015 and (b) at 0000 UTC on 10 July 2015.
Figure 2.
Geopotential height of 850 hPa (contours, unit: dagpm), wind field (wind bars, unit: m/s), and specific humidity (filled colors, unit: g/kg) (a) at 1200 UTC on 9 July 2015 and (b) at 0000 UTC on 10 July 2015.

Figure 3.
Flow chart of the experiments. GFS: Global Forecast System initial and boundary conditions, CNTL: control experiment, GTS: Global Telecommunications System, AMSU-A: Advanced Microwave Sounding Unit-A, AIRS: Atmospheric Infrared Sounder.
Figure 3.
Flow chart of the experiments. GFS: Global Forecast System initial and boundary conditions, CNTL: control experiment, GTS: Global Telecommunications System, AMSU-A: Advanced Microwave Sounding Unit-A, AIRS: Atmospheric Infrared Sounder.

Figure 4.
(a) observation of the brightness temperature minus the simulated brightness temperature in the background field (OMB; unit: K), and (b) observation of the brightness temperature minus the simulated brightness temperature in the analysis field (OMA; unit: K) of channel 1382 from the Atmospheric Infrared Sounder (AIRS) and (c) OMB (unit: K), and (d) OMA (unit: K) of channel 9 from the National Oceanic and Atmospheric Administration (NOAA) 15 Advanced Microwave Sounding Unit-A (AMSU-A) after bias correction at 1800 UTC on 9 July 2015.

Figure 5.
The observed brightness temperature (unit: K) and the simulated brightness temperature (unit: K) with the background and analysis of AIRS (a) before assimilation, (b) after assimilation with bias correction and of NOAA 15 AMSU-A (c) before assimilation, and (d) after assimilation with bias correction.

Figure 6.
Vertical root mean square error (RMSE) profile for specific humidity (unit: g/kg), temperature (unit: K), zonal wind (unit: m/s), and meridional wind (unit: m/s) of (a) Global Telecommunications System data assimilation (GTS_DA), (b) AMSU-A_DA, (c) AIRS_DA, and (d) AMSU-A + AIRS_DA.
Figure 6.
Vertical root mean square error (RMSE) profile for specific humidity (unit: g/kg), temperature (unit: K), zonal wind (unit: m/s), and meridional wind (unit: m/s) of (a) Global Telecommunications System data assimilation (GTS_DA), (b) AMSU-A_DA, (c) AIRS_DA, and (d) AMSU-A + AIRS_DA.

Figure 7.
RMSE mean values including (a) U wind speed (unit: m/s), (b) V wind speed (unit: m/s), (c) temperature (unit: K), and (d) humidity field (unit: g/kg) of all experiments at the analyzed time.
Figure 7.
RMSE mean values including (a) U wind speed (unit: m/s), (b) V wind speed (unit: m/s), (c) temperature (unit: K), and (d) humidity field (unit: g/kg) of all experiments at the analyzed time.

Figure 8.
Forecast field with a geopotential height of 500 hPa (filled colors, unit: gpm) and wind (wind bars, unit: kts) of (a) GTS_DA, (b) AMSU-A_DA, (c) AIRS_DA, and (d) AMSU-A + AIRS_DA at 0000 UTC on 11 July 2015.
Figure 8.
Forecast field with a geopotential height of 500 hPa (filled colors, unit: gpm) and wind (wind bars, unit: kts) of (a) GTS_DA, (b) AMSU-A_DA, (c) AIRS_DA, and (d) AMSU-A + AIRS_DA at 0000 UTC on 11 July 2015.

Figure 9.
(a) Observation, (b) CNTL, (c) GTS_DA, (d) AMSU-A_DA, (e) AIRS_DA, (f) AMSU-A + AIRS_DA 6 h accumulated precipitation (unit: mm) from 1500 UTC to 2100 UTC on July 10.
Figure 9.
(a) Observation, (b) CNTL, (c) GTS_DA, (d) AMSU-A_DA, (e) AIRS_DA, (f) AMSU-A + AIRS_DA 6 h accumulated precipitation (unit: mm) from 1500 UTC to 2100 UTC on July 10.

Figure 10.
Fraction skill score (FSS) score of cumulative precipitation for 6 h with thresholds of 0.1, 5, 15, 25 mm.
Figure 10.
Fraction skill score (FSS) score of cumulative precipitation for 6 h with thresholds of 0.1, 5, 15, 25 mm.

Figure 11.
(a) Track forecast and (b) track error (unit: km).

Figure 12.
(a) Minimum sea level pressure (MSLP) error (unit: hPa) and (b) maximum surface wind (MSW) error (unit: m/s).
Figure 12.
(a) Minimum sea level pressure (MSLP) error (unit: hPa) and (b) maximum surface wind (MSW) error (unit: m/s).

© 2020 by the authors. Licensee MDPI, Basel, Switzerland. This article is an open access article distributed under the terms and conditions of the Creative Commons Attribution (CC BY) license (http://creativecommons.org/licenses/by/4.0/).
Share and Cite
MDPI and ACS Style
Xu, D.; Shu, A.; Shen, F.; Min, J.; Li, H.; Xia, X. Impacts of Multiple Radiance Data Assimilation on the Simulation of Typhoon Chan-Hom. Atmosphere 2020, 11, 957. https://0-doi-org.brum.beds.ac.uk/10.3390/atmos11090957
AMA Style
Xu D, Shu A, Shen F, Min J, Li H, Xia X. Impacts of Multiple Radiance Data Assimilation on the Simulation of Typhoon Chan-Hom. Atmosphere. 2020; 11(9):957. https://0-doi-org.brum.beds.ac.uk/10.3390/atmos11090957
Chicago/Turabian StyleXu, Dongmei, Aiqing Shu, Feifei Shen, Jinzhong Min, Hong Li, and Xiaoli Xia. 2020. "Impacts of Multiple Radiance Data Assimilation on the Simulation of Typhoon Chan-Hom" Atmosphere 11, no. 9: 957. https://0-doi-org.brum.beds.ac.uk/10.3390/atmos11090957
Note that from the first issue of 2016, this journal uses article numbers instead of page numbers. See further details here.