Trends and Variabilities of Thunderstorm Days over Bangladesh on the ENSO and IOD Timescales


 ,
,  , , and
Abstract
:1. Introduction
2. Data and Methods
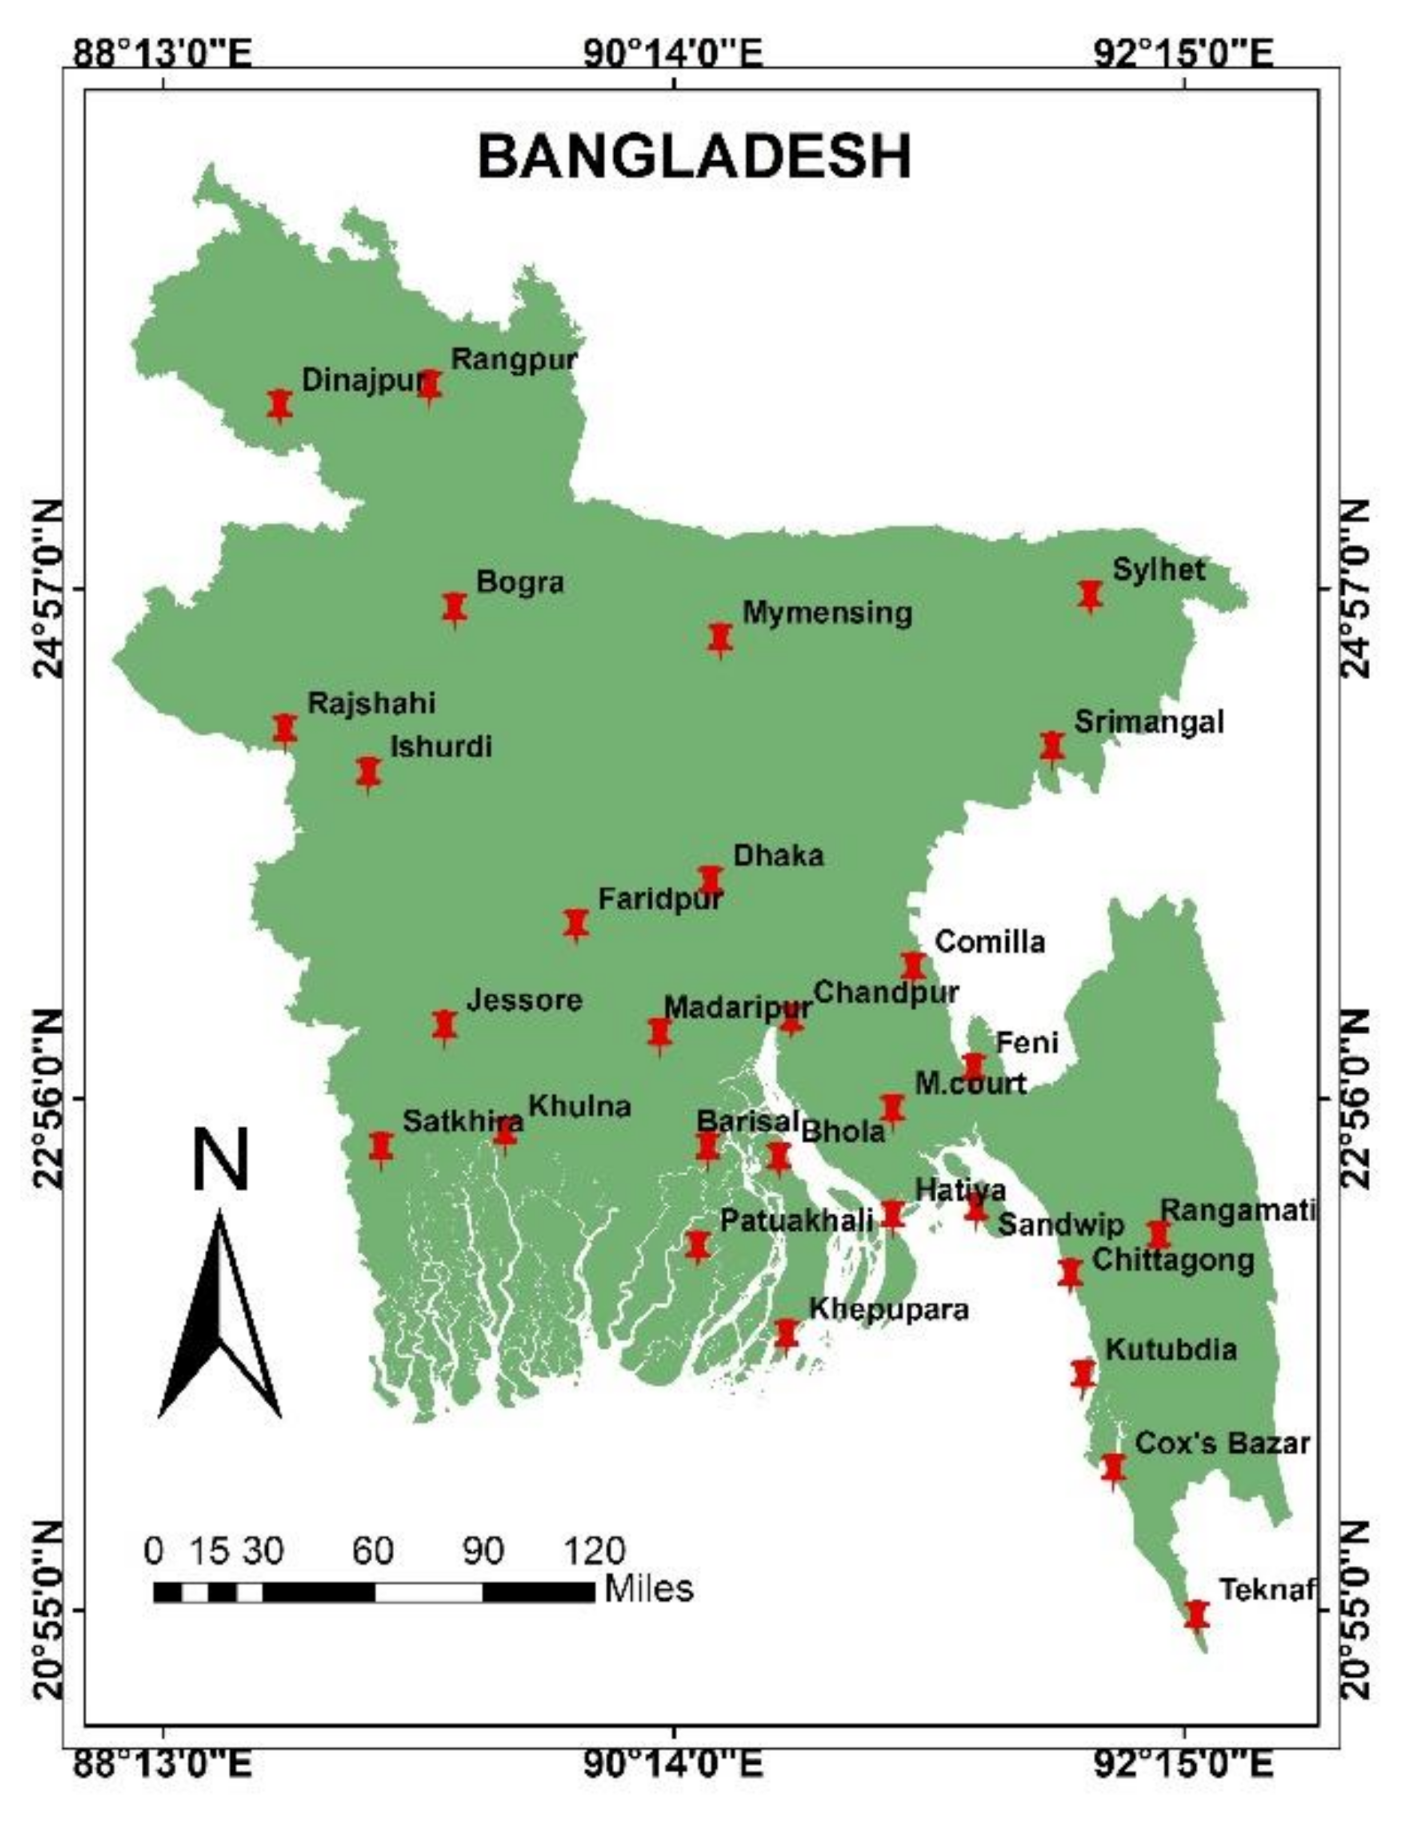
2.1. Study Area
2.2. Data Source and Quality Control
2.3. Methods
2.3.1. Mann–Kendall (MK) Trend Test
2.3.2. Weibull Probability Distribution Model
2.3.3. Spearman’s Rho Test
3. Results
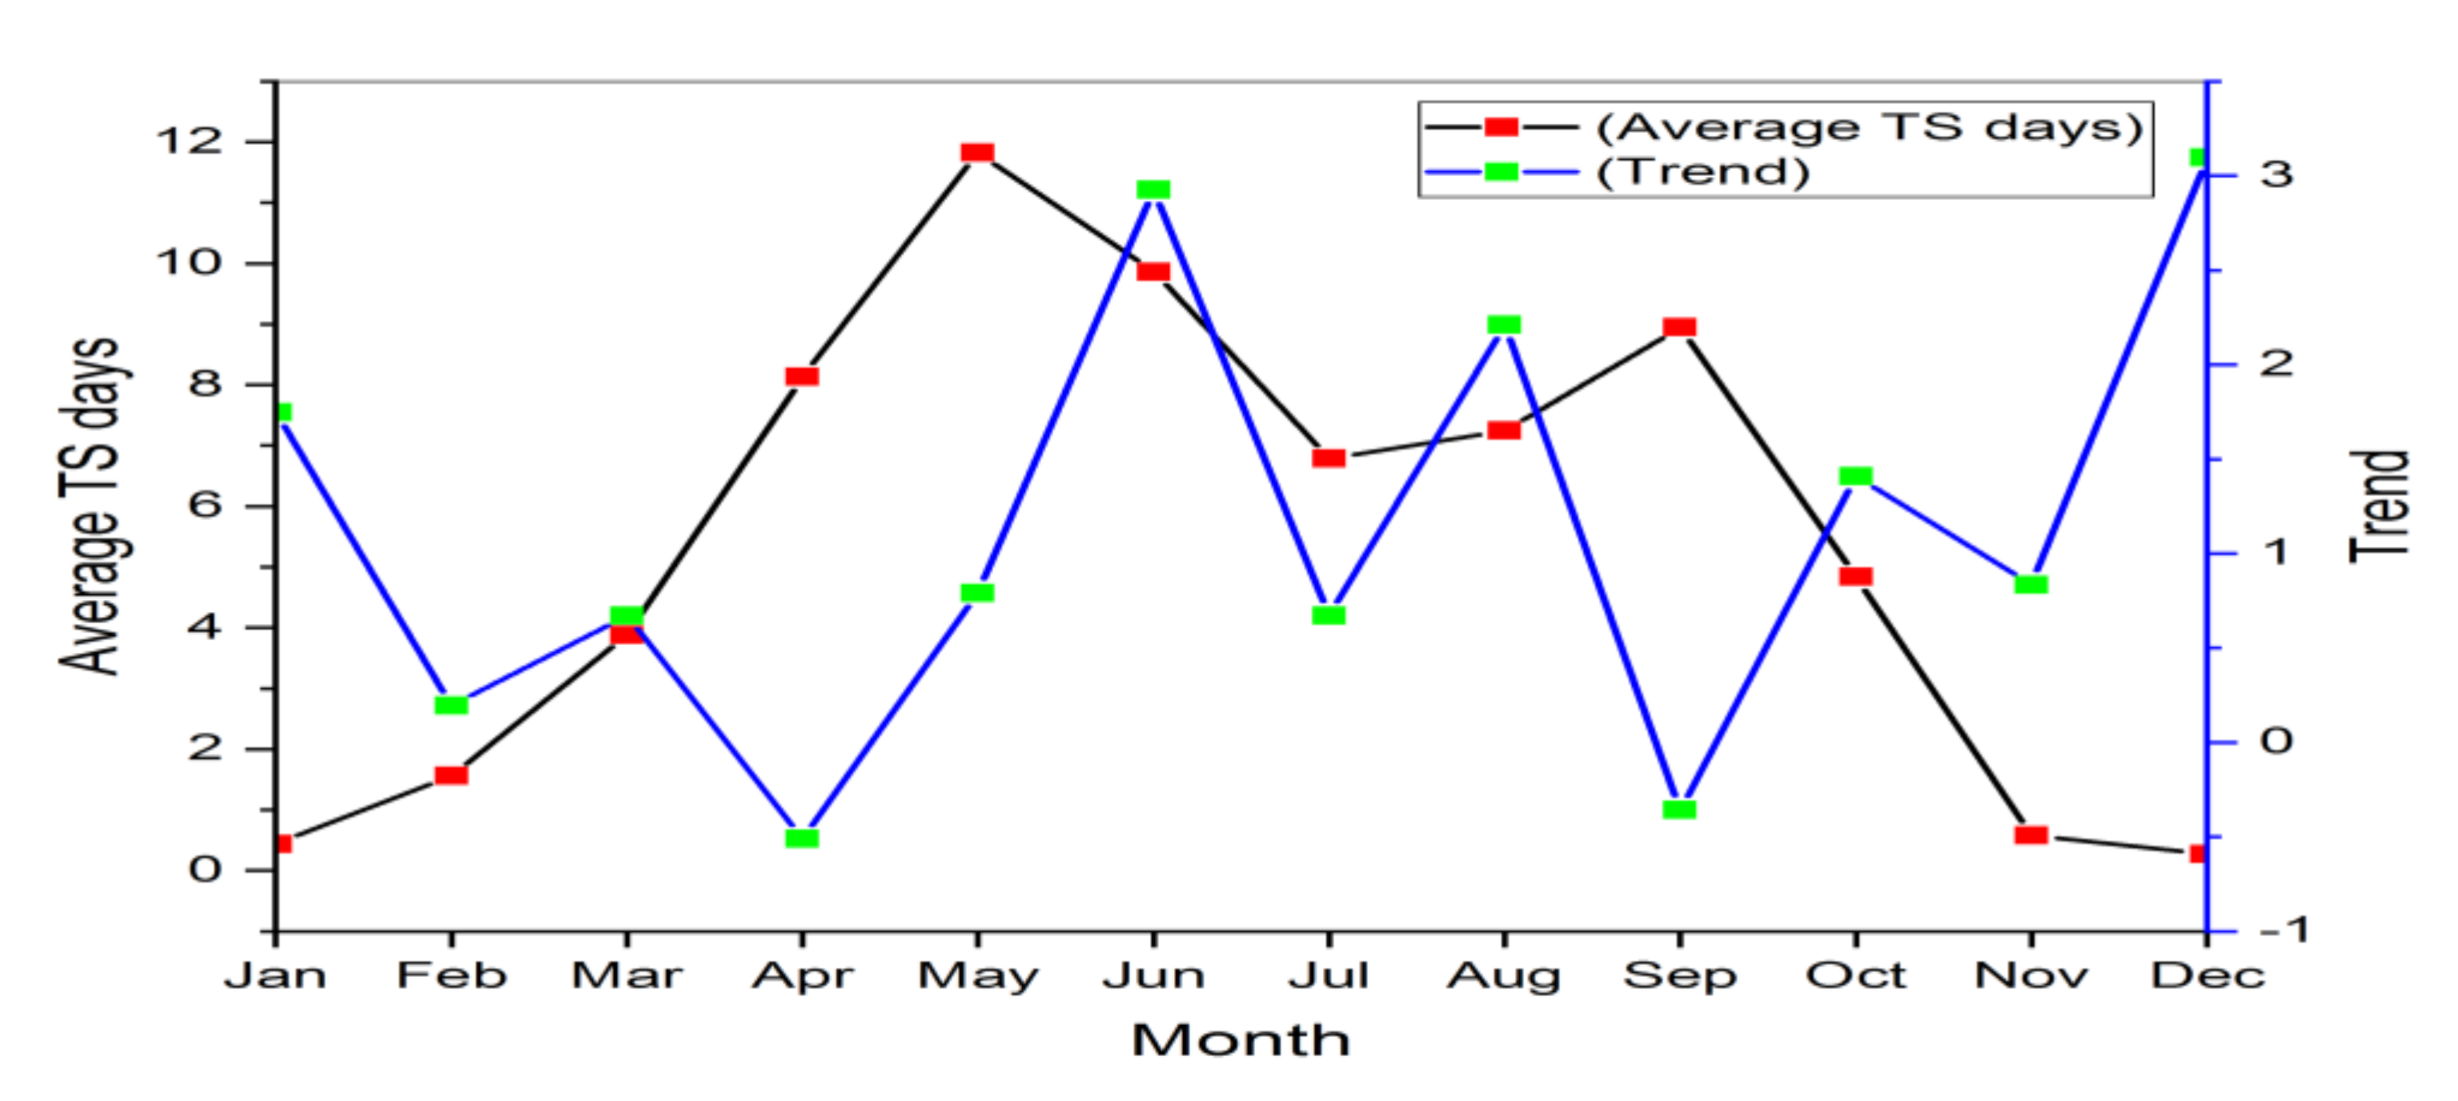
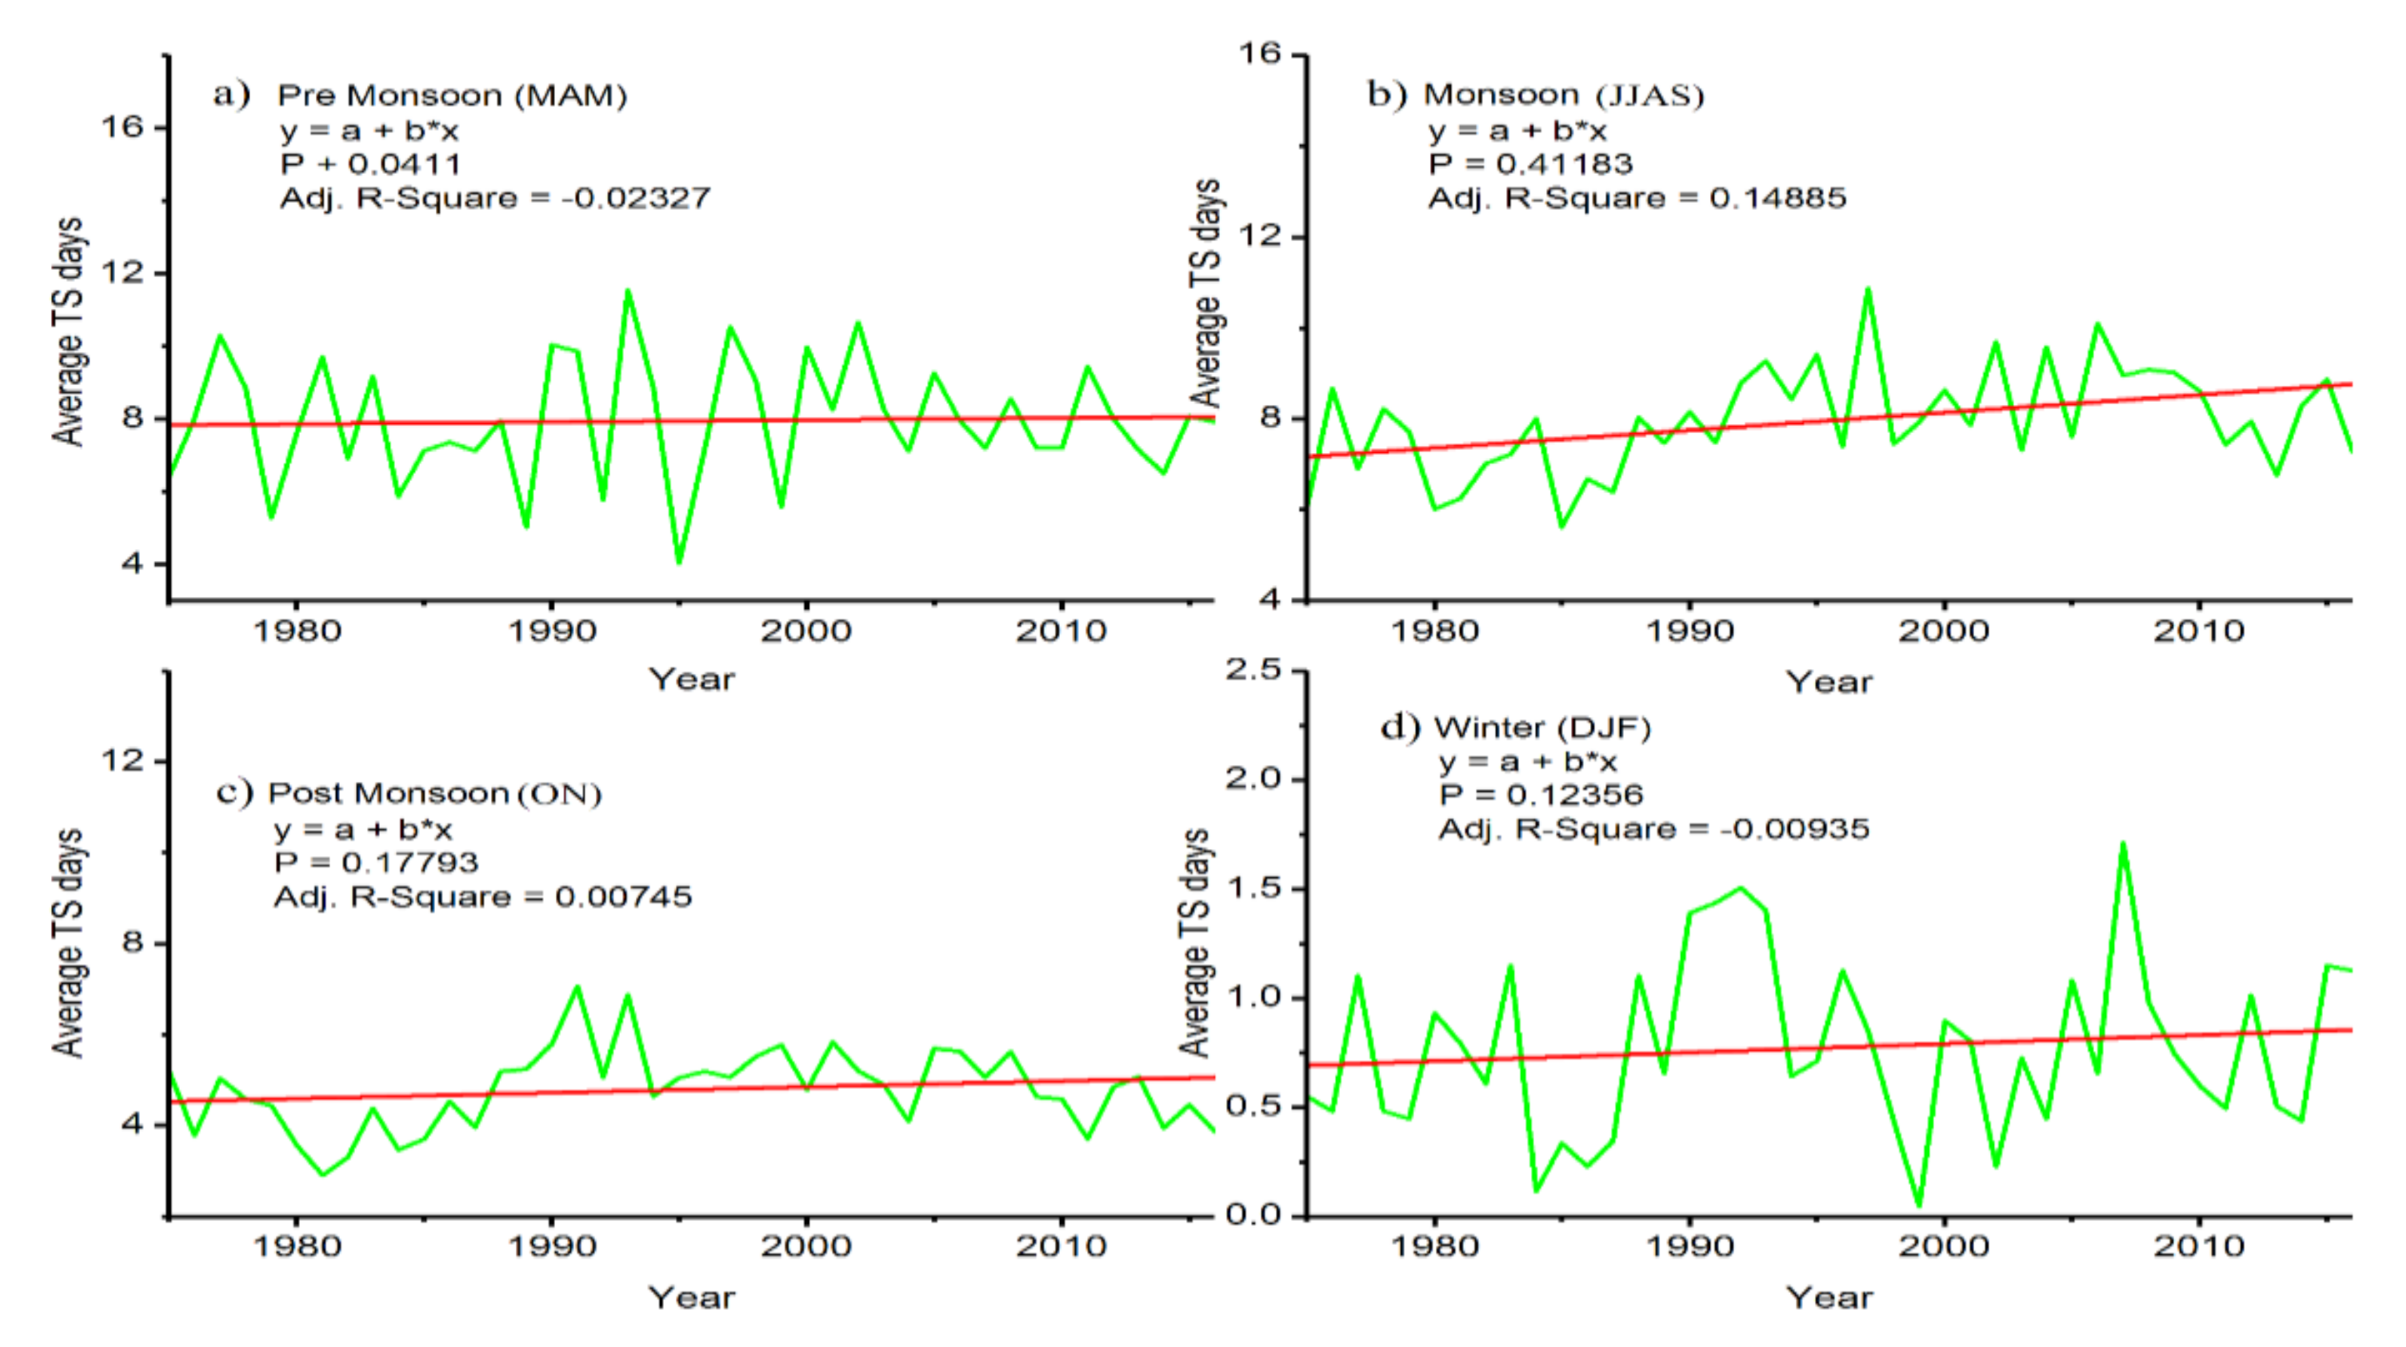
3.1. Monthly and Seasonal Variation of TS Days
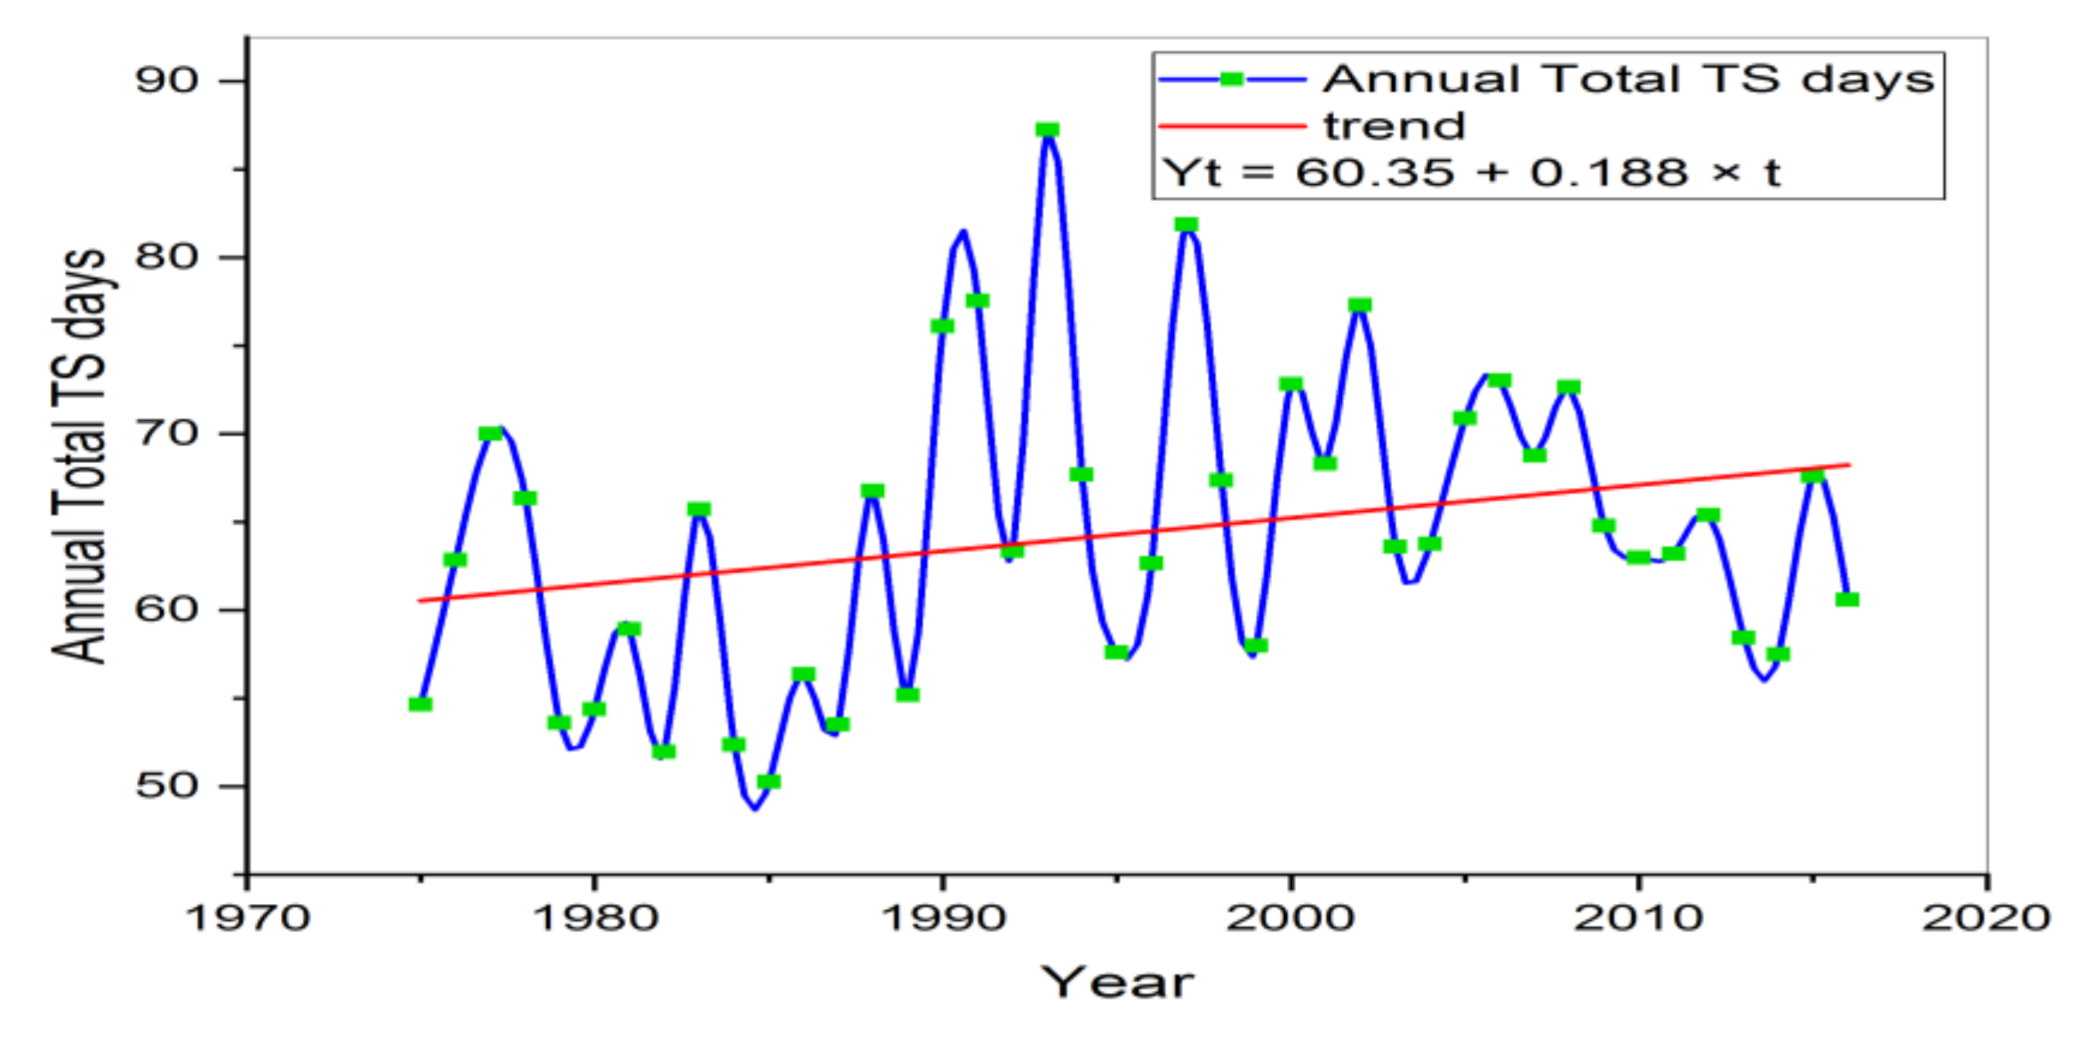
3.2. Annual Variation of TS Days
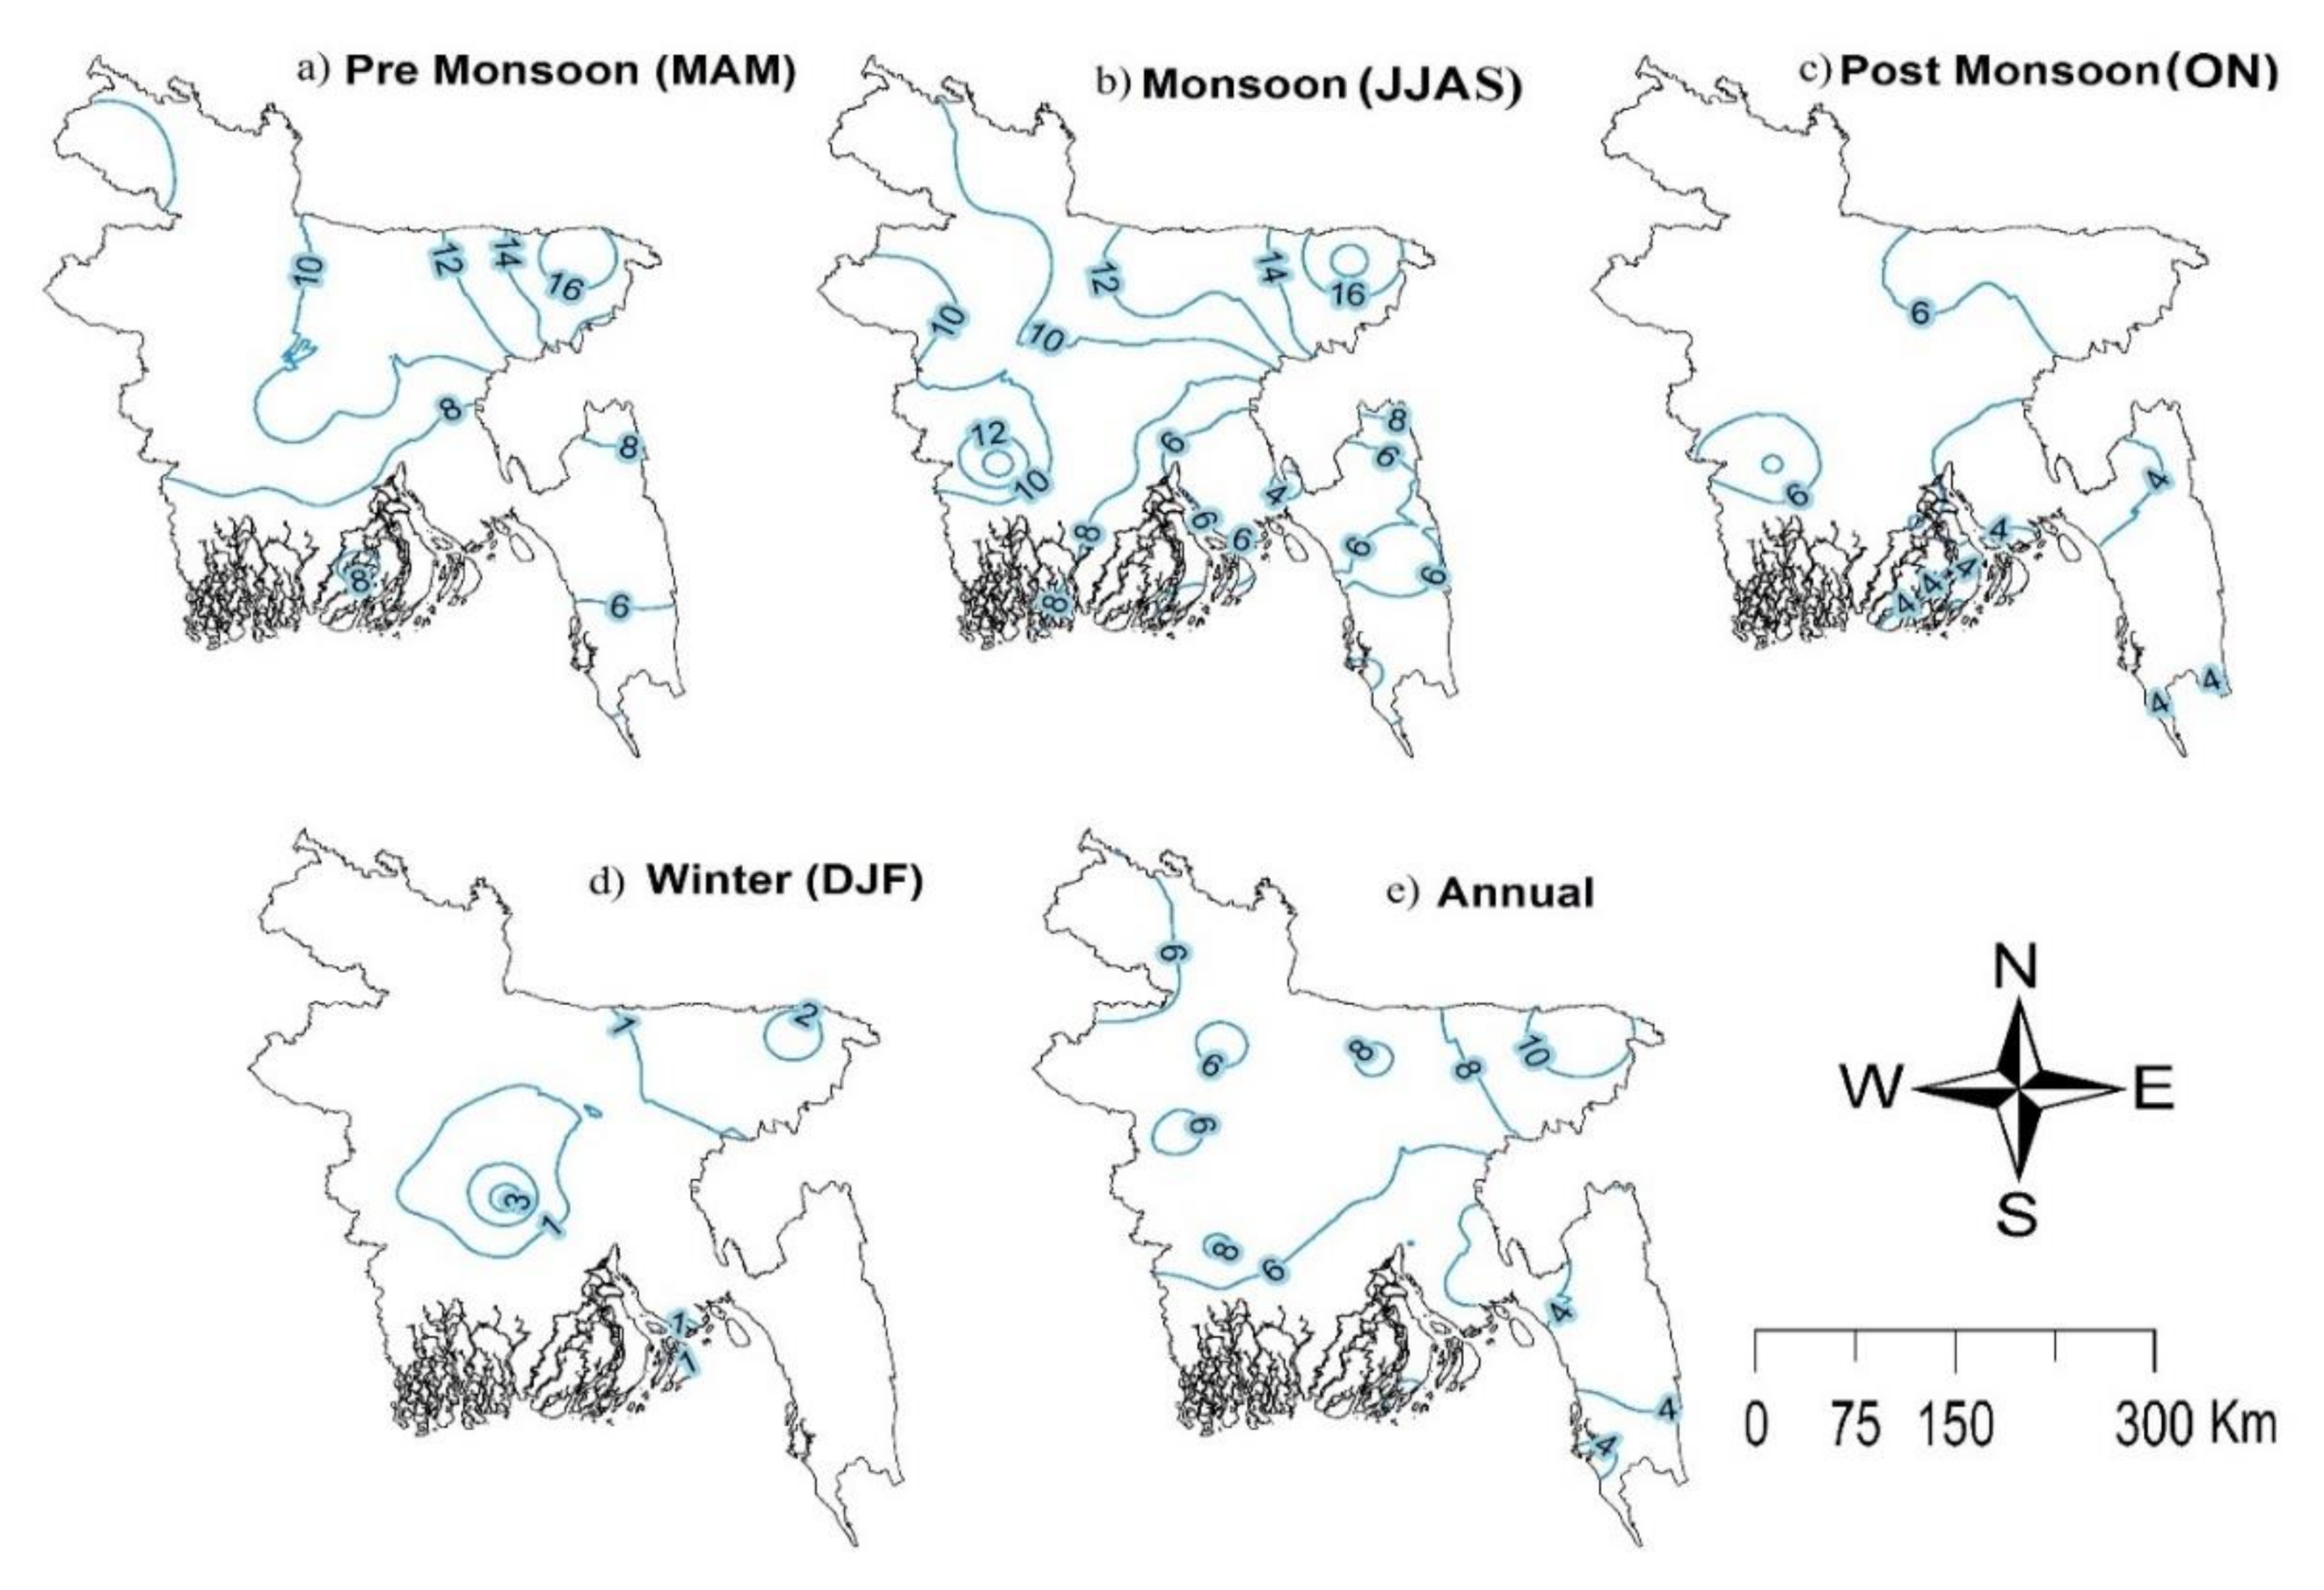
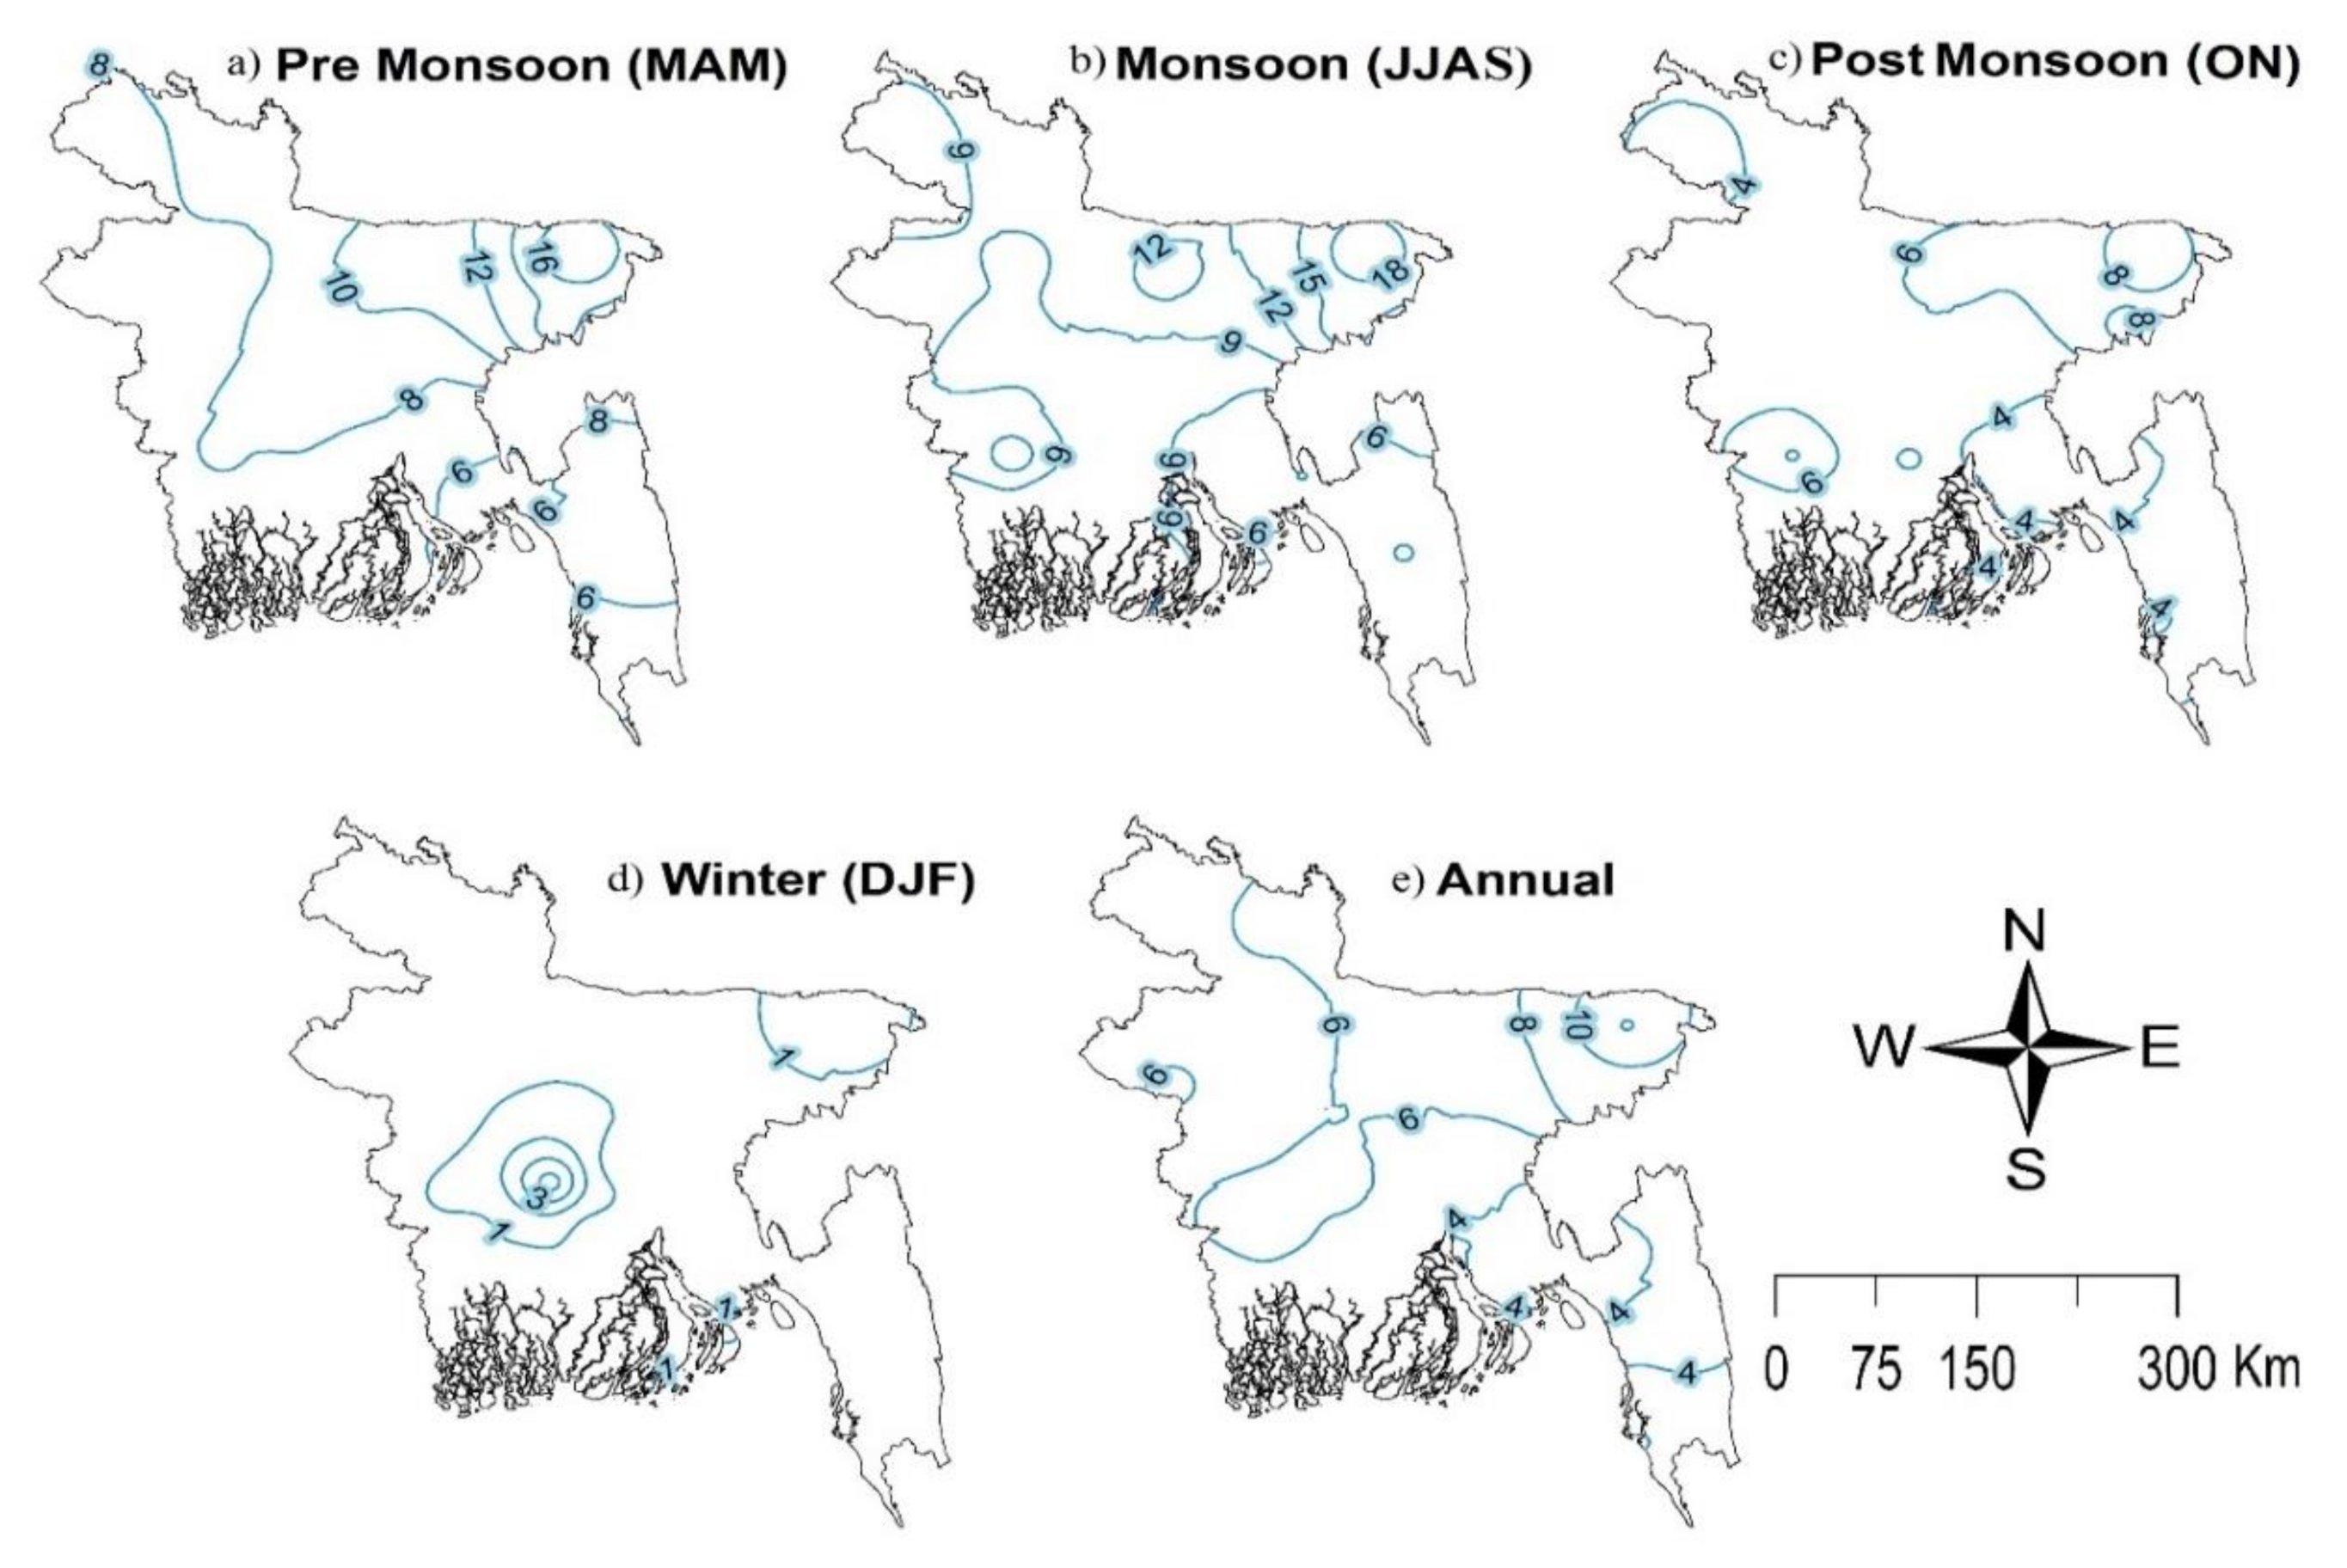
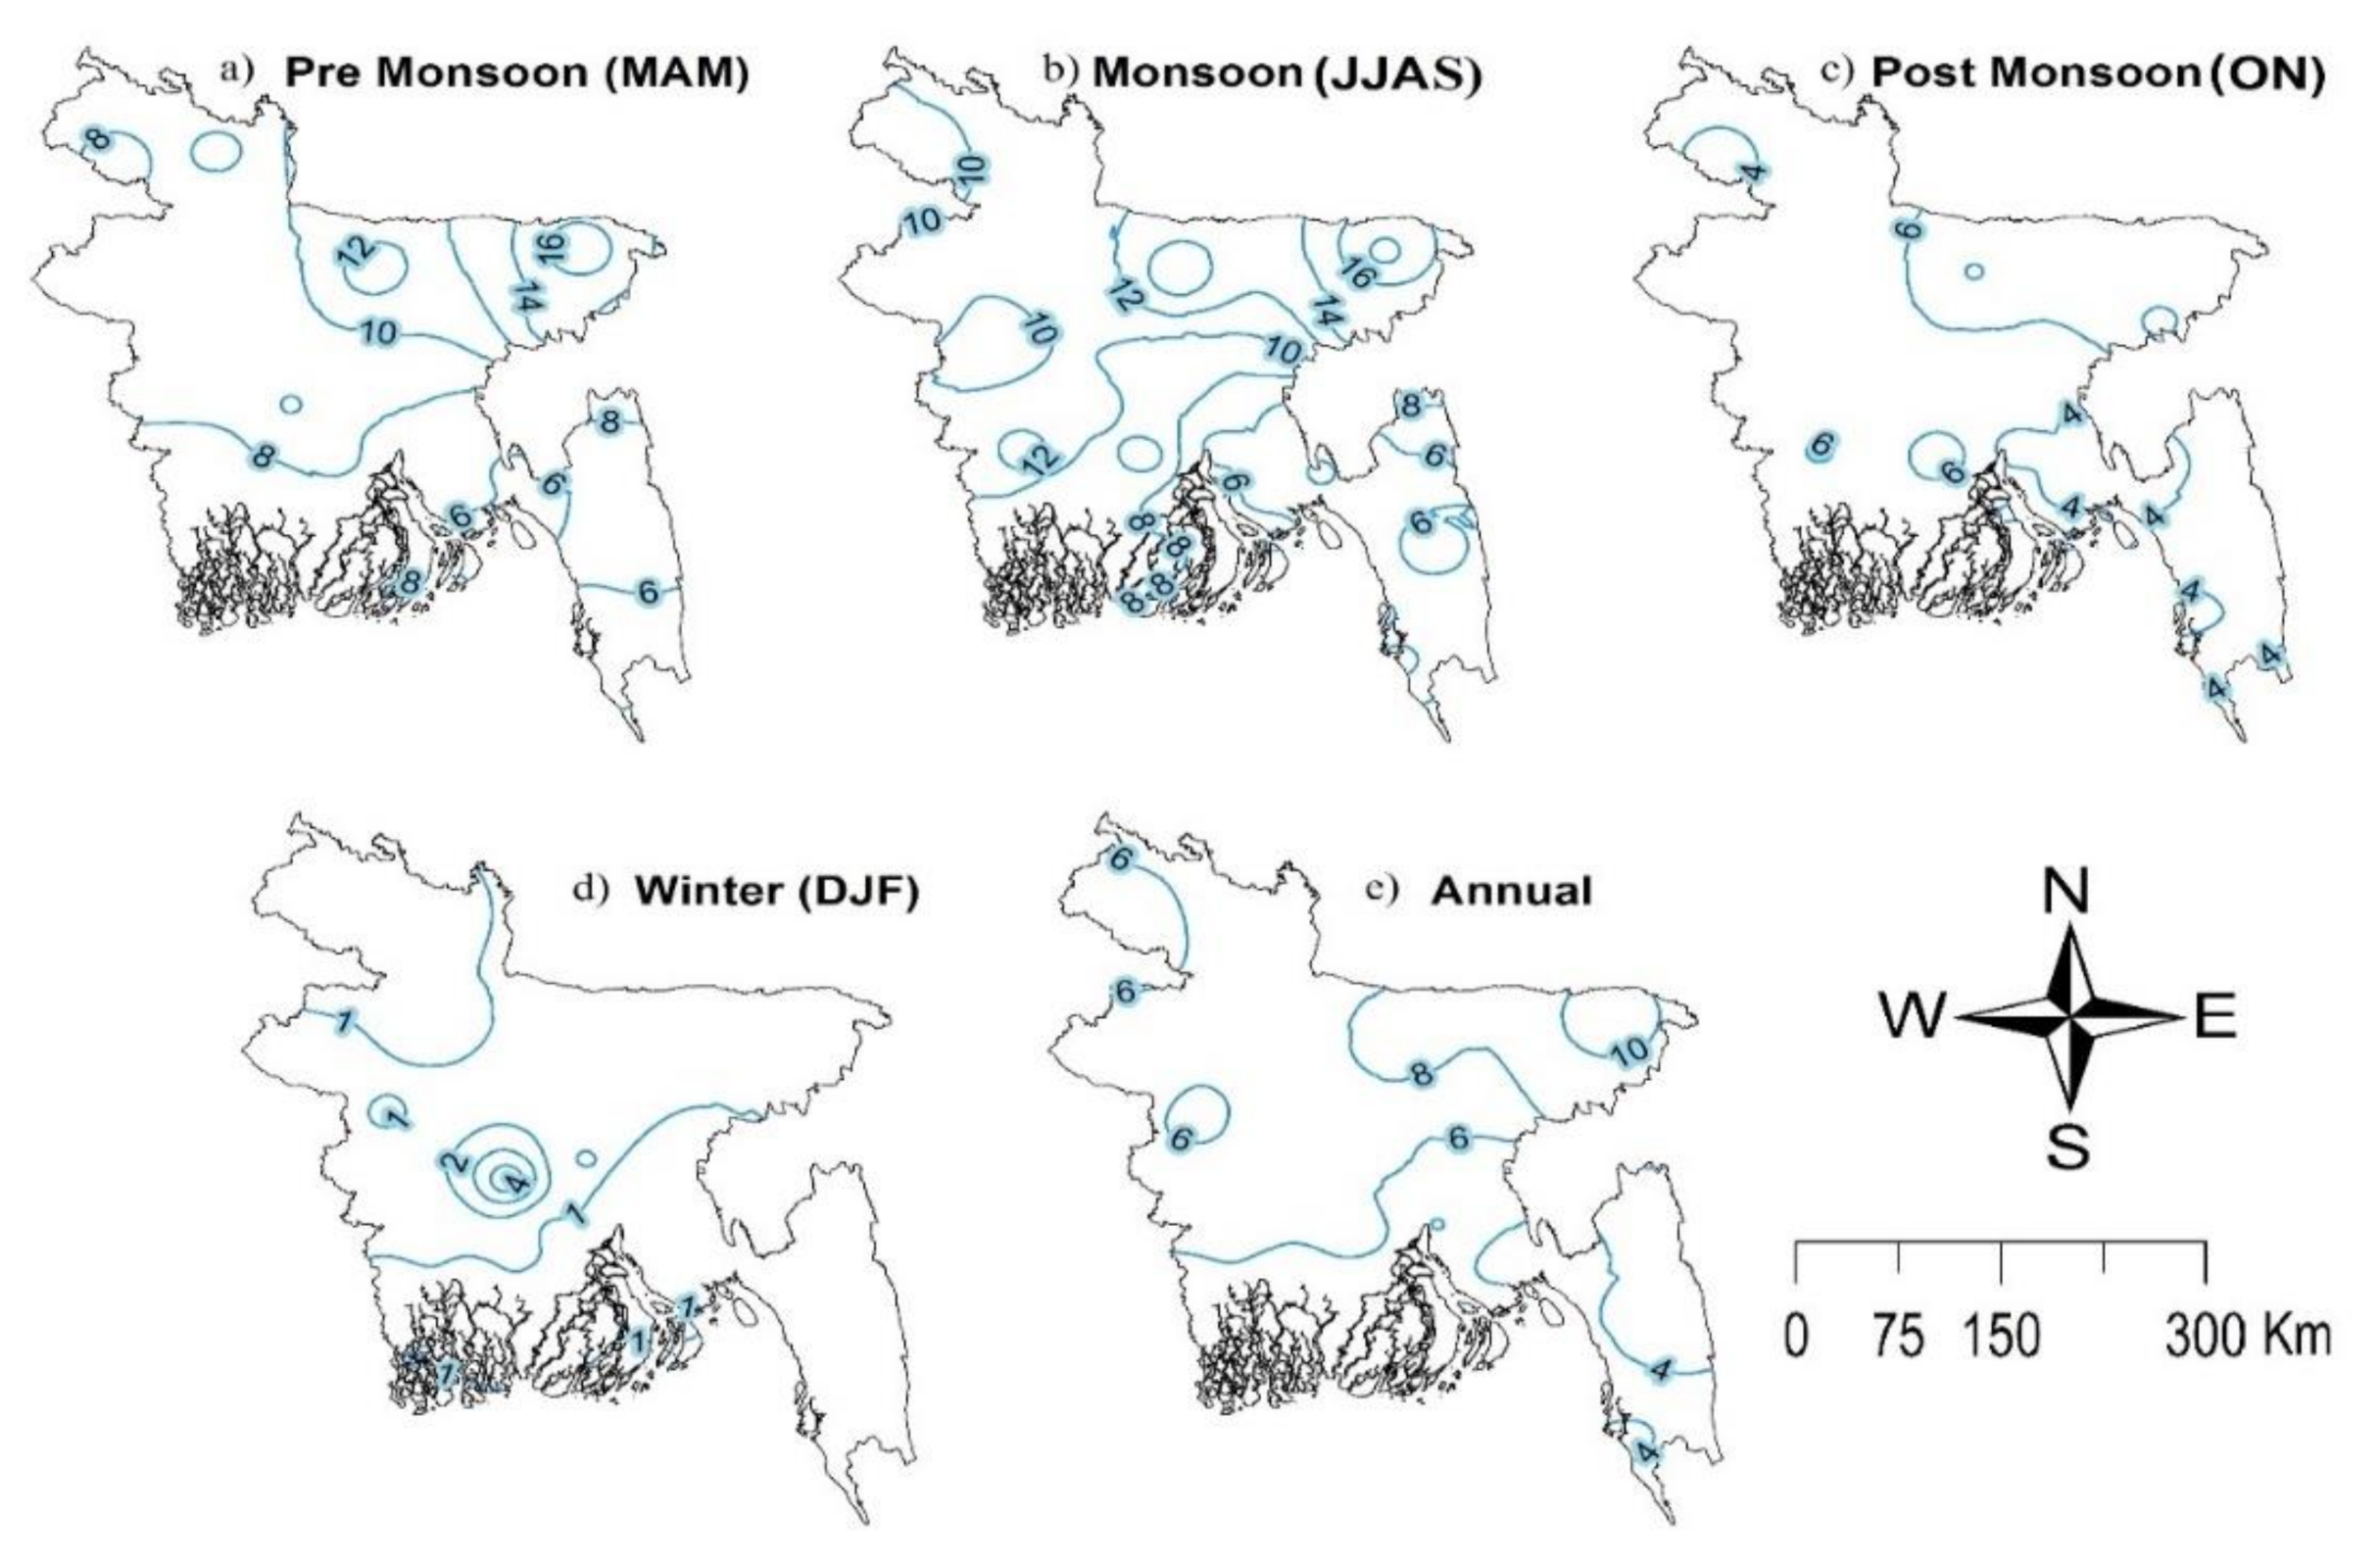
3.3. Spatial Distribution of TS Days
Monthly Spatial Distribution of TS Days
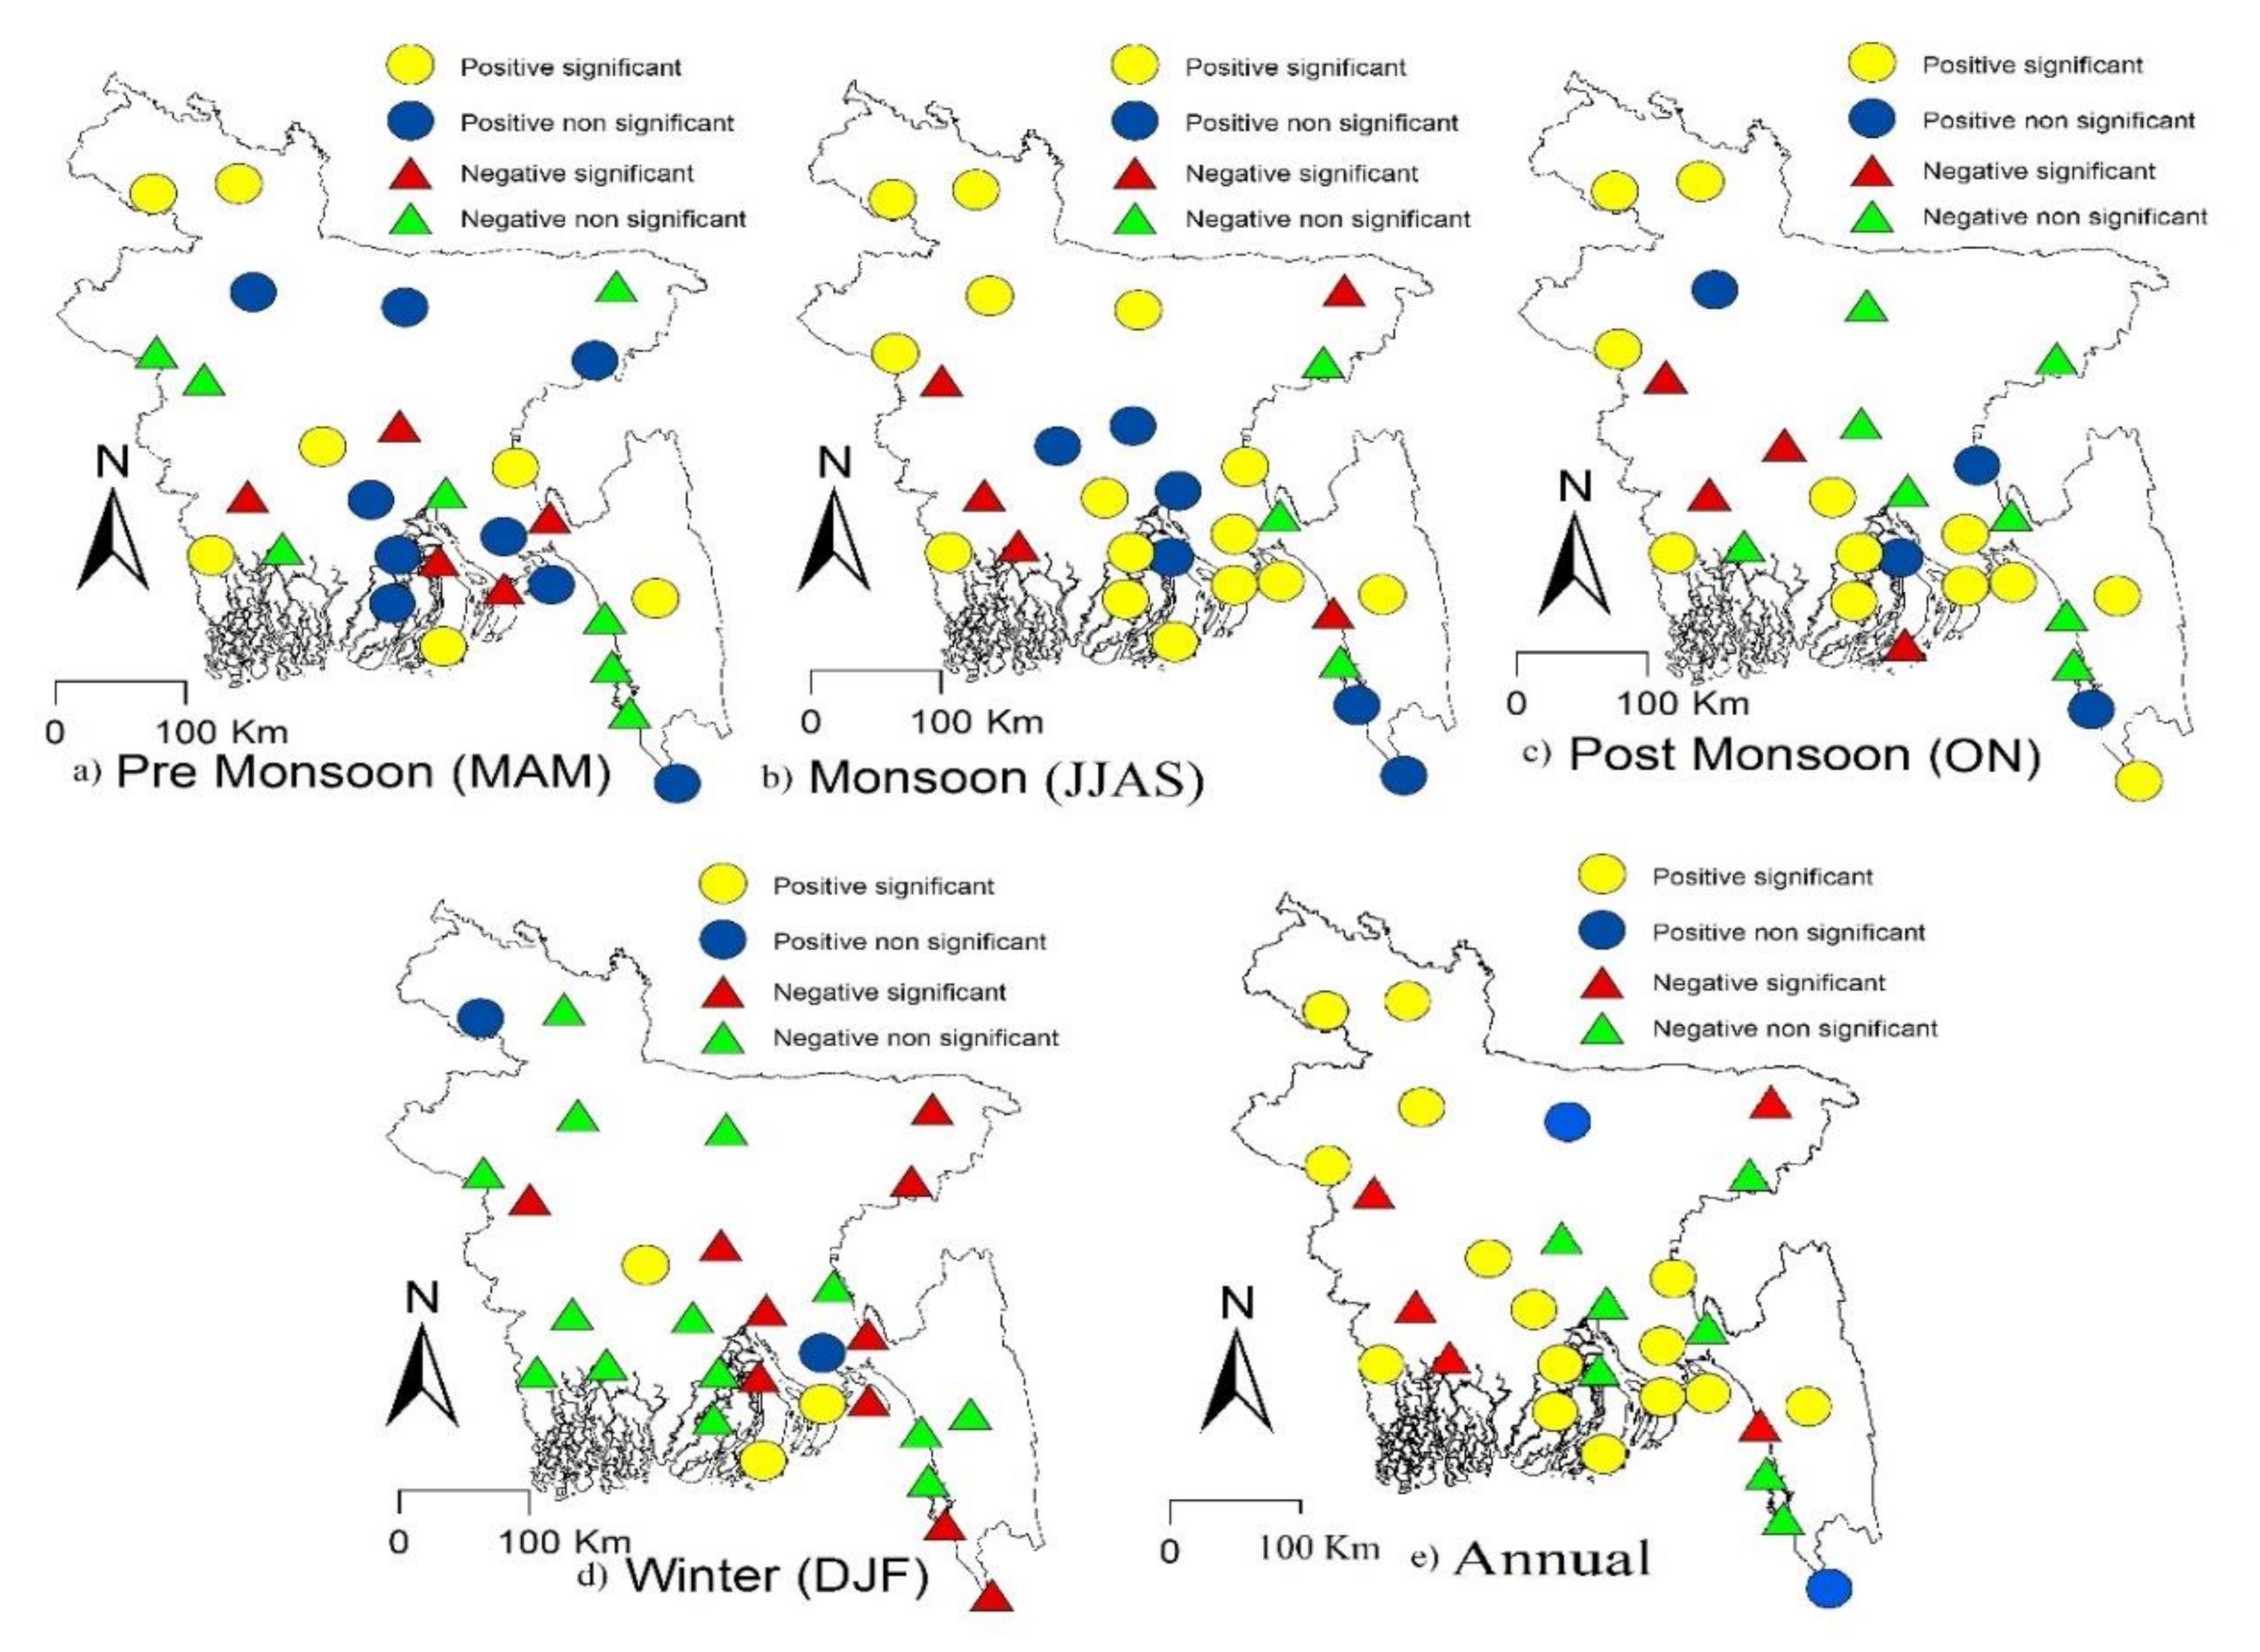
3.4. Spatiotemporal Pattern of TS Days
Spatial Patterns in the Monthly Trends of TS Days
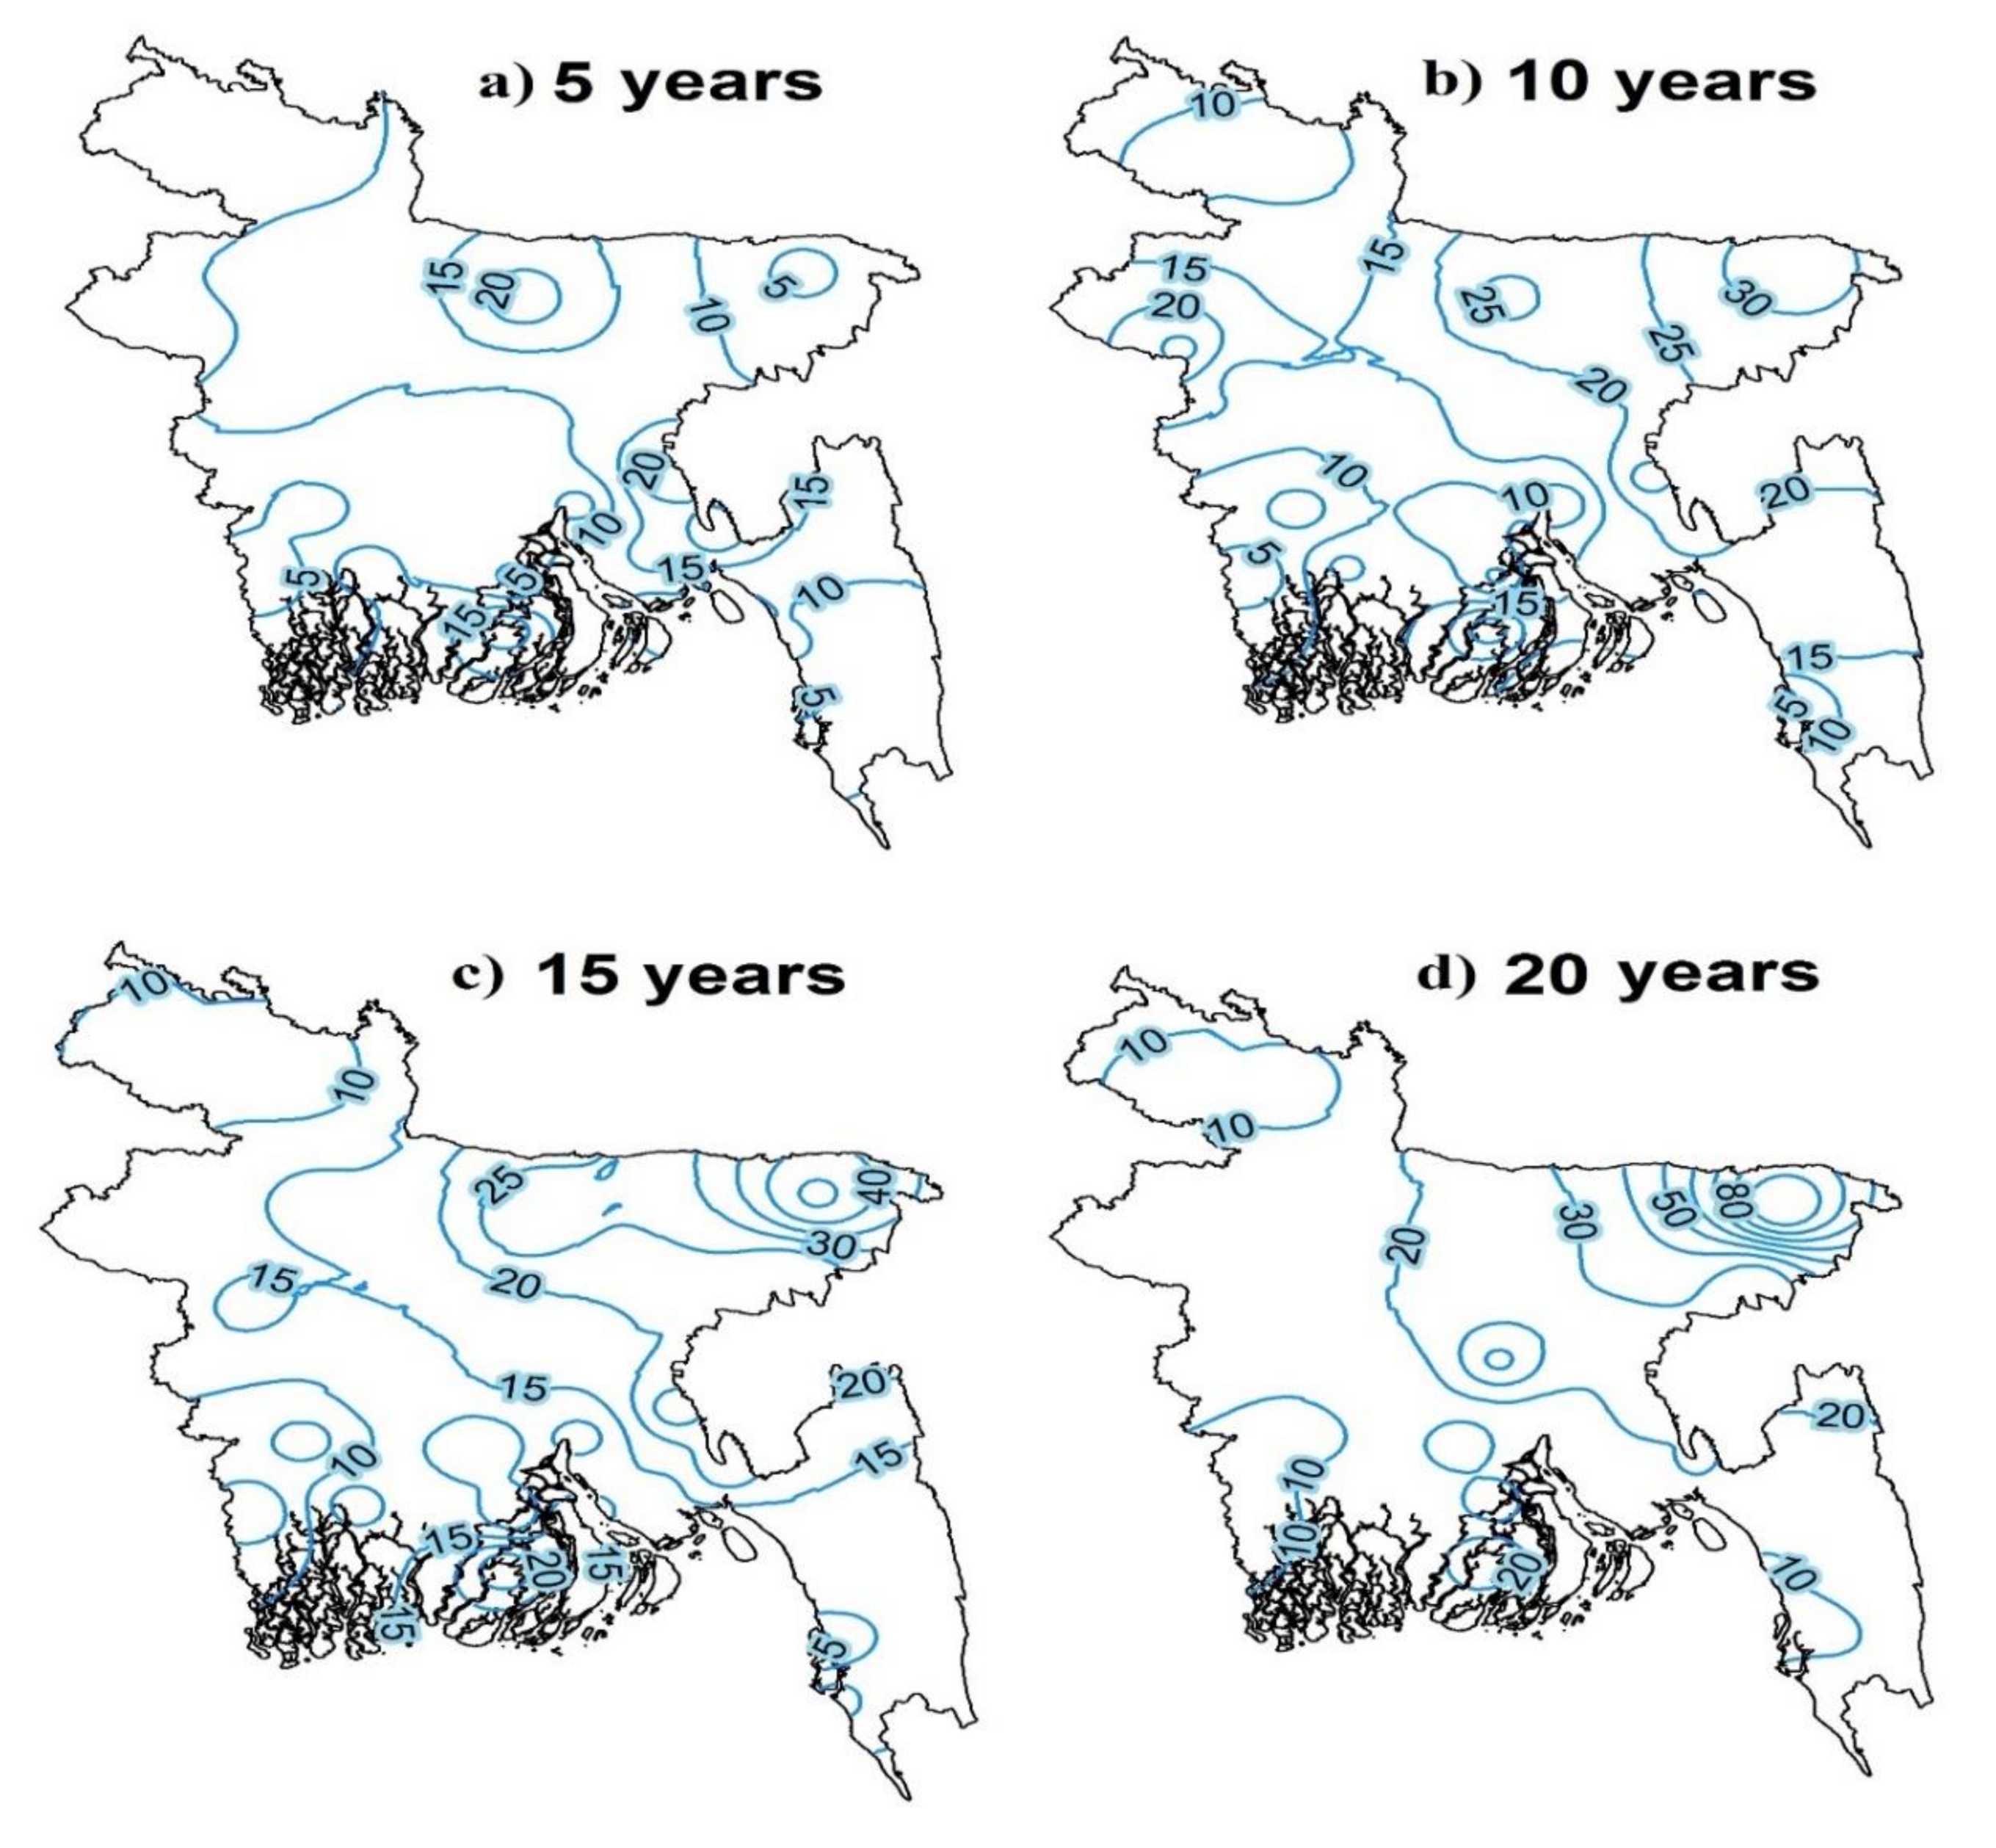
3.5. Probability of TS Days over Bangladesh
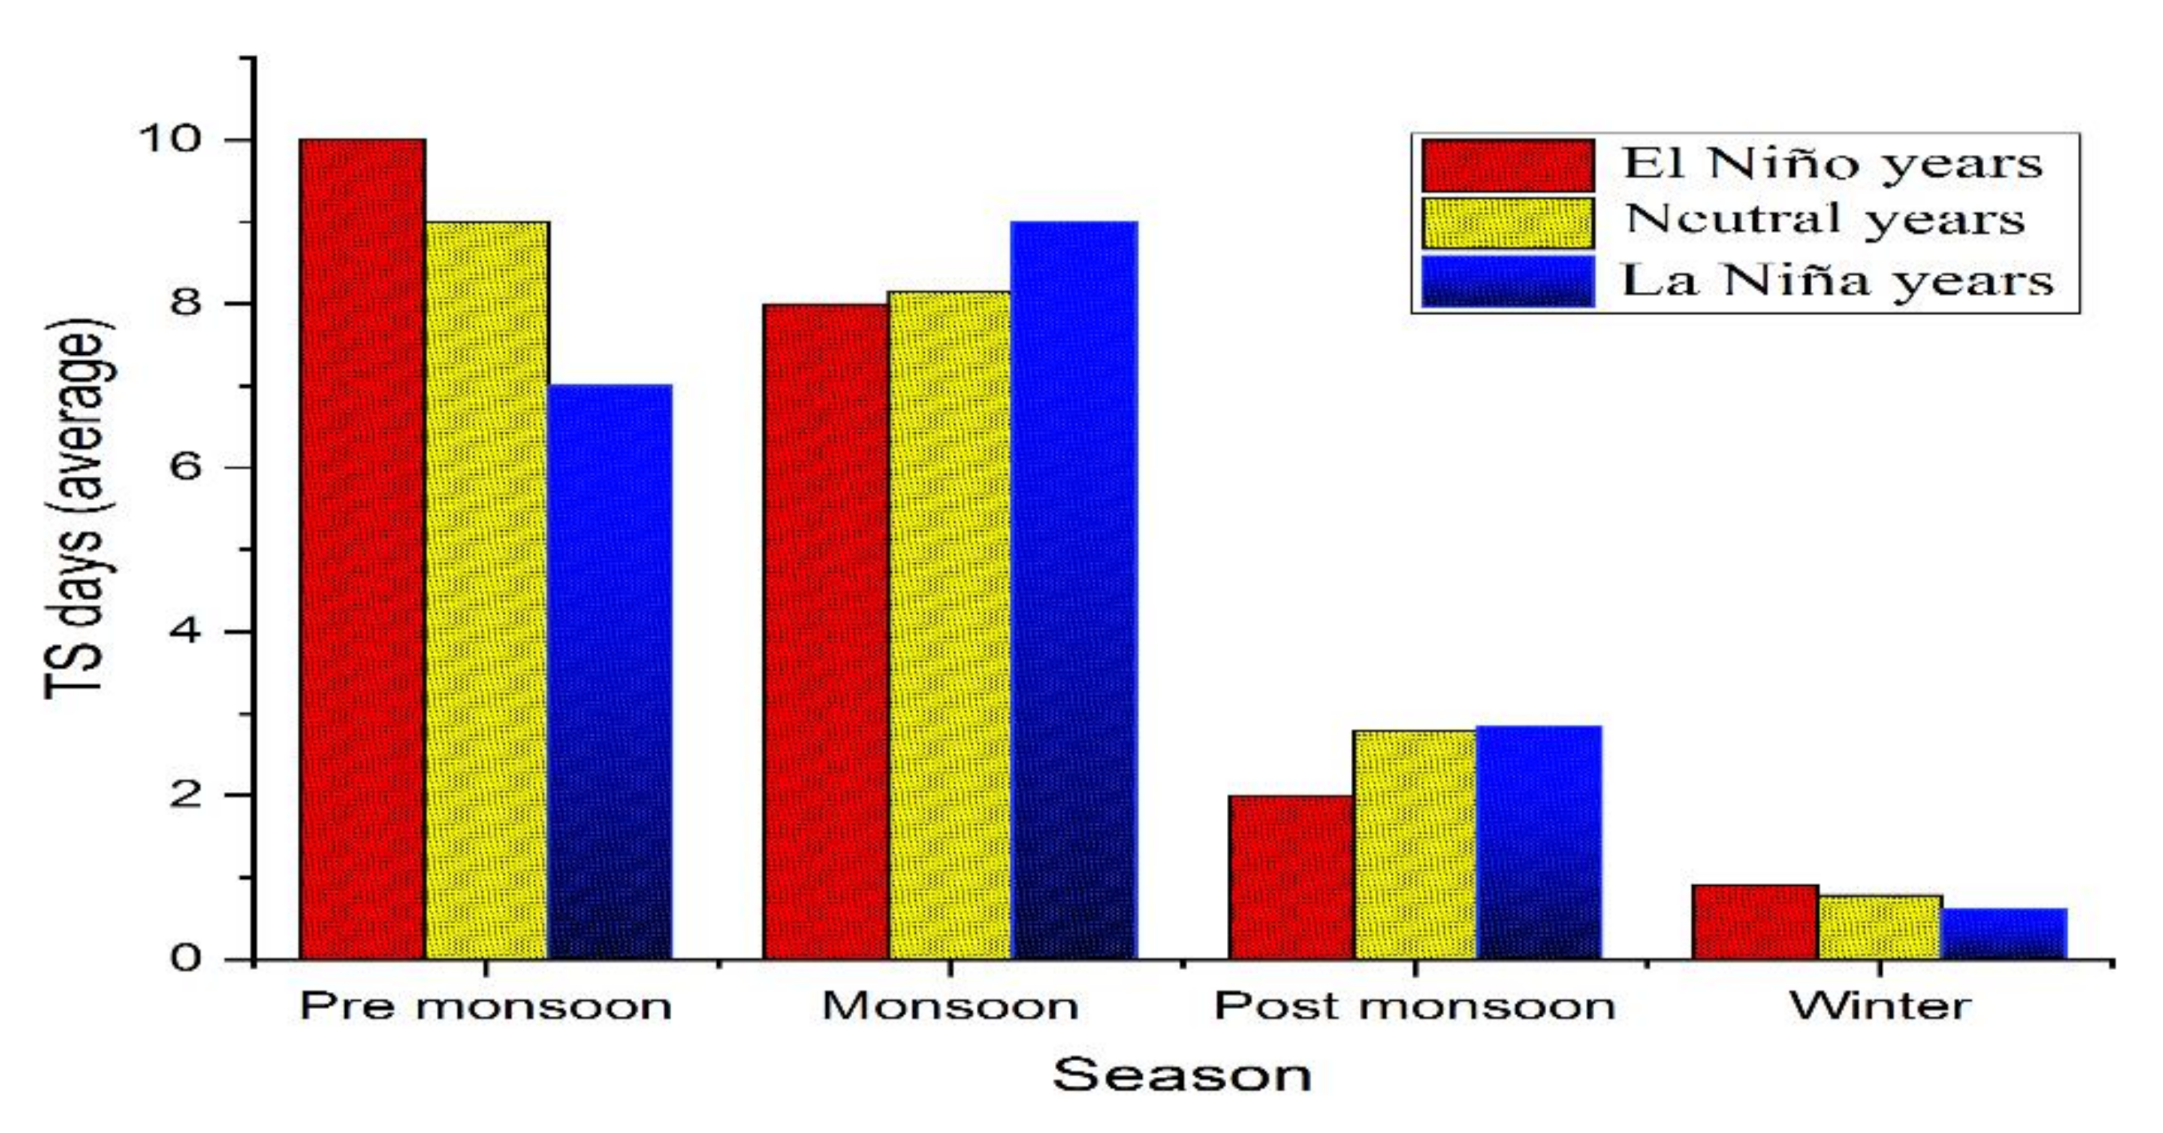
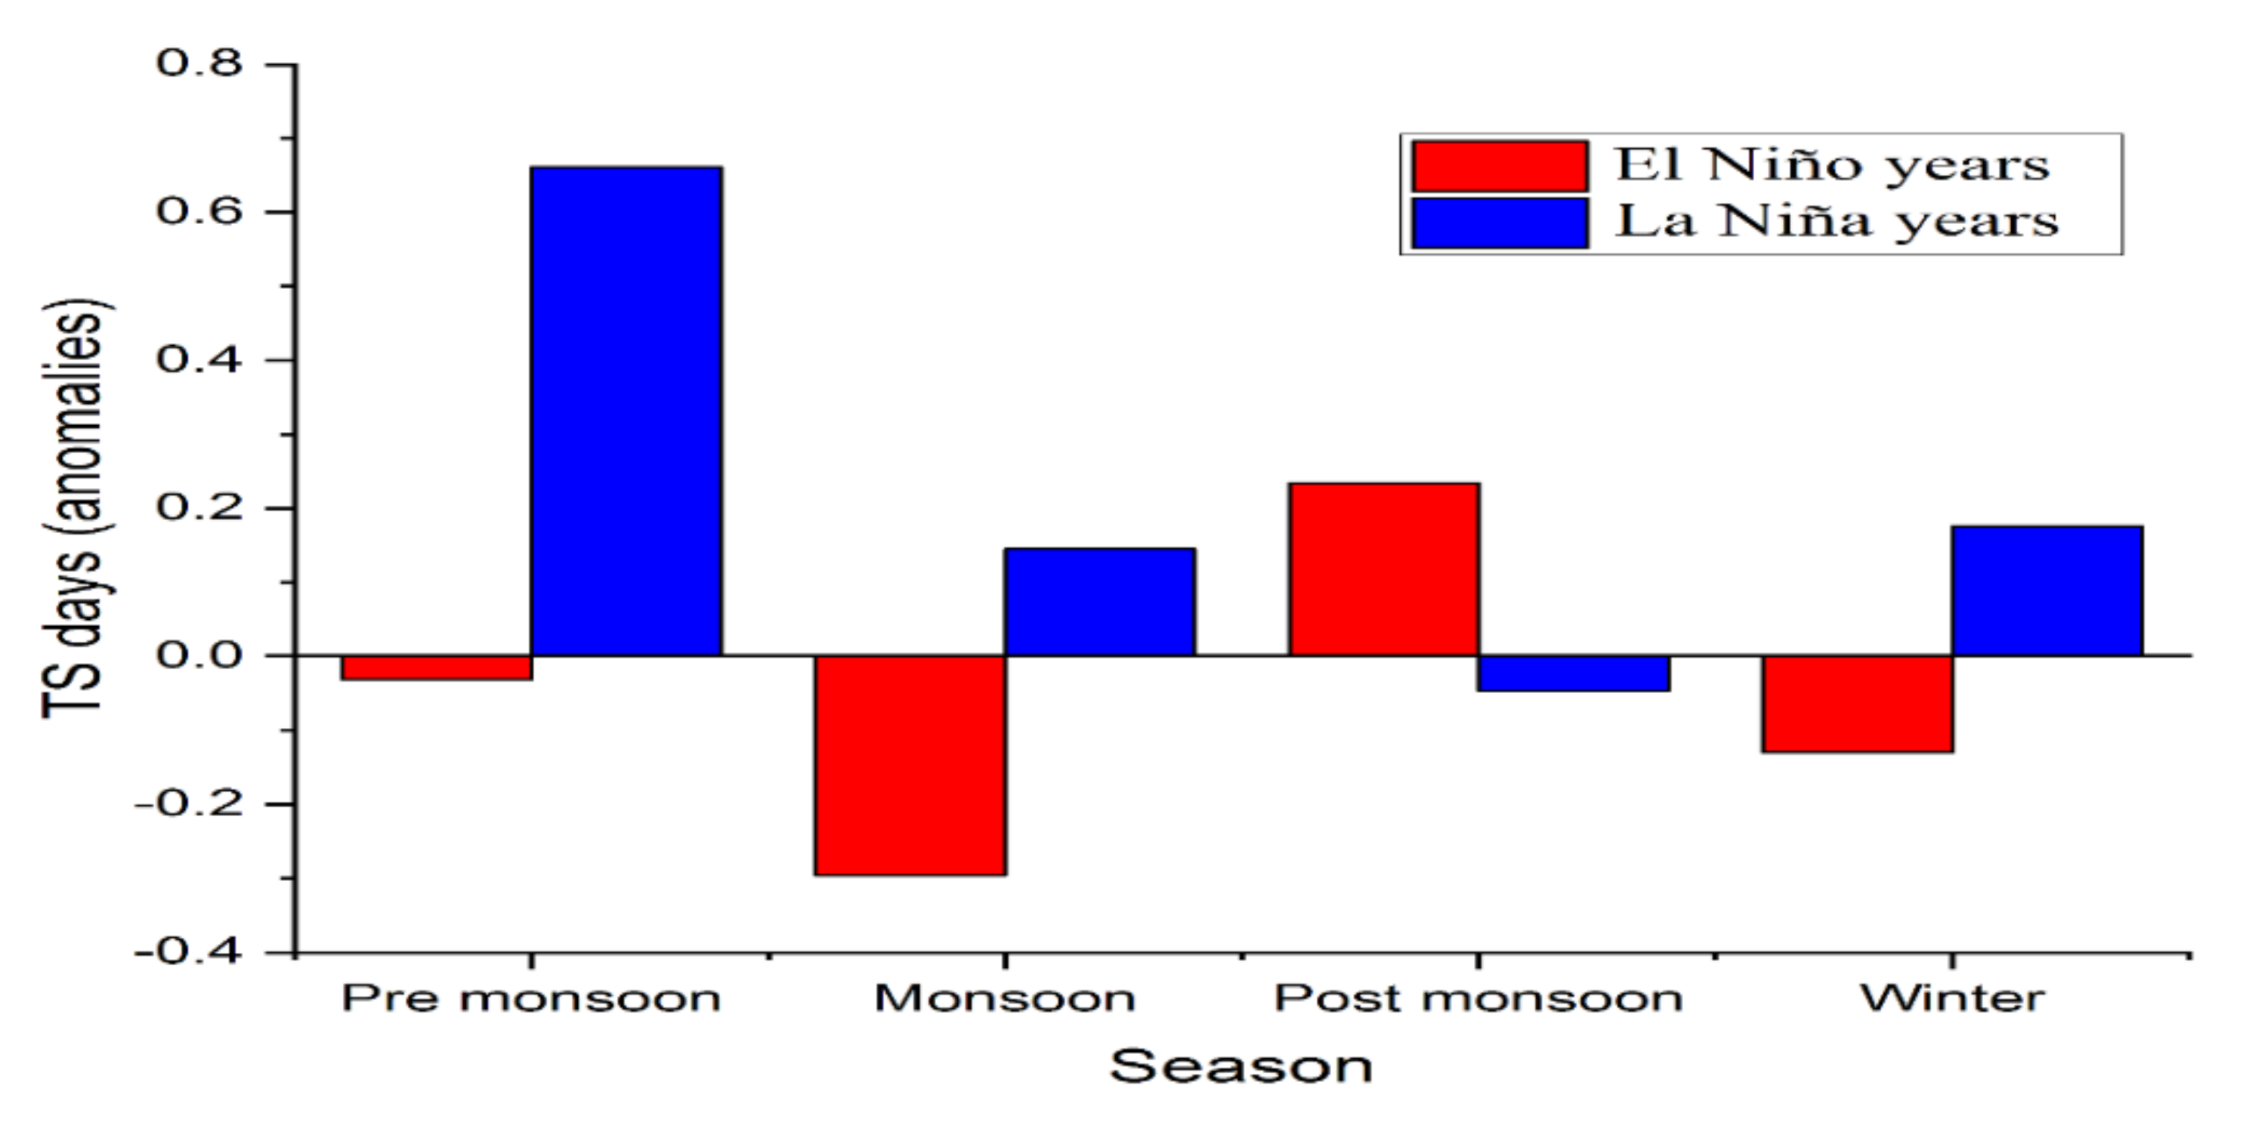
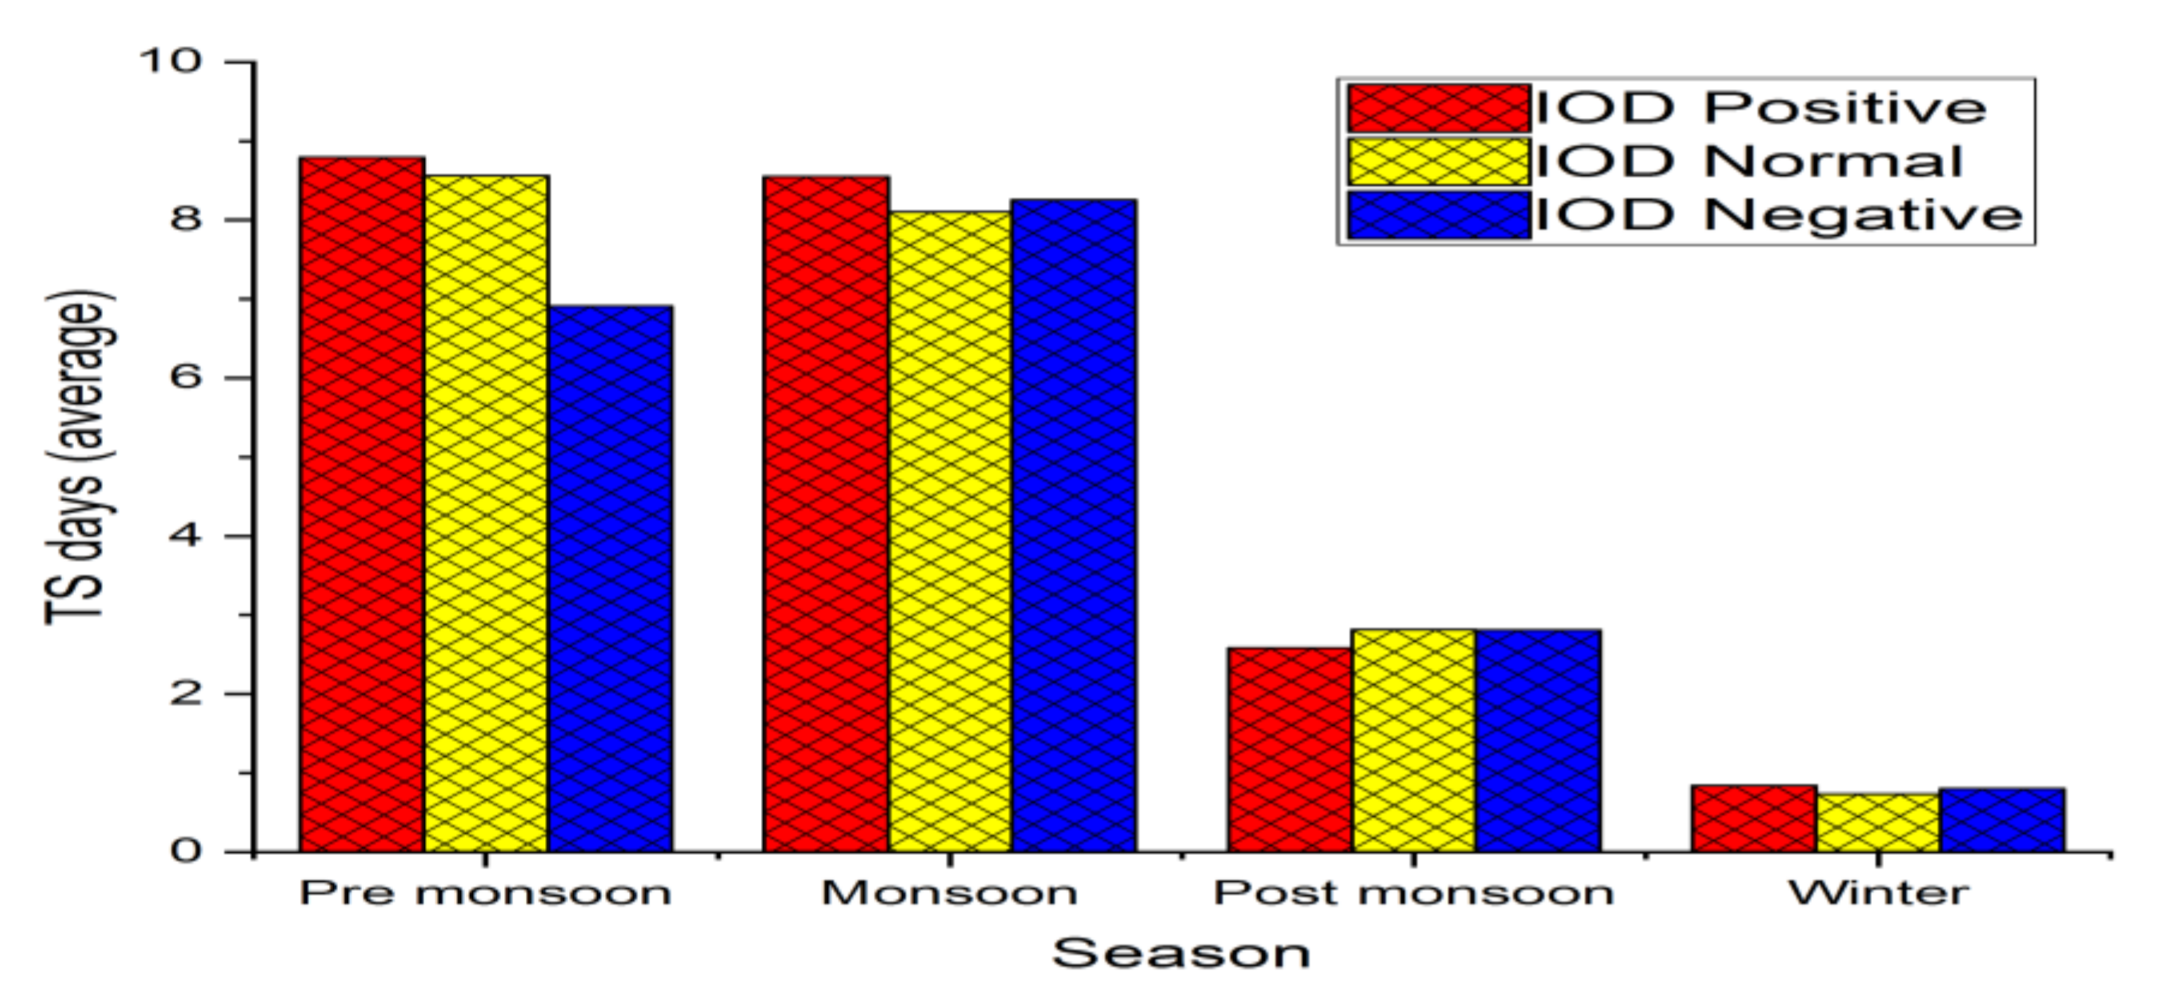
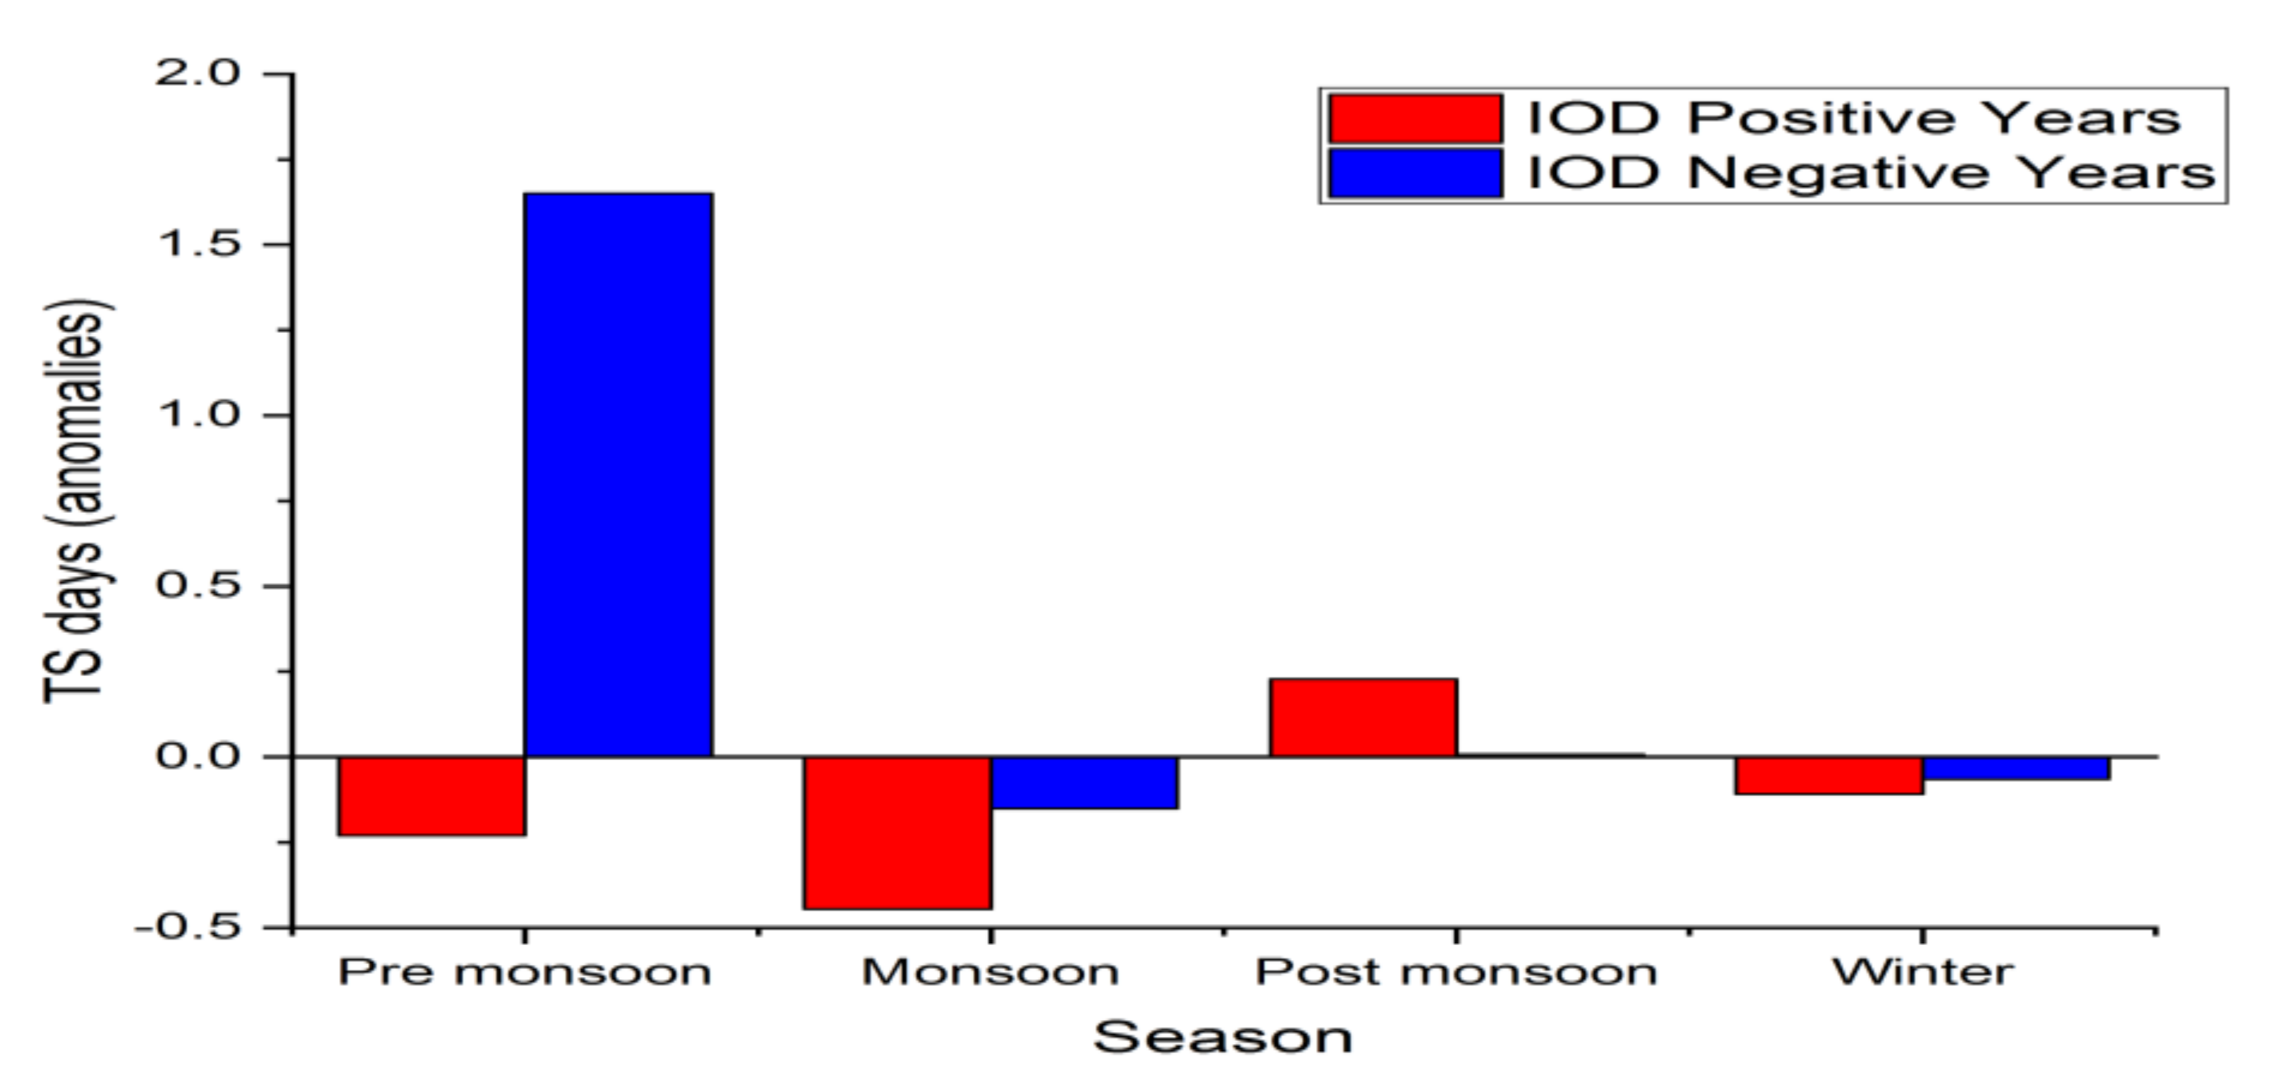
3.6. The Relationship between ENSO/IOD and TS Days
4. Discussion and Conclusions
Author Contributions
Funding
Conflicts of Interest
Appendix A

| Station | Mean | Median | Standard Deviation | Maximum | Minimum | 1st Quartile | 3rd Quartile | Variation per Decade |
|---|---|---|---|---|---|---|---|---|
| Dhaka | 6.1 | 6.1 | 1.0 | 8.8 | 4.4 | 5.3 | 6.6 | 3.3 |
| Madaripur | 6.0 | 6.3 | 1.8 | 10.0 | 1.8 | 4.9 | 7.1 | 4.6 |
| Faridpur | 7.1 | 7.4 | 2.0 | 11.2 | 2.2 | 5.6 | 8.5 | 5.8 |
| Mymensingh | 8.2 | 8.3 | 1.6 | 11.8 | 4.1 | 7.3 | 8.9 | 5.5 |
| Srimangal | 9.8 | 9.9 | 1.6 | 13.1 | 6.0 | 8.7 | 11.1 | 6.5 |
| Sylhet | 11.8 | 11.9 | 1.6 | 16.2 | 9.1 | 10.5 | 12.8 | 7.5 |
| Bogura | 5.7 | 5.6 | 1.3 | 8.5 | 2.9 | 4.9 | 6.8 | 2.3 |
| Rajshahi | 6.3 | 6.4 | 1.2 | 9.0 | 4.4 | 5.2 | 7.2 | 3.5 |
| Ishwardi | 5.5 | 5.6 | 1.4 | 8.4 | 2.8 | 4.7 | 6.3 | 2.2 |
| Dinajpur | 4.6 | 4.7 | 1.7 | 7.6 | 1.0 | 3.3 | 6.0 | 3.2 |
| Rangpur | 6.3 | 6.3 | 1.6 | 9.0 | 2.7 | 5.3 | 7.3 | 4.2 |
| Jassore | 7.9 | 8.1 | 1.5 | 10.3 | 2.6 | 7.0 | 9.0 | 2.1 |
| Khulna | 5.2 | 5.2 | 1.4 | 8.2 | 1.8 | 4.3 | 6.1 | 2.5 |
| Satkhira | 5.1 | 5.5 | 1.6 | 8.5 | 1.8 | 4.1 | 6.0 | 2.3 |
| Barishal | 4.9 | 5.3 | 1.6 | 7.3 | 1.7 | 3.8 | 6.3 | 3.3 |
| Bhola | 4.3 | 4.2 | 1.0 | 6.4 | 2.5 | 3.6 | 5.1 | 1.1 |
| Khepupara | 4.4 | 4.6 | 1.8 | 8.5 | 1.3 | 3.1 | 5.5 | 1.2 |
| Patuakhali | 5.2 | 5.3 | 1.3 | 7.8 | 2.1 | 4.2 | 6.1 | 0.5 |
| Chandpur | 4.3 | 4.0 | 1.3 | 7.5 | 2.5 | 3.3 | 5.1 | 3.1 |
| Chattogram | 4.3 | 4.4 | 1.1 | 6.7 | 1.3 | 3.6 | 5.0 | 2.5 |
| Comilla | 3.9 | 4.0 | 1.3 | 6.8 | 1.4 | 3.0 | 4.6 | 3.5 |
| Cox′s Bazar | 4.2 | 4.0 | 1.0 | 6.7 | 2.4 | 3.4 | 4.9 | 2.5 |
| Feni | 3.2 | 3.0 | 1.2 | 6.5 | 0.7 | 2.3 | 4.2 | 2.3 |
| Hatiya | 4.8 | 4.4 | 1.7 | 8.8 | 2.0 | 3.6 | 5.7 | 1.4 |
| Kutubdia | 3.1 | 3.2 | 1.2 | 5.5 | 0.7 | 2.1 | 3.8 | 1.9 |
| M.court | 3.2 | 3.5 | 1.4 | 6.3 | 0.3 | 2.1 | 4.2 | 3.3 |
| Rangamati | 4.5 | 4.8 | 1.5 | 7.1 | 0.6 | 3.6 | 5.5 | 1.2 |
| Sandwip | 3.3 | 3.1 | 1.4 | 6.9 | 0.6 | 2.4 | 4.3 | 1.0 |
| Teknaf | 2.4 | 2.5 | 1.2 | 5.2 | 0.3 | 1.4 | 3.2 | 0 |
| Year | 5 | 5 | 10 | 10 | 15 | 15 | 20 | 20 |
|---|---|---|---|---|---|---|---|---|
| Station Name | Maximum | 3rd Quartile | Maximum | 3rd Quartile | Maximum | 3rd Quartile | Maximum | 3rd Quartile |
| Dhaka | >7 | 3 | >19 | 10 | >18 | 6 | >42 | 4 |
| Madaripur | >5 | 4 | >5 | 3 | >5 | 4 | >5 | 4 |
| Faridpur | >10 | 8 | >12 | 9 | >15 | 9 | >17 | 8 |
| Mymensingh | >22 | 16 | >26 | 12 | >28 | 12 | >26 | 20 |
| Srimangal | >9 | 8 | >28 | 13 | >20 | 12 | >23 | 12 |
| Sylhet | >4 | 3 | >33 | 4 | >46 | 15 | >100 | 10 |
| Bogra | >13 | 12 | >14 | 12 | >16 | 14 | >18 | 13 |
| Rajshahi | >8 | 2 | >26 | 7 | >13 | 6 | >15 | 6 |
| Ishurdi | >14 | 8 | >14 | 10 | >16 | 10 | >18 | 12 |
| Dinajpur | >7 | 5 | >9 | 5 | >8 | 5 | >8 | 6 |
| Rangpur | >9 | 5 | >7 | 5 | >7 | 5 | >7 | 5 |
| Jessore | >3 | 2 | >3 | 2 | >3 | 1 | >4 | 2 |
| Khulna | >12 | 8 | >16 | 10 | >17 | 17 | >19 | 19 |
| Satkhira | >2 | 2 | >2 | 2 | >2 | 2 | >2 | 2 |
| Barisal | >3 | 3 | >4 | 2 | >5 | 3 | >4 | 2 |
| Bhola | >13 | 7 | >15 | 10 | >18 | 14 | >18 | 13 |
| Khepupa | >13 | 5 | >11 | 8 | >16 | 7 | >12 | 9 |
| Patuakhali | >24 | 18 | >28 | 25 | >30 | 23 | >28 | 24 |
| Chandpur | >3 | 2 | >6 | 5 | >8 | 5 | .>10 | 4 |
| Chittagon | >11 | 7 | >17 | 6 | >15 | 6 | >8 | 5 |
| Comilla | >25 | 23 | >27 | 25 | >28 | 25 | >26 | 24 |
| Cox′s Bazar | >8 | 6 | >10 | 8 | >16 | 8 | >12 | 4 |
| Feni | >24 | 17 | >23 | 20 | >24 | 22 | >21 | 19 |
| Hatiya | >7 | 6 | >17 | 7 | >12 | 8 | >14 | 7 |
| Kutubdia | >3 | 2 | >3 | 2 | >3 | 2 | >3 | 2 |
| M.court | >17 | 13 | >20 | 12 | >14 | 11 | >18 | 12 |
| Rangamat | >8 | 6 | >18 | 8 | >11 | 8 | >16 | 7 |
| Sandwip | >6 | 4 | >14 | 5 | >6 | 3 | >12 | 5 |
| Teknaf | >12 | 4 | >13 | 2 | >16 | 5 | >12 | 5 |
References
- Ahasan, D.M.N.; Quadir, D.; Khan, K.; Haque, M.S. Simulation of a thunderstorm event over Bangladesh using WRF–ARW model. J. Mech. Eng. 2015, 44, 124. [Google Scholar] [CrossRef] [Green Version]
- Saha, T.R.; Quadir, D.A. Variability and trends of annual and seasonal thunderstorm frequency over Bangladesh. Int. J. Climatol. 2016, 36, 344–345. [Google Scholar] [CrossRef]
- Wahiduzzaman, M.; Luo, J.J. A statistical analysis on the contribution of El Niño–Southern Oscillation to the rainfall and temperature over Bangladesh. Meteorol. Appl. Phys. 2020. [Google Scholar] [CrossRef]
- Wahiduzzaman, M.; Oliver, E.C.J.; Wotherspoon, S.J.; Luo, J.J. Seasonal forecasting of tropical cyclones in the North Indian Ocean region: The role of El Niño–Southern Oscillation. Clim. Dyn. 2020, 54, 1571–1589. [Google Scholar] [CrossRef]
- Manohar, G.K.; Kandalgaonkar, S.S.; Tinmaker, M.I.R. Thundersytrom activity over India and the Indian Southwest Monsoon. J. Geophys. Res. 1999, 104, 41188–41694. [Google Scholar]
- Kulkarni, M.K.; Revadekar, J.V.; Varikoden, H. About the variability in thunderstorms and rainfall activity over India and its association with El Niño and La Niña. Nat. Hazards 2015, 63, 2005. [Google Scholar] [CrossRef]
- Allen, J.T.; Karoly, D.J. A climatology of Australian severe thunderstorm environments 1979–2011: Inter–annual variability and ENSO influence. Int. J. Climatol. 2014, 34, 81–97. [Google Scholar] [CrossRef]
- Allen, J.T.; Tippett, M.; Sobel, A. Influence of El Niño/Southern Oscillation on tornado and hail frequency in the United States. Nat. Geosci. 2015, 8, 278–283. [Google Scholar] [CrossRef]
- Pinto, O.; Ferro, M.A.S. A study of the long–term variability of thunderstorm days in southeast Brazil. J. Geophys. Res. 2013, 118, 5231–5246. [Google Scholar] [CrossRef]
- Pinto, O. Thunderstorm climatology of Brazil: ENSO and tropical Atlantic connections. Int. J. Climatol. 2014, 35, 871–878. [Google Scholar] [CrossRef]
- Yuan, T.; Di, Y. Variability of lightning flash and thunderstorm over eastern China and Indonesia on ENSO time scales. Atmos. Res. 2014, 152, 377–390. [Google Scholar]
- Kunkel, K.E.; Karl, T.R.; Brooks, H.; Kossin, J.; Lawrimore, J.H.; Arndt, D.; Bosart, L.; Changnon, D.; Cutter, S.L.; Doesken, N.; et al. Monitoring and understanding trends in extreme storms: State of knowledge. Bull. Am. Meteorol. Soc. 2013, 94, 499–514. [Google Scholar] [CrossRef]
- Mir, H.; Hussain, A.; Babar, Z.A. Analysis of thunderstorms activity over Pakistan during 19612–000. J. Geophys. Res. 2006, 188, 41694. [Google Scholar]
- Kunz, M.; Sander, J.; Kottmeier, C. Recent trends of thunderstorm and hailstorm frequency and their relation to atmospheric characteristics in southwest Germany. Int. J. Climatol. 2009, 29, 22832–22897. [Google Scholar] [CrossRef] [Green Version]
- Enno, S.E.; Briede, A.; Valiukas, D. Climatology of thunderstorms in the Baltic countries. Theor. Appl. Climatol. 2013, 111, 309–325. [Google Scholar] [CrossRef]
- Zhang, Q.; Ni, X.; Zhang, F. Decreasing trend in severe weather occurrence over China during the past 50 years. Sci. Rep. 2017, 7, 42310. [Google Scholar] [CrossRef] [Green Version]
- Singh, O.; Bhardwaj, P. Spatial and temporal variations in the frequency of thunderstorm days over India. Weather 2017, 99, 1–7. [Google Scholar] [CrossRef]
- Araghi, A.; Adamowski, J.; Jagharg, M.R. Detection of trends in days with thunderstorms in Iran over the past five decades. Atmos. Res. 2016, 15, 242–243. [Google Scholar] [CrossRef]
- Karmakar, S. Climatology of thunderstorm days over Bangladesh during the pre–monsoon season. Bangladesh J. Sci. Tech. 2001, 33, 1022–1031. [Google Scholar]
- Islam, A.R.M.T.; Nafiuzzaman, M.; Rifat, J. Spatiotemporal variations of thunderstorm frequency and its prediction over Bangladesh. Meteorol. Atmos. Phys. 2020. [Google Scholar] [CrossRef]
- Shahid, S. Rainfall variability and the trends of wet and dryperiods in Bangladesh. Int. J. Climatol. 2010, 3030, 2299–2313. [Google Scholar] [CrossRef]
- Karl, R.; Williams, C.N. An approach to adjusting climatological time series for discontinuous in homogeneities. J. Clim. Appl. Meteorol. 1987, 2626, 17441–17763. [Google Scholar]
- Adamowski, K.; Bougadis, J. Detection of trends in annual extreme rainfall. Hydrol. Process. 2003, 17, 35473–35560. [Google Scholar] [CrossRef]
- Wilks, D.S. Statistical Methods in the Atmospheric Science, 3rd ed.; Academic Press: Cambridge, MA, USA, 2011; p. 704. [Google Scholar]
- Singh, C.; Mohapatra, M.; Bandyopadhyay, B.K.; Tyagi, A. Thunderstorm climatology over northeast and adjoining east India. Mausam 2011, 6262, 1631–1670. [Google Scholar]
- Sahu, R.K.; Dadich, J.; Tyagi, B.; Visa, N.K.; Singh, J. Evaluating the impact of climate change in threshold values of thermodynamic indices during pre–monsoon thunderstorm season over Eastern India. Nat. Hazards 2020, 102, 1541–1569. [Google Scholar] [CrossRef]
- Bhardwaj, P.; Singh, O. Spatial and temporal analysis of thunderstorm and rainfall activity over India. Atmosfera 2018, 3131, 2552–2584. [Google Scholar] [CrossRef]
- Sahu, R.K.; Dadich, J.; Tyagi, B.; Vissa, N.K. Trends of thermodynamic indices thresholds over two tropical stations of north–east India during pre–monsoon thunderstorms. J. Atmos. Solar Ter. Phys. 2020, 211, 105472. [Google Scholar] [CrossRef]
- Glazer, R.; Torres–Alavez, J.A.; Coppola, E.; Das, S.; Ashfaq, M.; Sines, T. Projected changes to Severe Thunderstorm environments as a result of 21st century warming from RegCM CORDEX–CORE simulations. EGU Gen. Assem. 2020, 2020, 970. [Google Scholar]
- Krishnamurthy, L.; Krishnamurthy, V. Influence of PDO on South Asian monsoon and monsoon–ENSO relation. Clim. Dyn. 2013, 42, 91. [Google Scholar] [CrossRef]
- Dash, S.K.; Jenamani, R.K.; Shekhar, M.S. On the decreasing frequency of monsoon depressions over the Indian region. Curr. Sci. India 2004, 86, 14041–14411. [Google Scholar]


| Climate Modes | Years |
|---|---|
| El Niño | 1976, 1977, 1986, 1987, 1988, 1997, 1998, 2006, 2007, 2014 |
| La Niña | 1975, 1983, 1984, 1985, 1989, 1996, 1999, 2000, 2001, 2005, 2008, 2010, 2012, 2013 |
| Normal | 1978, 1991, 1992, 1994, 1995, 2002, 2003, 2004, 2005, 2009, 2015, 2016 |
| IOD–positive | 1982, 1983, 1994, 1997, 2006, 2012,2015 |
| IOD–negative | 1975, 1981, 1989, 1992, 1996, 1998, 2010, 2014, 2016 |
Publisher’s Note: MDPI stays neutral with regard to jurisdictional claims in published maps and institutional affiliations. |
© 2020 by the authors. Licensee MDPI, Basel, Switzerland. This article is an open access article distributed under the terms and conditions of the Creative Commons Attribution (CC BY) license (http://creativecommons.org/licenses/by/4.0/).
Share and Cite
Wahiduzzaman, M.; Islam, A.R.M.T.; Luo, J.; Shahid, S.; Uddin, M.J.; Shimul, S.M.; Sattar, M.A. Trends and Variabilities of Thunderstorm Days over Bangladesh on the ENSO and IOD Timescales. Atmosphere 2020, 11, 1176. https://0-doi-org.brum.beds.ac.uk/10.3390/atmos11111176
Wahiduzzaman M, Islam ARMT, Luo J, Shahid S, Uddin MJ, Shimul SM, Sattar MA. Trends and Variabilities of Thunderstorm Days over Bangladesh on the ENSO and IOD Timescales. Atmosphere. 2020; 11(11):1176. https://0-doi-org.brum.beds.ac.uk/10.3390/atmos11111176
Chicago/Turabian StyleWahiduzzaman, Md, Abu Reza Md. Towfiqul Islam, Jing–Jia Luo, Shamsuddin Shahid, Md. Jalal Uddin, Sayed Majadin Shimul, and Md Abdus Sattar. 2020. "Trends and Variabilities of Thunderstorm Days over Bangladesh on the ENSO and IOD Timescales" Atmosphere 11, no. 11: 1176. https://0-doi-org.brum.beds.ac.uk/10.3390/atmos11111176