Rainfall Threshold for Shallow Landslides Initiation and Analysis of Long-Term Rainfall Trends in a Mediterranean Area


Abstract
:1. Introduction
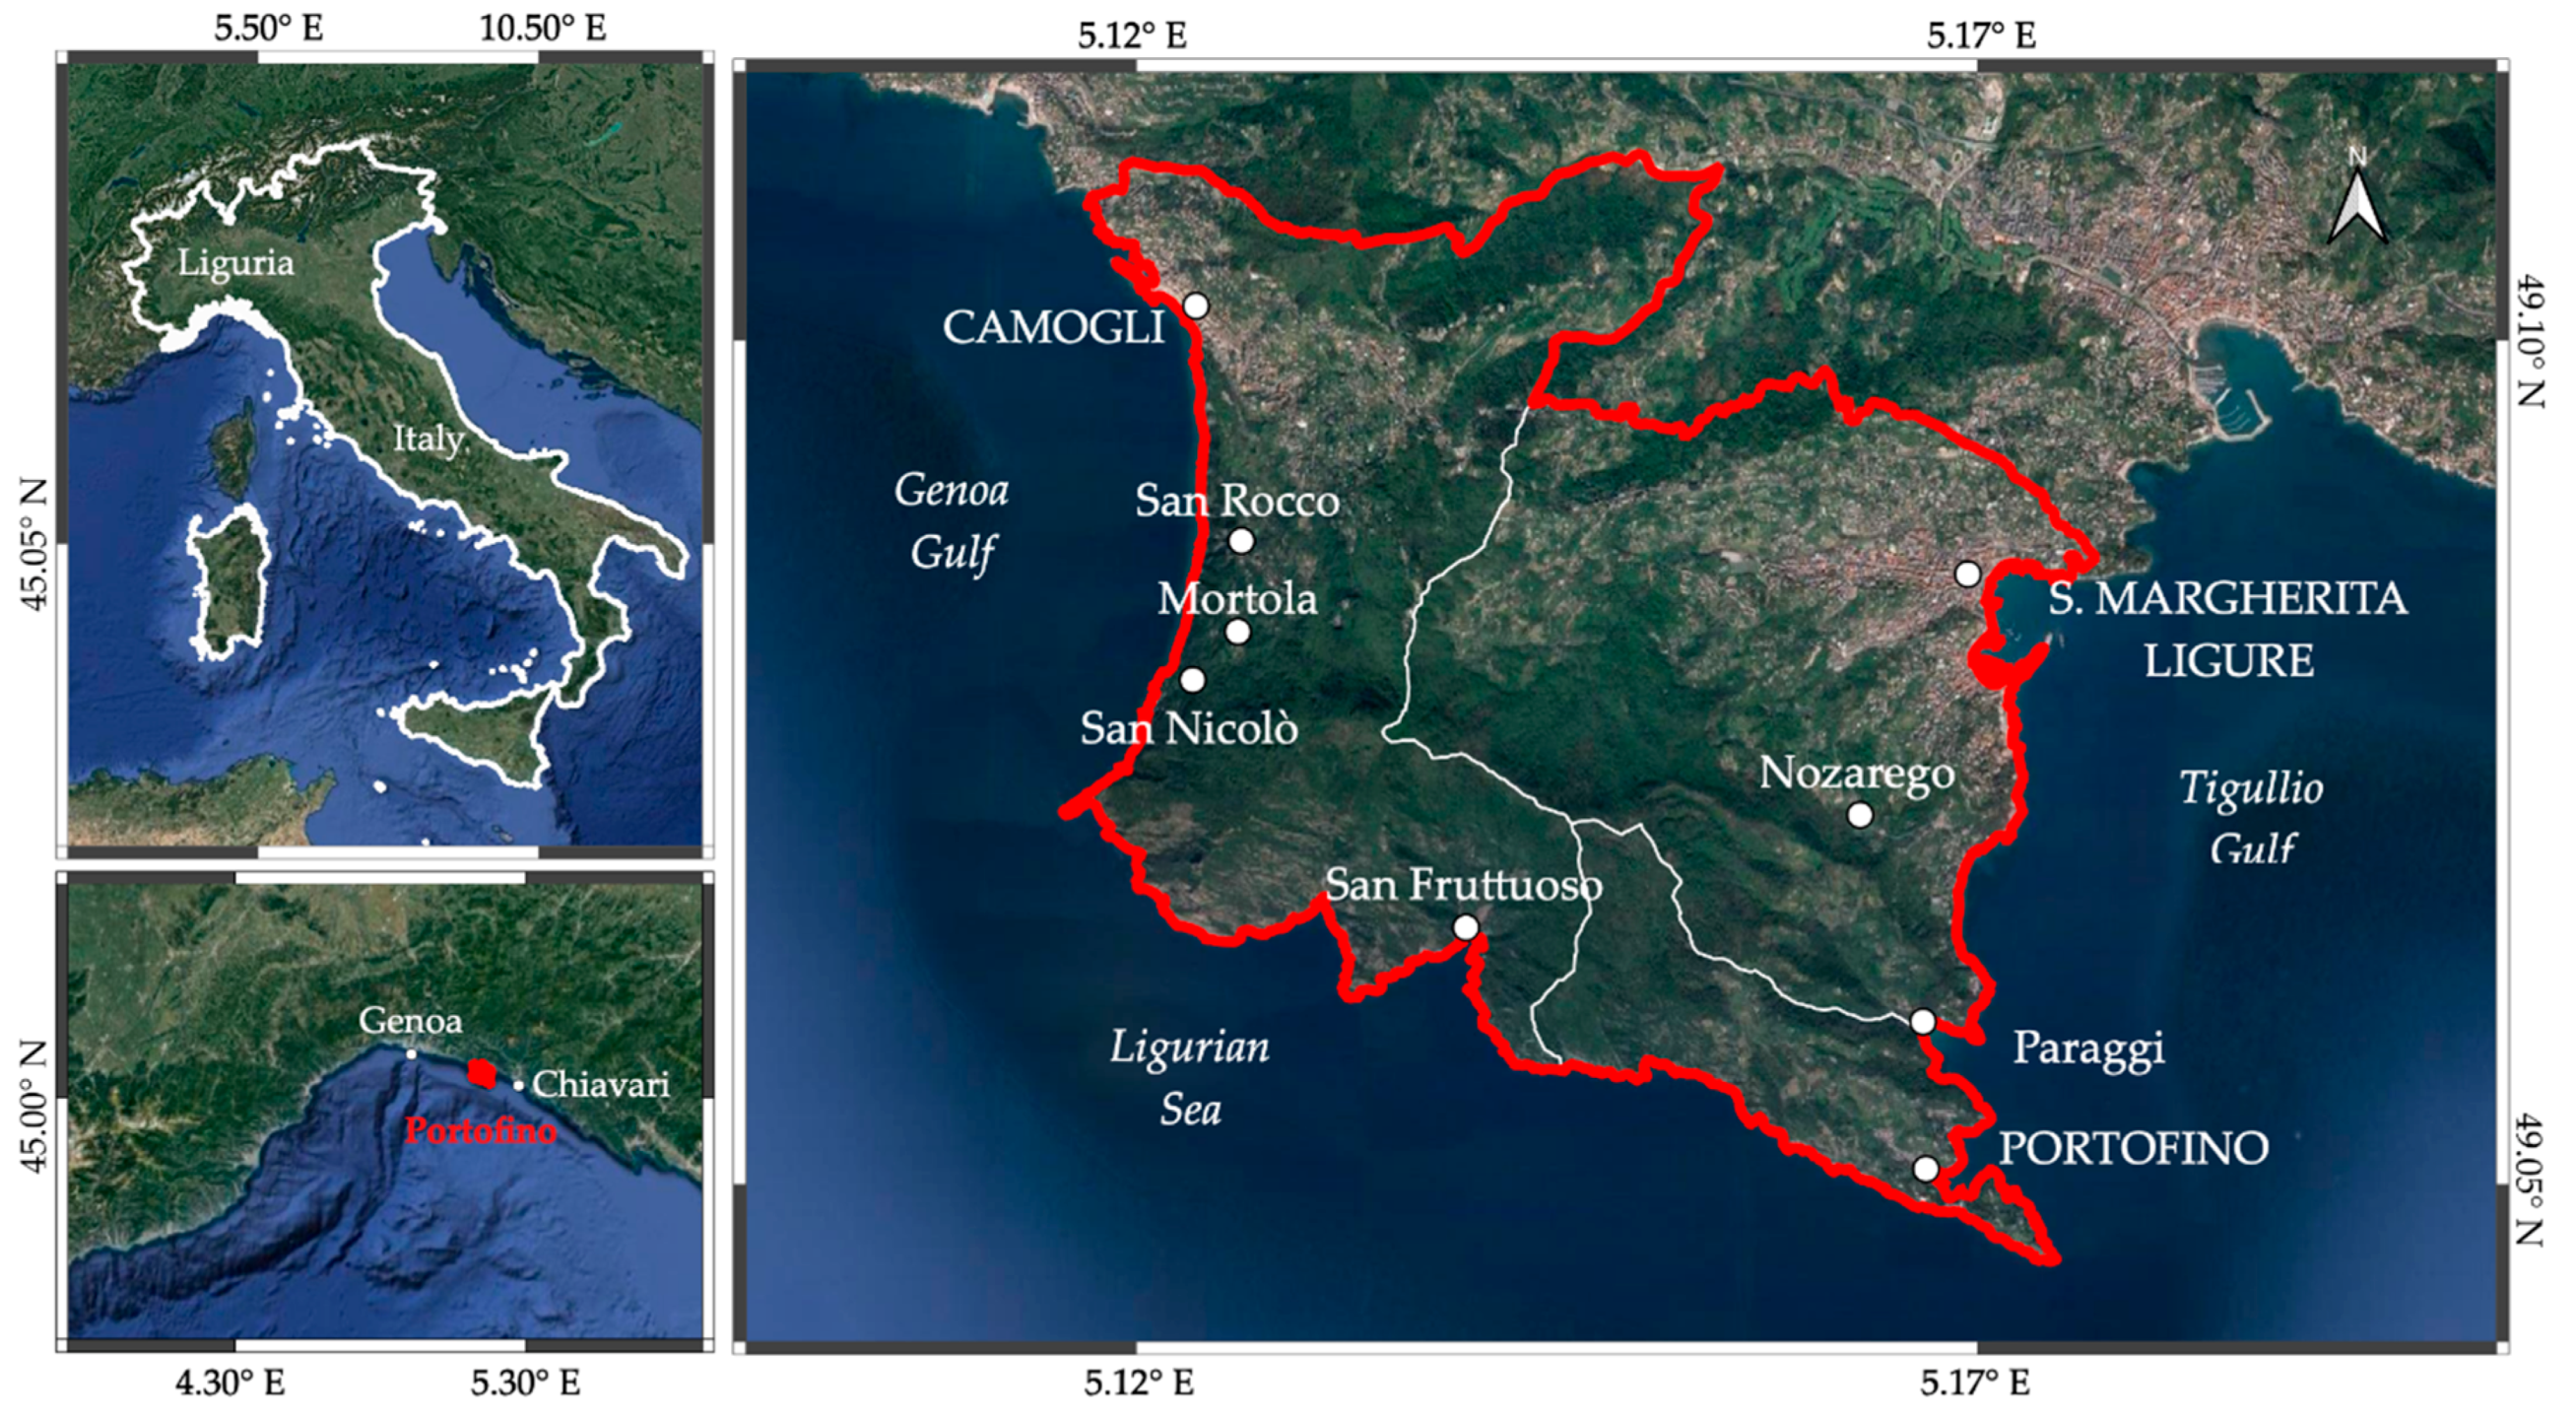
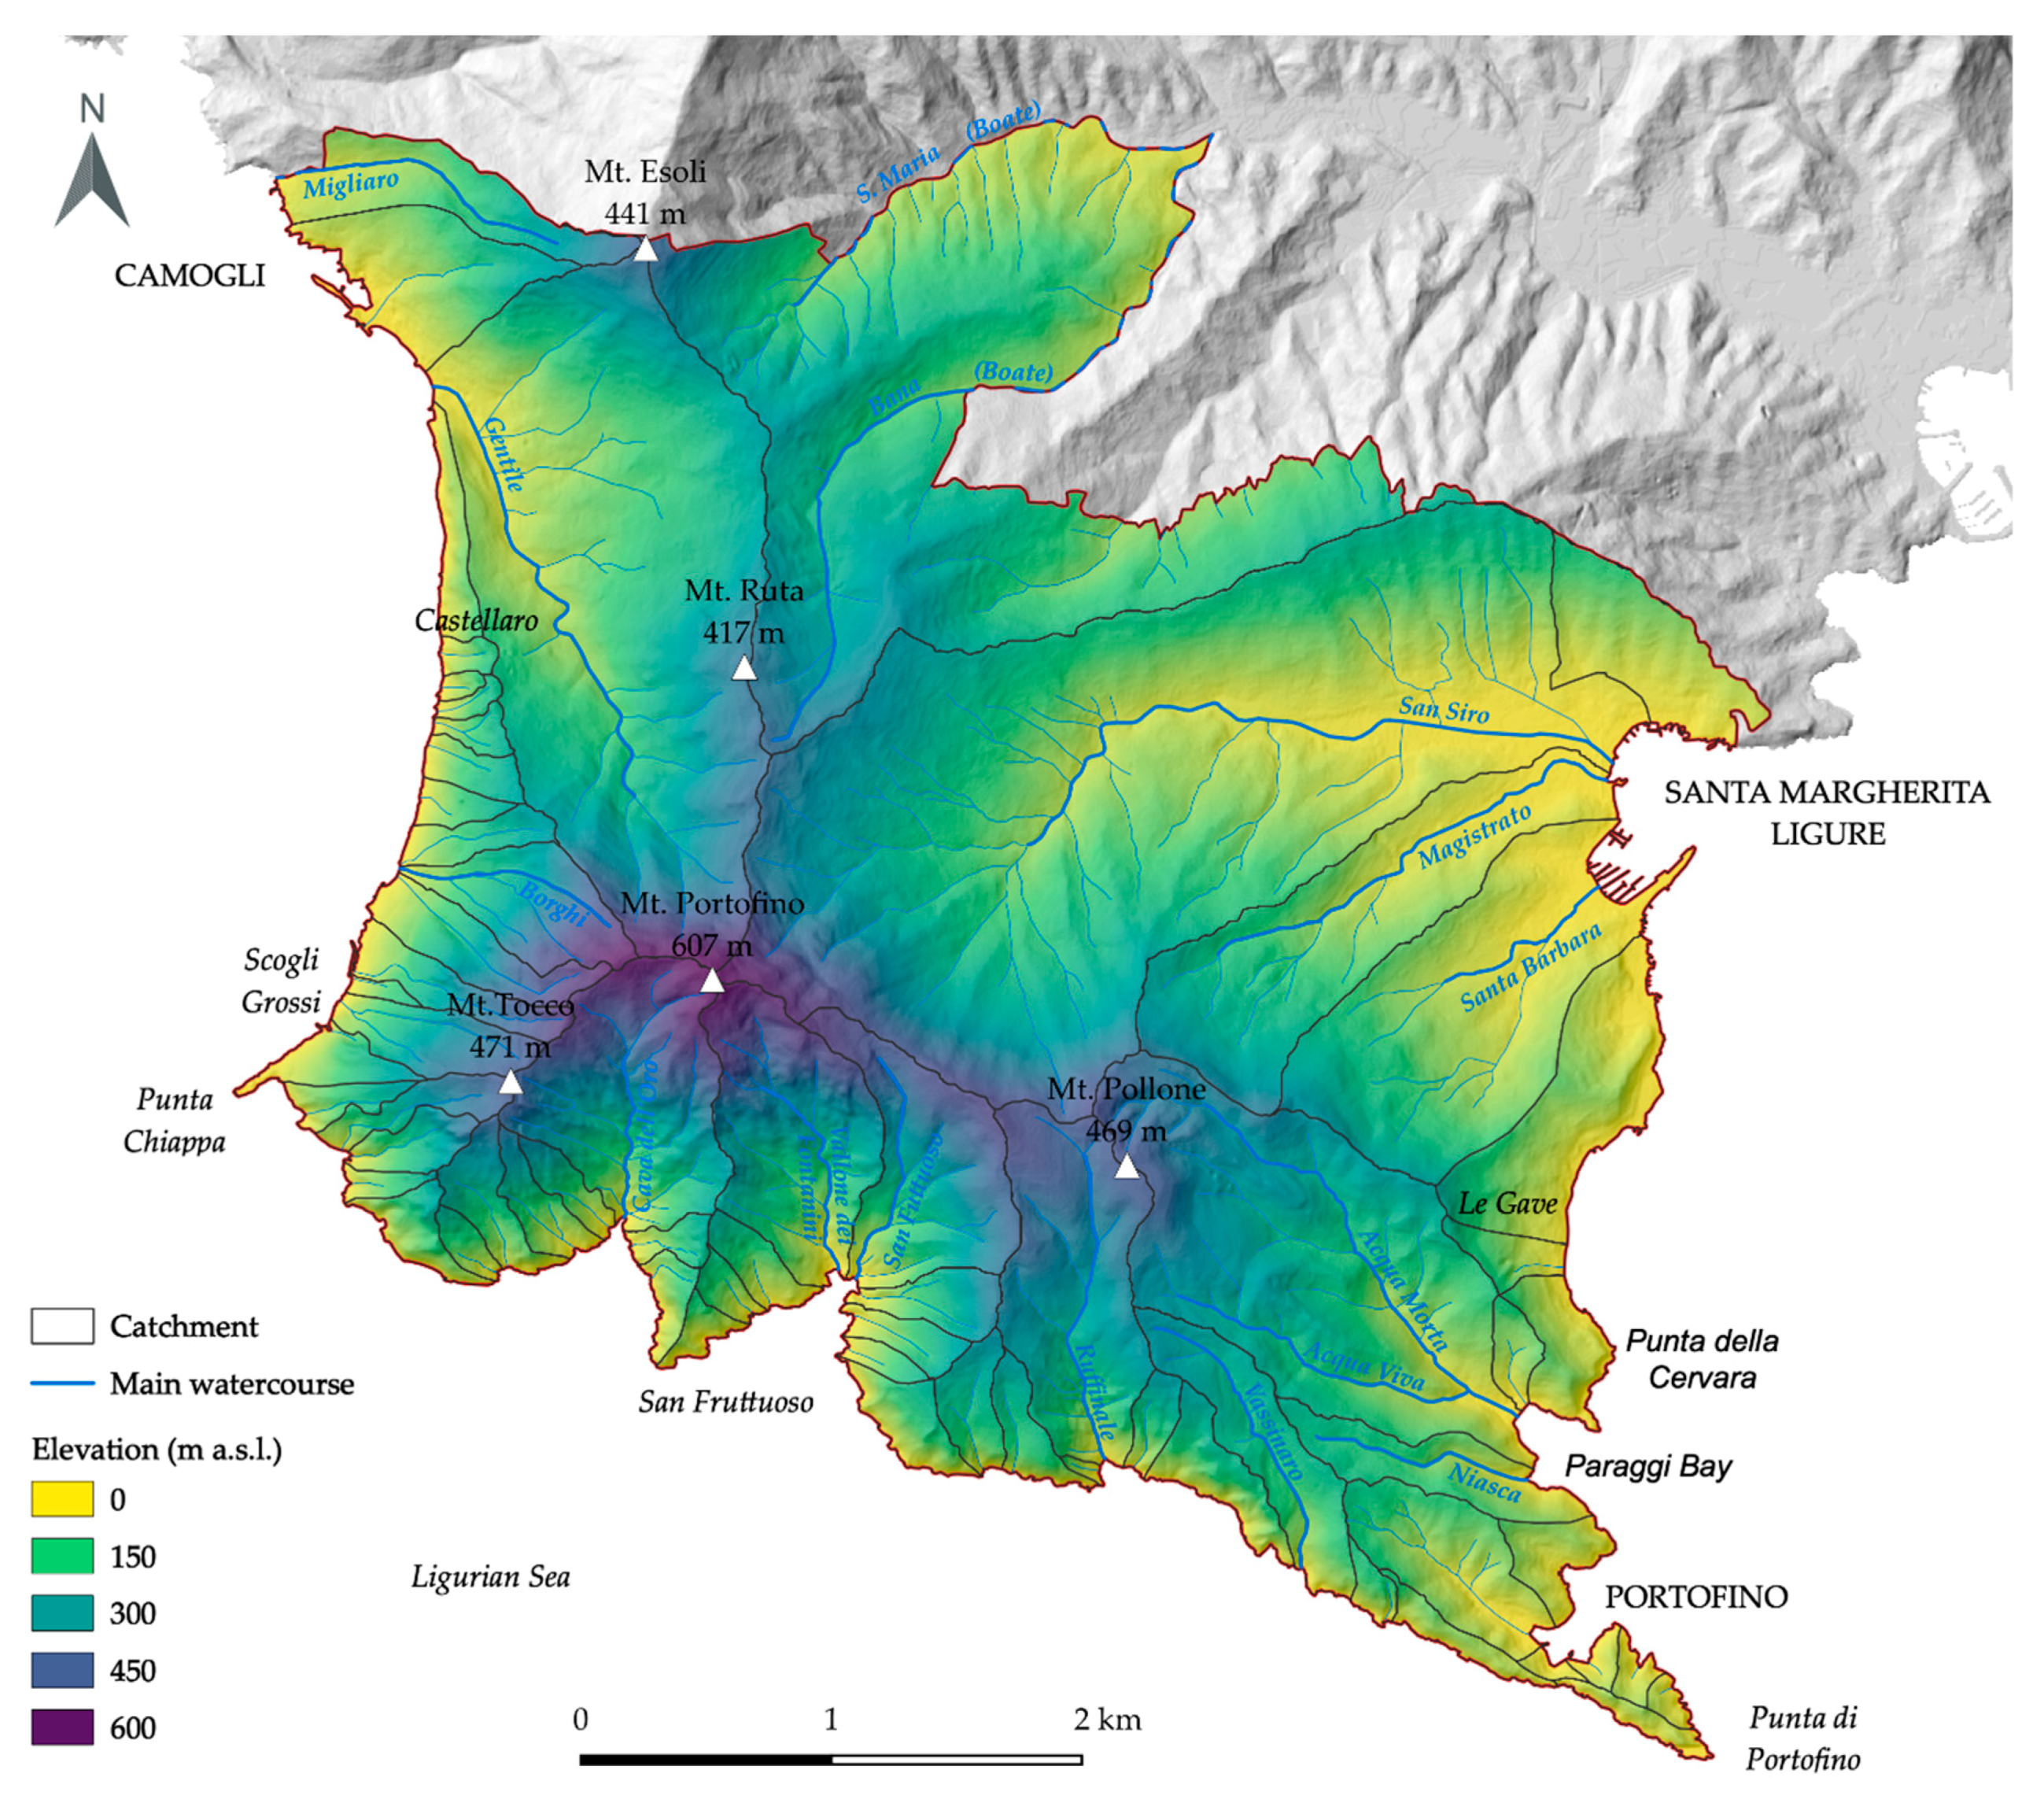
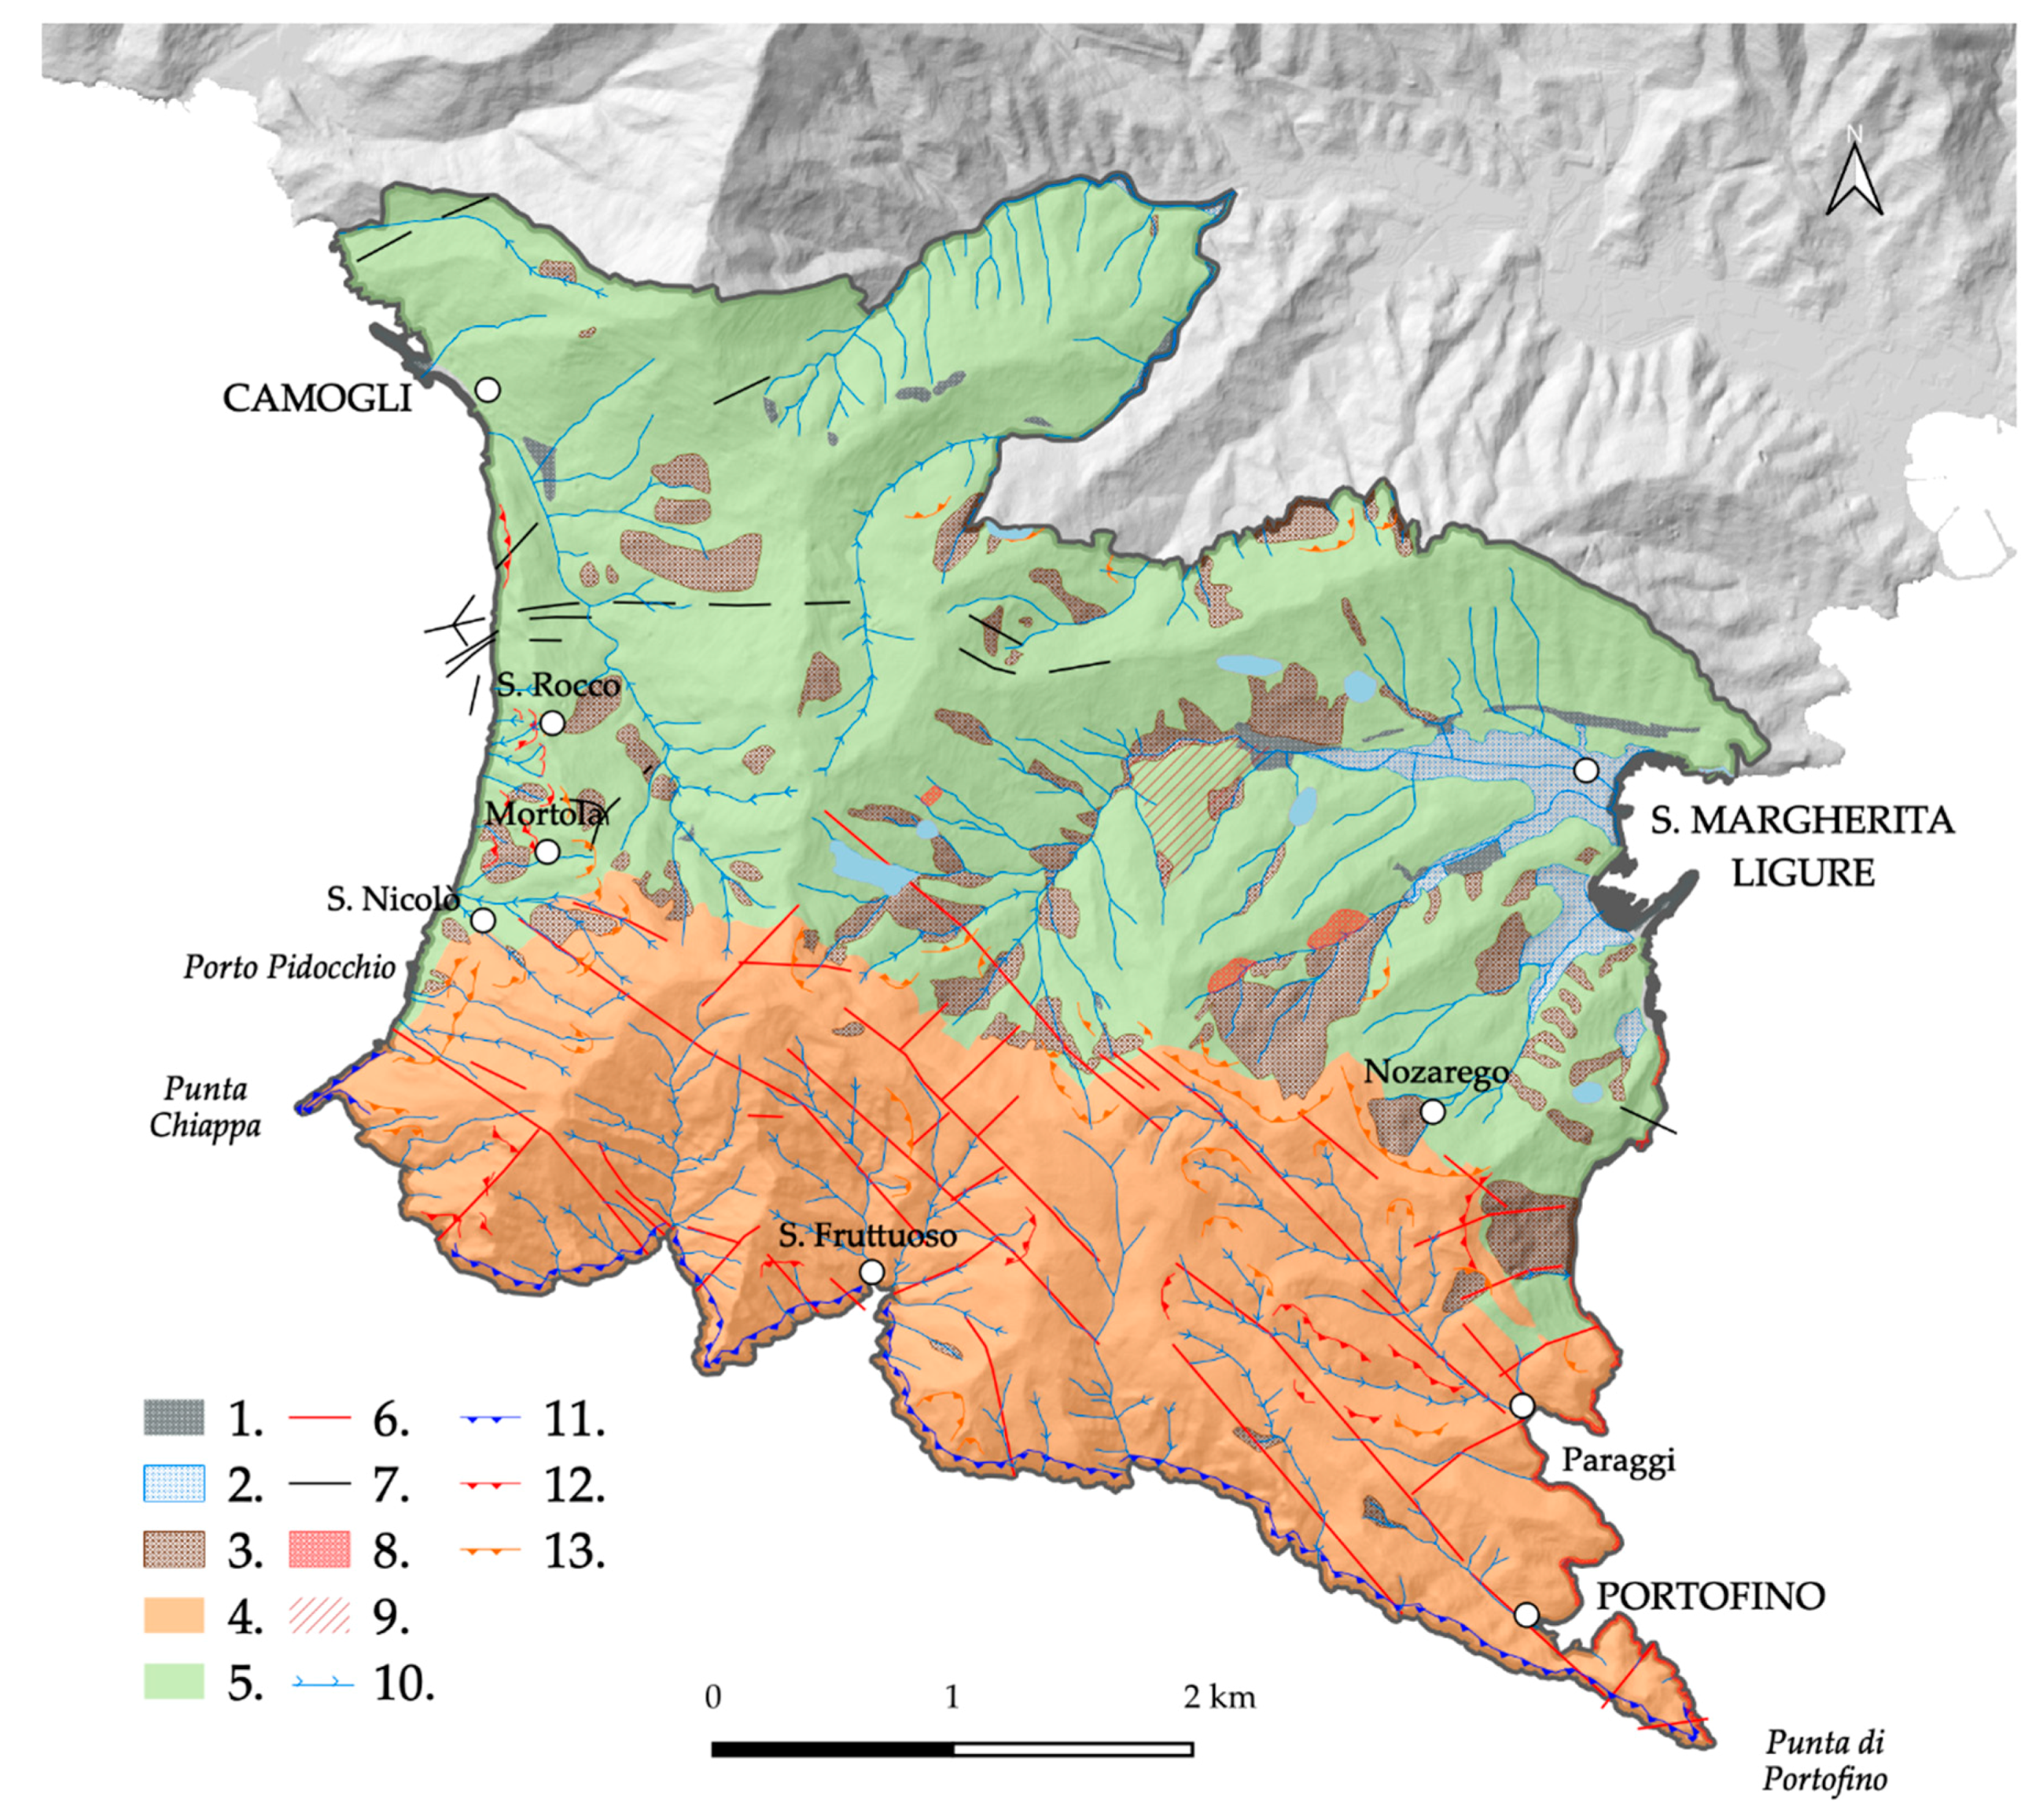
2. Study Area
2.1. General Settings
2.2. Meteorological Settings
3. Materials and Methods
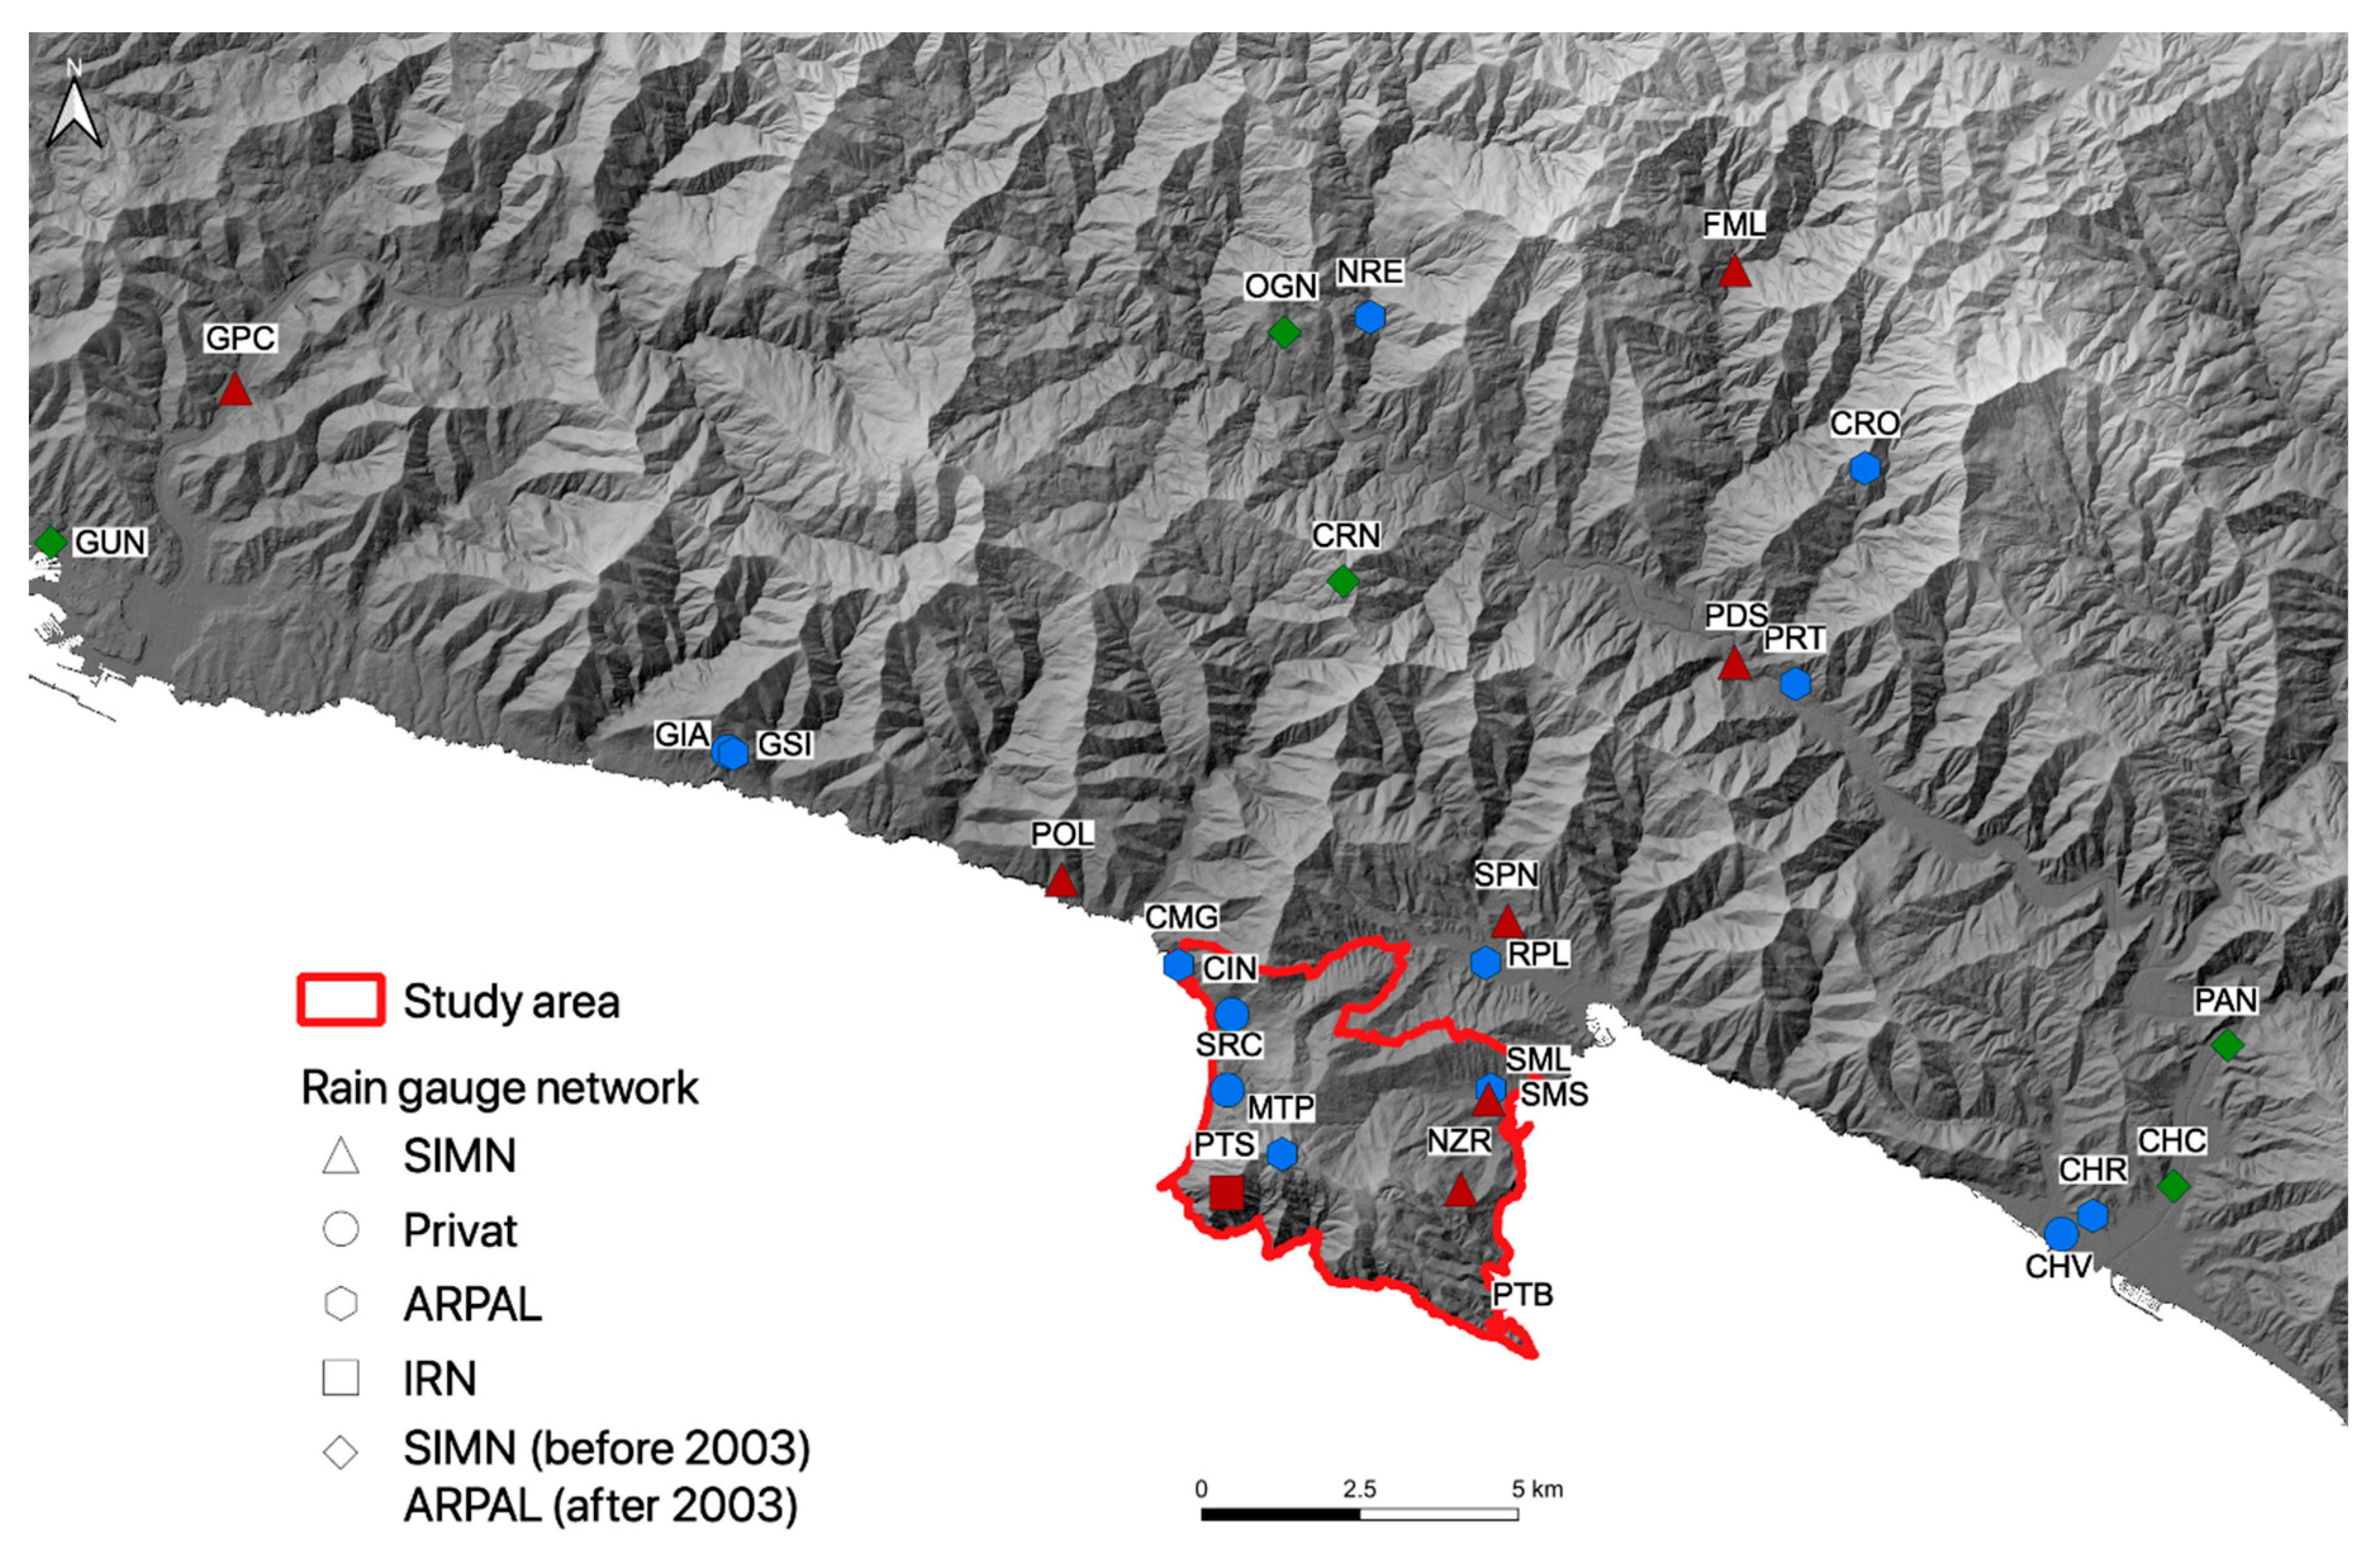
3.1. Data
3.2. Rainfall Threshold
3.3. Rainfall Historical Series Trend Evaluation
- Chiavari: 1877–2019 for annual rainfall and rainy days; 1932–2019 for hourly maximum.
- Genova University: 1833–2019 for annual rainfall and rainy days.
- Genova Ponte Carrega: 1939–2019 for hourly maximum.
4. Results
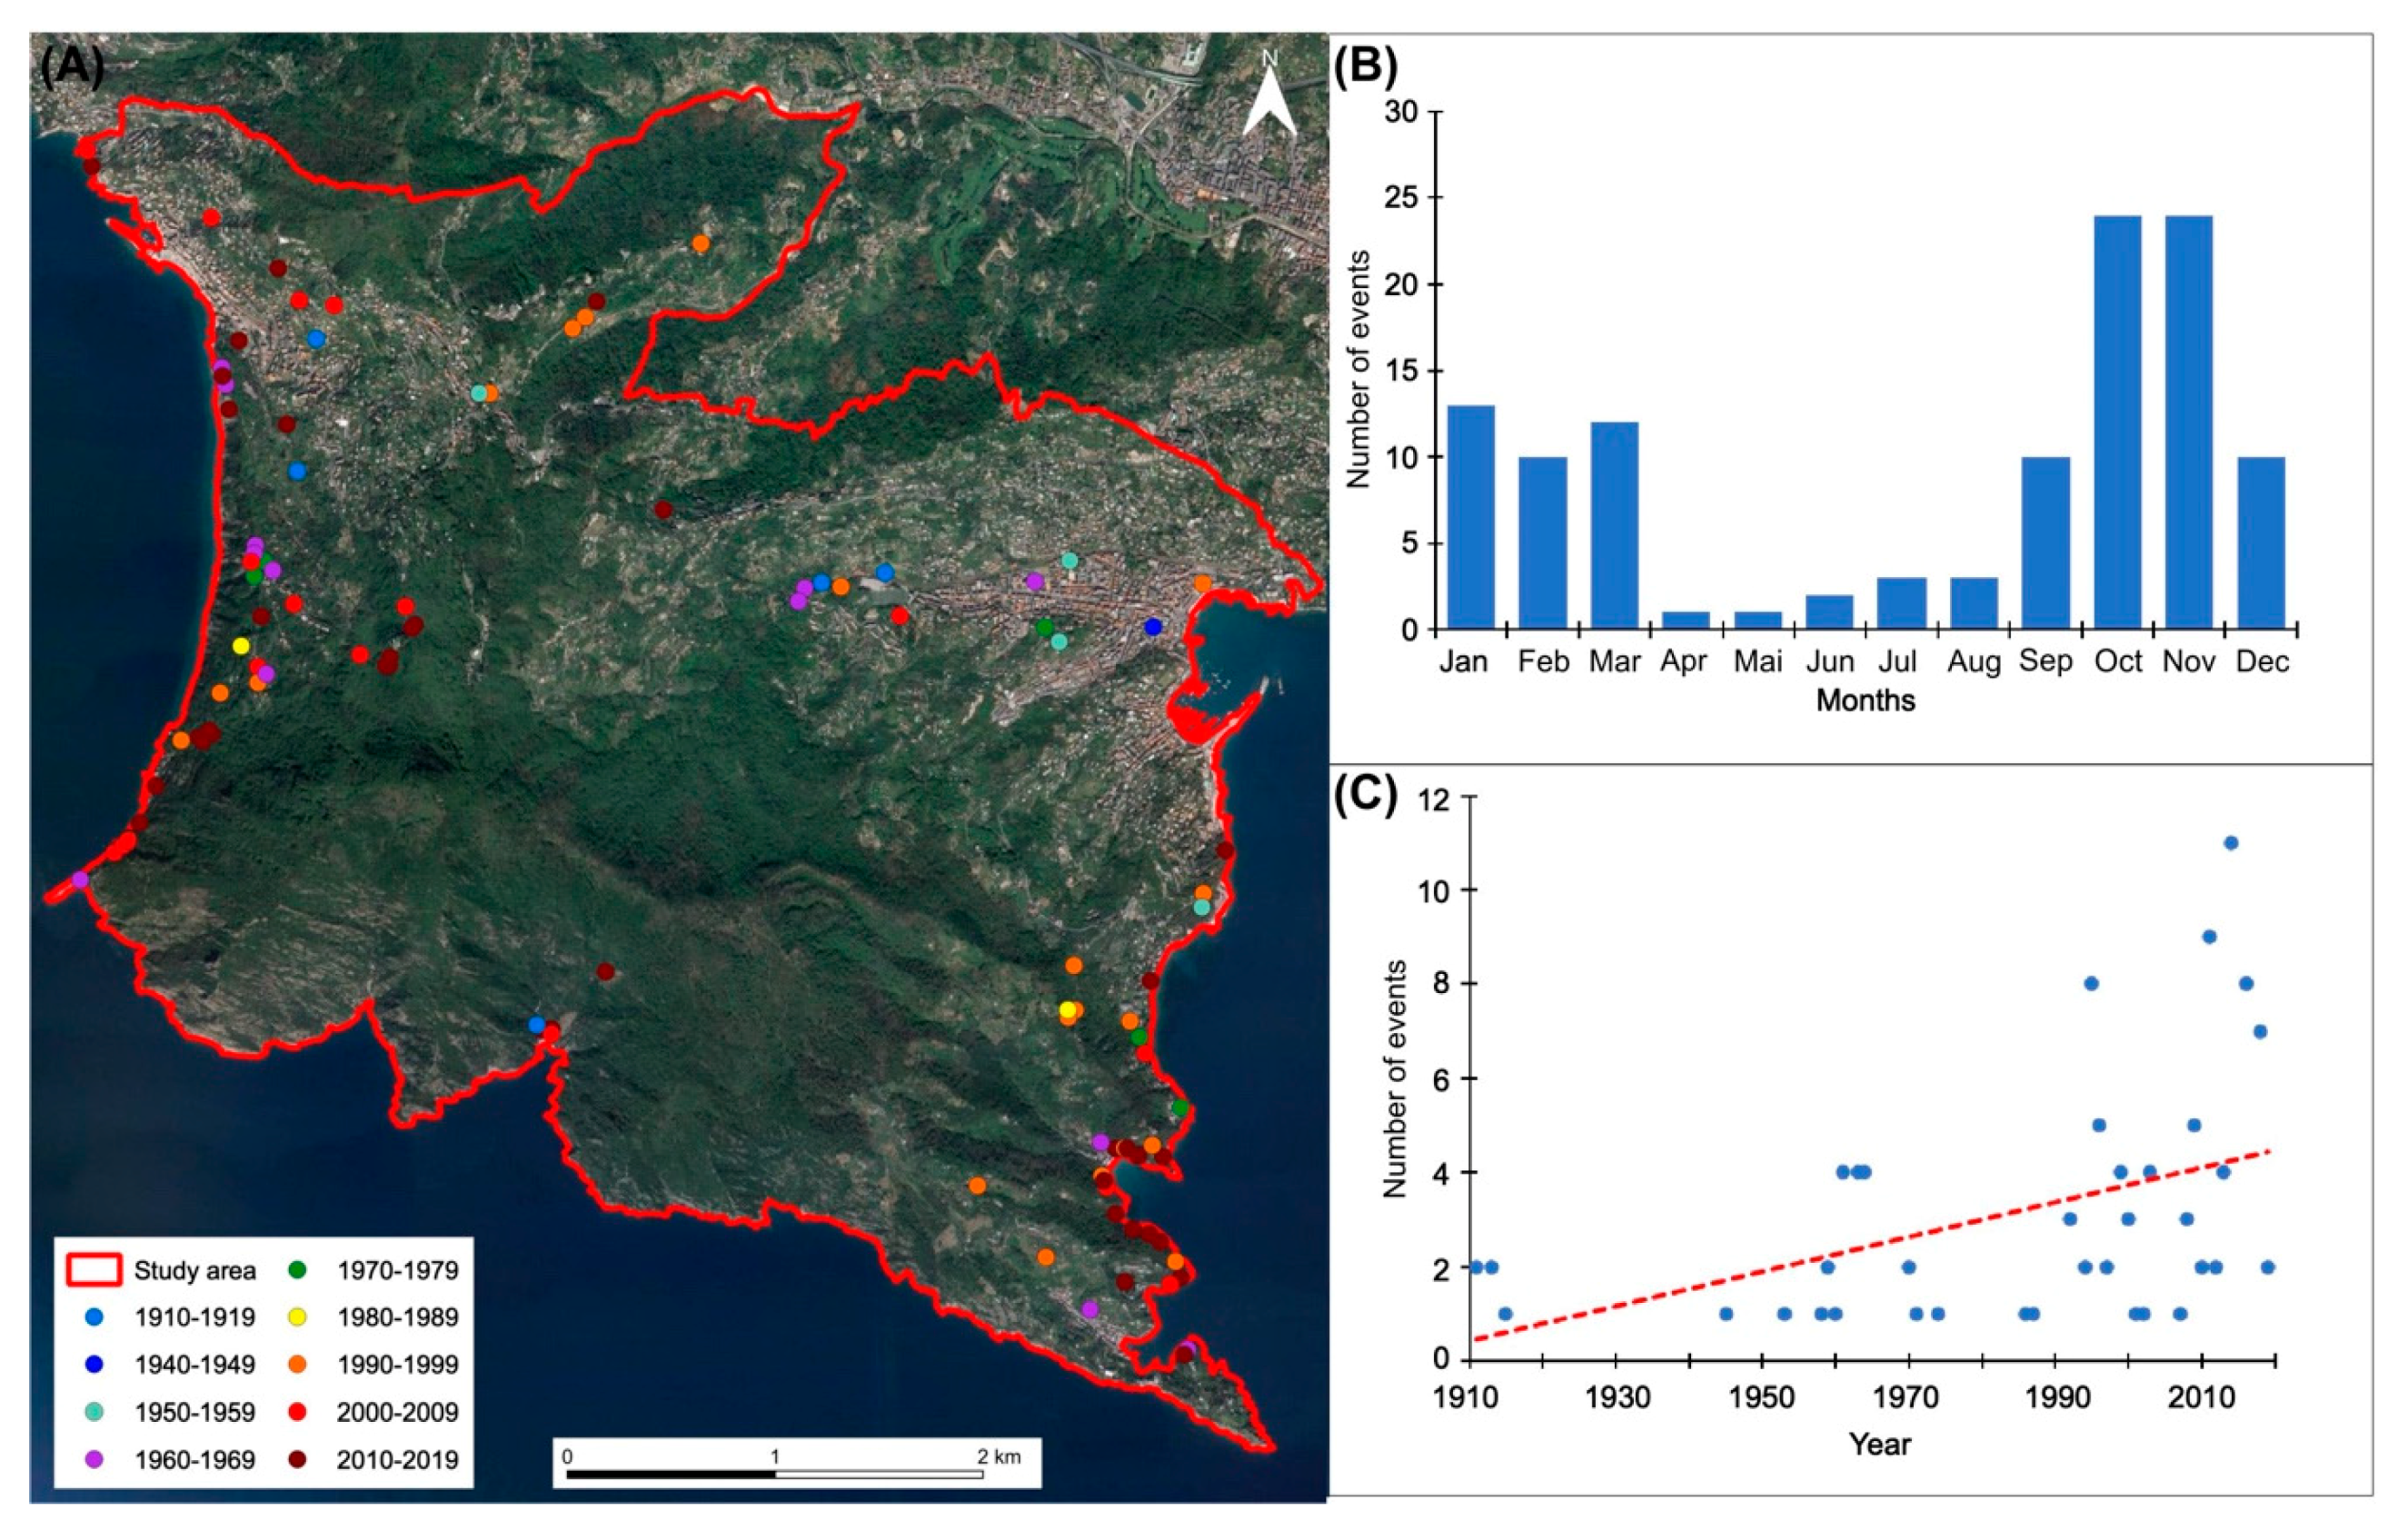
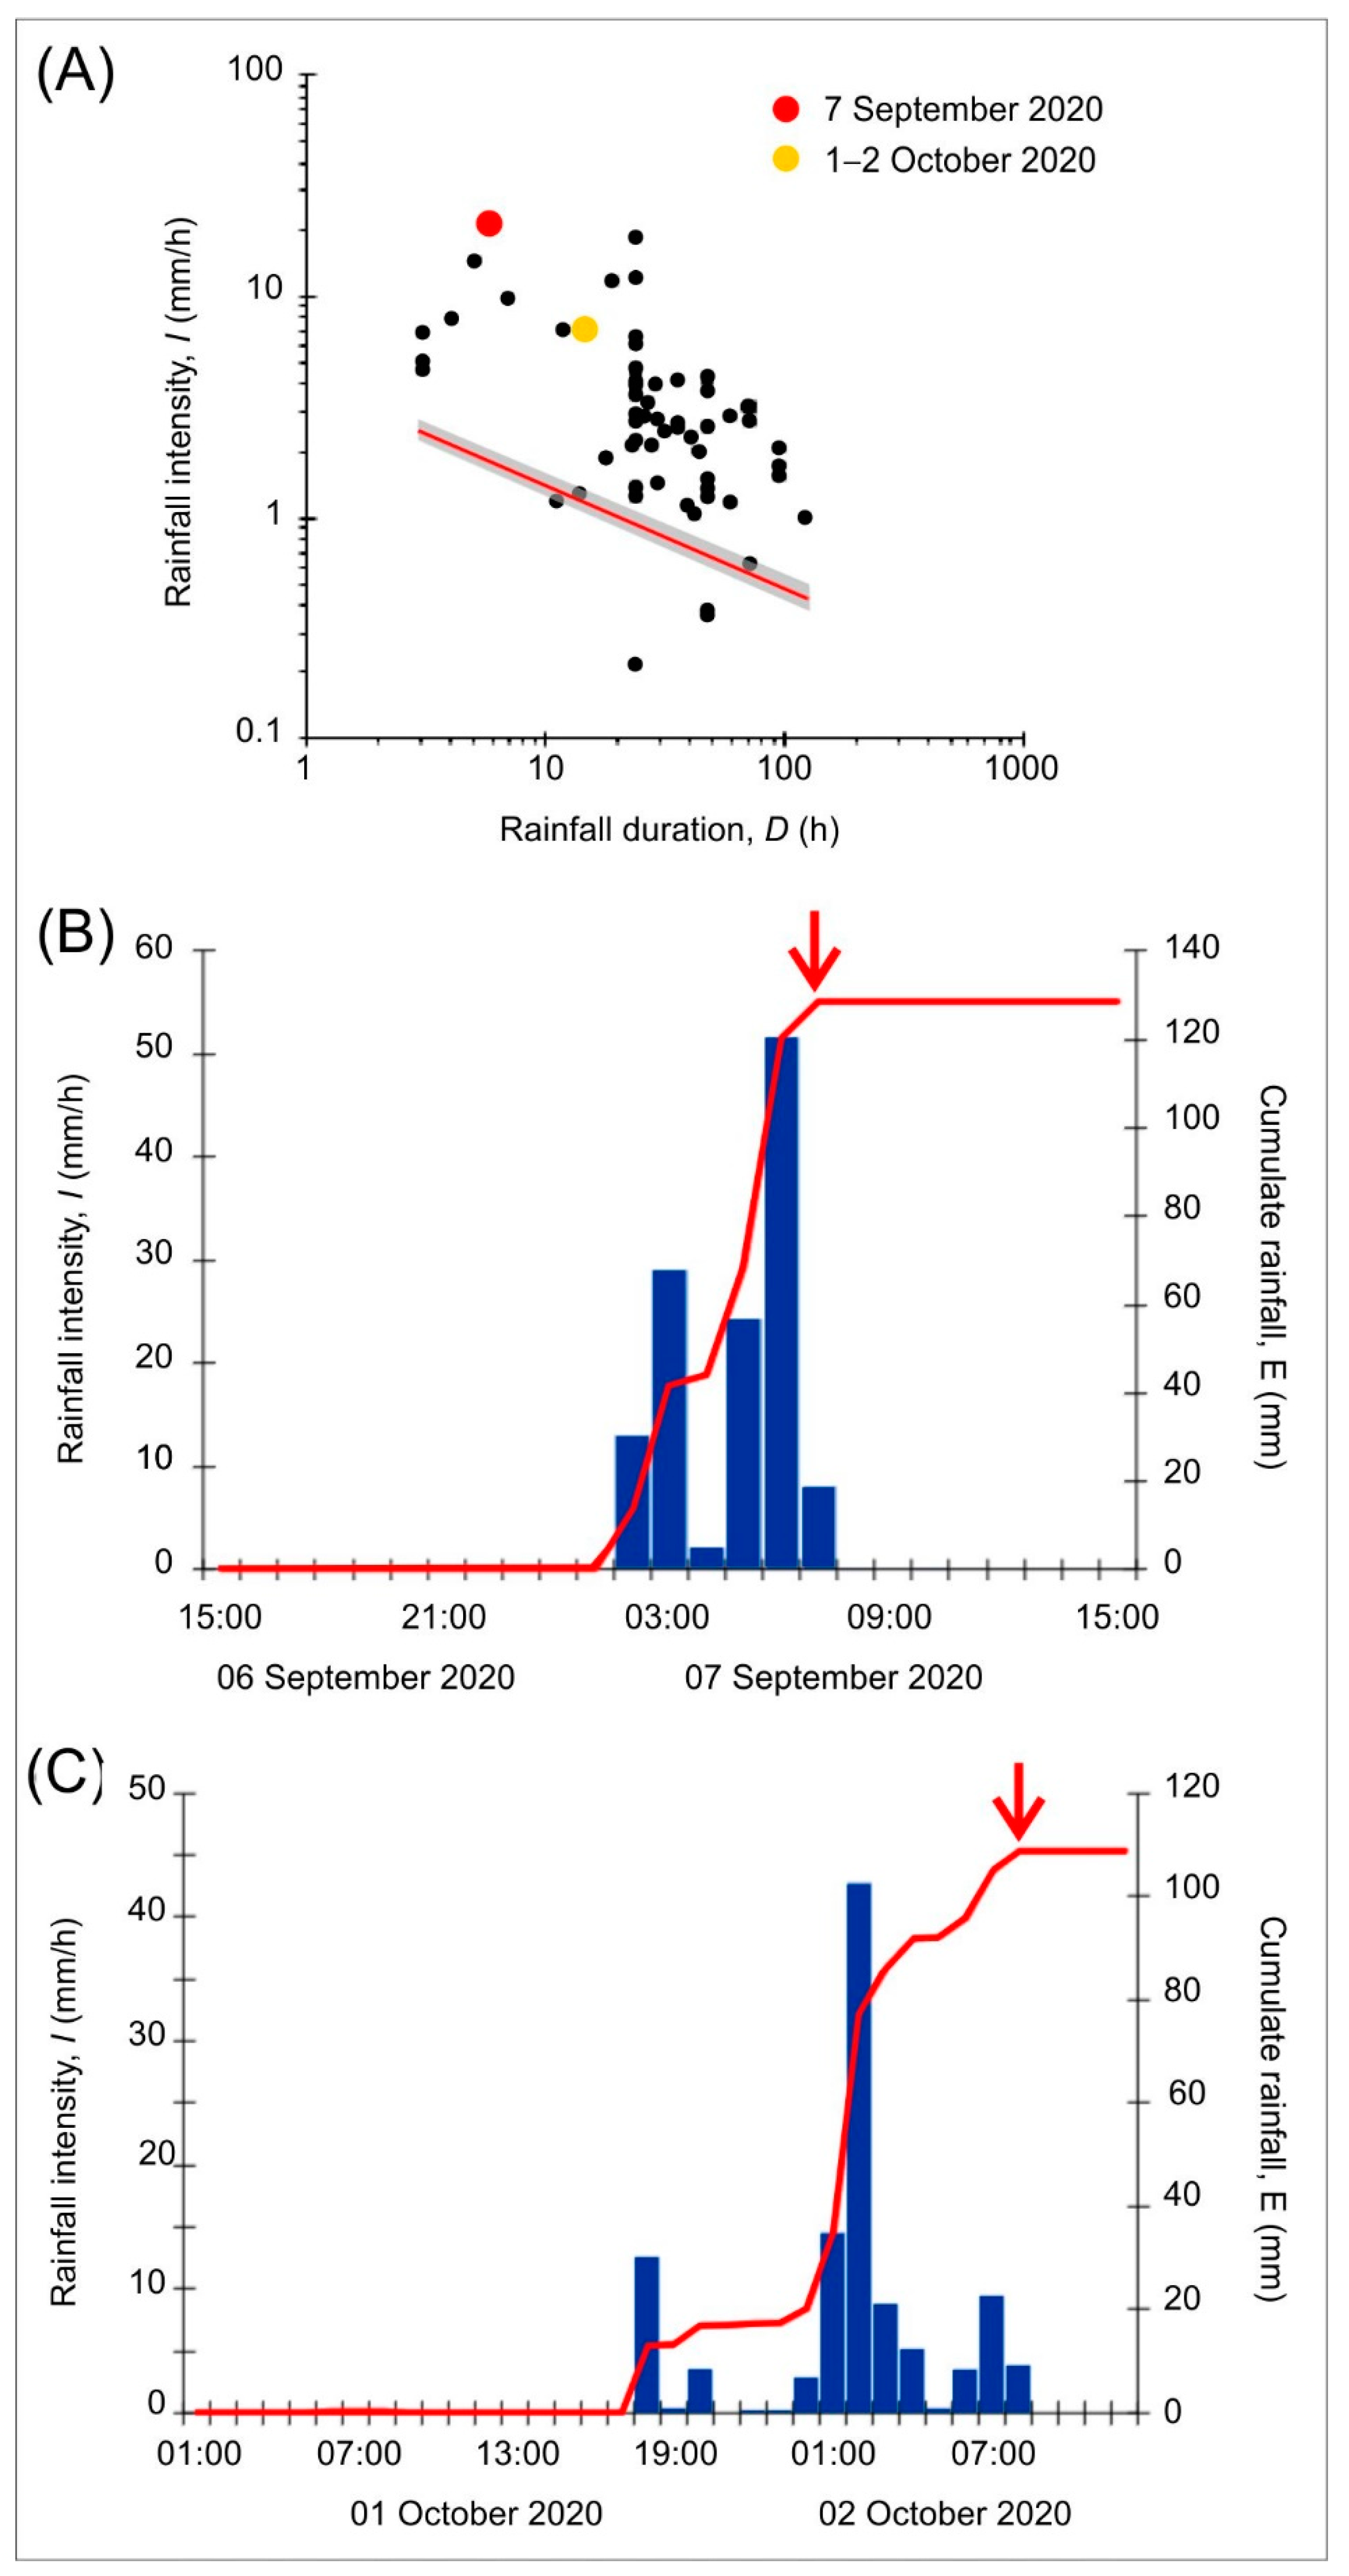
4.1. Rainfall Events and Shallow Landslides
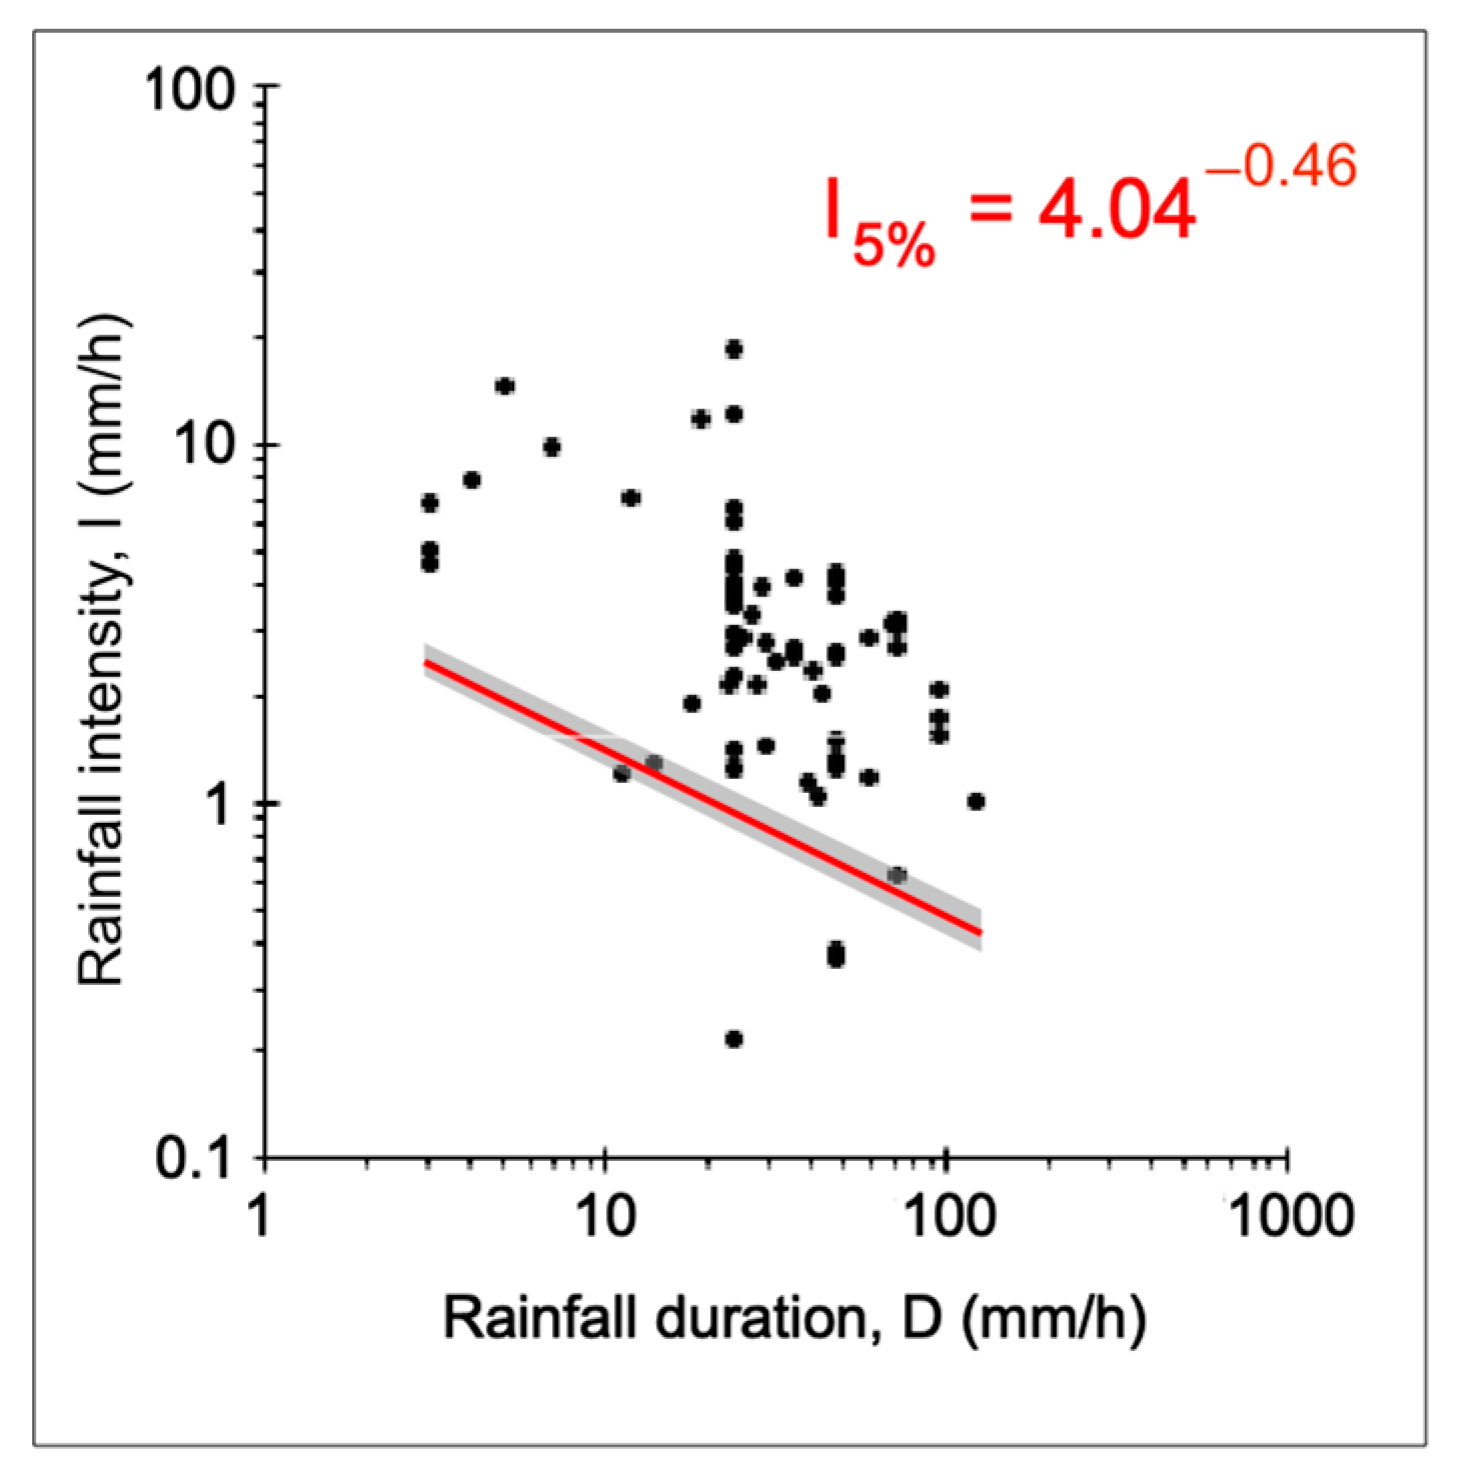
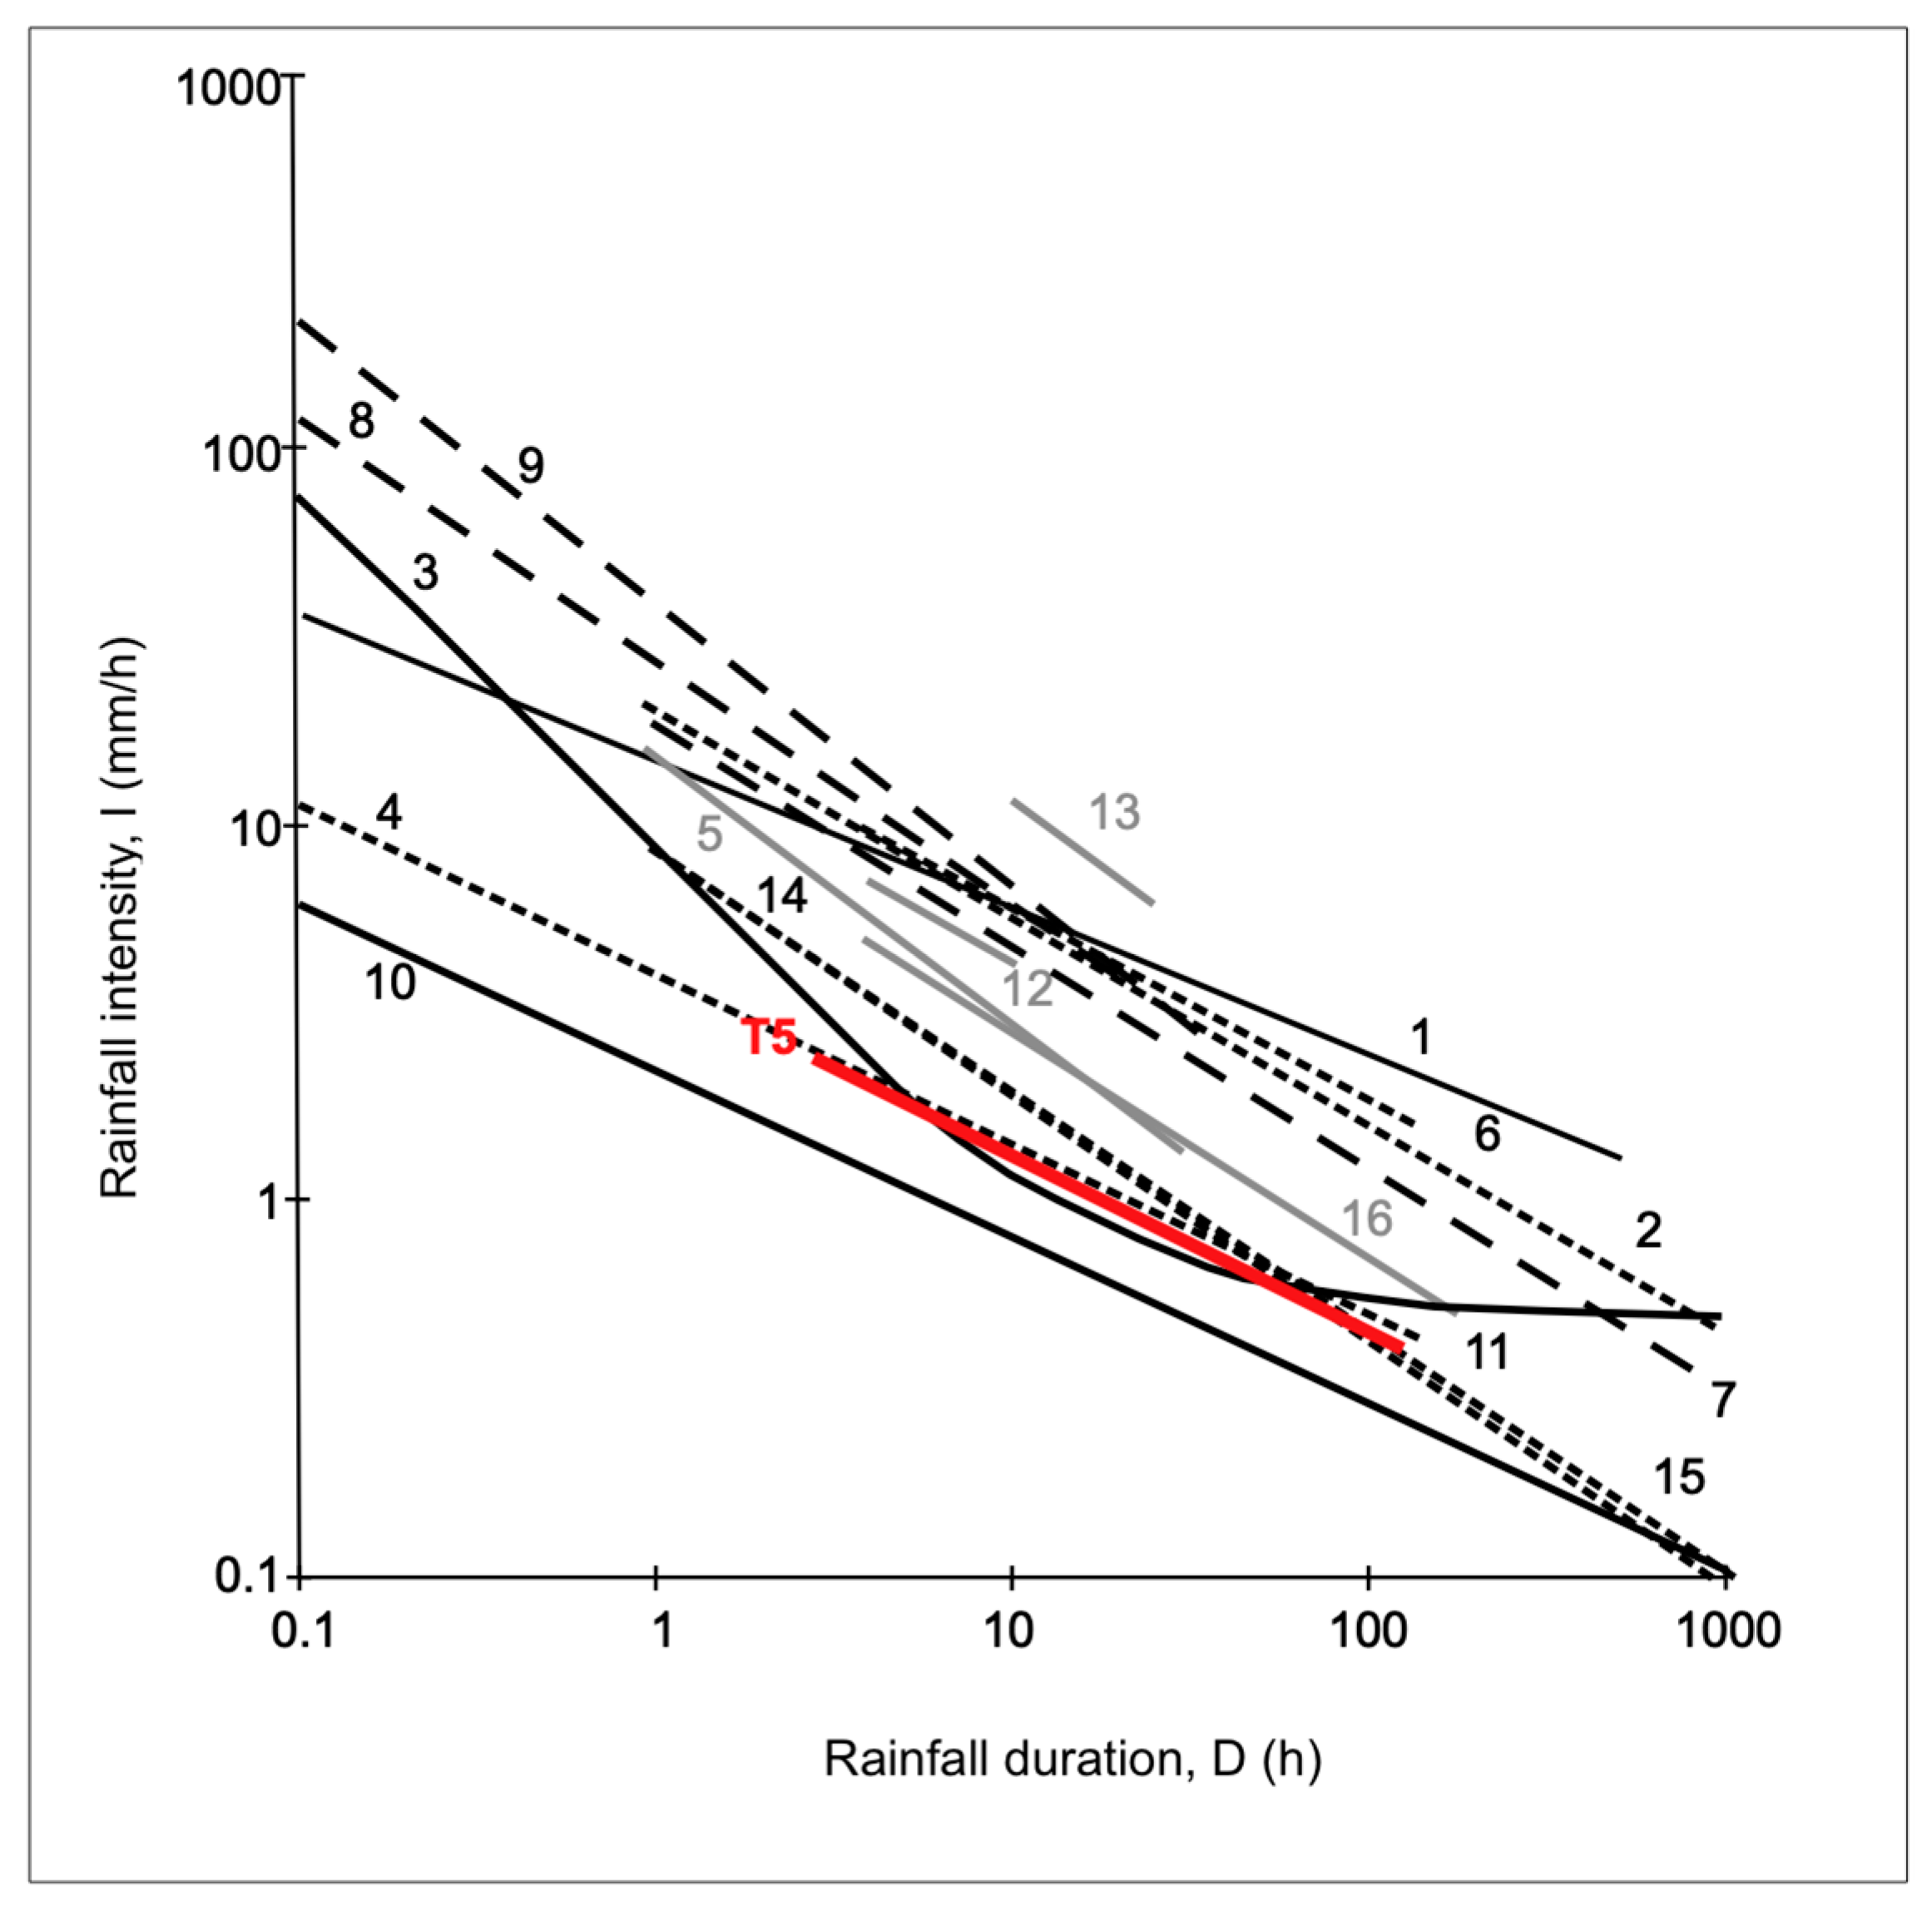
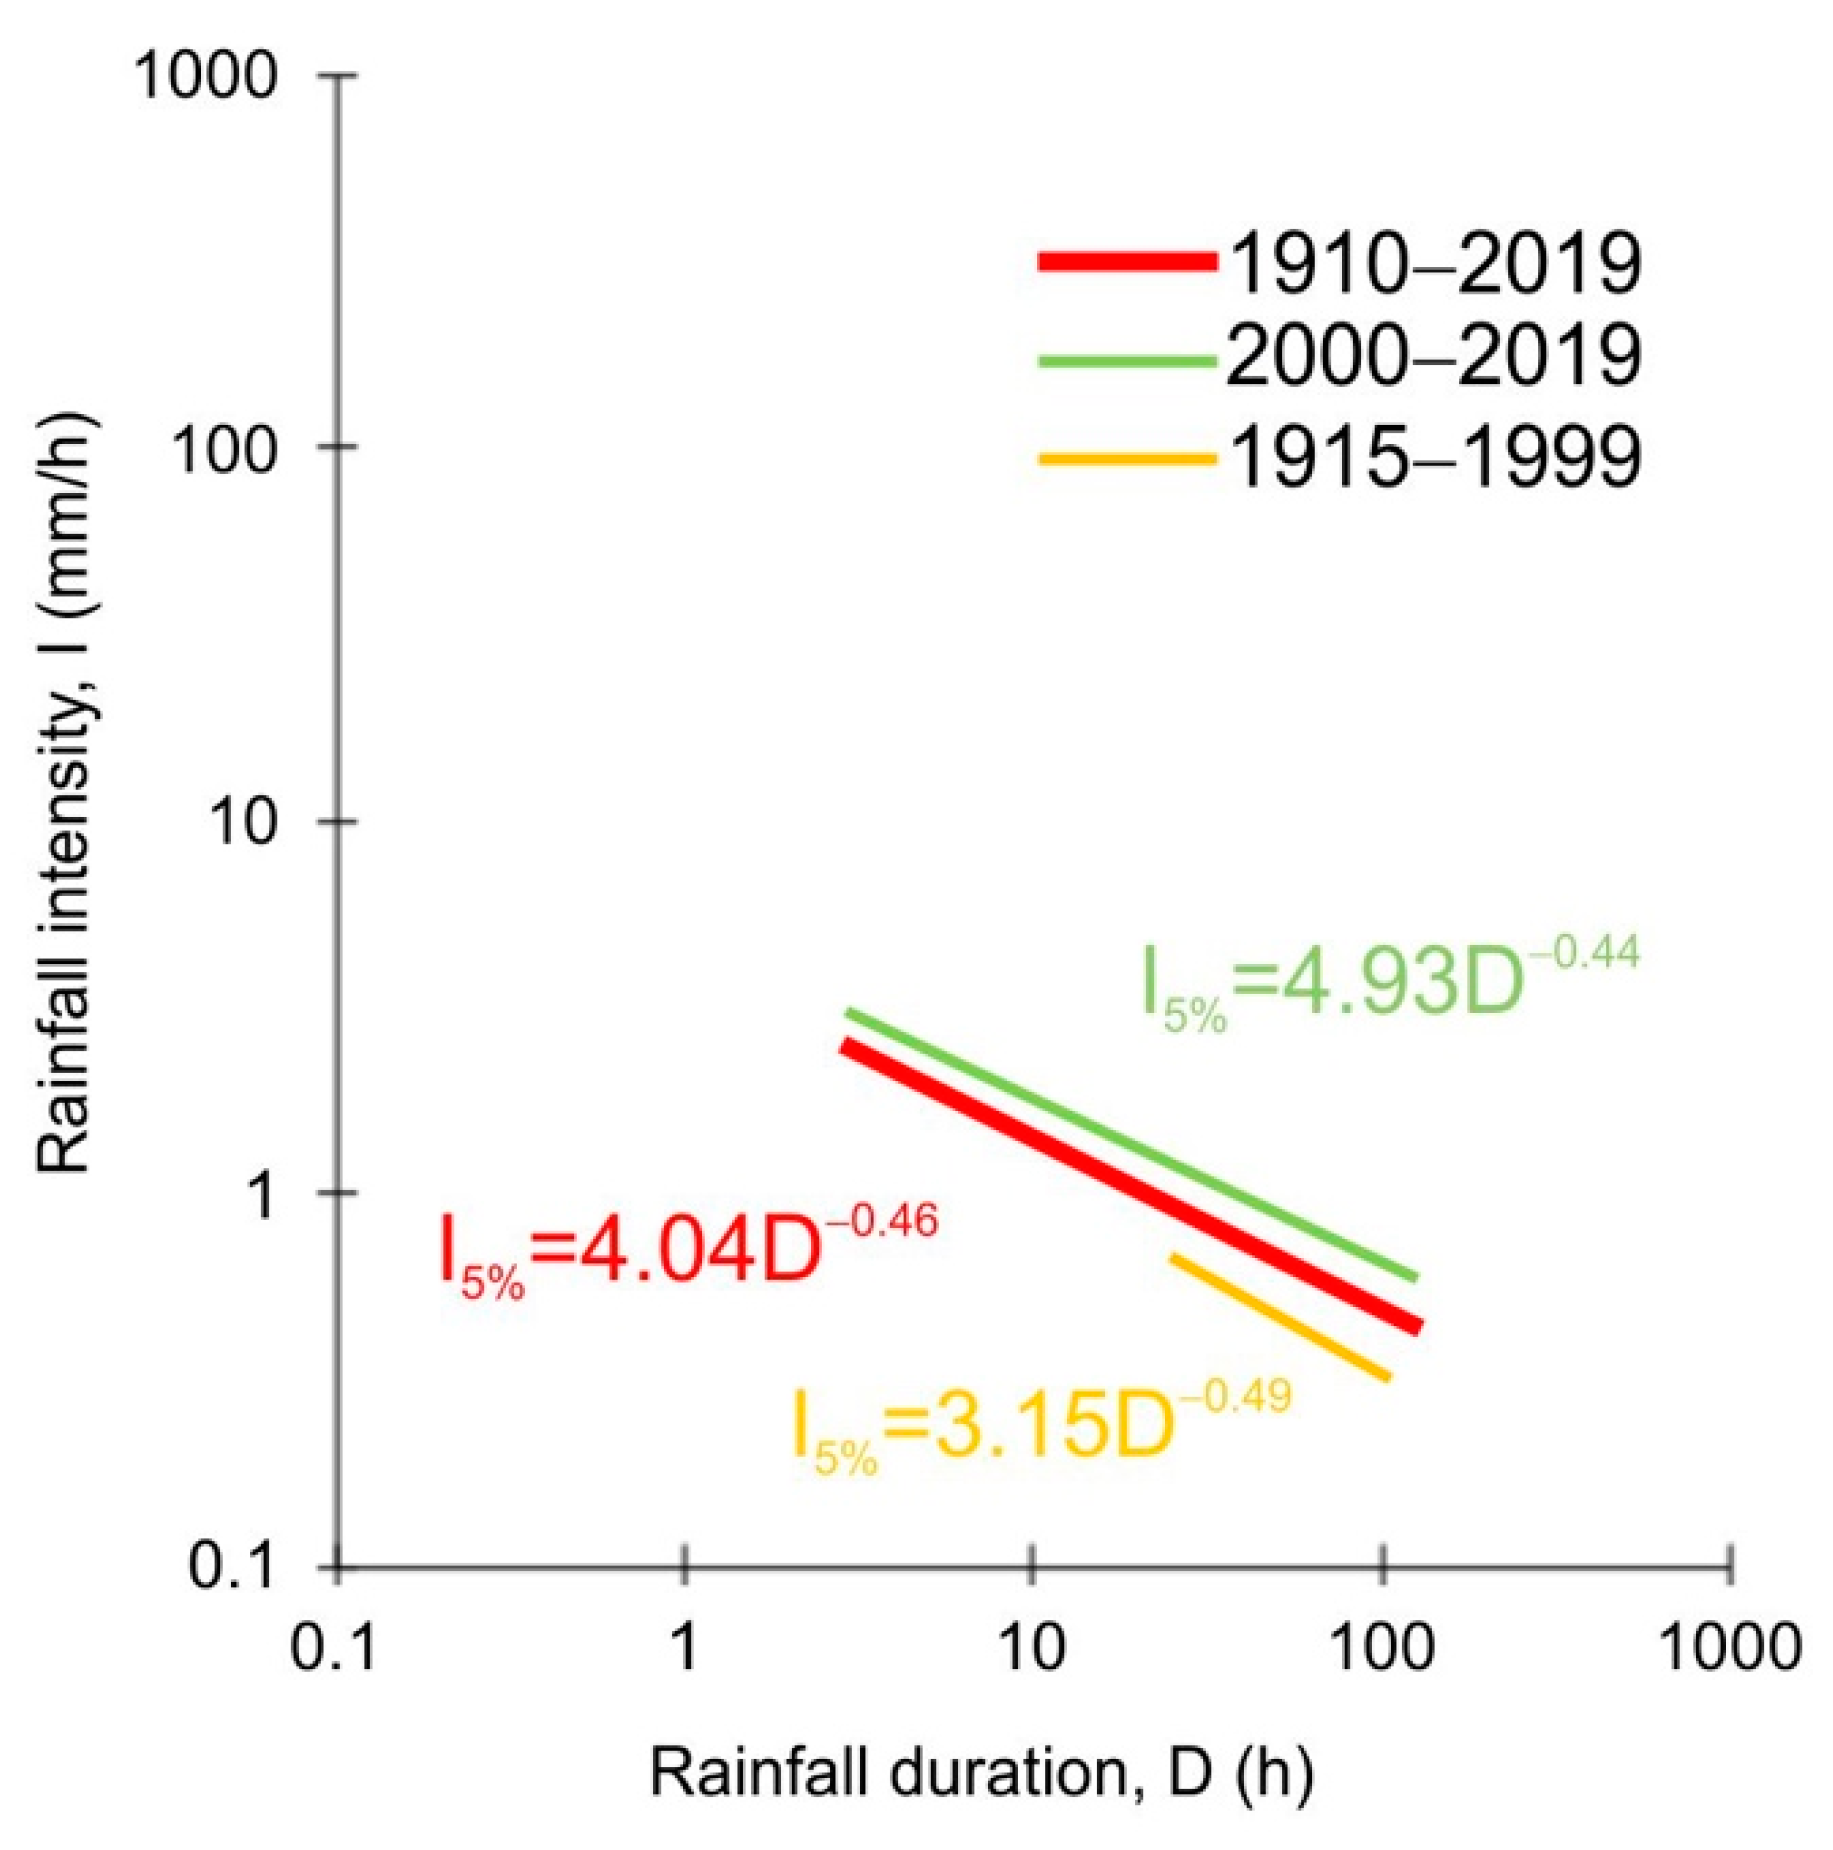
4.2. Rainfall Threshold
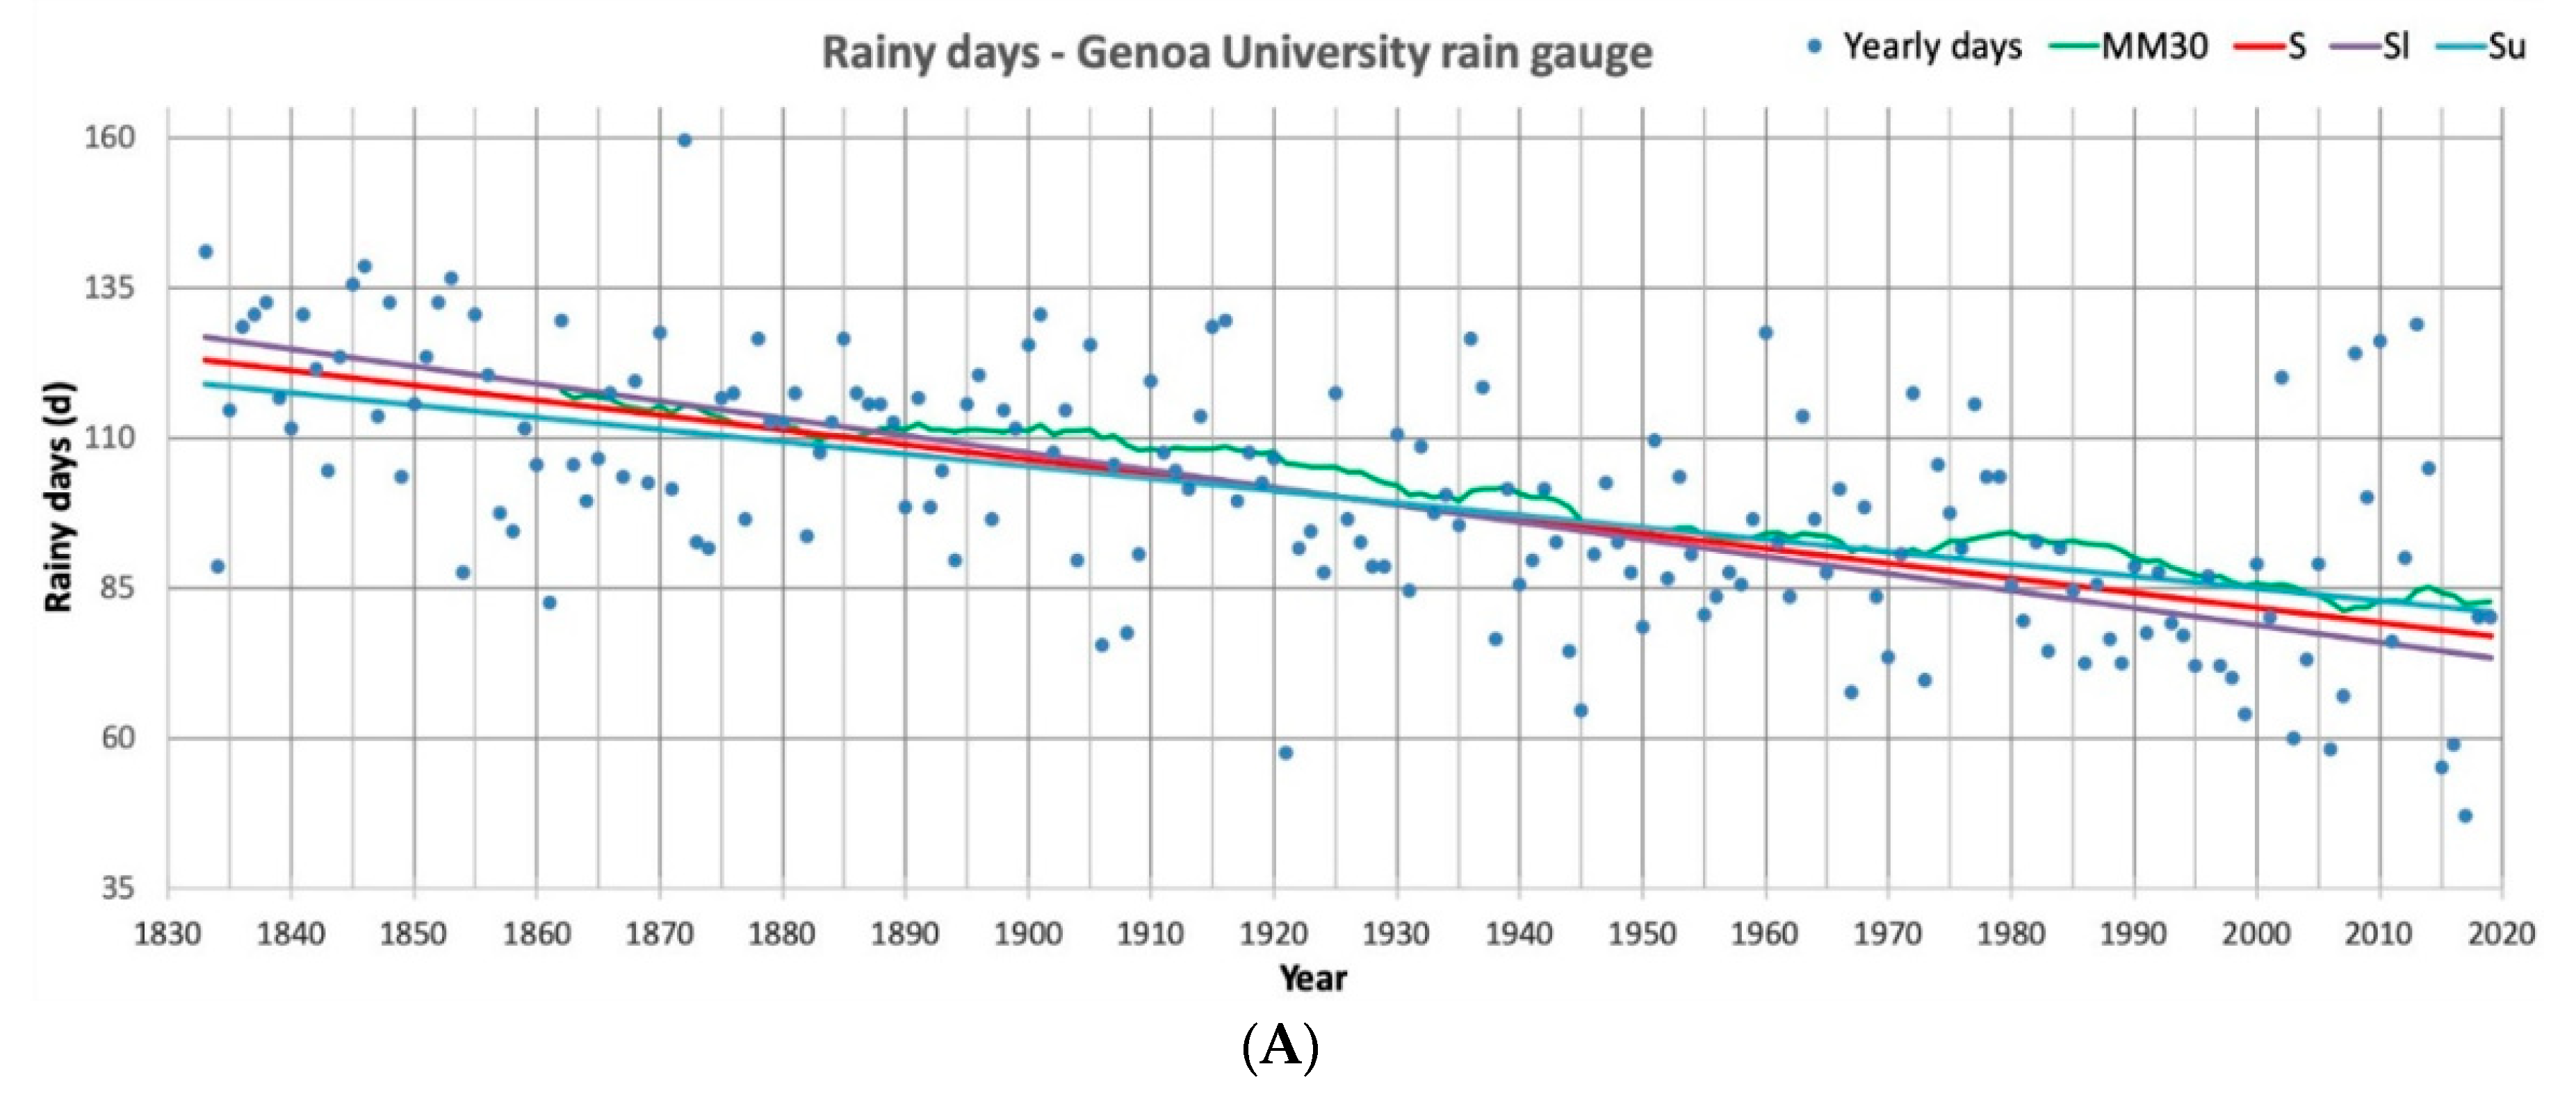
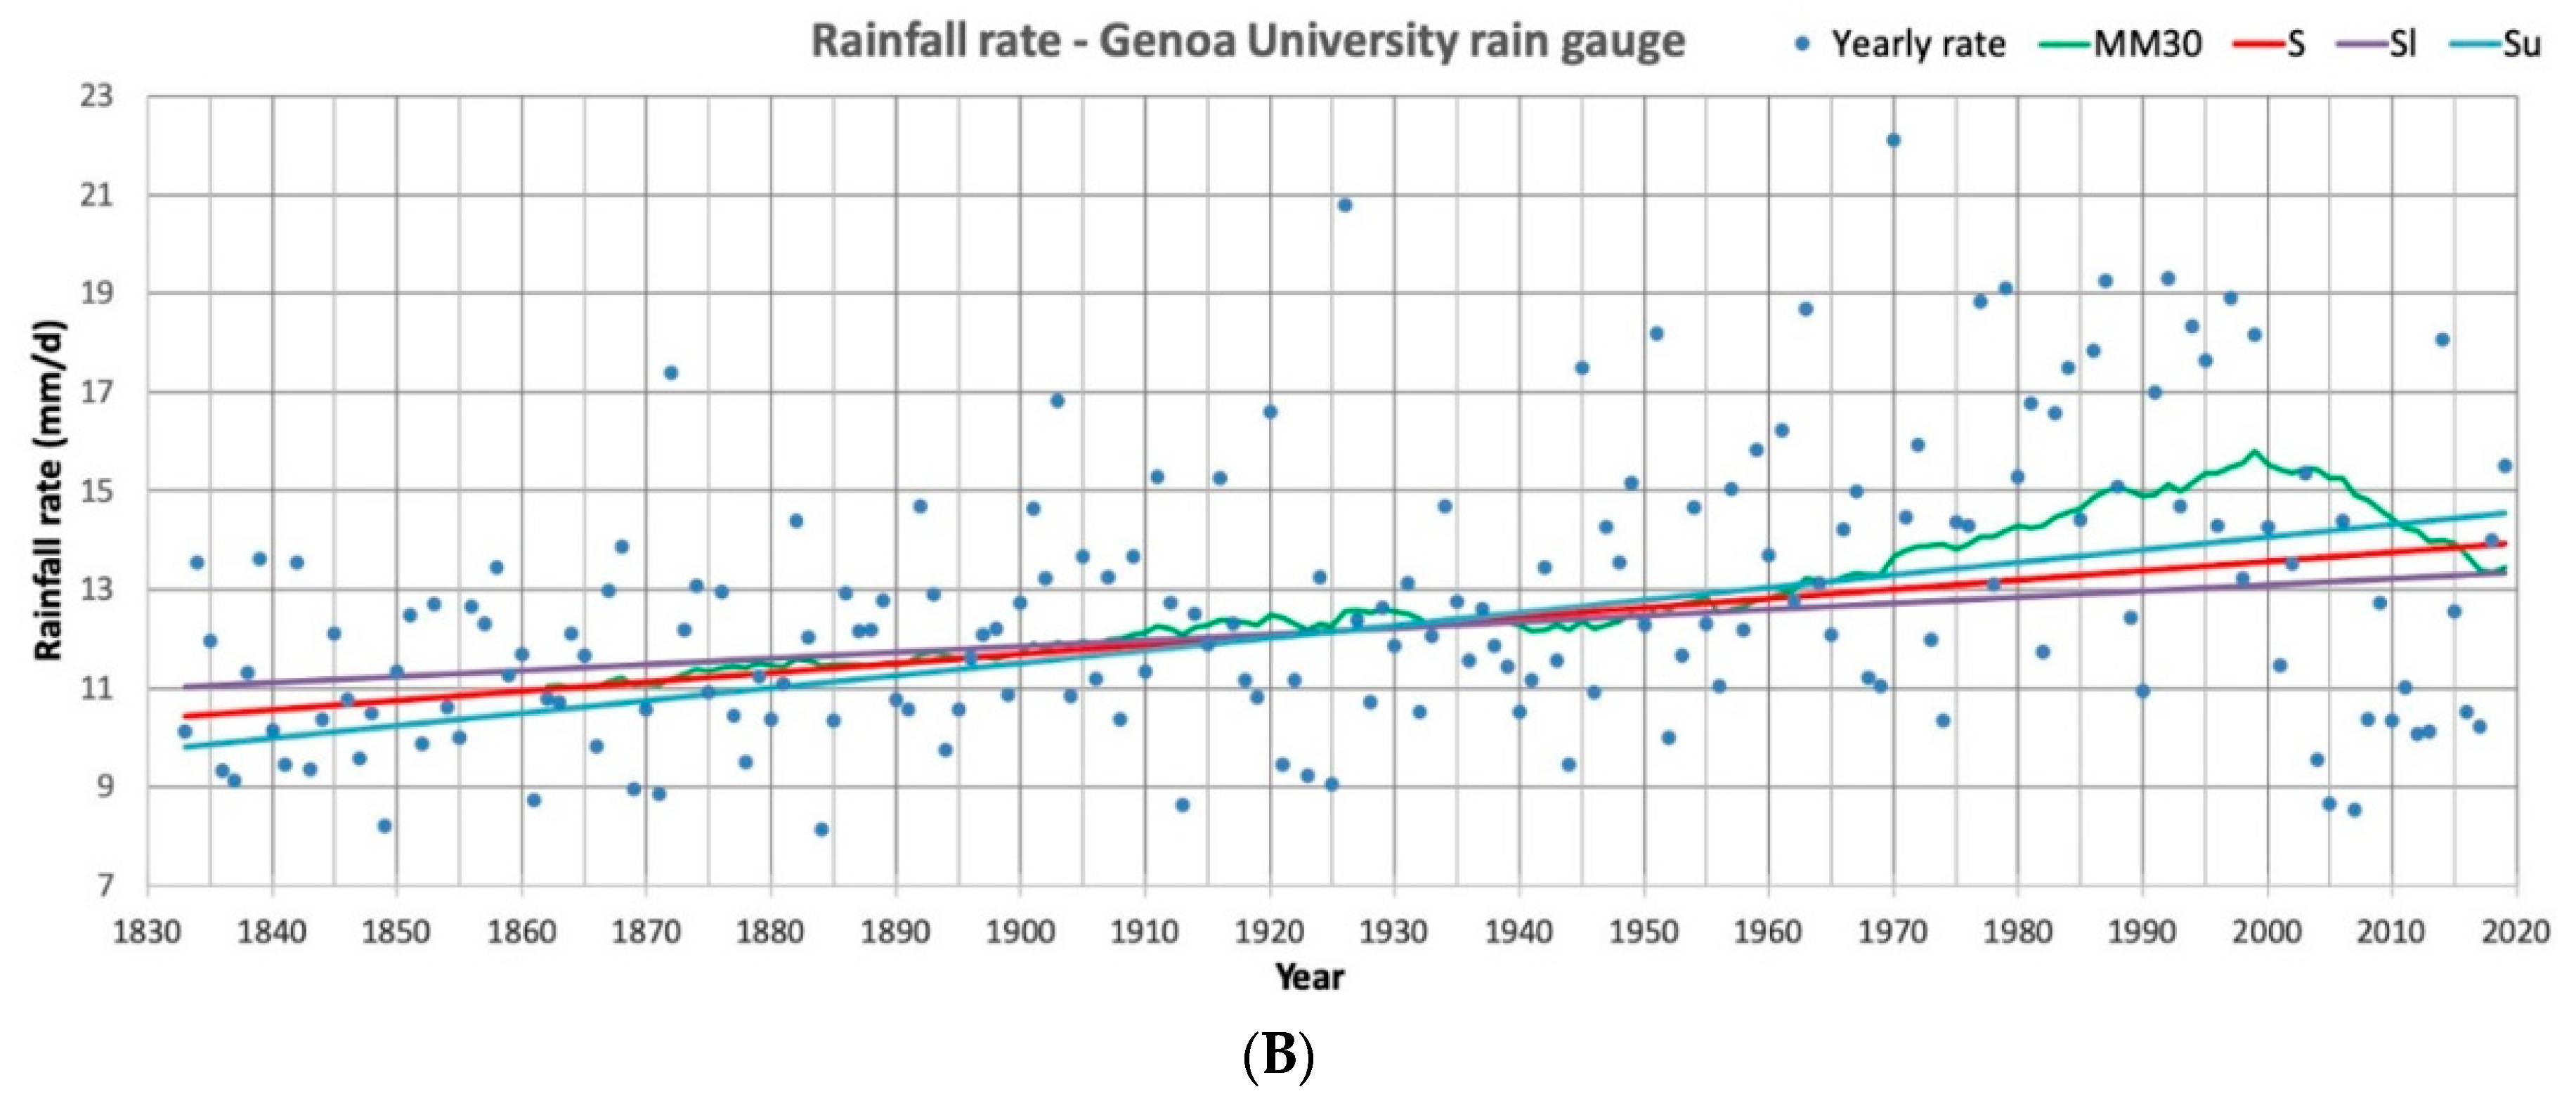
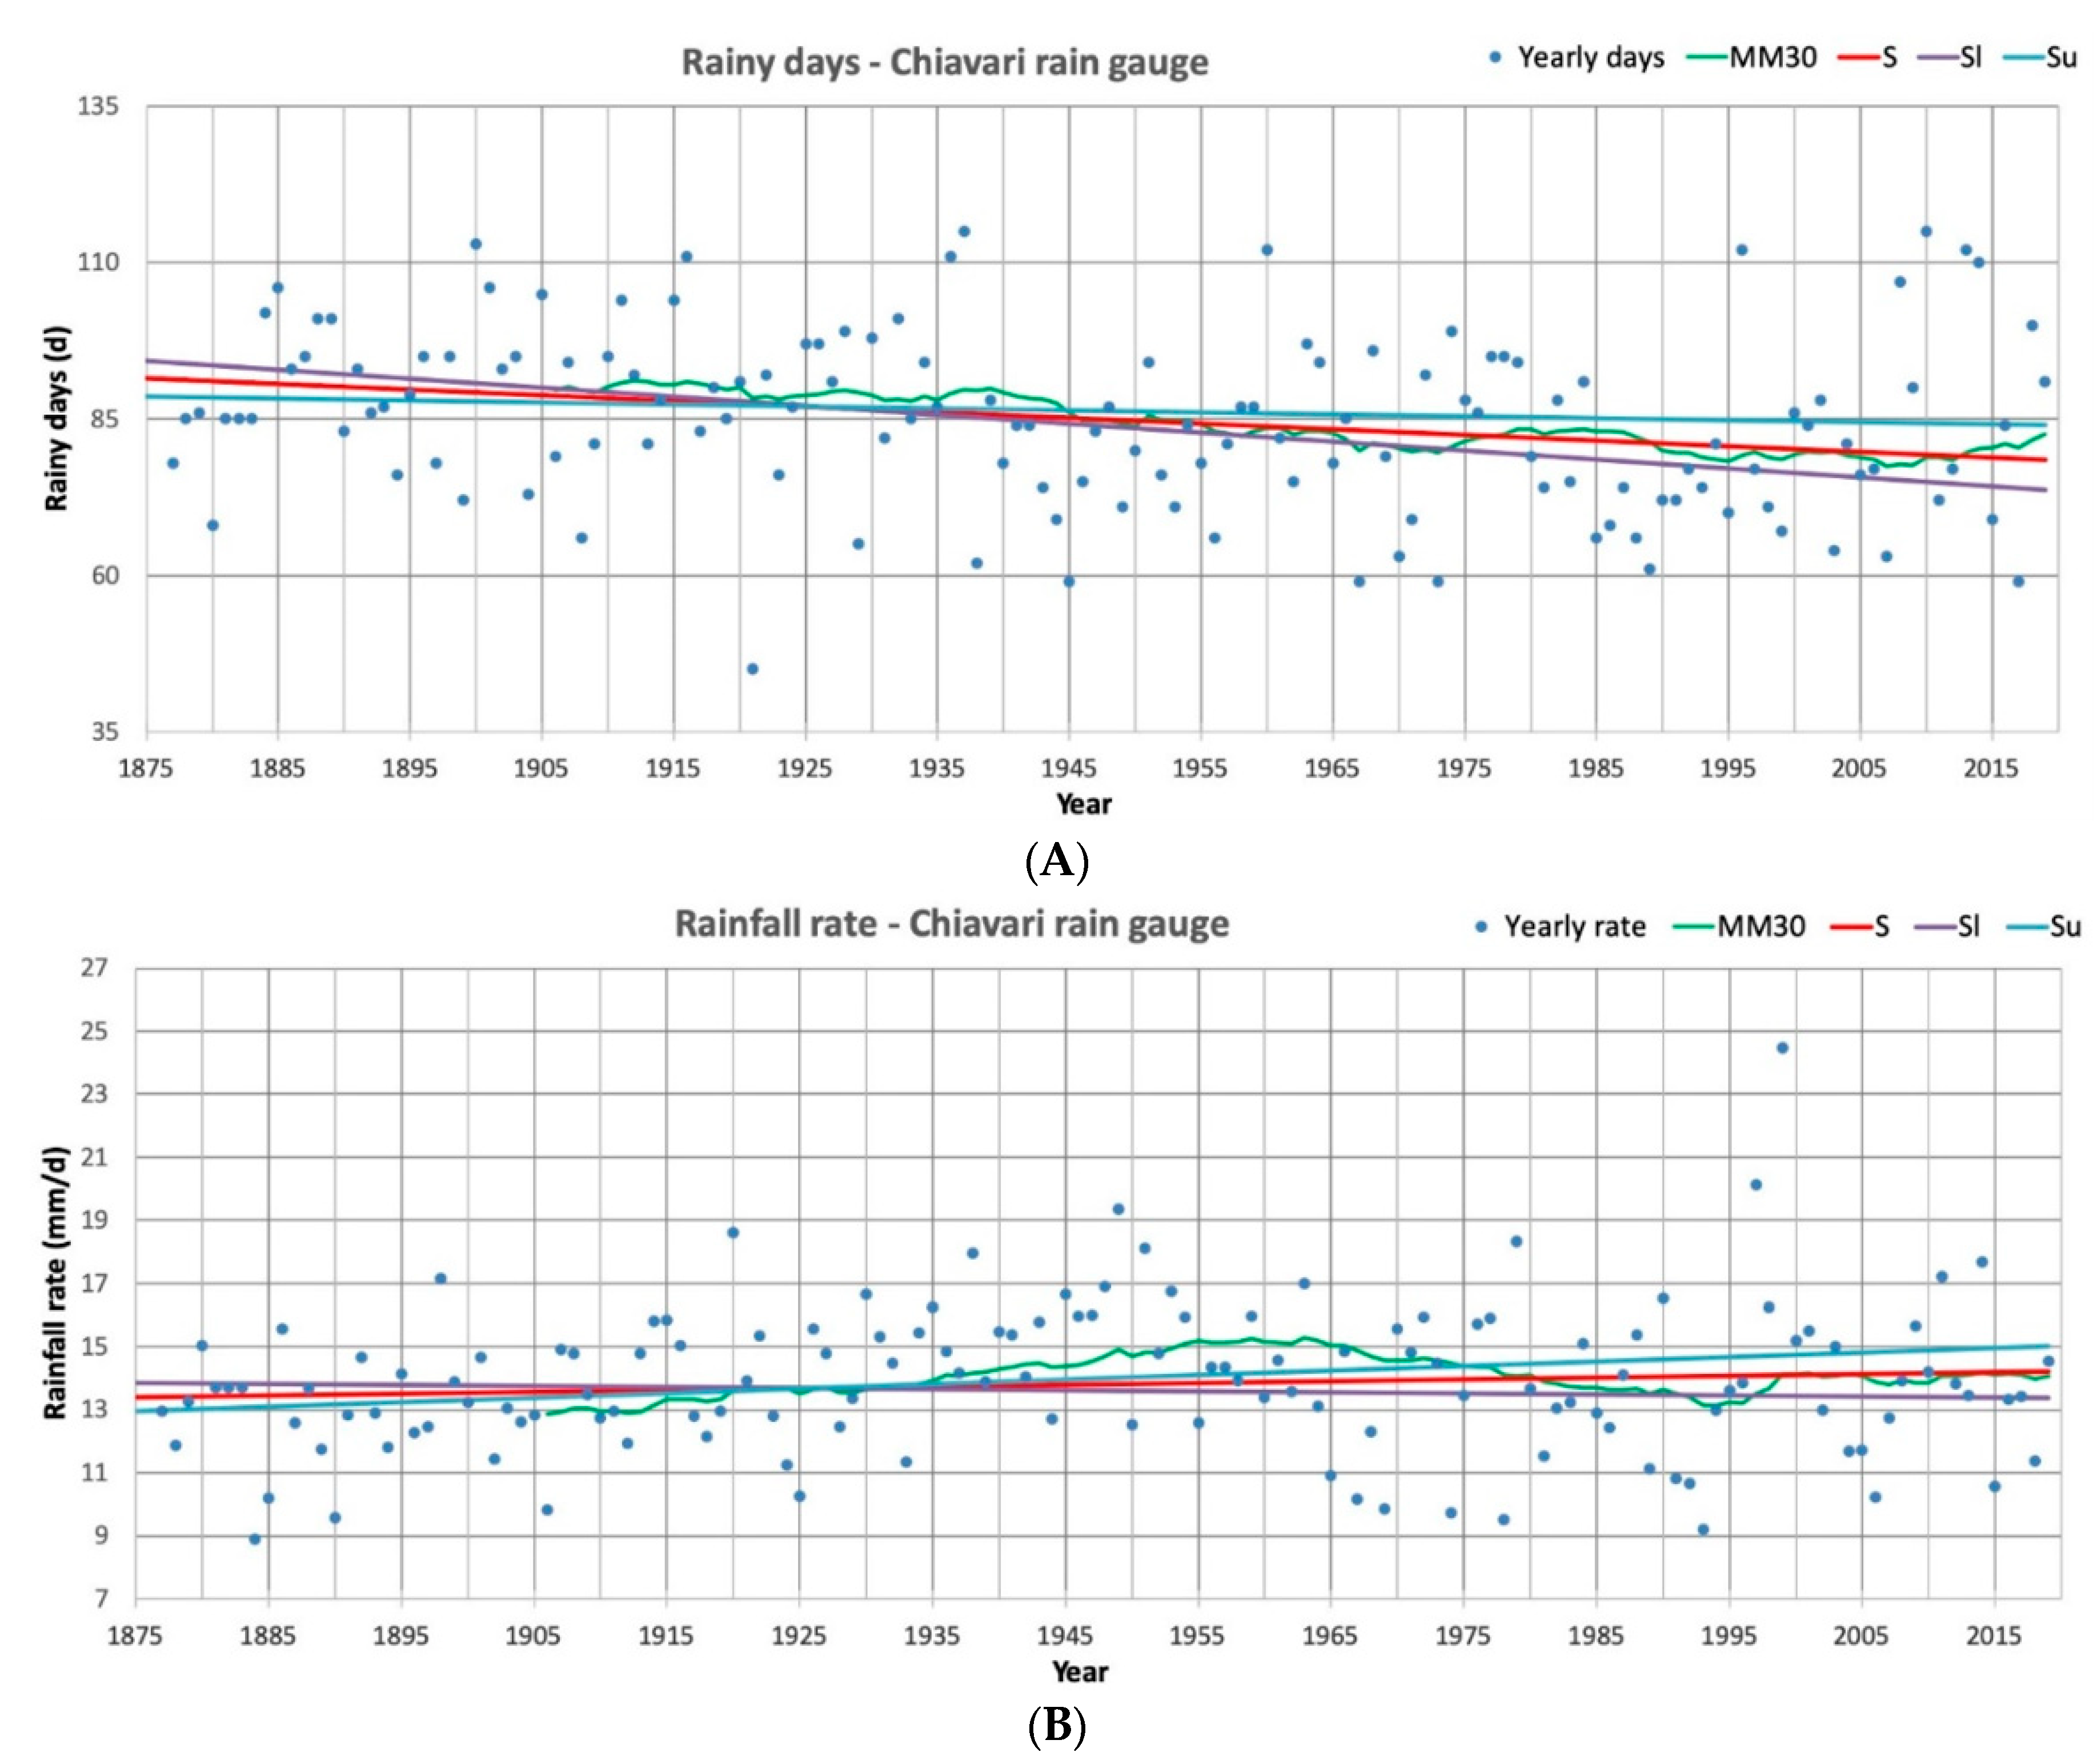
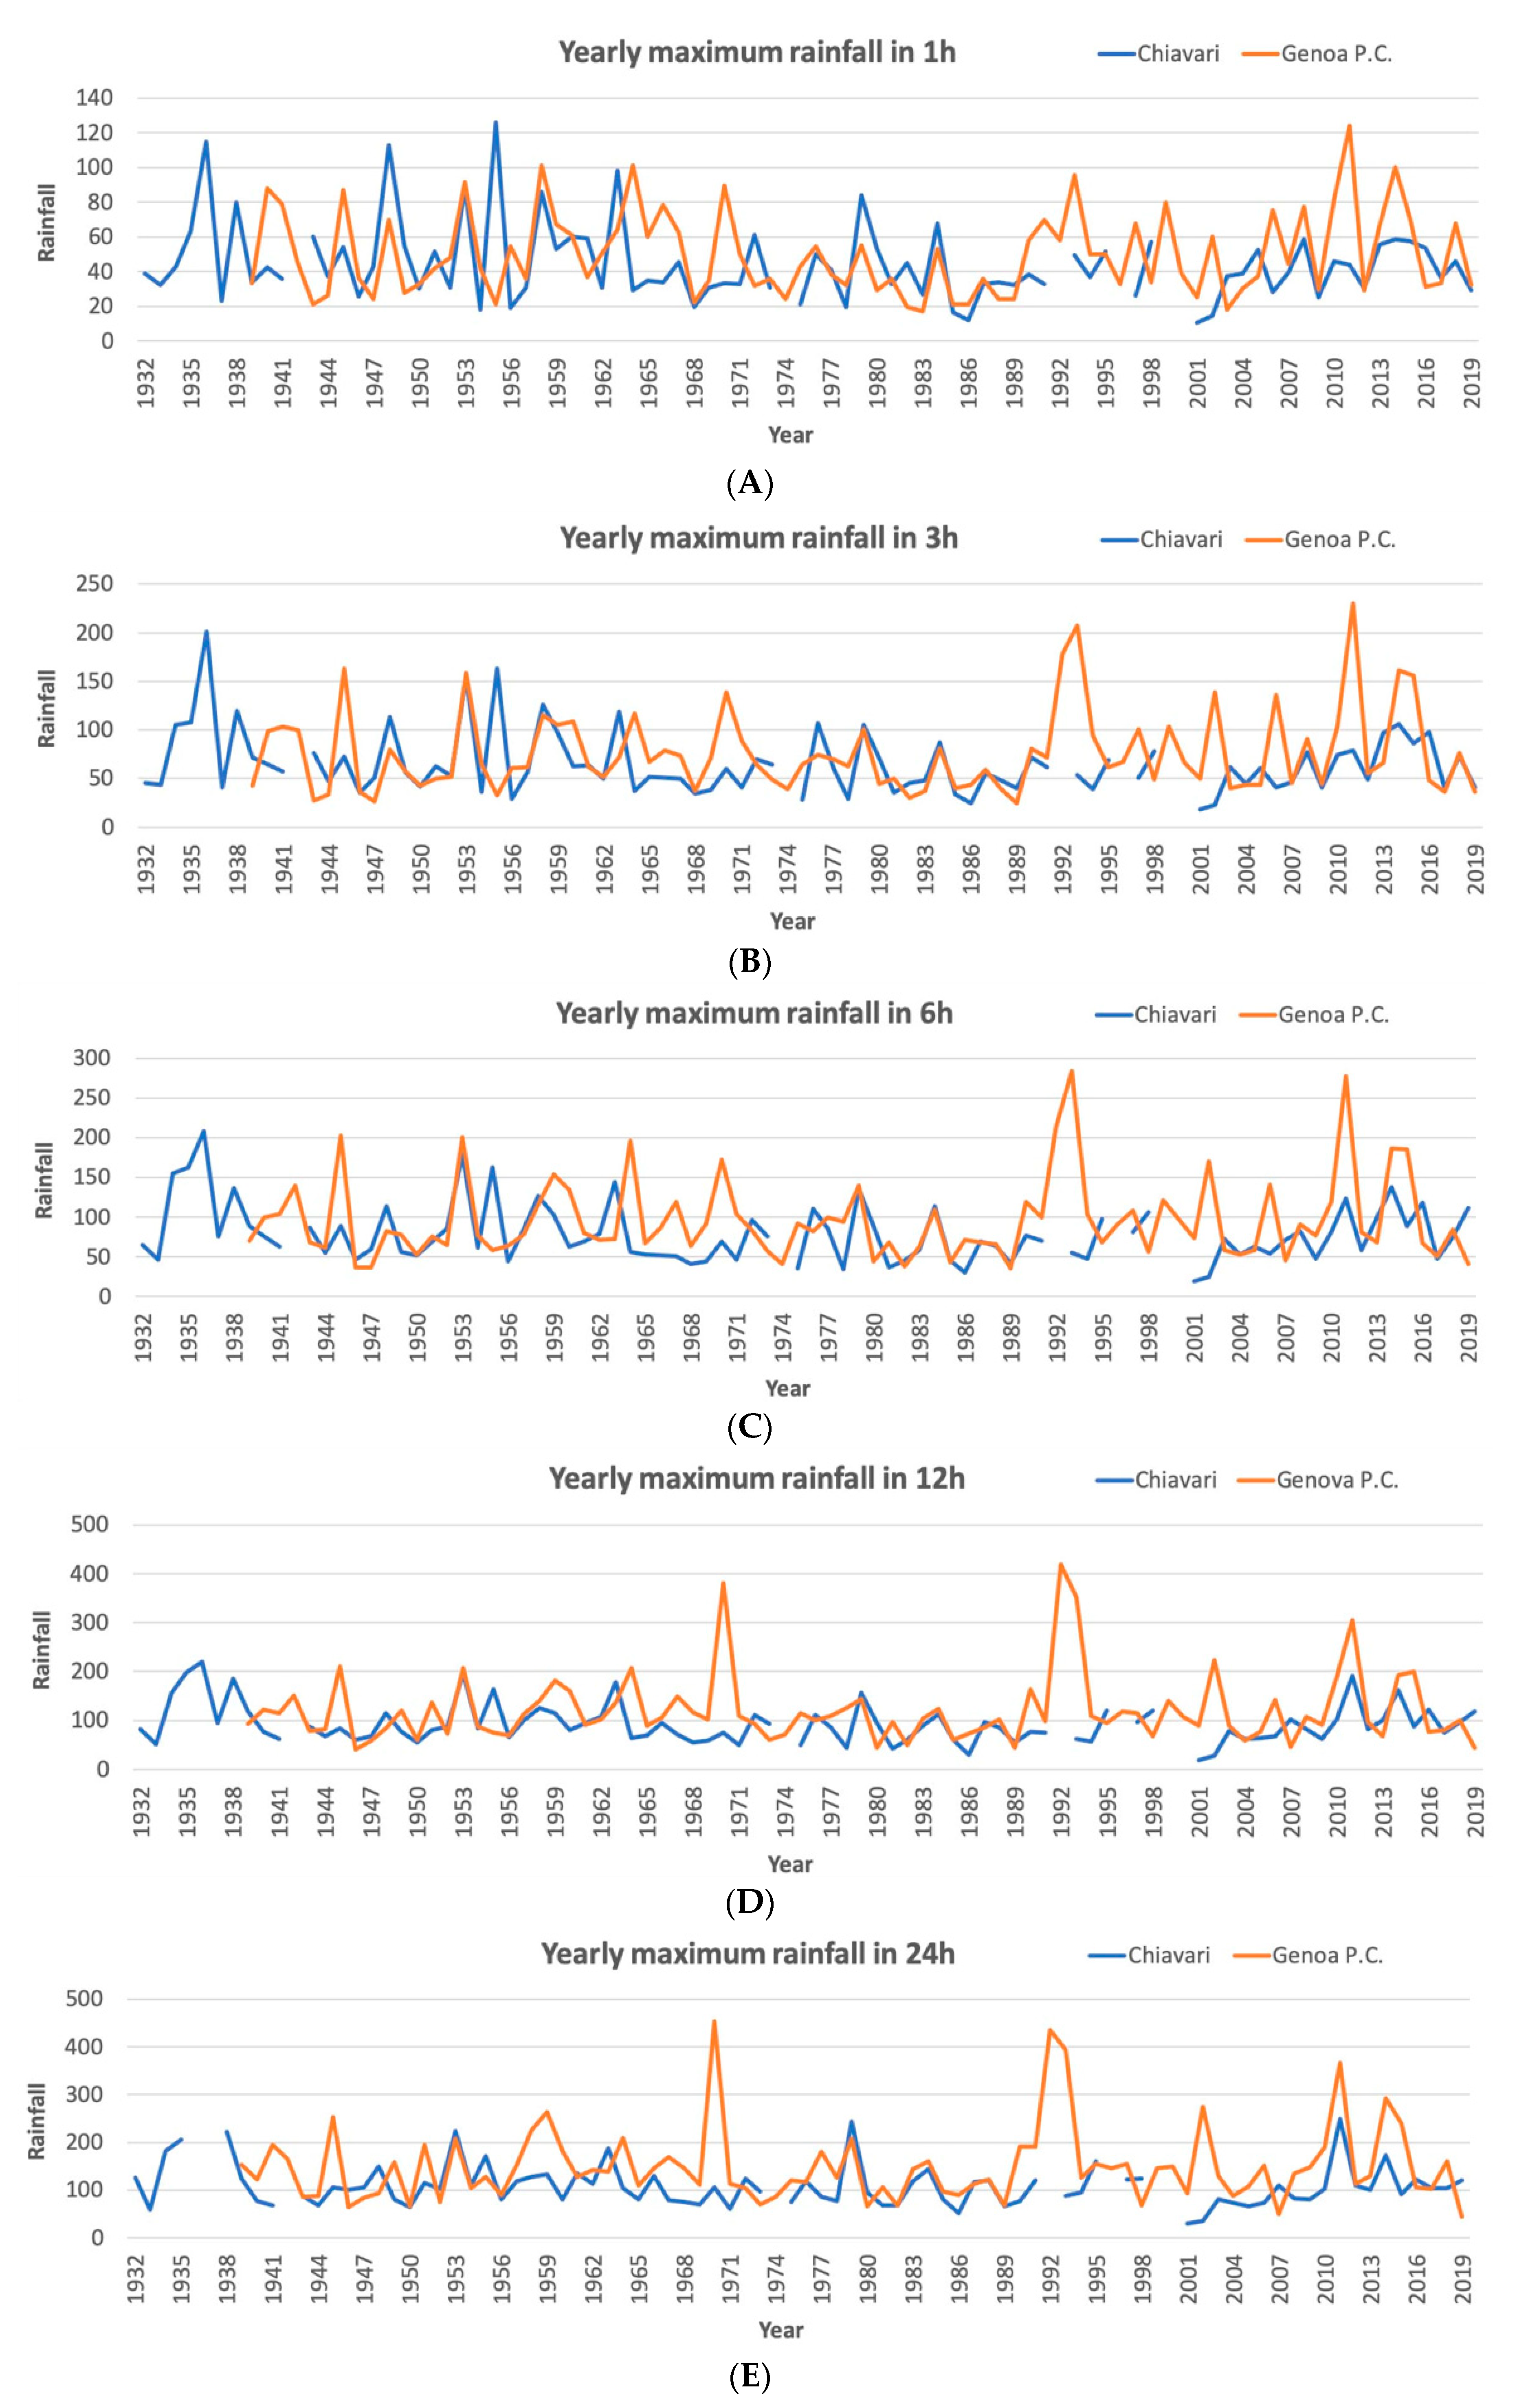
4.3. Rainfall Historical Series
5. Discussion
5.1. Rainfall Thresholds
5.2. Rainfall Trends
5.3. Effects of Rainfall Trends on Landslides Occurrence
6. Conclusions
Author Contributions
Funding
Conflicts of Interest
References
- European Environment Agency. Mapping the Impacts of Recent Natural Disasters and Technological Accidents in Europe; Environmental Issue Report 35; European Environment Agency: Copenhagen, Denmark, 2003; pp. 1–47. ISBN 92-9167-630-6. Available online: https://www.eea.europa.eu/publications/environmental_issue_report_2004_35 (accessed on 14 September 2020).
- Bryant, E. Natural Hazards, 2nd ed.; Cambridge University Press: Cambridge, UK, 2005; pp. 1–312. ISBN 978-0-521-53743-8. [Google Scholar]
- Petley, D.N.; Dunning, S.A.; Rosser, N.J. The analysis of global landslide risk through the creation of a database of worldwide landslide fatalities. In Landslide Risk Management; Hungr, O., Fell, R., Couture, R., Eberhardt, E., Eds.; A. Balkema: Amsterdam, The Netherland, 2005; pp. 367–374. [Google Scholar]
- Nadim, F.; Kjekstad, O.; Peduzzi, P.; Herold, C.; Jaedicke, C. Global Landslide and Avalanche Hotspots. Landslides 2006, 3, 159–173. [Google Scholar] [CrossRef]
- European Environment Agency. Mapping the Impacts of Natural Hazards and Technological Accidents in Europe—An Overview of the Last Decade; Environmental Issue Report 13; European Environment Agency: Copenhagen, Denmark, 2010; pp. 1–146. Available online: https://www.eea.europa.eu/publications/mapping-the-impacts-of-natural (accessed on 14 September 2020). [CrossRef]
- Petley, D. Global patterns of loss of life from landslides. Geology 2012, 40, 927–930. [Google Scholar] [CrossRef]
- Nadim, F.; Jaedicke, C.; Smebye, H.; Kalsnes, B. Assessment of Global Landslide Hazard Hotspots. In Landslides: Global Risk Preparedness; Sassa, K., Rouhban, B., Briceño, S., McSaveney, M., He, B., Eds.; Springer: Berlin, Germany, 2013; pp. 59–71. [Google Scholar] [CrossRef]
- Wood, J.L.; Harrison, S.; Turkington, T.A.R.; Reinhardt, L. Landslides and synoptic weather trends in the European Alps. Clim. Chang. 2016, 136, 297–308. [Google Scholar] [CrossRef] [Green Version]
- Froude, M.J.; Petley, D.N. Global fatal landslide occurrence from 2004 to 2016. Nat. Hazards Earth Syst. Sci. 2018, 18, 2161–2181. [Google Scholar] [CrossRef] [Green Version]
- International Federation of Red Cross and Red Crescent Societies; Sanderson, D.; Sharma, A. World Disasters Report 2018: Leaving No One Behind; International Federation of Red Cross and Red Crescent Societies: Geneva, Switzerland, 2018; ISBN 978-2-9701289-0-8. Available online: https://media.ifrc.org/ifrc/world-disaster-report-2018/ (accessed on 14 September 2020).
- Dore, M.H.I. Climate change and changes in global precipitation patterns: What do we know? Environ. Int. 2005, 31, 1167–1181. [Google Scholar] [CrossRef]
- Kyselý, J.; Beguería, S.; Beranová, R.; Gaál, L.; López-Moreno, J.I. Different patterns of climate change scenarios for short-term and multi-day precipitation extremes in the Mediterranean. Glob. Planet. Chang. 2012, 98, 63–72. [Google Scholar] [CrossRef] [Green Version]
- IPCC. Intergovernmental Panel on Climate Change. Climate Change 2014: Synthesis Report. Contribution of Working Groups I, II and III to the Fifth Assessment Report of the Intergovernmental Panel on Climate Change; IPCC: Geneva, Switzerland, 2014; pp. 1–151. Available online: https://www.ipcc.ch/report/ar5/syr/ (accessed on 14 September 2020).
- Longobardi, A.; Villani, P. Trend analysis of annual and seasonal rainfall time series in the Mediterranean area. Int. J. Clim. 2010, 30, 1538–1546. [Google Scholar] [CrossRef]
- Caloiero, T.; Coscarelli, R.; Ferrari, E.; Macini, M. Trend detection of annual and seasonal rainfall in Calabria (Southern Italy). Int. J. Climatol. 2011, 31, 44–56. [Google Scholar] [CrossRef]
- Mueller, E.N.; Pfister, A. Increasing occurrence of high- intensity rainstorm events relevant for the generation of soil erosion in a temperate lowland region in Central Europe. J. Hydrol. 2011, 411, 266–278. [Google Scholar] [CrossRef]
- Brunetti, M.; Buffoni, L.; Maugeri, M.; Nanni, T. Precipitation intensity trends in northern Italy. Int. J. Climatol. 2000, 20, 1017–1031. [Google Scholar] [CrossRef]
- Brunetti, M.; Colacino, M.; Maugeri, M.; Nanni, T. Trends in the daily intensity of precipitation in Italy from 1951 to 1996. Int. J. Climatol. 2001, 21, 299–316. [Google Scholar] [CrossRef]
- Brunetti, M.; Maugeri, M.; Nanni, T. Changes in total precipitation, rainy days and extreme events in northeastern Italy. Int. J. Climatol. 2001, 21, 861–871. [Google Scholar] [CrossRef]
- Paliaga, G.; Donadio, C.; Bernardi, M.; Faccini, F. High-Resolution Lightning Detection and Possible Relationship with Rainfall Events over the Central Mediterranean Area. Remote Sens. 2019, 11, 1601. [Google Scholar] [CrossRef] [Green Version]
- Petley, D.N.; Oven, K.; Mitchell, W.A.; Rosser, N.J.; Dunning, S.A.; Allison, R.J. The role of global and regional precipitation patterns in landslide generation. In Proceedings of the International Conference on Slopes Malaysia 2006; Ashaari, M., Ed.; Public Works Department: Kuala Lumpur, Malaysia, 2006; pp. 249–268. [Google Scholar]
- Ciccarelli, N.; von Hardenberg, J.; Provenzale, A.; Ronchi, C.; Vargiu, A.; Pelosini, R. Climate variability in north-western Italy during the second half of the 20th century. Glob. Planet. Chang. 2008, 63, 185–195. [Google Scholar] [CrossRef]
- Giorgi, F.; Lionello, P. Climate change projections for the Mediterranean region. Glob. Planet. Chang. 2008, 63, 90–104. [Google Scholar] [CrossRef]
- Jomelli, V.; Brunstein, D.; Déqué, M.; Vrac, M.; Grancher, D. Impacts of future climatic change (2070–2099) on the potential occurrence of debris flows: A case study in the Massif des Ecrins (French Alps). Clim. Chang. 2009, 97, 171–191. [Google Scholar] [CrossRef]
- Seneviratne, S.I.; Nicholls, N.; Easterling, D.; Goodess, C.M.; Kanae, S.; Kossin, J.; Luo, Y.; Marengo, J.; McInnes, K.; Rahimi, M.; et al. Changes in Climate Extremes and their Impacts on the Natural Physical Environment. In Managing the Risks of Extreme Events and Disasters to Advance Climate Change Adaptation. A Special Report of Working Groups I and II of the Intergovernmental Panel on Climate Change (IPCC); Field, C.B., Barros, V., Stocker, T.F., Dahe, Q., Eds.; Cambridge University Press: Cambridge, UK, 2012; pp. 109–230. ISBN 978-1-13-917724-5. Available online: https://www.ipcc.ch/report/managing-the-risks-of-extreme-events-and-disasters-to-advance-climate-change-adaptation/ (accessed on 14 September 2020).
- Saez, J.L.; Corona, C.; Stoffel, M.; Berger, F. Climate change increases frequency of shallow spring landslides in the French Alps. Geology 2013, 41, 619–622. [Google Scholar] [CrossRef]
- Field, C.B.; Barros, V.R.; Dokken, D.J.; Mach, K.J.; Mastrandrea, M.D.; Bilir, T.E.; Chatterjee, M.; Ebi, K.L.; Estrada, Y.O.; Genova, R.C.; et al. Intergovernmental Panel on Climate Change. Climate Change 2014: Impacts, Adaptation, and Vulnerability. Part A: Global and Sectoral Aspects. Contribution of Working Group II to the Fifth Assessment Report of the Intergovernmental Panel on Climate Change. Available online: https://www.ipcc.ch/site/assets/uploads/2018/02/WGIIAR5-PartA_FINAL.pdf (accessed on 14 September 2020).
- Barros, V.R.; Field, C.B.; Dokken, D.J.; Mastrandrea, M.D.; Mach, K.J.; Bilir, T.E.; Chatterjee, M.; Ebi, K.L.; Estrada, Y.O.; Genova, R.C.; et al. Intergovernmental Panel on Climate Change. Climate Change 2014: Impacts, Adaptation, and Vulnerability. Part B: Regional Aspects. Contribution of Working Group II to the Fifth Assessment Report of the Intergovernmental Panel on Climate Change. Available online: https://www.ipcc.ch/site/assets/uploads/2018/02/WGIIAR5-PartB_FINAL.pdf (accessed on 14 September 2020).
- Stoffel, M.; Tiranti, D.; Huggel, C. Climate change impacts on mass movements—Case studies from the European Alps. Sci. Total Environ. 2014, 493, 1255–1266. [Google Scholar] [CrossRef]
- IPCC. Intergovernmental Panel on Climate Change. Climate Change 2014: Synthesis Report. Contribution of Working Groups I, II and III to the Fifth Assessment Report of the Intergovernmental Panel on Climate Change; Pachauri, R.K., Meyer, L.A., Eds.; IPCC: Geneva, Switzerland, 2015; 151p, ISBN 978-9-29-169143-2. Available online: https://www.ipcc.ch/site/assets/uploads/2018/02/SYR_AR5_FINAL_full.pdf (accessed on 14 September 2020).
- Gariano, S.L.; Guzzetti, F. Landslides in a changing climate. Earth Sci. Rev. 2016, 162, 227–252. [Google Scholar] [CrossRef] [Green Version]
- Turkington, T.; Remaître, A.; Ettema, J.; Hussin, H.; van Westen, C. Assessing debris flow activity in a changing climate. Clim. Chang. 2016, 137, 293–305. [Google Scholar] [CrossRef] [Green Version]
- Glade, T. Landslide occurrence as a response to land use change: A review of evidence from New Zealand. Catena 2003, 51, 297–314. [Google Scholar] [CrossRef] [Green Version]
- Alexander, D. Vulnerability to landslides. In Landslide Hazard and Risk; Glade, T., Anderson, M.G., Crozier, M.J., Eds.; Wiley: Chichester, UK, 2005; 824p. [Google Scholar]
- Petley, D.N.; Hearn, G.J.; Hart, A.; Rosser, N.J.; Dunning, S.A.; Oven, K.; Mitchell, W.A. Trends in landslide occurrence in Nepal. Nat. Hazards 2007, 43, 23–44. [Google Scholar] [CrossRef]
- Acquaotta, F.; Faccini, F.; Fratianni, S.; Paliaga, G.; Sacchini, A.; Vilímek, V. Increased flash flooding in Genoa Metropolitan Area: A combination of climate changes and soil consumption? Meteorol. Atmos. Phys. 2018, 9131, 1099–1110. [Google Scholar] [CrossRef]
- Luino, F.; De Graff, J.; Roccati, A.; Biddoccu, M.; Cirio, C.G.; Faccini, F.; Turconi, L. Eighty Years of Data Collected for the Determination of Rainfall Threshold Triggering Shallow Landslides and Mud-Debris Flows in the Alps. Water 2020, 12, 133. [Google Scholar] [CrossRef] [Green Version]
- Roccati, A.; Faccini, F.; Luino, F.; Ciampalini, A.; Turconi, L. Heavy rainfall triggering shallow landslides: A susceptibility assessment by a GIS-approach in a Ligurian Apennine catchment (Italy). Water 2019, 11, 605. [Google Scholar] [CrossRef] [Green Version]
- Guzzetti, F.; Peruccacci, S.; Rossi, M.; Stark, C.P. Rainfall thresholds for the initiation of landslides in central and southern Europe. Meteorog. Atmos. Phys. 2007, 98, 239–267. [Google Scholar] [CrossRef]
- Guzzetti, F.; Peruccacci, S.; Rossi, M.; Stark, C.P. The rainfall intensity-duration control of shallow landslides and debris flows: An update. Landslides 2008, 5, 3–17. [Google Scholar] [CrossRef]
- Segoni, S.; Piciullo, L.; Gariano, S.L. A review of the recent literature on rainfall thresholds for landslide occurrence. Landslides 2018, 15, 1483–1501. [Google Scholar] [CrossRef]
- Aleotti, P. A warning system for rainfall-induced shallow failures. Eng. Geol. 2004, 73, 247–265. [Google Scholar] [CrossRef]
- Baum, R.L.; Godt, J.W. Early warning of rainfall-induced shallow landslides and debris flows in the USA. Landslides 2010, 7, 259–272. [Google Scholar] [CrossRef]
- Segoni, S.; Rosi, A.; Rossi, G.; Catani, F.; Casagli, N. Analysing the relationship between rainfalls and landslides to define a mosaic of triggering thresholds for regional-scale warning systems. Nat. Hazards Earth Syst. Sci. 2014, 14, 2637–2648. [Google Scholar] [CrossRef] [Green Version]
- Palladino, M.R.; Viero, A.; Turconi, L.; Brunetti, M.T.; Melillo, M.; Luino, F.; Deganutti, A.M.; Guzzetti, F. Rainfall thresholds for the activation of shallow landslides in the Italian Alps: The role of environmental conditioning factors. Geomorphology 2018, 303, 53–67. [Google Scholar] [CrossRef]
- Abraham, M.T.; Pothuraju, D.; Satyam, N. Rainfall Thresholds for Prediction of Landslides in Idukki, India: An Empirical Approach. Water 2019, 11, 2113. [Google Scholar] [CrossRef] [Green Version]
- Jordova, G.; Gariano, S.L.L.; Melillo, M.; Peruccacci, S.; Brunetti, M.T.; Auflic, M.J. Determination of Empirical Rainfall Thresholds for Shallow Landslides in Slovenia Using an Automatic Tool. Water 2020, 12, 1449. [Google Scholar] [CrossRef]
- Caine, N. The Rainfall Intensity: Duration Control of Shallow Landslides and Debris Flows. Geogr. Ann. 1980, 62, 23–27. [Google Scholar] [CrossRef]
- Wieczorek, G.F. Effect of rainfall intensity and duration on debris flow in central Santa Cruz mountains, California. In Debris Flow/Avalanches: Processes, Recognition and Migration; Reviews in Engineering Geology; Geological Society of America: Boulder, CO, USA, 1987; Volume 2. [Google Scholar]
- Crosta, G. Regionalization of rainfall thresholds: An aid to landslide hazard evaluation. Environ. Geol. 1998, 35, 131–145. [Google Scholar] [CrossRef]
- Saito, H.; Nakayama, D.; Matsuyama, H. Relationship between the initiation of a shallow landslide and rainfall intensity—Duration thresholds in Japan. Geomorphology 2010, 118, 167–175. [Google Scholar] [CrossRef]
- Hong, M.; Kim, J.; Jeong, S. Rainfall intensity-duration thresholds for landslide prediction in South Korea by considering the effects of antecedent rainfall. Landslides 2018, 15, 523–534. [Google Scholar] [CrossRef]
- Roccati, A.; Faccini, F.; Luino, F.; Turconi, L.; Guzzetti, F. Rainfall events with shallow landslides in the Entella catchment, Liguria, northern Italy. Nat. Hazards Earth Sys. Sci. 2018, 18, 2367–2386. [Google Scholar] [CrossRef] [Green Version]
- Hess, A.; Iyer, H.; Malm, W. Linear trend analysis: A comparison of methods. Atmos. Environ. 2001, 35, 5211–5222. [Google Scholar] [CrossRef]
- Yue, S.; Pilon, P.; Phinney, B.; Cavadias, G. The influence of autocorrelation on the ability to detect trend in hydrological series. Hydrol. Process. 2002, 16, 1807–1829. [Google Scholar] [CrossRef]
- Helsel, D.R.; Hirsch, R.M. Statistical Methods in Water Resources; Elsevier: Amsterdam, The Netherland, 1992; 395p. [Google Scholar]
- Hamed, K.H.; Rao, A.R. A modified Mann-Kendall trend test for autocorrelated data. J. Hydrol. 1998, 204, 182–196. [Google Scholar] [CrossRef]
- Buffoni, L.; Maugeri, M.; Nanni, T. Precipitation in Italy from 1833 to 1996. Theor. Appl. Climatol. 1999, 63, 33–40. [Google Scholar] [CrossRef]
- Whitfield, P.H.; Cannon, A.J. Recent variations in climate and hydrology in Canada. Can. Water. Resour. J. 2000, 25, 19–65. [Google Scholar] [CrossRef]
- Yue, S.; Hashino, M. Long term trends of annual and monthly precipitation in Japan. J. Am. Water. Resour. Assoc. 2003, 39, 587–596. [Google Scholar] [CrossRef]
- Gemmer, M.; Becker, S.; Jiang, T. Observed monthly precipitation trends in China 1951–2002. Theor. Appl. Climatol. 2004, 77, 39–45. [Google Scholar] [CrossRef]
- Cannarozzo, M.; Noto, L.V.; Viola, F. Spatial distribution of rainfall trends in Sicily (1921–2000). Phys. Chem. Earth 2006, 31, 1201–1211. [Google Scholar] [CrossRef]
- Yavuz, H.; Erdogan, S. Spatial analysis of monthly and annual precipitation trends in Turkey. Water Resour. Manag. 2012, 26, 609–612. [Google Scholar] [CrossRef]
- Mondal, A.; Kundu, S.; Mukhopadhyay, A. Rainfall trend analysis by Mann–Kendall test: A case study of north-eastern part of Cuttack district, Orissa. Int. J. Geol. Earth Environ. Sci. 2012, 2, 70–78. [Google Scholar]
- Burn, D.H.; Hag Elnur, M.A. Detection of hydrologic trends and variability. J. Hydrol. 2002, 255, 107–122. [Google Scholar] [CrossRef]
- Koutsoyiannis, D. Climate change, the Hurst phenomenon, and hydrological statistics. Hydrol. Sci. J. 2009, 48, 3–24. [Google Scholar] [CrossRef]
- Schmidt, J.; Dikau, R. Modeling historical climate variability and slope stability. Geomorphology 2004, 60, 433–447. [Google Scholar] [CrossRef]
- Crozier, M.J. Deciphering the effect of climate change on landslide activity: A review. Geomorphology 2010, 124, 260–267. [Google Scholar] [CrossRef]
- Coe, J.A.; Godt, J.W. Review of approaches for assessing the impact of climate change on landslide hazards. In Landslides and Engineered Slopes, Protecting Society Through Improved Understanding: Proceedings 11th International and 2nd North American Symposium on Landslides and Engineered Slopes, Banff, AB, Canada, 2–8 June 2012; Eberhardt, E., Froese, C., Turner, A.K., Leroueil, S., Eds.; Taylor & Francis Group: London, UK, 2012; pp. 371–377. [Google Scholar]
- Faccini, F.; Gabellieri, N.; Paliaga, G.; Piana, P.; Angelini, S.; Coratza, P. Geoheritage map of the Portofino Natural Park (Italy). J. Maps 2018, 14, 87–96. [Google Scholar] [CrossRef]
- Salvati, P.; Bianchi, C.; Rossi, M.; Guzzetti, F. Societal landslide and flood risk in Italy. Nat. Hazards Earth Syst. Sci. 2010, 10, 465–483. [Google Scholar] [CrossRef]
- Faccini, F.; Robbiano, A.; Sacchini, A. Geomorphic hazard and intense rainfall: The case study of the Recco Stream Catchment (Eastern Liguria, Italy). Nat. Hazards Earth Syst. Sci. 2012, 12, 893–903. [Google Scholar] [CrossRef] [Green Version]
- Faccini, F.; Luino, F.; Sacchini, A.; Turconi, L. The 4th October 2010 flash flood event in Genoa Sestri Ponente (Liguria, Italy). Disaster Adv. 2015, 8, 1–14. [Google Scholar]
- Regione Liguria. Carta Geologica Regionale (CGR), Scala 1:25,000, Tav. 231.1, 231.4—Chiavari Recco. 2005. Available online: https://geoportal.regione.liguria.it/catalogo/mappe.html (accessed on 15 September 2020).
- Faccini, F.; Piccazzo, M.; Robbiano, A.; Roccati, A. Applied geomorphological map of the Portofino municipal territory. J. Maps 2012, 4, 451–462. [Google Scholar] [CrossRef]
- Giammarino, S.; Messiga, B. Clasti di meta-ofioliti a paragenesi di alta pressione nel Conglomerato di Portofino: Implicazioni paleogegrafiche e strutturali. Ofioliti 1979, 4, 25–41. (In Italian) [Google Scholar]
- Corsi, B.; Elter, F.M.; Giammarino, S. Structural fabric of the Antola Unit (Riviera di Levante, Italy) and implications for its alpine versus apennine origin. Ofioliti 2003, 26, 1–8. [Google Scholar]
- Brandolini, P.; Faccini, F.; Pelfini, M.; Firpo, M. A complex landslide along the Eastern Liguria rocky coast (Italy). Rend. Online Soc. Geol. Ital. 2013, 28, 28–31. [Google Scholar]
- Brandolini, P.; Faccini, F.; Robbiano, A.; Terranova, R. Geomorphological hazards and monitoring activity along the western rocky coast of the Portofino Promontory (Italy). Quat. Int. 2007, 171, 131–142. [Google Scholar] [CrossRef]
- Brandolini, P.; Faccini, F.; Piccazzo, M. Geomorphological hazards and tourist vulnerability along Portofino Park trails (Italy). Nat. Hazard Earth Syst. Sci. 2006, 6, 1–8. [Google Scholar] [CrossRef] [Green Version]
- Turconi, L.; Faccini, F.; Marchese, A.; Paliaga, G.; Casazza, M.; Vojinovic, Z.; Luino, F. Implementation of nature-based solutions for hydro-meteorological risk reduction in small Mediterranean catchments: The case of Portofino Natural Regional Park. Sustainability 2019, 12, 1240. [Google Scholar] [CrossRef] [Green Version]
- Paliaga, G.; Luino, F.; Turconi, L.; De Graff, J.V.; Faccini, F. Terraced Landscapes on Portofino Promontory (Italy): Identification, Geo-Hydrological Hazard and Management. Water 2020, 12, 435. [Google Scholar] [CrossRef] [Green Version]
- Köppen, W. Das Geographische System der Klimate. In Handbuch der Klimatologie; Köppen, W., Geiger, R., Eds.; Gebrüder Borntraeger: Berlin, Germany, 1936; Volume 1, pp. 1–44. (In German) [Google Scholar]
- Thornthwaite, C.W.; Mather, J.R. Instruction and Tables for Computing Potential Evapotranspiration and the Water Balance; Laboratory of Climatology: Centerton, NJ, USA, 1957; pp. 183–311. [Google Scholar]
- Gestro, C. Education to protection of biodiversity in Liguria. Ital. Bot. 2004, 36, 537–539. [Google Scholar]
- Balletti, F.; Soppa, S. The landscapes of the Portofino natural regional Park. In Nature Policies and Landscape Policies; Springer: Cham, Switzerland, 2015; pp. 415–422. [Google Scholar]
- Terranova, R. Squilibri geomorfologici e rischi sulla costa alta rocciosa occidentale del Promontorio di Portofino (Liguria Orientale). In Studi Geografici e Geologici in Onore di S. Belloni; Università degli Studi di Milano e Milano Bicocca: Bicocca, Italy, 1999; pp. 595–607. (In Italian) [Google Scholar]
- Terranova, R. Le frane del Castellaro e di S. Rocco sul versante occidentale del Promontorio di Portofino. In Atti Istituto di Geologia Università di Genova 1964; Istituto di geologia dell’Università di Genova: Genova, Italy, 1964; pp. 342–376. (In Italian) [Google Scholar]
- Guzzetti, F.; Cardinali, M.; Reichenbach, P. The AVI Project: A bibliographical and archive inventory of landslides and floods in Italy. Environ. Manag. 1994, 18, 623–633. [Google Scholar] [CrossRef]
- Hungr, O.; Evans, S.G.; Bovis, M.J.; Hutchinson, J.N. A review of the classification of landslides of the flow type. Environ. Eng. Geosci. 2001, 7, 221–238. [Google Scholar] [CrossRef]
- Hungr, O.; Leroueil, S.; Picarelli, L. The Varnes classification of landslide types, an update. Landslides 2014, 11, 167–194. [Google Scholar] [CrossRef]
- Regione Liguria. Inventario dei Fenomeni Franosi sc. 1:10000—Progetto IFFI. 2014. Available online: https://geoportal.regione.liguria.it/catalogo/mappe.html (accessed on 15 September 2020).
- Regional Agency for Environment Protection of Liguria—ARPAL, 2003–2020. Consultazione Dati Climatici. Available online: http://www.cartografiarl.regione.liguria.it/SiraQualMeteo/script/PubAccessoDatiMeteo.asp (accessed on 15 September 2020).
- National Hydrographic and Oceanographic Service—SIMN, 1917–2003. Annali Idrologici. Compartimento di Genova. Available online: http://www.acq.isprambiente.it/annalipdf/ (accessed on 15 September 2020).
- Brunetti, M.T.; Peruccaci, S.; Rossi, M.; Luciani, S.; Valigi, D.; Guzzetti, F. Rainfall thresholds for the possible occurrence of landslides in Italy. Nat. Hazards Earth Syst. Sci. 2010, 10, 447–458. [Google Scholar] [CrossRef]
- Tiranti, D.; Rabuffetti, D. Estimation of rainfall thresholds triggering shallow implementation. Landslides 2010, 7, 471–481. [Google Scholar] [CrossRef]
- Peruccacci, S.; Brunetti, M.T.; Luciani, S.; Vennari, C.; Guzzetti, F. Lithological and seasonal control on rainfall thresholds for the possible initiation of landslides in central Italy. Geomorphology 2012, 139, 79–90. [Google Scholar] [CrossRef]
- Silverman, B.W. Density Estimation for Statistics and Data Analysis; Chapman and Hall: London, UK, 1986; 176p. [Google Scholar]
- Scott, D.W. Multivariate Density Estimation: Theory, Practice and Visualization; Wiley: New York, NY, USA, 1992; 336p. [Google Scholar]
- Venables, W.N.; Ripley, B.D. Modern Applied Statistics with S.; Springer: New York, NY, USA, 2002; 495p. [Google Scholar]
- Mann, H.B. Nonparametric tests against trend. Econometrica 1945, 13, 245–259. [Google Scholar] [CrossRef]
- Kendall, M.G. Rank Correlation Methods; Griffin: London, UK, 1975; 196p. [Google Scholar]
- Wang, Y.; Xu, Y.; Tabari, H.; Wang, J.; Wang, Q.; Song, S.; Hu, Z. Innovative trend analysis of annual and seasonal rainfall in the Yangtze River Delta, eastern China. Atmos. Res. 2020, 231, 104673. [Google Scholar] [CrossRef]
- Theil, H. A rank-invariant method of linear and polynomial regression analysis. Proc. Roy. Neth. Acad. Sci. 1950, 53, 386–392. [Google Scholar]
- Sen, P.K. Estimates of the regression coefficient based on Kendall’s tau. J. Am. Stat. Assoc. 1968, 63, 1379–1389. [Google Scholar] [CrossRef]
- Fernandes, R.; Leblanc, S.G. Parametric (modified least squares) and non-parametric (Theil–Sen) linear regressions for predicting biophysical parameters in the presence of measurement errors. Remote Sens. Environ. 2005, 95, 303–316. [Google Scholar] [CrossRef]
- Hurst, H.E. Long-term storage of reservoirs: An experimental study. Trans. Am. Soc. Civ. Eng. 1951, 116, 770–799. [Google Scholar]
- Sakalauskiené, G. The Hurst phenomenon in hydrology. Environ. Res. Eng. Manag. 2003, 3, 16–20. [Google Scholar]
- Anis, A.A.; Lloyd, E.H. The expected value of the adjusted rescaled Hurst range of independent normal summands. Biometrika 1976, 63, 111–116. [Google Scholar] [CrossRef]
- Xu, Z.; Tang, Y.; Connor, T.; Li, D.; Li, Y.; Liu, J. Climate variability and trends at a national scale. Sci. Rep. 2017, 7, 3258. [Google Scholar] [CrossRef]
- López-Lambraño, A.A.; Fuentes, C.; López-Ramos, A.A.; Mata-Ramírez, J.; López-Lambraño, M. Spatial and temporal Hurst exponent variability of rainfall series based on the climatological distribution in a semiarid region in Mexico. Atmosphere 2018, 31, 199–219. [Google Scholar] [CrossRef]
- Chandrasekaran, S.; Poomalai, S.; Saminathan, B.; Suthanthiravel, S.; Sundaram, K.; Abdul Hakkim, F.F. An investigation on the relationship between the Hurst exponent and the predictability of a rainfall time series. Meteorol. Appl. 2019, 26, 511–519. [Google Scholar] [CrossRef] [Green Version]
- Faccini, F.; Benedettini, A.; Pelfini, M.; Brandolini, P. La frana costiera delle Gave nel Promontorio di Portofino (Liguria, Italia): Evoluzione recente e interazione con le opere antropiche. StudiCostieri 2014, 22, 45–56. (In Italian) [Google Scholar]
- Faccini, F.; Piccazzo, M.; Robbiano, A. Natural hazards in San Fruttuoso of Camogli (Portofino Park, Italy): A case study of a debris flow in a coastal environment. Boll. Soc. Geol. Ital. 2009, 128, 641–654. [Google Scholar]
- Parodi, A.; Boni, G.; Ferraris, L.; Siccardi, F.; Pagliara, P.; Trovatore, E.; Foufoula-Georgiou, E.; Kranzmüller, D. The “perfect storm”: From across the Atlantic to the hills of Genoa. EOS T. Am. Geophys. Union 2012, 93, 225. [Google Scholar] [CrossRef]
- Ceriani, M.; Lauzi, S.; Padovan, N. Rainfall thresholds triggering debris flows in the alpine area of Lombardia Region, central Alps. In Proceedings of the Man and Mountain ’94 Proceedings Ponte di Legno, Ponte di Legno, Italy, 20–24 June 1994; pp. 123–139. [Google Scholar]
- Crosta, G.B.; Frattini, P. Rainfall thresholds for triggering soil slips and debris flow. In Proceedings of the 2nd EGS Plinius Conference on Mediterranean Storms, Siena, Italy, 1–3 October 2001; pp. 463–487. [Google Scholar]
- Jakob, M.; Weatherly, H. A hydroclimatic threshold for landslide initiation on the North Shore Mountains of Vancouver, British Columbia. Geomorphology 2003, 54, 137–156. [Google Scholar] [CrossRef]
- Marchi, L.; Arattano, M.; Deganutti, A.M. Ten years of debris flow monitoring in the Moscardo Torrent (Italian Alps). Geomorphology 2002, 46, 1–17. [Google Scholar] [CrossRef]
- Floris, M.; Mari, M.; Romeo, R.W.; Gori, U. Modelling of landslides-triggering factors—A case study in the Northern Apennines, Italy. In Engineering Geology for Infrastructure Planning in Europe. Lecture Notes in Earth Sciences; Hack, R., Azzam, R., Chalier, R., Eds.; Springer: Berlin/Heidelberg, Germany, 2004; Volume 104, pp. 745–753. [Google Scholar] [CrossRef]
- Giannecchini, R. Relationship between rainfall and shallow landslides in southern Apuane Alps (Italy). Nat. Hazards Earth Syst. Sci. 2006, 6, 357–364. [Google Scholar] [CrossRef]
- Cevasco, A.; Pepe, G.; Brandolini, P. The influences of geological and land use settings on shallow landslides triggered by an intense rainfall event in a coastal terraced environment. Bull. Eng. Geol. Environ. 2014, 73, 859–875. [Google Scholar] [CrossRef]
- Peruccacci, S.; Brunetti, M.T.; Gariano, S.L.; Melillo, M.; Rossi, M.; Guzzetti, F. Rainfall thresholds for possible landslide occurrence in Italy. Geomorphology 2017, 290, 39–57. [Google Scholar] [CrossRef]
- Anagnostopoulou, C.; Tolika, K.; Flocas, H.; Maheras, P. Cyclones in the Mediterranean region: Present and future climate scenarios derived from a general circulation model (HadAM3P). Adv. Geosci. 2006, 7, 9–14. [Google Scholar] [CrossRef] [Green Version]
- Rossi, M.; Luciani, S.; Valigi, D.; Kirschbaum, D.; Brunetti, M.T.; Peruccacci, S.; Guzzetti, F. Statistical approaches for the definition of landslide rainfall thresholds and their uncertainty using rain gauge and satellite data. Geomorphology 2017, 285, 16–27. [Google Scholar] [CrossRef]
- Goubanova, K.; Li, L. Extremes in temperature and precipitation around the Mediterranean basin in an ensemble of future climate scenario simulations. Glob. Planet. Chang. 2007, 57, 27–42. [Google Scholar] [CrossRef]
- Drobinski, P.; Da Silva, N.; Panthou, G.; Bastin, S.; Muller, C.; Ahrens, B.; Borga, M.; Conte, D.; Fosser, G.; Giorgi, F.; et al. Scaling precipitation extremes with temperature in the Mediterranean: Past climate assessment and projection in anthropogenic scenarios. Clim. Dyn. 2018, 51, 1237–1257. [Google Scholar] [CrossRef] [Green Version]
- RECONECT Project—Regenerating ECOsystems with Nature-Based Solutions for Hydrometeorological Risk rEduCTion. Available online: www.reconect.eu (accessed on 28 October 2020).
- Tramblay, Y.; Samuel, S. Future evolution of extreme precipitation in the Mediterranean. Clim. Chang. 2018, 151, 289–302. [Google Scholar] [CrossRef]


| Name | Source | Scale/Pixel | Date | Type |
|---|---|---|---|---|
| Administrative unit | Liguria Region | 1:5000 | 2018 | Vector |
| Aspect | Liguria Region | 1:10,000 | 2007 | Vector |
| Digital Terrain Model | Liguria Region | 5 m | 2016 | Raster |
| Hydrographic network | Liguria Region | 1:10,000 | 2019 | Vector |
| Hydrographic basins | Liguria Region | 1:10,000 | 2019 | Vector |
| Landslides-IFFI Project | Liguria Region | 1:10,000 | 2014 | Vector |
| Lithology | Liguria Region | 1:10,000 | 2017 | Vector |
| Nature Reserves Borders | Liguria Region | 1:10,000 | 2019 | Vector |
| Orthophotography | Liguria Region | 0.15 m | 2004 | Raster |
| Orthophotography | Google Earth | 2.5 m | 2019 | Raster |
| Regional Technical Cartography | Liguria Region | 1:5000 | 2006 | Raster |
| Slope | Liguria Region | 1:10,000 | 2016 | Vector |
| Rain Gauge | Authority | Name | Type | Start | End |
|---|---|---|---|---|---|
| Genova—Università | SIMN ARPAL | GUN | H | 1883 2003 | 1998 In use 1 |
| Genova—Ponte Carrega 2 | SIMN ARPAL | GPC | H | 1938 2003 | 2002 In use |
| Genova—S. Ilario | SIMN | GIA | D | 1939 | 1998 |
| ARPAL | GSI | H | 2010 | In use | |
| Colonia—Arnaldi | SIMN | CRN | D | 1933 | 1993 |
| ARPAL | H | 2003 | 2015 | ||
| Polanesi | SIMN | POL | H | 2003 | 2009 |
| Camogli—Nautical College | SIMN | CIN | D | 1969 | 1998 |
| ARPAL | CAM | H | 2015 | In use | |
| San Rocco | Privat | SRC | H | ||
| Monte di Portofino | ARPAL | MTP | H | 2009 | 2019 |
| Portofino—Semaforo Vecchio | IRN | PTS | D | 1894 | 1942 |
| Nozarego | SIMN | NZR | D | 1926 | 1949 |
| Santa Margherita Ligure | SIMN | SMS | D | 1950 | 1978 |
| ARPAL | SML | H | 2013 | 2019 | |
| Rapallo | ARPAL | RPL | H | 2013 | In use |
| San Pietro di Novella | SIMN | SPN | D | 1919 | 1950 |
| Neirone | SIMN | NRE | D | 1928 | 1998 |
| Ognio | SIMN | OGN | D | 1920 | 1979 |
| ARPAL | H | 2012 | In use | ||
| Croce di Orero | ARPAL | CRO | H | 2012 | In use |
| Favale di Malvaro | SIMN | FML | D | 1932 | 1998 |
| Piana di Soglio | SIMN | PDS | D | 1936 | 1998 |
| Pian dei Ratti | ARPAL | PRT | H | 2012 | In use |
| Chiavari | SIMN 3 | CHV | D | 1884 | 1987 |
| ARPAL 4 | CHC | H | 2001 | 2018 | |
| ARPAL 5 | CHR | H | 2015 | In use | |
| Panesi | SIMN | PAN | D | 1933 | 1998 |
| ARPA | H | 2003 | In use |
| Period | Date, Number of Events |
|---|---|
| 1910–1919 | 1911 (1)–1913 (1)–1915 (1) |
| 1920–1929 | No events |
| 1930–1939 | No events |
| 1940–1949 | 1945 (1) |
| 1950–1959 | 1953 (1)–1958 (1)–1959 (2) |
| 1960–1969 | 1960 (1)S–1961 (3)–1963 (3)–1964 (3) |
| 1970–1979 | 1970 (2)–1971 (1)–1974 (1)–1978 (1)–1979 (1) |
| 1980–1989 | 1986 (1)–1987 (1) |
| 1990–1999 | 1992 (1)–1994 (2)–1995 (3)–1996 (1)–1997 (2)–1999 (3) |
| 2000–2009 | 2000 (2)–2001 (1)–2002 (1)–2003 (1)–2007 (1)–2008 (3)–2009 (4) |
| 2010–2019 | 2010 (2)–2011 (5)–2012 (2)–2013 (4)–2014 (8)–2016 (5)–2018 (6)–2019 (2) |
| Statistics | Genova University | Chiavari | ||
|---|---|---|---|---|
| Rainfall Rate (mm/d) | Rainy Days | Rainfall Rate | Rainy Days | |
| Mean | 12.70 | 100.14 | 13.92 | 84.69 |
| Median | 12.18 | 100 | 13.82 | 85 |
| Maximum | 22.11 | 160 | 24.48 | 115 |
| Minimum | 8.13 | 47 | 8.89 | 45 |
| Statistics | Genova Ponte Carrega | Chiavari | ||||||||
|---|---|---|---|---|---|---|---|---|---|---|
| 1 h | 3 h | 6 h | 12 h | 24 h | 1 h | 3 h | 6 h | 12 h | 24 h | |
| Mean | 50.0 | 75.7 | 95.8 | 119.9 | 150.0 | 44.5 | 64.9 | 78.5 | 92.3 | 108.6 |
| Median | 43.0 | 64.4 | 80.4 | 102.6 | 130.2 | 38.6 | 56.1 | 69.5 | 83.4 | 103.6 |
| Maximum | 124.2 | 230.0 | 283.6 | 418.0 | 453.4 | 126.0 | 201.0 | 208.0 | 220.4 | 248.6 |
| Minimum | 17.0 | 24.6 | 35.0 | 40.0 | 45.2 | 10.6 | 18.6 | 19.0 | 19.4 | 30.8 |
| Statistics | Genova University | Chiavari | ||
|---|---|---|---|---|
| RD | RR | RD | RR | |
| z-stat | −9.1689 | 5.3449 | −3.1849 | 1.4719 |
| p-value | 4.7789 × 10⁻²⁰ | 9.0492 × 10⁻⁸ | 0.0014 | 0.1411 |
| trend | yes | yes | yes | no |
| Sen’s slope | −0.2468 | 0.0189 | −0.0976 | 0.0068 |
| lower | −0.2875 | 0.0123 | −0.1486 | −0.0023 |
| upper | −0.2041 | 0.02558 | −0.0385 | 0.0158 |
| Statistics | Genova University | Chiavari | ||
|---|---|---|---|---|
| RD | RR | RD | RR | |
| Hurst exp. | 0.825 | 0.972 | 0.652 | 0.855 |
| Hurst exp. Corr. | 0.740 | 0.875 | 0.571 | 0.747 |
| Statisitc | Genova Ponte Carrega | Chiavari | ||||||||
|---|---|---|---|---|---|---|---|---|---|---|
| 1 h | 3 h | 6 h | 12 h | 24 h | 1 h | 3 h | 6 h | 12 h | 24 h | |
| Hurst exp. | 0.787 | 0.686 | 0.633 | 0.689 | 0.707 | 0.699 | 0.806 | 0.845 | 0.836 | 0.683 |
| Corrected Hurst exp. | 0.638 | 0.548 | 0.504 | 0.551 | 0.567 | 0.563 | 0.657 | 0.694 | 0.686 | 0.549 |
| # | Extent | Area | Landslide Type | Threshold Curve | Range | Note |
|---|---|---|---|---|---|---|
| 1 | G | Worldwide | Sh, D | I = 14.82 D−0.39 | 0.167 < D < 500 | Power low equation, minimum threshold |
| 2 | R | Lombardy, Italy | A | I = 20.1 D−0.55 | 1 < D < 1000 | Power low equation, minimum threshold |
| 3 | G | Worldwide | Sh | I = 0.48 + 7.2 D−1.00 | 0.1 < D < 1000 | Hyperbolic thresholds |
| 4 | R | North Shore Mountains, Canada | Sh | I = 4.0 D−0.45 | 0.1 < D < 150 | Statistical approach, discriminant function |
| 5 | C | Moscardo basin, Italy | A | I = 15 D−0.70 | 1 < D < 30 | Manual fitting, minimum threshold |
| 6 | R | Piedmont, Italy | Sh | I = 19 D−0.50 | 4 < D < 150 | Probabilistic approach, 10% exceedance probability |
| 7 | L | Valzangona, Italy | A | I = 18.83 D−0.59 | 24 < D < 3360 | Visual interpolation curve |
| 8 | L | Apuane Alps, Italy | Sh | I = 26.871 D−0.638 | 0.1 < D < 35 | Manual fitting, minimum threshold |
| 9 | L | Apuane Alps, Italy | Sh | I = 38.636 D−0.743 | 0.1 < D < 12 | Manual fitting, minimum threshold |
| 10 | G | Worldwide | Sh, D | I = 2.20 D−0.44 | 1 < D < 1000 | Bayesian approach, minimum threshold |
| 11 | R | Abruzzo, Italy | A | I = 5.64 D−0.55 | 12 < D < 120 | Frequentist approach, 5% exceedance probability |
| 12 | C | Bisagno basin, Italy | Sh | I = 14.5 D−0.525 | 4 < D < 10 | Manual fitting, minimum threshold |
| 13 | C | Bisagno basin, Italy | Sh | I = 59.98 D−0.705 | 10 < D < 24 | Manual fitting, minimum threshold |
| 14 | R | Apennine mountain system | A | I = 8.6 D−0.64 | 1 < D < 918 | Frequentist approach, 5% exceedance probability |
| 15 | R | Csa climate regions | A | I = 8.6 D−0.65 | 1 < D < 1176 | Frequentist approach, 5% exceedance probability |
| 16 | C | Entella Basin, Italy | Sh | I = 11.28 D−0.60 | 4 < D < 170 | Frequentist approach, 5% exceedance probability |
| Period | CV | |
|---|---|---|
| Years | Genova | Chiavari |
| 1840–1869 | 0.14 | - |
| 1870–1899 | 0.16 | - |
| 1900–1929 | 0.20 | 0.13 |
| 1930–1959 | 0.16 | 0.11 |
| 1960–1989 | 0.19 | 0.16 |
| 1990–2019 | 0.24 | 0.22 |
Publisher’s Note: MDPI stays neutral with regard to jurisdictional claims in published maps and institutional affiliations. |
© 2020 by the authors. Licensee MDPI, Basel, Switzerland. This article is an open access article distributed under the terms and conditions of the Creative Commons Attribution (CC BY) license (http://creativecommons.org/licenses/by/4.0/).
Share and Cite
Roccati, A.; Paliaga, G.; Luino, F.; Faccini, F.; Turconi, L. Rainfall Threshold for Shallow Landslides Initiation and Analysis of Long-Term Rainfall Trends in a Mediterranean Area. Atmosphere 2020, 11, 1367. https://0-doi-org.brum.beds.ac.uk/10.3390/atmos11121367
Roccati A, Paliaga G, Luino F, Faccini F, Turconi L. Rainfall Threshold for Shallow Landslides Initiation and Analysis of Long-Term Rainfall Trends in a Mediterranean Area. Atmosphere. 2020; 11(12):1367. https://0-doi-org.brum.beds.ac.uk/10.3390/atmos11121367
Chicago/Turabian StyleRoccati, Anna, Guido Paliaga, Fabio Luino, Francesco Faccini, and Laura Turconi. 2020. "Rainfall Threshold for Shallow Landslides Initiation and Analysis of Long-Term Rainfall Trends in a Mediterranean Area" Atmosphere 11, no. 12: 1367. https://0-doi-org.brum.beds.ac.uk/10.3390/atmos11121367