Vertical Profiles of Atmospheric Species Concentrations and Nighttime Boundary Layer Structure in the Dry Season over an Urban Environment in Central Amazon Collected by an Unmanned Aerial Vehicle

 ,
,  , , , , and
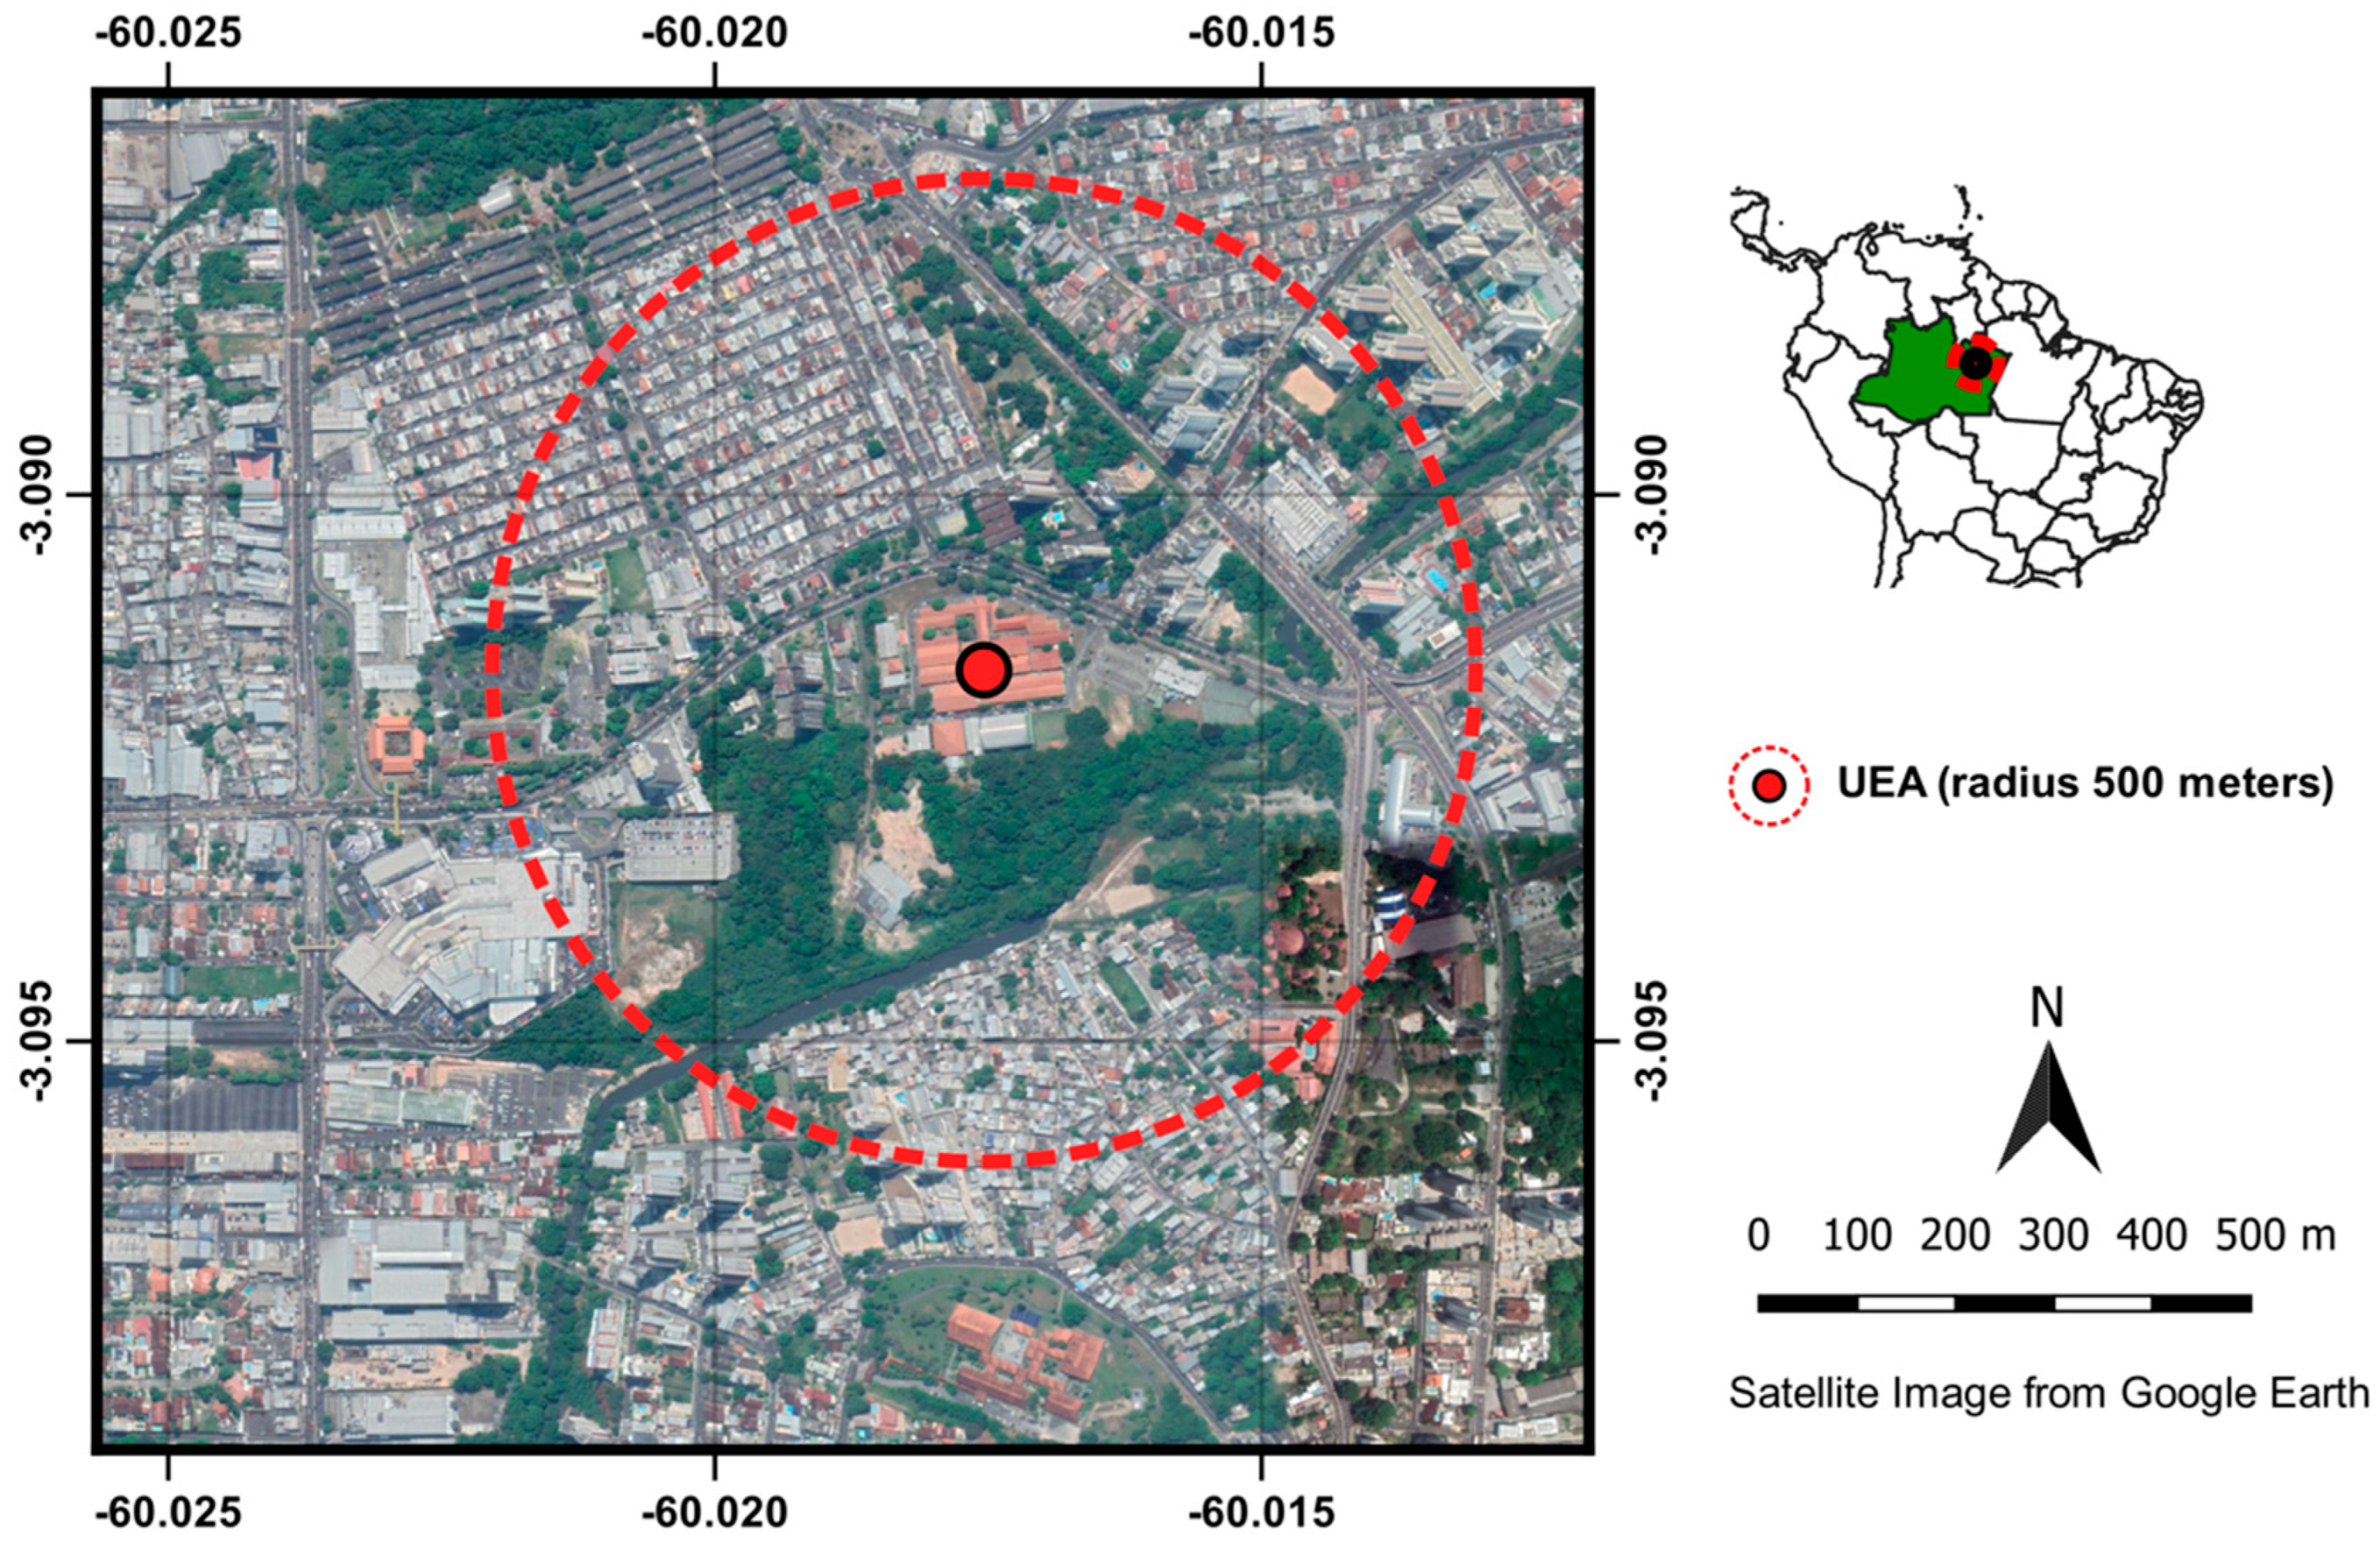
Abstract
:1. Introduction
2. Experiment
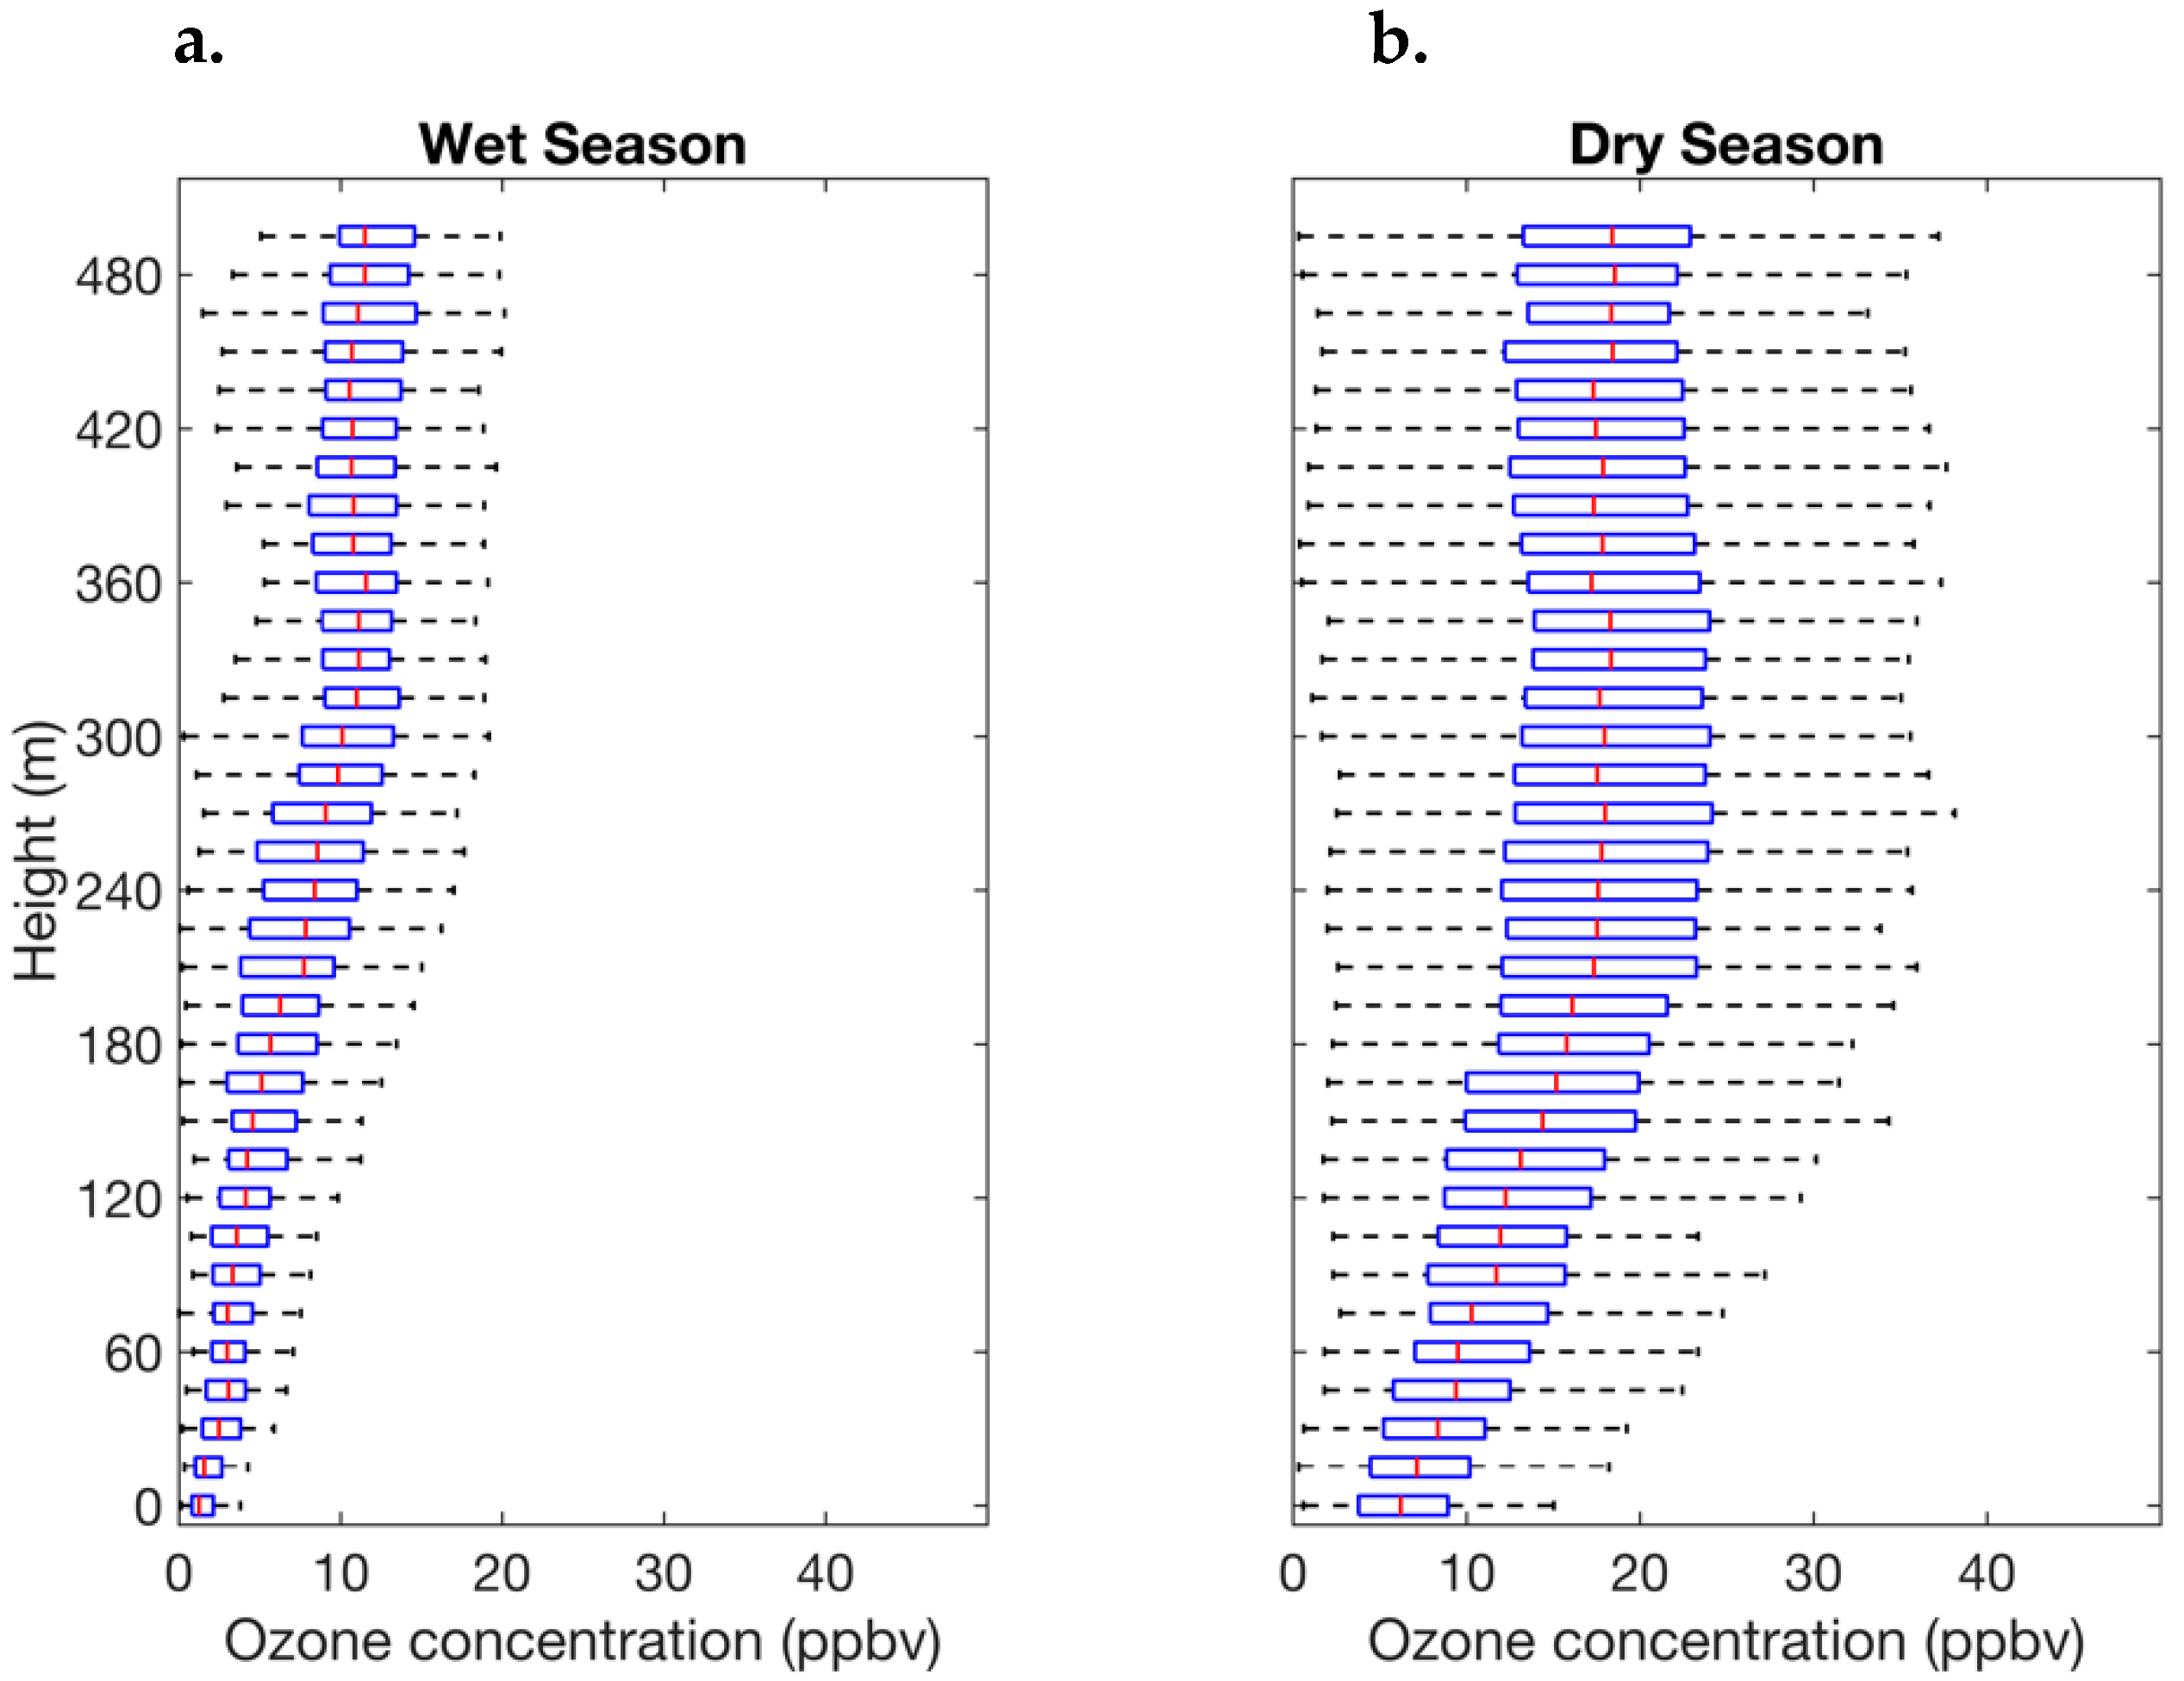
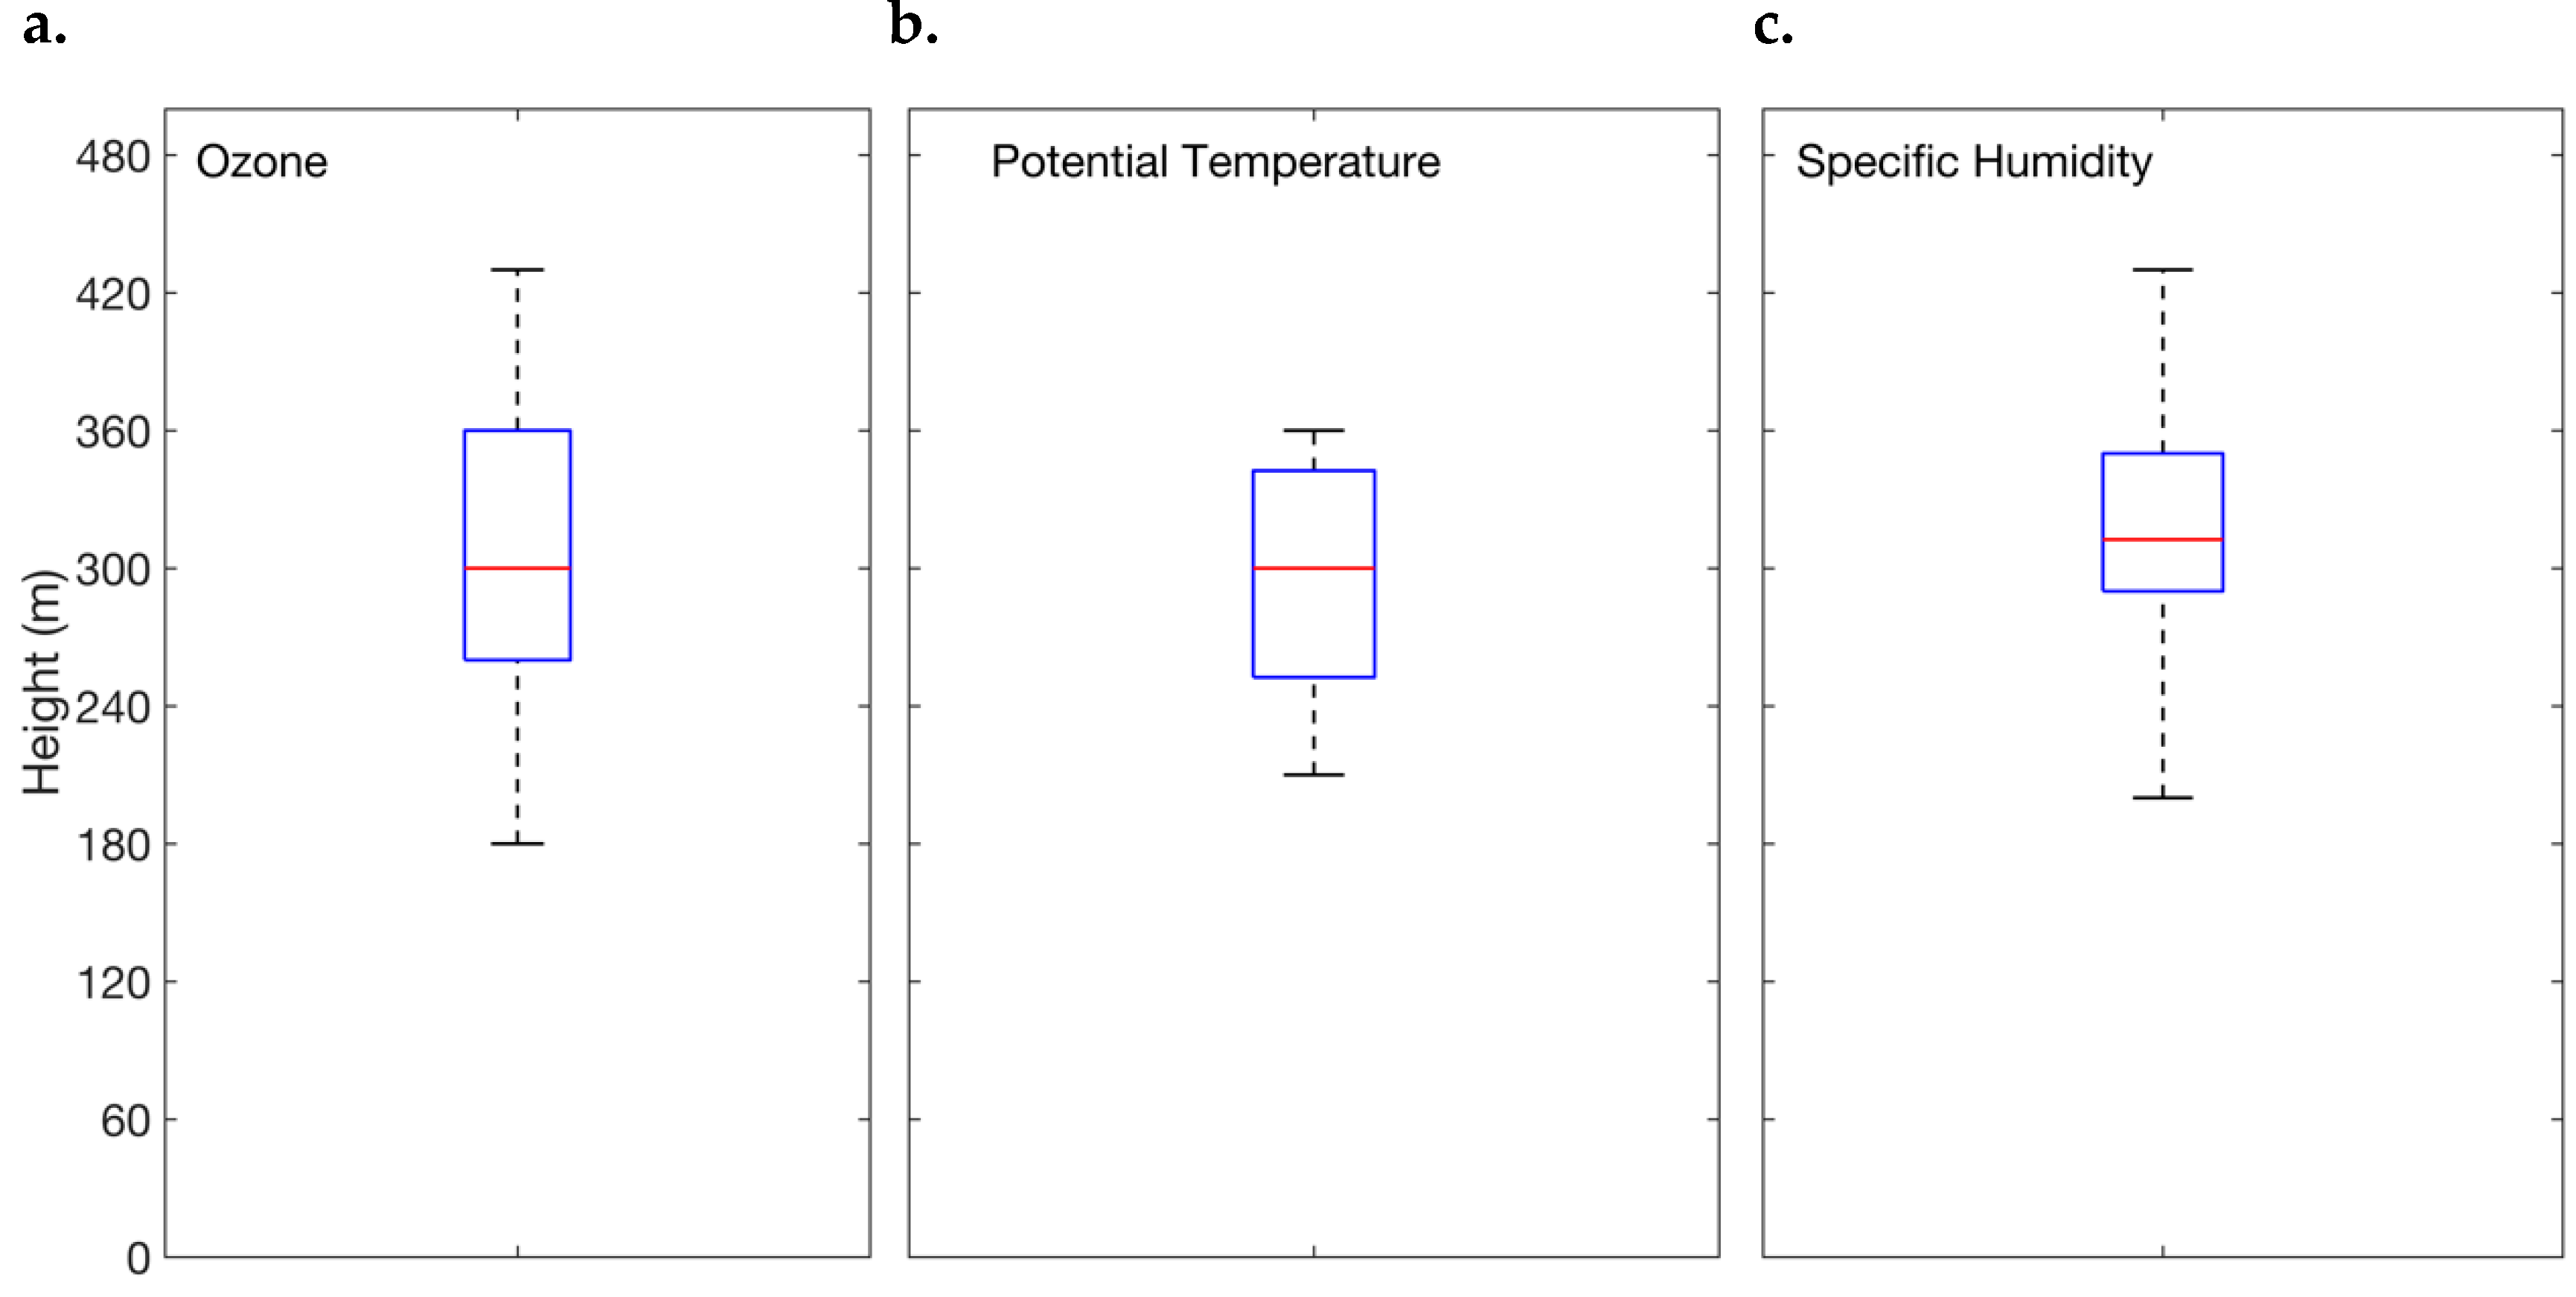
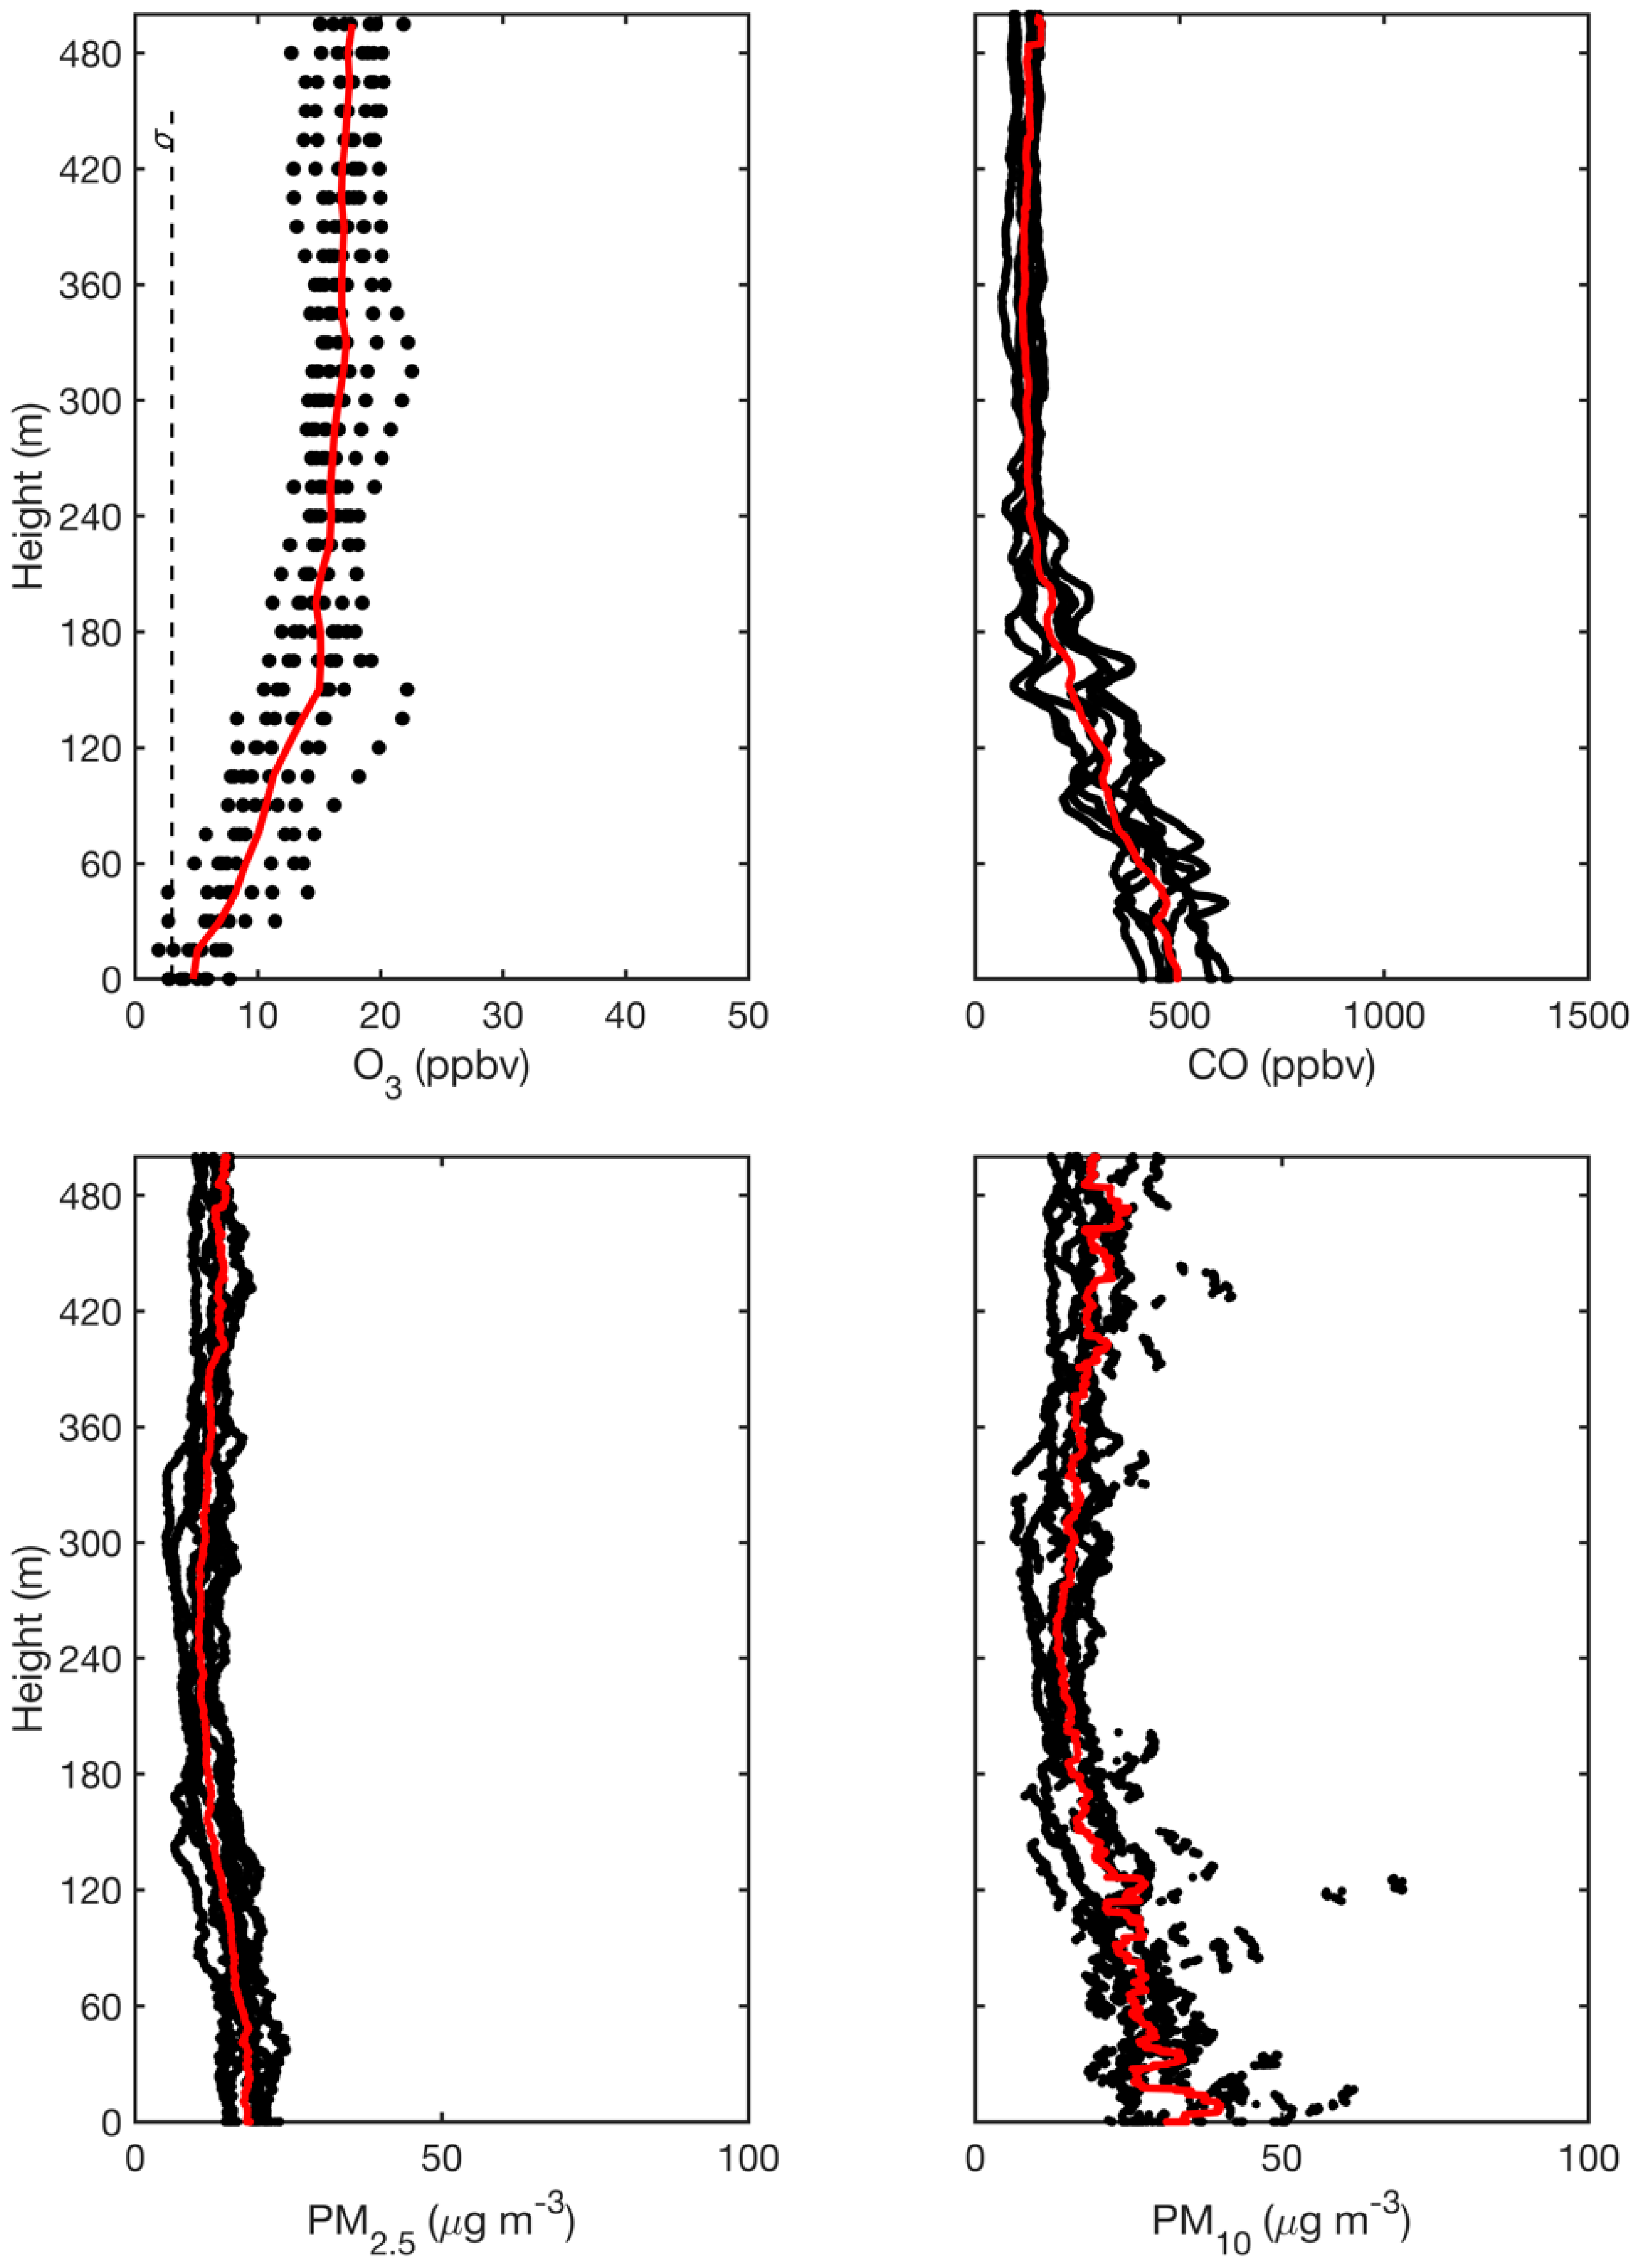
3. Results and Discussion
4. Conclusions
Supplementary Materials
Author Contributions
Funding
Conflicts of Interest
Data Availability
References
- Garstang, M.; Fitzjarrald, D.R. Observations of Surface to Atmosphere Interactions in the Tropics; Oxford University Press: Oxford, UK, 1999. [Google Scholar]
- Harriss, R.C.; Wofsy, S.C.; Garstang, M.; Browell, E.V.; Molion, L.C.B.; McNeal, R.J.; Hoell, J.M.; Bendura, R.J.; Beck, S.M.; Navarro, R.L.; et al. The Amazon Boundary Layer Experiment (ABLE 2A): Dry season 1985. J. Geophys. Res. Space Phys. 1988, 93, 1351. [Google Scholar] [CrossRef]
- Kirchhoff, V.W.J.H.; Rasmussen, R.A. Time variations of CO and O3 concentrations in a region subject to biomass burning. J. Geophys. Res. Space Phys. 1990, 95, 7521. [Google Scholar] [CrossRef]
- Martin, C.L.; Fitzjarrald, D.; Garstang, M.; Oliveira, A.P.; Greco, S.; Browell, E. Structure and growth of the mixing layer over the Amazonian rain forest. J. Geophys. Res. Space Phys. 1988, 93, 1361. [Google Scholar] [CrossRef]
- Carneiro, R.G.; Henkes, A.; Fisch, G.; Borges, C.K. Study of the daily cycle of the planetary boundary layer during the rainy season in the Amazon (GOAMAZON 2014/15). Sci. Nat. 2018, 40, 63–68. [Google Scholar]
- Fisch, G. Camada Limite Amazônica: Aspectos Observacionais e de Modelagem (Amazonian Boundary Lyer: Observations and Modeling). Ph.D. Thesis, Instituto Nacional de Pesquisas Espaciais (National Institute for Space Research), São José dos Campos, Brazil, December 1995. [Google Scholar]
- Neves, T.T.D.A.T.; Fisch, G. Night limit layer on pasture area in the Amazon. Rev. Bras. Meteorol. 2011, 26, 619–628. [Google Scholar] [CrossRef] [Green Version]
- Santos, R.D.; Fisch, G.; Dolman, A.; Waterloo, M. Modelagem da Camada Limite Noturna (CLN) durante a época úmida na Amazônia, sob diferentes condições de desenvolvimento. Rev. Bras. Meteorol. 2007, 22, 387–407. [Google Scholar] [CrossRef]
- Santos, R.M.N. Nighttime Boundary Layer Studies in the Amazon. Ph.D. Thesis, Instituto Nacional de Pesquisas Espaciais (National Institute for Space Research), Sao Jose dos Campos, Brazil, 2005. [Google Scholar]
- Guimarães, P.; Ye, J.; Batista, C.; Barbosa, R.; Ribeiro, I.; Medeiros, A.; Souza, R.; Martin, S.T. Vertical profiles of Ozone concentration collected by an Unmanned Aerial Vehicle and the mixing of the Nighttime Boundary Layer over an Amazonian Urban Area. Atmosphere 2019, 10, 599. [Google Scholar] [CrossRef] [Green Version]
- Stull, R.B. An Introduction to Boundary Mayer Meteorology; Kluwer: Dordrecht, The Netherlands, 1988. [Google Scholar]
- Betts, A.; Fisch, G.; von Randow, C.; Dias, M.S.; Cohen, J.; da Silva, R.; Fitzjarrald, D. The Amazon Boundary Layer and Mesoscale Circulations in Amazonia and Global Change; American Geophysical Union: Washington, DC, USA, 2009. [Google Scholar]
- Arya, P.S. Introduction to Micrometeorology, 2nd ed.; Academic Press: Cambridge, MA, USA, 2001. [Google Scholar]
- Barlow, J.F.; Halios, C.H.; Lane, S.E.; Wood, C.R. Observations of urban boundary layer structure during a strong urban heat island event. Environ. Fluid Mech. 2015, 15, 373–398. [Google Scholar] [CrossRef] [Green Version]
- Oke, T. Boundary Layer Climates, 2nd ed.; University Press: Cambridge, MA, USA, 1987; p. 435. [Google Scholar]
- Sánchez, M.P.; de Oliveira, A.P.; Valdés, J.T.; Codato, G.; Varona, R.P.; Marques Filho, E.P.; Dutra Ribeiro, F.N.; Rocha Pereira, M.M. Observational Investigation of the Nocturnal Low-Level Jet in the Metropolitan Region of São Paulo. 2017. Available online: http://repositorio.geotech.cu/ (accessed on 12 October 2020).
- Corsmeier, U.; Kalthoff, N.; Kolle, O.; Kotzian, M.; Fiedler, F. Ozone concentration jump in the stable nocturnal boundary layer during a LLJ-event. Atmos. Environ. 1997, 31, 1977–1989. [Google Scholar] [CrossRef]
- Aneja, V.P.; Mathur, R.; Arya, S.P.; Li, Y.; Murray, G.C.; Manuszak, T.L. Coupling the Vertical Distribution of Ozone in the Atmospheric Boundary Layer. Environ. Sci. Technol. 2000, 34, 2324–2329. [Google Scholar] [CrossRef]
- Salmond, J.; McKendry, I. Secondary ozone maxima in a very stable nocturnal boundary layer: Observations from the Lower Fraser Valley, BC. Atmos. Environ. 2002, 36, 5771–5782. [Google Scholar] [CrossRef]
- Martin, S.T.; Artaxo, P.; Machado, L.A.; Manzi, A.O.; Souza, R.A.F.; Schumacher, C.; Wang, J.; Andreae, M.O.; Barbosa, H.M.J.; Fan, J.; et al. Introduction: Observations and Modeling of the Green Ocean Amazon (GoAmazon2014/5). Atmos. Chem. Phys. Discuss. 2016, 16, 4785–4797. [Google Scholar] [CrossRef] [Green Version]
- Martin, S.T.; Andreae, M.O.; Artaxo, P.; Baumgardner, D.; Chen, Q.; Goldstein, A.H.; Guenther, A.; Heald, C.L.; Mayol-Bracero, O.L.; McMurry, P.H.; et al. Sources and properties of Amazonian aerosol particles. Rev. Geophys. 2010, 48. [Google Scholar] [CrossRef] [Green Version]
- Kirchhoff, V.W.J.H.; Browell, E.V.; Gregory, G.L. Ozone measurements in the troposphere of an Amazonian rain forest environment. J. Geophys. Res. Space Phys. 1988, 93, 15850. [Google Scholar] [CrossRef] [Green Version]
- Rummel, U. Turbulent Exchange of Ozone and Nitrogen Oxides between an Amazonian Rain Forest and the Atmosphere. Ph.D. Thesis, University of Bayreuth, Bayreuth, Germany, 2005; p. 264. [Google Scholar]
- Chambers, S.D.; Wang, F.; Williams, A.G.; Deng, X.; Zhang, H.; Lonati, G.; Crawford, J.; Griffiths, A.D.; Iannello, A.; Allegrini, I. Quantifying the influences of atmospheric stability on air pollution in Lanzhou, China, using a radon-based stability monitor. Atmos. Environ. 2015, 107, 233–243. [Google Scholar] [CrossRef]
- Dang, R.; Yang, Y.; Hu, X.; Wang, Z.; Zhang, S. A Review of Techniques for Diagnosing the Atmospheric Boundary Layer Height (ABLH) Using Aerosol Lidar Data. Remote Sens. 2019, 11, 1590. [Google Scholar] [CrossRef] [Green Version]
- Gerbig, C.; Körner, S.; Lin, J.C. Vertical mixing in atmospheric tracer transport models: Error characterization and propagation. Atmos. Chem. Phys. Discuss. 2008, 8, 591–602. [Google Scholar] [CrossRef] [Green Version]
- Gibert, F.; Schmidt, M.; Cuesta, J.; Ciais, P.; Ramonet, M.; Xueref, I.; Larmanou, E.; Flamant, P.H. Retrieval of average CO2fluxes by combining in situ CO2measurements and backscatter lidar information. J. Geophys. Res. Space Phys. 2007, 112. [Google Scholar] [CrossRef] [Green Version]
- Janssen, R.H.H.; De Arellano, J.V.-G.; Ganzeveld, L.N.; Kabat, P.; Jimenez, J.L.; Farmer, D.K.; Van Heerwaarden, C.C.; Mammarella, I. Combined effects of surface conditions, boundary layer dynamics and chemistry on diurnal SOA evolution. Atmos. Chem. Phys. Discuss. 2012, 12, 6827–6843. [Google Scholar] [CrossRef] [Green Version]
- Pal, S.; Lee, T.; Phelps, S.; De Wekker, S. Impact of atmospheric boundary layer depth variability and wind reversal on the diurnal variability of aerosol concentration at a valley site. Sci. Total Environ. 2014, 496, 424–434. [Google Scholar] [CrossRef]
- Pal, S.; Patra, A.S.; Ghorai, S.; Sarkar, A.K.; Mahato, V.; Sarkar, S.; Singh, R. Efficient and rapid adsorption characteristics of templating modified guar gum and silica nanocomposite toward removal of toxic reactive blue and Congo red dyes. Bioresour. Technol. 2015, 191, 291–299. [Google Scholar] [CrossRef] [PubMed]
- Alvarado, M.; Gonzalez, F.; Erskine, P.; Cliff, D.; Heuff, D. A Methodology to Monitor Airborne PM10 Dust Particles Using a Small Unmanned Aerial Vehicle. Sensors 2017, 17, 343. [Google Scholar] [CrossRef] [PubMed]
- Aurell, J.; Mitchell, W.; Chirayath, V.; Jonsson, J.; Tabor, D.; Gullett, B. Field determination of multipollutant, open area combustion source emission factors with a hexacopter unmanned aerial vehicle. Atmos. Environ. 2017, 166, 433–440. [Google Scholar] [CrossRef]
- Chen, Q.; Li, X.-B.; Song, R.; Wang, H.-W.; Li, B.; He, H.-D.; Peng, Z.-R. Development and utilization of hexacopter unmanned aerial vehicle platform to characterize vertical distribution of boundary layer ozone in wintertime. Atmos. Pollut. Res. 2020, 11, 1073–1083. [Google Scholar] [CrossRef]
- Chen, Q.; Wang, D.; Li, X.-B.; Li, B.; Song, R.; He, H.-D.; Peng, Z.-R. Vertical Characteristics of Winter Ozone Distribution within the Boundary Layer in Shanghai Based on Hexacopter Unmanned Aerial Vehicle Platform. Sustainability 2019, 11, 7026. [Google Scholar] [CrossRef] [Green Version]
- McKinney, K.A.; Wang, D.; Ye, J.; De Fouchier, J.-B.; Guimarães, P.C.; Batista, C.E.; Souza, R.A.F.; Alves, E.G.; Gu, D.; Guenther, A.B.; et al. A sampler for atmospheric volatile organic compounds by copter unmanned aerial vehicles. Atmos. Meas. Tech. 2019, 12, 3123–3135. [Google Scholar] [CrossRef] [Green Version]
- Villa, T.F.; Salimi, F.; Morton, K.; Morawska, L.; Gonzalez, F. Development and Validation of a UAV Based System for Air Pollution Measurements. Sensors 2016, 16, 2202. [Google Scholar] [CrossRef] [Green Version]
- Pan, J.-S.; Liu, N.; Chu, S.-C. A Hybrid Differential Evolution Algorithm and Its Application in Unmanned Combat Aerial Vehicle Path Planning. IEEE Access 2020, 8, 17691–17712. [Google Scholar] [CrossRef]
- Ma, Y.; Ye, J.; Ribeiro, I.O.; Vilà-Guerau de Arellano, J.; Xin, J.; Martin, S.T. Optimization and representativeness of atmospheric chemical sampling by hovering unmanned aerial vehicles. Harv. Dataverse. in peer review.
- Draxler, R.R.; Hess, G. An overview of the HYSPLIT_4 modelling system for trajectories. Aust. Meteorol. Mag. 1998, 47, 295–308. [Google Scholar]
- Stein, A.; Draxler, R.R.; Rolph, G.D.; Stunder, B.J.; Cohen, M.; Ngan, F. NOAA’s HYSPLIT atmospheric transport and dispersion modeling system. Bull. Am. Meteorol. Soc. 2015, 96, 2059–2077. [Google Scholar] [CrossRef]
- INPE. 2020. Available online: http://queimadas.dgi.inpe.br/queimadas/portal (accessed on 25 September 2020).
- Souza, C.M.; Shimbo, J.Z.; Rosa, M.R.; Parente, L.L.; Alencar, A.; Rudorff, B.F.; Hasenack, H.; Matsumoto, M.; Ferreira, L.G.; Souza-Filho, P.W.M.; et al. Reconstructing Three Decades of Land Use and Land Cover Changes in Brazilian Biomes with Landsat Archive and Earth Engine. Remote Sens. 2020, 12, 2735. [Google Scholar] [CrossRef]
- Zilitinkevich, S.S.; Esau, I.N. Similarity Theory and Calculation of Turbulent Fluxes at the Surface for the Stably Stratified Atmospheric Boundary Layer in Atmospheric Boundary Layers; Springer: New York, NY, USA, 2007. [Google Scholar]
- Fisch, G.; Marengo, J.A.; Nobre, C.A. A general review of the climate in the Amazon. Acta Amazon. 1998, 28, 101. [Google Scholar] [CrossRef]
- Rummel, U.; Ammann, C.; Kirkman, G.A.; Moura, M.A.L.; Foken, T.; Andreae, M.O.; Meixner, F.X. Seasonal variation of ozone deposition to a tropical rain forest in southwest Amazonia. Atmos. Chem. Phys. Discuss. 2007, 7, 5415–5435. [Google Scholar] [CrossRef] [Green Version]
- Medeiros, A.S.; Calderaro, G.; Guimarães, P.; Magalhaes, M.R.; Morais, M.V.B.; Rafee, S.A.A.; Ribeiro, I.O.; Andreoli, R.V.; Martins, J.A.; Martins, L.D.; et al. Power plant fuel switching and air quality in a tropical, forested environment. Atmos. Chem. Phys. 2017, 17, 8987–8998. [Google Scholar] [CrossRef] [Green Version]
- Rafee, S.A.A.; Martins, L.D.; Kawashima, A.B.; Almeida, D.S.; Morais, M.V.B.; Souza, R.V.A.; Oliveira, M.B.L.; Souza, R.A.F.; Medeiros, A.S.S.; Urbina, V.; et al. Contributions of mobile, stationary and biogenic sources to air pollution in the Amazon rainforest: A numerical study with the WRF-Chem model. Atmos. Chem. Phys. Discuss. 2017, 17, 7977–7995. [Google Scholar] [CrossRef] [Green Version]


Publisher’s Note: MDPI stays neutral with regard to jurisdictional claims in published maps and institutional affiliations. |
© 2020 by the authors. Licensee MDPI, Basel, Switzerland. This article is an open access article distributed under the terms and conditions of the Creative Commons Attribution (CC BY) license (http://creativecommons.org/licenses/by/4.0/).
Share and Cite
Guimarães, P.; Ye, J.; Batista, C.; Barbosa, R.; Ribeiro, I.; Medeiros, A.; Zhao, T.; Hwang, W.-C.; Hung, H.-M.; Souza, R.; et al. Vertical Profiles of Atmospheric Species Concentrations and Nighttime Boundary Layer Structure in the Dry Season over an Urban Environment in Central Amazon Collected by an Unmanned Aerial Vehicle. Atmosphere 2020, 11, 1371. https://0-doi-org.brum.beds.ac.uk/10.3390/atmos11121371
Guimarães P, Ye J, Batista C, Barbosa R, Ribeiro I, Medeiros A, Zhao T, Hwang W-C, Hung H-M, Souza R, et al. Vertical Profiles of Atmospheric Species Concentrations and Nighttime Boundary Layer Structure in the Dry Season over an Urban Environment in Central Amazon Collected by an Unmanned Aerial Vehicle. Atmosphere. 2020; 11(12):1371. https://0-doi-org.brum.beds.ac.uk/10.3390/atmos11121371
Chicago/Turabian StyleGuimarães, Patrícia, Jianhuai Ye, Carla Batista, Rafael Barbosa, Igor Ribeiro, Adan Medeiros, Tianning Zhao, Wei-Chun Hwang, Hui-Ming Hung, Rodrigo Souza, and et al. 2020. "Vertical Profiles of Atmospheric Species Concentrations and Nighttime Boundary Layer Structure in the Dry Season over an Urban Environment in Central Amazon Collected by an Unmanned Aerial Vehicle" Atmosphere 11, no. 12: 1371. https://0-doi-org.brum.beds.ac.uk/10.3390/atmos11121371