Projected Hydroclimate Changes on Hispaniola Island through the 21st Century in CMIP6 Models

 , , ,
, , ,
Abstract
:1. Introduction
2. Data and Methods
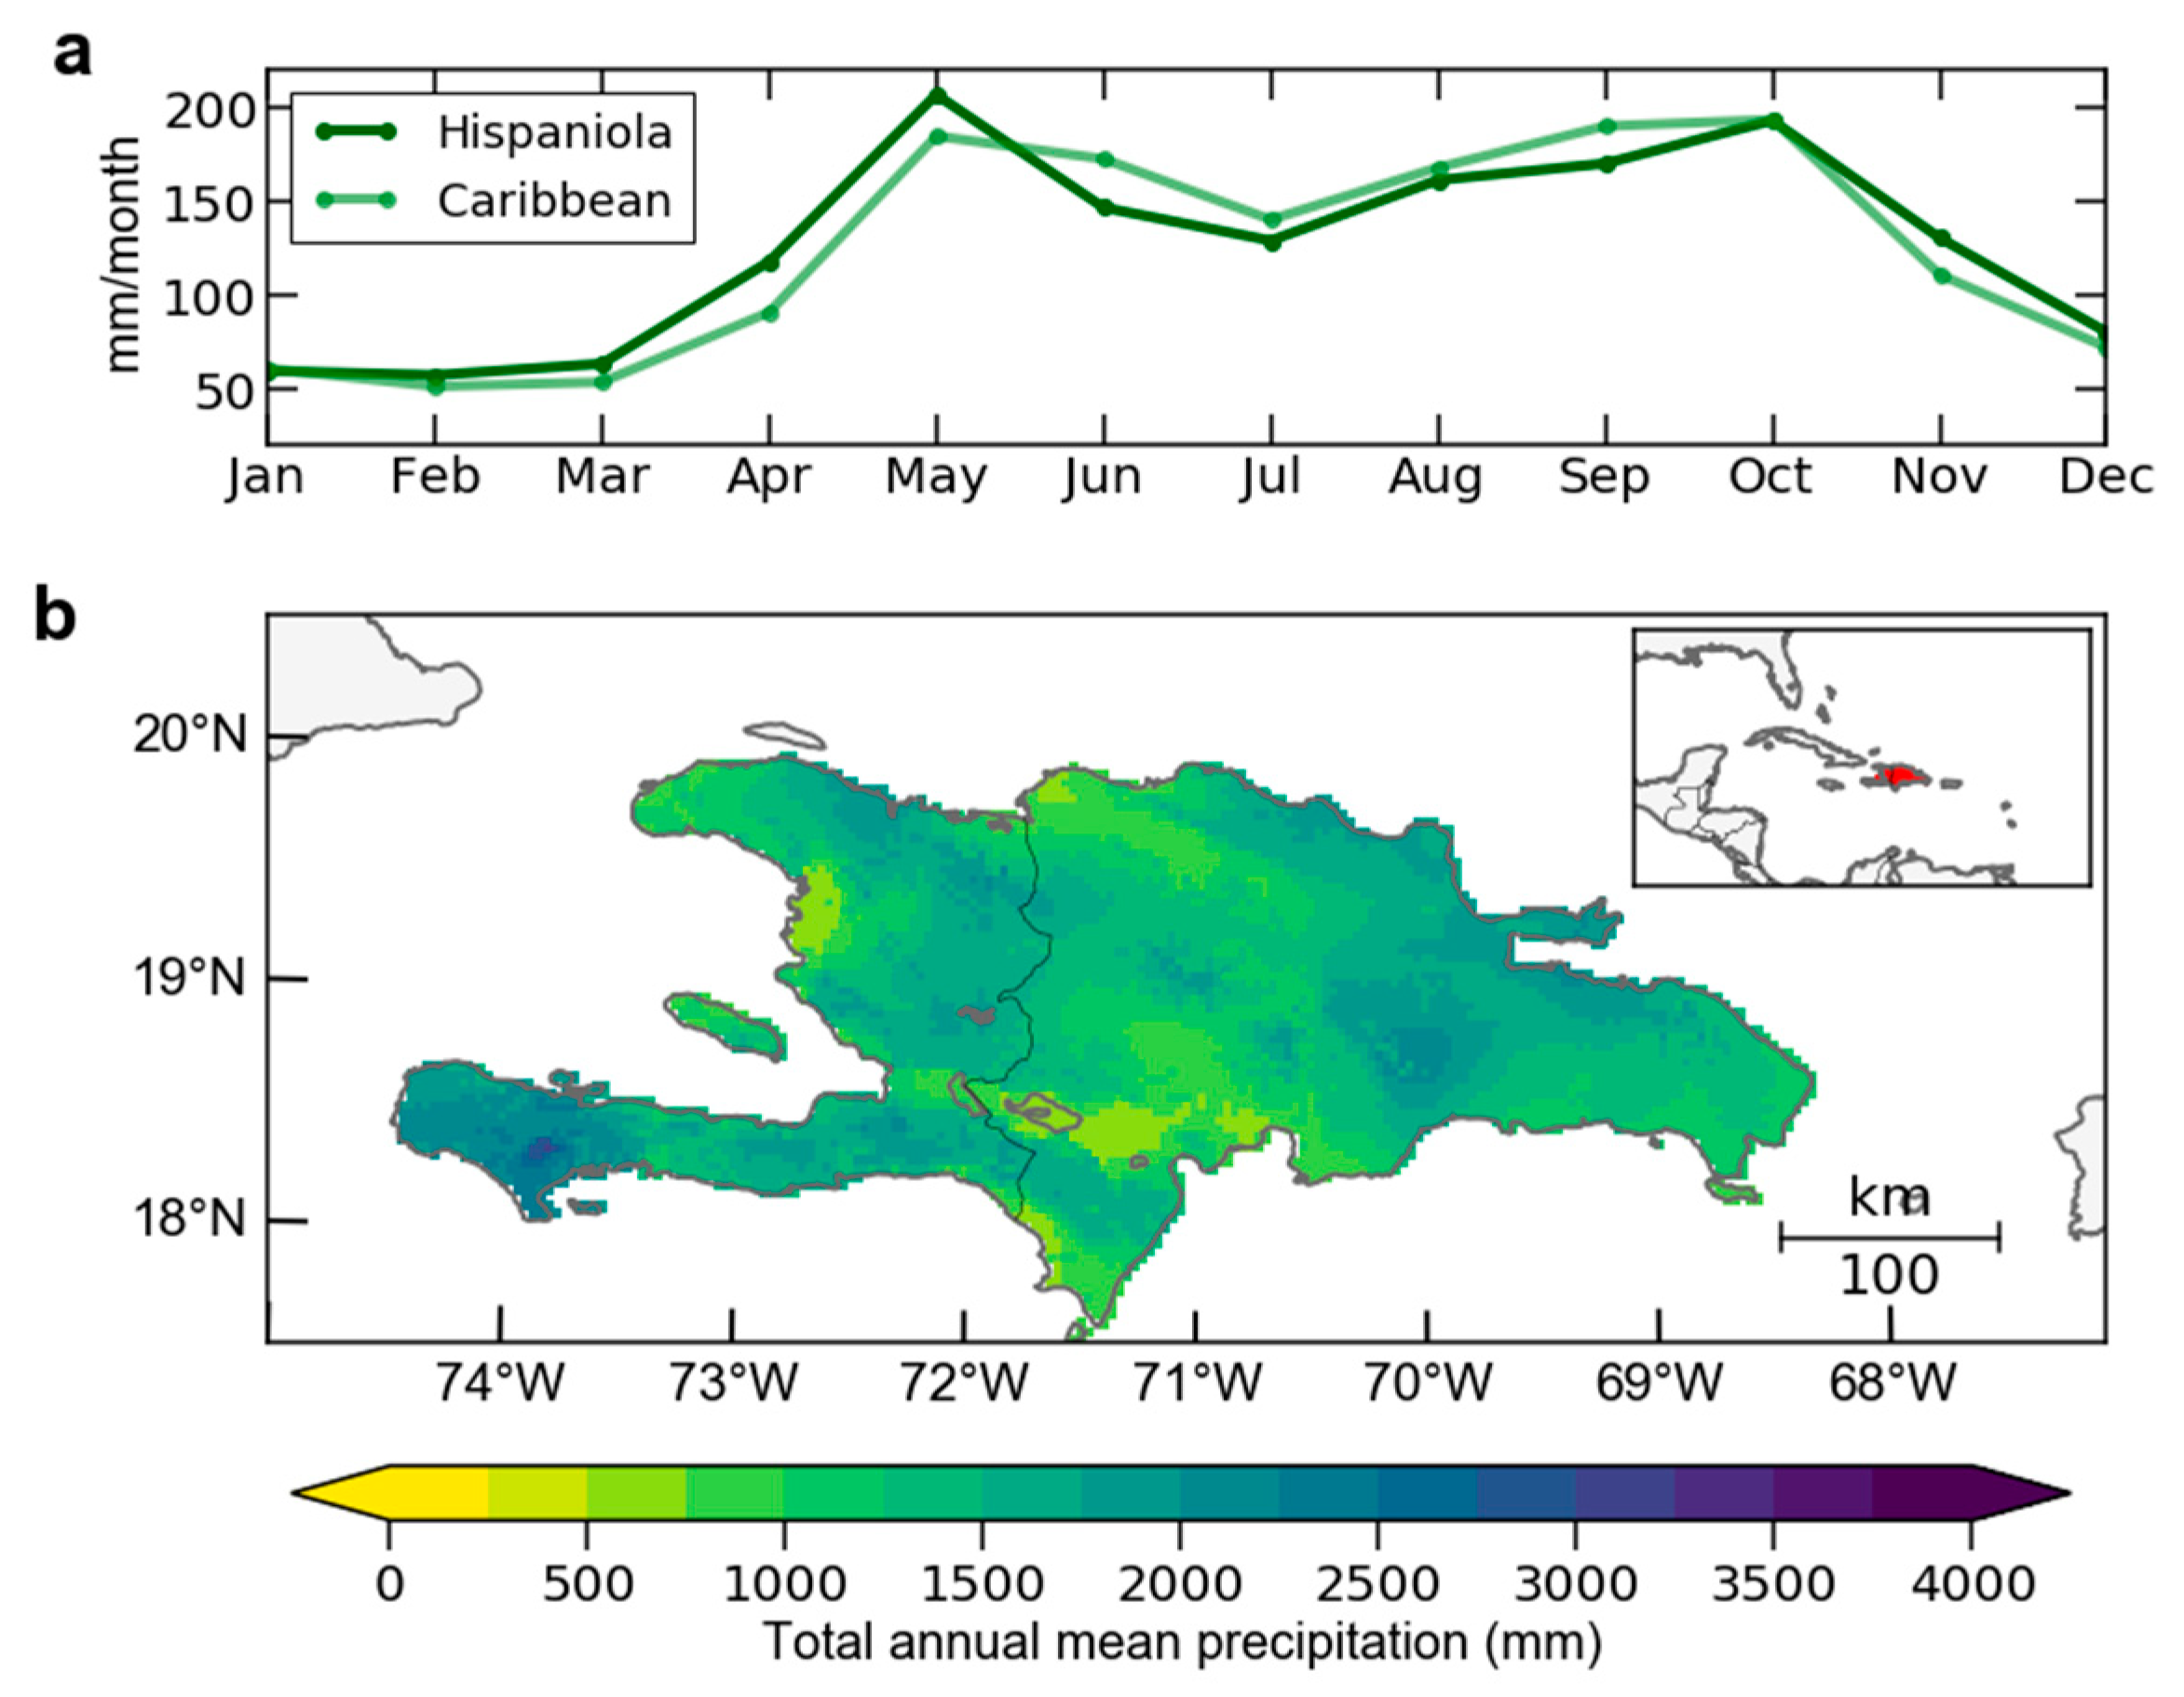
2.1. Study Area
2.2. High-Resolution Climate Data
2.3. CMIP6 Data and Analysis
2.4. Soil Moisture and Precipitation Trends
2.5. Statistical Significance
3. Results
3.1. Observed and Simulated Climatologies
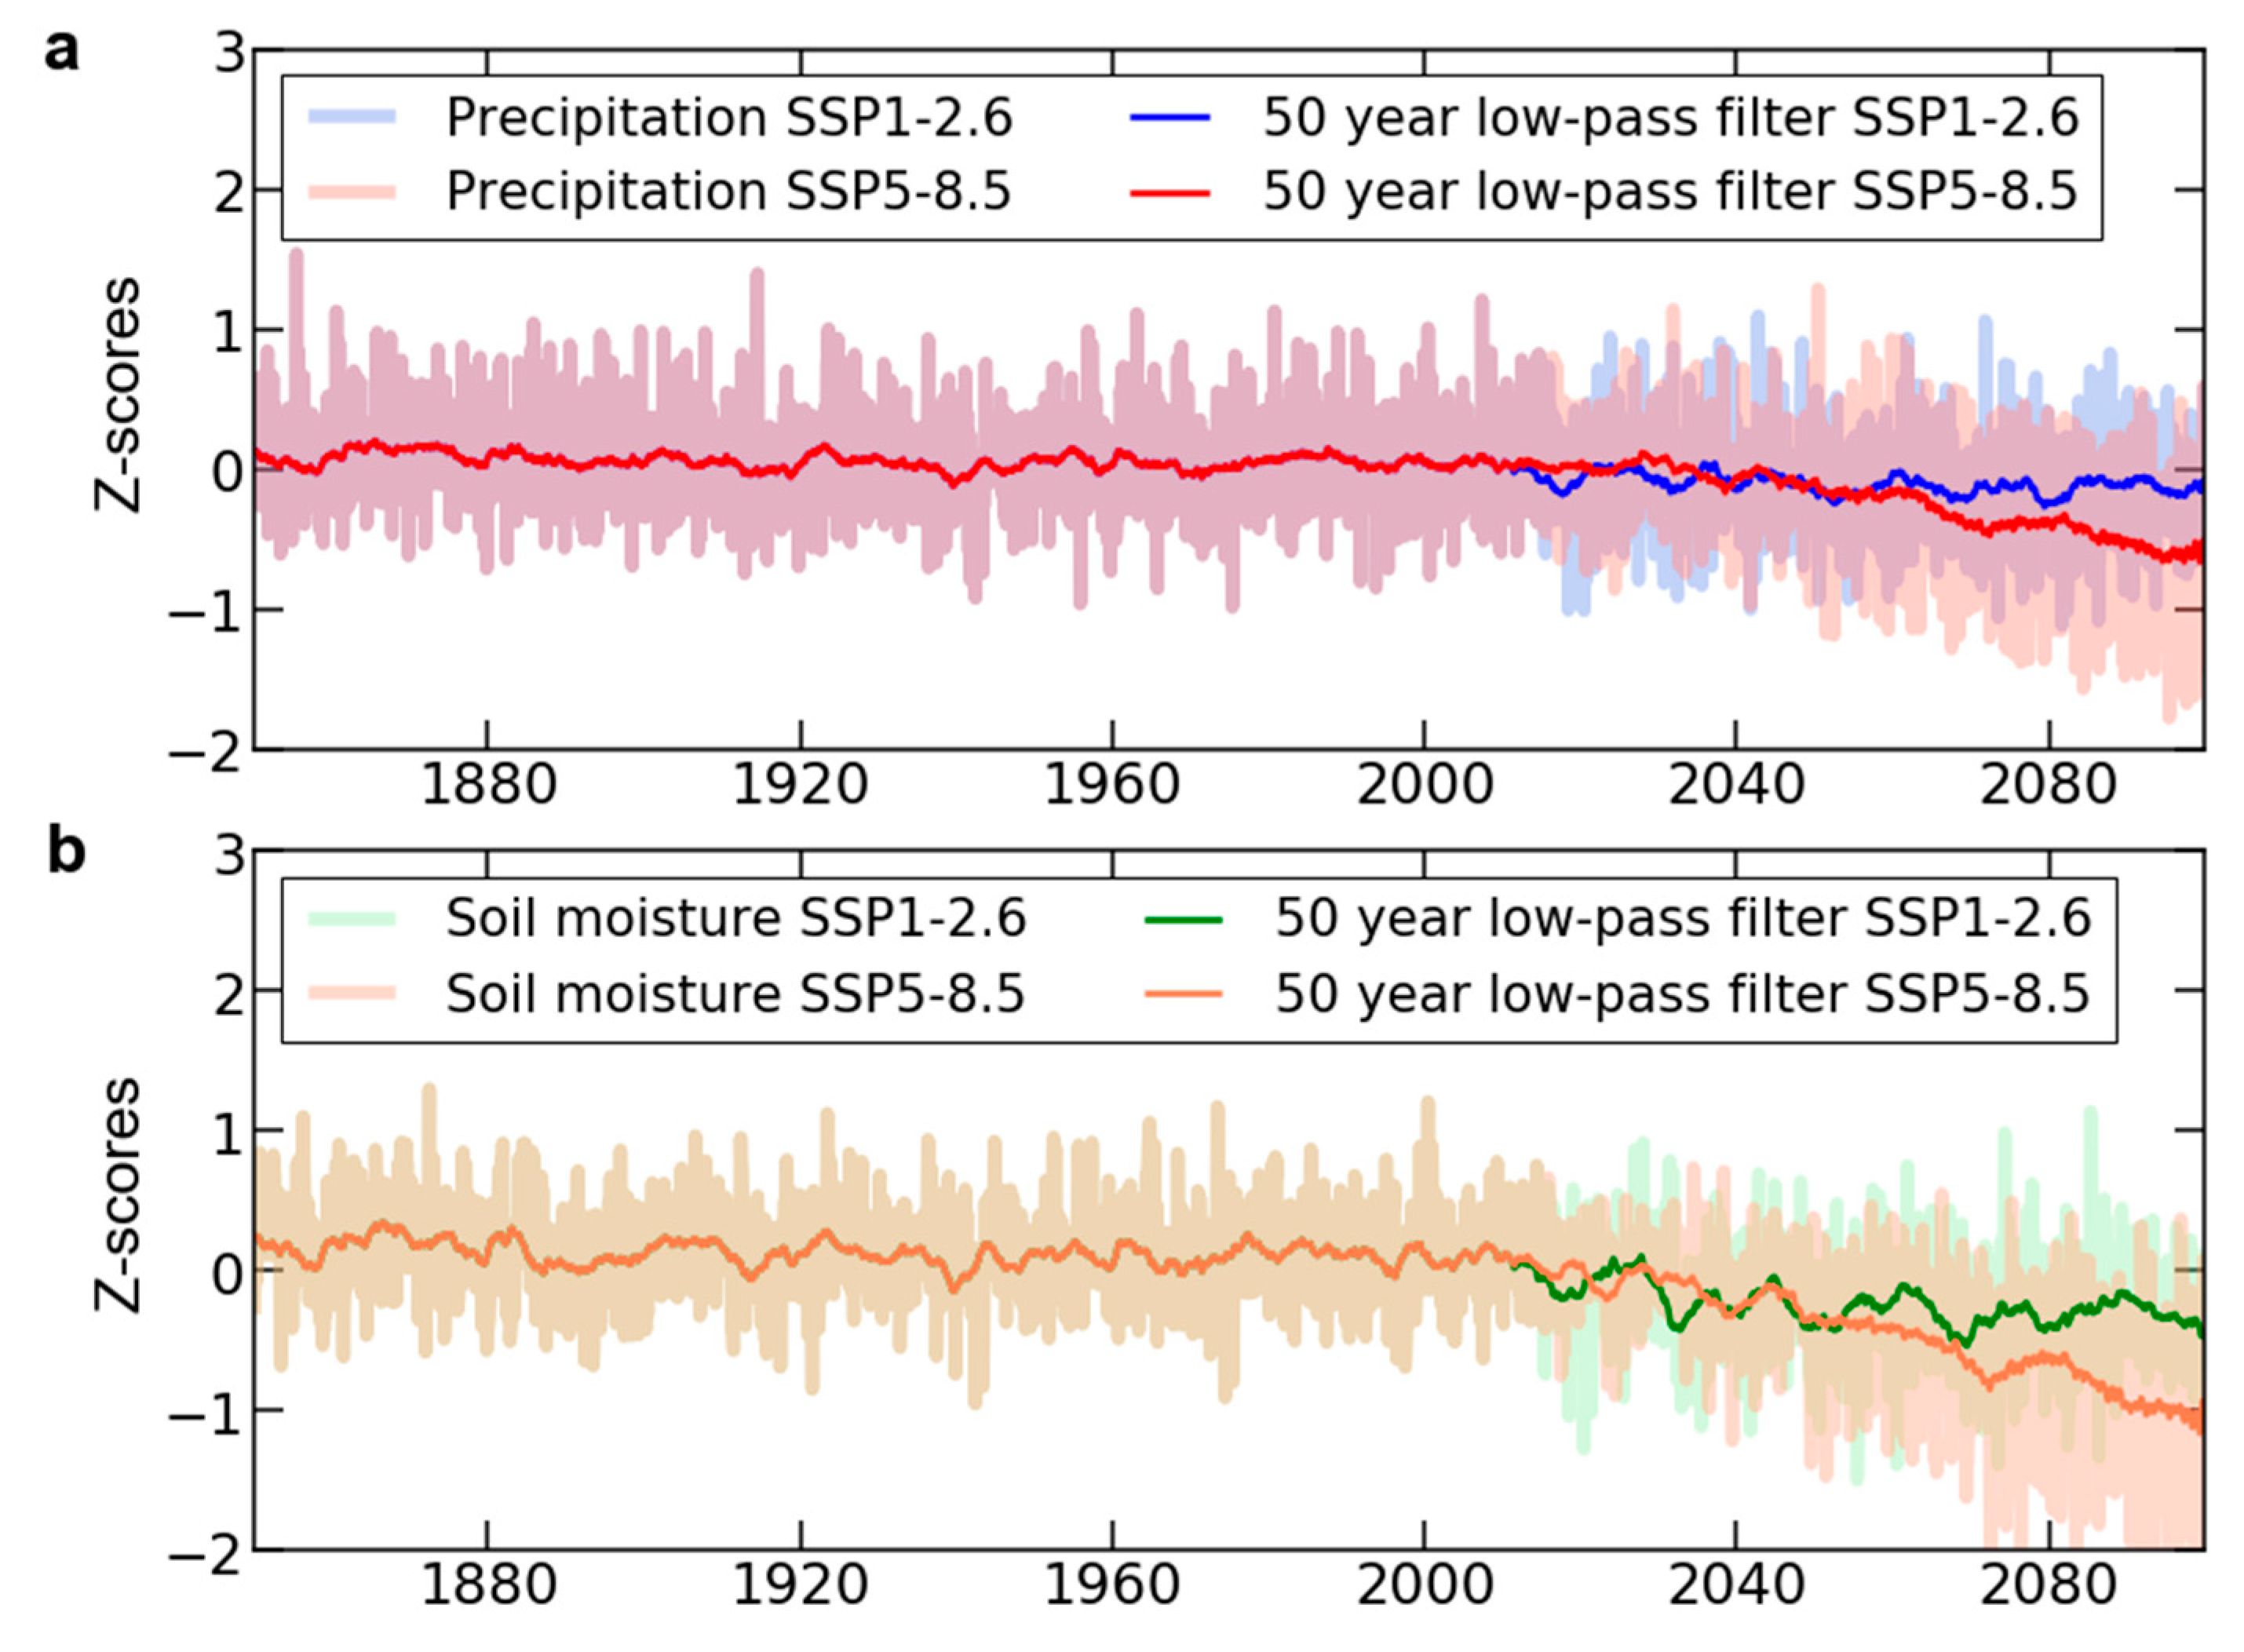
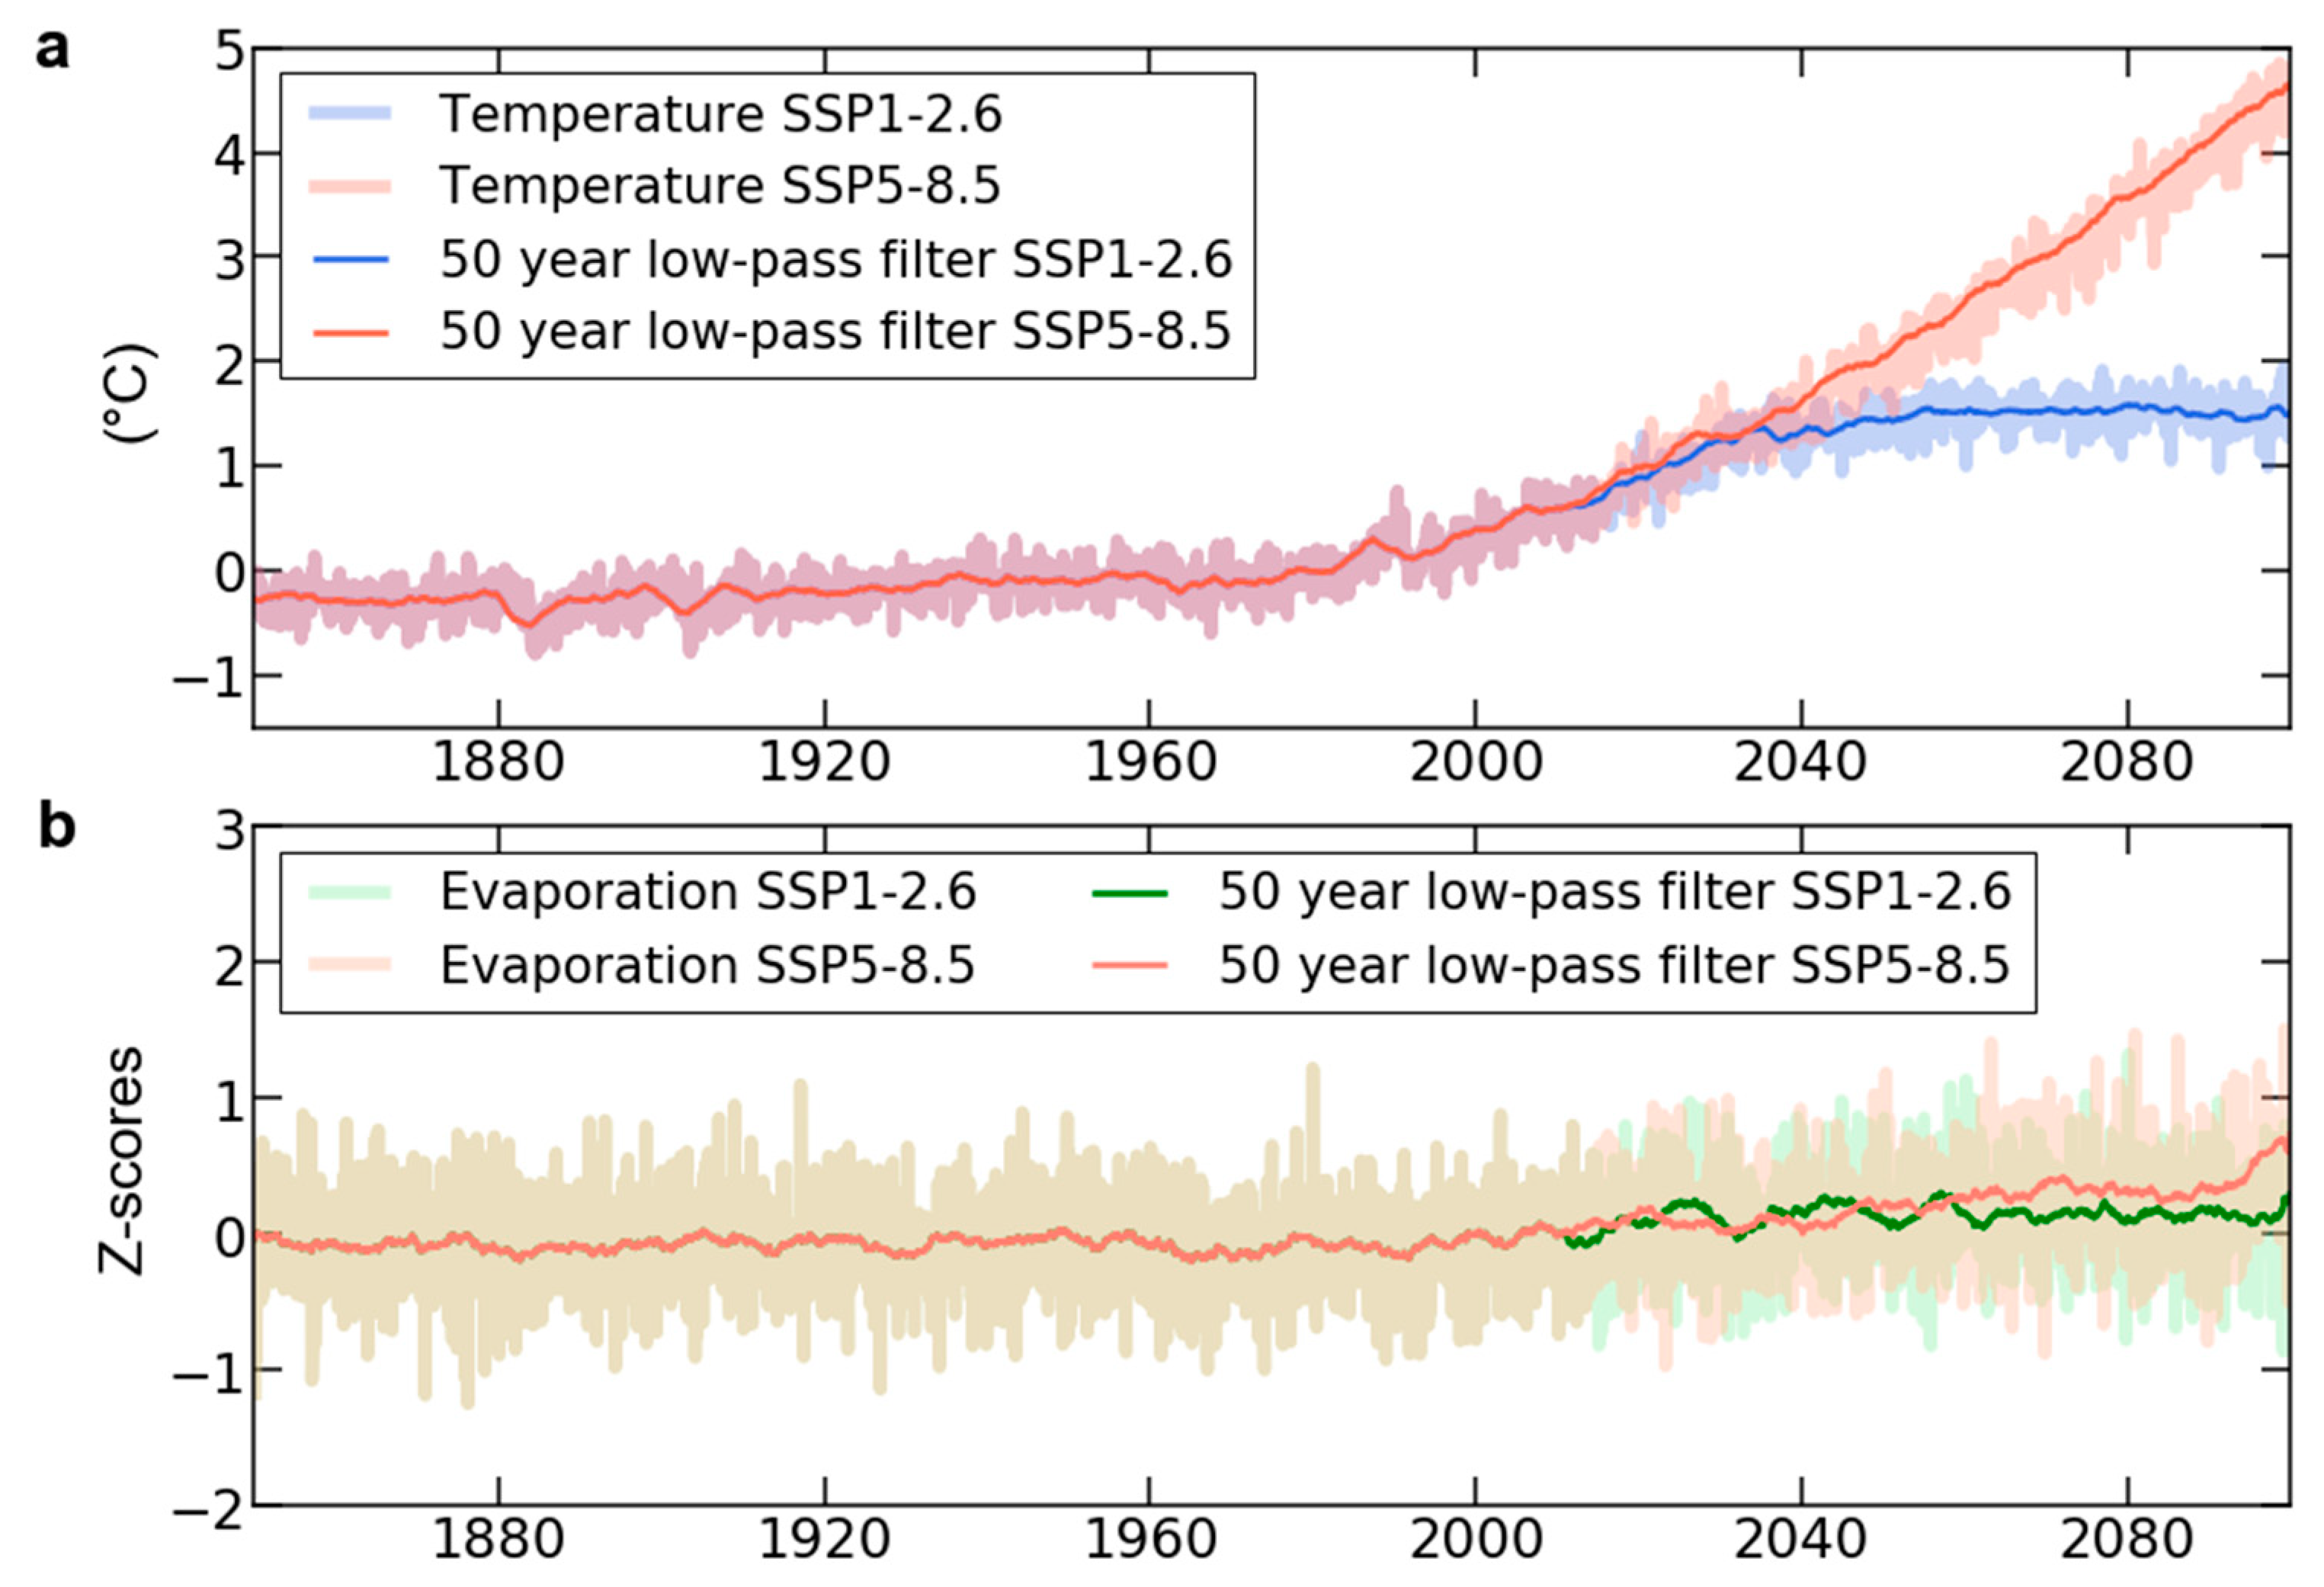
3.2. Observed and Simulated Historical Trends
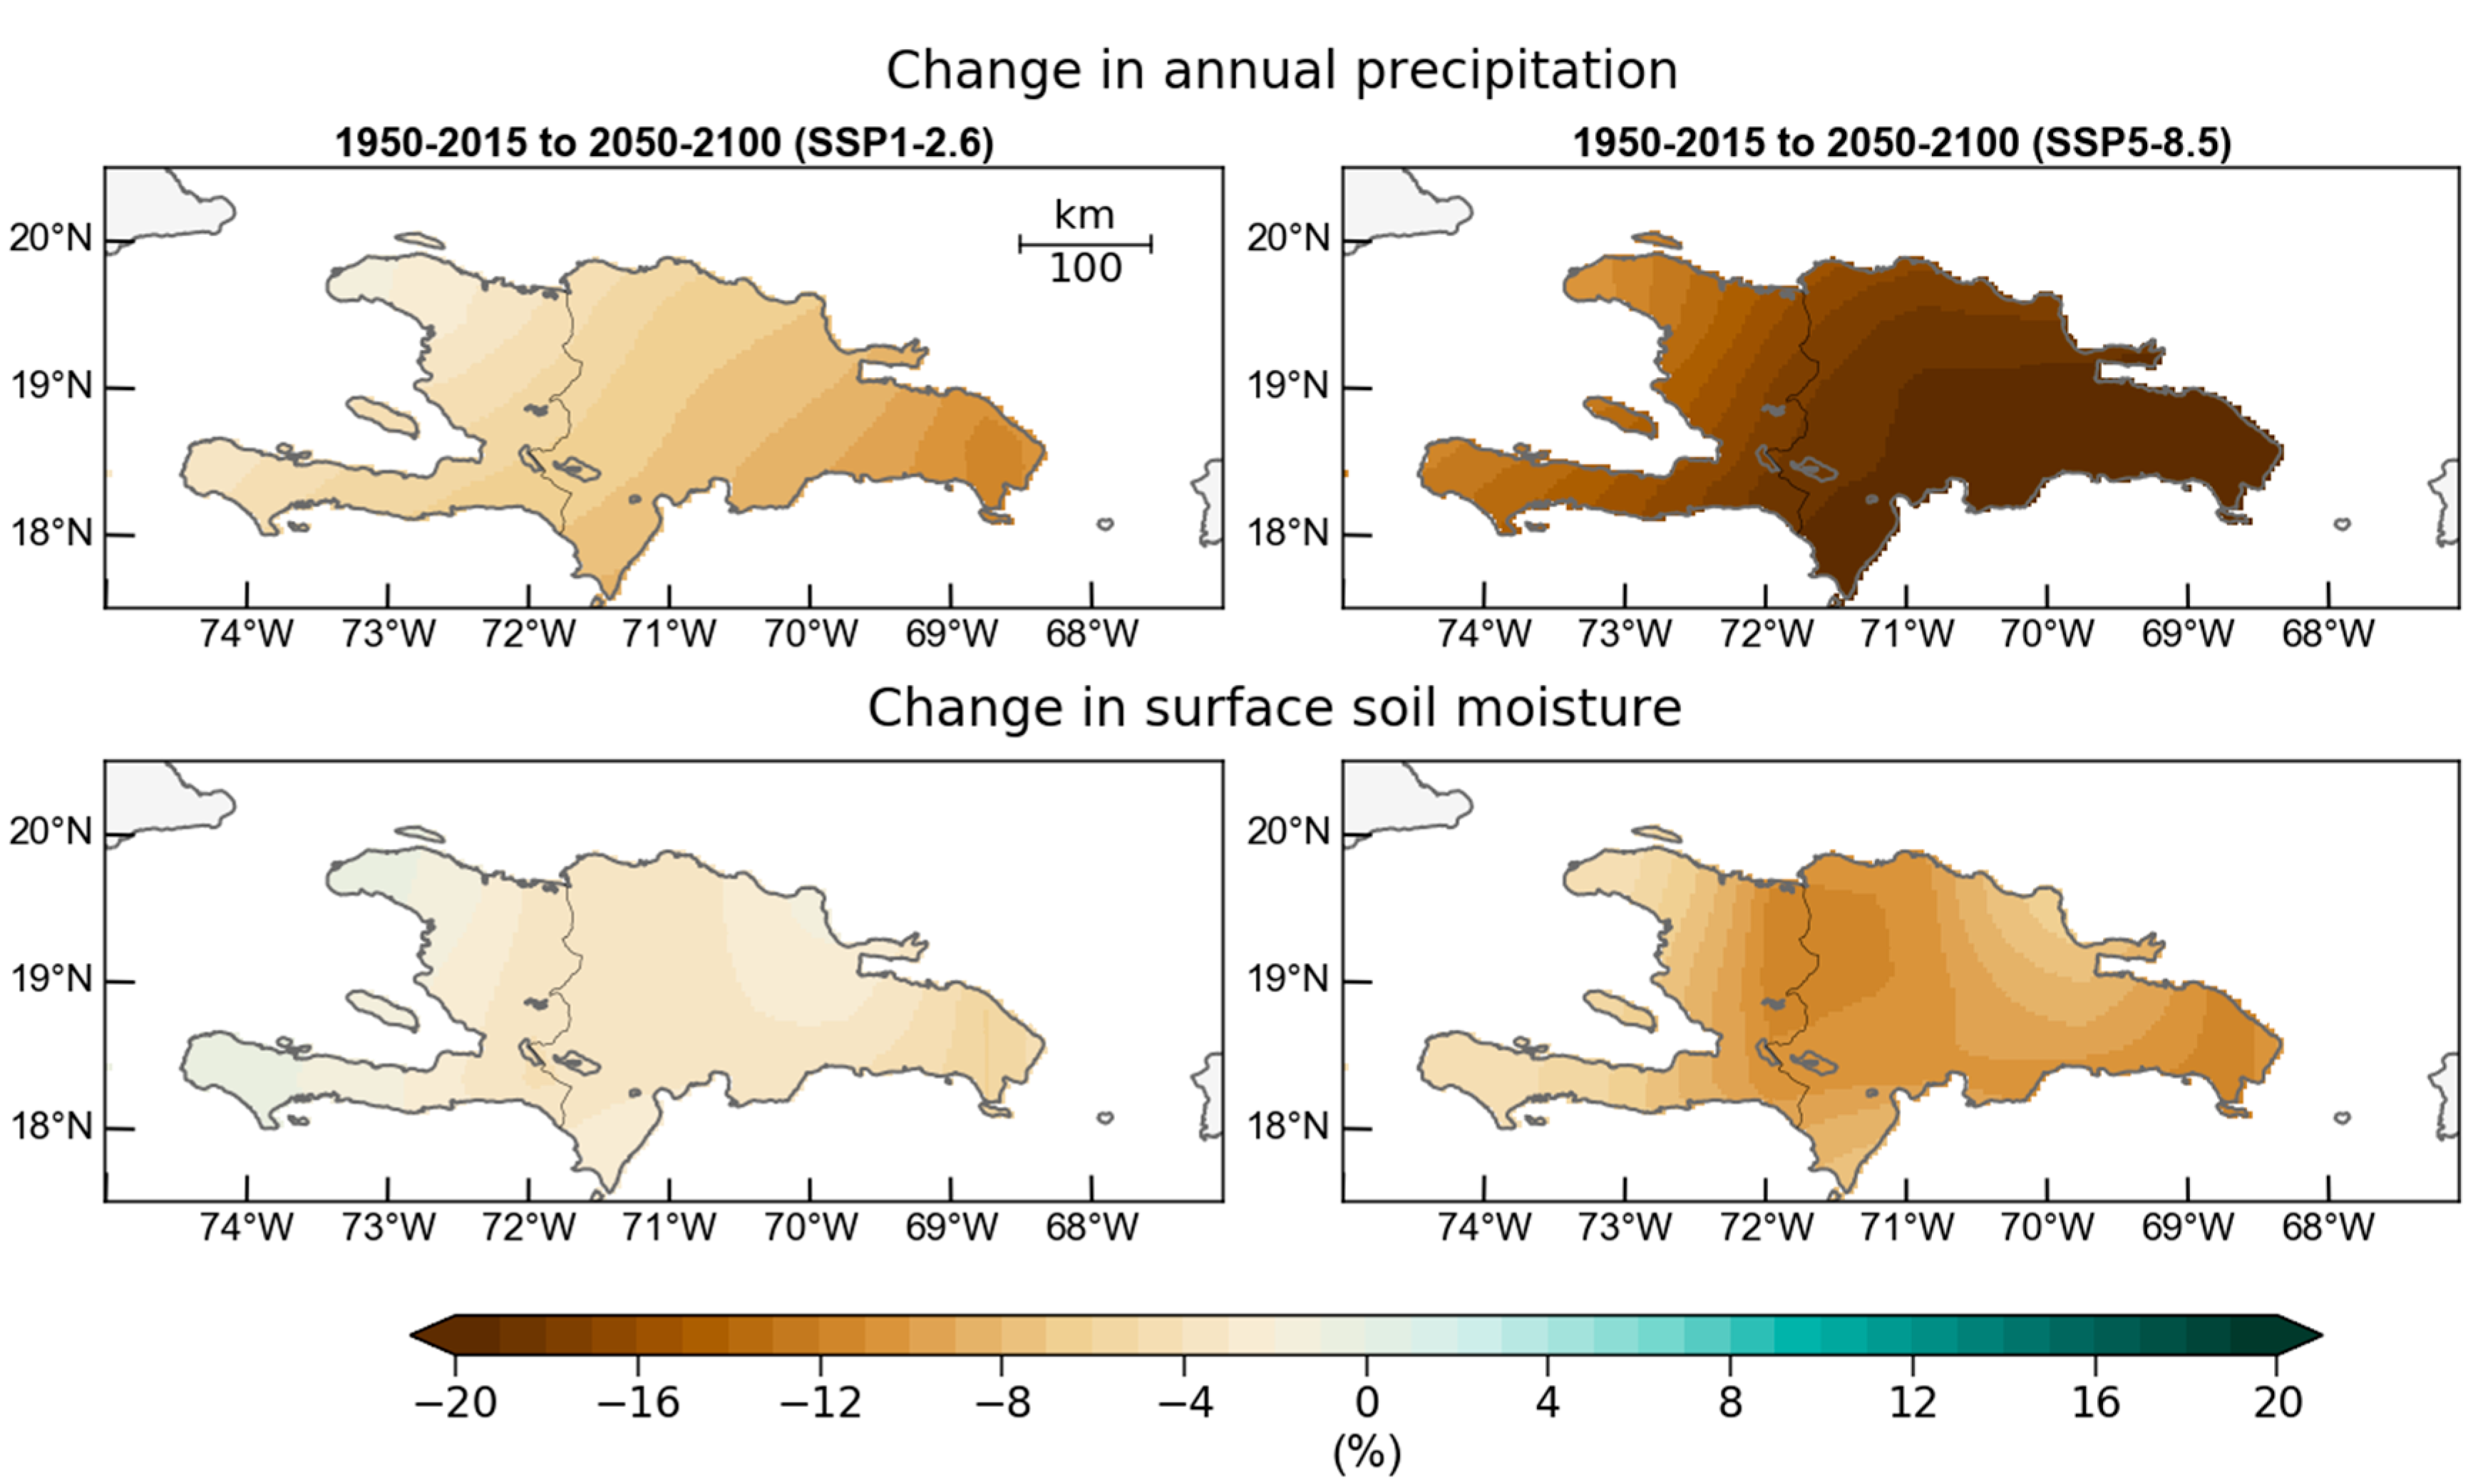
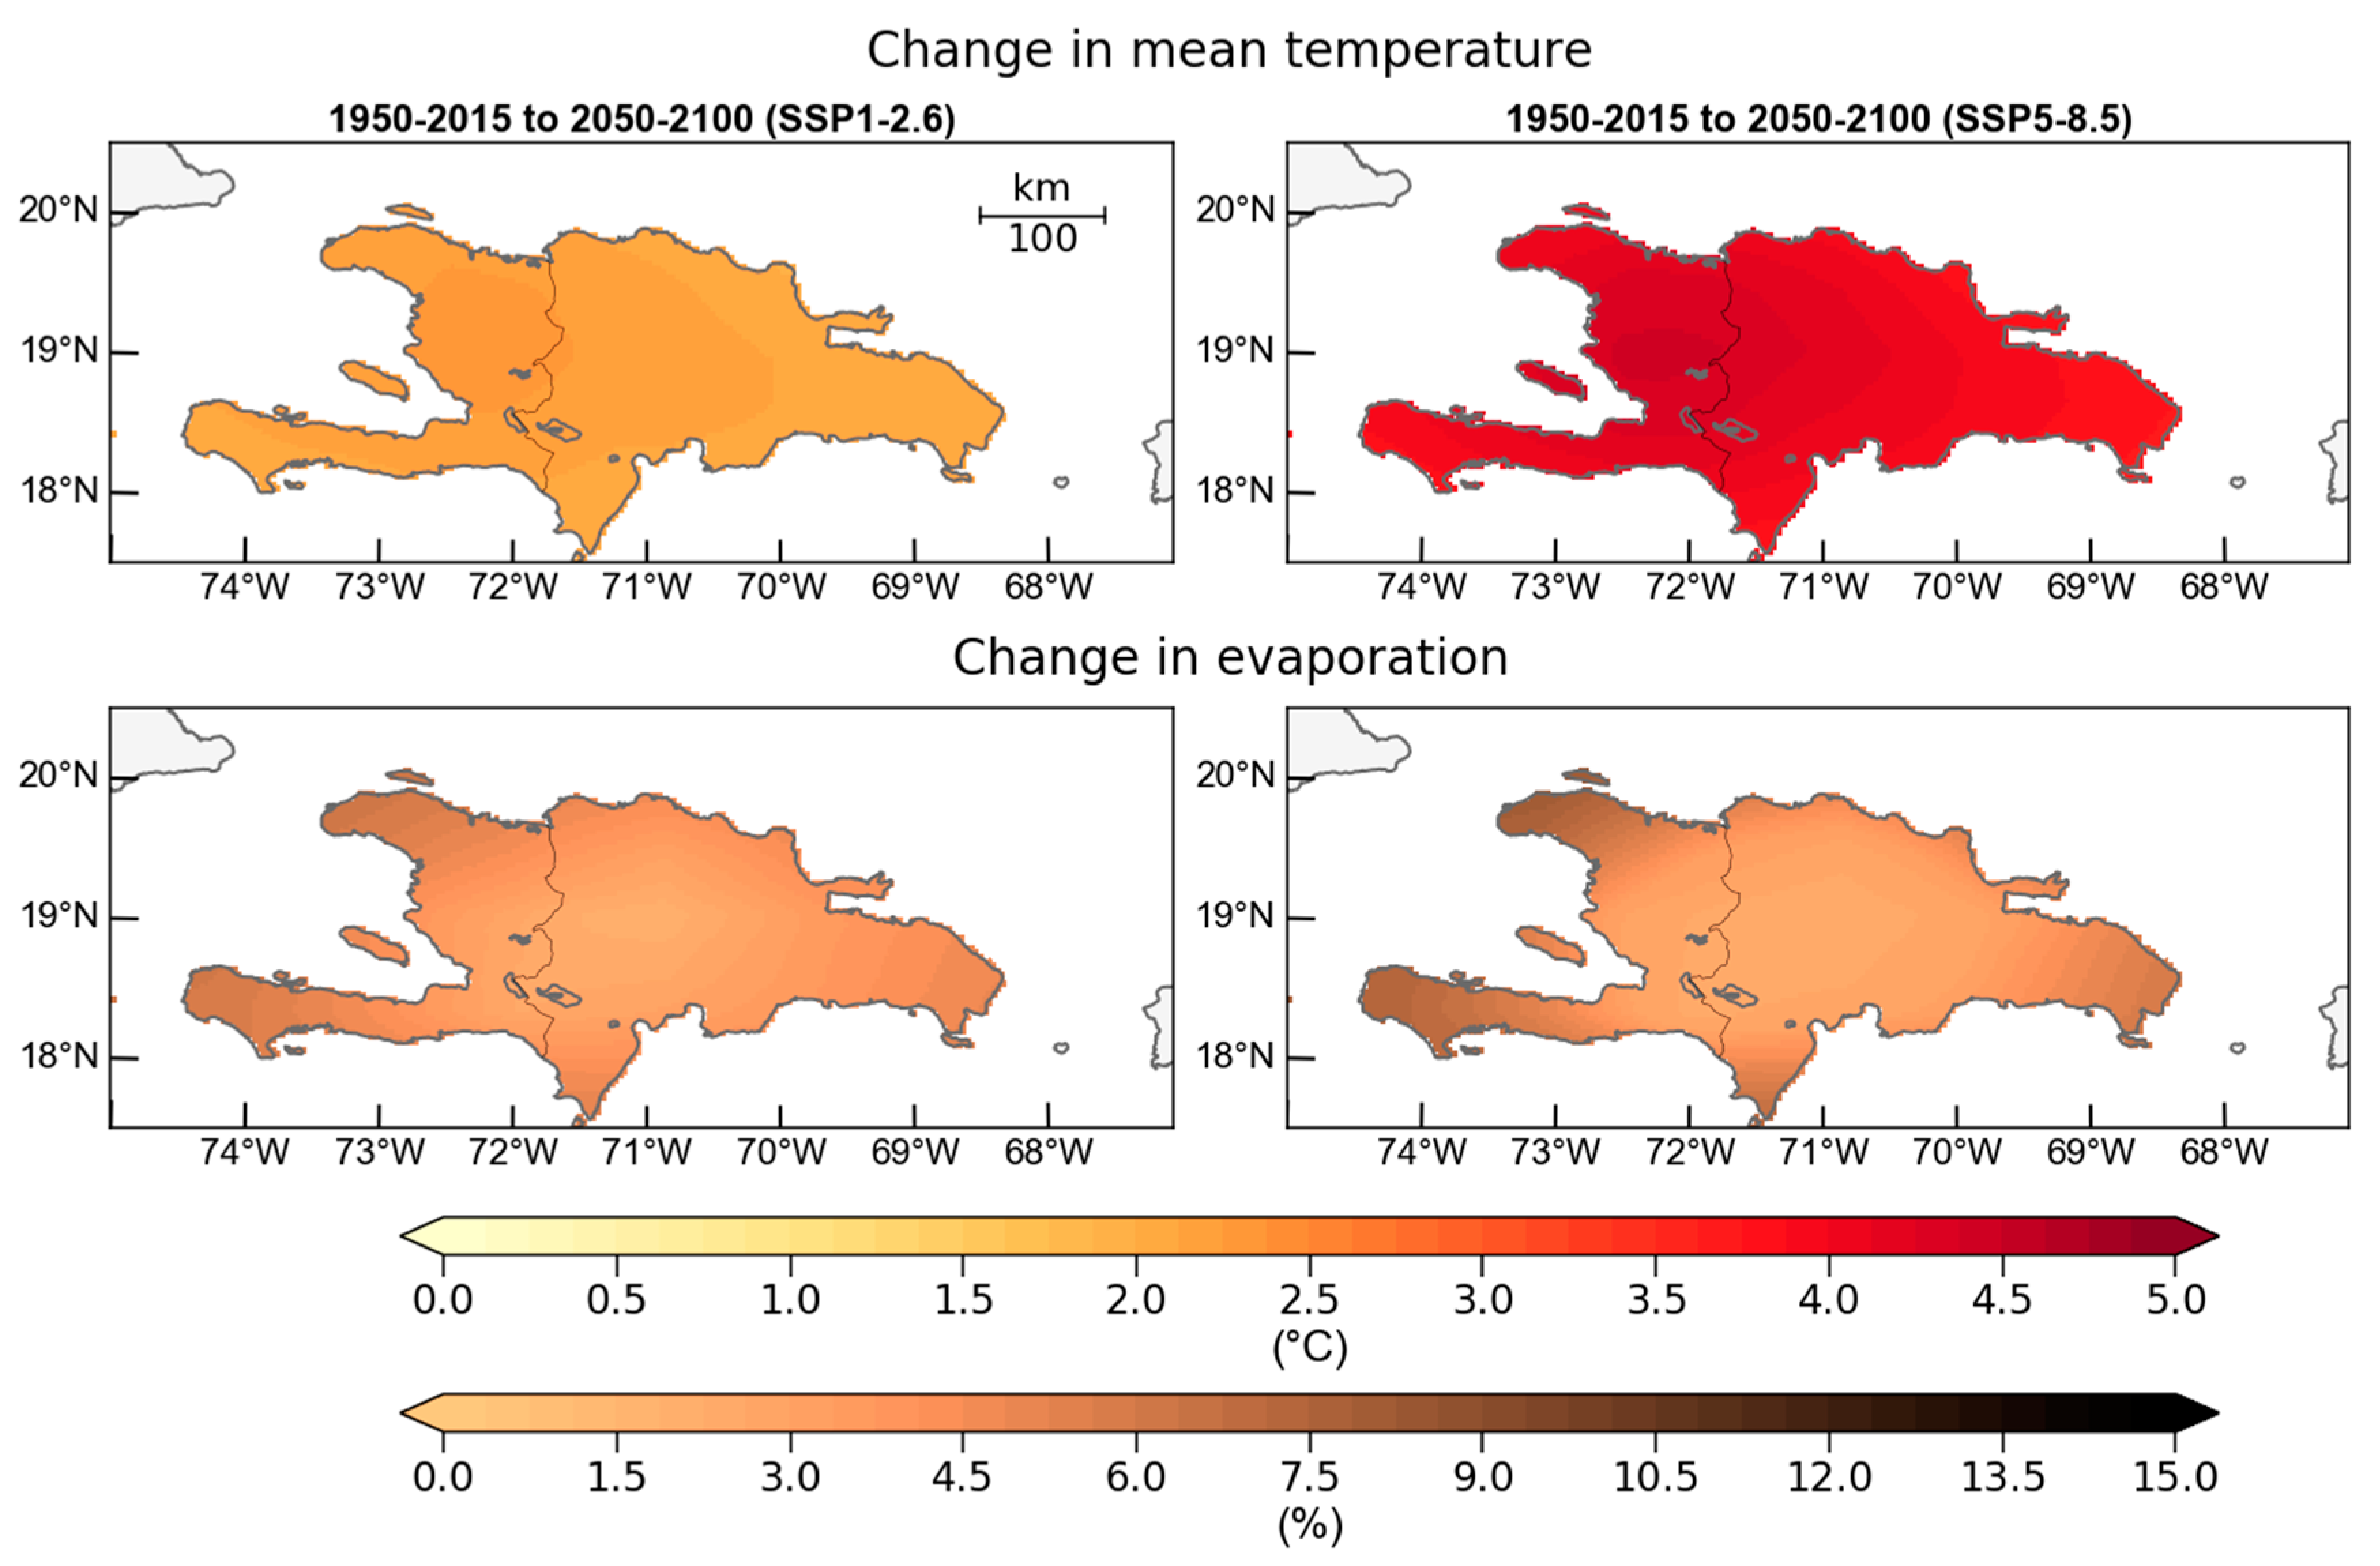
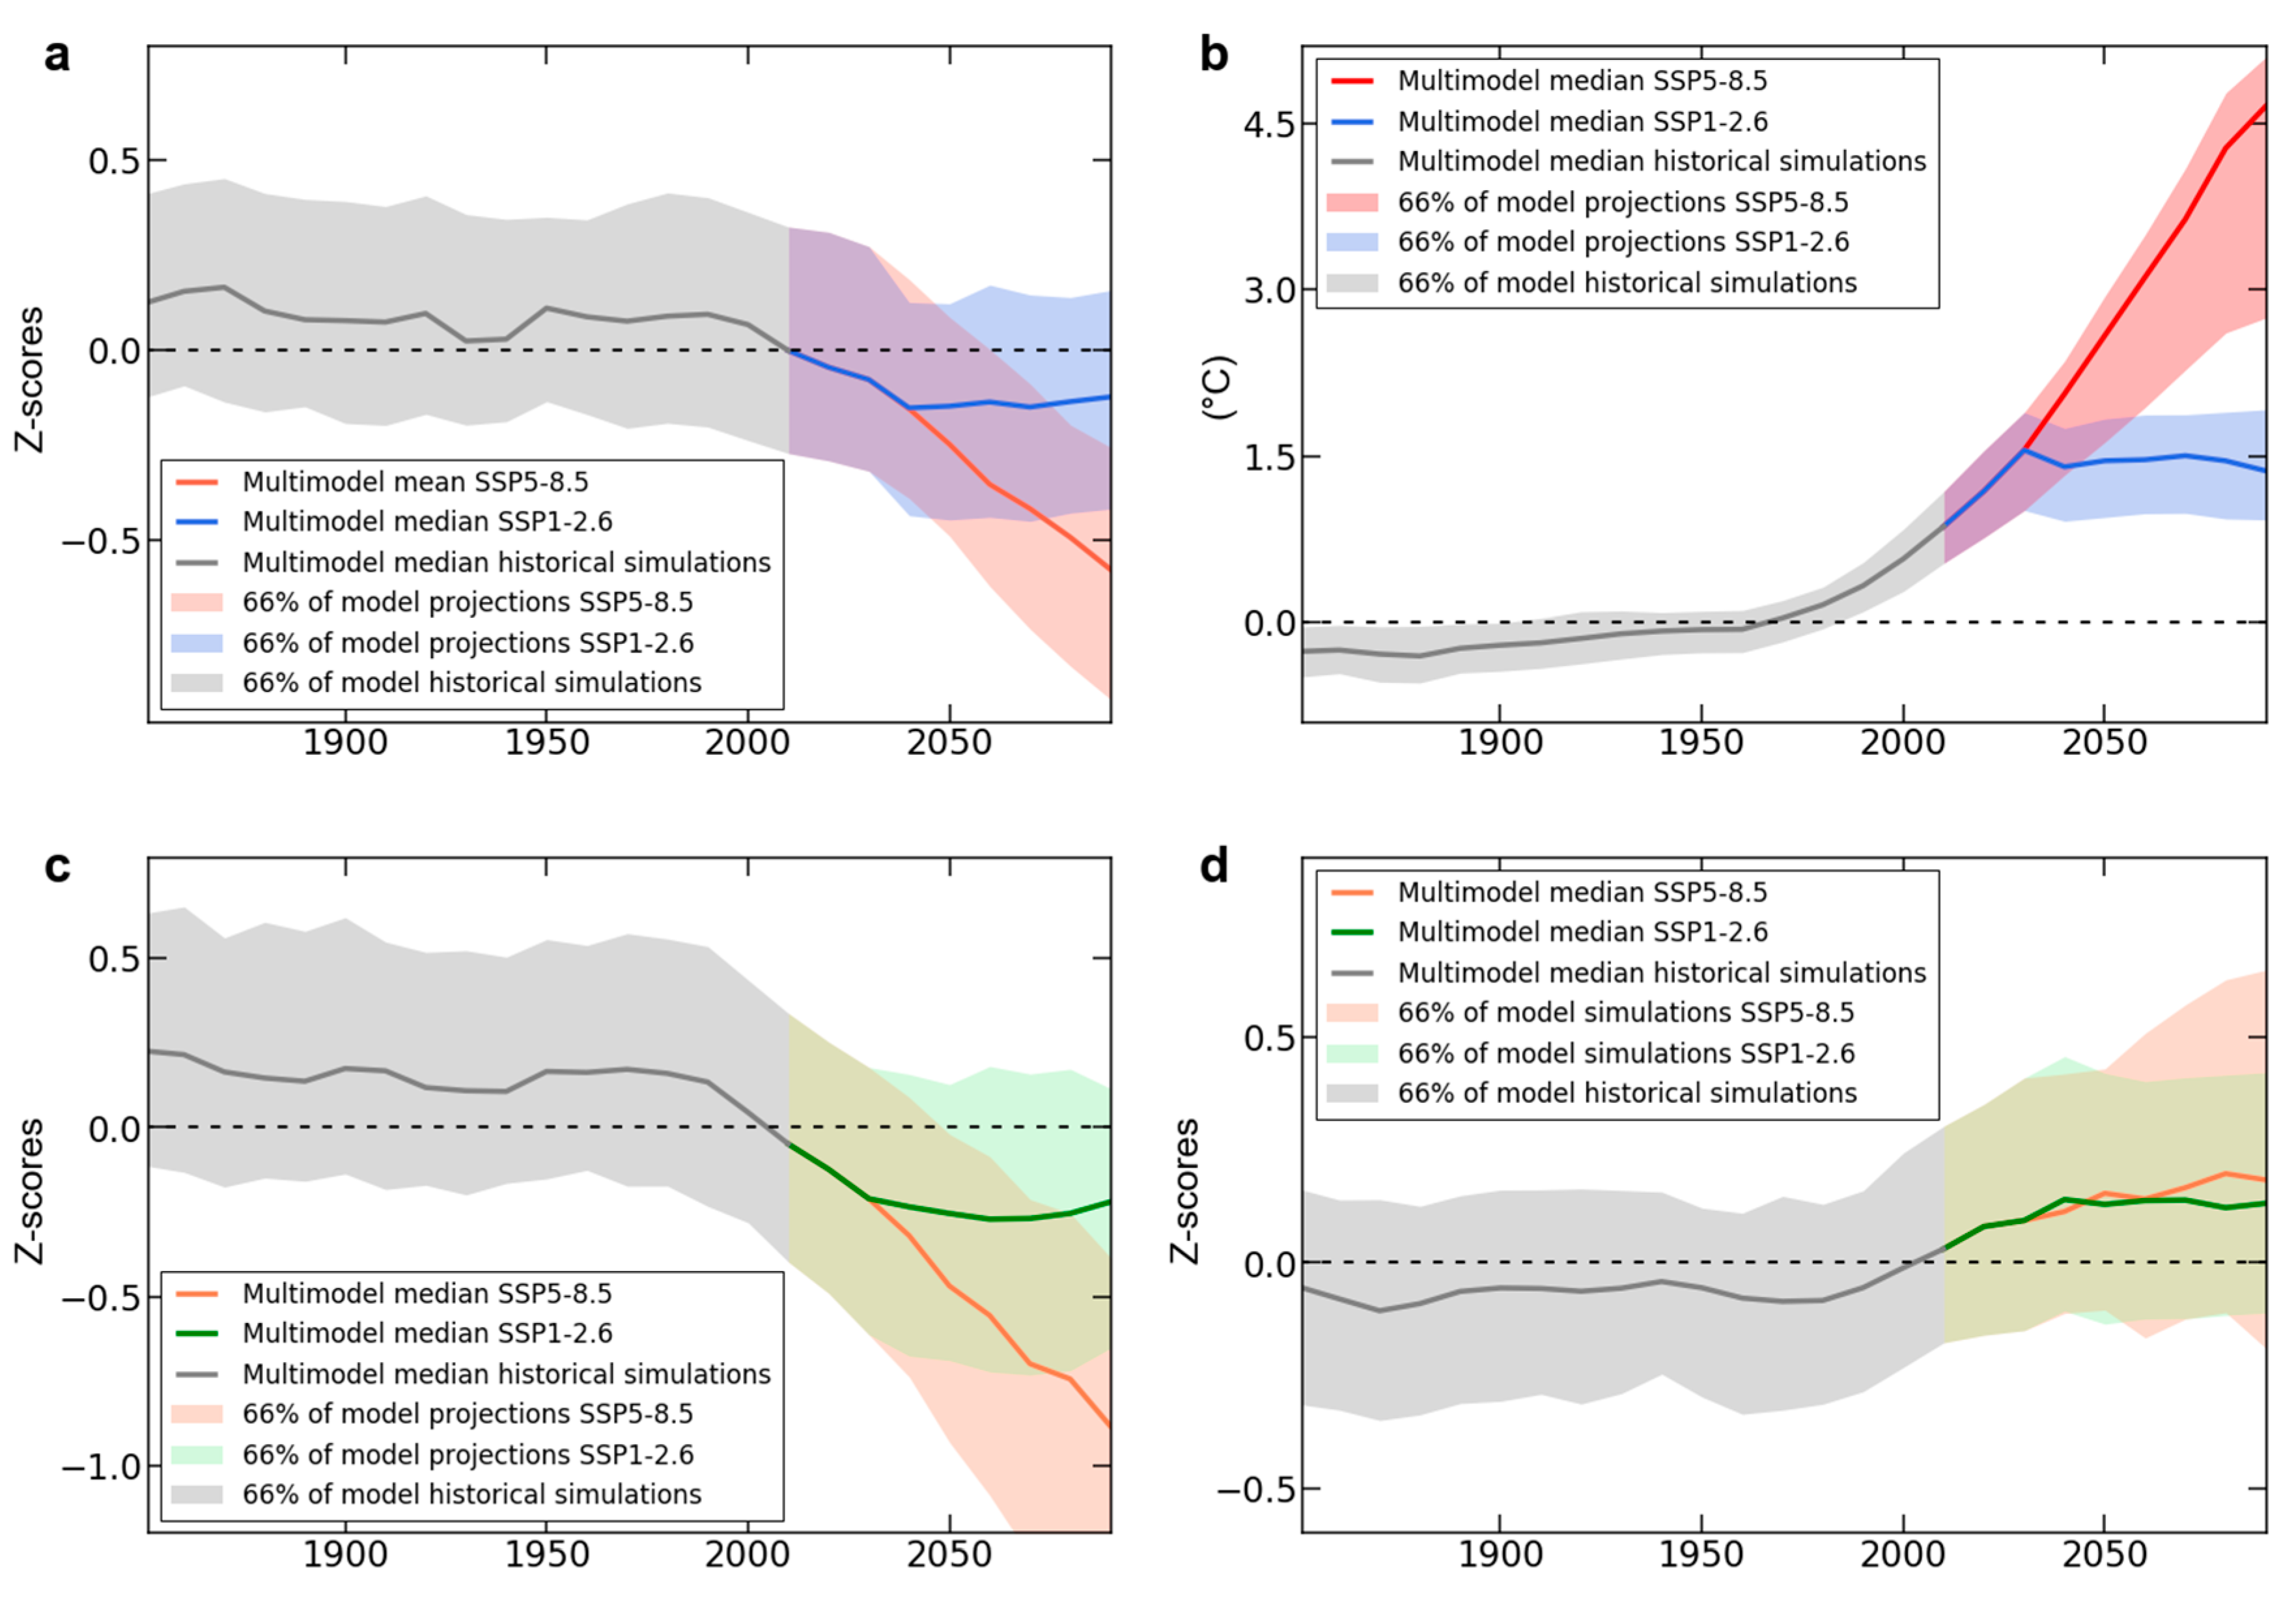
3.3. Projected Changes in Precipitation and Soil Moisture
4. Discussion
5. Conclusions
Author Contributions
Funding
Institutional Review Board Statement
Informed Consent Statement
Data Availability Statement
Acknowledgments
Conflicts of Interest
References
- OCHA. Drought in Central America in 2015: Situation Report (as of October 6, 2015); United Nations Office for the Coordination of Humanitarian Affairs (OCHA): New York, NY, USA, 2016; Available online: https://reliefweb.int/report/guatemala/drought-central-america-2015-situation-report-october-6-2015 (accessed on 1 November 2016).
- FAO. Situation Report: Dry Corridor in Central America; Food and Agriculture Organization of the United Nations: Rome, Italy, 2016; p. 3. Available online: http://www.fao.org/emergencies/resources/documents/resources-detail/en/c/422097/ (accessed on 1 November 2016).
- Herrera, D.A.; Ault, T.R. Insights from a new high-resolution drought atlas for the Caribbean spanning 1950–2016. J. Clim. 2017, 30, 7801–7825. [Google Scholar] [CrossRef]
- Herrera, D.A.; Ault, T.R.; Fasullo, J.T.; Coats, S.J.; Carrillo, C.M.; Cook, B.I.; Williams, A.P. Exacerbation of the 2013–2016 Pan-Caribbean drought by anthropogenic warming. Geophys. Res. Lett. 2018, 45, 10619–10626. [Google Scholar] [CrossRef] [PubMed] [Green Version]
- Blunden, J.; Arndt, D.S. State of the Climate in 2015. Bull. Amer. Meteor. Soc. 2016, 97, S1–S275. [Google Scholar] [CrossRef]
- Hernández Ayala, J.J. Atmospheric teleconnections and their effects on the annual and seasonal rainfall climatology of Puerto Rico. Theor. Appl. Climatol. 2019, 137, 2915–2925. [Google Scholar] [CrossRef]
- Neelin, J.D.; Münnich, H.; Su, H.; Meyerson, J.E.; Holloway, C.E. Tropical drying trends in global model and observations. Proc. Natl. Acad. Sci. USA 2006, 103, 6110–6115. [Google Scholar] [CrossRef] [Green Version]
- Jones, P.D.; Harpham, C.; Harris, I.; Goodess, C.M.; Burton, A.; Centella-Artola, A.; Taylor, M.A.; Bezanilla-Morlot, A.; Campbell, J.D.; Stephenson, T.S.; et al. Long-term trends in precipitation and temperature across the Caribbean. J. Int. Climatol. 2015, 36, 3314–3333. [Google Scholar] [CrossRef] [Green Version]
- Stephenson, T.S.; Vincent, L.A.; Allen, T.; Van Meerbeeck, C.J.; McLean, N.; Peterson, T.C.; Taylor, M.A.; Aaron-Morrison, A.P.; Auguste, T.; Bernard, D.; et al. Changes in extreme temperature and precipitation in the Caribbean region, 1961–2010. Int. J. Climatol. 2014, 34, 2957–2971. [Google Scholar] [CrossRef]
- Izzo, M.; Rosskopf, C.M.; Aucelli, P.C.; Maratea, A.; Méndez, R.; Pérez, C.; Segura, H. A new climatic map of the Dominican Republic based on the Thornthwaite classification. Phys. Geogr. 2010, 31, 455–472. [Google Scholar] [CrossRef]
- Torres-Valcárcel, A.R. Teleconnections between ENSO and rainfall and drought in Puerto Rico. Int. J. Climatol. 2018, 38, e1190–e1204. [Google Scholar] [CrossRef]
- Jury, M.R.; Bernard, D. Climate trends in the East Antilles Islands. Int. J. Climatol. 2020, 40, 36–51. [Google Scholar] [CrossRef]
- Smith, R.B.; Minder, J.R.; Nugent, A.D.; Storelvmo, T.; Kirshbaum, D.J.; Warren, R.; Lareau, N.; Palany, P.; James, A.; French, J. Orographic Precipitation in the Tropics: The Dominica Experiment. Bull. Amer. Meteor. Soc. 2012, 93, 1567–1579. [Google Scholar] [CrossRef] [Green Version]
- IPCC. Climate Change 2014: Synthesis Report; Pachauri, R.K., Meyer, L.A., Eds.; IPCC: Geneva, Switzerland, 2014; p. 151. [Google Scholar]
- Karmalkar, A.V.; Bradley, R.S.; Diaz, H.F. Climate change in Central America and Mexico: Regional climate model validation and climate change projections. Clim. Dyn. 2011, 37, 605. [Google Scholar] [CrossRef] [Green Version]
- Méndez-Tejeda, R. Increase in the Number of Hot Days for Decades in Puerto Rico 1950–2014. Environ. Nat. Res. Res. 2017, 7, 16–26. [Google Scholar] [CrossRef]
- Cook, B.I.; Ault, T.R.; Smerdon, J.E. Unprecedented 21st century drought risk in the American Southwest and Central Plains. Sci. Adv. 2015, 1, e1400082. [Google Scholar] [CrossRef] [PubMed] [Green Version]
- Ault, T.R.; Mankin, J.S.; Cook, B.I.; Smerdon, J.E. Relativeimpacts of mitigation, temperature, and precipitation on 21st-century megadrought risk in the American Southwest. Sci. Adv. 2016, 2, e1600873. [Google Scholar] [CrossRef] [PubMed] [Green Version]
- Ault, T.R. On the essentials of drought in a changing climate. Science 2020, 368, 256–260. [Google Scholar] [CrossRef]
- Centella-Artola, A.; Bezanilla, A.; Leslie, K.R. A Study of the Uncertainty in Future Caribbean Climate Using the PRECIS Regional Climate Model; Caribbean Community Climate Change Centre (CCCCC): Belmopan, Belize, 2008. [Google Scholar]
- Karnauskas, K.B.; Schleussner, C.F.; Donelly, J.P.; Anchukaitis, K.J. Freshwater stress on small island developing states: Population projections and aridity changes at 1.5 and C. Reg. Environ. Chang. 2018, 18. [Google Scholar] [CrossRef]
- UNESCO; Programa Hidrológico Internacional (PHI). The use of desalination plants in the Caribbean. Tech. Rep. 2006. Available online: http://unesdoc.unesco.org/images/0022/002281/228110e.pdf (accessed on 1 November 2016).
- United Nations, Department of Economic and Social Affairs, Population Division. World Population Prospects 2019: Data Booket; ST/ESA/SER.A/424; United Nations, Department of Economic and Social Affairs, Population Division, 2019; Available online: https://population.un.org/wpp/ (accessed on 1 October 2020).
- Eyring, V.; Bony, S.; Meehl, G.A.; Senior, C.; Stevens, B.; Stouffer, R.J.; Taylor, K.E. Overview of the Coupled Model Intercomparison Project Phase 6 (CMIP6) experimental design and organisation. Geosc. Mod. Dev. Dis. 2016, 8, 1937–1958. [Google Scholar] [CrossRef] [Green Version]
- Central Intelligence Agency. The World Factbook 2020; Central Intelligence Agency: Washington, DC, USA, 2020.
- Magaña, V.; Amador, J.; Medina, S. The midsummer drought over Mexico and Central America. J. Clim. 1999, 12, 1577–1588. [Google Scholar] [CrossRef]
- Anderson, T.G.; Anchukaitis, K.J.; Pons, D.; Taylor, M. Multiscale trends and precipitation extremes in the Central American Midsummer Drought. Environ. Res. Lett. 2019, 14, 124016. [Google Scholar] [CrossRef]
- Alfaro, E.; Hidalgo, H.; Alfaro-Córdoba, M. Aridity Trends in Central America: A Spatial Correlation Analysis. Atmosphere 2020, 11, 427. [Google Scholar] [CrossRef] [Green Version]
- Herrera, D.A.; Ault, T.R.; Carrillo, C.M.; Fasullo, J.T.; Li, X.; Evans, C.P.; Alessi, M.J.; Mahowald, N.M. Dynamical characteristics of drought in the Caribbean from observations and simulations. J. Clim. 2020, 33, 10773–10797. [Google Scholar] [CrossRef]
- Schneider, U.; Becker, A.; Finger, P.; Meyer-Christoffer, A.; Rudolf, B.; Ziese, M. GPCC Full Data Reanalysis Version 7.0 at 1.0°: Monthly Land-Surface Precipitation from Rain-Gauges Built on GTS-Based and Historic Data. 2015. Available online: https://opendata.dwd.de/climate_environment/GPCC/html/fulldata_v7_doi_download.html (accessed on 22 December 2020). [CrossRef]
- Rohde, R.; Muller, R.A.; Jacobsen, R.; Muller, E.; Perlmutter, S.; Rosenfeld, A.; Wurtele, J.; Groom, D.; Wickham, C. A new estimate of the average Earth surface land temperature spanning 1753 to 2011. Geoinfo. Geostat. Over. 2013, 1. [Google Scholar] [CrossRef]
- Hijmans, R.J.; Cameron, S.E.; Parra, J.L.; Jones, P.G.; Jarvis, A. Very high resolution interpolated climate surfaces for global land areas. Int. J. Climatol. 2005, 25, 1965–1978. [Google Scholar] [CrossRef]
- Funk, C.; Peterson, P.; Landsfeld, M.; Pedreros, D.; Verdin, J.; Shukla, S.; Husak, G.; Rowland, J.; Harrison, L.; Hoell, A.; et al. The climate hazards infrared precipitation with stations—a new environmental record for monitoring extremes. Sci. Data 2015, 2, 150066. [Google Scholar] [CrossRef] [PubMed] [Green Version]
- O’Neill, B.C.; Tebaldi, C.; Van Vuuren, D.P.; Eyring, V.; Friedlingstein, P.; Hurtt, G.; Knutti, R.; Kriegler, E.; Lamarque, J.F.; Lowe, J.; et al. The Scenario Model Intercomparison Project (ScenarioMIP) for CMIP6. Geosci. Model Dev. 2016, 9, 3461–3482. [Google Scholar] [CrossRef] [Green Version]
- Riahi, K.; Van Vuuren, D.P.; Kriegler, E.; Edmonds, J.; O’neill, B.C.; Fujimori, S.; Bauer, N.; Calvin, K.; Dellink, R.; Fricko, O.; et al. The Shared Socioeconomic Pathways and their energy, land use, and greenhouse gas emissions implications: An overview. G. Environ. Chang. 2017, 42, 153–168. [Google Scholar] [CrossRef] [Green Version]
- Gidden, M.; Riahi, K.; Smith, S.; Fujimori, S.; Luderer, G.; Kriegler, E.; van Vuuren, D.P.; van den Berg, M.; Feng, L.; Klein, D.; et al. Global emissions pathways under different socioeconomic scenarios for use in CMIP6: A dataset of harmonized emissions trajectories through the end of the century. Geosci. Model Dev. 2019, 12, 1443–1475. [Google Scholar] [CrossRef] [Green Version]
- Ault, T.R.; Cole, J.E.; Overpeck, J.T.; Pederson, G.T.; Meko, D.M. Assessing the risk of persistent drought usingclimate model simulations and paleoclimate data. J. Clim. 2014, 27, 7529–7549. [Google Scholar] [CrossRef] [Green Version]
- Williams, A.P.; Seager, R.; Abatzoglou, J.T.; Cook, B.I.; Smerdon, J.E.; Cook, E.R. Contribution of anthropogenic warming to California drought during 2012–2014. Geophys. Res. Lett. 2015, 42, 6819–6828. [Google Scholar] [CrossRef] [Green Version]
- Rauscher, S.A.; Giorgi, F.; Diffenbaugh, N.S.; Seth, A. Extension and intensification of the Meso-American mid-summer drought in the twenty-first century. Clim. Dyn. 2008, 31, 551–571. [Google Scholar] [CrossRef]
- Ryu, J.-H.; Hayhoe, K. Understanding the sources of Caribbean precipitation biases in CMIP3 and CMIP5 simulations. Clim. Dyn. 2014, 42, 3233–3252. [Google Scholar] [CrossRef]
- Taylor, M.A.; Whyte, F.S.; Stephenson, T.S.; Campbell, J.D. Why dry? Investigating the future evolution of the Caribbean Low Level Jet to explain projected Caribbean drying. Int. J. Climatol. 2013, 33, 784–792. [Google Scholar] [CrossRef]
- Amador, J.A. A climatic feature of the tropical Americas: The trade wind easterly jet. Tóp. Meteorol. Oceanogr. 1998, 5, 91–102. [Google Scholar]
- Swann, A.L.S.; Hoffman, F.M.; Koven, C.D.; Randerson, J.T. Plant responses to increasing CO2 reduce estimates of climate impacts on drought severity. Proc. Nat. Acad. Sci. USA 2016, 113, 10019–10024. [Google Scholar] [CrossRef] [Green Version]
- Trugman, A.T.; Medvigy, D.; Mankin, J.S.; Anderegg, W.R.L. Soil moisture stress as a major driver of carbon cycle uncertainty. Geophys. Res. Lett. 2018, 45, 6495–6503. [Google Scholar] [CrossRef]
- Cook, B.I.; Mankin, J.S.; Marvel, K.; Williams, A.P.; Smerdon, J.E.; Anchukaitis, K.J. Twenty-first century drought projections in the CMIP6 forcing scenarios. Earth’s Future 2020, 8, e2019EF001461. [Google Scholar] [CrossRef] [Green Version]
- Scoccimarro, E.; Gualdi, S. Heavy Daily Precipitation Events in the CMIP6 Worst-Case Scenario: Projected Twenty-First-Century Changes. J. Clim. 2020, 33, 7631–7642. [Google Scholar] [CrossRef]
- US Global Change Research Program. Global Climate Change Impacts in the United States. 2009. Available online: https://nca2009.globalchange.gov/islands/index.html#footnote7_n3w79p3 (accessed on 1 October 2020).
- Centella-Artola, A.; Taylor, M.A.; Bezanilla-Morlot, A.; Martinez-Castro, D.; Campbell, J.D.; Stephenson, T.S.; Vichot, A. Assessing the effect of domain size over the Caribbean region using the PRECIS regional climate model. Clim. Dyn. 2015, 44, 1901–1918. [Google Scholar] [CrossRef]
- Martínez-Castro, D.; Vichot-Llano, A.; Bezanilla-Morlot, A.; Centella-Artola, A.; Campbell, J.; Viloria-Holguin, C. Performance of RegCM-4.3 over the Caribbean region using different configurations of the Tiedtke convective parameterization scheme. Rev. Climatol. 2016, 16, 77–98. [Google Scholar]
- Vichot-Llano, A.; Martinez-Castro, D.; Giorgi, F.; Bezanilla-Morlot, A.; Centella-Artola, A. Comparison of GCM and RCM simulated precipitation and temperature over Central America and the Caribbean. Theor. Appl. Climatol. 2020. [Google Scholar] [CrossRef]
- Navarro-Racines, C.; Tarapues, J.; Thornton, P.; Jarvis, A.; Ramirez-Villegas, J. High-resolution and bias-corrected CMIP5 projections for climate change impact assessments. Sci. Data 2020, 7, 7. [Google Scholar] [CrossRef] [PubMed] [Green Version]
- Sobel, A.H.; Burleyson, C.D.; Yuter, S.E. Rain on small tropical islands. J. Geophys. Res. 2011, 116, D08102. [Google Scholar] [CrossRef] [Green Version]


| CMIP6 Model | Model Native Resolution | Historical | SSP1-2.6 | SSP5-8.5 | |||||||||
|---|---|---|---|---|---|---|---|---|---|---|---|---|---|
| pr | mrsos | tas | evspsbl | pr | mrsos | tas | evspsbl | pr | mrsos | tas | evspsbl | ||
| ACCESS-CM2 | 0.80° × 0.53° | * | * | * | * | * | * | * | * | * | * | * | * |
| ACCESS-ESM1-5 | 0.80° × 0.53° | * | * | * | * | * | * | * | * | * | * | * | * |
| BCC-CSM2-MR | 0.89° × 0.89° | * | * | * | * | * | * | * | * | * | * | * | * |
| CAMS-CSM1-0 | 0.89° × 0.89° | * | * | * | * | * | * | * | * | * | * | * | * |
| CanESM5 | 0.36° × 0.36° | * | * | * | * | * | * | * | * | * | * | * | * |
| CESM2 | 1.07° × 0.80° | * | * | * | x | * | * | * | x | * | * | * | x |
| CESM2-WACCM | 1.07° × 0.80° | * | * | * | x | * | * | * | x | * | * | * | x |
| CNRM-CM6-1 ** | 0.71° × 0.71° | * | * | * | * | * | * | * | * | * | * | * | * |
| FGOALS-f3 | 1.0° × 0.80° | * | * | * | * | * | * | * | * | * | * | * | * |
| GFDL-ESM4 | 1.0° × 0.80° | * | * | * | x | * | * | * | x | * | * | * | x |
| GISS-E2-1-G | 0.50° × 0.40° | * | * | * | * | * | * | * | * | * | * | * | * |
| HadGEM3-GC31-LLa | 0.80° × 0.53° | * | * | * | * | * | x | * | x | * | x | * | * |
| INM-CM5-0 | 0.67° × 0.50° | * | x | * | x | * | x | * | * | * | x | * | x |
| IPSL-CM6A-LR | 0.80° × 0.40° | * | * | * | * | * | * | * | * | * | * | * | * |
| MIROC-ES2L ** | 0.36° × 0.36° | * | * | * | * | * | * | * | * | * | * | * | * |
| MIROC6 | 0.71° × 0.71° | * | x | * | * | * | x | * | * | * | x | * | * |
| MPI-ESM1-2-LR | 0.53° × 0.53° | * | x | * | * | * | x | * | * | * | x | * | * |
| MRI-ESM2-0 | 0.89° × 0.89° | * | * | * | * | * | * | * | * | * | * | * | * |
Publisher’s Note: MDPI stays neutral with regard to jurisdictional claims in published maps and institutional affiliations. |
© 2020 by the authors. Licensee MDPI, Basel, Switzerland. This article is an open access article distributed under the terms and conditions of the Creative Commons Attribution (CC BY) license (http://creativecommons.org/licenses/by/4.0/).
Share and Cite
Herrera, D.A.; Mendez-Tejeda, R.; Centella-Artola, A.; Martínez-Castro, D.; Ault, T.; Delanoy, R. Projected Hydroclimate Changes on Hispaniola Island through the 21st Century in CMIP6 Models. Atmosphere 2021, 12, 6. https://0-doi-org.brum.beds.ac.uk/10.3390/atmos12010006
Herrera DA, Mendez-Tejeda R, Centella-Artola A, Martínez-Castro D, Ault T, Delanoy R. Projected Hydroclimate Changes on Hispaniola Island through the 21st Century in CMIP6 Models. Atmosphere. 2021; 12(1):6. https://0-doi-org.brum.beds.ac.uk/10.3390/atmos12010006
Chicago/Turabian StyleHerrera, Dimitris A., Rafael Mendez-Tejeda, Abel Centella-Artola, Daniel Martínez-Castro, Toby Ault, and Ramón Delanoy. 2021. "Projected Hydroclimate Changes on Hispaniola Island through the 21st Century in CMIP6 Models" Atmosphere 12, no. 1: 6. https://0-doi-org.brum.beds.ac.uk/10.3390/atmos12010006