Simultaneous Roadside and Urban Background Measurements of Submicron Aerosol Number Concentration and Size Distribution (in the Range 20–800 nm), along with Chemical Composition in Strasbourg, France


 and
and
Abstract
:1. Introduction
2. Experiments
2.1. Measurement Sites and Period
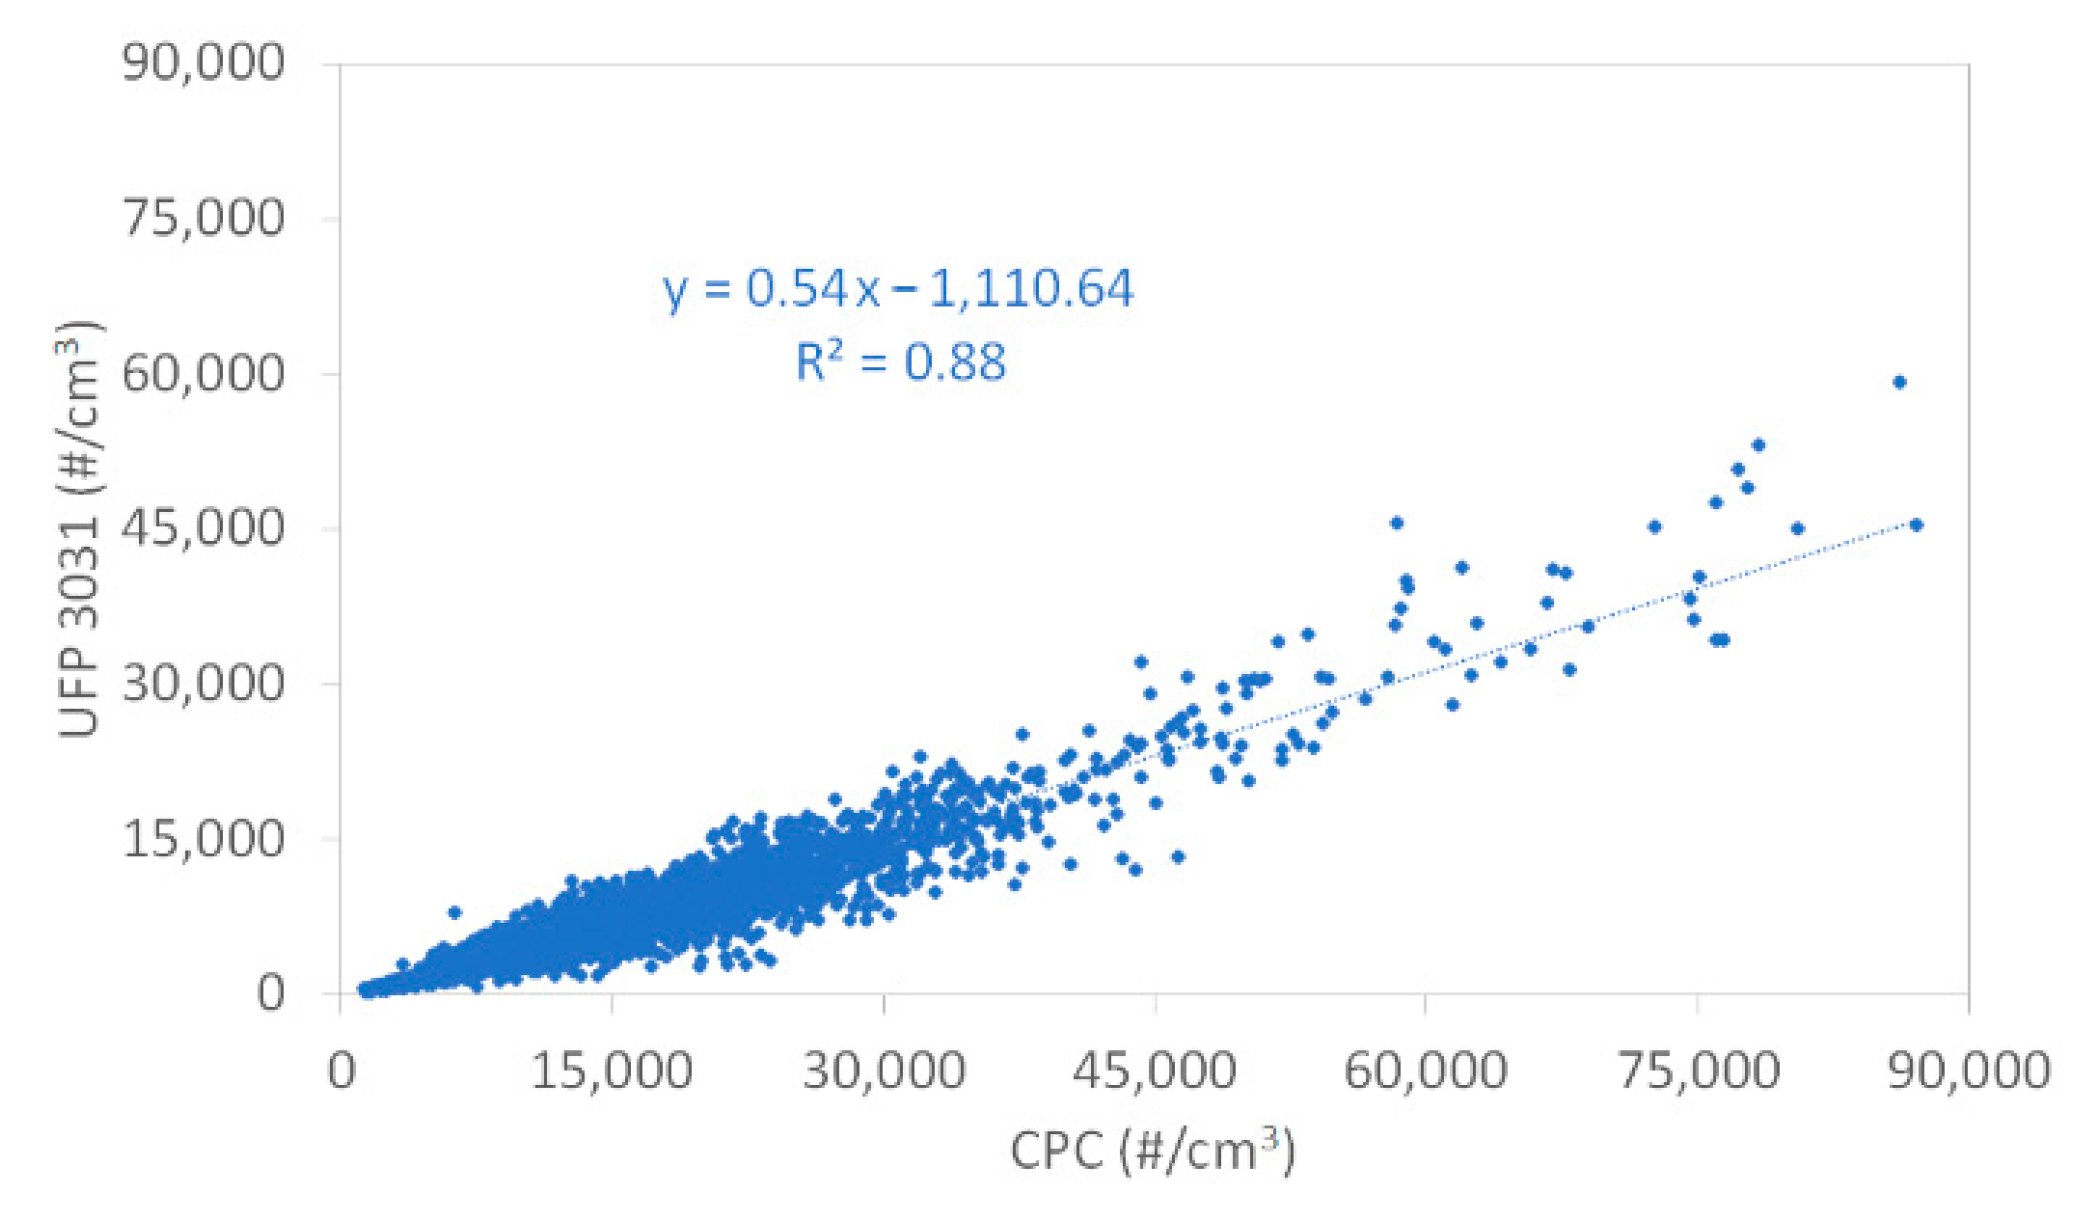
2.2. Instrumental
2.3. Assumptions and Statistical Tools
3. Results
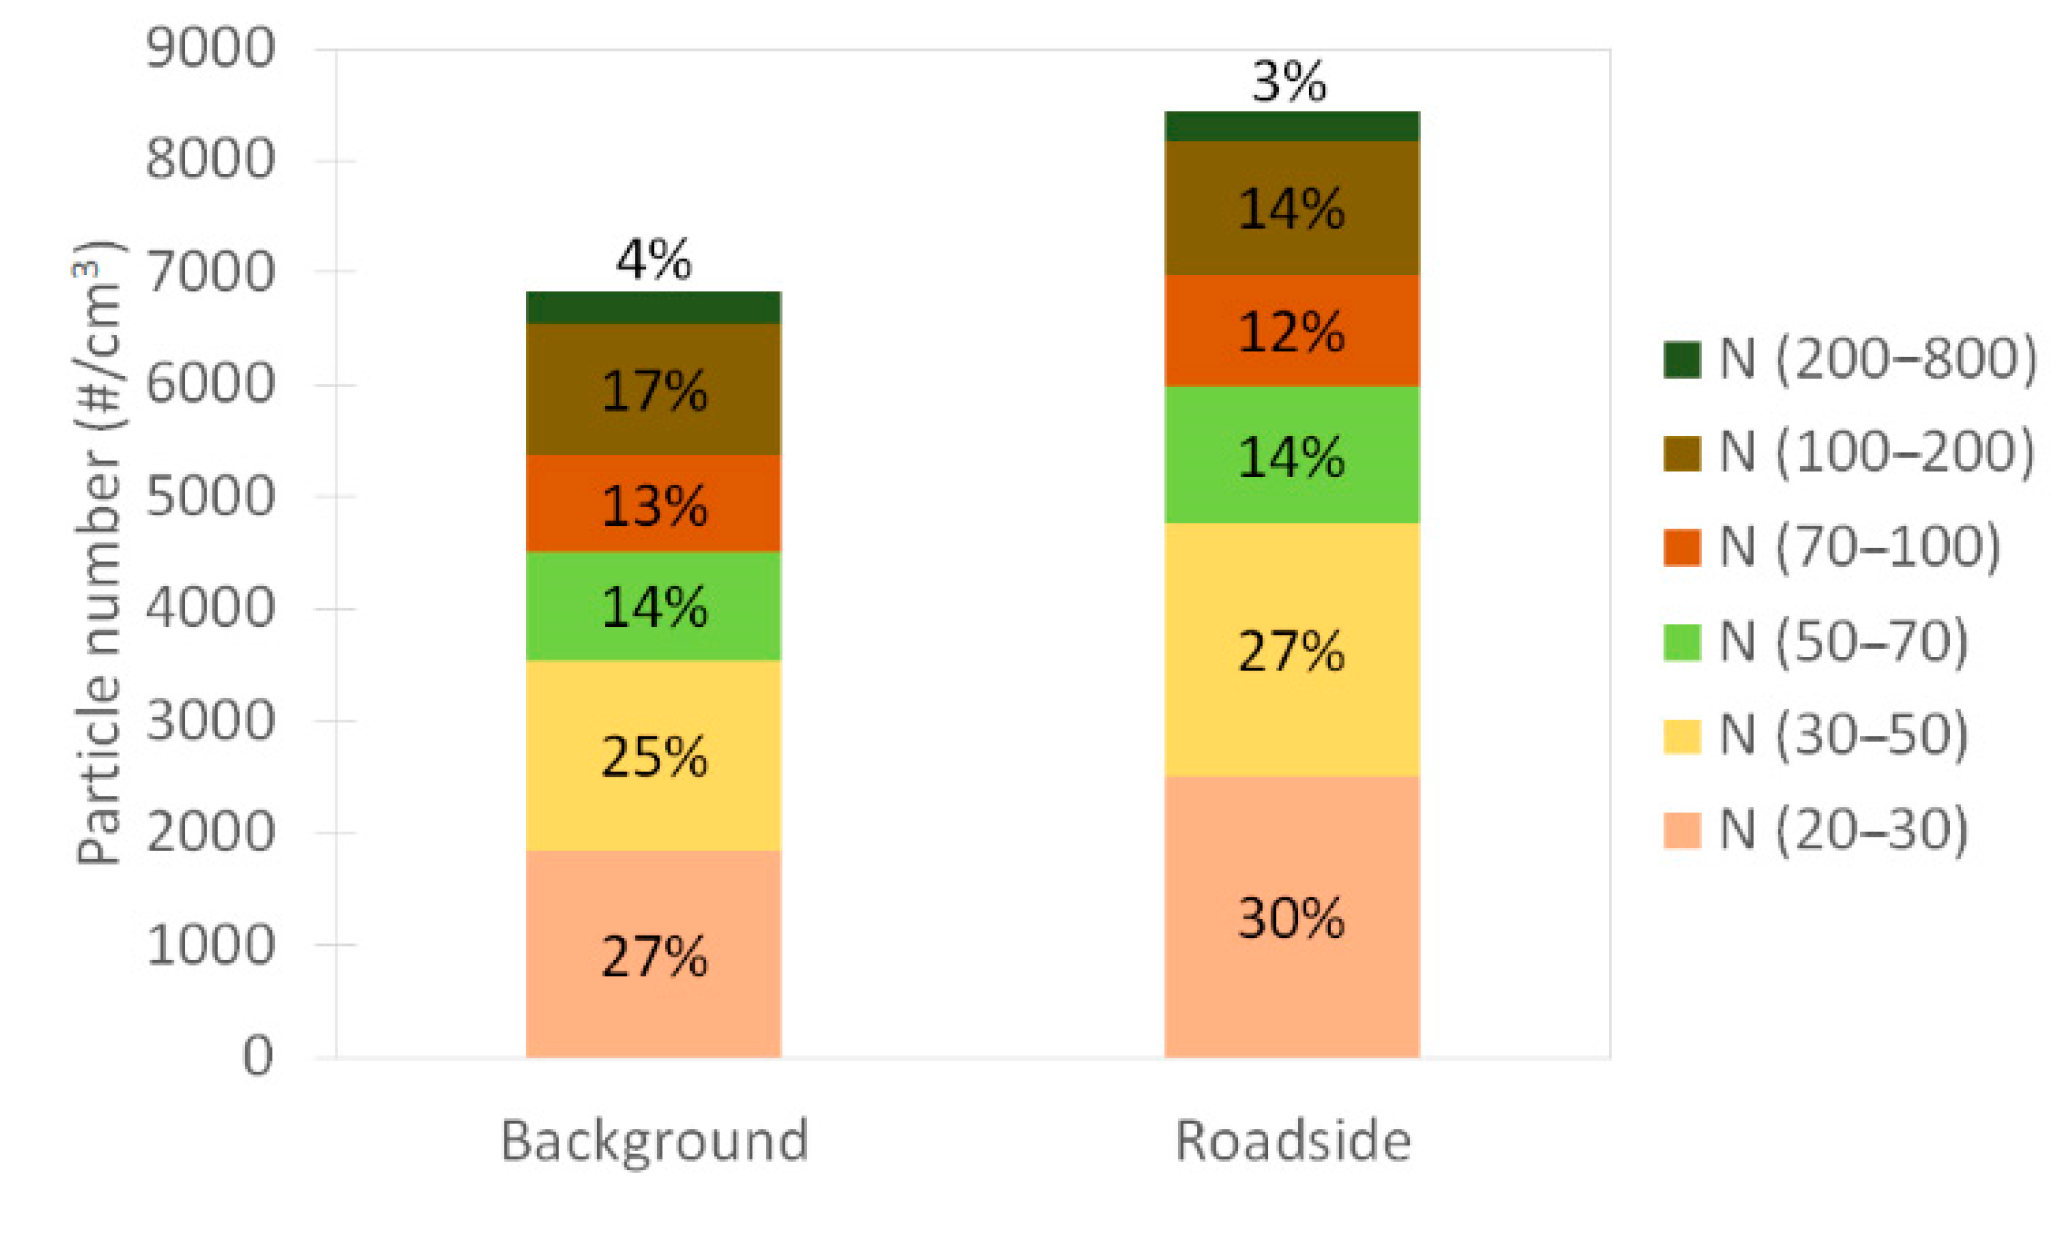
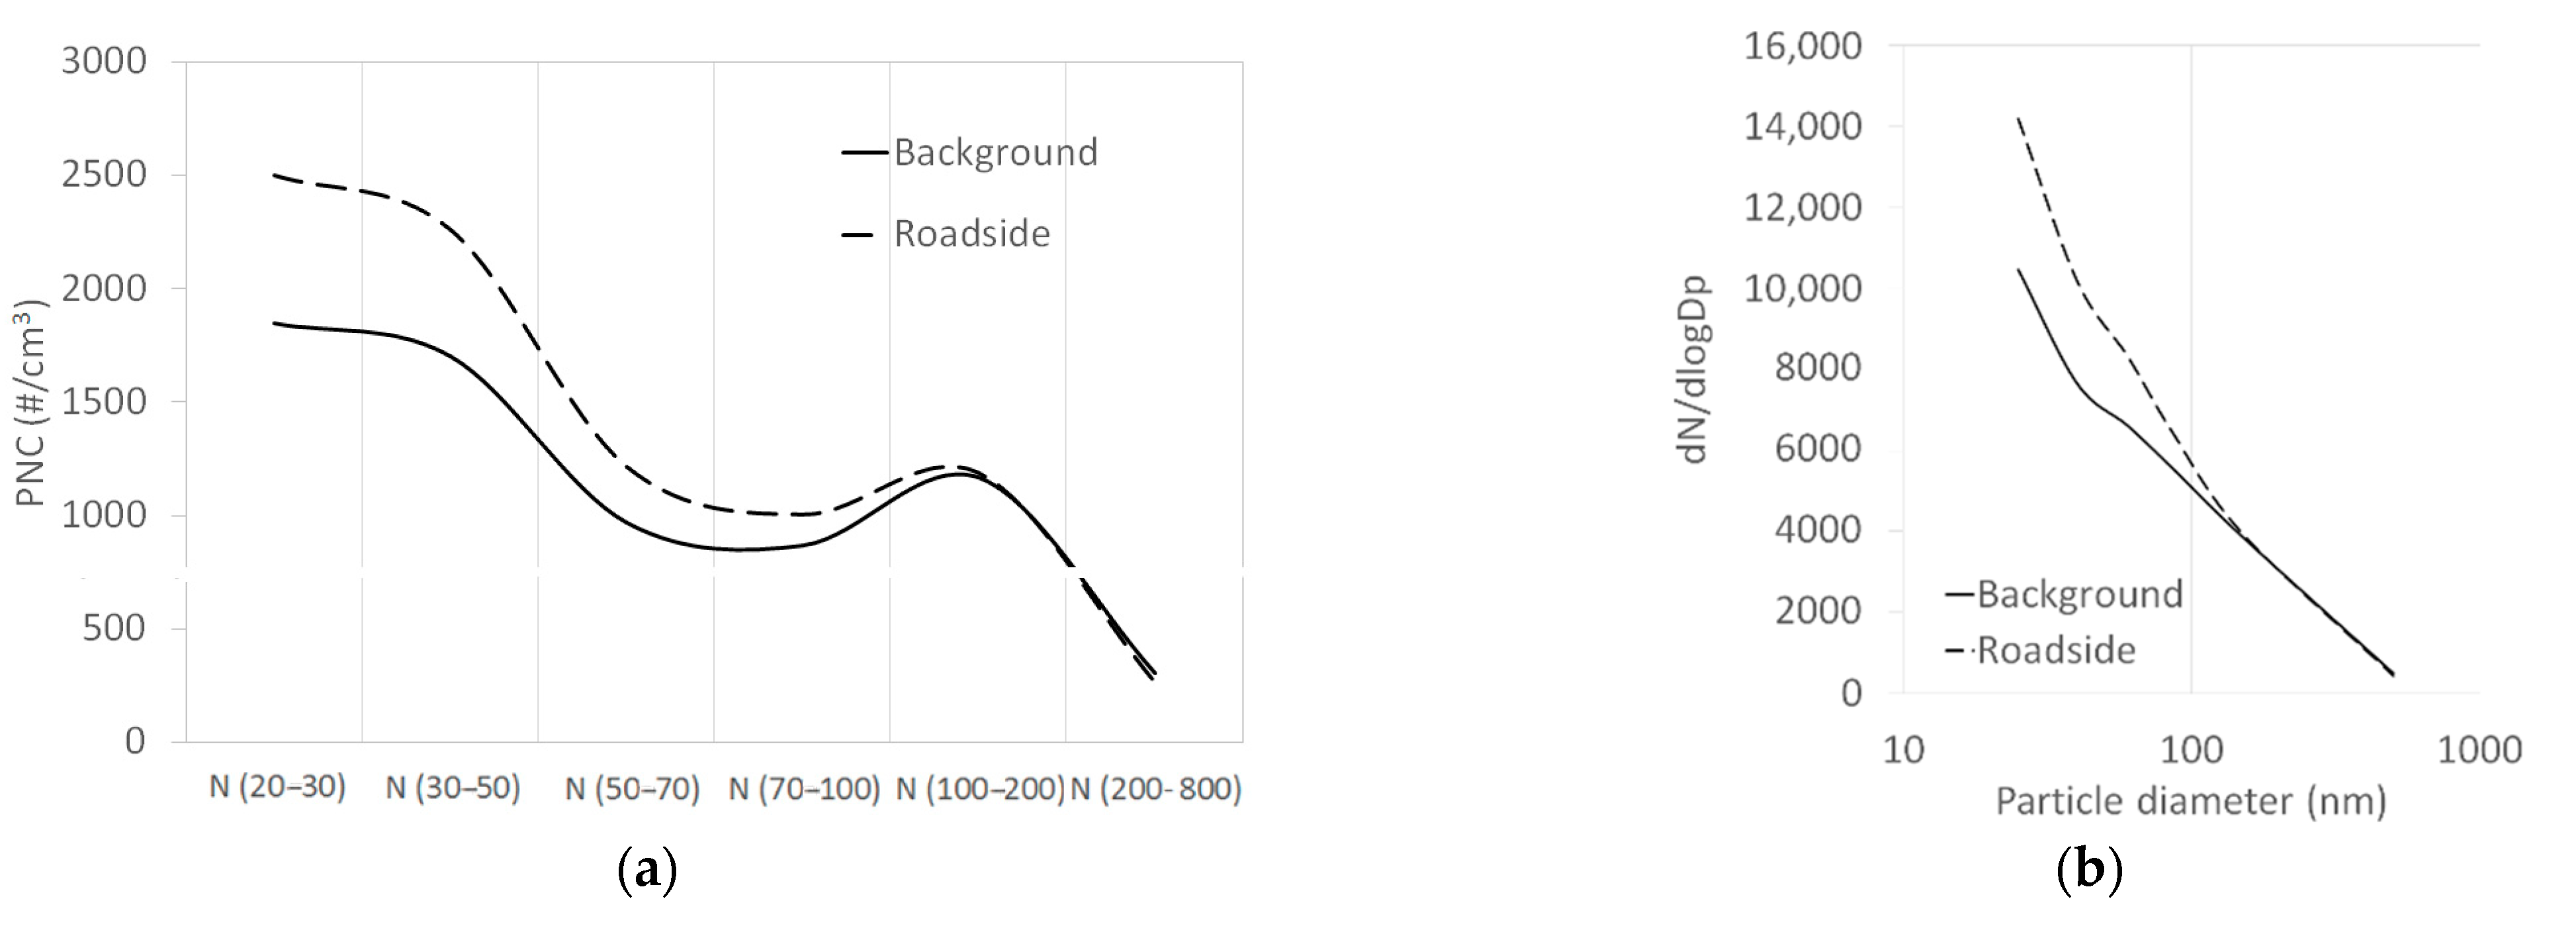
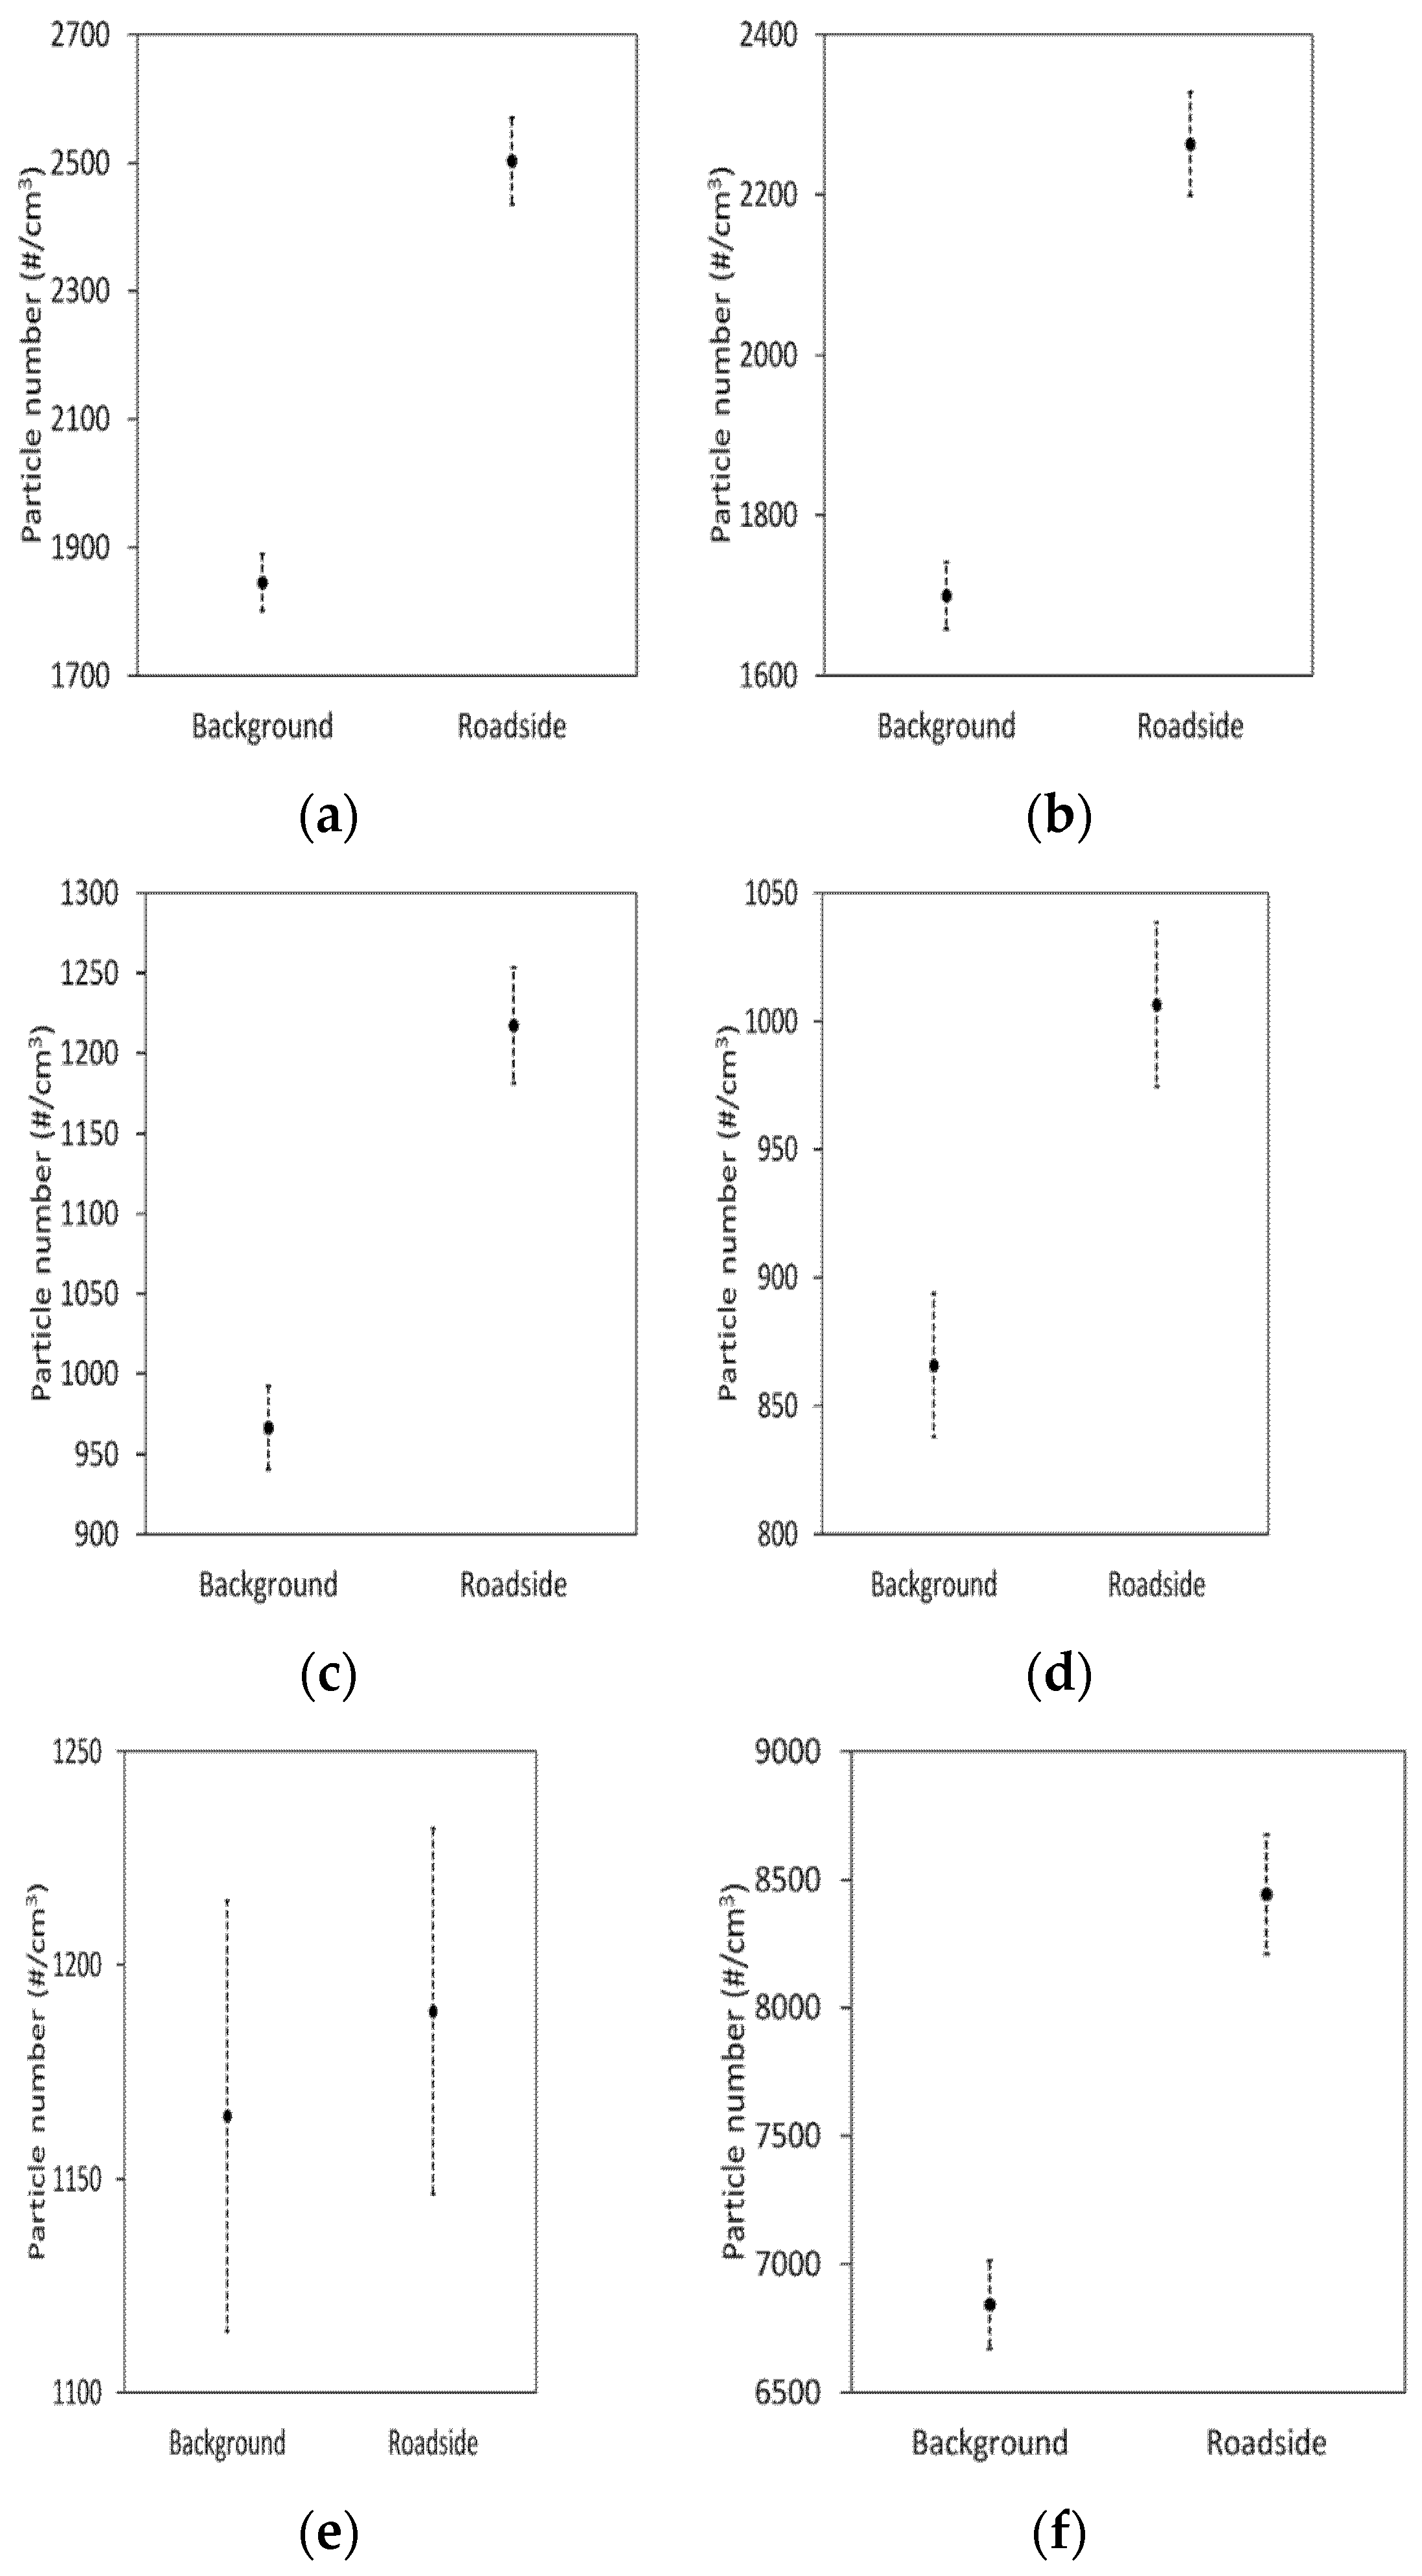
3.1. Size Distributions
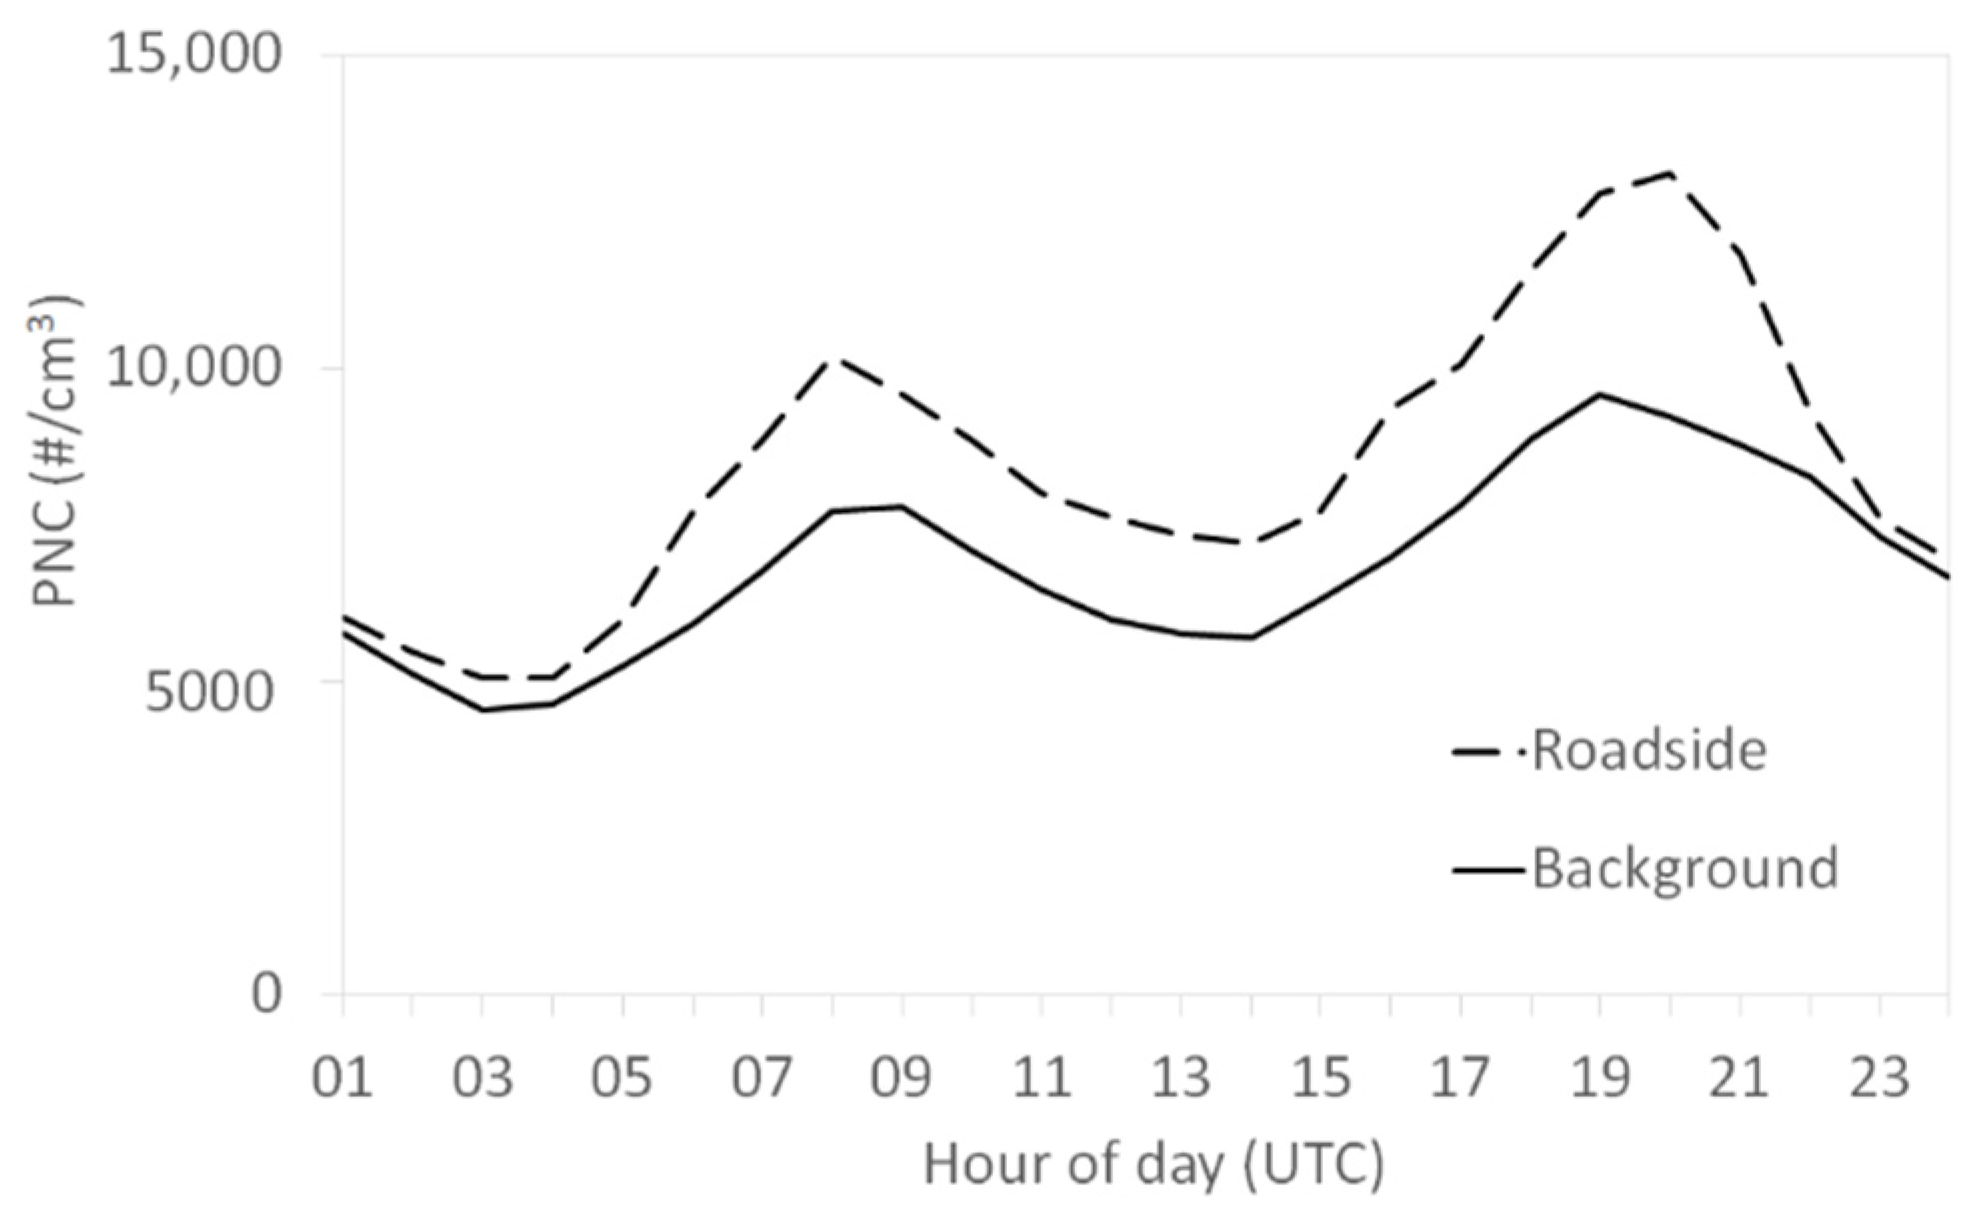
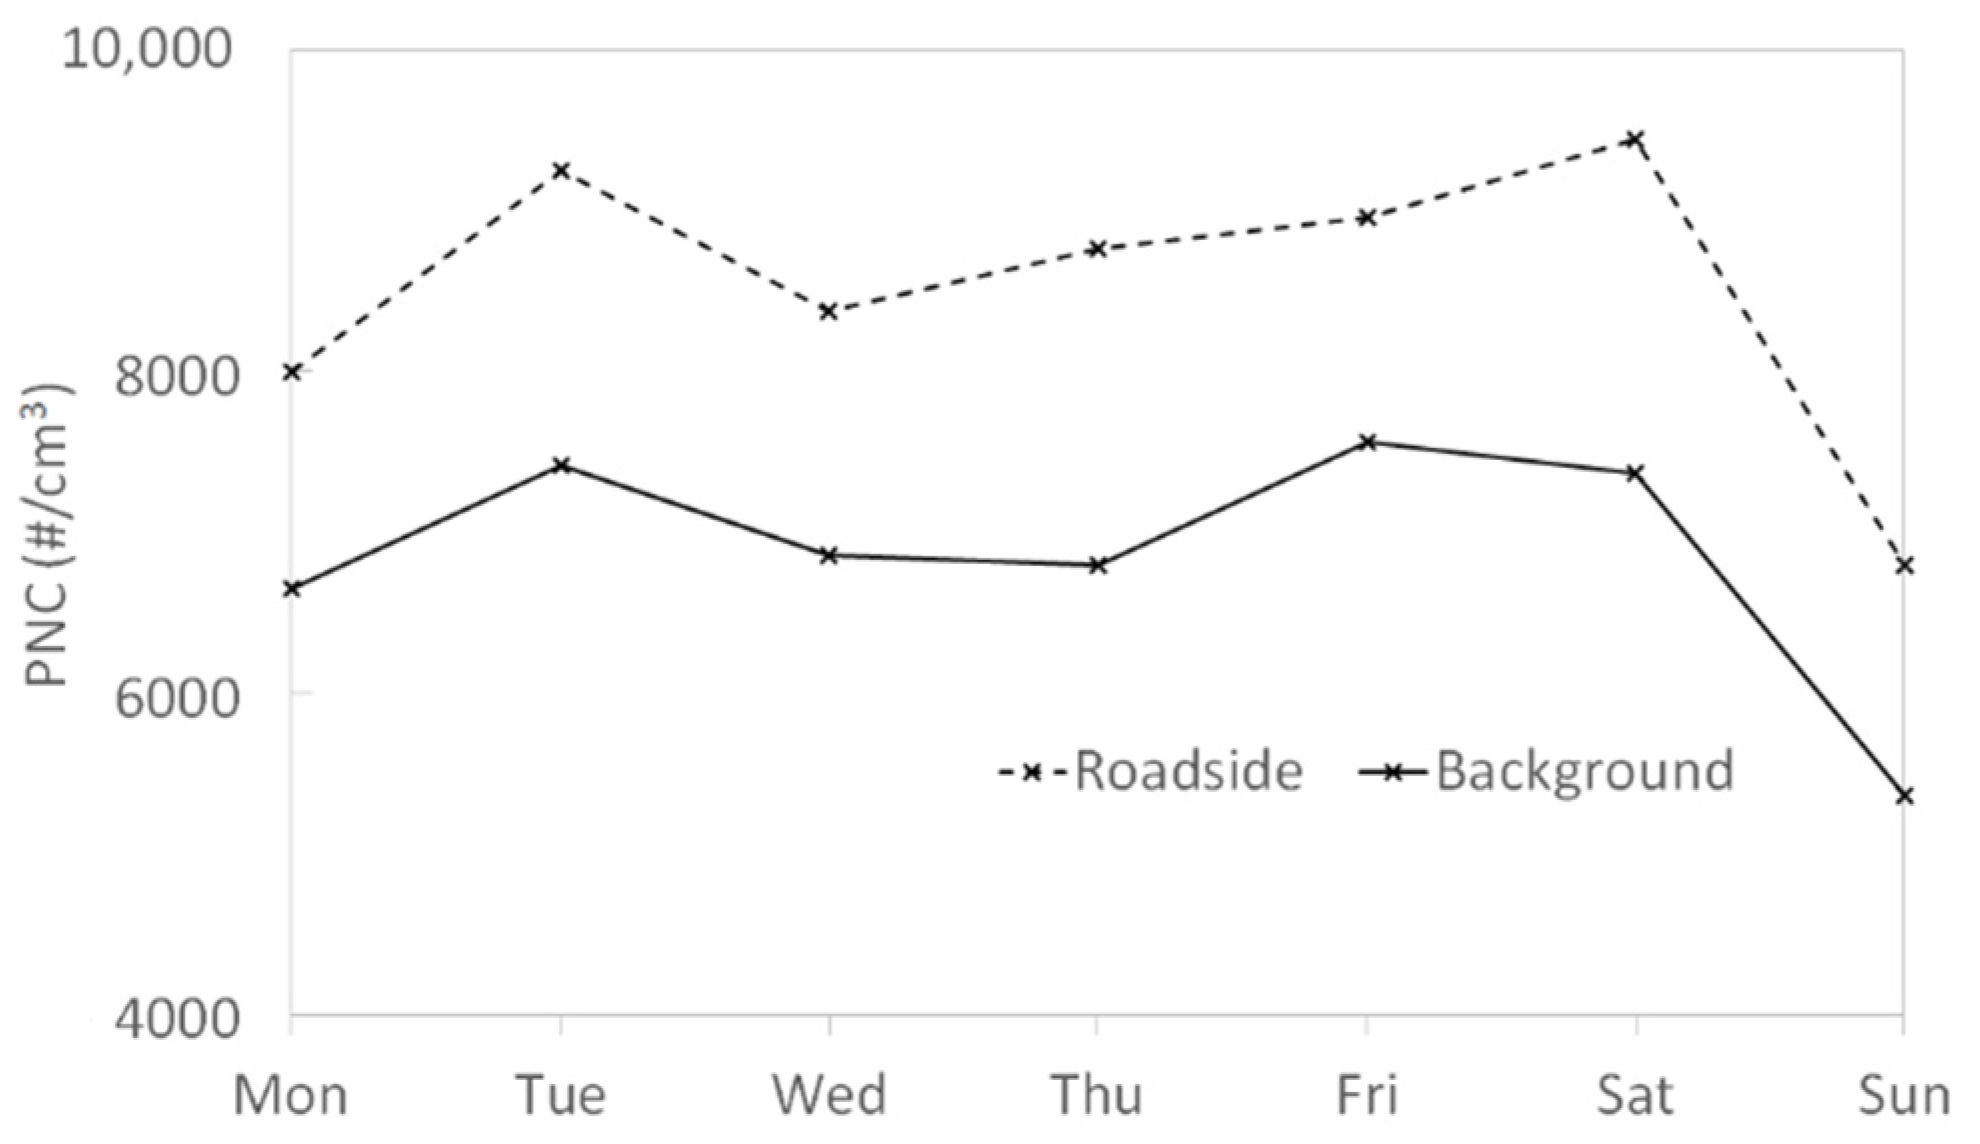
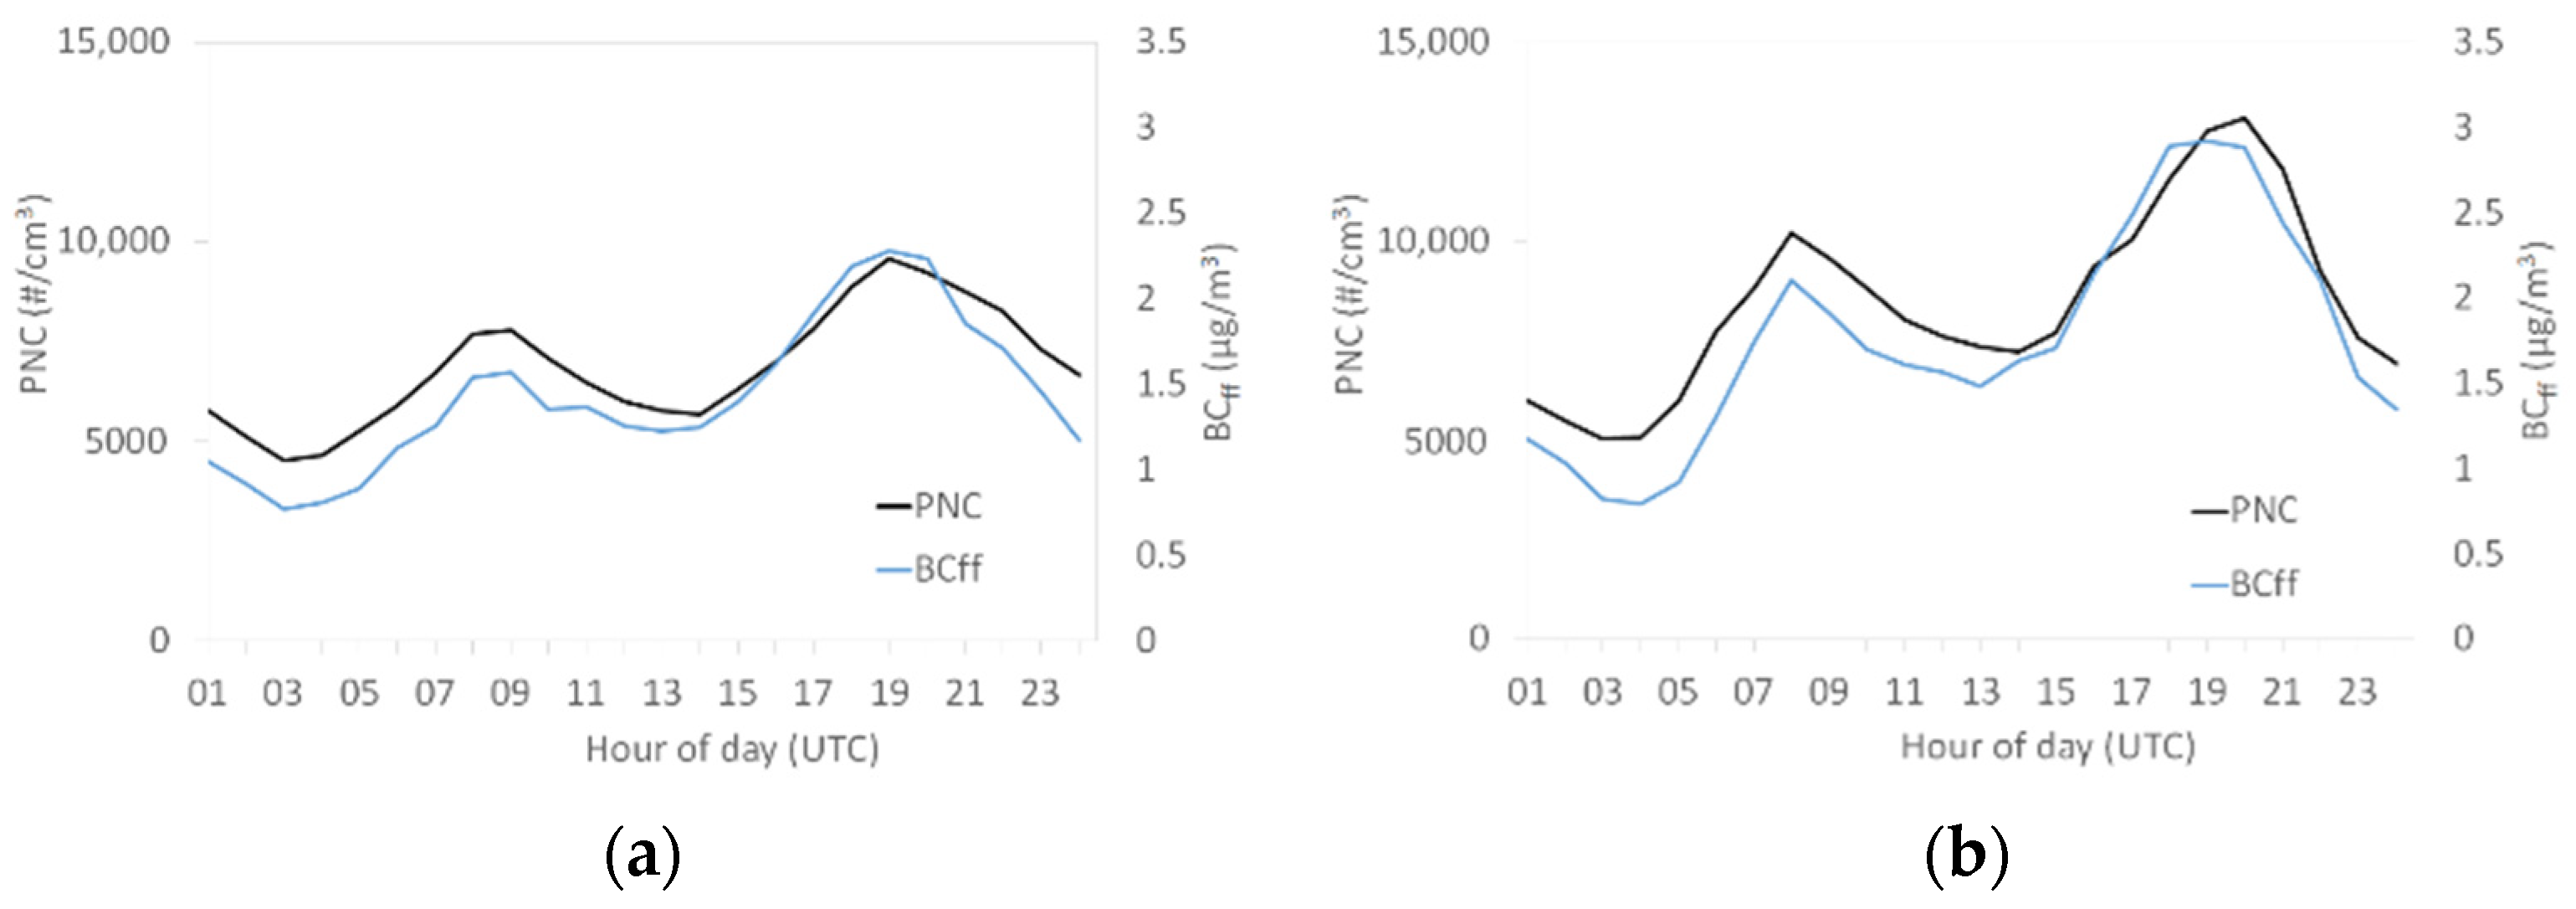
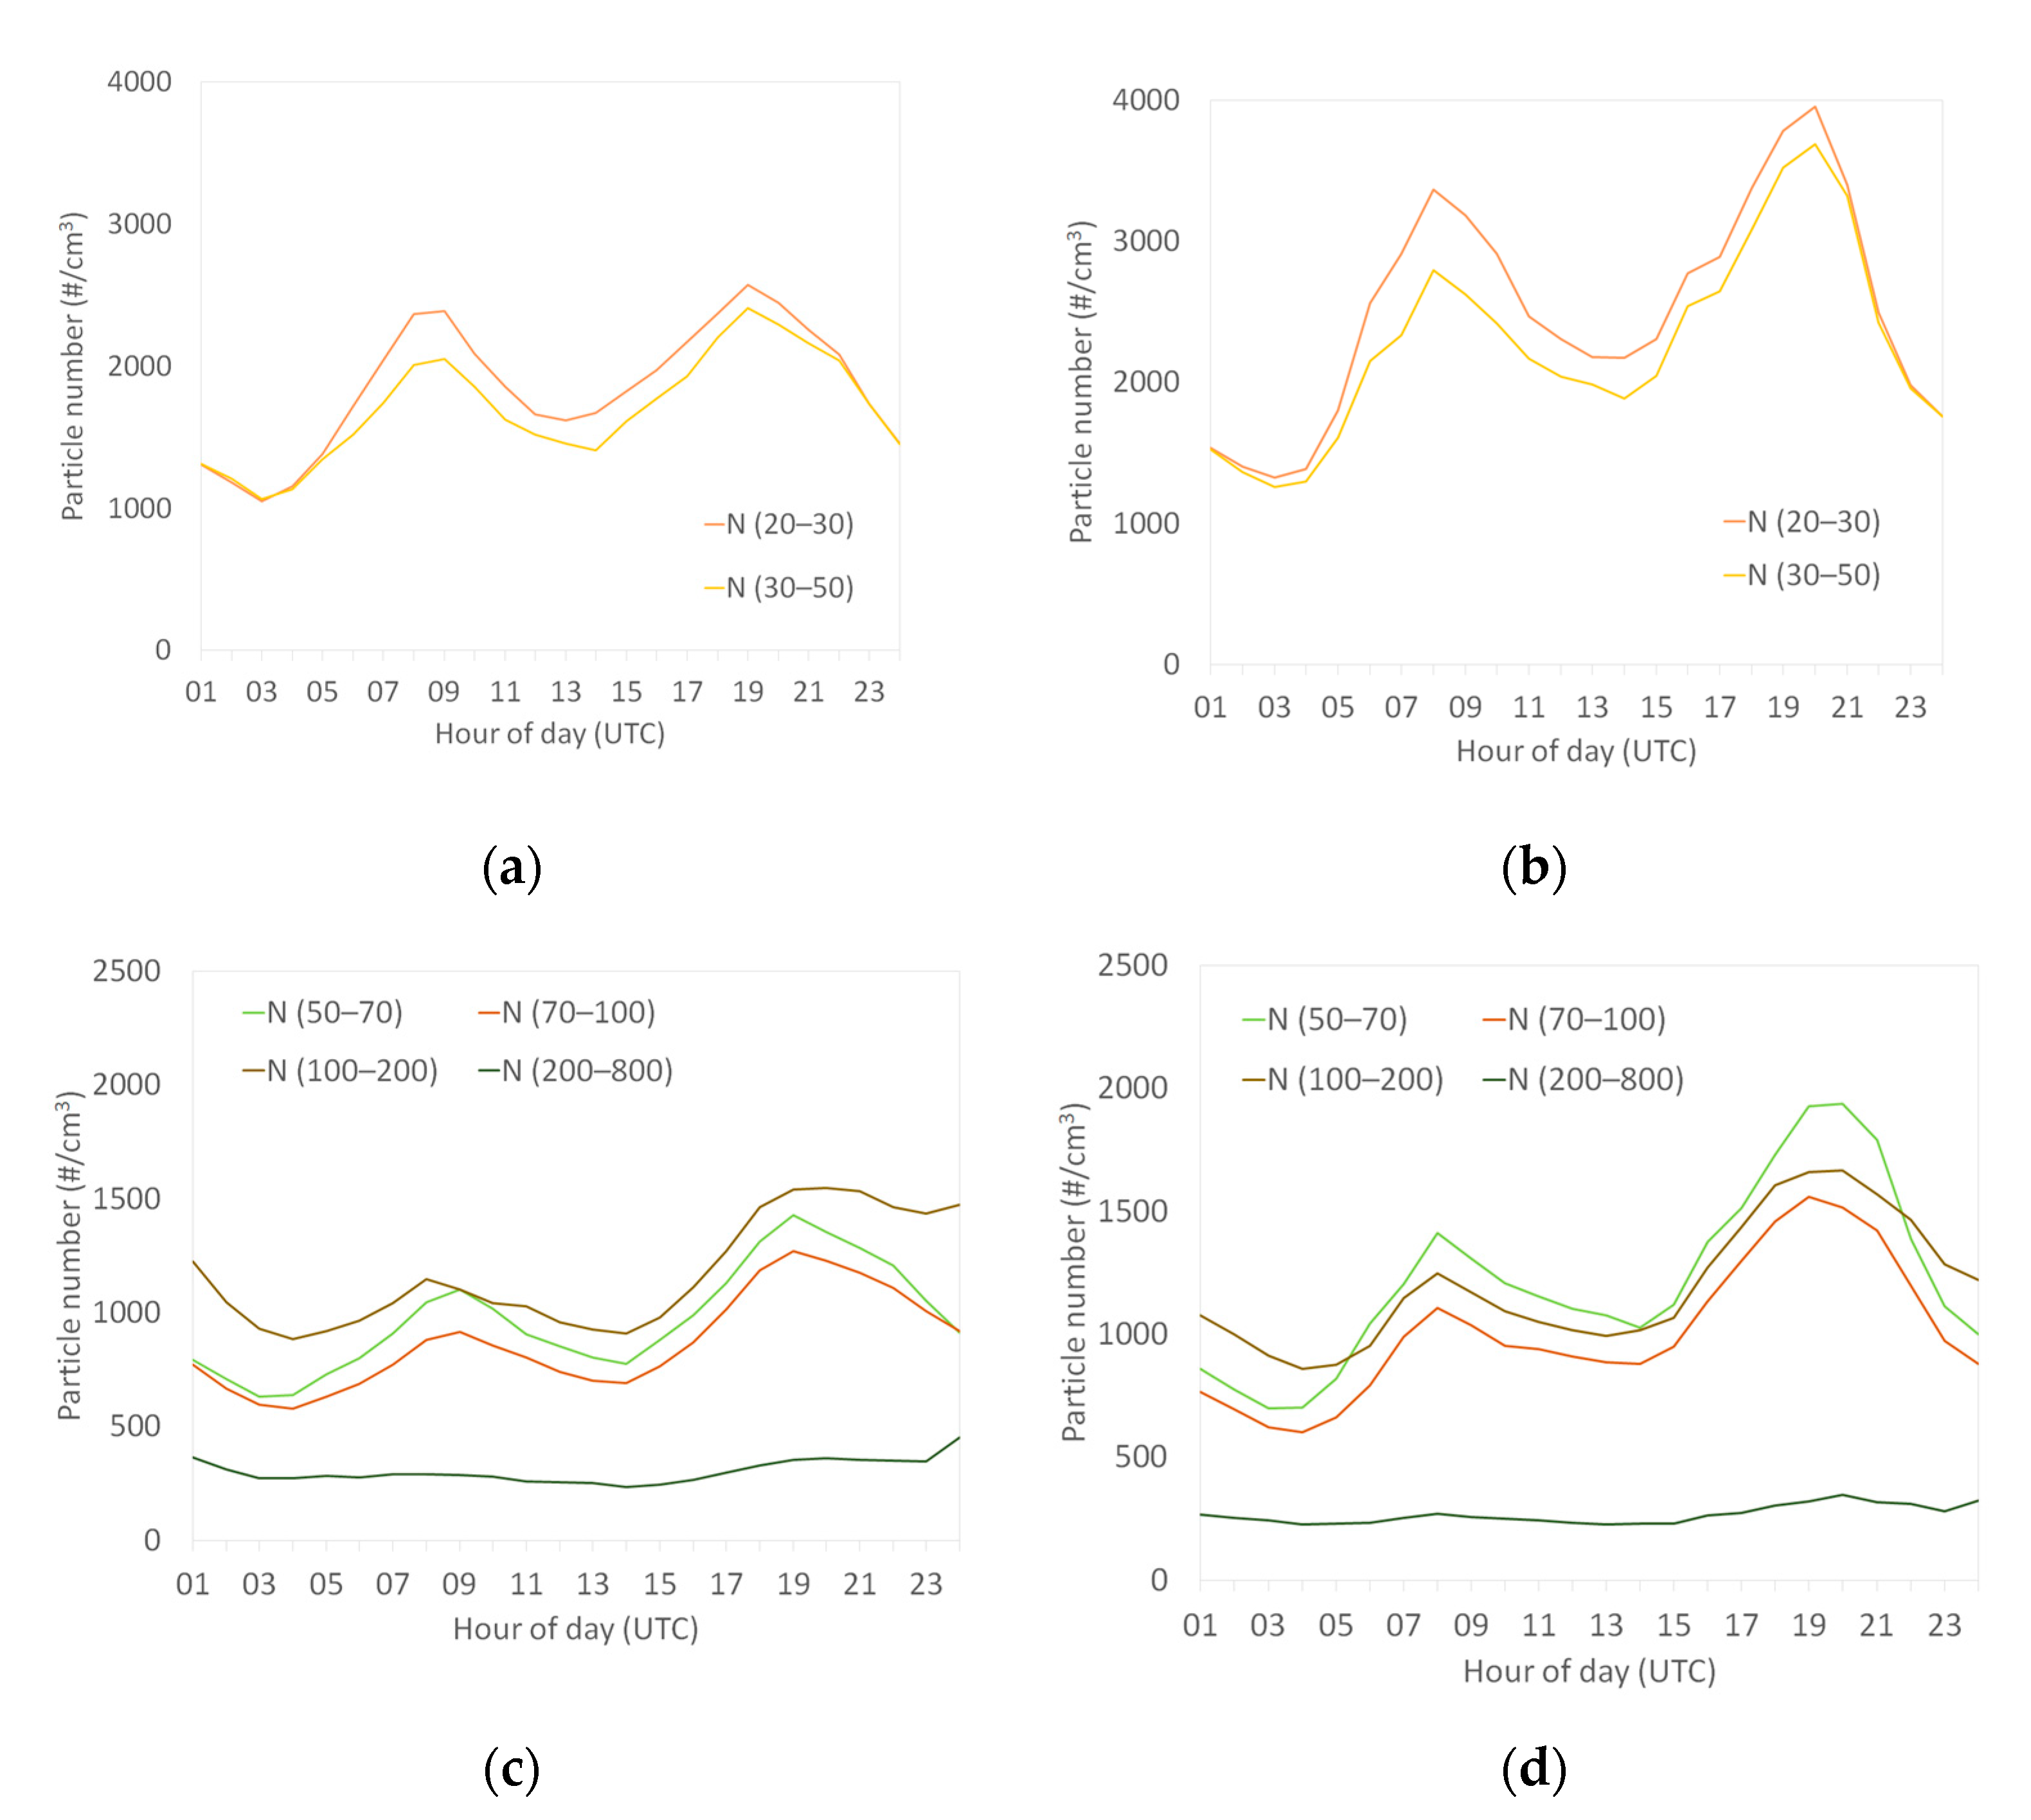
3.2. PNC Daily and Weekly Variations
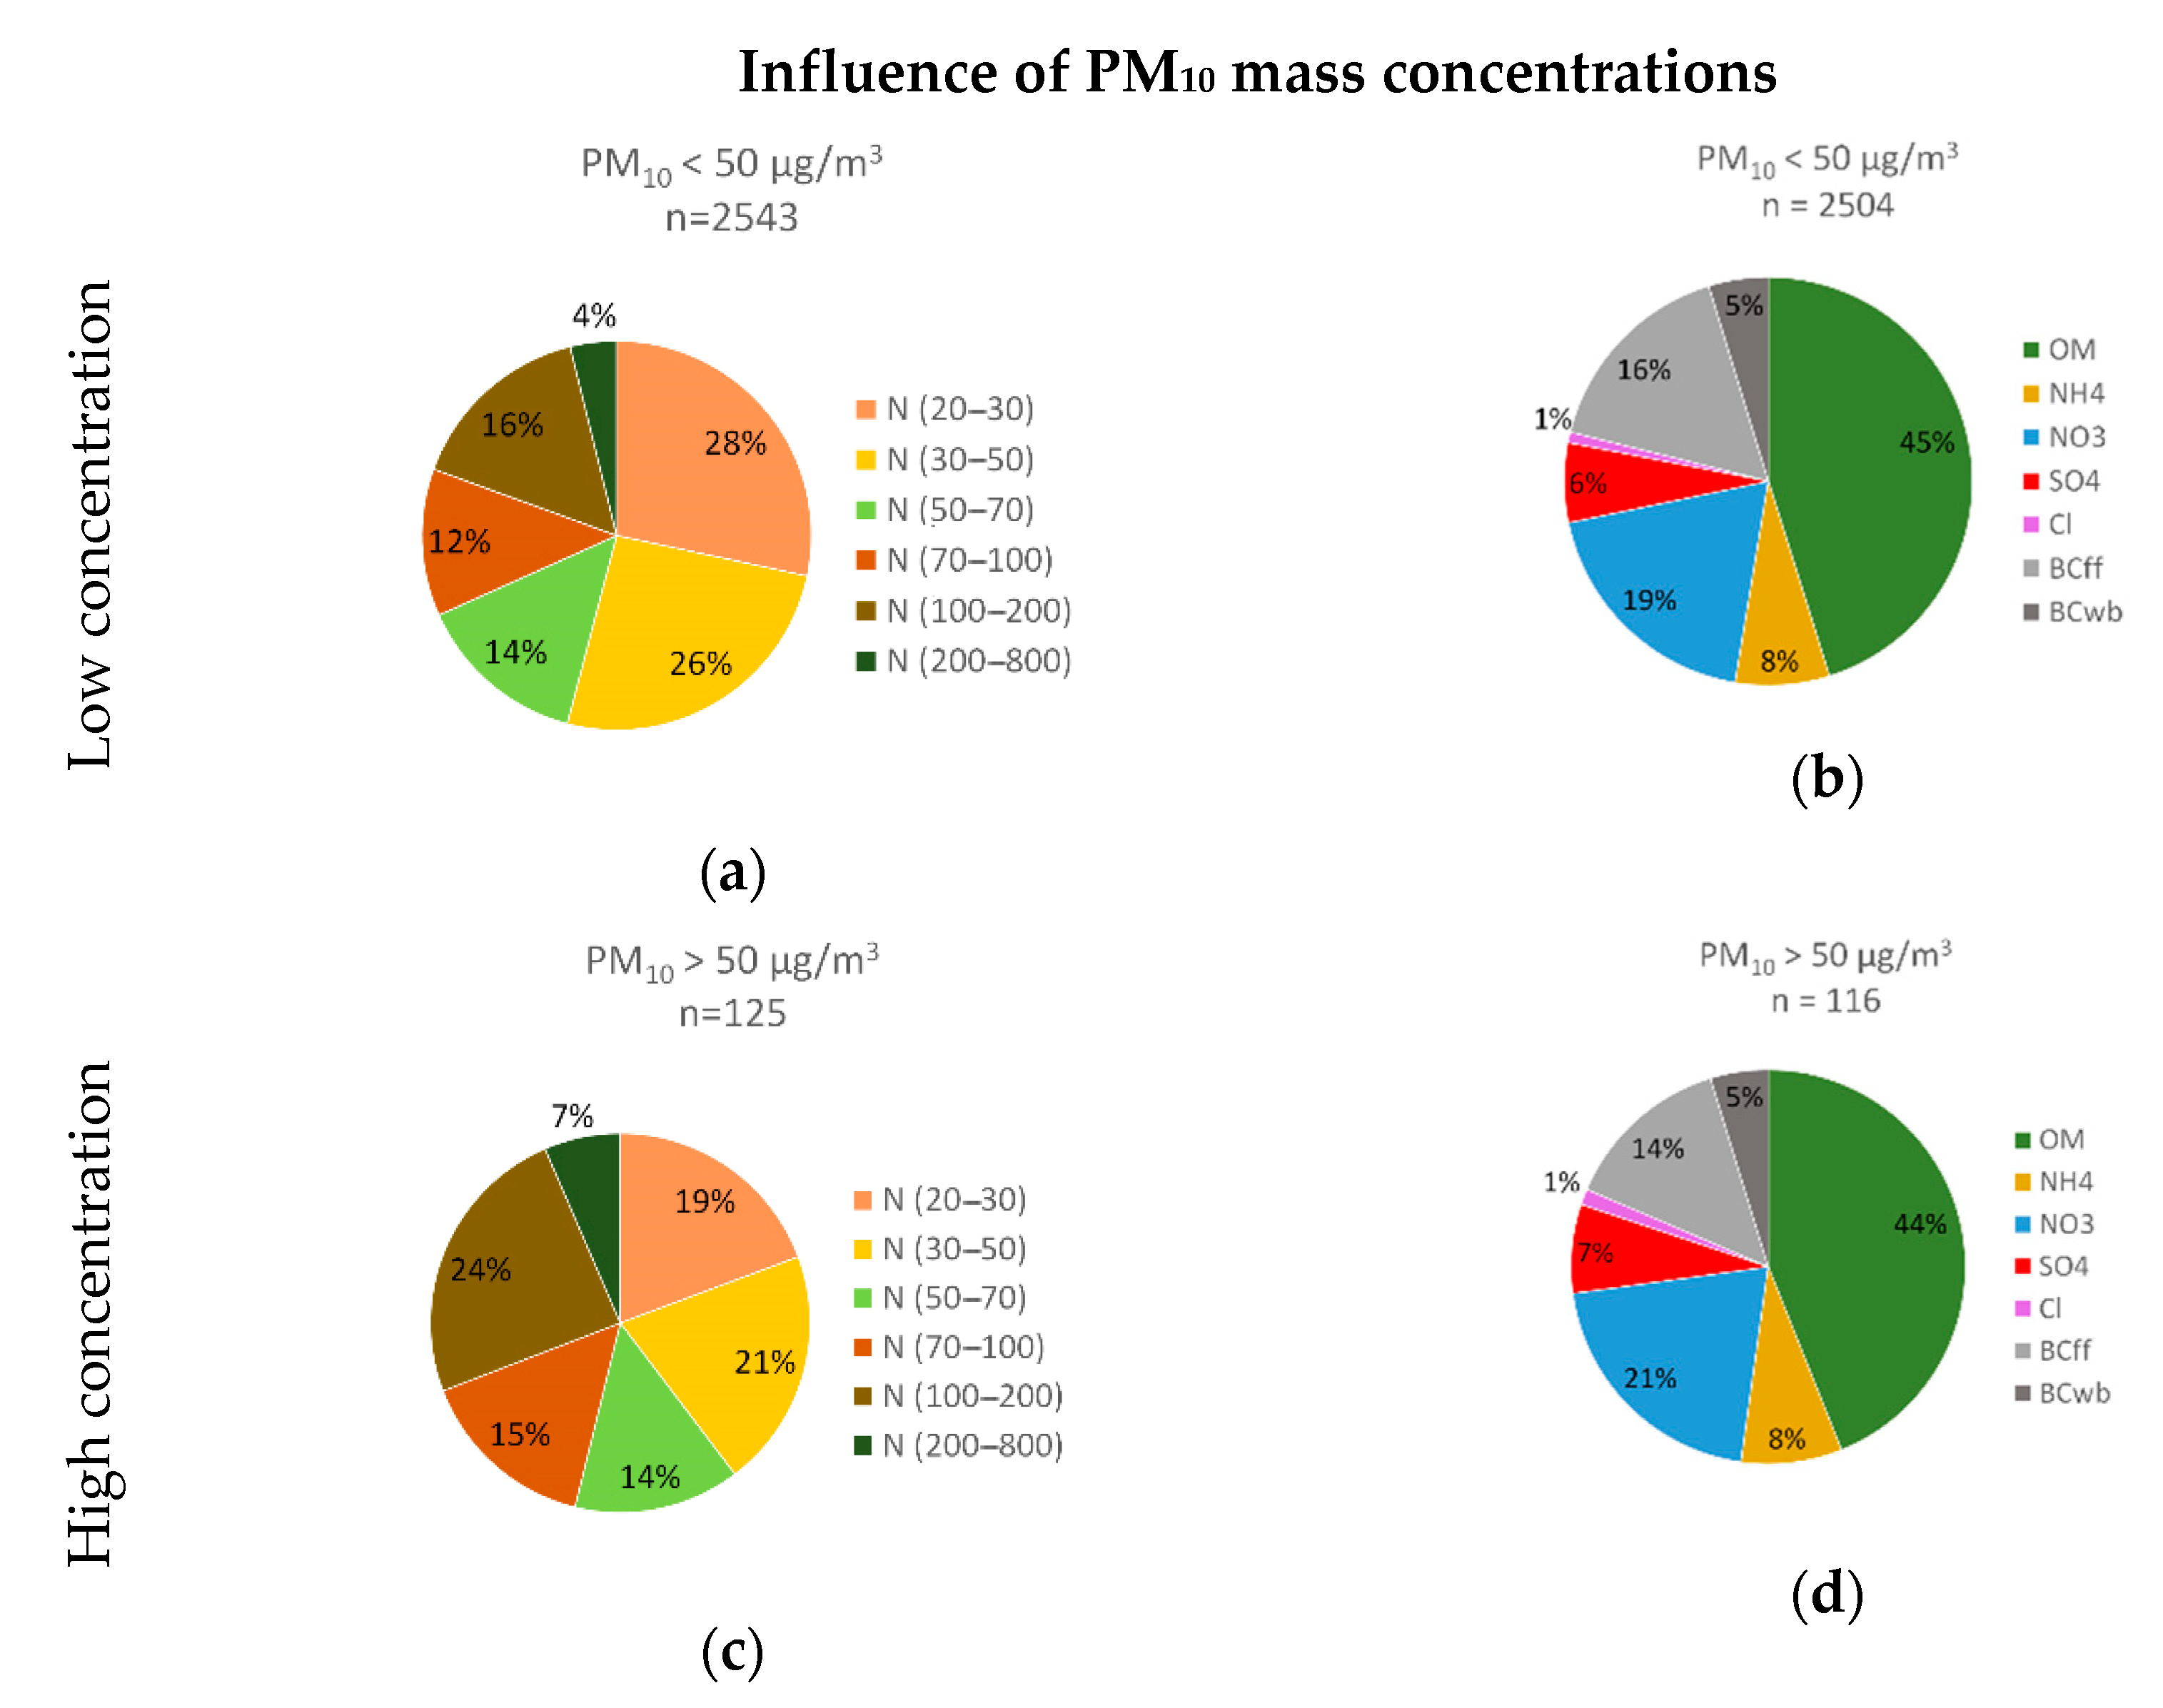
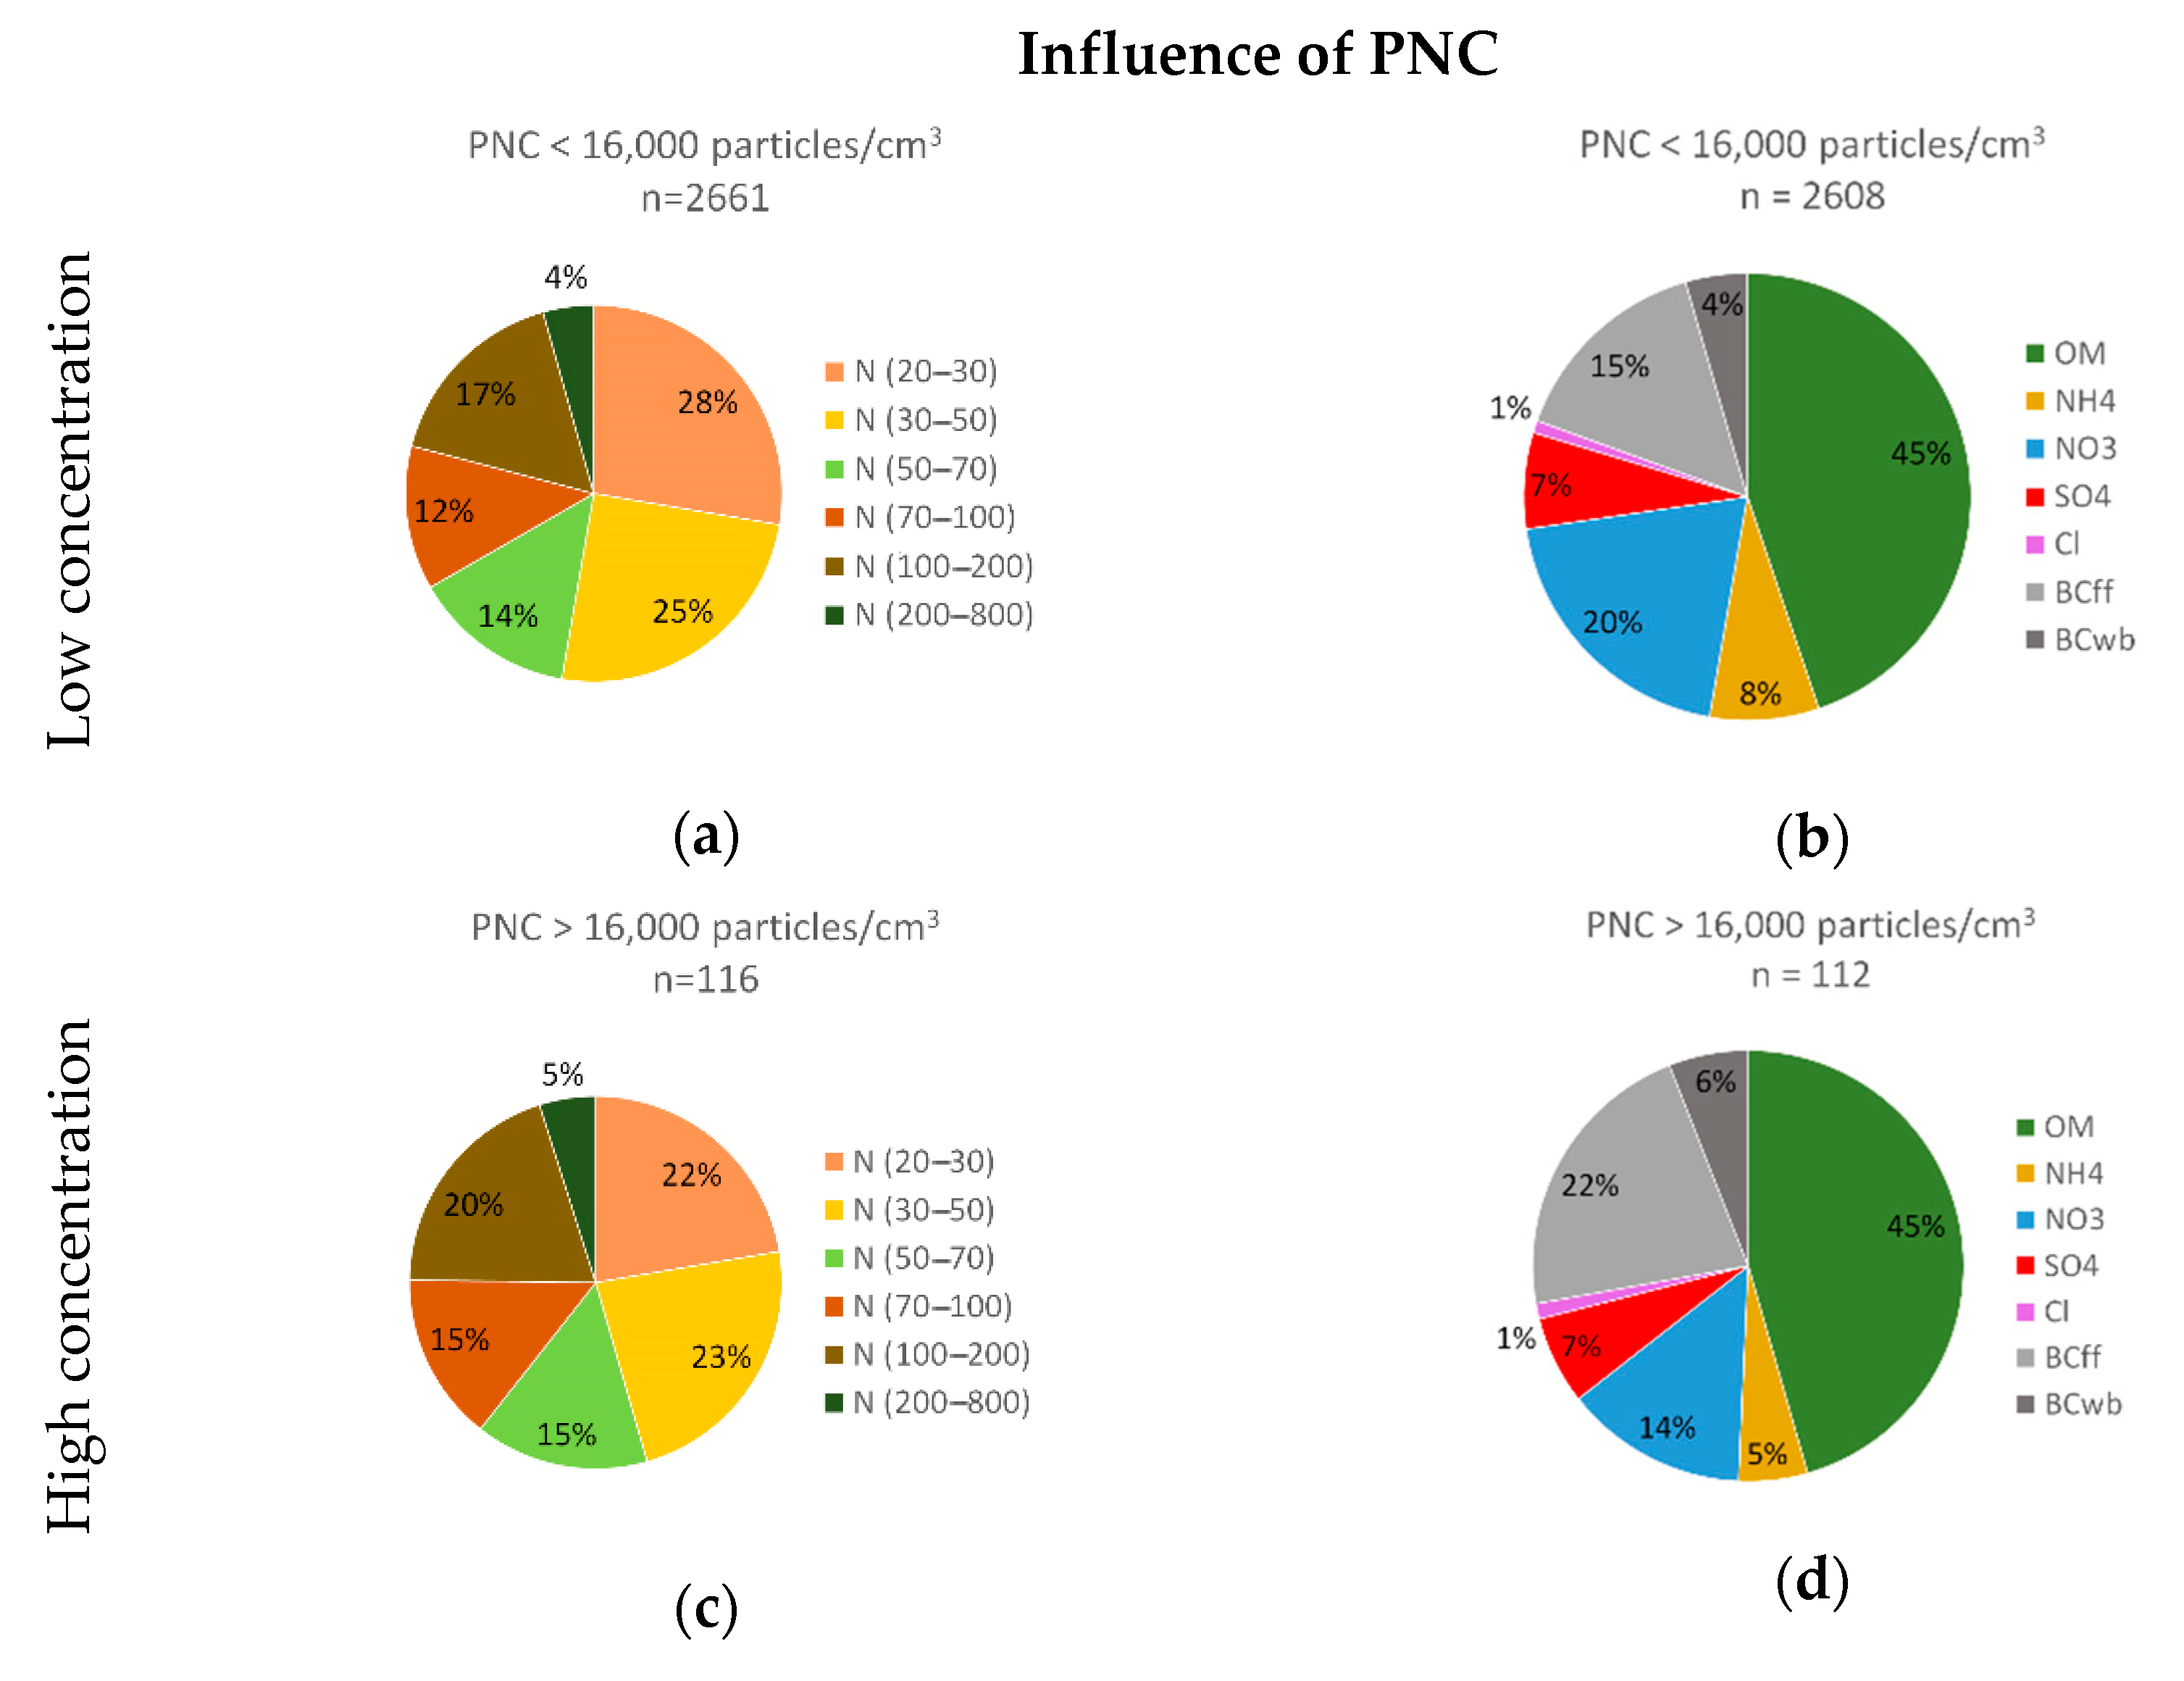
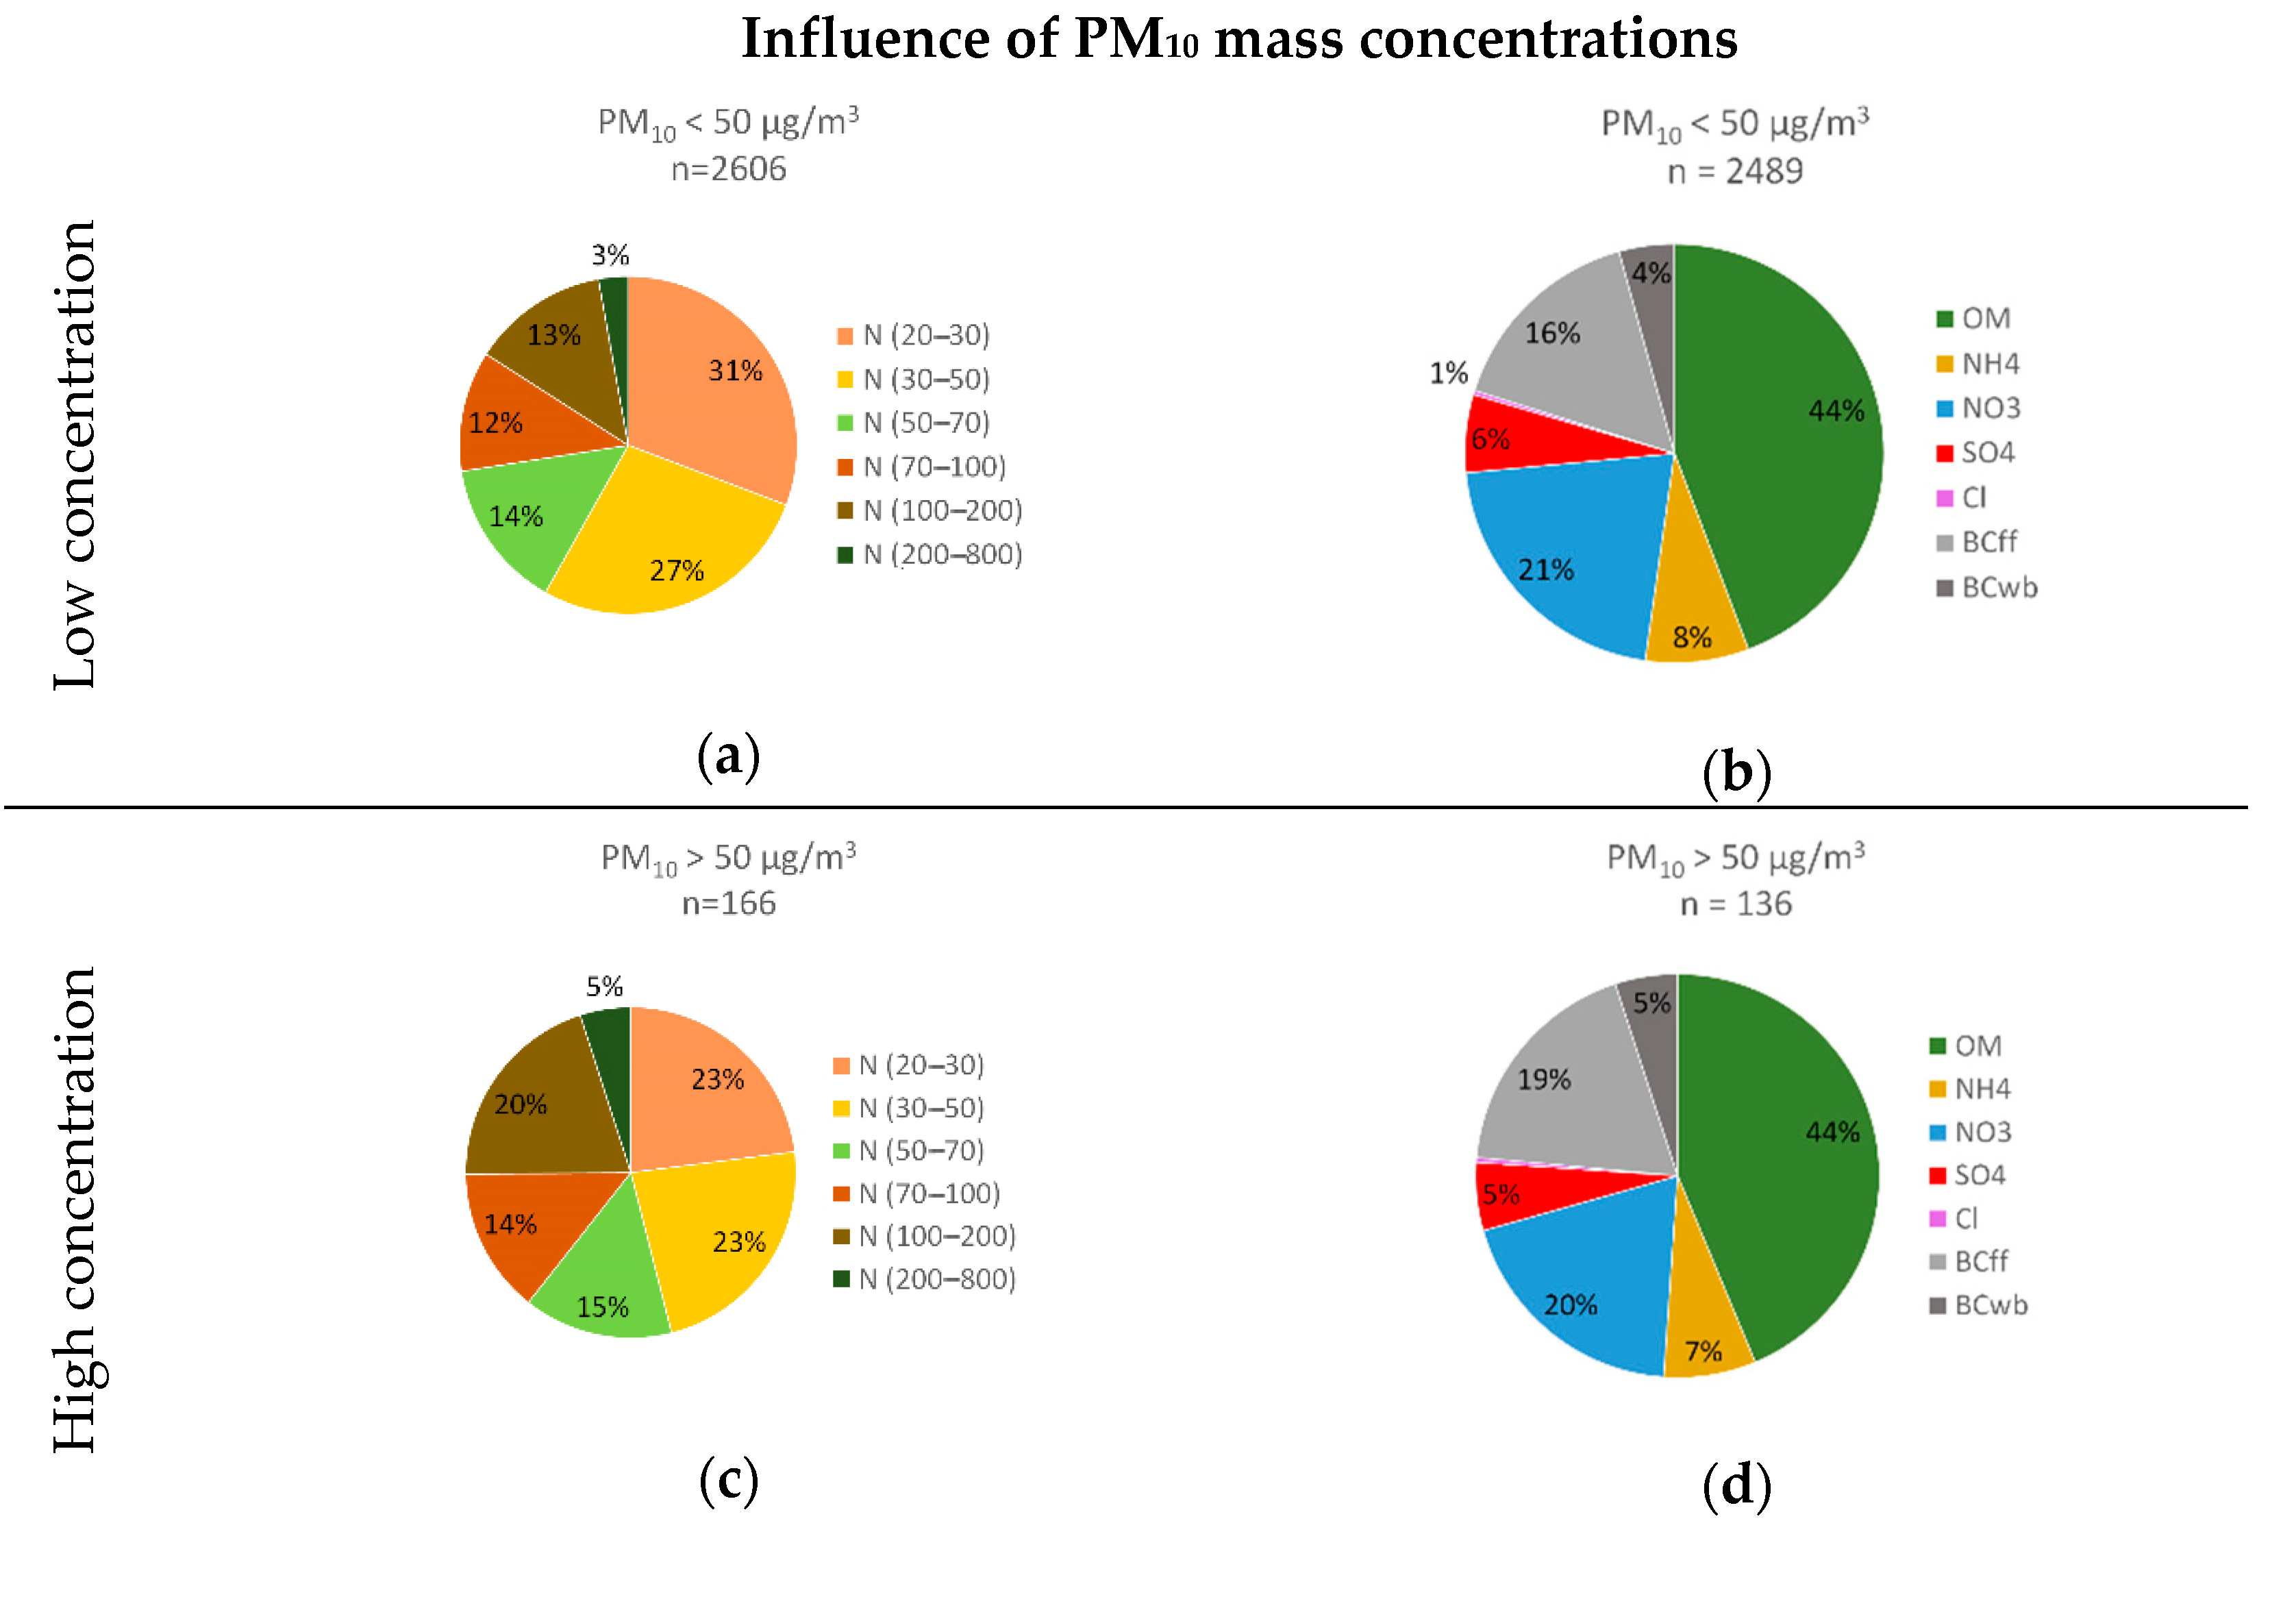
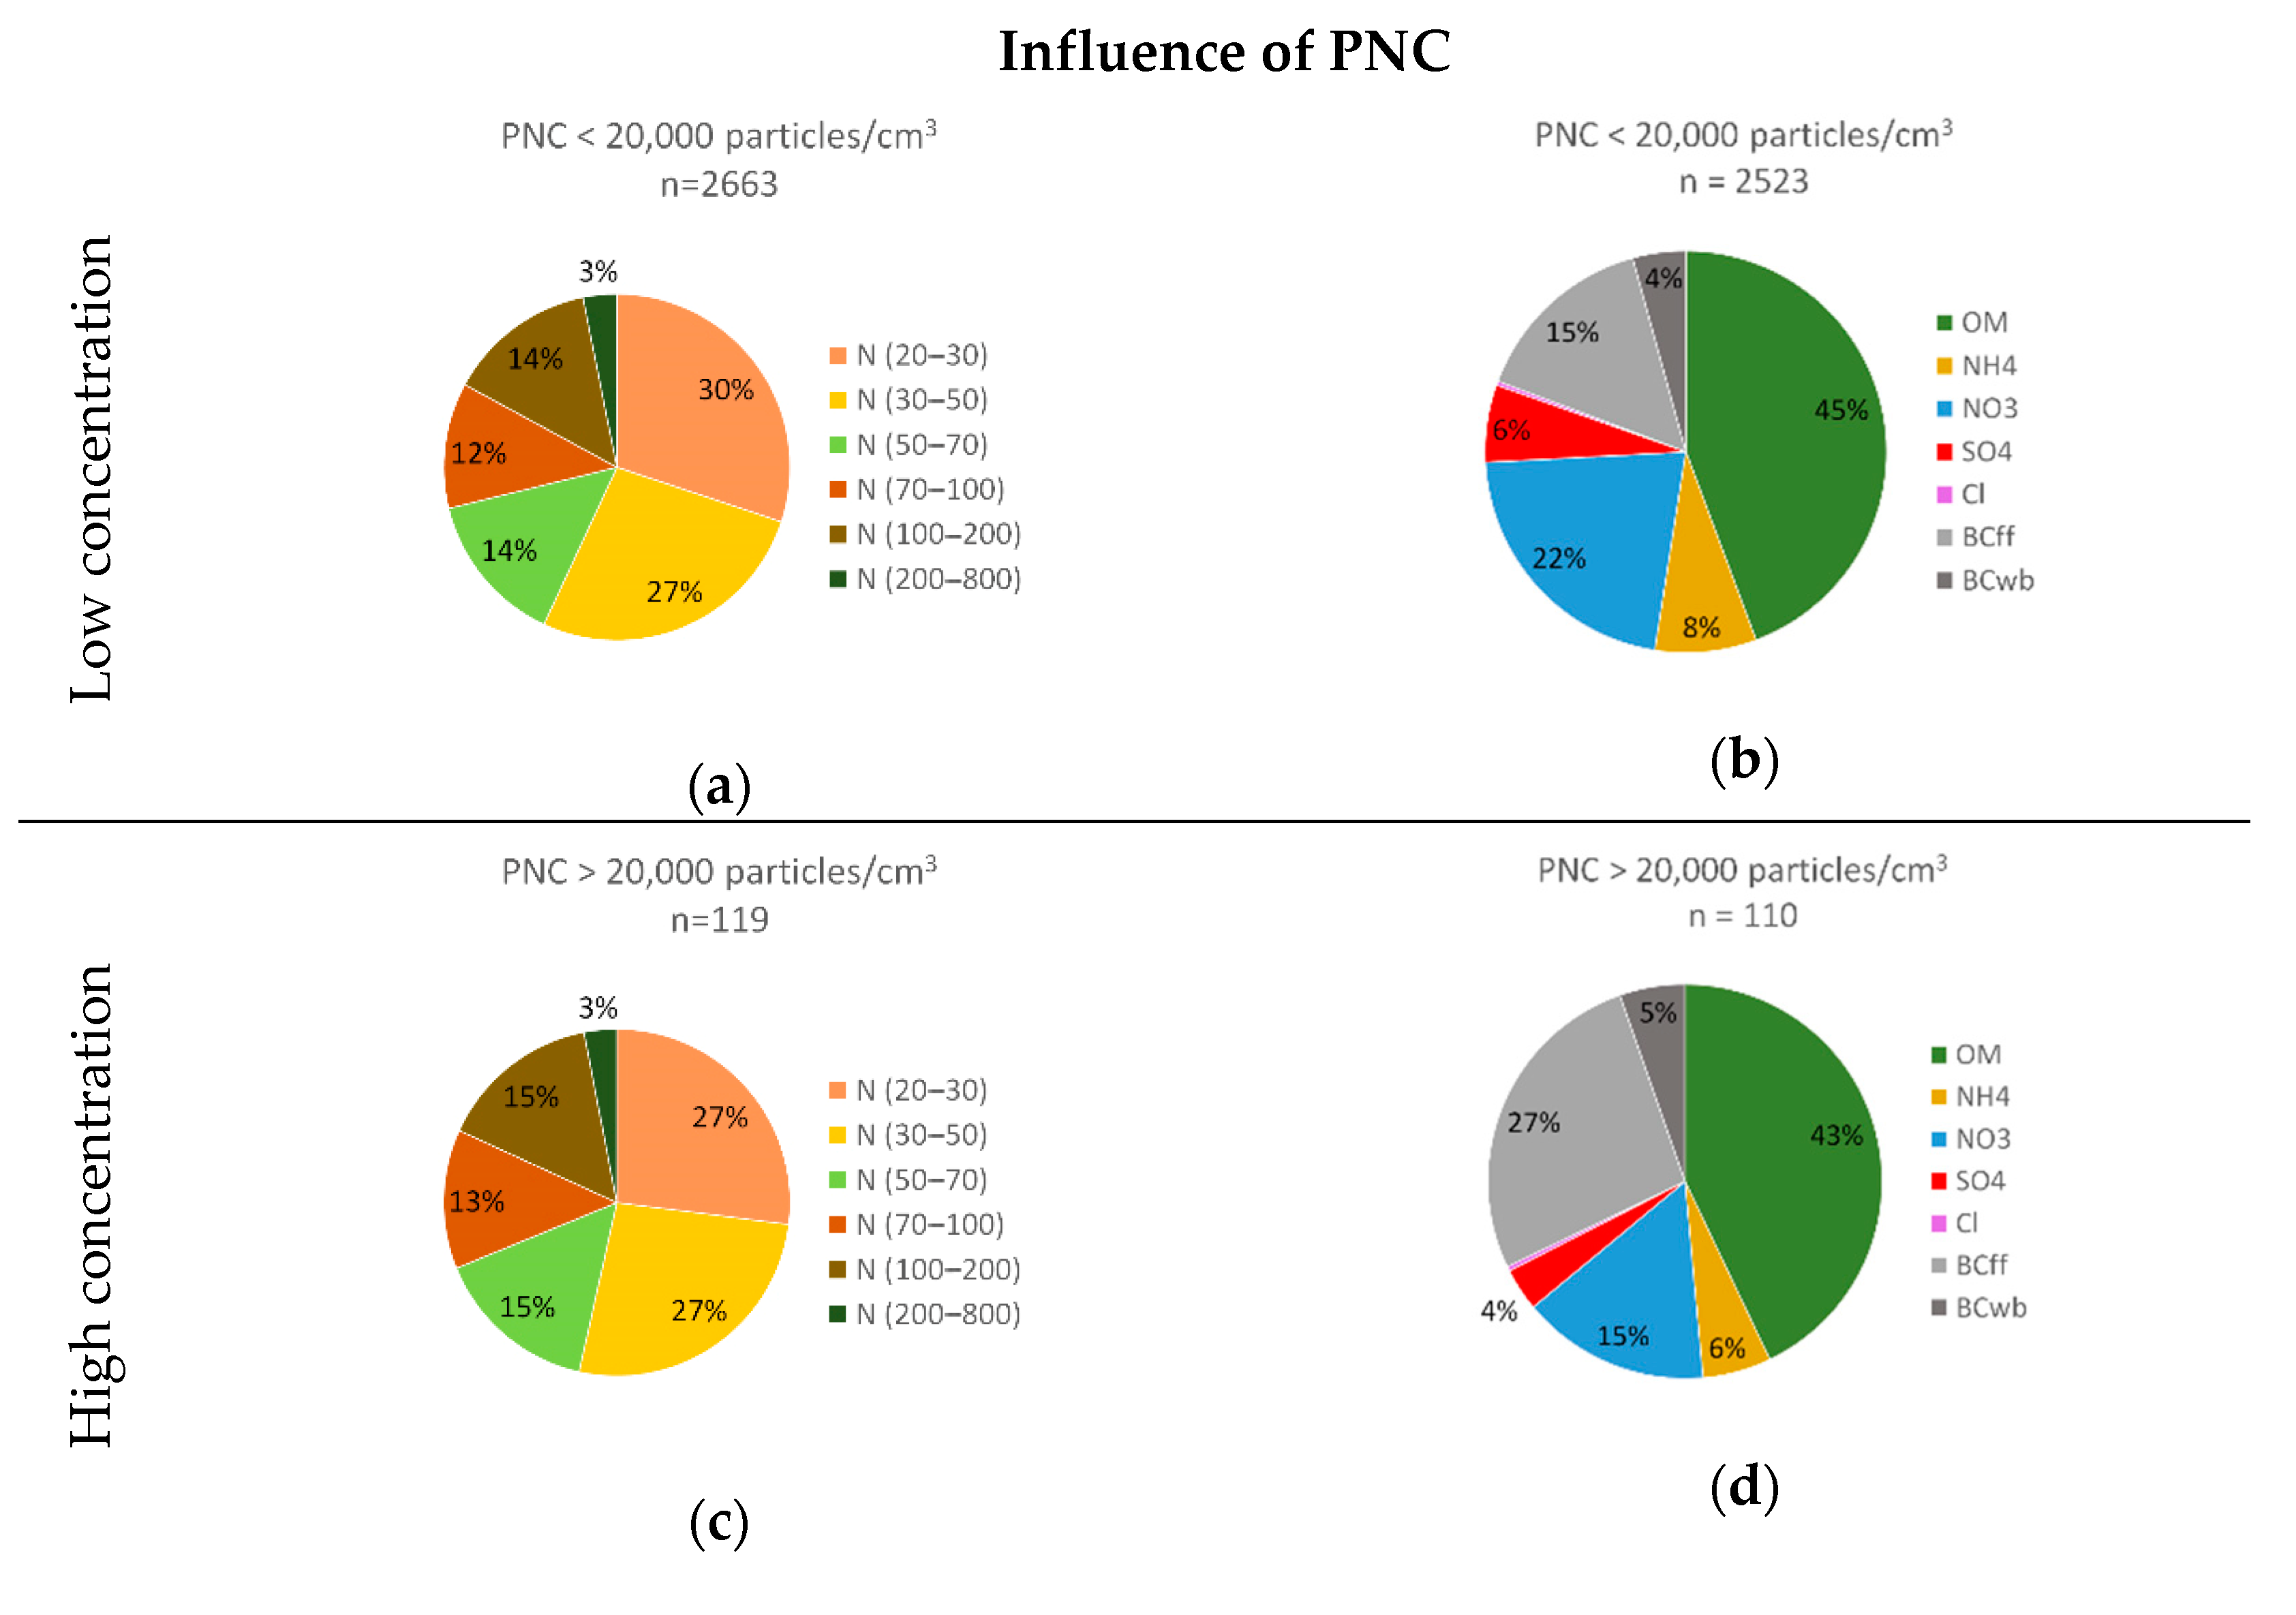
3.3. Mass Concentration and Number Concentration Influences on the Distribution and Chemical Composition of Submicron Particles
4. Discussion
4.1. PNC Variations
4.2. Insights into the Aerosol Origins
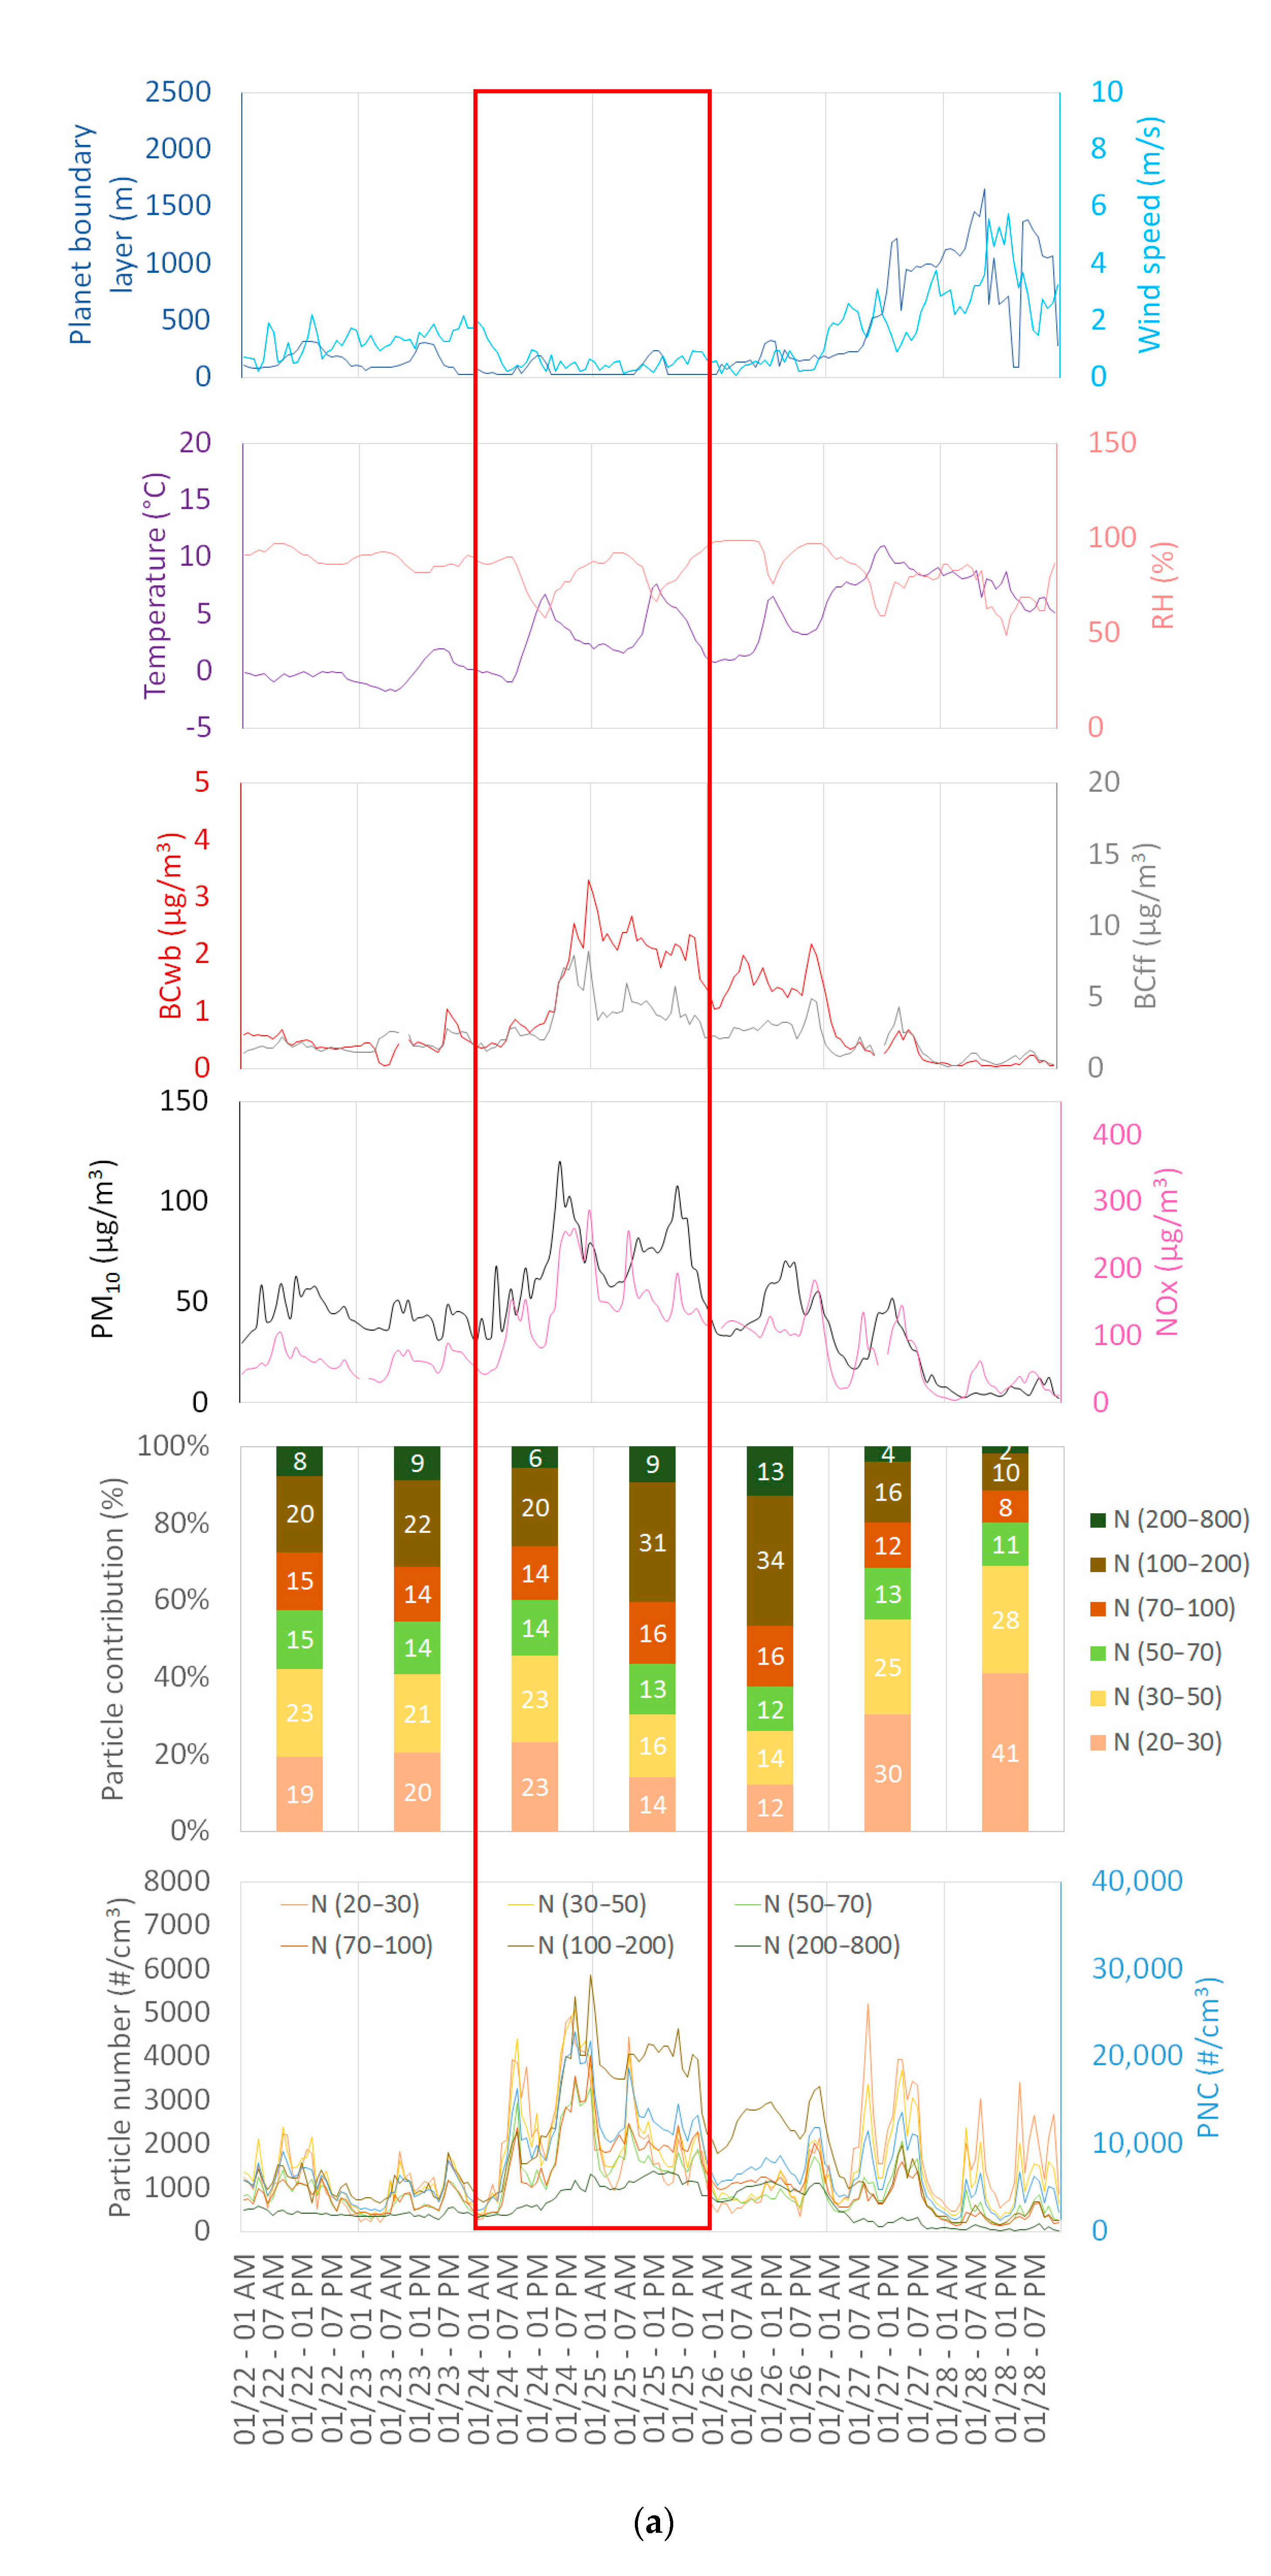
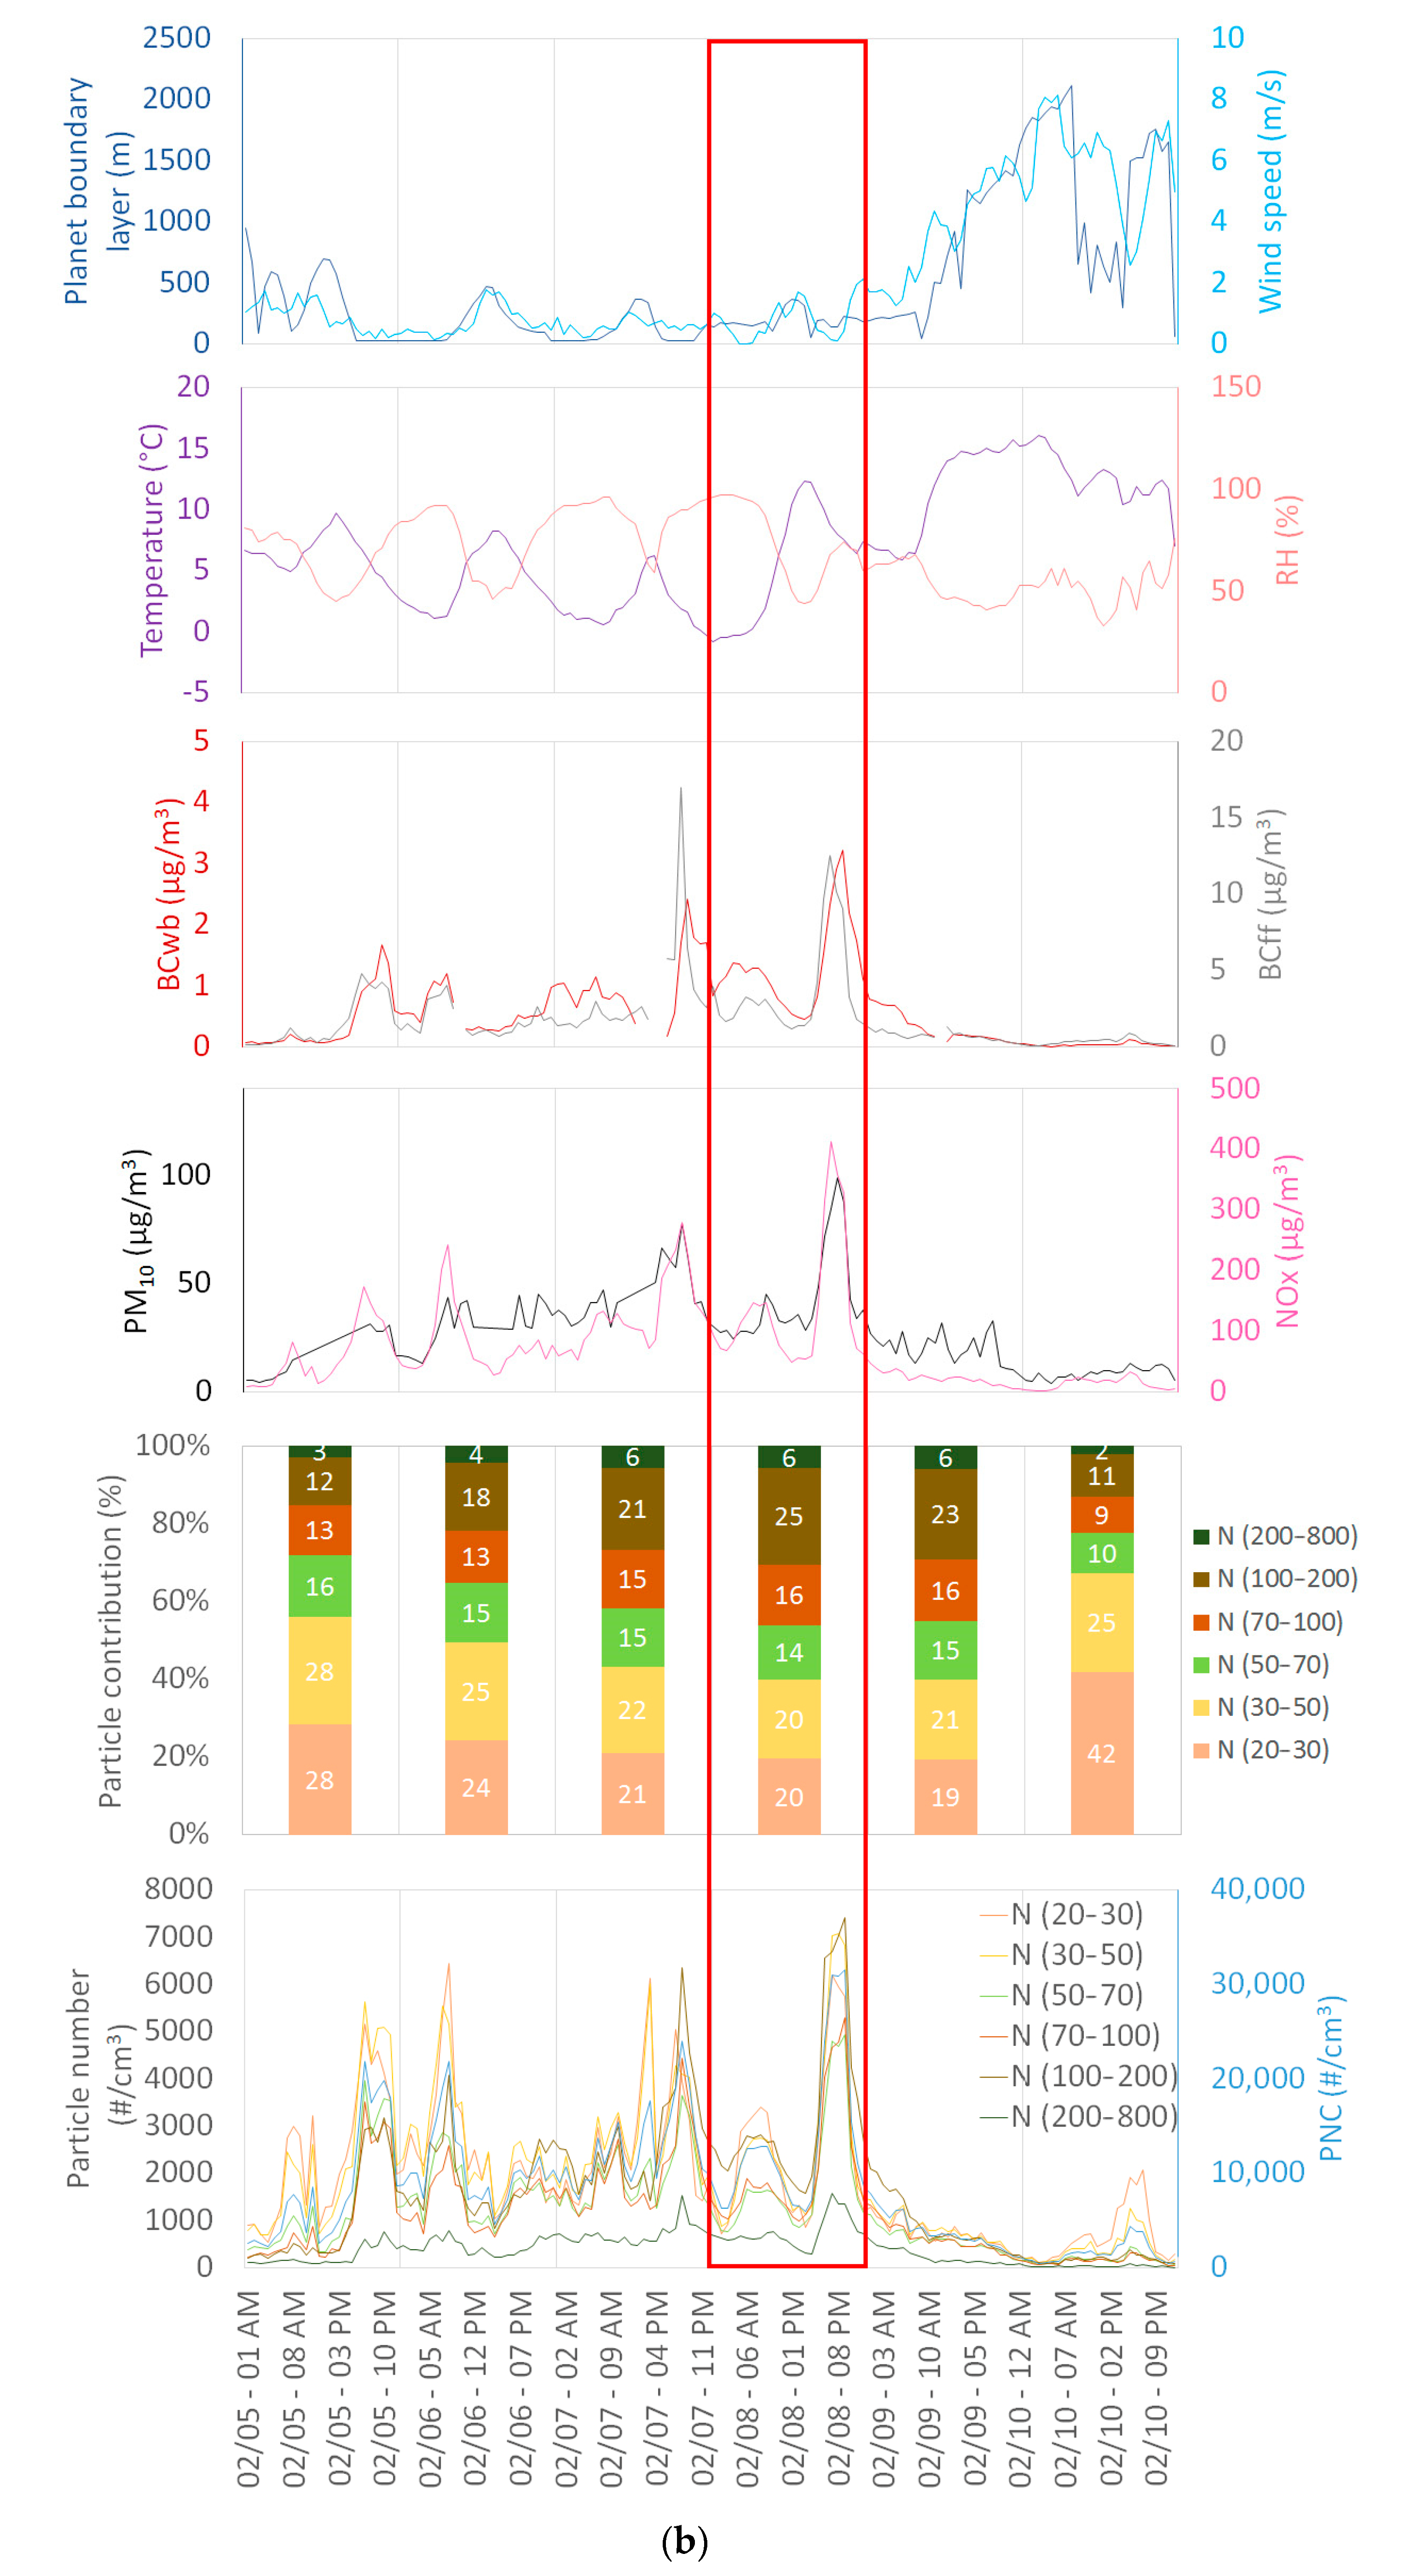
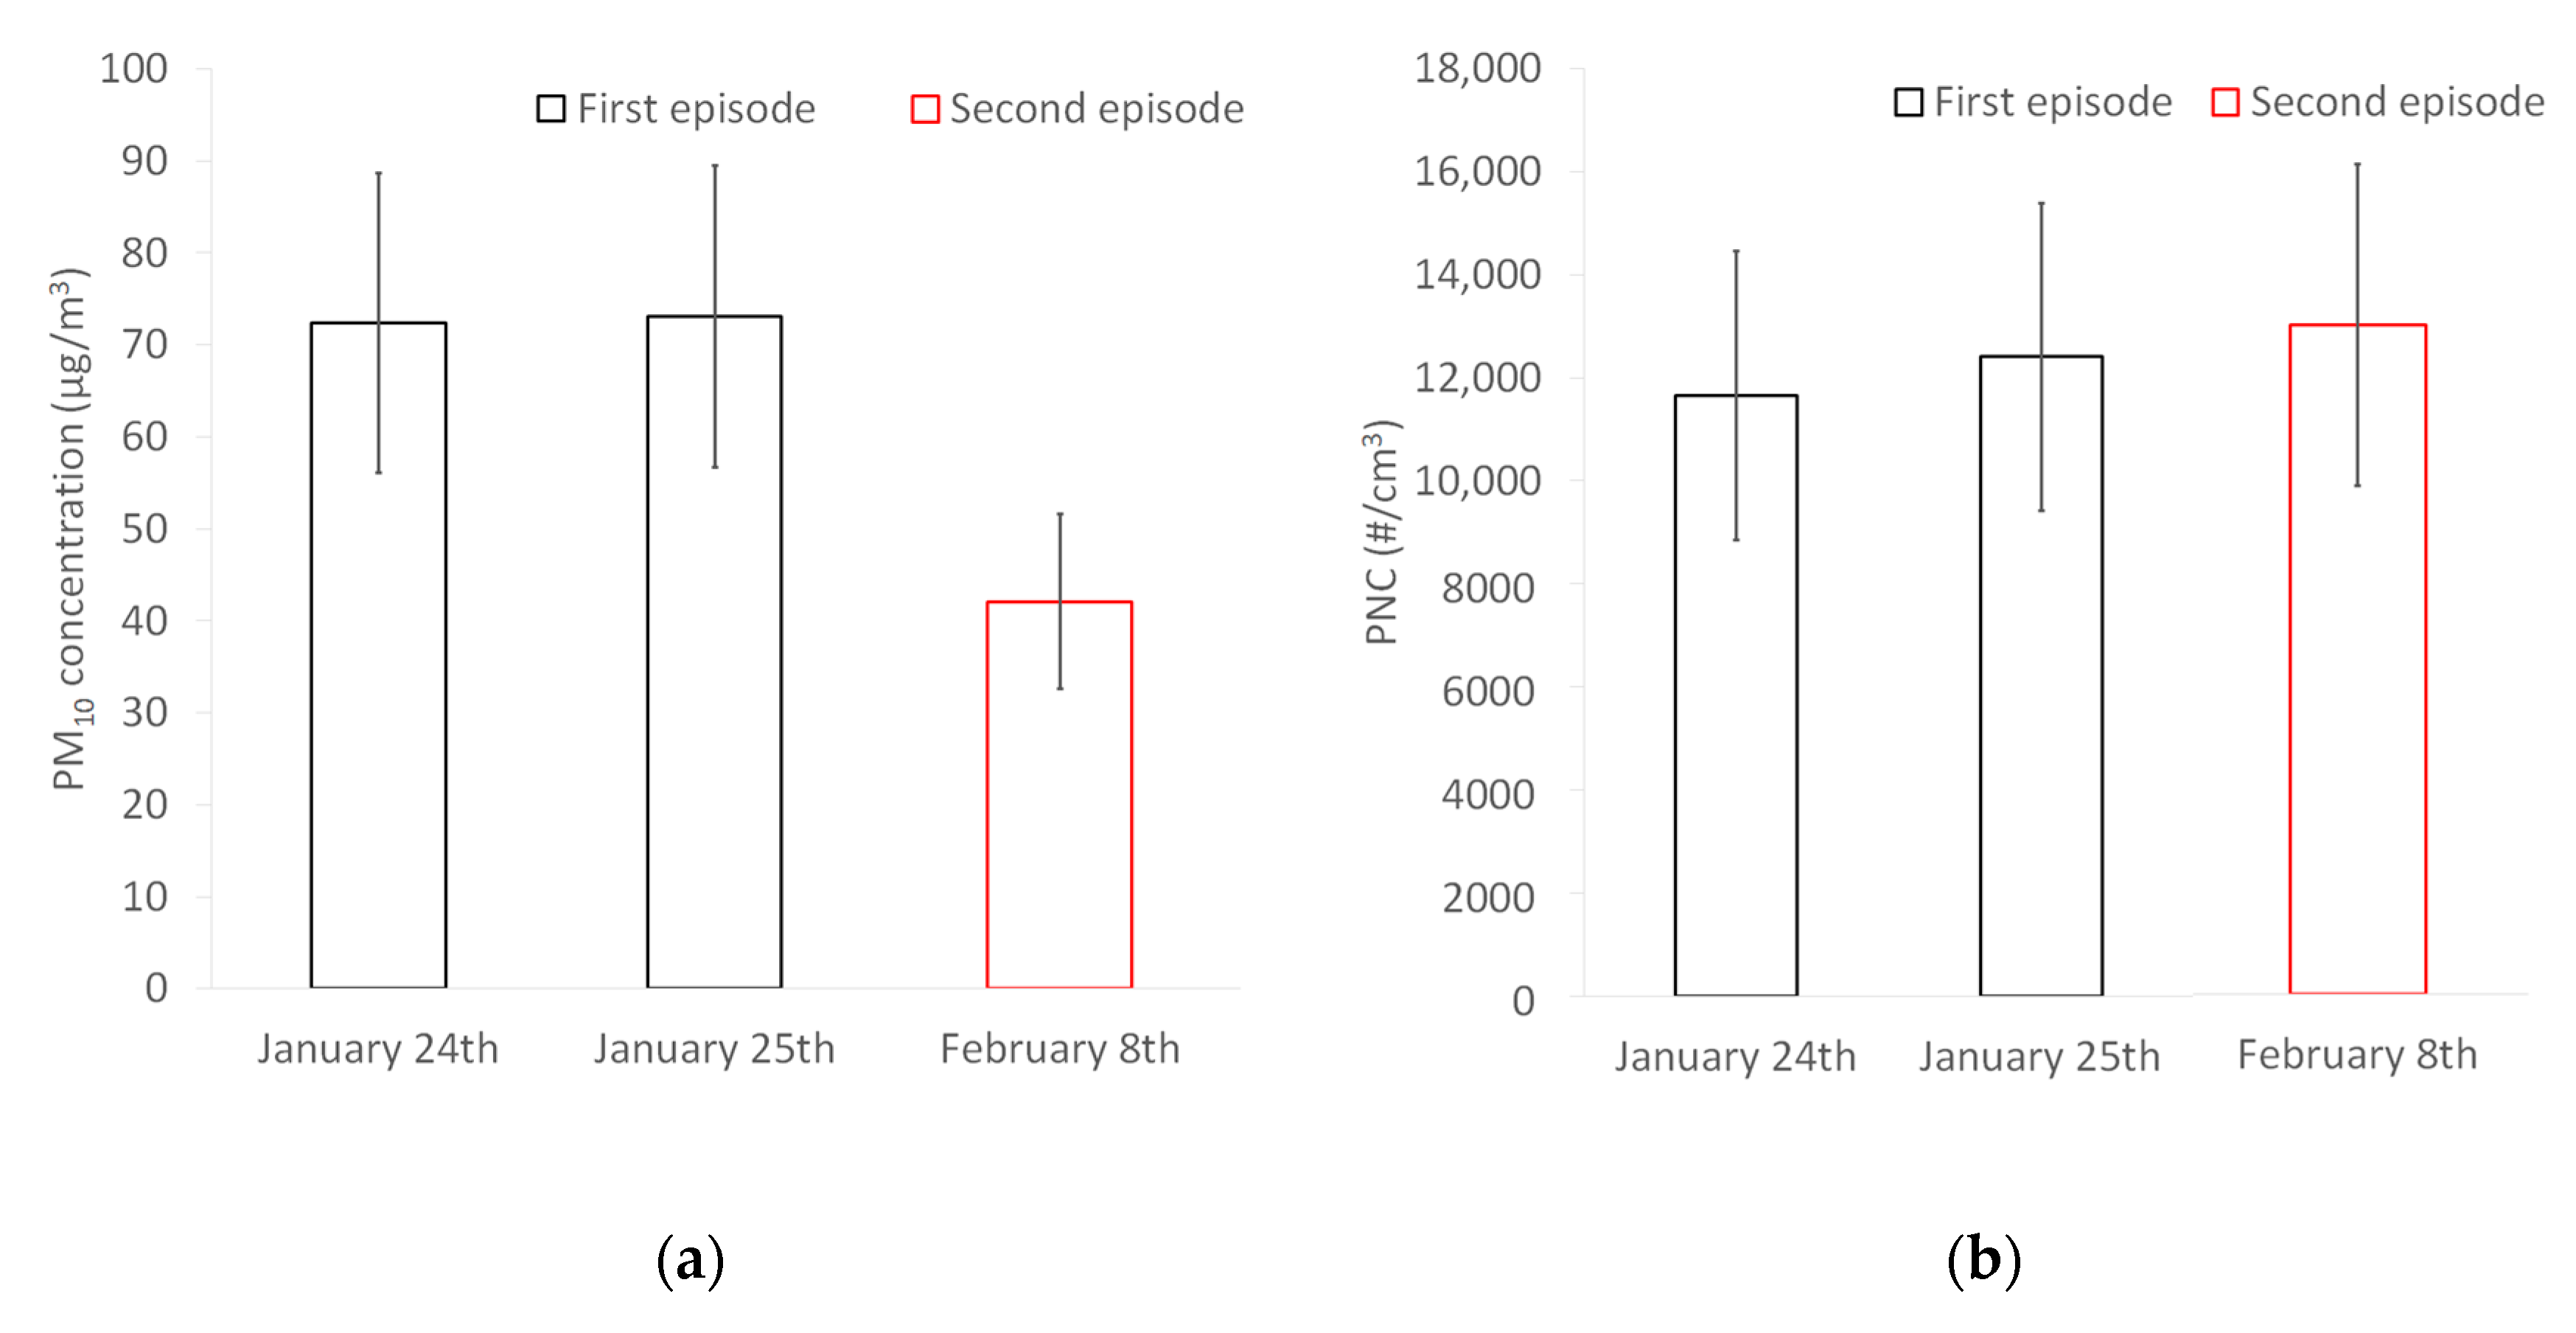
4.3. Pollution Episodes
5. Conclusions
Author Contributions
Funding
Data Availability Statement
Acknowledgments
Conflicts of Interest
Appendix A

Appendix B

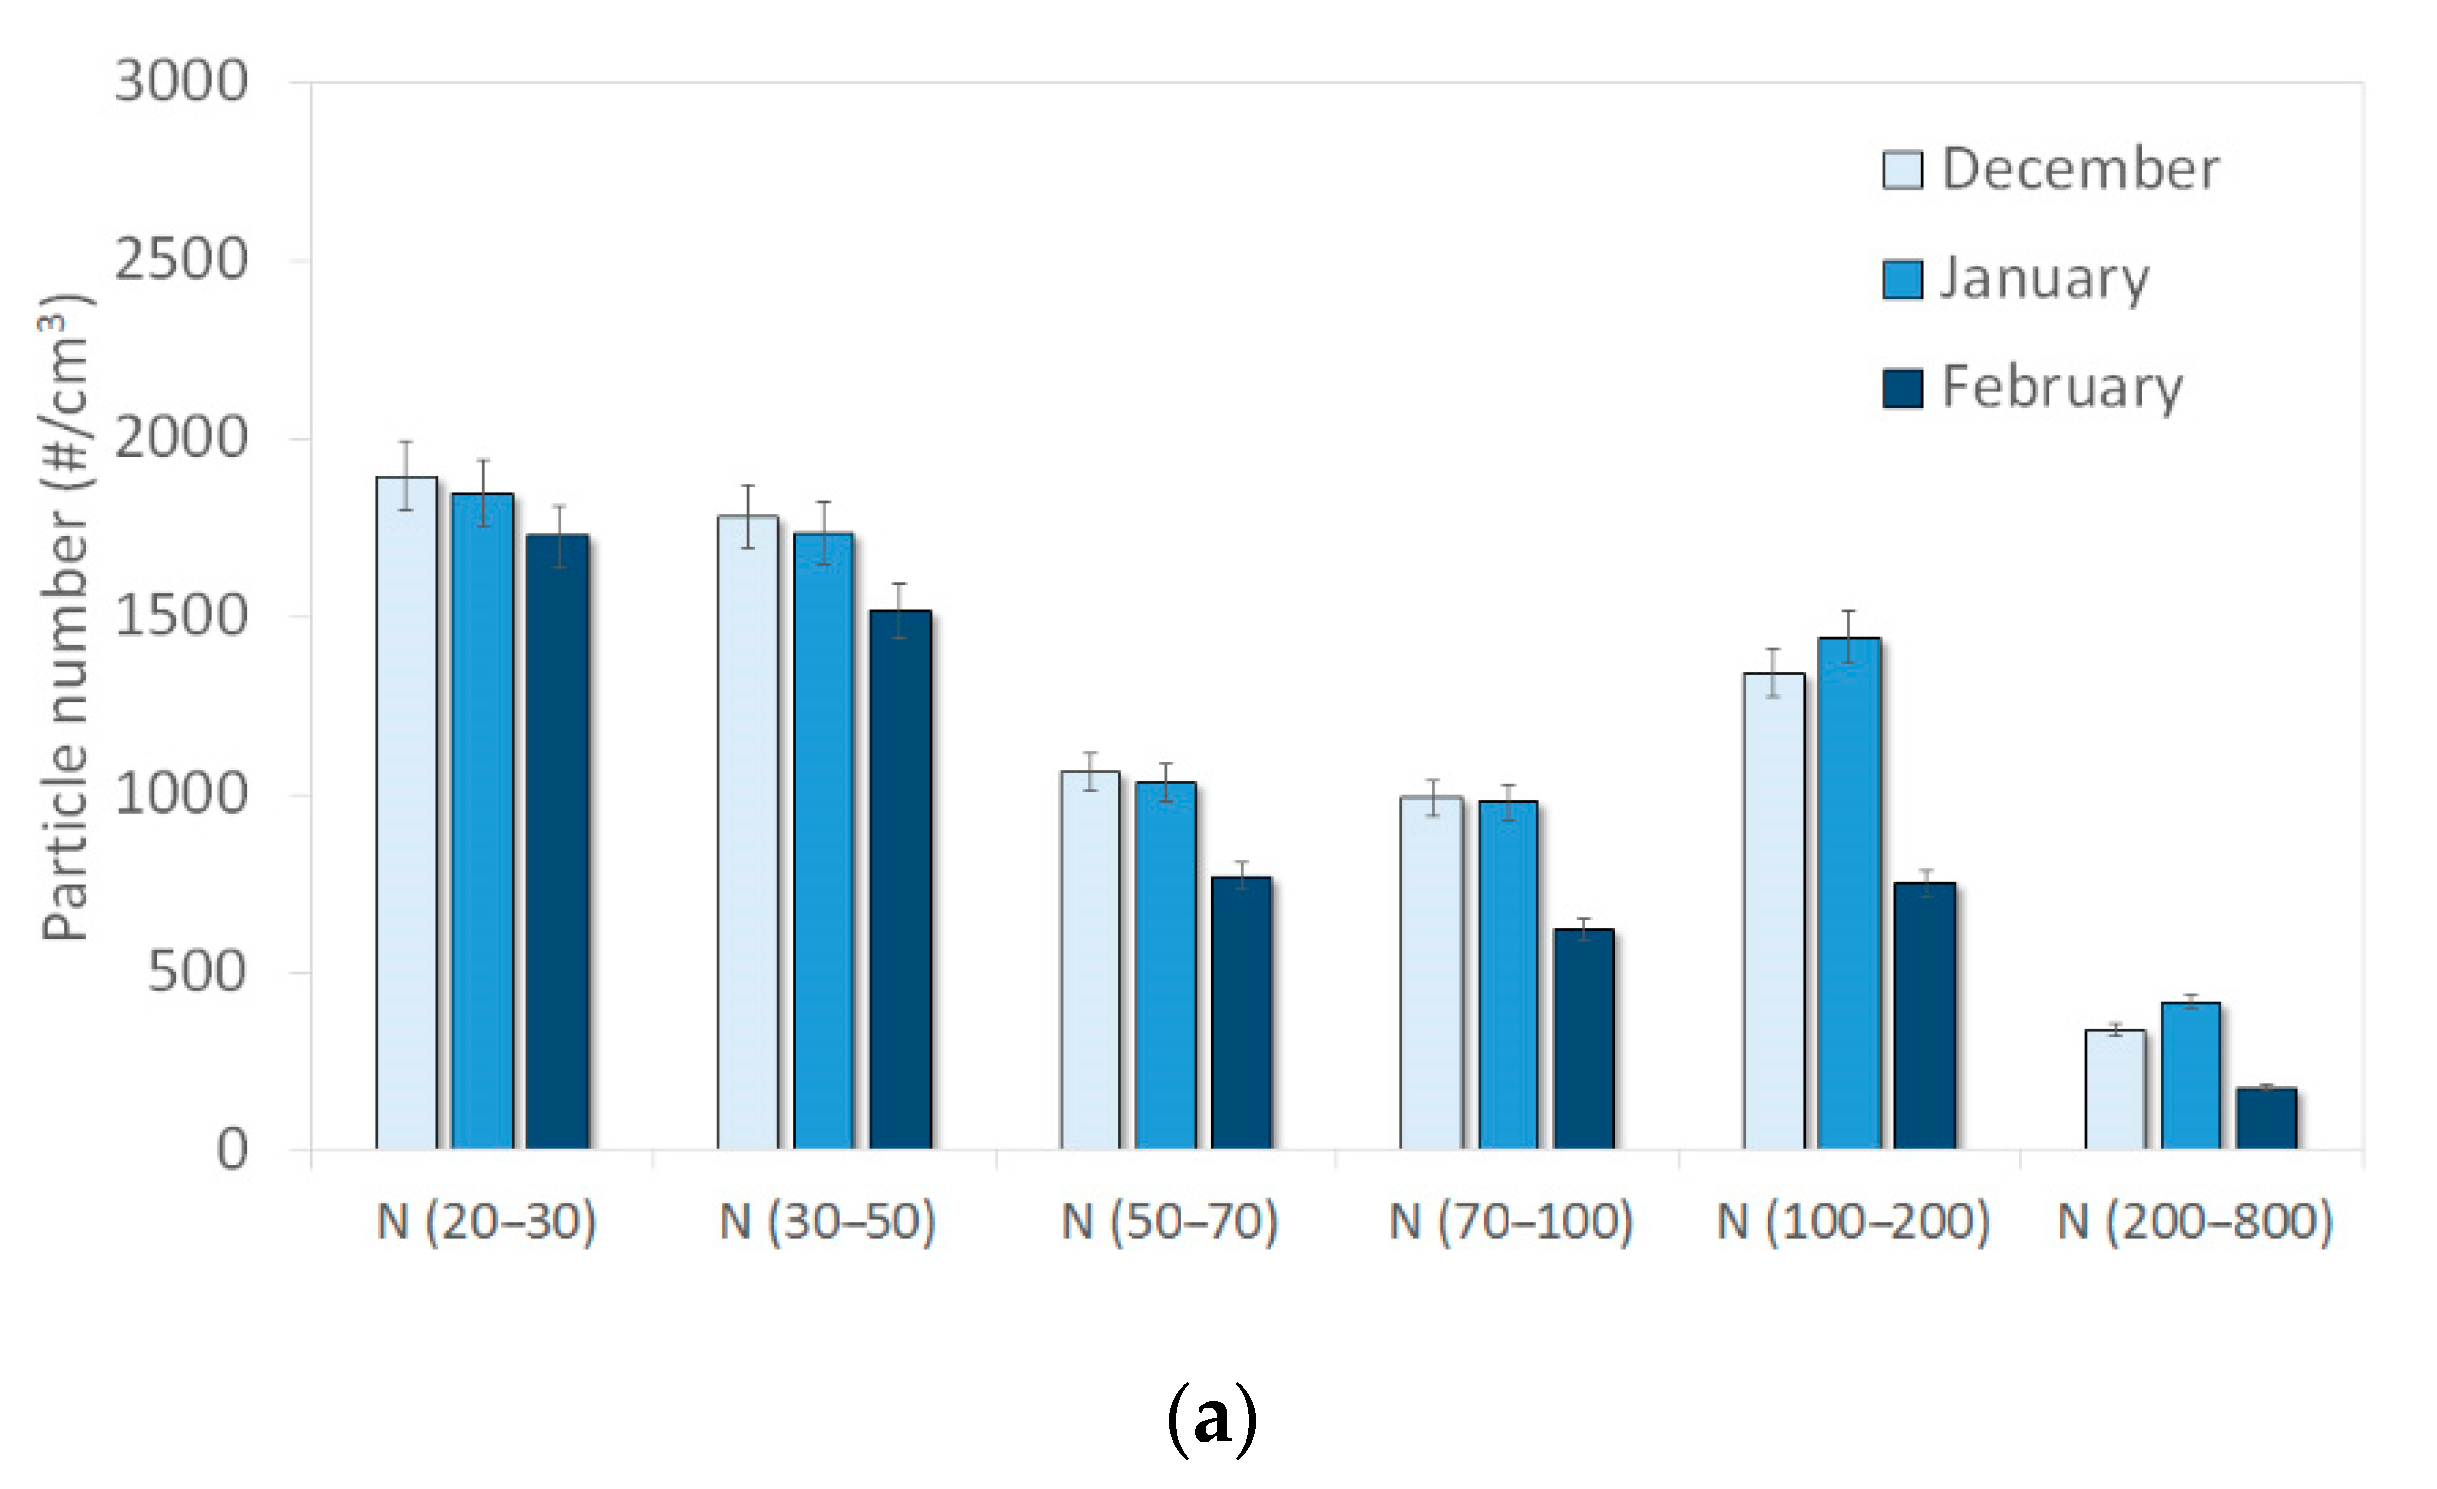
| Size Range | Mean | Median | Hourly Minimum | Hourly Maximum | Daily Minimum | Daily Maximum |
|---|---|---|---|---|---|---|
| N (20–30) | 1845 | 1553 | 113 | 9529 | 465 | 3359 |
| N (30–50) | 1700 | 1449 | 89 | 8309 | 404 | 3368 |
| N (50–70) | 967 | 812 | 24 | 7725 | 167 | 2024 |
| N (70–100) | 866 | 692 | 24 | 15,834 | 148 | 2696 |
| N (100–200) | 1165 | 850 | 10 | 40,930 | 178 | 5582 |
| N (200–800) | 302 | 210 | 4 | 17,905 | 32 | 1847 |
| PNC | 6844 | 5857 | 390 | 87,094 | 1598 | 16,233 |
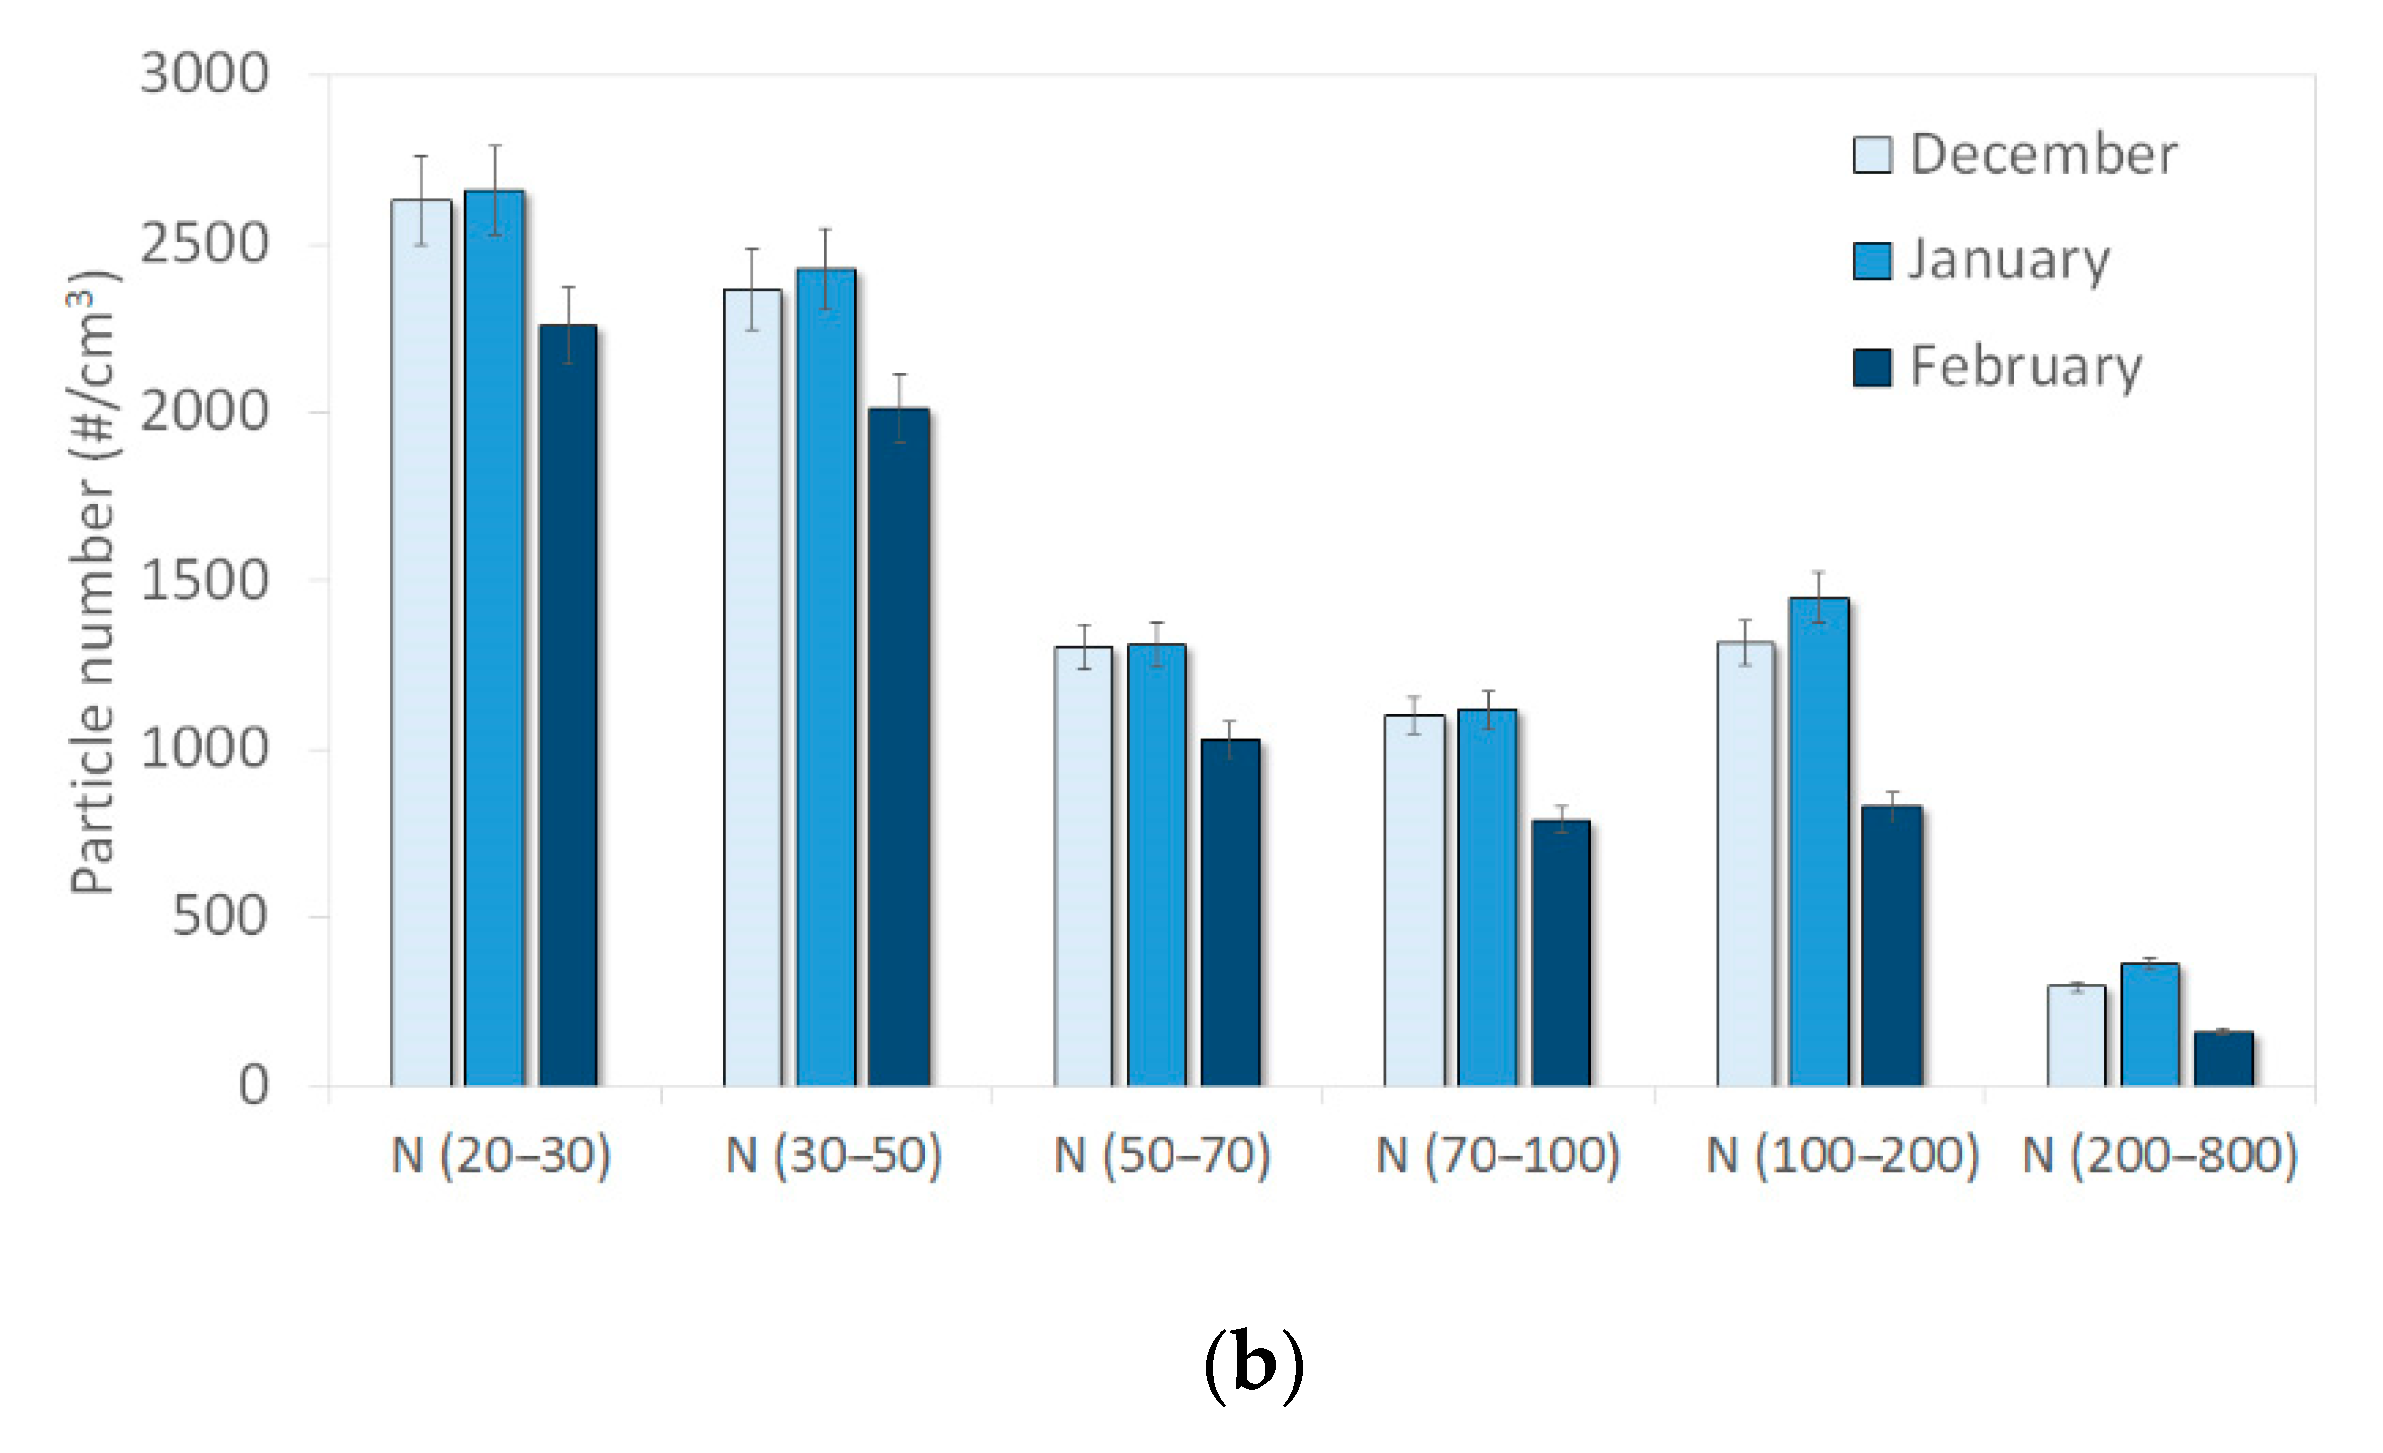
| Size Range | Mean | Median | Hourly Minimum | Hourly Maximum | Daily Minimum | Daily Maximum |
|---|---|---|---|---|---|---|
| N (20–30) | 2503 | 2038 | 79 | 15,009 | 702 | 5377 |
| N (30–50) | 2263 | 1837 | 74 | 16,391 | 614 | 5130 |
| N (50–70) | 1217 | 991 | 29 | 9677 | 281 | 3190 |
| N (70–100) | 1006 | 800 | 28 | 8229 | 224 | 3026 |
| N (100–200) | 1189 | 877 | 18 | 16,440 | 217 | 4141 |
| N (200–800) | 265 | 197 | 5 | 8622 | 34 | 1294 |
| PNC | 8444 | 7062 | 326 | 59,342 | 2173 | 21,417 |
Appendix C

Appendix D

Appendix E


Appendix F

References
- World Health Organization. IARC: Outdoor Air Pollution a Leading Environmental Cause of Cancer Deaths; WHO: Geneva, Switzerland, 2013. [Google Scholar]
- ANSES. Pollution par les Particules dans l’Air Ambiant: Synthèse des Eléments Sanitaires en Vue d’un Appui à l’Elaboration de Seuils d’Information et d’Alerte du Public pour les Particules dans l’Air Ambiant; ANSES: Paris, France, 2009.
- Monteiller, C.; Tran, L.; MacNee, W.; Faux, S.; Jones, A.; Miller, B.; Donaldson, K. The pro-inflammatory effects of low-toxicity low-solubility particles, nanoparticles and fine particles, on epithelial cells in vitro: The role of surface area. Occup. Environ. Med. 2007, 64, 609–615. [Google Scholar] [CrossRef] [Green Version]
- ANSES. Particules de l’Air Ambiant Extérieur—Effets Sanitaires des Particules de l’Air Ambiant Extérieur Selon les Composés, les Sources et la Granulométrie; ANSES: Paris, France, 2019.
- Schraufnagel, D.E. The health effects of ultrafine particles. Exp. Mol. Med. 2020, 52, 311–317. [Google Scholar] [CrossRef]
- Schraufnagel, D.E.; Balmes, J.R.; Cowl, C.T.; De Matteis, S.; Jung, S.-H.; Mortimer, K.; Perez-Padilla, R.; Rice, M.B.; Riojas-Rodriguez, H.; Sood, A.; et al. Air Pollution and Noncommunicable Diseases. Chest 2019, 155, 409–416. [Google Scholar] [CrossRef] [PubMed] [Green Version]
- Alföldy, B.; Giechaskiel, B.; Hofmann, W.; Drossinos, Y. Size-distribution dependent lung deposition of diesel exhaust particles. J. Aerosol Sci. 2009, 40, 652–663. [Google Scholar] [CrossRef]
- Donaldson, K.; Brown, D.M.; Clouter, A.; Duffin, R.; MacNee, W.; Renwick, L.; Tran, L.; Stone, V. The Pulmonary Toxicology of Ultrafine Particles. J. Aerosol Med. 2002, 15, 213–220. [Google Scholar] [CrossRef] [PubMed]
- Yacobi, N.R.; Malmstadt, N.; Fazlollahi, F.; DeMaio, L.; Marchelletta, R.; Hamm-Alvarez, S.F.; Borok, Z.; Kim, K.-J.; Crandall, E.D. Mechanisms of Alveolar Epithelial Translocation of a Defined Population of Nanoparticles. Am. J. Respir. Cell Mol. Biol. 2010, 42, 604–614. [Google Scholar] [CrossRef] [PubMed]
- Powell, J.; Harvey, R.; Ashwood, P.; Wolstencroft, R.; Gershwin, M.; Thompson, R. Immune Potentiation of Ultrafine Dietary Particles in Normal Subjects and Patients with Inflammatory Bowel Disease. J. Autoimmun. 2000, 14, 99–105. [Google Scholar] [CrossRef]
- Morales-Rubio, R.A.; Alvarado-Cruz, I.; Manzano-León, N.; Andrade-Oliva, M.-D.-L.-A.; Uribe-Ramirez, M.; Quintanilla-Vega, B.; Osornio-Vargas, A.R.; De Vizcaya-Ruiz, A. In utero exposure to ultrafine particles promotes placental stress-induced programming of renin-angiotensin system-related elements in the offspring results in altered blood pressure in adult mice. Part. Fibre Toxicol. 2019, 16, 1–16. [Google Scholar] [CrossRef]
- Limbach, L.K.; Wick, P.; Manser, P.; Grass, R.N.; Bruinink, A.; Stark, W.J. Exposure of Engineered Nanoparticles to Human Lung Epithelial Cells: Influence of Chemical Composition and Catalytic Activity on Oxidative Stress. Environ. Sci. Technol. 2007, 41, 4158–4163. [Google Scholar] [CrossRef]
- Zhang, S.; Thomasson, A.; Mesbah, B.; Guernnion, P.-Y.; Pin, F.; Aleixo, T.; Roze, F.; Dalle, M.; Le Bihan, O. La surveillance des particules ultrafines en France. In Proceedings of the Congrès Français sur les Aérosols (CFA 2018), Paris, France, 30–31 January 2018. [Google Scholar]
- Kumar, P.; Morawska, L.; Birmili, W.; Paasonen, P.; Hu, M.; Kulmala, M.; Harrison, R.M.; Norford, L.K.; Britter, R. Ultrafine particles in cities. Environ. Int. 2014, 66, 1–10. [Google Scholar] [CrossRef] [Green Version]
- Air Quality Expert Group. Ultrafine Particles (UFP) in the UK; Defra: London, UK, 2018.
- Weber, R.; Marti, J.J.; McMurry, P.H.; Eisele, F.L.; Tanner, D.J.; Jefferson, A. Measurements of new particle formation and ultrafine particle growth rates at a clean continental site. J. Geophys. Res. Space Phys. 1997, 102, 4375–4385. [Google Scholar] [CrossRef]
- Morawska, L.; Ristovski, Z.; Jayaratne, R.; Keogh, D.U.; Ling, X. Ambient nano and ultrafine particles from motor vehicle emissions: Characteristics, ambient processing and implications on human exposure. Atmos. Environ. 2008, 42, 8113–8138. [Google Scholar] [CrossRef] [Green Version]
- Atmo Nouvelle-Aquitaine. Mesures Exploratoires de Particules Ultrafines en Aquitaine; Atmo Nouvelle-Aquitaine: Merignac, France, 2015. [Google Scholar]
- AtmoSud. Plan de Surveillance des Particules dans la Région PACA, PUF Bilan des Mesures 2016; Atmosud: Marseille, France, 2017. [Google Scholar]
- Atmo AURA. Observatoire des Particules Ultrafines Atmosphériques en Rhône-Alpes; Atmo AURA: Bron, France, 2016. [Google Scholar]
- Atmo Nouvelle-Aquitaine. Particules Ultrafines—Bilan Annuel 2017; Atmo Nouvelle-Aquitaine: Merignac, France, 2018. [Google Scholar]
- Atmo Hauts-de-France. Surveillance des Particules Ultrafines dans la Région Hauts-de-France; Atmo Hauts-de France: Lille, France, 2019. [Google Scholar]
- Cassee, F.R.; Morawska, L.; Peters, A. White Paper—Ambient Ultrafine Particles: Evidence for Policy Makers; European Federation of Clean Air and Environmental Protection Associations (EFCA): Pfintal, Germany, 2019. [Google Scholar]
- ATMO Grand Est. Invent’Air 2020—Données de l’année 2018. Observatoire climat-air-énergie Grand Est. Available online: https://observatoire.atmo-grandest.eu/ (accessed on 14 December 2020).
- UFIPOLNET. Technical Final Report. 2008. Available online: https://ec.europa.eu/environment/life/project/Projects/index.cfm?fuseaction=search.dspPage&n_proj_id=2709 (accessed on 2 November 2020).
- JOAQUIN. UFP Instrument Comparison at an Urban Background Location in Antwerp; VITO: Mol, Belgium, 2013. [Google Scholar]
- LCSQA. Recommandations Techniques pour l’Utilisation du Granulomètre UFP 3031; Laboratoire Central de Surveillance de la Qualité de l’Air: Paris, France, 2016. [Google Scholar]
- Ng, N.L.; Herndon, S.C.; Trimborn, A.; Canagaratna, M.R.; Croteau, P.L.; Onasch, T.B.; Sueper, D.; Worsnop, D.R.; Zhang, Q.; Sun, Y.L.; et al. An Aerosol Chemical Speciation Monitor (ACSM) for Routine Monitoring of the Composition and Mass Concentrations of Ambient Aerosol. Aerosol Sci. Technol. 2011, 45, 780–794. [Google Scholar] [CrossRef]
- Freney, E.; Zhang, Y.; Croteau, P.; Amodeo, T.; Williams, L.R.; Truong, F.; Petit, J.-E.; Sciare, J.; Sarda-Esteve, R.; Bonnaire, N.; et al. The second ACTRIS inter-comparison (2016) for Aerosol Chemical Speciation Monitors (ACSM): Calibration protocols and instrument performance evaluations. Aerosol Sci. Technol. 2019, 53, 830–842. [Google Scholar] [CrossRef]
- Xu, W.; Lambe, A.T.; Silva, P.; Hu, W.; Onasch, T.B.; Williams, L.; Croteau, P.; Zhang, X.; Renbaum-Wolff, L.; Fortner, E.; et al. Laboratory evaluation of species-dependent relative ionization efficiencies in the Aerodyne Aerosol Mass Spectrometer. Aerosol Sci. Technol. 2018, 52, 626–641. [Google Scholar] [CrossRef]
- Middlebrook, A.M.; Bahreini, R.; Jimenez, J.L.; Canagaratna, M.R. Evaluation of Composition-Dependent Collection Efficiencies for the Aerodyne Aerosol Mass Spectrometer using Field Data. Aerosol Sci. Technol. 2012, 46, 258–271. [Google Scholar] [CrossRef]
- Drinovec, L.; Močnik, G.; Zotter, P.; Prévôt, A.S.H.; Ruckstuhl, C.; Coz, E.; Rupakheti, M.; Sciare, J.; Müller, T.; Wiedensohler, A.; et al. The “dual-spot” Aethalometer: An improved measurement of aerosol black carbon with real-time loading compensation. Atmos. Meas. Tech. 2015, 8, 1965–1979. [Google Scholar] [CrossRef] [Green Version]
- Sandradewi, J.; Prévôt, A.S.H.; Szidat, S.; Perron, N.; Alfarra, M.R.; Lanz, V.A.; Weingartner, E.; Baltensperger, U.R.S. Using Aerosol Light Absorption Measurements for the Quantitative Determination of Wood Burning and Traffic Emission Contributions to Particulate Matter. Environ. Sci. Technol. 2008, 42, 3316–3323. [Google Scholar] [CrossRef]
- AtmoSud. Plan de Surveillance des Particules dans la Région PACA, PUF Bilan des Mesures 2017; AtmoSud: Marseille, France, 2018. [Google Scholar]
- Birmili, W.; Sun, J.; Weinhold, K.; Merkel, M.; Rasch, F.; Spindler, G. Atmospheric aerosol measurements in the German Ultrafine Aerosol Network (GUAN)—Part 3: Black Carbon mass and particle number concentrations 2009 to 2014. Gefahrstoffe Reinhalt. 2015, 75, 479–488. [Google Scholar]
- Sun, J.; Birmili, W.; Hermann, M.; Tuch, T.; Weinhold, K.; Spindler, G.; Schladitz, A.; Bastian, S.; Löschau, G.; Cyrys, J.; et al. Variability of black carbon mass concentrations, sub-micrometer particle number concentrations and size distributions: Results of the German Ultrafine Aerosol Network ranging from city street to High Alpine locations. Atmos. Environ. 2019, 202, 256–268. [Google Scholar] [CrossRef]
- JOAQUIN. Monitoring of Ultrafine Particles and Black Carbon; Flanders Environment Agency: Aalst, Belgium, 2015. [Google Scholar]
- Rönkkö, T.; Virtanen, A.; Vaaraslahti, K.; Keskinen, J.; Pirjola, L.; Lappi, M. Effect of dilution conditions and driving parameters on nucleation mode particles in diesel exhaust: Laboratory and on-road study. Atmos. Environ. 2006, 40, 2893–2901. [Google Scholar] [CrossRef]
- JOAQUIN. Short-Term Intra-Urban Variability of UFP Number Concentration and Size Distribution; VITO: Mol, Belgium, 2013. [Google Scholar]
- Regniers, O. Les Particules Diesel Ultrafines: Techniques de Mesure à l’Emission et à l’Immission; Universite Libre de Bruxelles: Buxelles, Belgium, 2006. [Google Scholar]
- Harrison, R.M.; Shi, J.P.; Jianxin, Y.; Khan, A.; Mark, D.; Kinnersley, R.; Yin, J. Measurement of number, mass and size distribution of particles in the atmosphere. Philos. Trans. R. Soc. A Math. Phys. Eng. Sci. 2000, 358, 2567–2580. [Google Scholar] [CrossRef]
- LCSQA. Surveillance des Particules Submicroniques; Laboratoire Central de Surveillance de la Qualité de l’Air: Paris, France, 2004. [Google Scholar]
- Putaud, J.-P.; Van Dingenen, R.; Dell’Acqua, A.; Raes, F.; Matta, E.; Decesari, S.; Facchini, M.C.; Fuzzi, S. Size-segregated aerosol mass closure and chemical composition in Monte Cimone (I) during MINATROC. Atmos. Chem. Phys. Discuss. 2004, 4, 889–902. [Google Scholar] [CrossRef] [Green Version]
- Southern Ontario Centre for Atmospheric Aerosol Research. Near-Road Air Pollution Pilot Study; University of Toronto: Toronto, ON, Canada, 2019. [Google Scholar]
- LCSQA. Inter-Comparaison 2014 sur les Granulomètres UFP 3031; Laboratoire Central de Surveillance de la Qualité de l’Air: Paris, France, 2014. [Google Scholar]
- LCSQA. Inter-Comparaison 2015 sur les Granulomètres UFP 3031; Laboratoire Central de Surveillance de la Qualité de l’Air: Paris, France, 2015. [Google Scholar]
- LCSQA. Inter-Comparaison 2016 sur les Granulomètres UFP 3031; Laboratoire Central de Surveillance de la Qualité de l’Air: Paris, France, 2016. [Google Scholar]


Publisher’s Note: MDPI stays neutral with regard to jurisdictional claims in published maps and institutional affiliations. |
© 2021 by the authors. Licensee MDPI, Basel, Switzerland. This article is an open access article distributed under the terms and conditions of the Creative Commons Attribution (CC BY) license (http://creativecommons.org/licenses/by/4.0/).
Share and Cite
Chatain, M.; Alvarez, R.; Ustache, A.; Rivière, E.; Favez, O.; Pallares, C. Simultaneous Roadside and Urban Background Measurements of Submicron Aerosol Number Concentration and Size Distribution (in the Range 20–800 nm), along with Chemical Composition in Strasbourg, France. Atmosphere 2021, 12, 71. https://0-doi-org.brum.beds.ac.uk/10.3390/atmos12010071
Chatain M, Alvarez R, Ustache A, Rivière E, Favez O, Pallares C. Simultaneous Roadside and Urban Background Measurements of Submicron Aerosol Number Concentration and Size Distribution (in the Range 20–800 nm), along with Chemical Composition in Strasbourg, France. Atmosphere. 2021; 12(1):71. https://0-doi-org.brum.beds.ac.uk/10.3390/atmos12010071
Chicago/Turabian StyleChatain, Mélodie, Raphaël Alvarez, Aurélien Ustache, Emmanuel Rivière, Olivier Favez, and Cyril Pallares. 2021. "Simultaneous Roadside and Urban Background Measurements of Submicron Aerosol Number Concentration and Size Distribution (in the Range 20–800 nm), along with Chemical Composition in Strasbourg, France" Atmosphere 12, no. 1: 71. https://0-doi-org.brum.beds.ac.uk/10.3390/atmos12010071