Article

Investigations of Museum Indoor Microclimate and Air Quality. Case Study from Romania

1
Department of Geography, Tourism and Territorial Planning, Faculty of Geography, Tourism and Sport, University of Oradea, 1 Universitatii Street, 410087 Oradea, Romania
2
Faculty of Medicine and Pharmacy, University of Oradea, 10 Piața 1 Decembrie Street, 410073 Oradea, Romania
3
Department of Textiles, Leather and Industrial Management, Faculty of Energy Engineering and Industrial Management, University of Oradea, 4 Barbu Stefanescu Delavrancea Street, 410058 Oradea, Romania
4
Faculty of Environment Protection, University of Oradea, Gen Magheru 26 Street, 410048 Oradea, Romania
5
Faculty of Geography, Babes-Bolyai University, Sighetu Marmatiei Extension, 6 Avram Iancu Street, 437500 Sighetu Marmatiei, Romania
6
Faculty of Geography, Babes-Bolyai University, 5-6 Clinicilor Street, 400006 Cluj Napoca, Romania
7
Department of Physical and Economic Geography, Faculty of Science, L.N. Gumilyov Eurasian National University, 2 Satpayev Street, Nur-Sultan 010008, Kazakhstan
8
Institute of Geography, Faculty of Oceanography and Geography, University of Gdansk, 80-309 Gdansk, Poland
*
Author to whom correspondence should be addressed.
Submission received: 30 December 2020 / Revised: 10 February 2021 / Accepted: 17 February 2021 / Published: 23 February 2021
(This article belongs to the Special Issue Indoor Air Quality—What Is Known and What Needs to Be Done)

Abstract

:
Poor air quality inside museums is one of the main causes influencing the state of conservation of exhibits. Even if they are mostly placed in a controlled environment because of their construction materials, the exhibits can be very vulnerable to the influence of the internal microclimate. As a consequence, museum exhibits must be protected from potential negative effects. In order to prevent and stop the process of damage of the exhibits, monitoring the main parameters of the microclimate (especially temperature, humidity, and brightness) and keeping them in strict values is extremely important. The present study refers to the investigations and analysis of air quality inside a museum, located in a heritage building, from Romania. The paper focuses on monitoring and analysing temperature of air and walls, relative humidity (RH), CO2, brightness and particulate matters (PM), formaldehyde (HCHO), and total volatile organic compounds (TVOC). The monitoring was carried out in the Summer–Autumn 2020 Campaign, in two different exhibition areas (first floor and basement) and the main warehouse where the exhibits are kept and restored. The analyses aimed both at highlighting the hazard induced by the poor air quality inside the museum that the exhibits face. The results show that this environment is potentially harmful to both exposed items and people. Therefore, the number of days in which the ideal conditions in terms of temperature and RH are met are quite few, the concentration of suspended particles, formaldehyde, and total volatile organic compounds often exceed the limit allowed by the international standards in force. The results represent the basis for the development and implementation of strategies for long-term conservation of exhibits and to ensure a clean environment for employees, restorers, and visitors.

1. Introduction

Indoor air quality is one of the main causes of damage to museum exhibits. Given that the items of great value displayed in museums and other historical monument buildings are old and very delicate, some are in a poor state of conservation and cannot be cleaned on a regular basis [1]. Conservation treatments are also extremely delicate to apply due to the need for authenticity of the exhibits [2,3]. This has attracted the attention of researchers over time who have monitored the interior microclimate of museums in order to preserve the exhibits as best as possible [4,5,6,7,8].
In addition to the potential negative effects on the integrity of the exhibits, poor air quality inside museums can also affect human health [9,10,11,12,13]. The most concerned are employees and restorers who work for a long time in the indoor environment, but also museum visitors [14,15]. These are the main reasons why, in order to stop the process of their deterioration, preventive conservation is recommended, by means of monitoring, assessment, and control of indoor environmental parameters [16].
The variables which influence the indoor microclimate, therefore requiring close monitoring, are the physical variables—air temperature and relative humidity (RH). Too much seasonal or daily variation of the two indicators can lead over time to the irreversible deterioration of the items that make up the cultural heritage. To avoid this, temperature and RH values should be maintained as much as possible in a recommended range. Thus, they must not vary greatly or very often, and must not record values that can be harmful to exhibits [17].
A careful monitoring must also take into account the volume of pollutants in museums [18]. In general, the most important indoor monitored pollution variables influenced by air pressure and air velocity are: Carbon dioxide (mainly due to the presence of people), particulate and dust, total volatile organic compounds and formaldehyde (due to detergents, printer, etc.), and pollutants related to light and illuminance [19]. Of these, suspended particles and dust are extremely dangerous for human health (especially in the case of the elderly and children) and may also present a threat to exhibits [20]. For humans the threat is of diseases such as asthma, cardiovascular disease, atherosclerosis, and lung disease, in terms of exhibits, it creates a favourable environment for insects, as well as for the development of different types of moulds and fungi, leading to deterioration over time [2,21]. At the same time, high concentration levels of formaldehyde (TVOC) and total volatile organic compounds (HCHO) can lead to nausea and dizziness, increasing the risk of asthma and even cancer [22]. Although the negative effects of TVOC and HCHO are mainly felt by humans, the exhibits are also susceptible to damage due to excessive concentrations of these chemical compounds. TVOC and HCHO are mainly emitted during cleaning and conservation operations of exhibits that involve chemicals, but can also be emitted naturally by some items that are made of wood, plastic, or rubber, or that contain polyurethane foam, paints, synthetic adhesives, or oils [23]. Illuminance is one of the biggest threats to the integrity of exhibits, and the amount of CO2 has negative effects on people; these indicators require close monitoring for proper management.
The cumulative action of microclimatic indicators and various pollutants [24] is one of the main sources of damage to exhibits and also has negative effects on human health [25]. Knowing the values of the above mentioned parameters can represent a solid basis for decision-making in order to improve the quality of the indoor microclimate [17,26]. This can be done by installing heating, ventilation, and air conditioning systems (HVAC) [27,28] and by applying non-invasive treatments to exhibits.
The optimal values of temperature, relative humidity, CO2, particulate matters, brightness, TVOC, and HCHO are regulated by the international standards in force. Numerous standards are mentioned in the literature with the role of providing guidance regarding the values of the main indicators of the internal microclimate for the health of employees/visitors and for the conservation of exhibits (Table 1). The allowed intervals in which the values of the indicators can vary differ depending on the consulted bibliographic source and the nature of the targeted exhibits. Even if some indicators only target human health, while others present a potential danger only for exhibits; in order to maintain an optimal internal microclimate in museums, a complete set of standards and guidelines must be considered.
The study is intended to be a multi-disciplinary approach for investigation of the indoor environment of an old heritage museum building, for better conservation of the collections and for the health of workers and visitors. The case study is of a heritage building (built at the end of 19th century) which is located in the Municipality of Beius, Bihor County, Romania (Figure 1). It is the former house of memorandum activist Vasile Ignat and martyr Dr. Ioan Ciordas. It was built in a baroque eclectic style with dominant baroque elements. Since 1985, the museum has two sets of exhibits: One of history and one of ethnography, with over 3000 items displayed. This research envisaged to create a database for in situ monitoring of indoor air of a heritage building at a certain time, which allows comparisons with past and future investigations and reflects on the immediate measures to be taken in order to improve indoor air quality that may affect displayed or stored items, but also the health of workers and visitors [47,48].
Within the framework of the extended study [49], an assessment was undertaken of the degree of fungal contamination of the air inside the museum, respectively, on the surface of the exhibits. The results obtained show that the degree of microbial and fungal contamination of the surfaces and the air inside falls in a medium-high degree of fungal contamination and represents a potential risk to human health of visitors and museum workers (Figure 2). Thus, favoured by the microclimate conditions (RH and high temperature), 11 species of fungi were identified in the air: Candida guilliermondii, Candida sphaerica, Cryptococcus albidus, Cryptococcus laurentii, Cryptococcus neoformans, Sporobolomyces salmonicolor, Penicillium sp., Aspergillus sp., Trichoderma sp., Cladosporium sp., and Stachybotrys sp.; on the exhibits were identified four different colonies of fungi: Penicillium sp., Aspergillus sp., Trichoderma sp., and Cladosporium sp.
Due to the high frequency and power of colonisation of different surfaces, the identified fungal species can cause negative effects on the chemical composition and physical and mechanical structure of the exhibits [50], while also causing irreparable aesthetic damage [51]. In humans, they can cause ailments ranging from local infections to fatal disseminated diseases, depending mainly on the individual’s immune system [49,52]. Among symptoms of inhalation of these fungi, fever, anaemia, respiratory problems, exacerbation of asthma, cough, dyspnoea, nausea, chills, or headache are common symptoms [52,53,54].

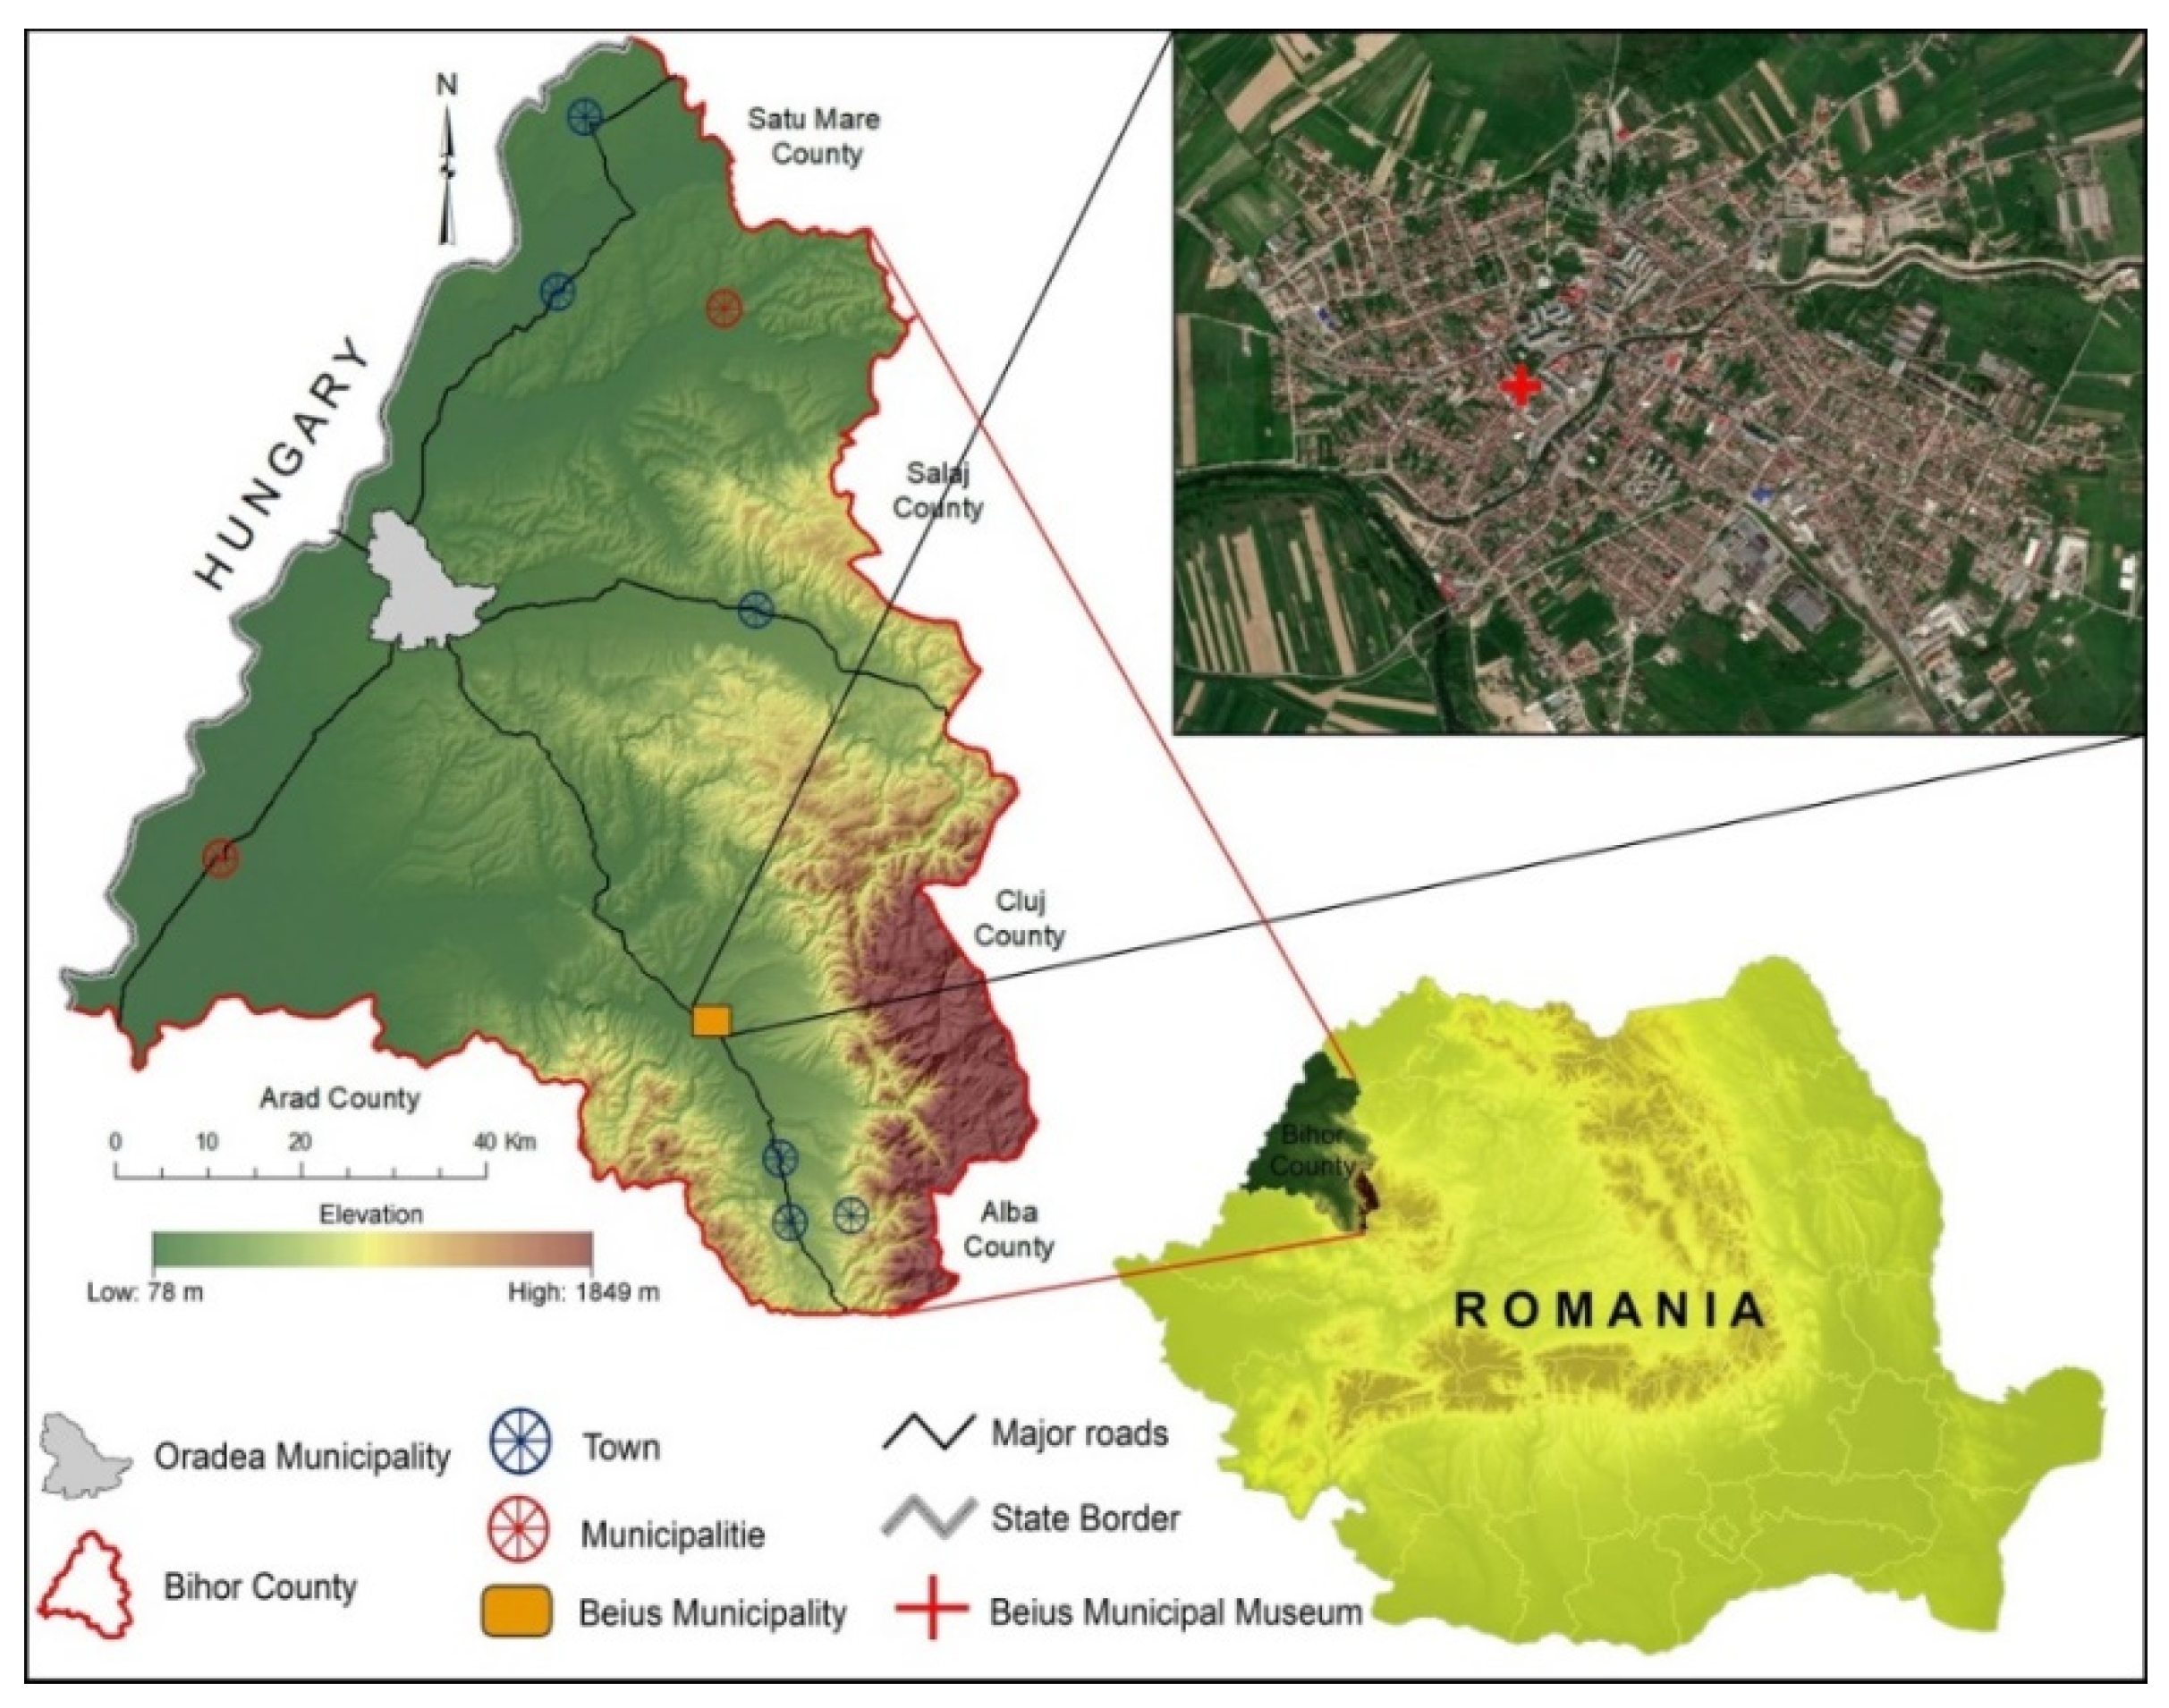
2. Materials and Methods

For determining the internal microclimate, the following were monitored: Temperature, relative humidity (RH), CO2 concentration, brightness, suspended particles concentration, formaldehyde concentration (HCHO), and total volatile organic compounds (TVOC). The measurements lasted for a period of at least 15 weeks between June–October 2020. The values obtained were compared to the international standards in force for establishing an overview on the quality of the microclimate inside the museum from Beiuș.
In order to have a better overview on the fluctuations of the main parameters of the indoor microclimate related to the Museum from Beiuș, halls with different particularities were chosen for study, albeit they can be transposed also for the other exhibition spaces. The purpose of this selection is to obtain reliable information about all categories of rooms present in the museum. Thus, the monitoring devices were located in:
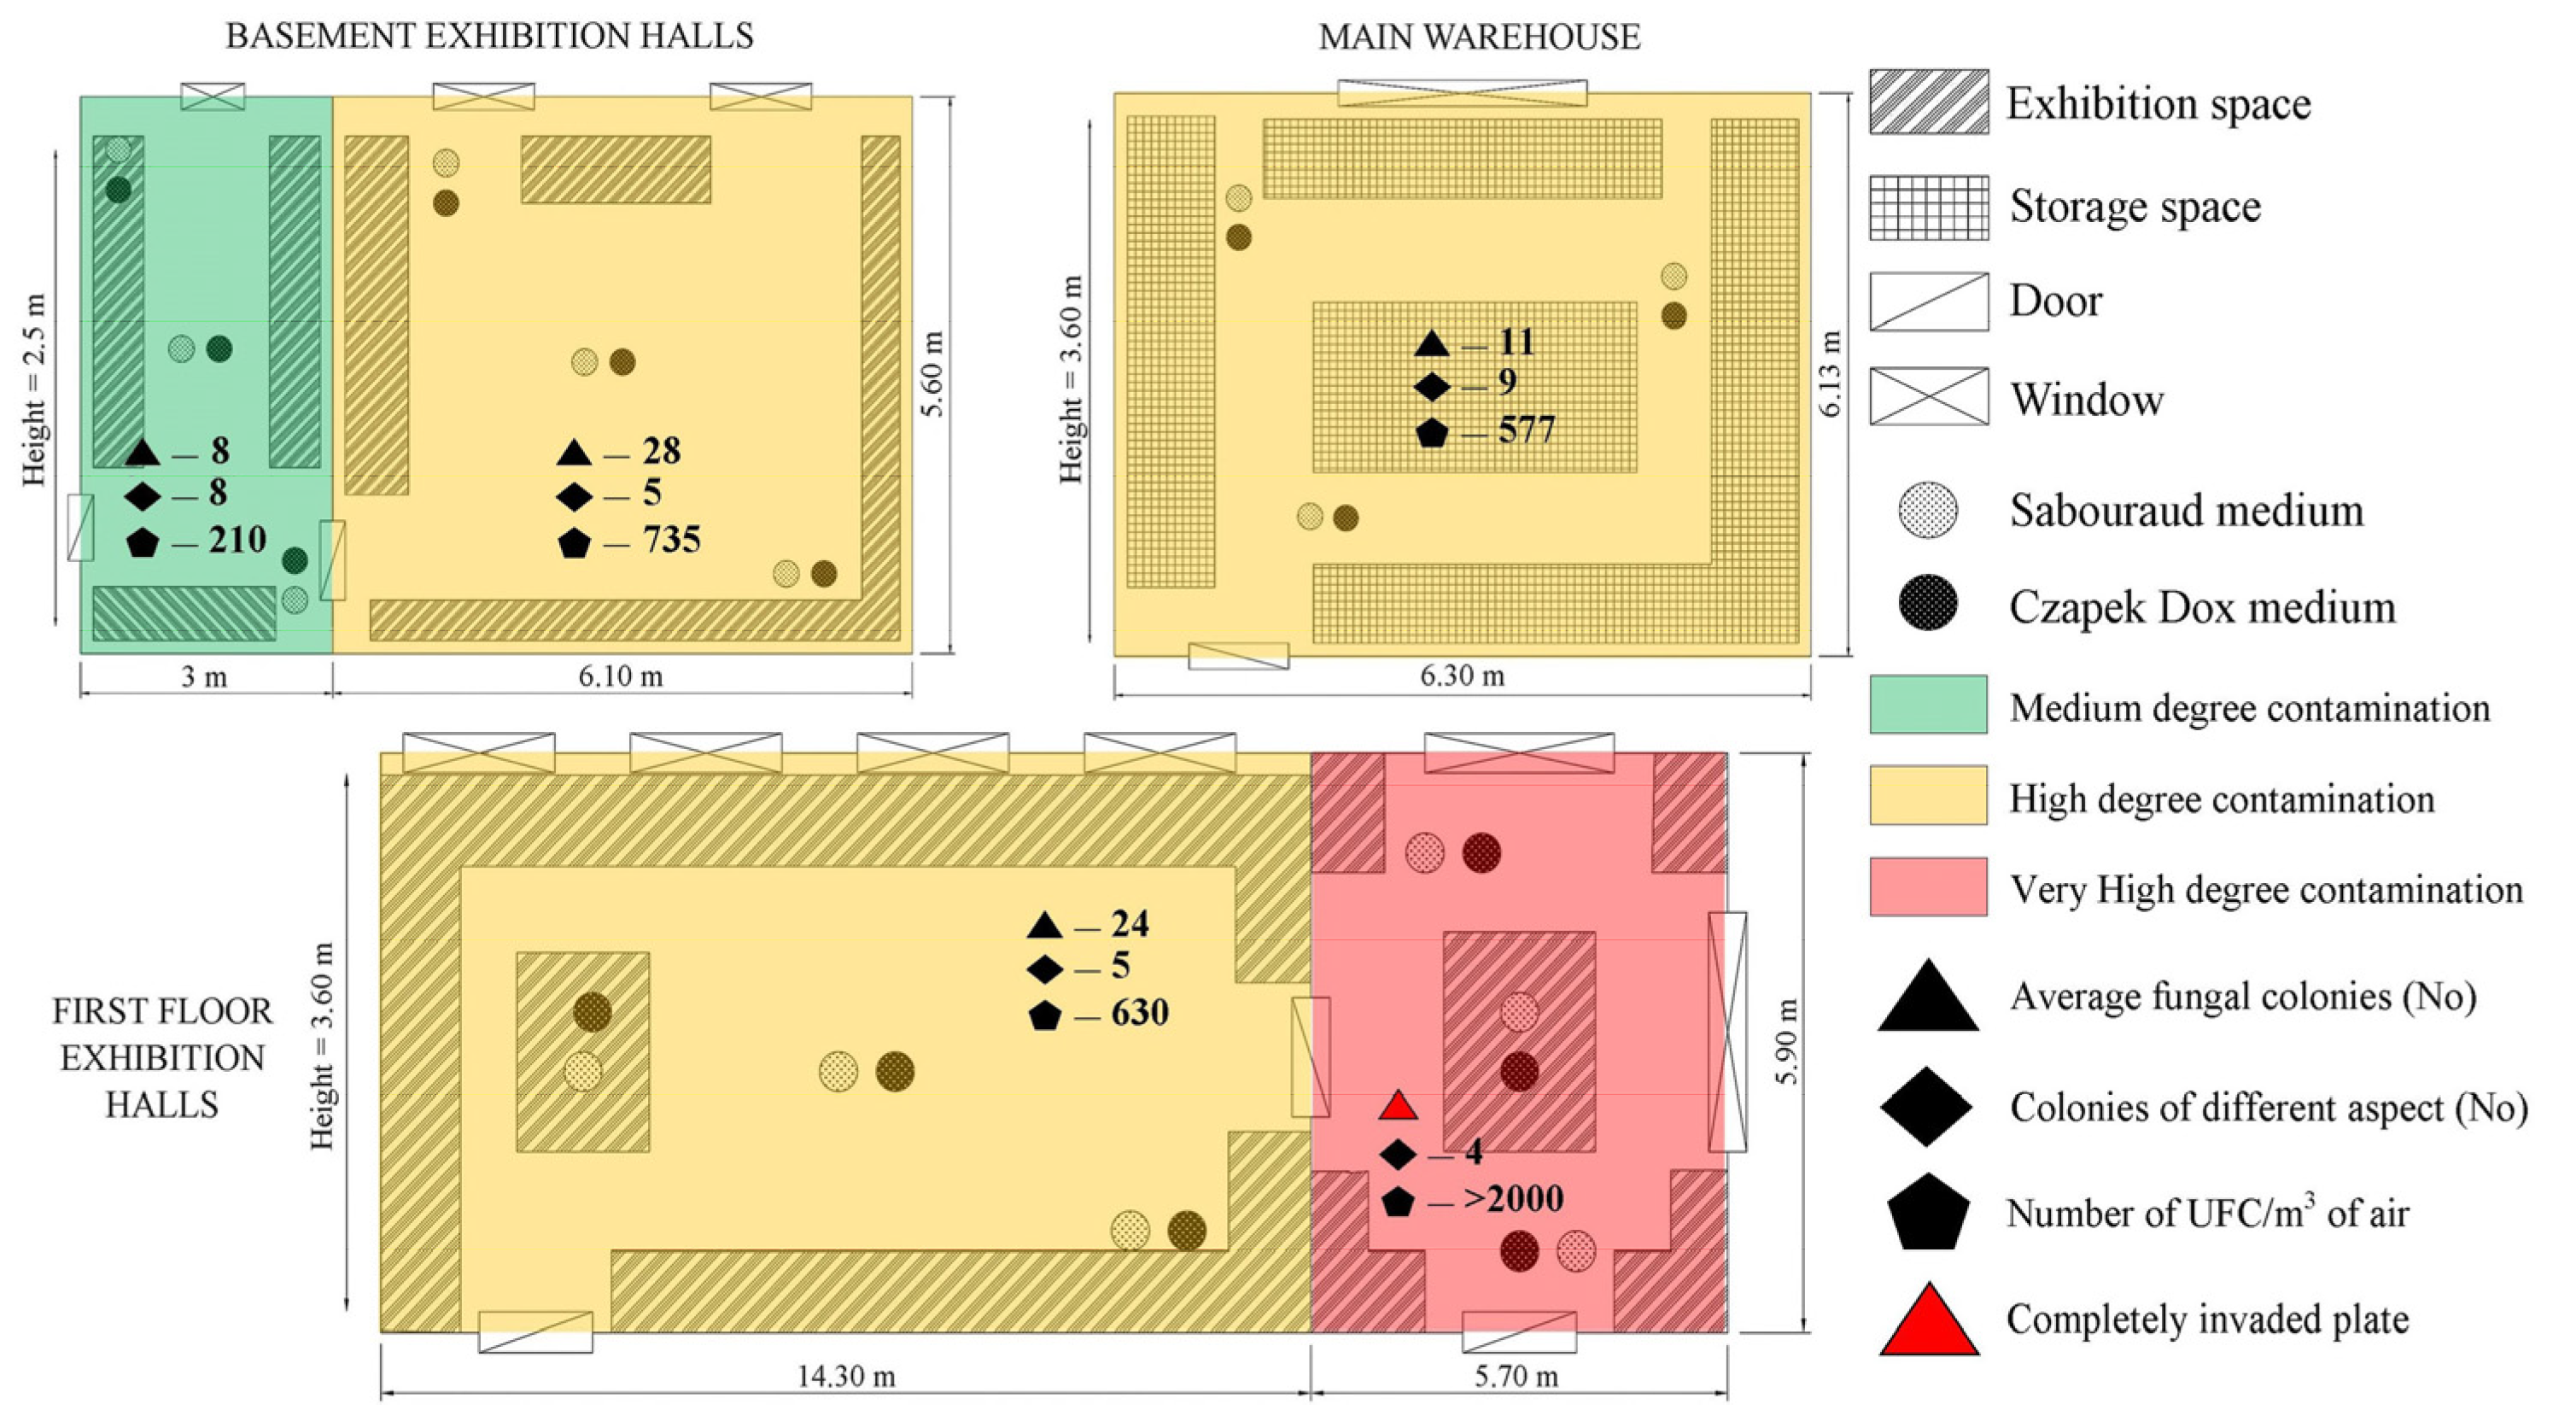
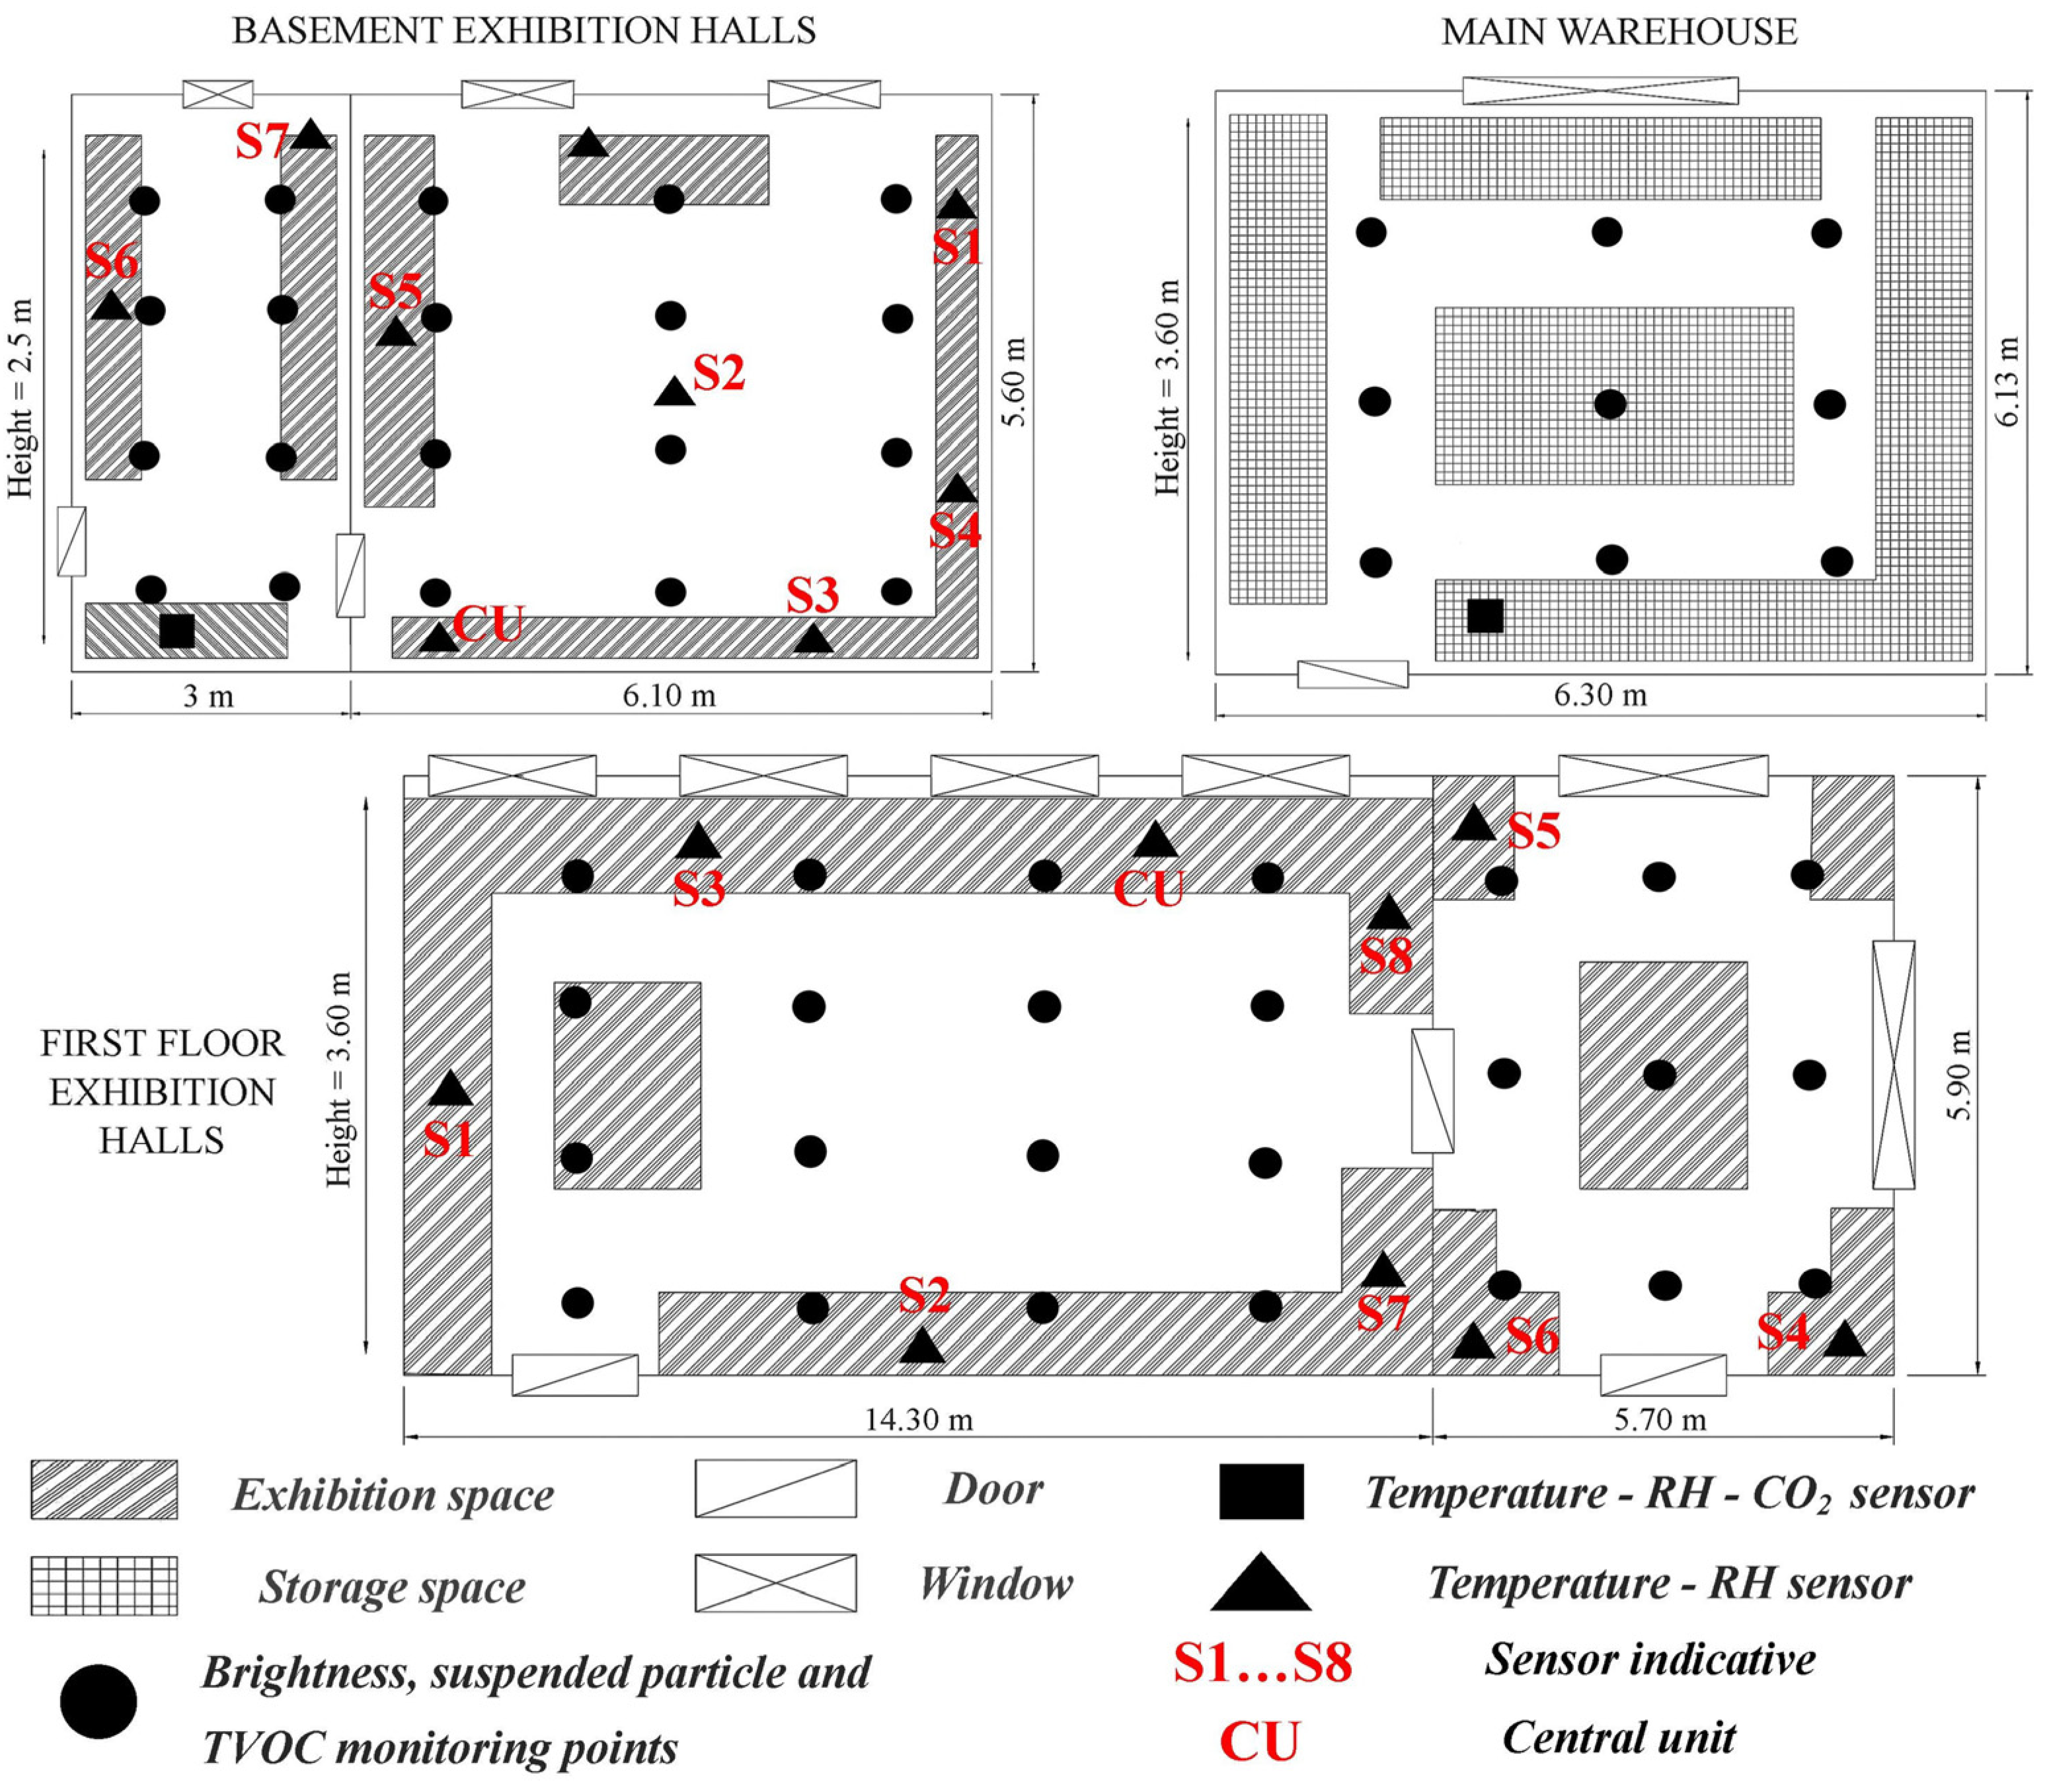
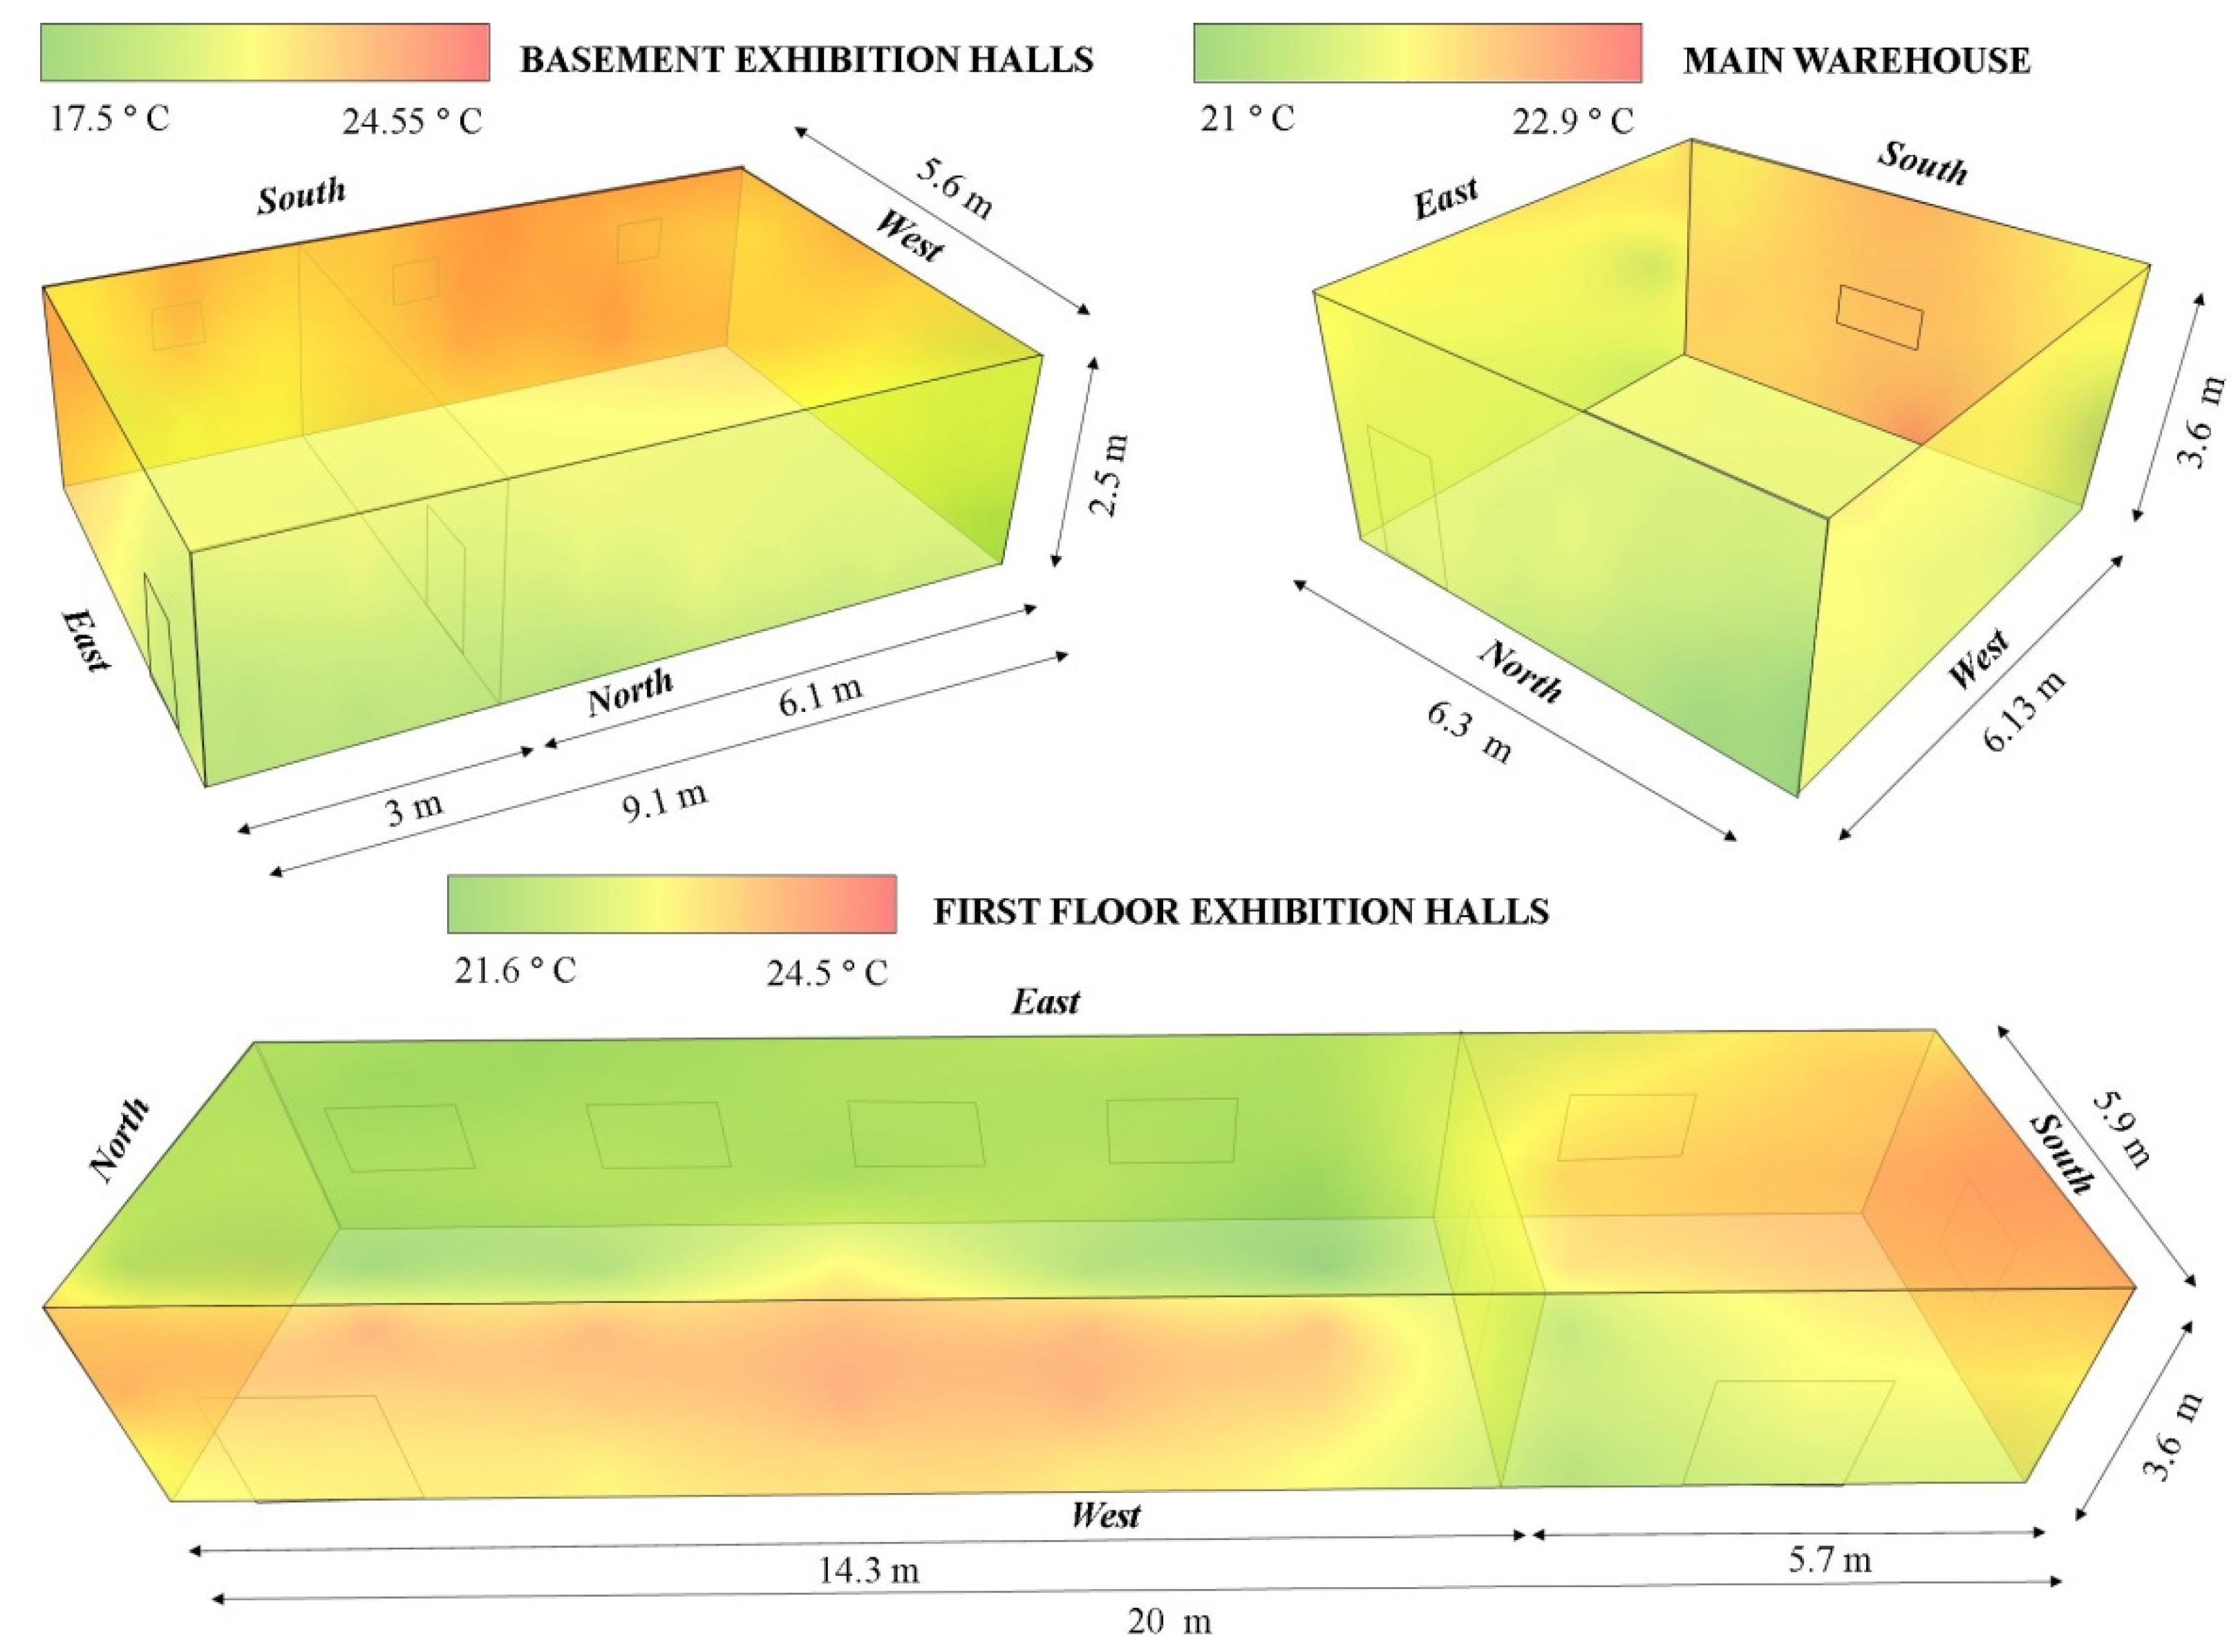
  • Two exhibition halls next to each other at the basement of the museum. They interlink through a permanently open door, so that the indoor microclimate is not very different from one hall to another, the two being therefore analysed as a unit. The two halls have a total volume of 127.4 m3 of air and house both exhibits belonging to the textile cultural heritage and exhibits made of clay and wood.
  • Two exhibition halls at the first floor of the museum, which were also analysed as a unit due to similarities in terms of indoor microclimate. They have a total volume of 424.8 m3 of air. The exhibitions present here mainly include art items, folk clothing, and old furniture. It is the largest exhibition space in the museum.
  • The main warehouse of the museum. It has a volume of 139 m3 of air and is intended for the temporary storage of exhibits. It is a space closed to visitors, being frequented only by museum staff and restorers (Figure 3).

2.1. Temperature, Relative Humidity, and CO2

These parameters were monitored using data-logger sensors, programmed to automatically record values every hour. The sensors have been positioned within the halls so as to cover the space as evenly as possible, in order to give a real situation on the distribution in space of the values related to these indicators (Figure 3). They were placed in key points, away from the visitors’ eyes, so that the data sets do not record any change due to possible location changes.
Two sets of Klimalogg Pro thermo-hygrometers connected with 8 wireless sensors each were used to measure temperature and humidity values. Thermo-hygrometers record and store data with an accuracy of ±0.1 °C in terms of temperature and ±3% in terms of relative humidity. The two sets of devices were installed in the exhibition halls within the museum.
The CO2 concentration was measured using two Extech SD800 datalogger devices. These devices, in addition to determining the concentration of CO2 in the air, also measure temperature and relative humidity, thus being considered as an additional sensor for monitoring the latter indicators. The accuracy of the measurements is ±40 ppm for CO2, ±0.8 °C for temperature and ±4% for relative humidity. Given that museum visitors and employees are most prone to the negative effects of a high concentration of CO2; in order to determine as accurately as possible how much they could inhale, the sensors were placed at the height of an average height for man (1.7 m).

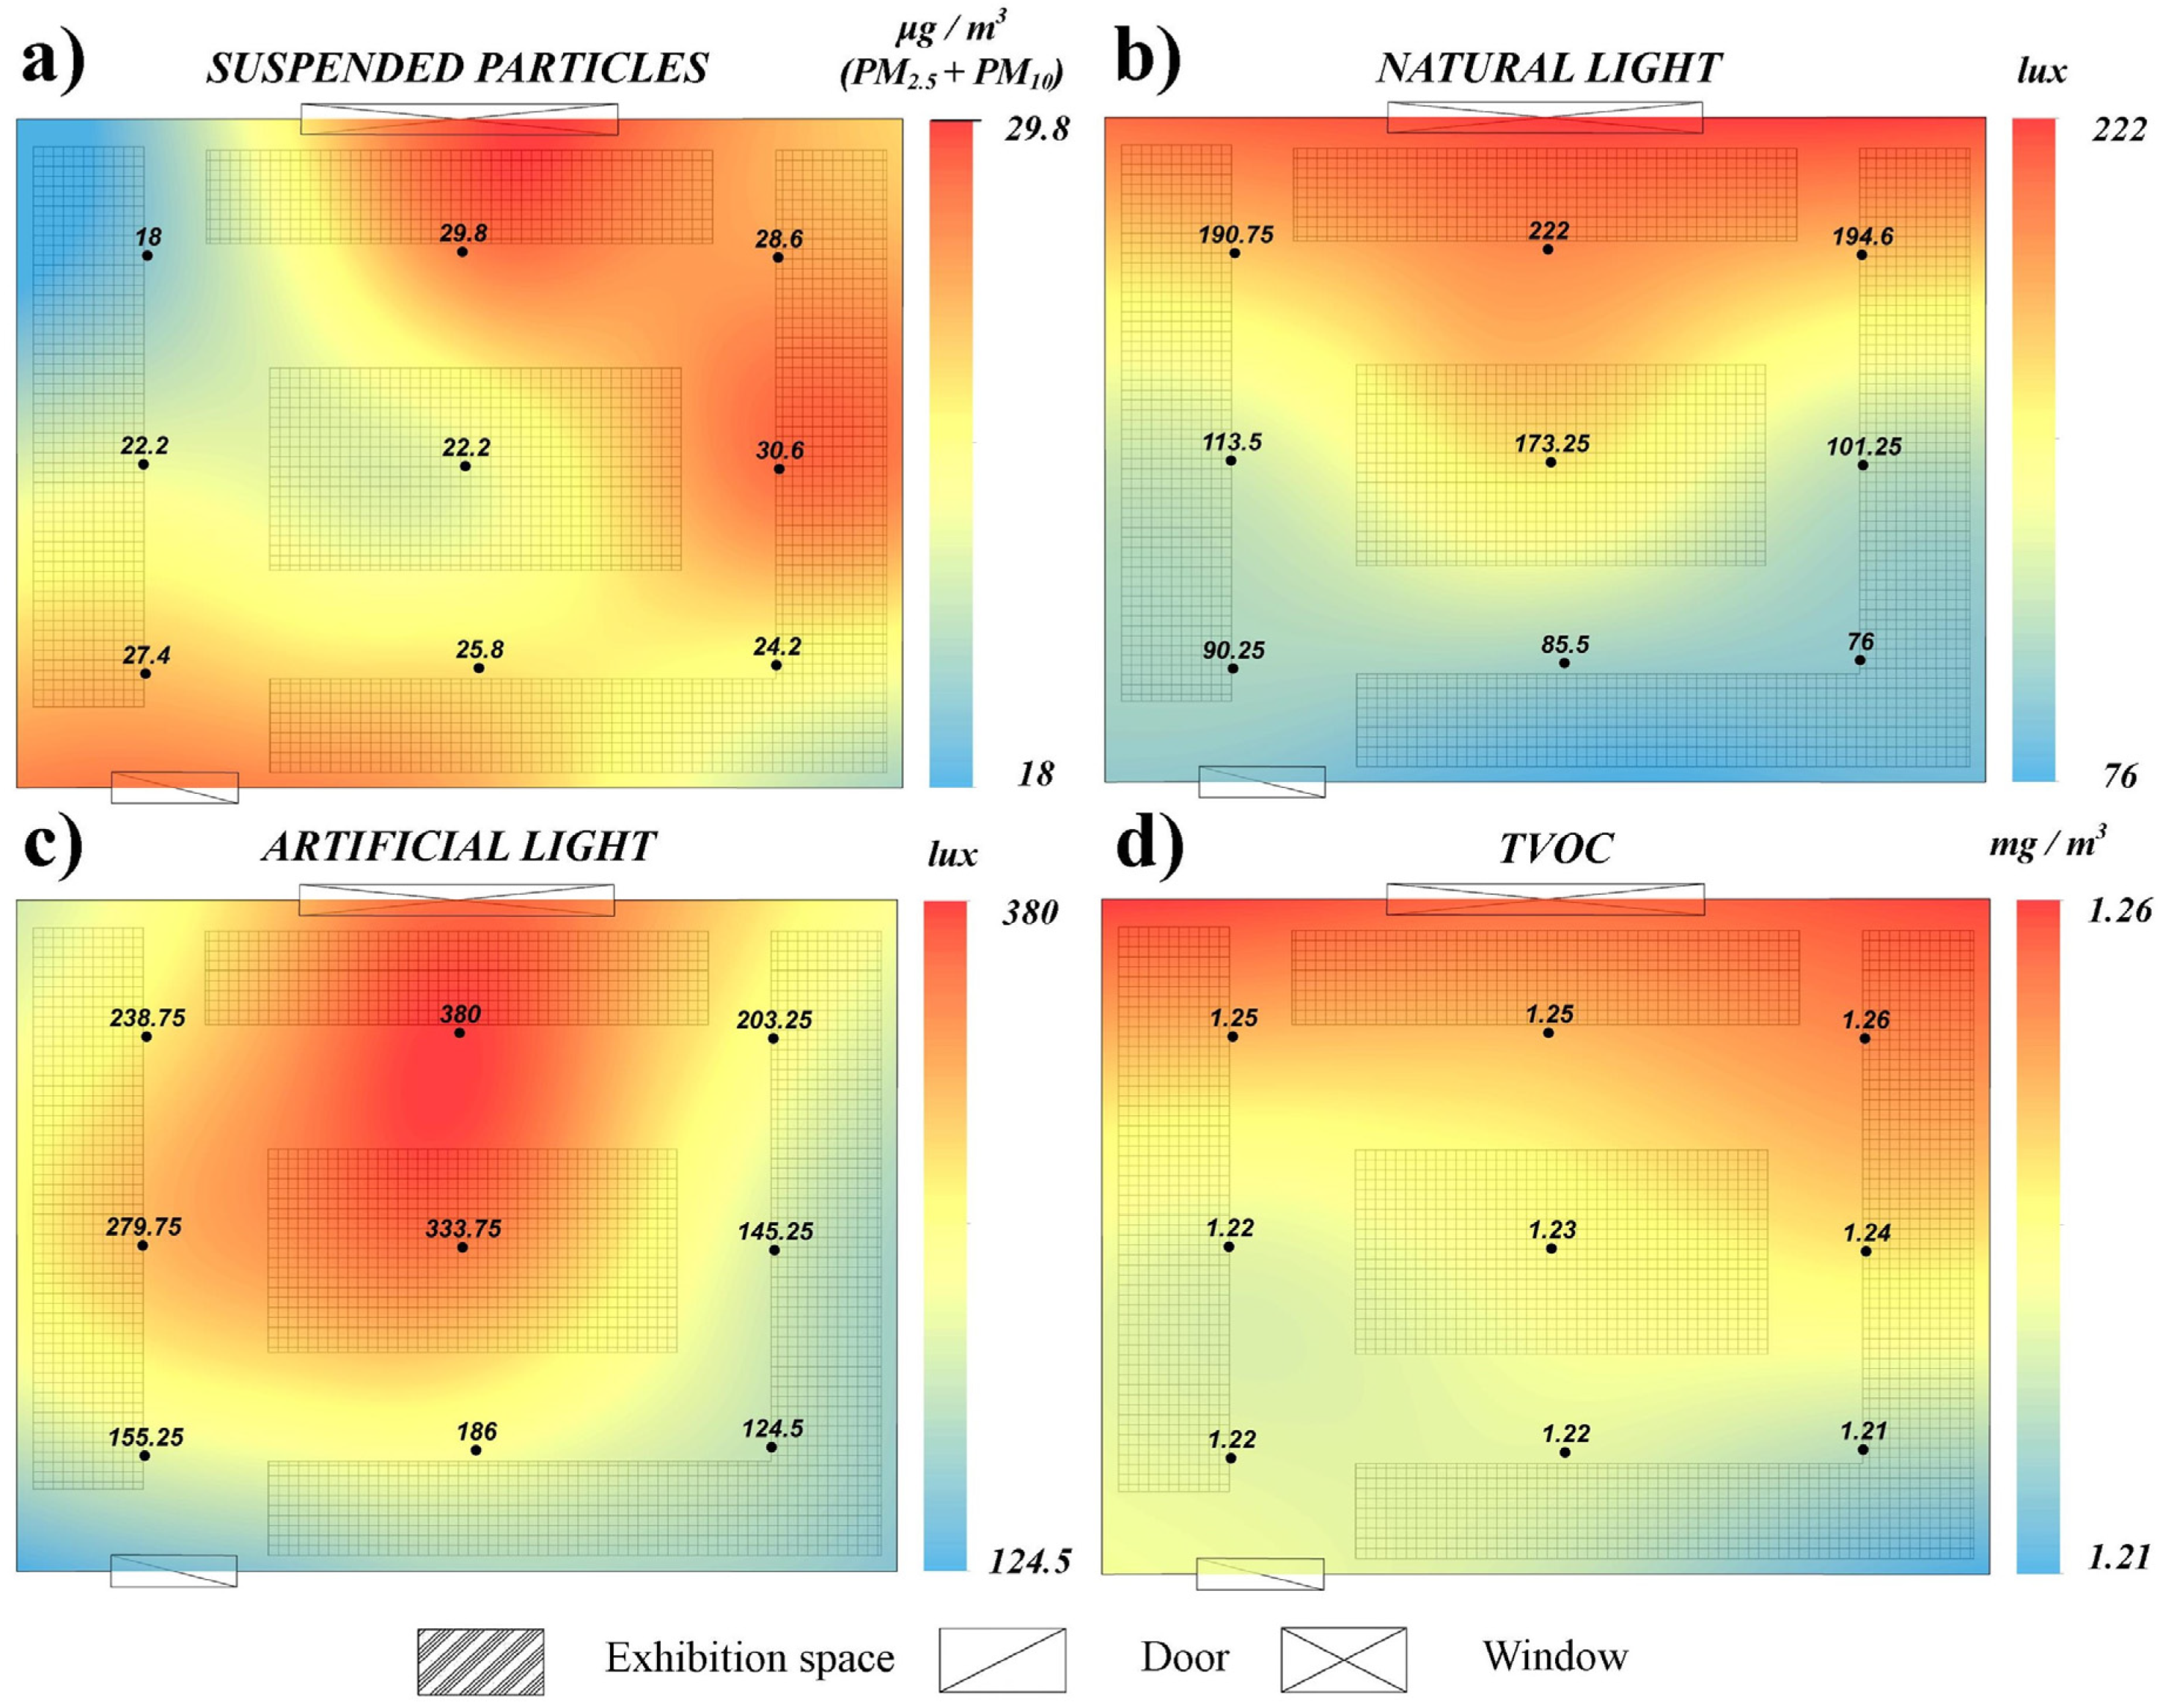
2.2. Suspended Particles, Brightness, HCHO and TVOC

Measurements were made at predefined points (Figure 3), evenly distributed in order to have the best possible coverage of the halls. The data was collected three times a day, both during the hours when the museum was open to the public and when it was closed.
Determining the concentration of particles in the air volume of the halls was performed in situ using a handheld device PCE-PCO 2. By analysing the samples taken from the inside, this device calculates and reproduces the concentration of suspended particles (μg/m3) with a margin of error of less than 5%, as well as their size (2.5 and 10 micrometres). Data collection was performed at an average height of 1 m, for one minute for each point.
The brightness was measured at different times of the day (usually between 8 a.m.–7 p.m.), both in terms of the amount of natural and artificial light, using Extech SDL400 datalogger luxmeter. It renders the amount of light in lux to an accuracy of ±4%.
The concentration of formaldehyde (HCHO) and total volatile organic compounds (TVOC) was measured using a Trotec-BQ16 device. The accuracy of the device is ±5% for HCHO and ±10% for TVOC. Data was measured in mg/m3 for each of the established sampling points.

2.3. Thermography

Given that maintaining a suitable microclimate is closely linked to thermal inertia and heat loss, the determination of the temperature of walls was aimed at highlighting thermal anomalies, cold and hot areas within them. The infrared (IR) thermography measurements revealed the differences in the various surfaces having different building materials, the presence of hidden cracks, and areas of high humidity.
The infrared (IR) thermography was done at the level of the ceiling and each wall of the analysed halls using a thermal imaging camera FLIR E4. This device, which has dynamic multi-spectral imaging, has an accuracy of ±2% for items with a temperature above 0 °C and a resolution of 80 × 60 pixels.

3. Results and Discussions

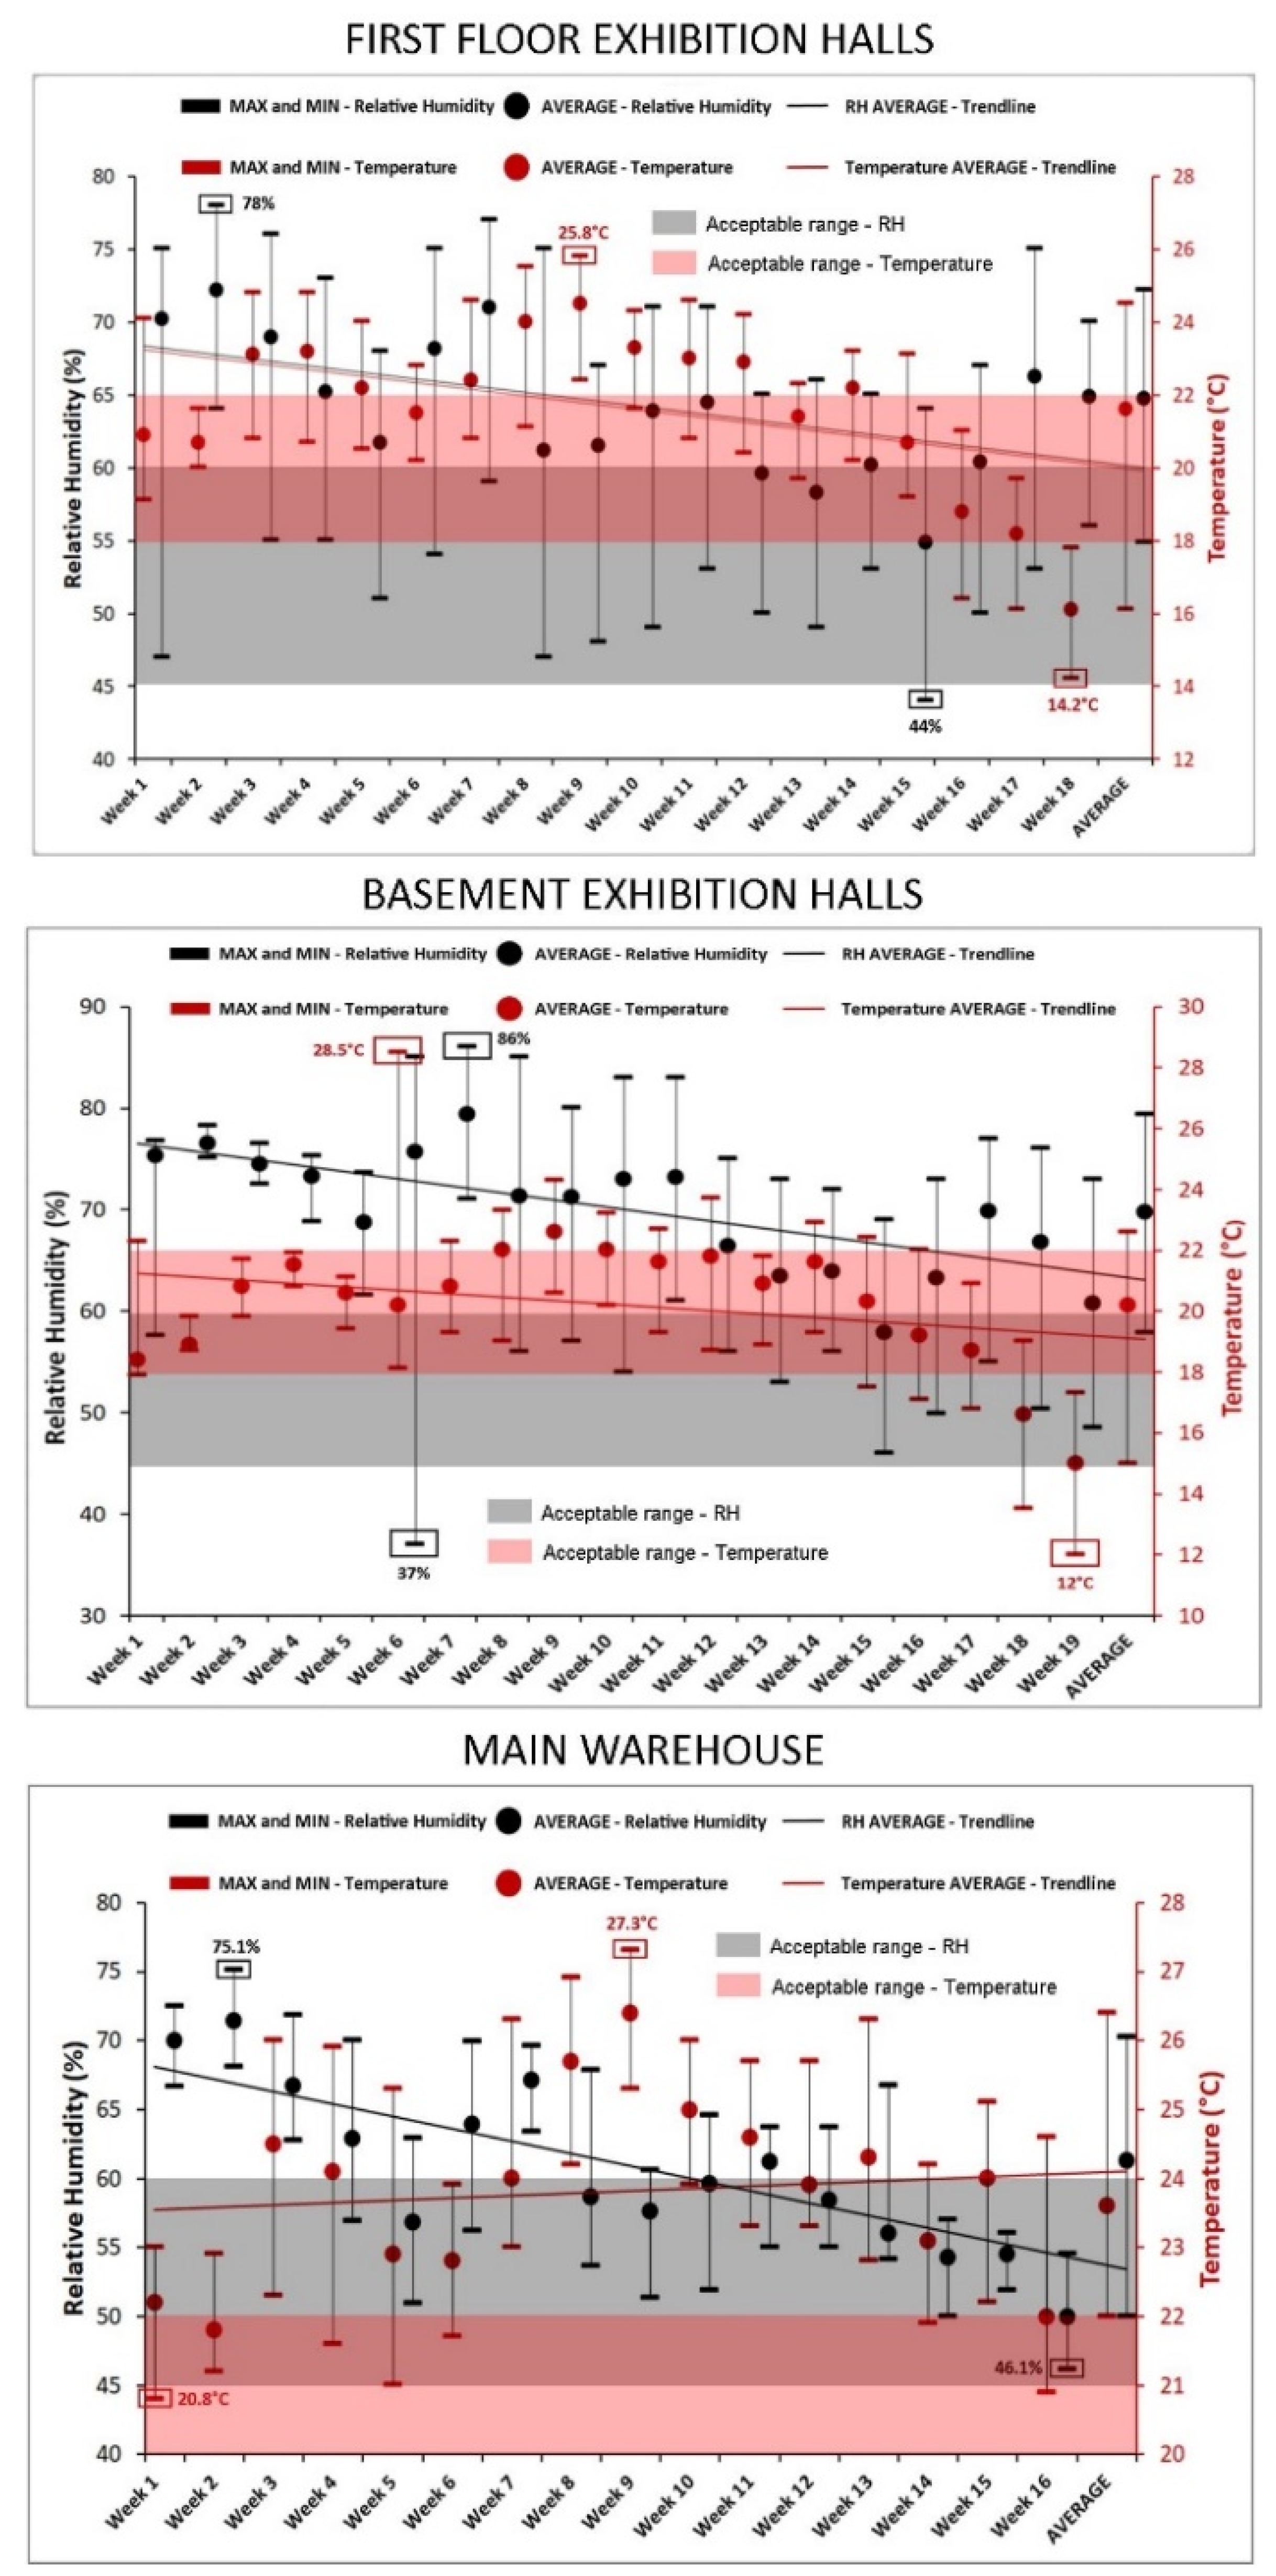
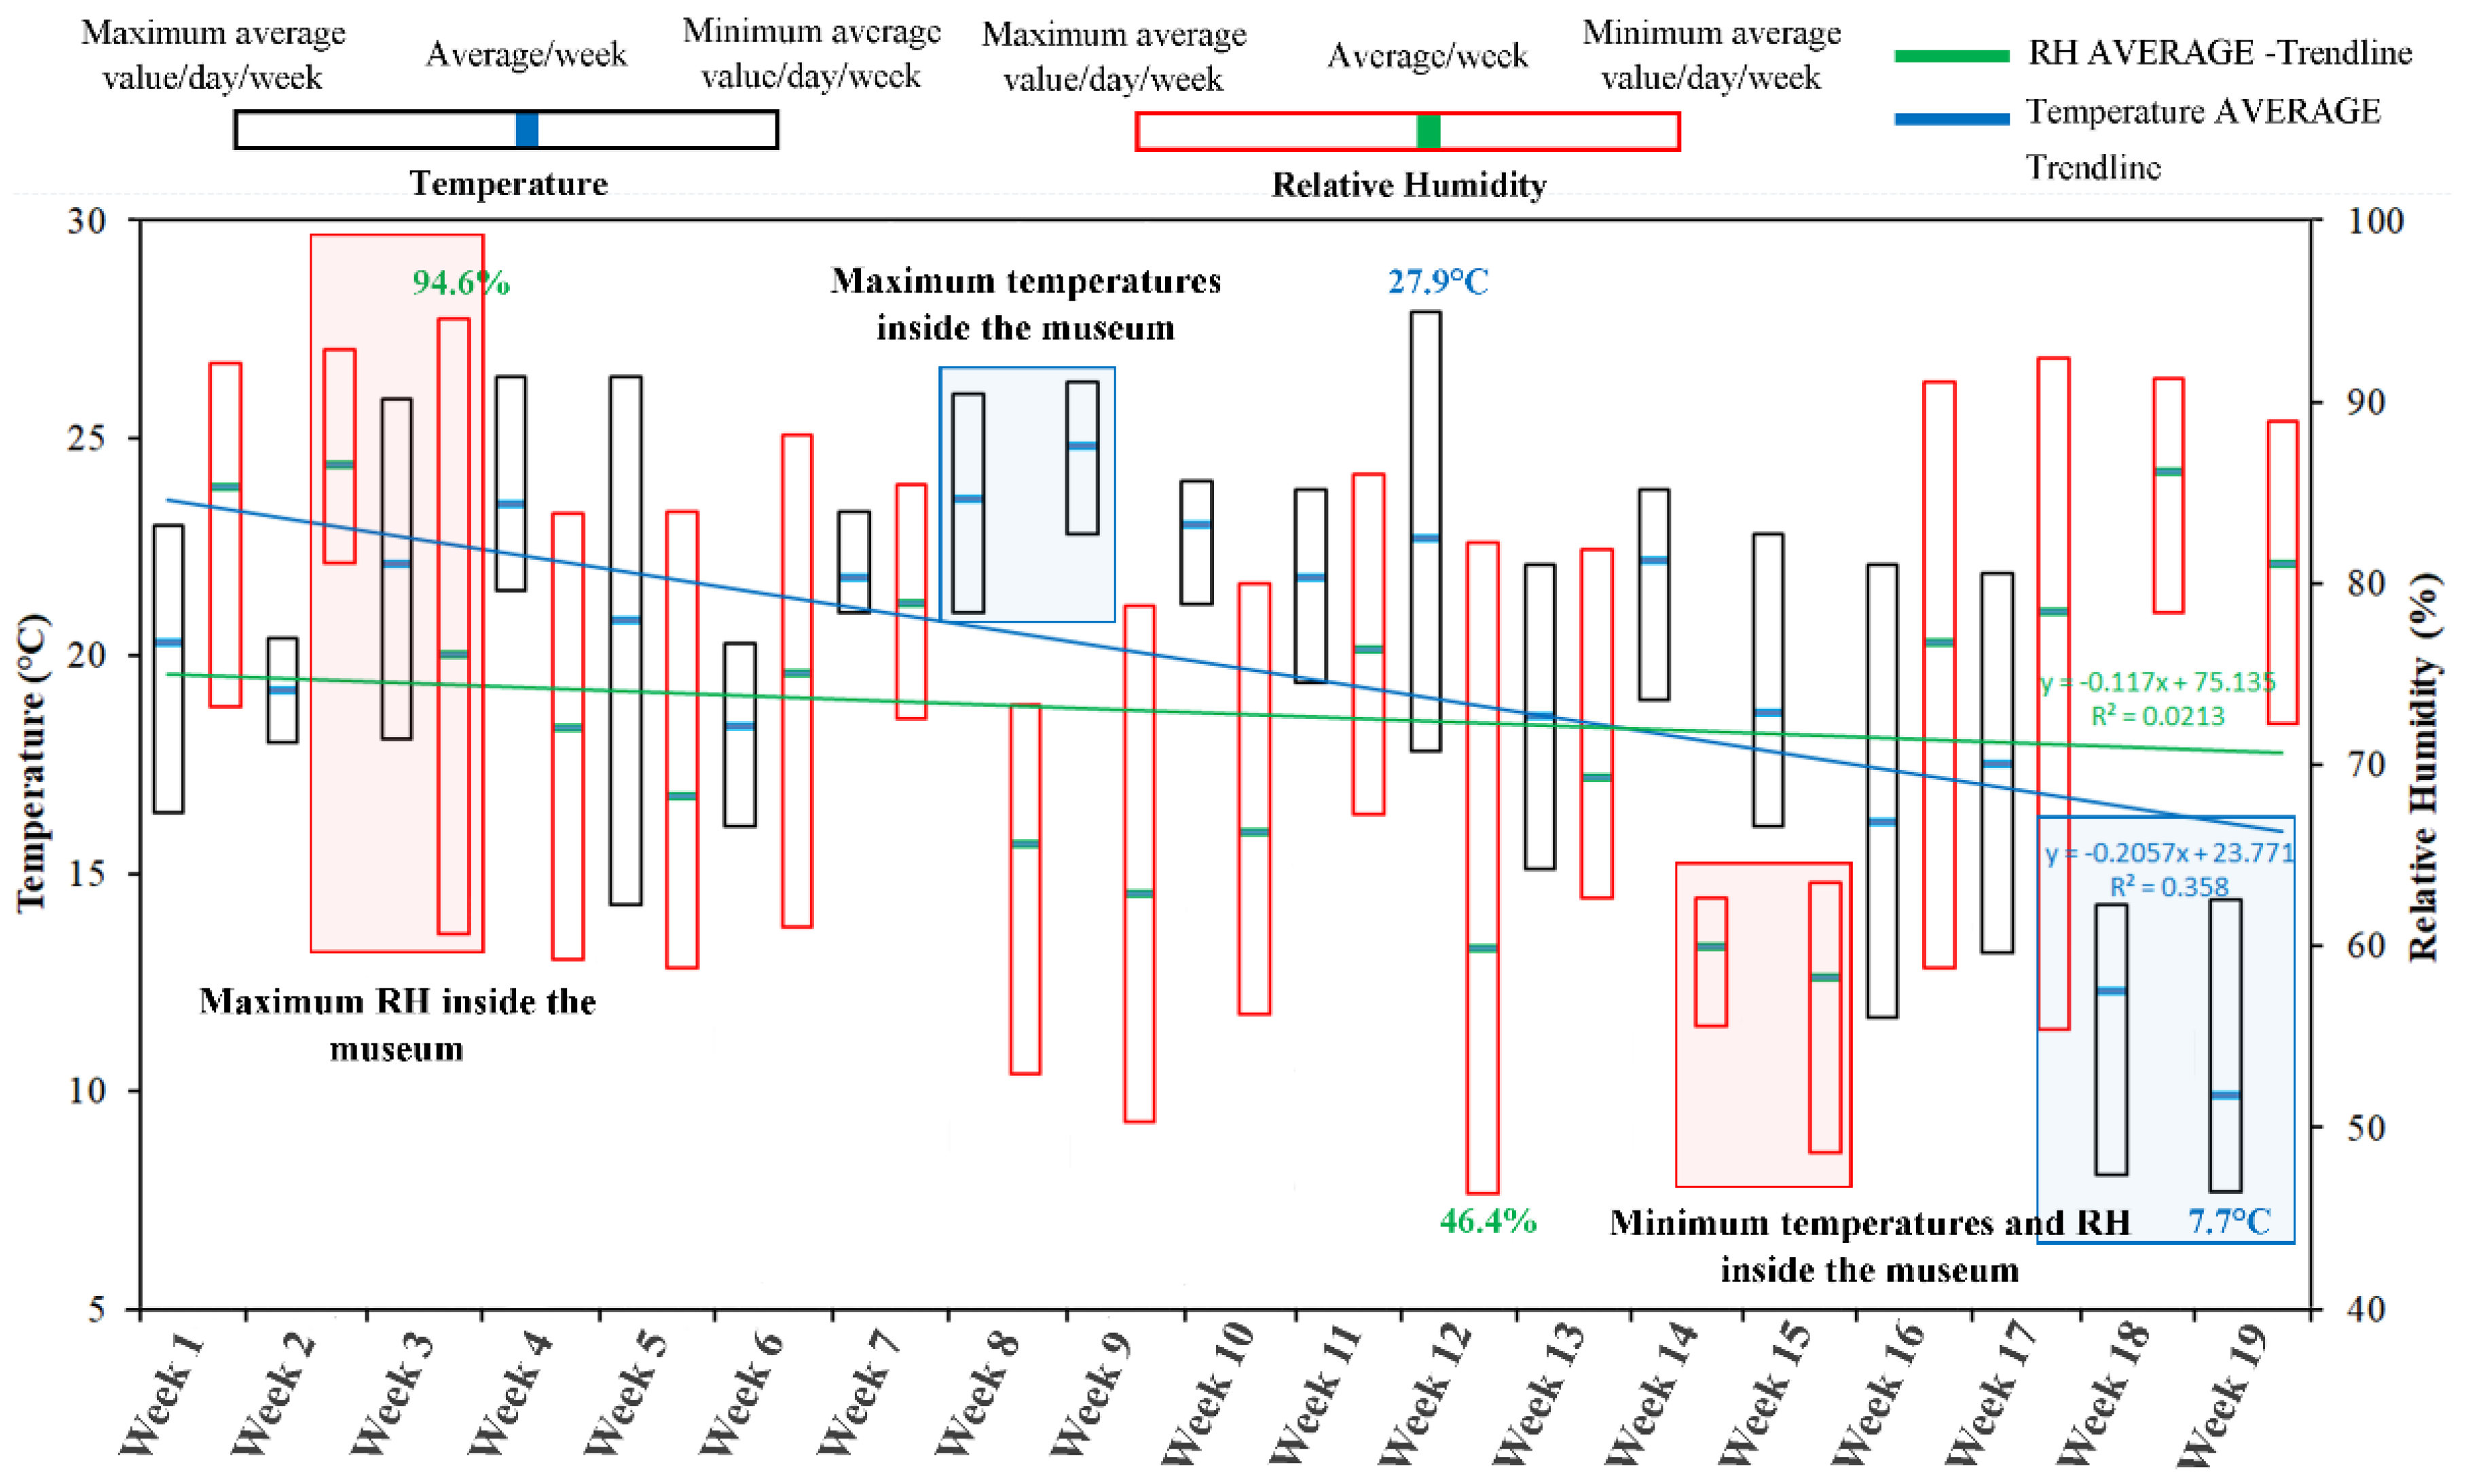
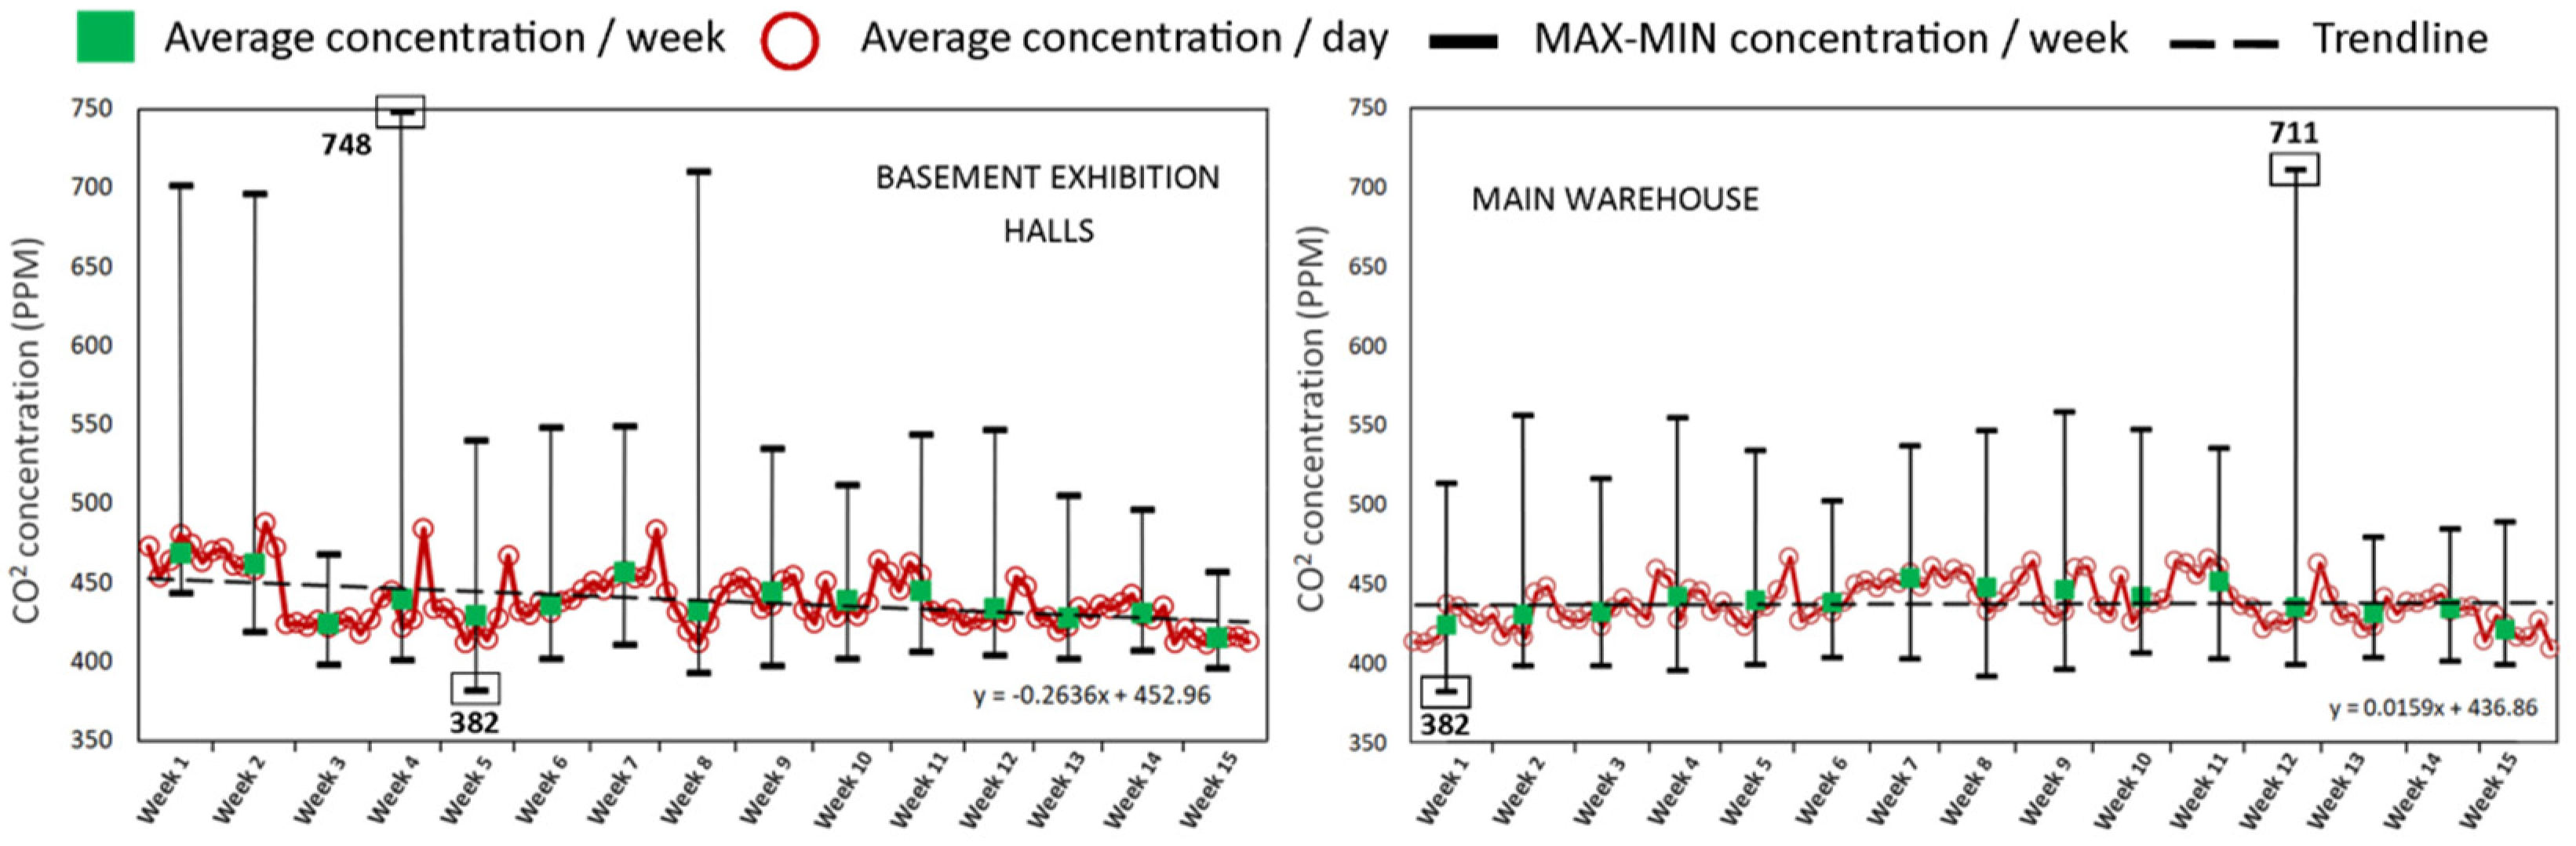
3.1. Temperature, Relative Humidity, and CO2

Proper conservation of museum exhibits requires strict monitoring of internal microclimate parameters, especially in terms of temperature and relative humidity. In order to maintain an ideal microclimate, according to ASHRAE standards [36], the temperature must be maintained at an average value of 20 °C (±1–2 °C) and the daily variation must not exceed 2 °C. As for the RH, the ideal is set at an average value of 50% (±3%), but values ranging between 45% and 60% are also accepted.
In the case of the museum from Beiuș, the average temperature for the analysed period largely falls within the established standards. Thus, the exhibition halls on the first floor and basement have recorded average values that fall within the acceptable average values, respectively, 21.6 °C (first floor exhibition hall) and 20.2 °C (basement exhibition hall). The warehouse is the only room in which an average temperature value has been recorded above the allowed limit. Here, in the 16 weeks of monitoring, the average temperature was 23.6 °C, which is 3.6 °C above the situation considered ideal according to ASHRAE [36]. The analysis of the average temperature values for each monitoring week reveals that, although the warehouse registers an average temperature above the allowed limit, the fluctuations per week are quite low. Thus, inside the warehouse, the average weekly temperature values vary in a range of 4.6 °C, between 26.4 °C (week nine) and 21.8 °C (week two). As for the basement, this indicator varies from a maximum value of 22.6 °C for week nine up to a minimum value of 15 °C in week 19. The first floor is the area with the largest average weekly variations; these fluctuate between 24.5 °C during week nine and 16.1 °C during week 18.
The periodic variation of the temperature in the analysed halls shows an accentuated thermal instability. The basement of the museum recorded the largest thermal variation (16.5 °C), between a maximum value of 28.5 °C and a minimum value of 12 °C. Temperature at the first floor of the museum varied by 11.6 °C, from maximum 25.8 °C to minimum of 14.2 °C. The warehouse is the space with the lowest thermal variations (6.5 °C), the temperature ranging between 27.3 °C and 20.8 °C (Figure 4).
Unlike temperature, the average values of RH exceed the acceptable situation established for all three halls analysed. Therefore, the exhibition in the basement of the museum has recorded for the 19 weeks of monitoring an average RH value of 69.7%, the hall on the first floor is represented by an average of 64.8%, while the lowest value was recorded in the warehouse, namely 61.3%. Regarding the weekly average values of RH, they vary in a range of 29.4% (between maximum 79.4% in the basement and 50% in the warehouse). Thus, the basement records the highest weekly average value in the seventh week of measurements (79.4%) and the lowest in the fifteenth week (57.9%), the evolution of this indicator in the rooms located in the basement of the museum being a negative one. The first-floor area also registers a downward trend of the average weekly value of RH, in parallel with the temperature values presented above. The maximum weekly RH value on the first floor is recorded in the second week of measurements at 72.2%, while the minimum is assigned to the fifteenth week with a value of 54.9%. The second week also provides the higher value in the case of the warehouse, where a value of 71.4% is reached during this period, while the minimum value is assigned to the sixteenth week, with 50% measured relative humidity.
These RH values can be harmful to exhibits due to the fact that they favour water absorption and salt contamination [19], aspects that can lead to serious damage, especially if the exhibits are made of wood, clay, or textiles.
In addition to the fact that RH records very high average values, the periodic variation of this indicator remains also very high, RH values fluctuating by 49%. As in the case of temperature, the most significant variations in terms of RH (49%) are recorded in the basement, ranging between a maximum value of 86% and a minimum of 37%. In the exhibition halls located on the first floor, a periodic RH variation of 34% was recorded, between 78% and 44%. RH values exceeding 75% represent critical situations for the conservation of artifacts. The warehouse is also in this case, the room with the greatest stability, RH varying by only 29%, between 75.1% and 46.1% (Figure 4).
Given that the museum does not have HVAC systems to regulate the internal microclimate, it is closely related to fluctuations of outside weather. Thus, the values of temperature and RH in the exhibition rooms at the first floor and in the basement registered constant and continuous decreases, in accordance with the fluctuation of the outdoor weather depending on the week. The only room with a separate evolution was the warehouse, and only in the case of RH values, which increased continuously.
Despite this, the average temperature values in the three analysed rooms remained higher by 1.2 to 3.7 °C compared to the average value of 19.9 °C recorded outside during the analysed period. At the same time, weeks eighteen and nineteen represent the minimum in terms of temperatures both outside and inside the exhibition halls (Figure 5); only the basement registering a minimum in the second week, in disagreement with the outside. Both outdoors and indoors, the highs were recorded in the summer months (June-August) and especially in the eighth and ninth weeks.
The average values of relative humidity (RH) were lower in all three rooms inside (between 61 and 69%) than those outside (72.3%). In agreement with outside RH, the lowest values of this indicator were recorded internally in the fourteenth and fifteenth week (in September), while the maximum values are assigned to the beginning weeks of the monitoring period (the second and the third week) (Figure 5).
In order to have an overview on the relative temperature and humidity fluctuations in the analysed rooms, it is important to establish the number of days in which these indicators have recorded values that fall within the rules in force for the protection of exhibits and for the comfort/health of employees and visitors. For this, the international standards regarding the indoor microclimate in museums have been carefully consulted [36,55,56], especially in the case of exhibits made of wood, ceramics, or textiles. Thus, three situations were established, each one being assigned an indicative, namely:
Indicative 1—Assigned to the daily average values considered to be ideal. These were set between 19–21 °C in terms of average temperature and between 47% and 53% in terms of average RH.
Indicative 2—Assigned to the daily average values considered to oscillate in an acceptable range and thus presenting no danger to exhibits and staff. Intervals were set between 18–19 °C/21–22 °C for temperature and 45–47%/53–60% for RH.
Indicative 3—Assigned to the daily average values considered not recommended and therefore potentially hazardous. These values can be found below 18 °C and above 22 °C in terms of temperature, as well as below 45% and above 60% in terms of RH (Table 2).
Only the two indicators were taken into account due to the fact that they are the main factors that cause the damage to the exhibits. At the same time, if the other parameters of the microclimate fall within a tolerable range, deteriorations occur only if the temperature and RH values vary too much or too often [19].
Table 1 below presents the results. These show that the situations in which the indoor microclimate does not present any risk for exhibits are relatively few. The necessary conditions are met for just 50 days (13.8%), while the days that are at risk (both parameters exceed the allowed limits) consist of 103 (28.5%). The largest deviations are identified in terms of RH, which in 32.4% (117 days) of cases exceeds the allowed limit in comparison with temperature conditions that are unfavourable, as recorded in 25.8% (93 days) of cases.
The results, broken down by the three areas where the measurements were performed, reveal that the warehouse faces the greatest problems with temperature and RH. For the warehouse, the days without risk were only 7 (6.8%) while 41 days (39.9%) have recorded exceeding acceptable levels for both indicators. Overall, for 45 days (43.7%), it was detected that temperature levels were excessive, and in 10 days (9.7%), excess of the ideal/acceptable values for RH was noted. Exhibits held in the basement found good conservation conditions in only 11 days (8.5%), while in another 28 days (21.6%), a high risk of damage was present. The biggest problems were identified in RH, which in 63.5% of cases exceeded the allowed values. The first floor is the only area where a real balance is maintained during the days that present risk (34 days-26.3%) and the optimal ones (32 days-24.8%). Regarding the excess deviations recorded on indicators, on the first floor, the temperature in 31% of cases varied outside the optimal range, while for RH it was 19.4% of the time.
Due to the fact that all the halls in the museum have large windows, which are periodically opened for ventilation both during and outside the visiting hours, the amount of CO2 is kept within normal limits. Thus, for the storage area, the average amount of CO2 for the entire analysed period is 437.7 ppm, with a weekly variation between 420.5 ppm and 452.9 ppm. The basement recorded average values of 439 ppm, with weekly values ranging between 415.4 ppm and 468.5 ppm. Maximum values were 748 ppm (basement) and 711 ppm (warehouse), while minimum values did not decrease below 382 ppm in any of the cases (Figure 6).
According to ANSI/ASHRAE Standard [30] a value above 1000 ppm can lead to health issues such as drowsiness, breathing problems, headaches, or increased sweating [17,57]. All recorded values fall within the abovementioned standards, so there is no danger from this point of view for staff and visitors.

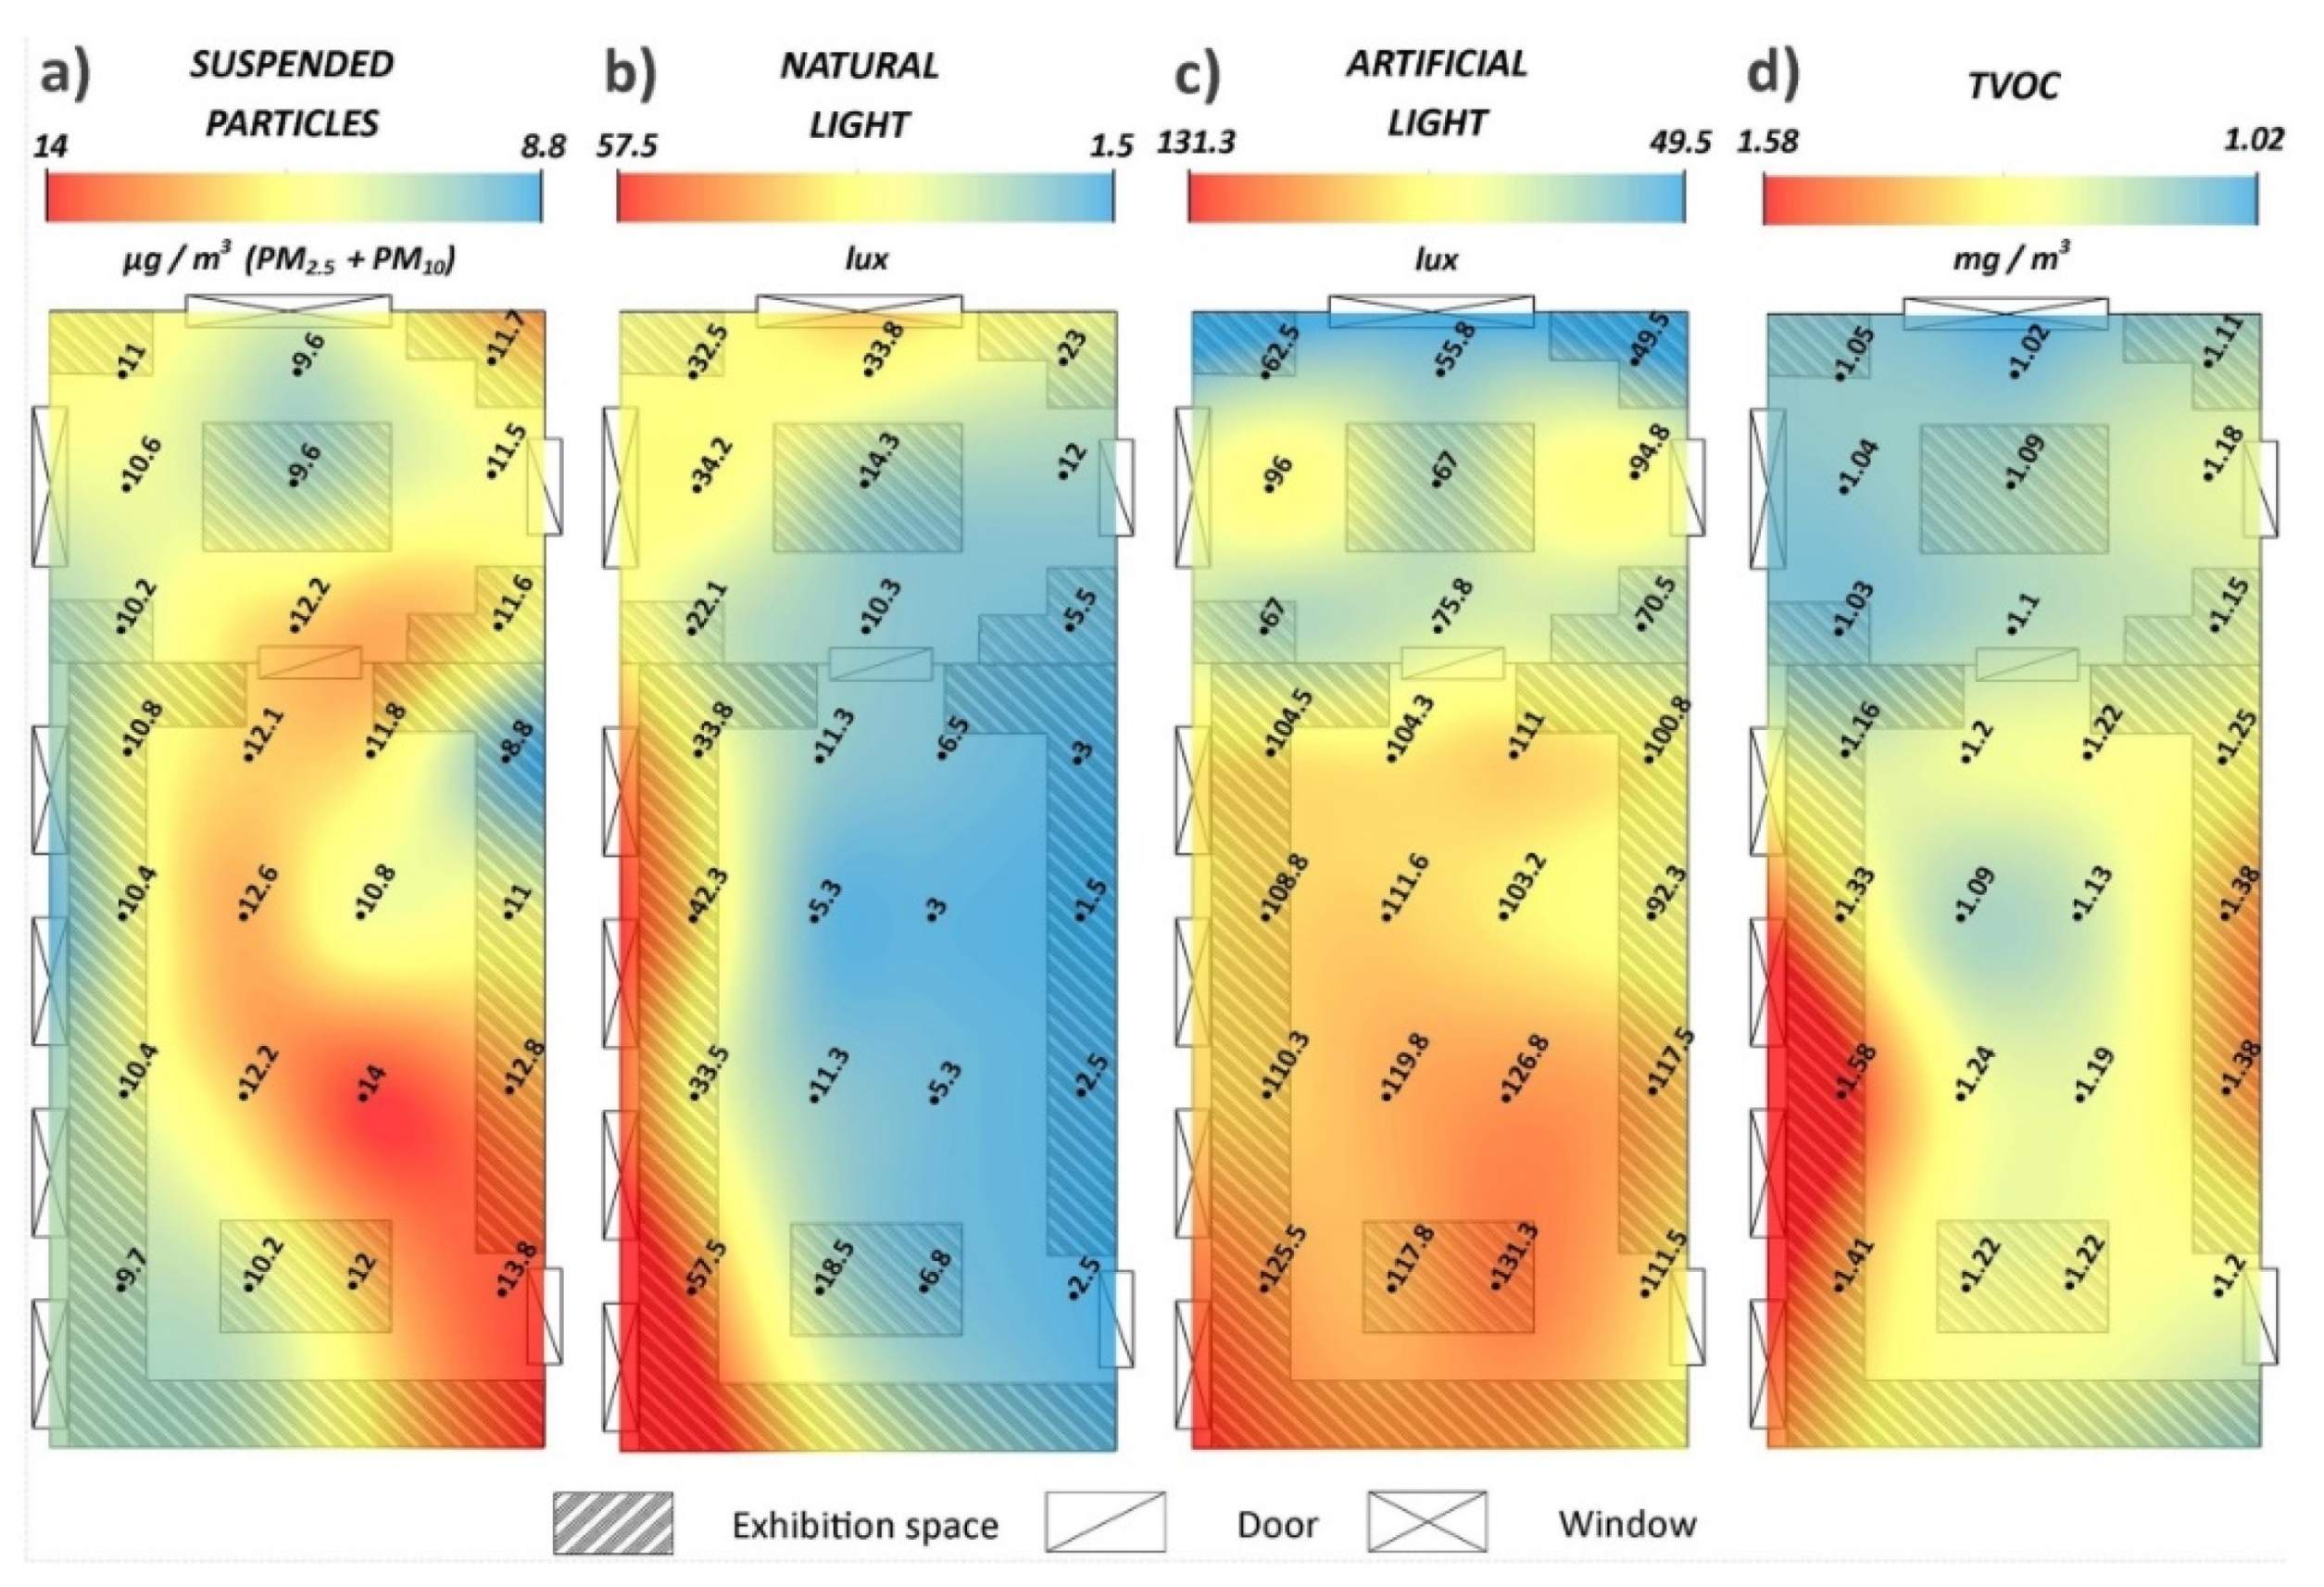
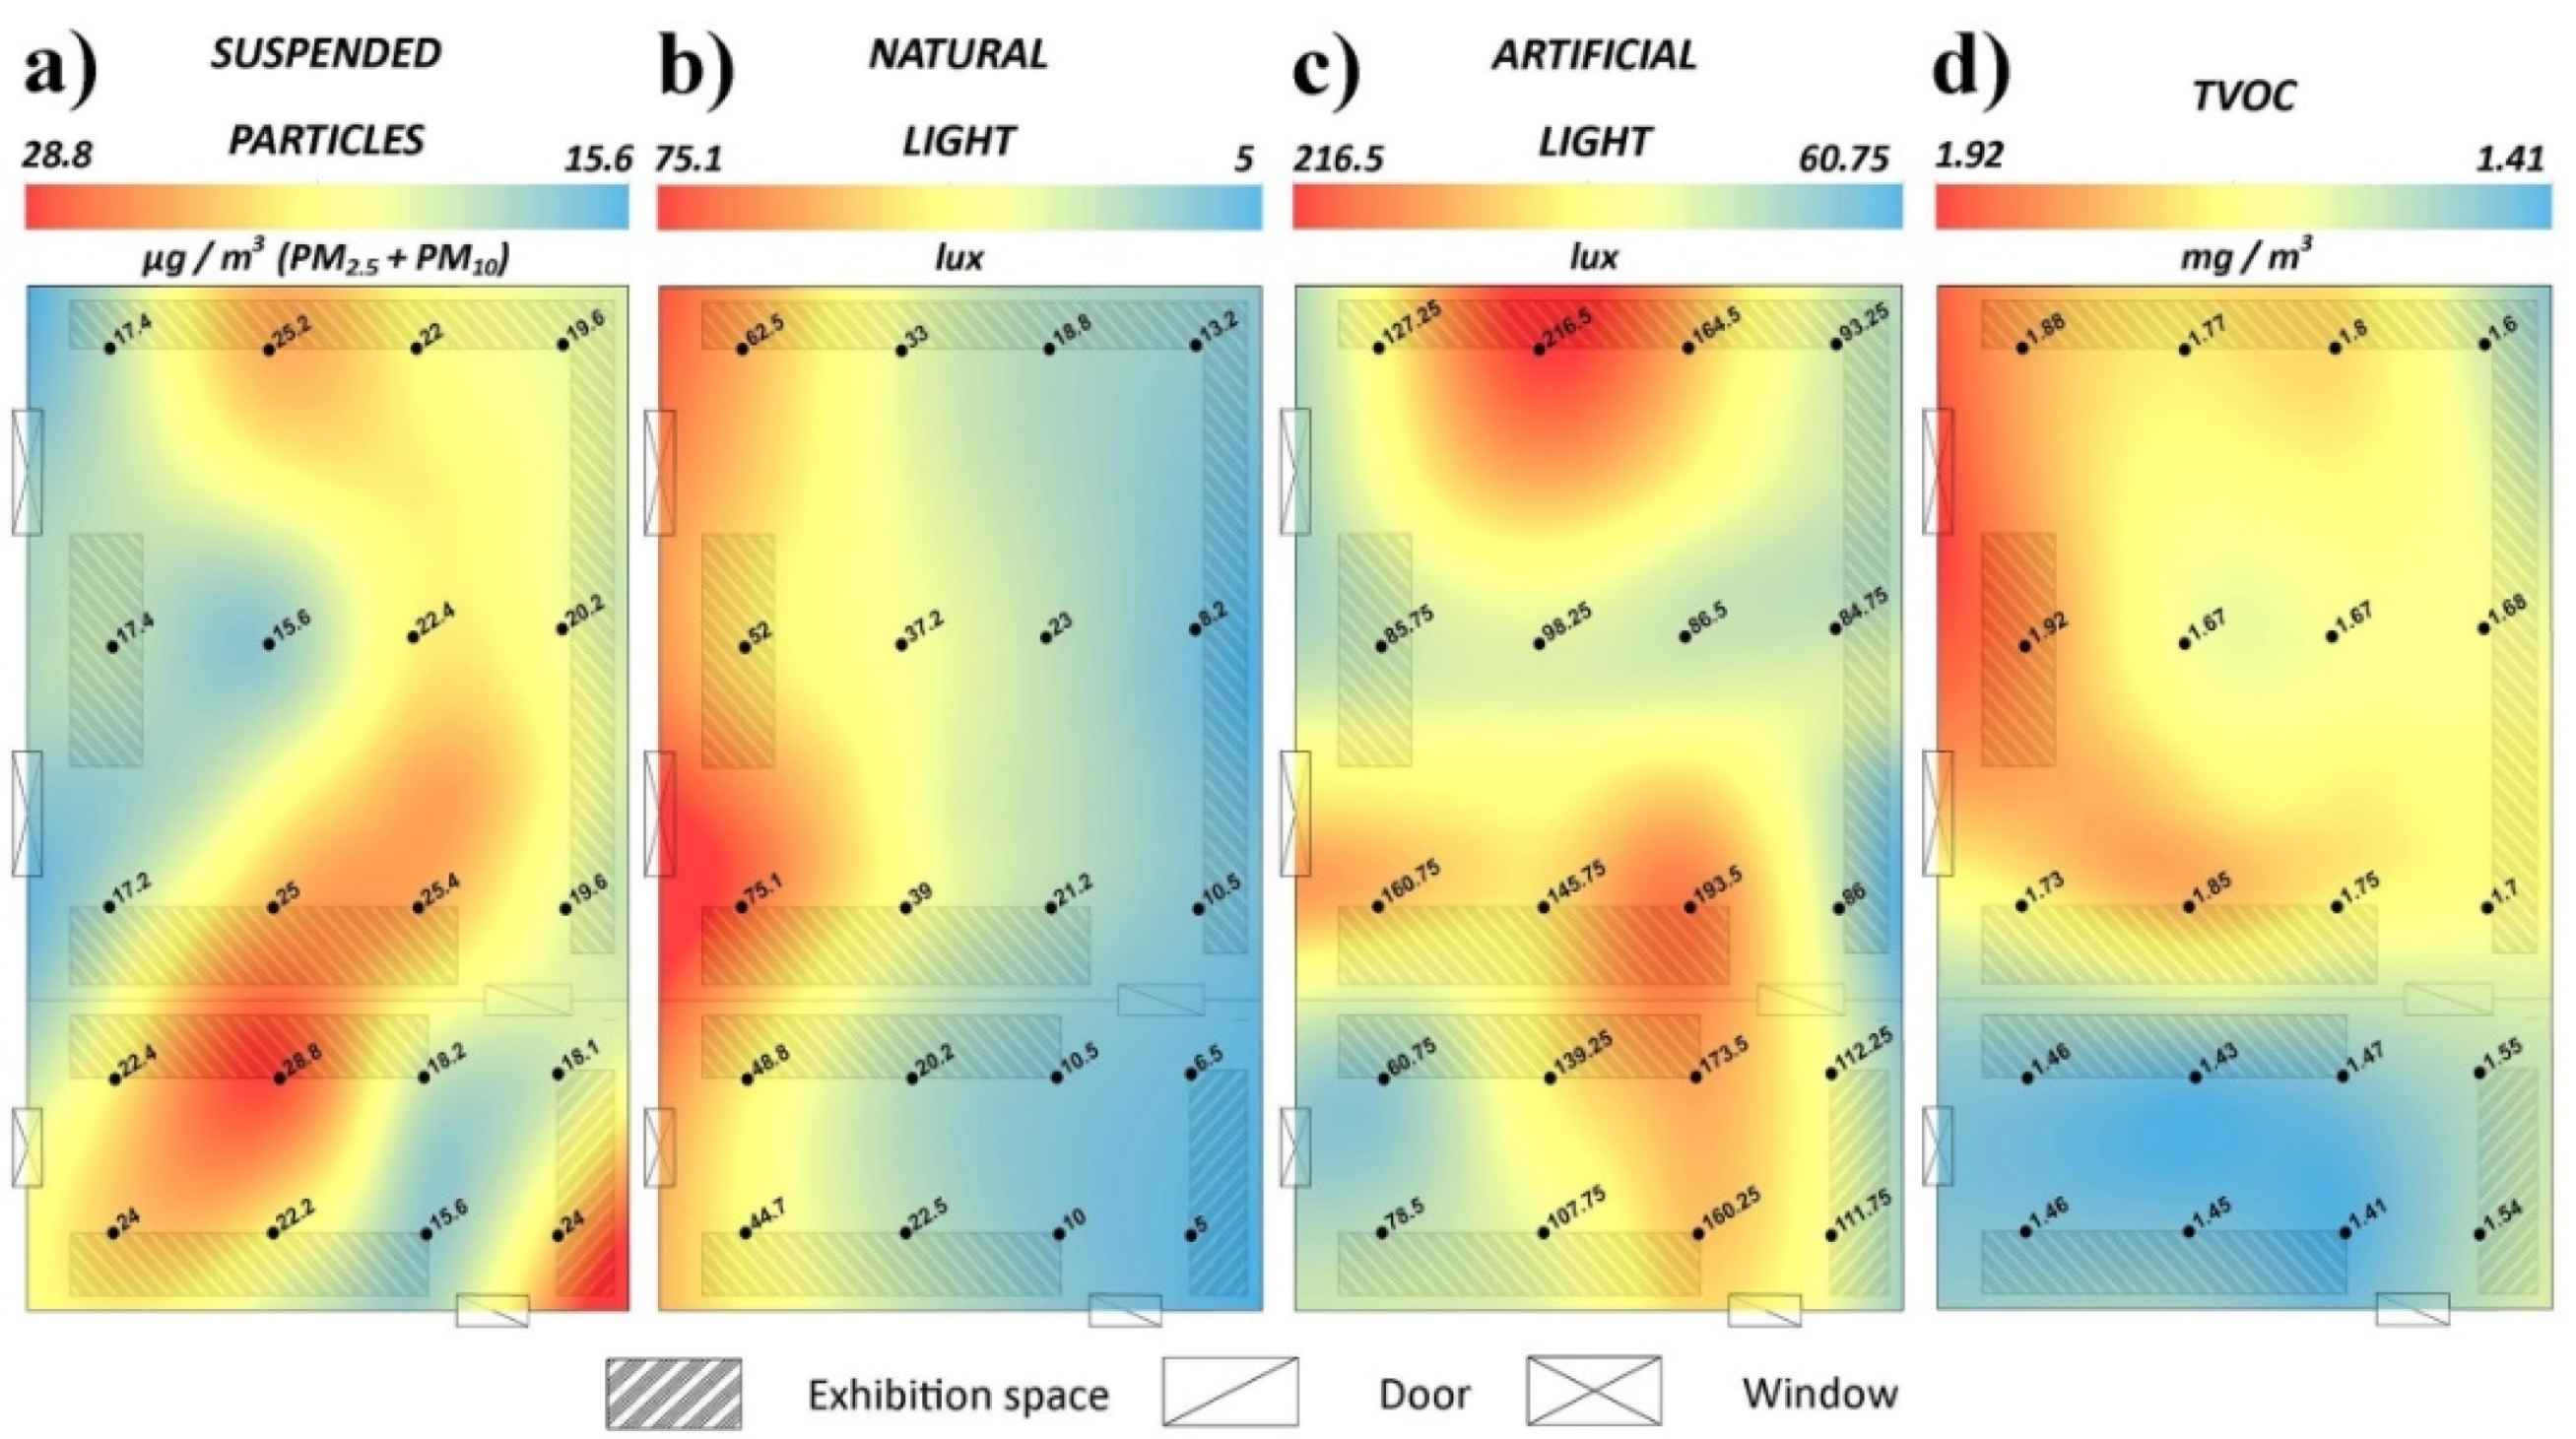
3.2. Suspended Particles, Brightness, HCHO, and TVOC

Suspended particles and dust, above a certain value, represent a real threat to the integrity both of the exhibits and human health. Therefore, these should be monitored and maintained as much as possible within a recommended range.
The threshold which, once exceeded, represents a danger to human health or to exhibits is mainly due to the nature of the particles (physical and chemical characteristics) as well as the time of exposure to a given concentration. The United States Environmental Protection Agency (EPA) divides the suspended particles into two categories according to their aerodynamics, namely: Coarse particulate matter (PM10) and fine particulate matter (PM2.5). The thresholds allowed for suspended particles to not affect human health have been set at 12 μg/m3 for the multiannual average and 35 μg/m3 for daily variations, while for the well-being of the people, the average annual concentration must not exceed 15 μg/m3 [31]. Overall, an urban environment in which the concentration of PM is maintained up to 10–15 μg/m3 is considered a very clean environment and suitable for human health as well as the integrity of exhibits [58,59].
The three areas of the Museum in Beiuș recorded during the study period an average of the suspended particles measuring 19.3 μg/m3, of which PM2.5 had a value of 7 μg/m3 and PM10 a value of 12.3 μg/m3 (Figure 7a, Figure 8a and Figure 9a). The most affected area was the warehouse, with an average of 25.8 μg/m3 (PM2.5–9.3 μg/m3; PM10–16.6 μg/m3), the minimum values being 9 μg/m3 (PM2.5–3 μg/m3; PM10–6 μg/m3) and the maximum values of 67 μg/m3 (PM2.5–22 μg/m3; PM10–45 μg/m3). The exhibition halls located in the basement deal with issues in terms of the quantity of suspended particles, the average for the entire analysed period being 21 μg/m3, with an average value for PM2.5 of 7.4 μg/m3 and PM10 of 13.7 μg/m3. The maximum values recorded here were 43 μg/m3 (PM2.5–18 μg/m3; PM10–26 μg/m3), while the minimum values do not exceed 6 μg/m3 (PM2.5–2 μg/m3; PM10–4 μg/m3). The first floor is the most appropriate area, according to the standards in force. Inside the two halls from this area, an average value for PM of only 11.1 μg/m3 was noted, average PM2.5 being 4.2 μg/m3 and average PM10 measuring 6.9 μg/m3. As for the maximum–minimum values, these were 29 μg/m3 (PM2.5–11 μg/m3; PM10–18 μg/m3) and 3 μg/m3 (PM2.5–1 μg/m3; PM10–2 μg/m3).
According to the values expressed above, the warehouse area and the exhibition area in the basement are unsuitable for human health and the conservation of the archives, while the halls on the first floor have optimal conditions.
The analysis of Figure 7a, Figure 8a and Figure 9a reveals that the distribution in space of the average values during the analysed period of time follows a pattern which is not random at all. Thus, the two exhibition areas have recorded higher values of suspended particles on the access and visit corridors of tourists, as well as in the parts where the exhibits are strongly attractive. While the warehouse has a relatively even distribution over the entire surface, showing a single negative discontinuity in the southeast corner, these results indicate that human activity (by displacing particles deposited on surfaces) is primarily responsible for the volume of suspended particles inside the museum.
For the deterioration of materials to take place, energy is needed, and light is the most powerful source of energy that acts inside museums [60]. According to international standards in force [39,40], in the case of exhibits which are receptive and fragile to light stimuli, the quantity of optical radiation must be as far as possible between 50 and 200 lux. A daily exposure to more than 200 lux can lead over time to accelerate the deterioration of materials, oxidation, increased fragility, loss of elasticity, discoloration, fading of colour, yellowing, or blackening [61].
During the study period of analysis, the three areas of the museum have registered an average amount of natural light of 57.8 lux, while the average amount of artificial light is up to 148.7 lux. These values fall perfectly within the international standards in force, but analysed individually, the three areas present certain dysfunctions.
The average amount of artificial light in the two halls on the first floor was 94.9 lux, in the basement being 124.3 lux and 227.4 lux in the warehouse. Depending on the position of the sampling points, the maximum–minimum values of artificial light ranged between 185 and 39 lux on the first floor, 300 and 48 lux in the basement, respectively, and 490 and 35 lux inside the warehouse. Artificial light is maintained in 77.7% of cases within the optimal range, an exception being the warehouse where the optimal values are found only in 52.8% of the time. Deviations are usually few and isolated in places of maximum light incidence in the immediate proximity of the location of the bulbs. At the same time, the distribution in space of artificial light (Figure 7c, Figure 8c and Figure 9c) in the rooms is also conditioned by the location of the light bulbs. The negative influence of artificial light is limited to the central area of the warehouse (Figure 9c) and the western side of the basement (Figure 8c).
Regarding natural light, the warehouse registered, during the analysed period, an average quantity of 130.3 lux, while in the exhibition halls, only 14.7 lux (first floor) and 28.5 lux (basement) were recorded. The maximum values were 408 lux (warehouse), 85 lux (first floor), and 114 lux (basement), while the minimum values were 86 lux (warehouse), 1 lux (first floor), and 4 lux (basement). Except for the warehouse where an optimal amount of light was maintained at 75% of the time, the exhibition halls registered lower values than the optimal range. In the basement, in 83.7% of cases, the amount of light was below the threshold of 50 lux, while on the first floor, the percentage was 93.2%. Low light is good for the conservation of exhibits, but can harm the visitors’ visual comfort, as it decreases the visibility of the items. According to Figure 7b, Figure 8b and Figure 9b, the exhibits located in the immediate proximity of the windows, where the values of this parameter are maximum, are those most liable to be damaged by the action of natural light stimuli.
Monitoring of some of the most exposed objects reveals that the total amount of natural light averages up to 1590.2 lux per day and up to 11,132 lux per week. The amount is quite high considering that the average per hour is 66.3 lux, and at an exposure of 12–13 h/day, the volume of natural light exceeds 132 lux. At the same time, in the interval 9:00–11:00, when the amount of light is the highest, measured values frequently exceed the limit of 200 lux imposed by the international standards in force.
Determining the total volume of total volatile organic compounds (TVOC) and formaldehyde (HCHO) inside the museum is extremely important due to the fact that they can cause negative effects on human health, even at low levels of concentration [62,63].
The World Health Organisation (WHO) in its Air quality guidelines for Europe–Second Edition [34] sets the acceptability threshold for TVOC concentration below 1 mg/m3. Any value that exceeds this indicator has potentially harmful effects on human health and exposure should only be temporary, and values above 3 mg/m3 have a strong negative effect. The Museum in Beiuș, with an average value throughout the entire analysed period of 1.33 mg/m3, is slightly above the recommended limit. However, given that human activity (both of employees, restorers, and visitors) is limited to 42 h per week, the exposure time being relatively short, the effects of TVOC on health are largely negligible. The basement has recorded the highest average value of TVOC (1.62 mg/m3), followed by the warehouse (1.23 mg/m3) and the exhibition halls at the first floor (1.15 mg/m3). The maximum values were 3.75 mg/m3 on the first floor, 2.71 mg/m3 in the basement, and 1.95 mg/m3 inside the warehouse, while the minimum values are below the limit of 1 mg/m3 (0.25 mg/m3–first floor; 0.51 mg/m3–warehouse; 0.79 mg/m3–basement).
Figure 7d, Figure 8d and Figure 9d show that the highest average TVOC concentrations are recorded in the immediate proximity of exhibition and storage spaces, as well as next to windows. This reveals that the exhibits are one of the main sources of TVOC inside the museum, and its concentration increases near windows where the temperature and humidity is usually higher than the rest of the room due to the strong influence of external factors [64].
As for formaldehyde concentration (HCHO), The Agency for Toxic Substances and Disease Registry (ATSDR), quoted by United States Environmental Protection Agency (EPA) [35], has set a minimum risk of inhalation for human health of 0.004 mg/m3. At this concentration, there is no human danger for the development of diseases, even if the exposure takes place on a daily basis.
The average of the three monitored areas within the museum in terms of HCHO was 0.0123 mg/m3. The warehouse is distinguished by an average of 0.014 mg/m3, followed by the basement with 0.012 mg/m3 and the spaces on the first floor with 0.011 mg/m3. Even if all these values exceed the allowable threshold, relatively low concentrations and low exposure times act so as the negative effects on human health, but also on the integrity of the exhibits, are reduced.

3.3. Infrared (IR) Thermography

The analysis of the average values of the temperature of the walls and their spatial distribution, highlighted the existence of significant thermal differences, both between the three rooms studied and at the level of each room. The explanation of the differences lies in a number of determining factors, including: Nature of exhibits, location of windows and doors, type and location of exhibition furniture, layout of exhibits, geometry and volume of rooms, air circulation corridors, and number of tourists and their movement patterns and directions.
The analysis of the average values of the temperature of the walls in the basement exhibition halls highlighted the existence of significant thermal differences, between 17.5 °C and 24.55 °C. The highest values were recorded on the southern wall, and the lowest on the northern wall. The analysis of the spatial distribution of the average values of the wall temperature indicates the existence of a descending thermal trend from south to north, respectively, from the ceiling to the floor (Figure 10). A similar situation, in terms of spatial distribution of average wall temperature values, was encountered in the case of main warehouse. The differences compared to the results obtained in basement exhibition halls oscillated between 21 °C and 22.9 °C.
The analysis of the spatial distribution of the average values of the temperature of the walls in the first floor exhibition halls, indicated the existence of higher values at the level of the south-east exposed walls (related to the small room), respectively, of the western wall (related to the large room). If, in the first situation, the higher average values are directly related to the exposure and the higher amount of intercepted radiation, on the one hand, and with the geometric configuration and the small volume, on the other hand, in the second situation (of the western wall of large hall) the explanation is linked to the overall configuration of the building, respectively, the corridor that doubles the exhibition hall analysed, relatively narrow corridor with large windows through the western wall of the large hall is exposed to solar radiation in the second part of the day (afternoon). The average values of the wall temperature ranged between 21.6 °C and 24.5 °C.
The analysis of the average thermal variations of the walls, at spatial level, for the three studied rooms indicates the existence of optimal conditions in the main warehouse, with a value of 1.9 °C, while the highest value was recorded in basement exhibition halls, this being 7.05 °C. First floor exhibition halls have a value of 2.9 °C.

4. Conclusions

Monitoring the environmental conditions inside of the museums is very important in order to identify the best strategies to enhance the microclimate and therefore to preserve the exhibits. The museum in Beiuș deals with issues in terms of fluctuations of the main parameters that make up the internal microclimate. Thus, the average temperature largely falls within the international quality standards, but its fluctuations are too high and create instability of items; RH is most of the time above the allowable average, the concentration of suspended particles, and HCHO and TVOC present a potential hazard to both exhibits and human health. The number of days in which temperature and RH create ideal conditions for the conservation of exhibits is relatively small (13.8%-50 days) during the analysed period. It was shown that for most days, the conditions exceeded the standards in force for both indicators. Only the brightness (both artificial and natural) indicators lack negative influence and CO2 concentration.
Given that within the rooms analysed in this study there are exhibits made of a wide variety of materials with different properties and degrees of vulnerability, the ideal conditions for their conservation are often a compromise. At the same time, a very high level of a single pollutant can lead to damage even if all other conditions are ideal and the combined action of several parameters, the values of which are non-compliant, leads to the acceleration of the damage of the exhibits.
Overall, our findings represent an alarm signal for the community and the local public administration regarding the situation in the museum. In order to improve the indoor microclimate conditions, a close collaboration between the museum representatives and the local authorities is necessary. These stakeholders should aim at identifying reactive and proactive solutions and procedures both for better preservation of exhibits and a healthier environment for employees, restorers, and visitors. Among the most necessary solutions can be specified HVAC systems and the closure of certain exhibits in suitable glass cases to communicate as little as possible with the outside environment.

Author Contributions

Conceptualization—D.C.I. and F.M.; methodology—D.C.I., T.C., G.V.H.; software—Ș.B., G.V.H., T.C.; validation—A.I., L.I., M.I.; data curation—A.A., M.C., L.B.; writing—original draft preparation—M.S., N.H., Z.B.; writing—review and editing—A.H., J.A.W., G.I.; visualization—F.M., D.C.I.; supervision—D.C.I. All authors have read and agreed to the published version of the manuscript.

Funding

This research was funded by grant PN-III-P1-1.2-PCCDI-2017-0686.

Institutional Review Board Statement

Not applicable.

Informed Consent Statement

Not applicable.

Data Availability Statement

The data presented in this study may be obtained on request from the corresponding author.

Acknowledgments

The research was possible by equal scientific involvement of all authors. The authors wish to thank to anonymous reviewer for their thoughtful suggestions and comments.

Conflicts of Interest

The authors declare no conflict of interest.

References

  1. Uring, P.; Chabas, A.; Alfaro, S. Dust deposition on textile and its evolution in indoor cultural heritage. Eur. Phys. J. Plus. 2019, 134, 225. [Google Scholar] [CrossRef]
  2. Uring, P.; Chabas, A.; Alfaro, S.; Derbez, M. Assessment of indoor air quality for a better preventive conservation of some French museums and monuments. Environ. Sci. Pollut. Res. 2020, 27, 42850–42867. [Google Scholar] [CrossRef] [PubMed]
  3. Ilieș, D.C.; Herman, G.V.; Caciora, T.; Ilieș, A.; Indrie, L.; Wendt, J.A.; Axinte, A.; Diombera, M.; Lite, C.; Berdenov, Z.; et al. Considerations Regarding the Research for the Conservation of Heritage Textiles in Romania. In Waste in Textile and Leather Sectors; Körlü, A., Ed.; IntechOpen: Rijeka, Croatia, 2020; Chapter 10; pp. 209–231. [Google Scholar] [CrossRef] [Green Version]
  4. Gysels, K.; Delalieux, F.; Deutsch, F.; Van Grieken, R.; Camuffo, D.; Bernardi, A.; Sturaro, G.; Busse, H.-J.; Wieser, M. Indoor environment and conservation in the Royal Museum of Fine Arts, Antwerp, Belgium. J. Cult. Herit. 2004, 5, 221–230. [Google Scholar] [CrossRef]
  5. Budu, A.-M.; Sandu, I. Monitoring of Pollutants in Museum Environment. Present Environ. Sustain. Dev. 2015, 9, 173–180. [Google Scholar] [CrossRef]
  6. Indrie, L.; Oana, D.; Ilieş, M.; Ilieş, D.C.; Lincu, A.; Ilieş, A.; Baias, Ș.; Herman, G.V.; Onet, A.; Costea, M.; et al. Indoor Air Quality of Museums and Conservation of Textiles Art Works. Case Study: Salacea Museum House, Romania. Ind. Text. 2019, 70, 88–93. [Google Scholar] [CrossRef]
  7. Mašková, L.; Smolík, J.; Ďurovič, M. Characterization of indoor air quality in different archives–Possible implications for books and manuscripts. Build. Environ. 2017, 120, 77–84. [Google Scholar] [CrossRef]
  8. Hu, T.; Jia, W.; Cao, J.; Huang, R.; Li, H.; Liu, S.; Ma, T.; Zhu, Y. Indoor air quality at five site museums of Yangtze River civilization. Atmos. Environ. 2015, 123, 449–454. [Google Scholar] [CrossRef]
  9. Litti, G.; Audenaert, A.; Fabbri, K. Indoor Microclimate Quality (IMQ) certification in heritage and museum buildings: The case study of Vleeshuis museum in Antwerp. Build. Environ. 2017, 124, 478–491. [Google Scholar] [CrossRef]
  10. Chianese, E.; Riccio, A.; Duro, I.; Trifuoggi, M.; Iovino, P.; Capasso, S.; Barone, G. Measurements for Indoor Air Quality Assessment at the Capodimonte Museum in Naples (Italy). Int. J. Environ. Res. 2021, 6, 509–518. [Google Scholar]
  11. Godoi, R.H.M.; Carneiro, B.H.B.; Paralovo, S.L.; Campos, V.P.; Tavares, T.M.; Evangelista, H.; Van Grieken, R.; Godoi, A.F.L. Indoor air quality of a museum in a subtropical climate: The Oscar Niemeyer museum in Curitiba, Brazil. Sci. Total Environ. 2013, 452–453, 314–320. [Google Scholar] [CrossRef] [PubMed] [Green Version]
  12. Sofia, D.; Gioiella, F.; Lotrecchiano, N.; Giuliano, A. Mitigation strategies for reducing air pollution. Environ. Sci. Pollut. Res. Int. 2020, 27, 19226–19235. [Google Scholar] [CrossRef] [PubMed]
  13. Lotrecchianoa, N.; Sofiaa, D.; Giulianoa, A.; Barlettaa, D.; Polettoa, M. Real-time on-road monitoring network of air quality. Chem. Eng. Trans. 2019, 74, 241–246. [Google Scholar] [CrossRef]
  14. Zorpas, A.A.; Skouroupatis, A. Indoor air quality evaluation of two museums in a subtropical climate conditions. Sustain. Cities Soc. 2016, 20, 52–60. [Google Scholar] [CrossRef]
  15. Schieweck, A.; Lohrengel, B.; Siwinski, N.; Genning, C.; Salthammer, T. Organic and inorganic pollutants in storage rooms of the Lower Saxony State Museum Hanover, Germany. Atmos. Environ. 2005, 39, 6098–6108. [Google Scholar] [CrossRef]
  16. Bucur, E.; Danet, A.F.; Lehr, C.B.; Lehr, E.; Nita-Lazar, M. Binary logistic regression—Instrument for assessing museum indoor air impact on exhibits. J. Air Waste Manag. Assoc. 2017, 67, 391–401. [Google Scholar] [CrossRef] [Green Version]
  17. Ilieș, D.C.; Oneț, A.; Herman, G.V.; Indrie, L.; Ilieș, A.; Burtă, L.; Gaceu, O.; Marcu, F.; Baias, Ș.; Caciora, T.; et al. Exploring the indoor environment of heritage buildings and its role in the conservation of valuable objects. Environ. Eng. Manag. J. 2019, 18, 2579–2586. [Google Scholar] [CrossRef]
  18. Grøntoft, T.; Marincas, O. Indoor Air Pollution Impact on Cultural Heritage in an Urban and a Rural Location in Romania: The National Military Museum in Bucharest and the Tismana Monastery in Gorj County. Herit. Sci. 2018, 6, 73. [Google Scholar] [CrossRef]
  19. Schito, E.; Testi, D.; Grassi, W. A Proposal for New Microclimate Indexes for the Evaluation of Indoor Air Quality in Museums. Buildings 2016, 6, 41. [Google Scholar] [CrossRef]
  20. Kim, K.-H.; Kabir, E.; Kabir, S. A review on the human health impact of airborne particulate matter. Environ. Int. 2015, 74, 136–143. [Google Scholar] [CrossRef]
  21. Wallace, L. Indoor Particles: A Review. Journal of the Air & Waste Management Association. J. Air Waste Manag. Assoc. 1996, 46, 98–126. [Google Scholar] [CrossRef] [PubMed]
  22. Baroja, O.; Rodríguez, E.; Gomez de Balugera, Z.; Goicolea, A.; Unceta, N.; Sampedro, C.; Alonso, A.; Barrio, R.J. Speciation of Volatile Aromatic and Chlorinated Hydrocarbons in an Urban Atmosphere Using TCT-GC/MS. J. Environ. Sci. Health 2005, 40, 343–367. [Google Scholar] [CrossRef]
  23. Hatchfiels, P.B. Pollutants in the Museum Environment; Archetype Publications Ltd.: London, UK, 2002. [Google Scholar]
  24. Reddy, M.K.; Suneela, M.; Sumathi, M.; Reddy, R.C. Indoor Air Quality at Salarjung Museum, Hyderabad, India. Environ. Monit. Assess. 2005, 105, 359–367. [Google Scholar] [CrossRef]
  25. Abdul-Wahab, S.A.; Salem, N.; Ali, S. Evaluation of indoor air quality in a museum (Bait Al Zubair) and residential homes. Indoor Built Environ. 2015, 24, 244–255. [Google Scholar] [CrossRef]
  26. Klein, L.; Bermudez, S.; Schrott, A.; Tsukada, M.; Dionisi-Vici, P.; Kargere, L.; Marianno, F.; Hamann, H.F.; Lopez, V.; Leona, M. Wireless Sensor Platform for Cultural Heritage Monitoring and Modeling System. Sensors 2017, 17, 1998. [Google Scholar] [CrossRef] [Green Version]
  27. Iwata, T.; Masahiro, H.; Hiroyasu, T. Field investigations on IAQ in museums and examination of methods for monitoring: Pilot Study for Air Quality Guidelines in Museums Part 1. J. Archit. Plan. 2001, 66, 55–62. [Google Scholar] [CrossRef] [Green Version]
  28. Ryhl-Svendsen, M. Indoor air pollution in museums: Prediction models and control strategies. Stud. Conserv. 2006, 51 (Suppl. 1), 27–41. [Google Scholar] [CrossRef]
  29. ANSI/ASHRAE Standard 62.1-2013, Ventilation for Acceptable Indoor Air Quality; American Society of Heating, Refrigerating and Air-Conditioning Engineers: Atlanta, GA, USA, 2013; Available online: http://myiaire.com/product-docs/ultraDRY/ASHRAE62.1.pdf (accessed on 1 February 2021).
  30. ANSI/ASHRAE Standard 62.1-2010, Ventilation for Acceptable Indoor Air Quality; American Society of Heating, Refrigerating and Air-Conditioning Engineers: Atlanta, GA, USA, 2010; Available online: https://www.ashrae.org/file%20library/doclib/public /200418145036_347.pdf (accessed on 28 December 2020).
  31. EPA Standard. The National Ambient Air Quality Standards for Particulate Matter-Epa Retains Air Quality Standards for Particle Pollution (Particulate Matter): Fact Sheet. 2020. Available online: https://www.epa.gov/sites/production/files/2020-04/documents/fact_sheet_pm_naaqs_proposal.pdf (accessed on 28 December 2020).
  32. World Health Organization. Health Effects of Particulate Matter. In Policy Implications for Countries in Eastern Europe, Cucasus and Central Asia; WHO Regional Office for Europe: Conpenhagen, Denmark, 2013. [Google Scholar]
  33. European Commission Air Quality Standards. 2008. Available online: https://ec.europa.eu/environment/air/quality/standards.htm (accessed on 1 February 2021).
  34. Air Quality Guidelines for Europe, 2nd ed.; World Health Organization—WHO: Copenhagen, Denmark, 2000.
  35. EPA Standard, Health Effects Notebook for Hazardous Air Pollutants, Formaldehyde–CAS 50-00-0. Available online: https://www.epa.gov/sites/production/files/2016-09/documents/formaldehyde.pdf (accessed on 28 December 2020).
  36. Chapter 23: Museums, Galleries, Archives and Libraries. In ASHRAE Handbook–HVAC Applications; SI (Ed.) ASHRAE Research: Atalanta, GA, USA, 2011; pp. 1–23. [Google Scholar]
  37. Blaszczok, M.; Kaczmarczyk, J.; Ferdyn-Grygierek, J. Microclimate (Indoor Air Quality) in Museum Buildings in Poland. In Proceedings of the 10th Rehva World Congress, Antalya, Turkey, 9–12 May 2010. [Google Scholar]
  38. Christensen, C. Environmental standards: Looking beyond flat lining? AIC Newsl. 1995, 20, 1–8. [Google Scholar]
  39. Commission Internationale de L’Eclairage. Control of Damage to Museum Objects by Optical Radiation; Commission Internationale de L’Eclairage: Wien, Austria, 2004. [Google Scholar]
  40. British Standards Institution. Light and Lighting e Lighting of Work Places e Part 1: Indoor Work Places; British Standards Institution: Brussels, Belgium, 2011; English Version EN 12464-1. [Google Scholar]
  41. Bacci, M.; Cucci, C.; Mencaglia, A.A.; Mignani, A.G. Innovative Sensors for Environmental Monitoring in Museums. Sensors 2008, 8, 1984–2005. [Google Scholar] [CrossRef] [Green Version]
  42. Ferdyn-Grygierek, J.; Kaczmarczyk, J.; Blaszczok, M.; Lubina, P.; Koper, P.; Bulińska, A. Hygrothermal Risk in Museum Buildings Located in Moderate Climate. Energies 2020, 13, 344. [Google Scholar] [CrossRef] [Green Version]
  43. Lucchi, E. Multidisciplinary risk-based analysis for supporting the decision making process on conservation, energy efficiency, and human comfort in museum buildings. J. Cult. Herit. 2016, 22, 1079–1089. [Google Scholar] [CrossRef]
  44. Sharif-Askari, H.; Abu-Hijleh, B. Review of museums’ indoor environment conditions studies and guidelines and their impact on the museums’ artifacts and energy consumption. Build. Environ. 2018, 143, 186–195. [Google Scholar] [CrossRef]
  45. Ferdyn-Grygierek, J.; Baranowski, A. Numerical analysis of heat and moisture gains in ancient and modern museum auditoriums. In Proceedings of the 10th Rehva World Congress, Antalya, Turkey, 9–12 May 2010. [Google Scholar]
  46. Nakielska, M.; Pawłowski, K. Conditions of the Internal Microclimate in the Museum. J. Ecol. Eng. 2020, 21, 205–209. [Google Scholar] [CrossRef]
  47. Georgescu, M.S.; Ochinciuc, C.V.; Georgescu, E.S.; Colda, I. Heritage and Climate Changes in Romania: The St. Nicholas Church of Densus, from Degradation to Restoration. Energy Procedia 2017, 133, 76–85. [Google Scholar] [CrossRef]
  48. Deac, L.A.; Gozner, M.; Sambou, A. Ethnographic museums in the rural areas of Crișana region, Romania–keepers of local heritage, tradition and lifestyle. Geoj. Tour. Geosites 2019, 27, 1251–1260. [Google Scholar] [CrossRef]
  49. Dejeu, P.; Ilies, D.C.; Herman, G.V.; Caciora, T.; Ilies, M.; Albu, A.; Burta, L.; Berdenov, Z.; Hodor, N.; Baias, S.; et al. Microbiological Investigations in Museal Environment. Notulae Botanicae Horti Agrobotanici Cluj-Napoca 2021. in print. [Google Scholar]
  50. Borrego, S.; Molina, A. Fungal Assessment on Storerooms Indoor Environment in the National Museum of Fine Arts, Cuba. Air Qual. Atmos. Health 2019, 12, 1373–1385. [Google Scholar] [CrossRef]
  51. Pinheiro, A.C.; Sequeira, S.O.; Macedo, M.F. Fungi in archives, libraries, and museums: A review on paper conservation and human health. Crit. Rev. Microbiol. 2019, 45, 1–15. [Google Scholar] [CrossRef]
  52. Vescia, N.; Brenier-Pinchart, M.P.; Osborn, J.F.; Cerquetani, F.; Cavarischia, R.; Grillot, R.; D’Alessandro, D. Field validation of a dusting cloth for mycological surveillance of surfaces. Am. J. Infect. Control. 2011, 39, 156–158. [Google Scholar] [CrossRef] [PubMed] [Green Version]
  53. Hu, Y.; Zhang, J.; Li, X.; Yang, Y.; Zhang, Y.; Ma, J.; Xi, L. Penicillium marneffei Infection: An Emerging Disease in Mainland China. Mycopathologia 2013, 175, 57–67. [Google Scholar] [CrossRef]
  54. Sandoval-Denis, M.; Sutton, D.A.; Martin-Vicente, A.; Cano-Lira, J.F.; Wiederhold, N.; Guarro, J.; Gené, J. Cladosporium Species Recovered from Clinical Samples in the United States. J. Clin. Microbiol. 2015, 53, 2990–3000. [Google Scholar] [CrossRef] [Green Version]
  55. ASHRAE. Section 9.0: Building Applications. In ASHRAE Handbook–HVAC Applications; SI, Ed.; ASHRAE Research: Atalanta, GA, USA, 2019. [Google Scholar]
  56. European Committee For Standardization. Norm: Conservation of Cultural Property—Specifications for Temperature and Relative Humidity to Limit Climate-Induced Mechanical Damage in Organic Hygroscopic Materials; European Committee For Standardization: Brussels, Belgium, 2008. [Google Scholar]
  57. Satish, U.; Mendell, M.J.; Shekhar, K.; Hotchi, T.; Sullivan, D.; Streufert, S.; Fisk, W. Is CO2 an Indoor Pollutant? Direct Effects of Low-to-Moderate CO2 Concentrations on Human Decision-Making Performance. Environ. Health Perspect. 2012, 120, 1671–1677. [Google Scholar] [CrossRef] [PubMed] [Green Version]
  58. Hinds, W.C. Aerosol Technology: Properties, Behavior, and Measurement of Airborne Particles; John Wiley & Sons: Hoboken, NJ, USA, 1999. [Google Scholar]
  59. Estokova, A.; Stevulov, N. Investigation of Suspended and Settled Particulate Matter in Indoor Air. In Atmospheric Aerosols-Regional Characteristics–Chemistry and Physics; Abdul-Razzak, H., Ed.; IntechOpen: Rijeka, Croatia, 2012; Chapter 18; pp. 455–480. [Google Scholar] [CrossRef] [Green Version]
  60. Pavlogeorgatos, G. Environmental parameters in museums. Build. Environ. 2003, 38, 1457–1462. [Google Scholar] [CrossRef]
  61. De Graaf, T.; Dessouky, M.; Müller, H.F.O. Sustainable lighting of museum buildings. Renew. Energy 2014, 67, 30–34. [Google Scholar] [CrossRef]
  62. Sánchez, B.; de Oliveira Souza, M.; Vilanova, O.; Canela, M.C. Volatile organic compounds in the Spanish National Archaeological Museum: Four years of chemometric analysis. Build. Environ. 2020, 174, 106780. [Google Scholar] [CrossRef]
  63. Schieweck, A.; Salthammer, T. Indoor air quality in passive-type museum showcases. J. Cult. Herit. 2011, 12, 205–213. [Google Scholar] [CrossRef]
  64. Zhou, C.; Zhan, Y.; Chen, S.; Xia, M.; Ronda, C.; Sun, M.; Chen, H.; Shen, X. Combined effects of temperature and humidity on indoor VOCs pollution: Intercity comparison. Build. Environ. 2017, 121, 26–34. [Google Scholar] [CrossRef]
Figure 1. Location of Beiuș Municipal Museum in Romania and Bihor County.
Atmosphere 12 00286 g001
Figure 2. Degree of fungal contamination in the air of the analysed rooms (processing after Ilieș et al. [49]).
Atmosphere 12 00286 g002
Figure 3. Distribution of sensors in the studied museum halls.
Atmosphere 12 00286 g003
Figure 4. Fluctuations in terms of minimum, maximum, and average values per week for temperature and RH in the three monitored halls.
Atmosphere 12 00286 g004
Figure 5. Outside fluctuations of temperature and relative humidity (RH) in terms of average values per week and minimum-maximum values/day/week.
Atmosphere 12 00286 g005
Figure 6. Graphical representation of CO2 amount variations per week.
Atmosphere 12 00286 g006
Figure 7. Distribution in space of average values for suspended particles, brightness, and total volatile organic compounds (TVOC) (ad) throughout the entire period of measurements performed inside the exhibition halls located on the first floor.
Atmosphere 12 00286 g007
Figure 8. Distribution in space of average values for suspended particles, brightness, and TVOC (ad) throughout the entire period of measurements performed inside the exhibition halls located in the basement.
Atmosphere 12 00286 g008
Figure 9. Distribution in space of average values for suspended particles, brightness, and TVOC (ad) throughout the entire period of measurements performed in the warehouse.
Atmosphere 12 00286 g009
Figure 10. Distribution in space of temperature average values at the level of the walls of the analysed halls.
Atmosphere 12 00286 g010
Table 1. International standards in terms of indicators analysed, both for human health and for the integrity of exhibits.
RecommentationsTemperature [R]RH [R]CO2 [R]PM [R]Brightness [R]TVOC [R]HCHO [R]
°C-MA%-MAppm-IV(μg/m3)-MALux-IV(mg/m3)-IV(mg/m3)-IV
Human healthN/AN/A<1000 [29]
<1000 [30]
<15 [31]
<10 PM2.5 [32]
<25 PM2.5 [33]
<20 PM10 [32]
<40 PM10 [33]
N/A<1 [34]<0.004 [35]
Application in museums20 (±1–2) [36,37]
21(±2) [38]
50 (±3) [36,37]
45 (±8) [38]
N/AN/A50–200 [39,40,41]N/AN/A
15–25 [42,43,44,45]40–65 [42,43,44,45]
Individual recomandation depending on the nature of the exhibitsWood19–24 [46]
14–18 [37]
40–65 [46]
55 (±5%) [37]
N/AN/A50–200 [39,40,41]N/AN/A
Paper19–24 [46]
14–18 [37]
50–60 [46]
50–65 [37]
Ethnographic materials19–24 [46]40–60 [46]
Iron armourN/A<40 [46]
LeatherN/A50–60 [46]
Fur and leather15–21 [46]45–60 [46]
CeramicsN/A20–60 [46]
[R]-Bibliography reference; MA-Multiannual average; IV-Individual value.
Table 2. The quality of indoor microclimate expressed by the number of days in which the temperature and RH have recorded ideal/acceptable/not recommended values according to the standards in force (T-1, RH-1—days when only temperature or RH have recorded ideal values; T-2, RH-2—days when only temperature or RH have recorded acceptable values; T-3, RH-3—days when only temperature or RH have recorded not recommended values; T+RH-1—days when both temperature and RH have recorded ideal values; T+RH-2—days when both temperature and RH have recorded acceptable values; T+RH-3—days when both temperature and RH have recorded not recommended values; T1+RH2, T2+RH1—days when ideal situations at an indicator mixed with the acceptable ones at the other indicator).
HallIdeal ConditionsAcceptable ConditionsUnrecommended ConditionsAcceptable
Conditions
(Indicative-1)(Indicative-2)(Indicative-3)
T1RH1T1+RH1T2RH2T2+RH2T3RH3T3+RH3T1+RH2T2+RH1
Main WarehouseNo. of days11001440245104105
%0.99.7013.638.81.943.79.739.904.8
Basement Exhibition HallsNo. of days4221481428822880
%32.61.60.837.210.91.66.263.521.66.20
First Floor Exhibition HallsNo. of days217610391840253462
%16.35.44.77.830.2143119.426.34.71.6
Publisher’s Note: MDPI stays neutral with regard to jurisdictional claims in published maps and institutional affiliations.

