Review

Drought in South Asia: A Review of Drought Assessment and Prediction in South Asian Countries

by
Sewwandhi S.K. Chandrasekara
1,2,
Hyun-Han Kwon
2,*,
Meththika Vithanage
3,
Jayantha Obeysekera
4 and
Tae-Woong Kim
5
1
Department of Agricultural Engineering, Faculty of Agriculture, University of Peradeniya, Peradeniya 20400, Sri Lanka
2
Department of Civil and Environmental Engineering, Sejong University, Seoul 05006, Korea
3
Ecosphere Resilience Research Center, Faculty of Applied Sciences, University of Sri Jayewardenepura, Nugegoda 10250, Sri Lanka
4
Sea Level Solutions Center, Florida International University, Miami, FL 33199, USA
5
Department of Civil and Environmental Engineering, Hanyang University, Ansan 15588, Korea
*
Author to whom correspondence should be addressed.
Submission received: 5 February 2021 / Revised: 25 February 2021 / Accepted: 8 March 2021 / Published: 11 March 2021
(This article belongs to the Section Climatology)

Abstract

:
South Asian countries have been experiencing frequent drought incidents recently, and due to this reason, many scientific studies have been carried out to explore drought in South Asia. In this context, we review scientific studies related to drought in South Asia. The study initially identifies the importance of drought-related studies and discusses drought types for South Asian regions. The representative examples of drought events, severity, frequency, and duration in South Asian countries are identified. The Standardized Precipitation Index (SPI) was mostly adopted in South Asian countries to quantify and monitor droughts. Nevertheless, the absence of drought quantification studies in Bhutan and the Maldives is of great concern. Future studies to generate a combined drought severity map for the South Asian region are required. Moreover, the drought prediction and projection in the regions is rarely studied. Furthermore, the teleconnection between drought and large-scale atmospheric circulations in the South Asia has not been discussed in detail in most of the scientific literature. Therefore, as a take-home message, there is an urgent need for scientific studies related to drought quantification for some regions in South Asia, prediction and projection of drought for an individual country (or as a region), and drought teleconnection to atmospheric circulation.

1. Introduction

In today’s context, extreme events entice both the public and scientific attention because of their trends on changes in intensity and frequency, anthropogenic influences, and severe physical damages. Among different extreme events, droughts receive attention due to their influences on crop production and social and economic factors. The first study on drought was reported by Davy [1]. However, interest in drought is evident based on the rapidly increasing number of publications starting in the 1970s. Mirza [2] indicated that flood and drought are more frequent than other natural disasters (i.e., cyclones, earthquakes, landslides, and tsunamis) in South Asia. A comprehensive review by Naveendrakumar et al. [3] on extreme events in South Asia concluded that droughts have become more notable in South Asia during the recent decades.
The previous studies mainly enclosed extreme rainfall, temperature, and heatwave events, but research focused on drought in South Asia is relatively limited. Therefore, it is timely to review historical drought events in each country and drought monitoring and assessment approaches in the South Asian region. Furthermore, this review discusses the aspects of teleconnections on drought and drought monitoring, forecasting, and future projection in the region together with future perspectives related to drought in the South Asian context.

2. Definitions, Types, and Indices

2.1. Definitions of Drought

Palmer [4] compiled drought definitions by many authors (e.g., [5,6,7,8,9,10,11]) and proposed a definition that drought is a phenomenon that depends on the effects of relatively prolonged and abnormal moisture deficiency. However, various definitions of drought existed in the early 1980s based on differences in region, needs, and disciplinary approach.
Wilhite and Glantz [12] provide two classes for drought definitions: (a) conceptual definitions and (b) operational definitions. The concepts of the droughts are mostly covered by conceptual definitions. On the other hand, the operational drought defines the details on the duration, severity of droughts, and how drought can develop. The generalized definition for drought can be a natural, rare, random phenomenon observed in almost all climatic zones with spatially varying characteristics caused due to deficiency in precipitation and can exist for either short-term or more extended periods. Eventually, drought is causing severe hydrological imbalances in different segments of the hydrological cycle and leads to negative impacts over the land resources production system [13,14].
Furthermore, a coupled atmosphere–ocean system directly (or indirectly) controls precipitation and temperature and can cause drought. For instance, rainfall and temperature anomalies are closely related to the El-Nino Southern Oscillation (ENSO) that is fundamentally driven by changes in the coupled atmosphere–ocean system and leads to various disasters, including droughts and floods [15]. The other variables that affect drought include sea surface temperature (SST) and pressure, deforestation, level of CO2, and levels of other greenhouse gases [16].

2.2. Types of Drought

Wilhite and Glantz [12] proposed four categories to measure droughts: (a) meteorological drought due to precipitation shortage (degree of dryness) over a certain period for a specific region, (b) hydrological drought due to the presence of below-average surface and subsurface flow for a longer time duration that accelerates inadequate water supply, (c) agricultural drought due to low soil water availability to support agricultural growth, and (d) socio-economic drought, which defines the imbalances in supply and demand of drought-dependent socio-economic commodities. Moreover, recent studies proposed an “ecological drought”, which is described as an extended and widespread shortage of water availability in ecosystems, leading to ecological stresses [17,18]. In addition, a novel drought type called “flash drought” has been introduced into scientific research. According to the proposed definition by Otkin et al. [19], the mentioned drought type is a subdivision of all droughts that is distinguished solely based on its rapid rate of intensification due to abnormal evapotranspiration. However, the definition excludes short periods of abnormal conditions that do not lead to drought impacts.

2.3. Drought Indices

The assessment and monitoring of drought using drought indices are more appropriate than the direct use of hydro-meteorological indicators. More specifically, indicators are hydro-meteorological variables used to define drought situation such as rainfall and temperature. On the other hand, drought indices are obtained by numerically using hydro-meteorological inputs and the drought indicators. The indices intend to estimate the drought state (i.e., severity, spatio-temporal attributes of drought events) for a certain period [20]. The drought quantification can be conducted using (a) an individual index, (b) multiple indices, and (c) a composite index.
The World Meteorological Organization and Global Water Partnership [20] summarized and provided 50 indices used practically and theoretically in many drought studies. Table 1 shows the frequently used drought indices in South Asia. These indicators and indices can be categorized based on the variables used and grouped into (a) hydro-meteorology, (b) soil water, (c) remote sensing, and (d) composite or modeled. Recently, Woldeyohannes et al. [21] concluded that each index could be considered to identify different drought types where prior knowledge of the index is crucial.

3. Overview of Drought in South Asian Countries

3.1. Drought Occurrence and Frequency in the Region

Unlike other natural disasters, drought develops gradually over a prolonged period and is not visible until a critical level of rainfall shortage. The most common droughts observed in South Asian countries are due to the variability of amount (i.e., less or absence), onset, and the distribution pattern of rainfall during the primary monsoon season [25,26,27,28,29,30,31]. Apart from the rainfall characteristics, high heat stress, which would cause high evaporation, was also identified as a reason for drought in Bangladesh and Sri Lanka [25,30]. Furthermore, Raghib and Rahman [32] demonstrated that the processes involved in soil erosion could aggravate the drought conditions in Bangladesh. Moreover, the poor soil texture (i.e., low water-holding capacity, high permeability, and infiltration), which percolates more available water at surfaces into deep layers, causes drought in Afghanistan. The persistence of strong wind over inadequate vegetative cover caused drought, such as the annual drought from April to August in Afghanistan.
Each country identified different drought years based on the characteristics of the droughts they experienced. Muhammad et al. [33] reported extremely severe droughts during 1971 and 2001 in Afghanistan. Furthermore, Privara and Privarova [34] stated that the period of 1998–2006 was the longest and utmost drought observed during the last five decades in Afghanistan. The Asian Development Bank (ADB) elaborated that localized droughts have 3 to 5 years of recurrence interval, and on the other hand, spatially extended droughts occur in every decadal interval. Nevertheless, Afghanistan is prone to the nationwide drought every 2–3 decades [33], according to the ADB as cited in [35,36].
Zimmermann et al. [37] revealed that the frequency and intensity of droughts in recent years had been raised in Bangladesh. Interestingly, many studies identified that many droughts persisted over 2.5 years and 5 years in Bangladesh, but there was not any specific return period for their occurrence [38,39,40,41]. Abedin et al. [42] and Raghib and Rahman [32] identified that the shortest duration of drought was observed annually from November to May in Chittagong Hill tracts. Furthermore, extreme droughts have been observed in 1961, 1975, 1981, 1982, 1984, 1989, 1994, and 2000.
All of India is prone to drought except for the eastern regions; the western arid regions of India experience frequent droughts [43]. Shewale and Kumar [44] explained that the Indian Meteorological Department (IMD) analyzed the drought over India and identified that drought became more frequent and severe since 1965. During that period, droughts observed in 1972, 1987, 2002, and 2009 were classified as “severe droughts”, and droughts observed in 1965, 1966, 1974, 1979, 1982, 1985, 2000, and 2012 were classified as “moderate droughts”. Joshi et al. [45] concluded that drought increased remarkably in northeast and central India.
Pakistan frequently experiences droughts. Central-eastern, southwestern, southern, and some scattered south coastal regions are most vulnerable to severe droughts, mainly during winter and dry–wet periods due to the enhanced climate variability in these areas [46]. The severe droughts were observed in 1899, 1920, and 1935 for Punjab province, in 1902 and 1951 for the North-West Frontier Province of Pakistan, in 1871, 1881, 1899, 1931, 1947, and 1999 for the Sindh region, and a nationwide drought was observed from 1999 to 2002 [47]. The 1998–2004 drought severely affected almost 50% of Pakistan’s districts and over 15 million of the most impoverished civilians in the country.
Wang et al. [48] identified that both the natural variability and anthropogenic activities influenced the recent decadal drought in Nepal. The recent historical droughts observed in Nepal were recorded in 1972, 1977, 1982, and 1992. However, periodic droughts have been observed since 2002, and the most severe winter drought was recorded during 2008–2009. The most recent droughts were observed in 2012, 2013, and 2015 in the mountainous regions of Nepal [49,50].
Sri Lanka experiences drought almost annually, with periodic severe droughts, and it is identified as the most frequent disasters in Sri Lanka [51,52]. Even the wettest parts of Sri Lanka, such as Ratnapura, have recently experienced frequent severe droughts. According to the statistics provided by the Disaster Management Center [51,52] of Sri Lanka, the country had extreme droughts in 2001, 2004, 2012, 2014, and 2016.
Although the Maldives and Bhutan experience drought, the studies related to drought are limited. A monthly rainfall below the 1st decile has been used as an indicator of drought in the Maldives. Substantial inter-annual and inter-decadal variability of the drought was prominent but without long-term trend [53]. Bhutan has experienced fewer droughts compared to other South Asian countries. Although data and information are limited, individual municipalities or agencies reported that the winter during 2005–2006 was unusually dry, with no rain or snow [31].

3.2. Drought Impacts and Vulnerability of the Region

The gradual progress and prolonged duration typically make it challenging to quantify the onset and end of droughts along with damages to sectors. Drought impacts and consequences can be direct or indirect, with different hydro-meteorological processes varying among sectors. Furthermore, the severity of drought impact differs depending on the vulnerability, adaptability, and mitigation of drought in each country. In the South Asia region, drought impacts predominantly on crop production. Apart from the Maldives, the remaining South Asian countries are agriculture-based countries. Table 2 describes the examples of the drought impacts on agriculture in the South Asian countries except for the Maldives.
The loss of crop production ultimately led to food insecurity and loss of income within a family and, finally, an economic burden to the country. Sarkar [59] further confirmed that the social and economic loss of drought is more severe than the physical loss by droughts in India. Kulshreshtha [60] emphasized that the recovery rate of social instability is slower compared to the recovery rate of physical structures damaged by droughts. The drought observed in Pakistan during 1999–2002 affected 3.3 million people, mainly in the Sindh and Baluchistan regions, and it caused many deaths due to hunger. Previous droughts adversely affected about 53% of the civilians and 47% of India’s area [38]. Ultimately, drought caused slower Gross Domestic Product (GDP) growth in Pakistan [58]. Nevertheless, famine due to drought has not been recognized as a major issue these days, but historically, famine associated with droughts was recorded in India and Sri Lanka [61]. Figure 1 illustrates the areal coverage of the historical droughts related to soil moisture in India.
Droughts had enormous impacts on other natural resources in South Asia. Afghanistan experienced a 5-year consecutive drought from 2000 to 2004, and drought in 2001 severely impacted on Kabul river basin (KRB) [62]. In late February or early March in Afghanistan, the annual droughts caused a reduction of river flows to the Tarbela dam, leading to a 50% water shortage over the area. Deepening the levels of groundwater aquifers in Afghanistan during drought is prominent and caused a shortage of potable water. In addition, the over-exploitation of groundwater caused salinity problems in Pakistan during the drought period. Jayasiri and Dahanayaka [63] reported that saltwater intrusion in the southern coasts of Sri Lanka was observed during the recent droughts in Sri Lanka. Reductions in surface and groundwater impact on the quantity and quality of water resources, which impact on livestock production, hydropower generation, drinking water supply, and flora and fauna in the ecosystems [38,43,55,64,65,66,67]. Importantly, Werner [68] demonstrated the influence of drought on the upper montane rain forests in Sri Lanka and identified that the tree species Calophyllum and Syzygium were most vulnerable, experiencing a high mortality rate due to periodic drought over Sri Lanka.
South Asian countries are vulnerable to drought due to the outrageous dense population in the region of Afghanistan. Furthermore, mass migration due to difficult access to potable water and loss of familial income is the massive social impact from the drought in South Asian regions, such as environmental migrants from Afghanistan migrating to provincial centers, cities, the capital (Kabul), and Iran, and it is from the northwestern and western regions for Pakistan [34,69,70,71]. The improper irrigation facilities were identified as one of the reasons to increase vulnerability to the drought of the agrarian community in Nepal [29]. Regrettably, some countries have ongoing civil wars (e.g., Afghanistan, India, and Pakistan) or are overcoming civil wars (e.g., Sri Lanka), making the countries more vulnerable to the economic damage of drought. Box 1 summarizes the 2016–2017 drought impacts observed in Sri Lanka.
Box 1. Brief discussion on 2016–2017 drought in Sri Lanka.
Drought has been most influenced disaster in Sri Lanka with reference to people affected and the relief provided [72,73]. Sri Lanka is more prone to dry situations during the two inter-monsoon seasons between March-April and October-November, due to lower amounts or absence of rainfall compared to the main monsoon seasons. Figure 2 [74] illustrates the spatial drought severity during two cultivation seasons in Sri Lanka.
Sri Lanka experienced a challenging period during 2016–2017 due to the lack of expected amount of rainfall, which caused an absence of two consecutive monsoon rainfalls. Since Sri Lanka is a hydrologically enriched country, the low storage levels of the reservoirs were significant during this drought season. At end of 2016, the total water supply levels in 3/4 of major reservoirs were reported to be only 29% of the full capacity level [75]. The government of Sri Lanka adopted an intermittent power supply policy during the period because the hydropower sector provided only about 30% of the total installed capacity due to lack of water [75]. The low storage in reservoirs impacted significantly on agricultural production. More than 50% of affected households lost 1/3rd of their expected income during the 2016/17 drought [76].

4. Drought Assessment in South Asia

4.1. Sub-Himalayan Region (Nepal and Bhutan)

Nepal used the Standard Precipitation Index (SPI) mostly for drought quantification. The monthly rainfall data between 1971 and 2003 were analyzed by Sigdel and Ikeda [15] using SPI-12 and revealed that moderate drought affected 9% of the area and severe droughts affected 5% of the area in Nepal. Furthermore, western and northwestern regions were likely to have short-term drought risk, and central and northeastern Nepal were likely to have long-term drought risk. A few stations located at high mountainous regions in Nepal showed a contrast decreasing pattern in SPI, which illustrates an increase in drought [77]. Dahal et al. [78] also confirmed that drought severity and frequency increased in central Nepal with prolonged duration. The study used SPI values from 1981 to 2012 for 40 meteorological stations in central Nepal. Baniya et al. [79] used satellite-derived Vegetation Condition Index (VCI) from 1982 through 2015 and identified severe drought events in 1982, 1984, 1985, and 2000. The statistically significant increased rate in VCI (i.e., 1.14/year and 1.31/year) was observed in annual and seasonal monsoon scales, respectively. However, the increased rate for the pre-monsoonal scale was not statistically significant. An increase in VCI indicates a reduction in drought in Nepal. Khatiwada and Pandey [80] compared SPI, Standardized Precipitation Evapotranspiration Index (SPEI), Reconnaissance Drought Index (RDI), self-calibrating PDSI (sc-PDSI), Standardized Streamflow Index (SFI), and Palmer hydrological drought index (PHDI). They identified that the SPI is foremost focused on capturing the duration and intensity of drought in the Karnali river basin, Nepal.

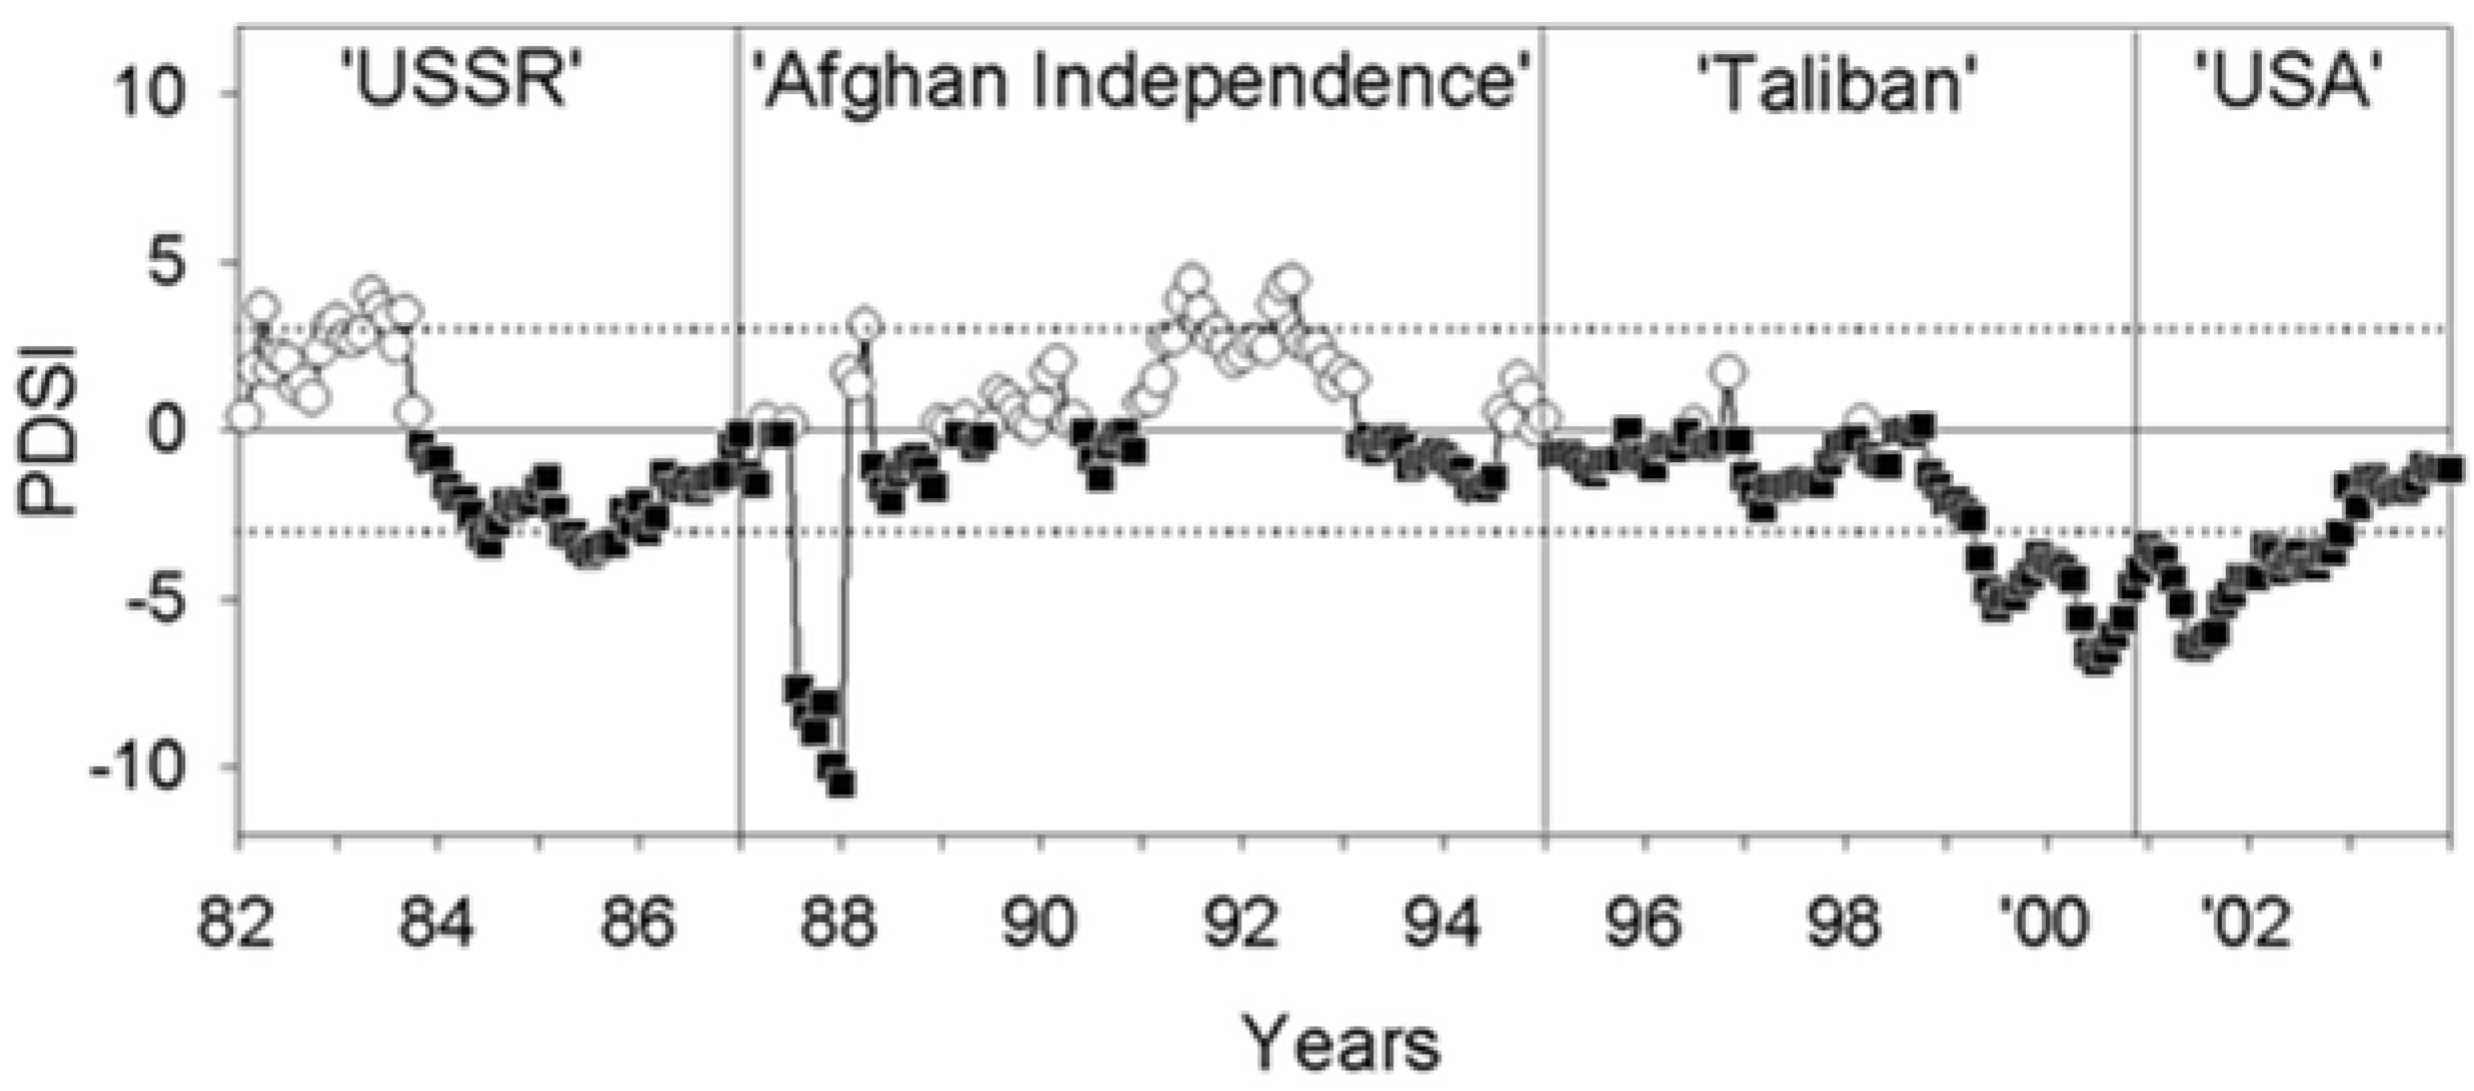
4.2. Northwestern Region (Afghanistan and Pakistan)

Interestingly, many drought indices were used to analyze droughts in Afghanistan. However, many studies concentrated on identifying the suitability of the index to capture the droughts in Afghanistan, and fewer studies investigated droughts in Afghanistan. De Beurs and Henebry [81] assessed the changes in the land surface phenology of Afghanistan between a dry year (2001) and wet year (2003) by applying the MODIS (Moderate Resolution Imaging Spectroradiometer) Normalized Difference Vegetation Index (NDVI). The Pathfinder AVHRR (The Advanced Very-High-Resolution Radiometer) Land (PAL)—NDVI dataset is recorded by four different satellites during 1981–1985, 1985–1988, 1989–1994, and 1995–2001, and these periods are approximately divided into the USSR period, Afghan Independence period, Taliban period, and USA period. Furthermore, the changes in the Palmer Drought Severity Index (PDSI) during 1982 and 2003 were analyzed and identified (Figure 3). The extreme drought observed in 2000 and 2001 had a significant influence on the NDVI, with a substantial decrease compared to previous periods. Alami et al. [62] applied the SPI along with three statistical distributions (i.e., normal, log-normal, and Gamma distributions), Percent of Normal Precipitation Index (PNPI), Deciles Index (DI), and China-Z Index (CZI) for the foremost on KRB in Afghanistan to identify appropriate monitoring index for the basin. The results revealed that the historical extremes and severe drought periods in KRB are well captured by the log-normal distribution-based SPI, gamma distribution-based SPI, and DI. However, the number of moderate drought years is overestimated by PNPI compared to SPI and CZI.
On the other hand, less and moderate drought conditions in KRB are well described by the normal-SPI, CZI, and PNPI. Later on, Alami et al. [82] recommended using normal-SPI and gamma-SPI to better characterize severe drought periods for future assessment in Afghanistan. Muhammad et al. [33] evaluated PDSI, PHDI, and Palmer moisture anomaly index (Z-index) to identify the impact of snowmelt in drought quantification in Afghanistan. The study revealed that both the standard and modified Palmer models captured the vital historical droughts in Afghanistan, including the extreme events in 1971 and 2001. However, the model with snowmelt hindcasts past droughts poorly compared to the standard PDSI. Furthermore, the study revealed that less severe drought was identified at higher elevations than low-lying regions during the events in 2000–2001. Moreover, more substantial different results between the standard and modified PDSIs were observed at higher elevations in Afghanistan.
Aich et al. [83] compared the differences between the periods of 1950–1980 and 1981–2010 based on a reanalysis of the data-based SPEI and discussed the influence of climate change in Afghanistan. Recently, Qutbudin et al. [84] used SPEI that identified that the frequency and severity of drought in Afghanistan increased from 1901 to 2010.
The majority of drought analysis in Pakistan was carried using SPI. The gridded precipitation data during 1960 to 2007 were used to calculate different SPI time scales (i.e., 3, 6, and 12 months) by Lu Xie et al. [85] to study the drought changes spatially and temporally in Pakistan. Principal component analysis (PCA) of the SPI showed that drought in Pakistan predominantly affected a large extent of affected area and has a recurrence interval of 16 years. Khan and Gadiwala [86] analyzed SPI over Sindh in Pakistan, where frequent drought was observed. Monthly rainfall data from 1951 to 2010 from nine meteorological stations were used to obtain SPI at different time scales (i.e., 3, 6, 9 months, annually, biannually, triennial, and quadrennial). The results demonstrate that drought characteristics such as intensity, duration, magnitude, and attenuation for any month in the historical records are timescale dependent. Later, Adnan et al. [87] analyzed SPI over the same region and identified four drought categories based on a percentage of the affected area (i.e., <40%, 40–60%, 60–80%, and >80%) and the recurrence intervals of four different drought conditions (i.e., mild, moderate, severe, and extreme). Based on the results, more than 80% of the area mild droughts with an eight-year recurrence interval were observed. However, less than 40% of the area would experience extreme drought every 20 years. Later, Adnan [88] focused on the identification of drought from 1970 to 2010 using deciles, and severe drought occurred in 2000 over all south-central Asia, including Pakistan. Furthermore, Adnan et al. [89] proposed drought categories with different drought types and intensities based on the agro-climatic region of Pakistan.
Bilal et al. [90] analyzed NDVI and SPI for five years (i.e., 2002, 2005, 2008, 2011, and 2014) over the Thar Desert and claimed that vegetation increased from 2002 to 2011 and then declined from 2011 to 2014. Ahmed et al. [91] constructed drought severity–area–frequency curves with different recurrence intervals for SPI-3 and SPI-6 indices over different seasons in Pakistan, which showed that 25.76% of the area in Pakistan would experience the drought once in 100 years and 10.33% of the area would be affected by the drought observed once in 50 years. Amin et al. [92] identified the Mianwali and Jhang regions that experienced drought in 2000, and these regions had −1.16 and −1.54 of SPI-12 values, respectively.

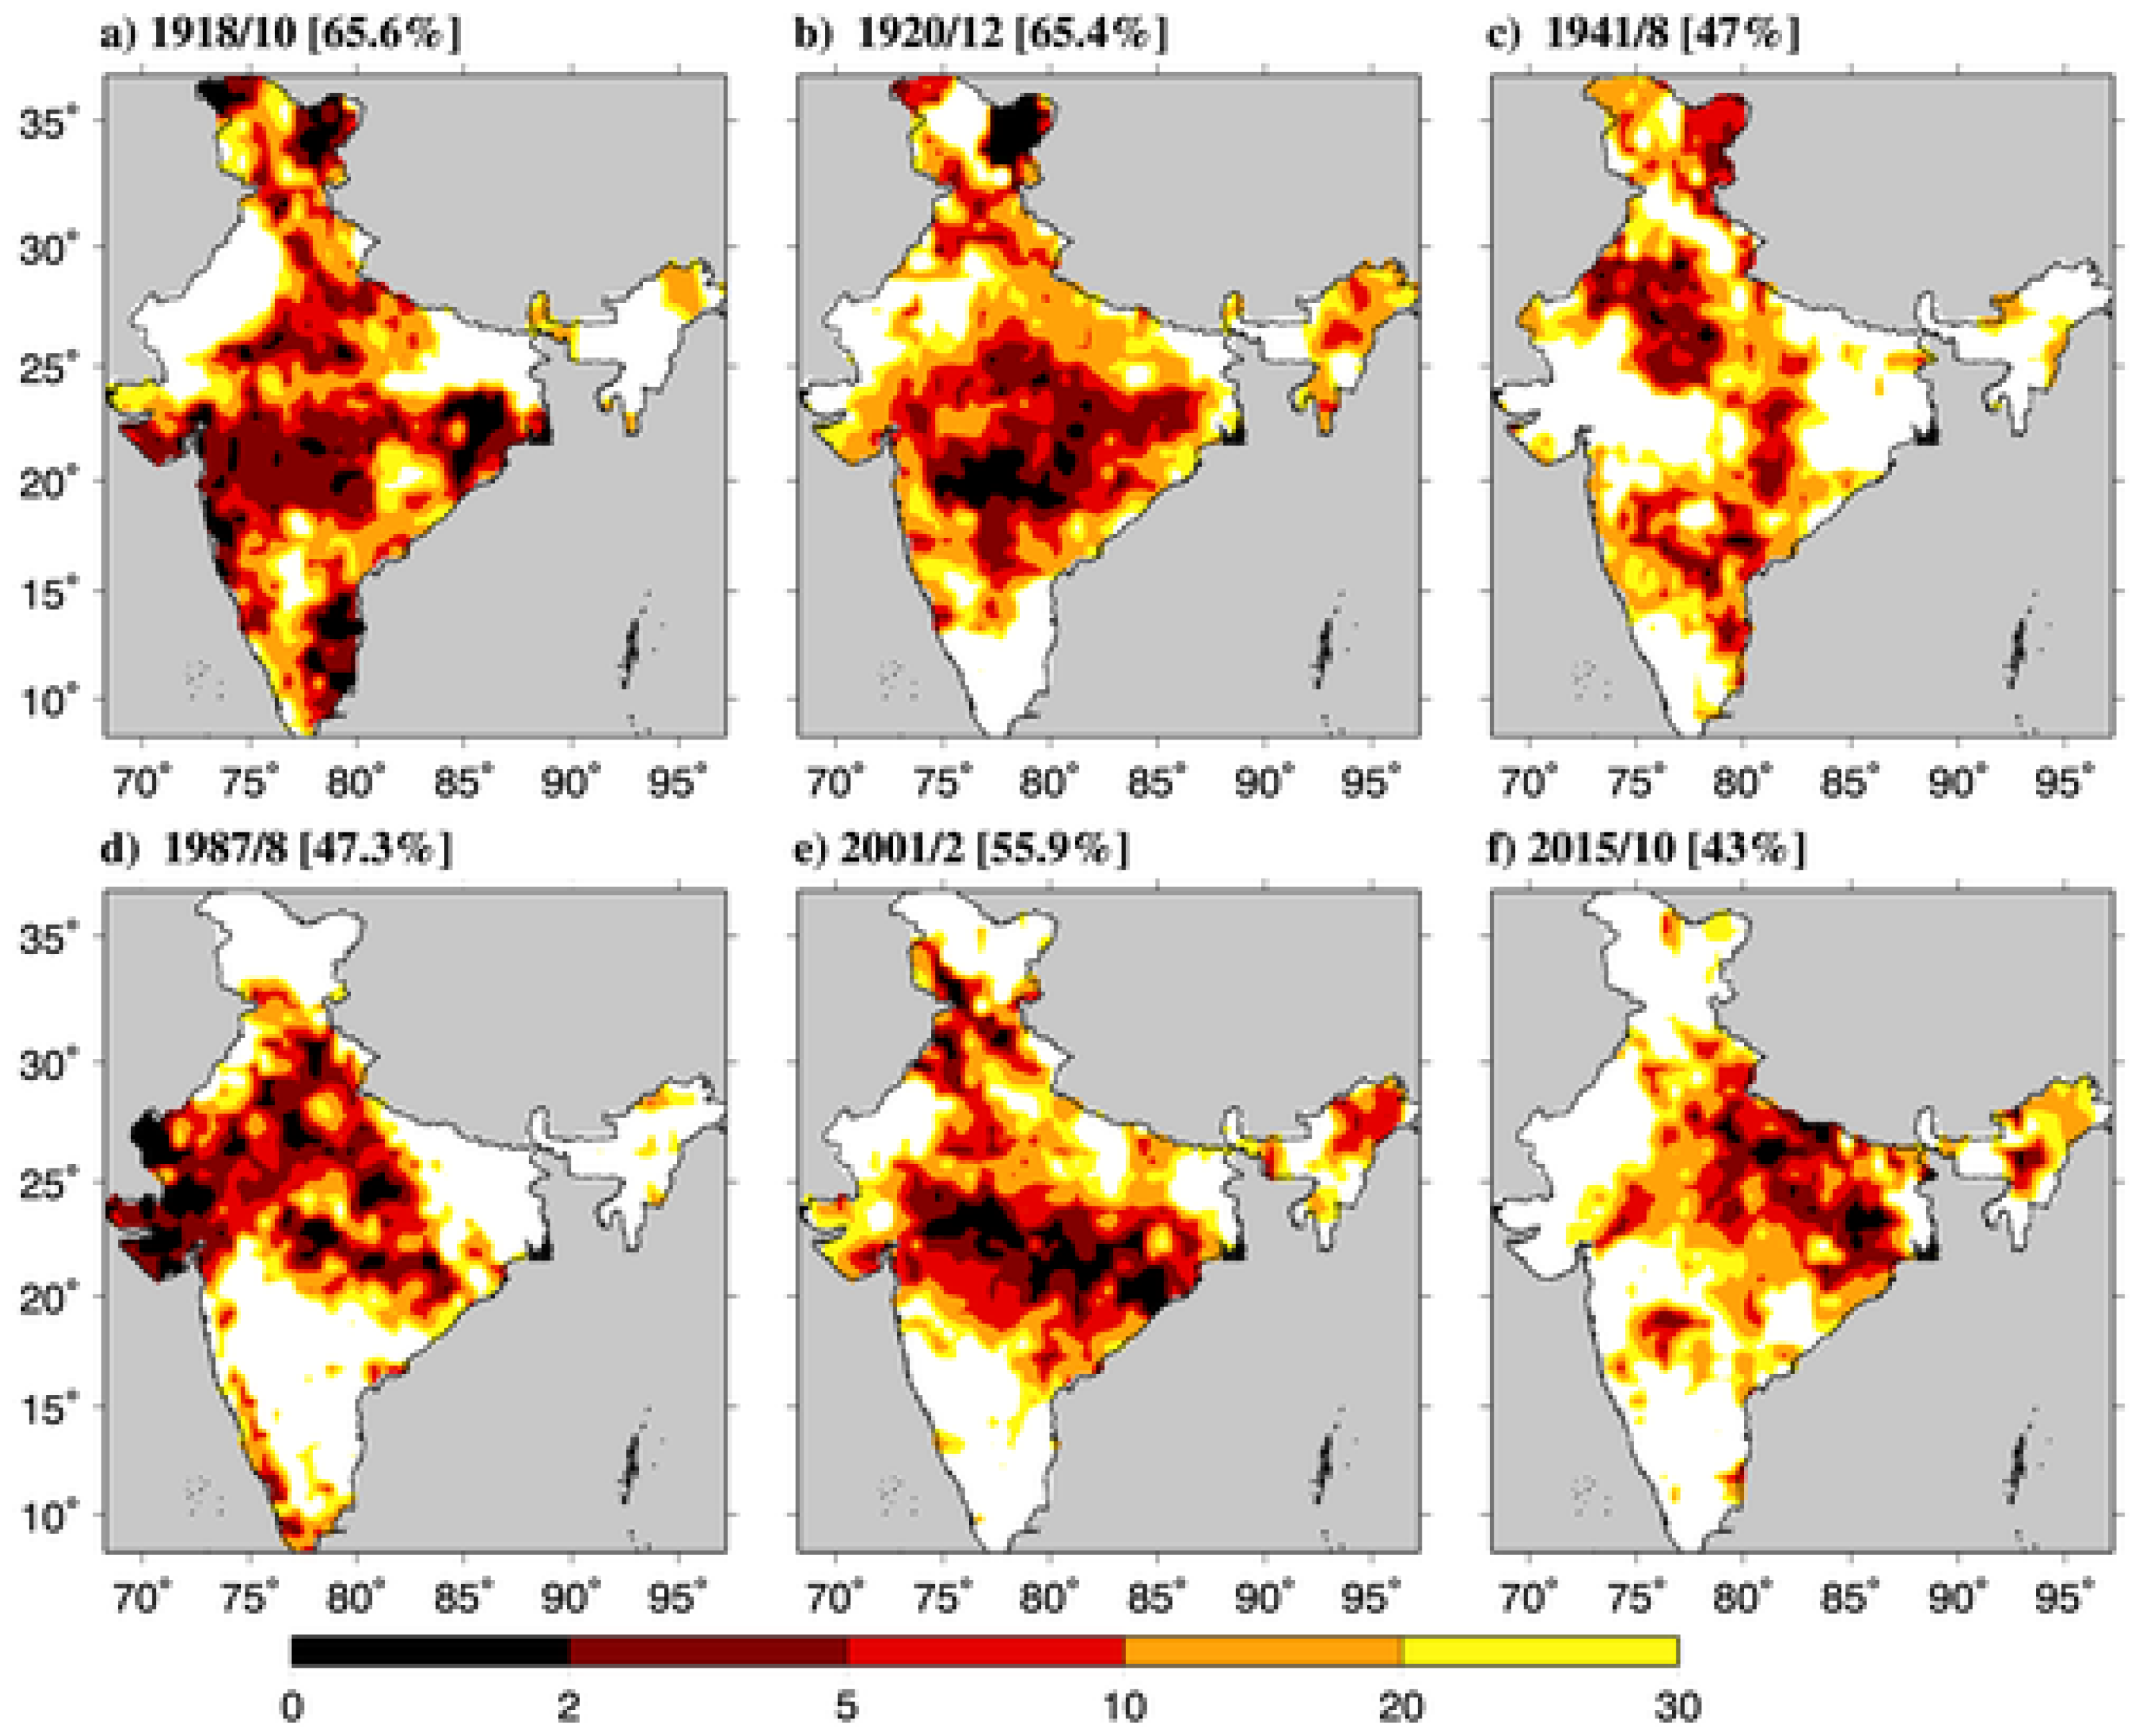
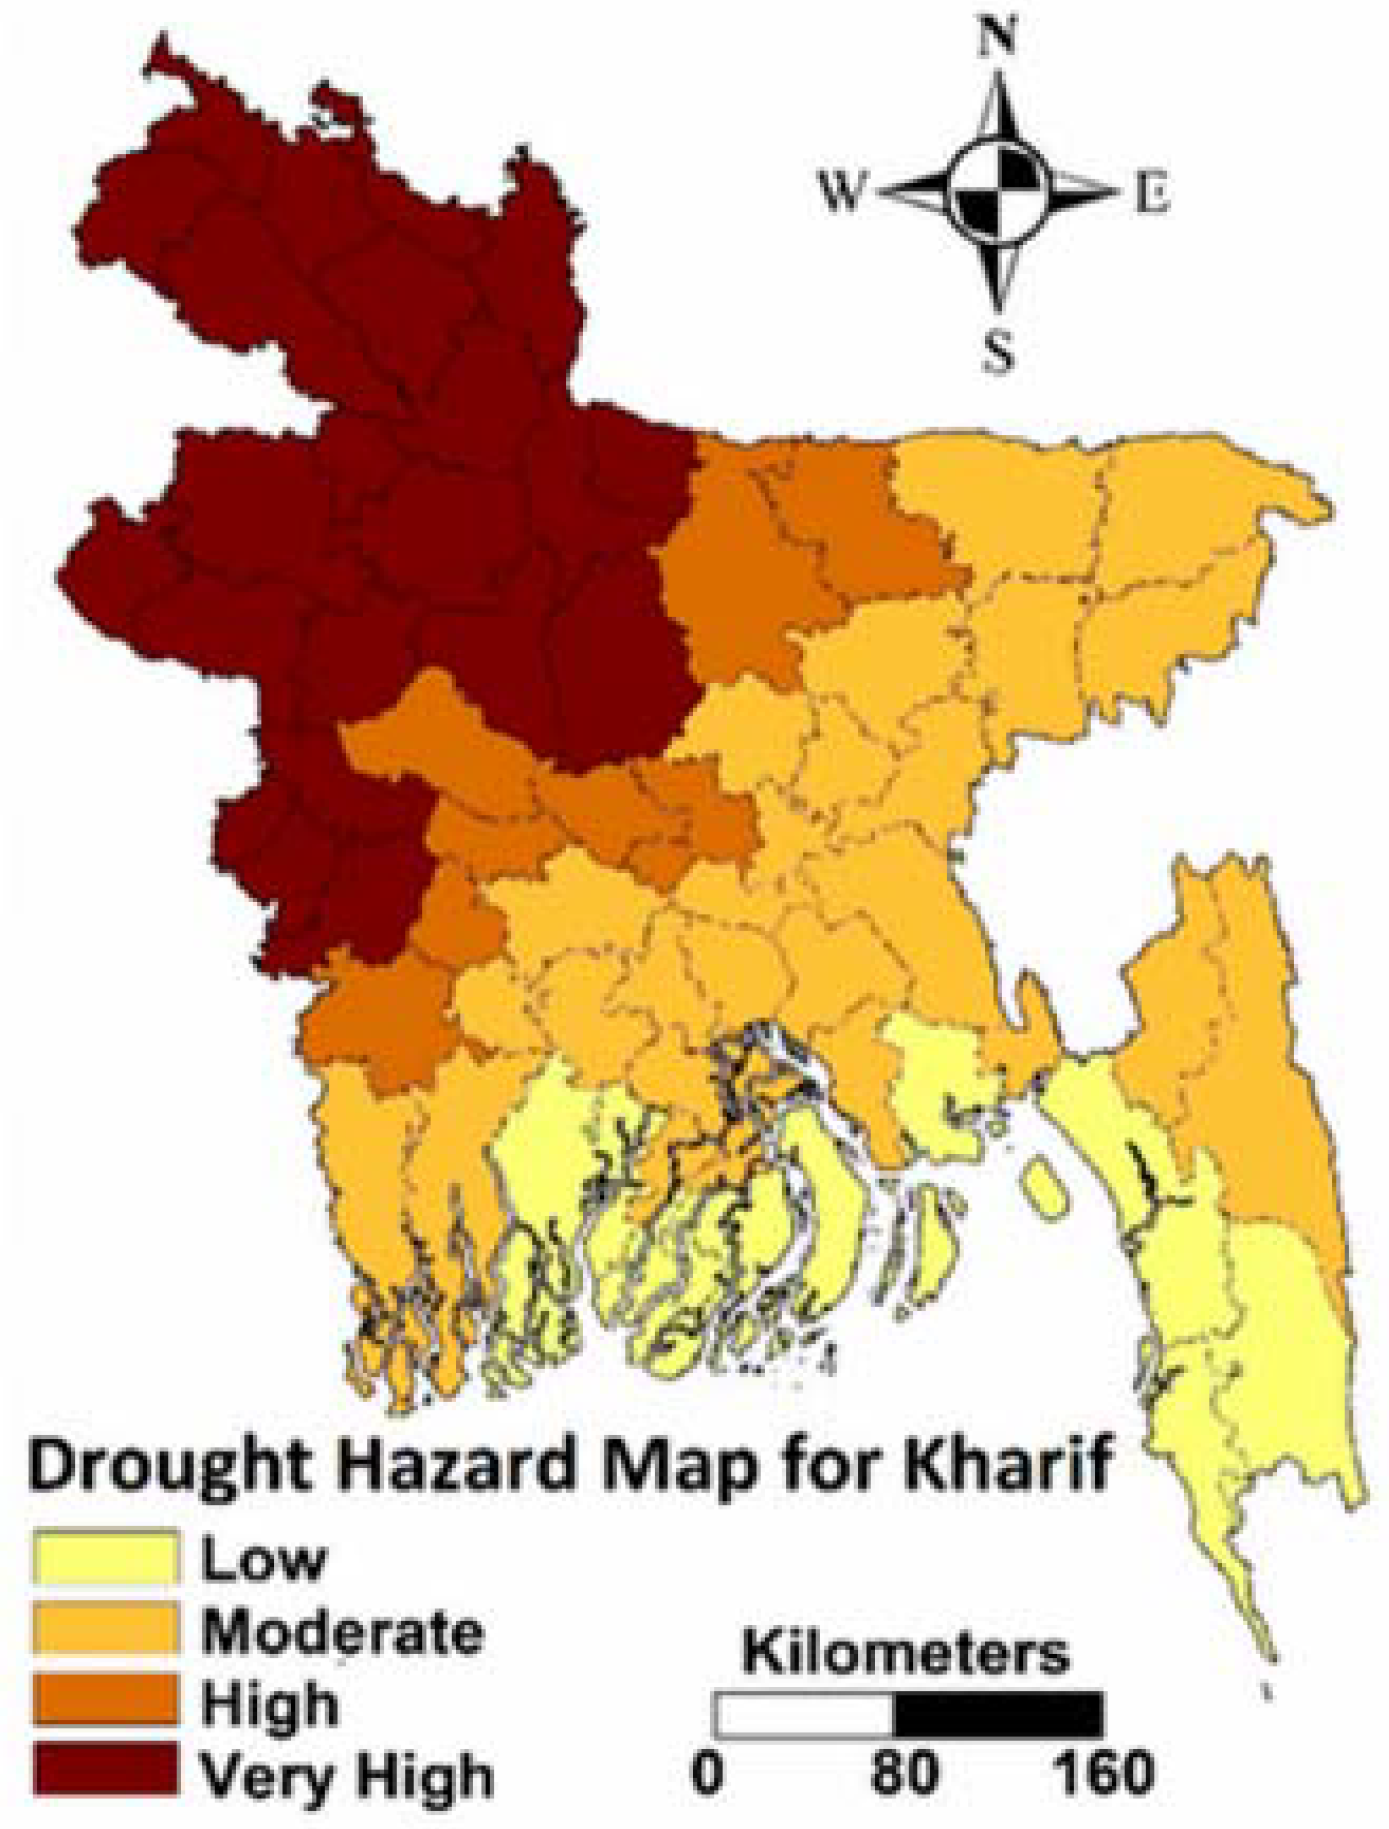
4.3. Indian Continent (India and Bangladesh)

The droughts in India were identified using several indices, and interestingly, a novel index was also introduced to quantify droughts in India. Some studies identified the strength and weaknesses of the drought indices used in India. Kumar et al. [93] developed a temporal sequence of the SPI-1 over India using daily rainfall from June to September for 1951–2007. The results revealed that the extent of the regions prone to moderate drought frequency has expanded during the beginning of the 21st century in India. The Vegetation Temperature Condition Index (VTCI) assesses drought based on the relationship between crop water status, and Patel et al. [94] identified that VTCI precisely described the intensity and spatial extent of drought stress in 2000, 2002, and 2004 in India. Palchaudhuri and Biswas [95] analyzed daily gridded data between 1971 and 2005 for the Puruliya District, West Bengal, India, and they developed a drought severity map using the SPI (Figure 4). Mundetia and Sharma [96] revealed that mild droughts were observed at a higher frequency than moderate and severe droughts.
Furthermore, a high frequency of severe droughts on longer timescales was noticeable. The moderate district-wide droughts were observed over many regions of the country, while intensified droughts were predominant in the north, northwest, and central India [97]. Guhathakurta et al. [98] studied meteorological drought using SPI for the five meteorological subdivisions of India during the southwest and northeast monsoon seasons for the period of 1901–2015. The results revealed that the SPI was less than −1 for most parts of India when there was the presence of below-average southwest monsoon rainfall. The combined analysis of SPI for the years that had below-average rainfall showed that more than 30% of India was under drought conditions during those years. Recent studies of drought quantification in India emphasized that the SPI is efficient in capturing historical drought events from 1961 to 2015 using different timescales (i.e., 1, 3, 6, 9, and 12 months) [99].
Bhuiyan et al. [100] compared the SPI, Standardized Water-Level Index (SWI), Vegetation Condition Index (VCI), Temperature Condition Index (TCI), and Vegetation Health Index (VHI) using NDVI data. They identified that on some occasions, the negative SPI anomalies were observed even in the absence of drought. Mahajan et al. [101] revealed that the SPI could perform drought monitoring at multiple timescales more precisely than the Percent of Normal Precipitation (PNP). The study consisted of 59 rain gauges from 1960 to 2012. Particularly, SPI-1 fails to identify drought that exists during non-monsoon months. SPI and SPEI were used to assess the variation of meteorological droughts over India during 1901–2010, and the results revealed that 18% of the years had countrywide droughts in India [97]. The comparison between SPI and RDI indices revealed that RDI is more able to predict actual drought years precisely compared to SPI [102]. However, SPI and RDI were well correlated based on three-month rainfall data, and SPI values were used to predict annual RDI. Wable et al. [103] assessed historical droughts between 1985 and 2009 in the basin located at semi-arid western India using the Percent Departure from Normal (PDN), Effective Drought Index (EDI), SPI, Reconnaissance Drought Index (RDI), and SPEI. They concluded that the most accurate drought monitoring could be done using SPEI-9 compared to other indices.
The Drought Severity Index (DSI)—a novel index was developed by Pandey et al. [104] using 10-day streamflow data of the Betwa River system from 1960 to 2001. The DSI is described as a function of (a) the ratio of deficit flow volume to the corresponding volume at the truncation level and (b) the ratio of the duration of deficit flow to the maximum possible duration of the independent streamflow drought event. The results showed that those upstream of the river were more susceptible to severe droughts than the lower stream. Furthermore, the drought becomes severe when the onset of the drought falls during August−November.
SPI is a widely used index in drought analysis in Bangladesh. Furthermore, some studies identified the weakness of the index based on hydrological data. Notably, the severity of groundwater droughts was studied in Bangladesh. Alamgir et al. [105] assessed seasonal drought using the SPI and demonstrated that the spatial drought pattern was substantially different by season. In addition, more frequent droughts were identified in the north and northwest regions. Rahman and Lateh [106] demonstrated that more severe and extreme droughts in Bangladesh were frequently observed in January and April based on the SPI-3. Furthermore, the most severe and frequent droughts were observed in the northern, western, and central regions of Bangladesh [106,107,108,109]. Azam et al. [110] assessed the severity and spatial pattern of the meteorological dry spell during 1975–2014 in Rajshahi, Bangladesh using the SPI. The study showed the lowest SPI value of −2.27 for the SPI-6 timescale, −2.17 for the SPI-12 timescale, and −1.85 for the SPI-3 timescale in the year 2010 for the region. Figure 5 illustrates the recent development of the drought hazard map for Bangladesh [111] using the SPI and catastrophe weighing method. Severe drought conditions in Bangladesh were identified in 1981, 1982, 1985, 1987, 1989, 1992, 1994, and 1996, after which the conditions gradually improved in 2004, 2006, and 2009. Furthermore, the drought duration in Bangladesh was about 2.5 years [107].
Hore et al. [25] identified that the SPI and SPEI indices are appropriate in detecting historical droughts in Bangladesh, especially in northwestern Bangladesh. On the other hand, the study revealed that drought indices relying on hydrological data (i.e., standardized runoff index—SRI) generally fail to detect past droughts in Bangladesh. This is because the river discharge used in this study is regulated by the upstream Ganges River basin, so that hydrologic drought cannot be adequately captured. Furthermore, the Standardized Groundwater Level Index (SGWI) and NDVI identified extreme historical droughts, including that in 2010. Shahid and Hazarika [112] computed the severity of groundwater droughts using the cumulative deficit approach from the threshold groundwater level. They revealed that more or less half of the northwestern districts of Bangladesh had annual groundwater scarcity.

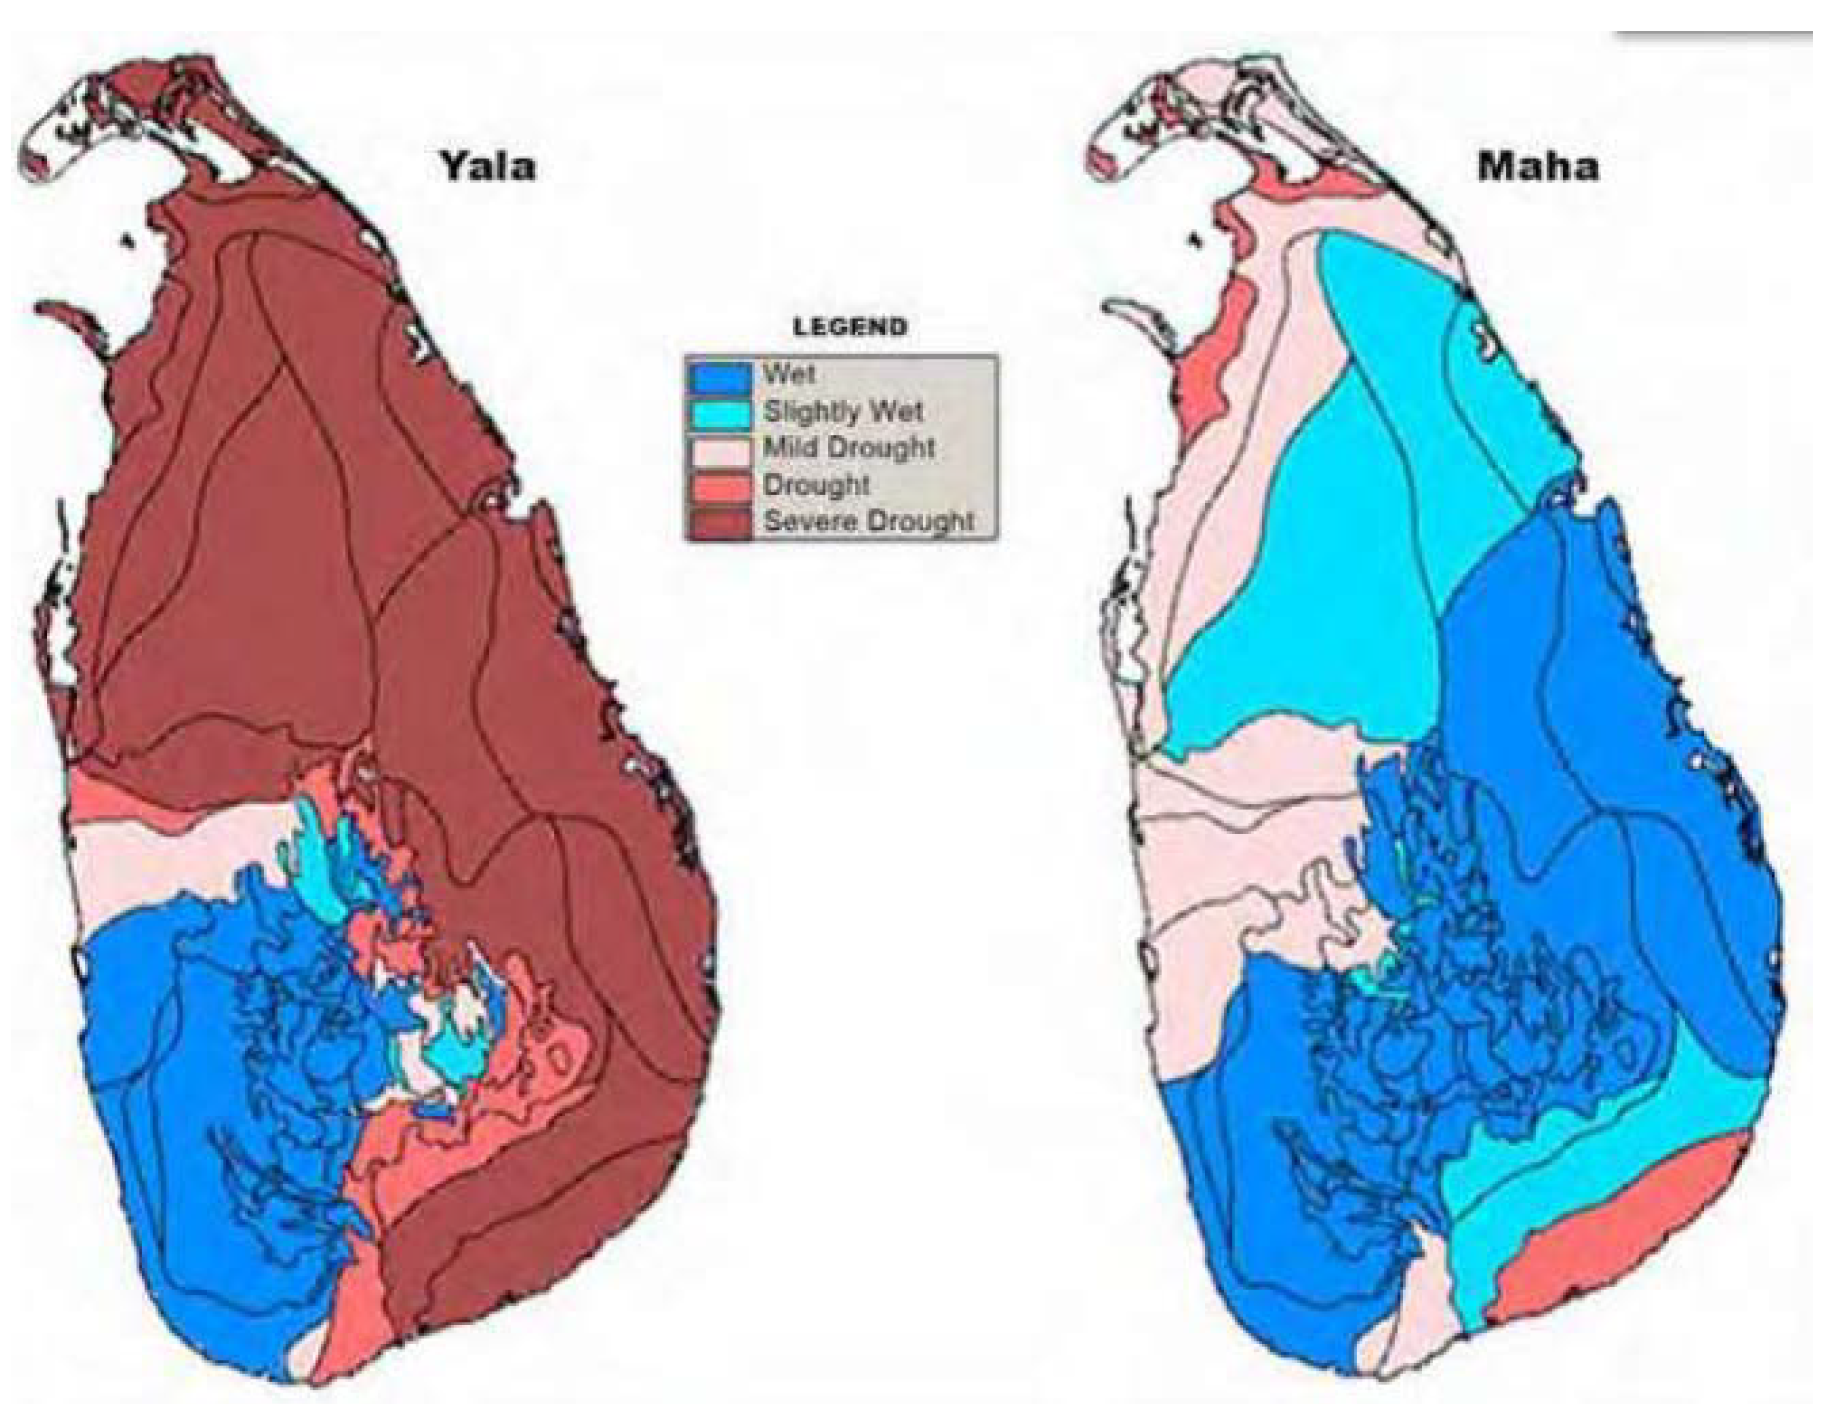
4.4. Southern Region (Sri Lanka and the Maldives)

As in other countries in South Asia, the SPI is commonly used in drought quantification in Sri Lanka. Sri Lanka developed a novel index based on newly derived 14 indices to understand drought vulnerability in Sri Lanka (Box 2).
Box 2. Brief on multi-agency coordinated and supported research to develop disaster profiles for Sri Lanka.
Fourteen indices were designed to generate a drought vulnerability map (Figure 6a) for Sri Lanka, and 64 agro-ecological regions were classified to reflect drought-prone agricultural regions (Figure 6b) [113]. These indices include (1) total rainfall deficit per year, (2) highest total consecutive deficit, (3) total number of months with deficits, (4) highest consecutive number of months with deficits, (5) deficits over excess, (6) highest deficit within one month, (7) number of months per year with rainfall less than 30 mm, (8) highest number of three consecutive months where rainfall is less than 30 mm, (9) mean rainfall of months where rainfall is less than 30 mm, (10) lowest mean rainfall where rainfall is less than 30 mm in consecutive months, (11) total rainfall deficit less than 30 mm, (12) mean annual daily deficit, (13) mean annual non-rainy days, and (14) mean number of days per year in which rainfall is less than or equal to 1 mm. Factor analysis was carried out on the z-values of all 14 indices using SPSS software, revealing that 76% of the total variance could be explained only by index 1, and 14% of the variance was explained by index 2.
Lyon et al. [114] used the SPI and a percent-annual-average index over the accumulated rainfall anomalies for 3, 6, 9, and 12 months durations based on gridded (10 km × 10 km) rainfall data. The results revealed that SPI-9 provided the most robust relationship with the overall occurrence of drought relief, although SPI-6 and SPI-12 indicators provided generally similar results. Ekanayake and Perera [115] studied a case for Anuradhapura, Sri Lanka to identify drought characteristics using the SPI from 1951 to 2007, and 46 droughts were identified.
Furthermore, in the study, five copulas were examined to represent the joint distribution. Akaike information criterion (AIC), Bayesian information criterion (BIC), and the Kolmogorov–Smirnov test were used to select the best gamma distributions for drought duration and severity, and Frank copula was identified as the best. The results revealed that the drought in 1974 was the worst event, with a drought duration and severity of nine months and 10.95, respectively.
Herath et al. [116] developed drought severity maps for Sri Lanka in 2015 based on SPI-1, SPI-3, and SPI-6 using historical precipitation data from 1981 to 2015. The SPI values for the three different scales were normal for most months except for January and July in 2015, which showed dry conditions in a few parts of the island. The SPI-3 captured the moderate drought conditions spatially over the western slopes of the central hills of Sri Lanka. Manesha et al. [117] analyzed significant drought events in Sri Lanka in 1976 and 2001 using the same timescales. The study concluded that SPI-1 is inappropriate to quantify the severity of drought conditions in Sri Lanka. Furthermore, SPI-3 is highly capable of monitoring the onset of droughts. On the other hand, SPI-6 performed well in explaining drought severity and duration in Sri Lanka.
Gunda et al. [118] conducted PCA of PDSI and SPI-9 using monthly rainfall and temperature data from 1881 to 2010 over 13 stations covering three climatic zones in Sri Lanka. The PCA of the study showed that the first two principal components of the two indices were more or less equal to all regions and could represent the two main monsoons (i.e., southwest and northeast monsoons). Furthermore, the PDSI was highly correlated with the regions that receive an annual rainfall of 1750–2500 mm, while SPI-9 was highly correlated with the regions that receive an annual rainfall of less than 900 mm. However, both the indices were not well associated with wet regions of Sri Lanka. Jayawardana et al. [119] used the SPI over different timescales (i.e., SPI-3, SPI-6, and SPI-12) to understand drought severity in coconut growing agro-ecological regions in Sri Lanka. The SPI-12 (i.e., SPI with 12 months moving average rainfall) was used to identify historical hydrological drought events, and the remaining two indices were adopted to explore the drought pattern during monsoon seasons and Yala/Maha seasons (i.e., major cultivation seasons in Sri Lanka: Yala—March to September, and Maha—October to February), respectively.

5. Drought Prediction, Teleconnection, and Projection under Climate Change

As discussed in previous sections, assessments and impacts of drought are crucial for various sectors. Although drought itself is not a disaster [120], it becomes a disaster because of its negative influence on citizens and all the other economic sectors, including the environment, and lower capability to manage and overcome the negative influence of the drought. Consequently, monitoring and prediction of drought are essential to mitigate associated disasters. Furthermore, information derived from drought monitoring and prediction may be useful for decision-makers to produce effective drought policies, including plans for early warning, response, and recovery.
Wilhite and Buchanan-Smith [121] define that drought monitoring is the continuous monitoring of natural indicators related to drought. Total rainfall amounts or rainfall deficiencies were used as drought monitoring indicators in the early years of the process [122]. Later on, monitoring of other in situ measurements of related hydrological variables was also included in the drought monitoring process. However, there had been a huge necessity to hindcast specific historical drought events. Many studies highlight and compared various aspects of drought by developing new indices based on the spatial and temporal difference in the region and the climate conditions [123]. There are many substantial achievements in the availability of several datasets for monitoring drought, such as data from remote sensing, land surface model simulations, and impact data. Most countries in the area have prepared drought severity maps for drought mitigation and preparedness.
Along with drought monitoring, drought prediction is crucial for early warnings in drought management. The prediction of drought severity is the main concern when considering drought prediction. In some instances, drought prediction also considers the prediction of drought duration and frequency [124,125], stage, and recovery. Drought prediction can be performed in two ways: (a) statistical drought prediction and (b) dynamic drought prediction. Statistical drought prediction involves modeling the relationships between drought index or indices of interest and potential predictors (i.e., large-scale climate indices, local climate variables, and initial conditions). Dynamic drought prediction is based on climate forcing and initial conditions and uses seasonal climate forecasts from general circulation models (GCMs) [126,127,128,129].
The Global Ensemble Forecast System (GEFS) is used to predict moderate drought over India by using ensemble climatological means of historical precipitation [130]. The results showed improvement in GEFS with a correlation of 0.44 over and 0.55 throughout the monsoon season and winter season, respectively. Next, a bias-corrected GEFS forecast for a short-term hydrological and agricultural drought in India was developed using the Variable Infiltration Capacity (VIC) model. Mishra and Desai [131] compared linear stochastic models (i.e., Autoregressive Integrated Moving Average (ARIMA), Seasonal Autoregressive Integrated Moving Average (SARIMA)), a recursive multi-step neural network (RMSNN), and a direct multi-step neural network (DMSNN) to identify the capability of SPI to forecast drought over the Kansabati River Basin, India. The results revealed that the RMSNN is best at drought prediction one month in advance. On the contrary, the DMSNN performs well in recursive multi-step and ARIMA models with a lead-time of 4 months.
The sc-PDSI was developed by Rahaman et al. [132] to assess drought conditions between 1981 and 2013 in Bangladesh and an increasing drought risk under climate change with the use of sc-PDSI and Representative Concentration Pathways (RCP) 4.5. Baniya et al. [79] concluded that combined remote sensing products could be used to calculate the VCI and predict future droughts in Nepal.
Illeperuma and Sonnadara [133] used artificial neural networks as a tool to predict droughts in Sri Lanka. Predictions were made using the SPI for 13 stations over Sri Lanka based on rainfall data from 1870 to 1980. For SPI-3, the average correlation coefficient was 0.90, with the lowest at 0.84 for Nuwara Eliya and the highest at 0.94 for Batticaloa and Jaffna. The results revealed that the more accurate prediction could be observed for the dry regions (i.e., annual rainfall between 900 and 1750 mm) compared to the wet regions (i.e., annual rainfall of more than 5000 mm). The model predictions were superior for the period from May to July (which is the first part of the southwest monsoon season) compared to the rest of the year.
The collective effort from Bangladesh, India, Nepal, Pakistan, and Sri Lanka developed the tool kit “South Asia Drought Monitoring System (SADMS)” in 2014. The SADMS uses various drought indices to monitor and quantify the drought in the region. The system produces the weekly drought condition map for South Asia, and the online application available at http://dms.iwmi.org/app/ (accessed on 15 January2021) is maintained by the International Water Management Institute [134]. The Experimental Drought Monitor for India developed by Shah and Mishra [135] was recently expanded into an ensemble-based model to monitor and predict drought for all of South Asia by Mishra and Aadhar [136]. This “South Asia Drought Monitoring and Prediction System” forecasts daily rainfall, soil moisture, and runoff for 15 days lead time [137]. Furthermore, the SADMPS provides drought indices, including the SPI, standardized soil moisture index (SSI), and SRI. The prediction system is available at https://sites.google.com/a/iitgn.ac.in/high_resolution_south_asia_drought_monitor/gefs-forecast/drought-forecast (accessed on 15 January2021); it is user friendly and provides online real-time information to the users.
Even though not many drought prediction studies have been carried out for the South Asian region, there are many studies related to the prediction of rainfall and temperature for the South Asian region, which could give direct (or indirect) information on drought prediction for the area.
Since drought is due to a deficiency of rainfall, it is evident that drought is connected with large-scale climate variability, which may have a relationship with rainfall. The ENSO is one of the significant climate variables influenced by rainfall over the South Asian region. El Niño has been linked to 13 out of 21 droughts observed in India during the last century [138]. Rahman et al. [139] analyzed SPI-3 and revealed that moderate and extreme droughts are associated with El-Nino events. On the other hand, wet events (SPI-3 ≥ 1) are often due to La-Nina events in Bangladesh.
Moreover, Pai et al. [97] found that warmer SST over the tropical oceans was significantly influenced the changes in meteorological droughts over India. The UN Office for the Coordination of Humanitarian Affairs [70] declared that La Niña had a catastrophic effect on 2018’s planting season, which caused a 70% shortage in rain, snow, and sleet across Afghanistan. Wang et al. [48] stated that Arctic Oscillation (AO) and its decadal variability influence the winter drought in western Nepal. Furthermore, continuous heating of the Indian Ocean and accelerated Hadley circulation indirectly influence the drought in Nepal.
Future climate projections are intended to provide a long-term forecast of a particular variable in a specific scenario. It can be a projection of multiple scenarios using one or several models. Based on the Canadian GSM and the A2 emission scenario, rainfall estimates (1961 to 1990), and projections (1991 to 2100) for Hulhule in the Maldives, the drought frequency in the Maldives is likely to be lower in the beginning of the 2000s relative to the latter part of the 1900s [53]. Ramamasy and Baas [55] mentioned that current projections suggest that the frequency of drought would increase in Bangladesh. Zhou and Hong [140] projected an increasing rate of drought risk for Southeast Asia between 2051 and 2100 using the Flexible Global Ocean-Atmosphere-Land System model and Spectral Version 2 (FGOALS-s2). Furthermore, the RCP8.5 scenario projected that the moderate and extreme droughts, which have PDSI values of less than −2 and less than −4, respectively, would experience a statistically significant increasing trend.
Dahal et al. [78] downscaled the HadCM3Q0 global model data by the PRECIS regional climate model and identified that drought would increase in Nepal. Barlow et al. [141] reviewed droughts in Southwest Asia and elaborated on the literature regarding South Asian monsoon rainfall and temperature projection. However, many studies projected precipitation and temperature for South Asia, but drought projection for South Asian countries or individual countries located in the region is limited or absent. Therefore, there is a potential for an exploration of variability in droughts under climate change in South Asia.

6. Current Status and Future Perspectives

The drought is one of the hydrological extremes observed in South Asian countries, and literature on drought analysis has increased since 2003. Drought adversely impacts agriculture and livestock productivity, food security, hydropower generation, drinking water supplies, wildlife habitat, and most importantly, social cohesion such as mass migration due to loss of primary family income. Table 3 summarized the most severe droughts observed in the region, vulnerable sectors for the drought and drought assessment, monitoring, and prediction methods used in the region.
Many studies have acknowledged the SPI as a representative index for precise drought assessment, monitoring, and prediction (Table 3). Furthermore, some studies developed unique severity indices to quantify drought related to the region. Despite all the previous work, the absence of drought quantification studies in Bhutan and Maldives is of great concern. Future studies to develop a combined drought severity map for the South Asian region are required. Most South Asian countries have developed drought severity maps using drought indicators or indices for ease of drought mitigation and preparedness. Huang et al. [142] mentioned that the main objective of the drought prediction is to improve the precision and accuracy of the prediction by combining the knowledge of physical mechanisms behind the drought and maximizing the utilization of predictability sources. Even though there are a plethora of studies on rainfall and temperature predictions and projections in the South Asian region, there are limited studies related to drought prediction. Therefore, it is crucial to conduct studies related to drought prediction and future projection in the South Asian region.
Furthermore, the teleconnection of drought with other atmospheric oscillations in South Asia is not well documented. Few countries have studied ENSO and its impact on the frequency of drought in South Asia. Therefore, it is essential to continue to consider teleconnection between large-scale climate circulations because the South Asian region consists of large landmasses such as India and islands such as Sri Lanka and the Maldives, which may show different impacts from large-scale climate circulation. Finally, the South Asian region provides a pool of opportunities for studies related to drought, drought quantification using innovative methods, drought prediction and projection, and teleconnections between atmospheric oscillations.

Author Contributions

Conceptualization, S.S.K.C. and H.-H.K.; methodology, S.S.K.C. and H.-H.K.; writing—original draft preparation, S.S.K.C.; writing—review and editing, S.S.K.C., H.-H.K., M.V., J.O. and T.-W.K.; supervision, H.-H.K., M.V., J.O. and T.-W.K.; project administration, H.-H.K.; funding acquisition, H.-H.K. All authors have read and agreed to the published version of the manuscript.

Funding

This research was funded by the NATIONAL RESEARCH FOUNDATION OF KOREA (NRF) funded by the MINISTRY OF EDUCATION, grant number (2019R1A2C2087944).

Informed Consent Statement

Not applicable.

Conflicts of Interest

The authors declare no conflict of interest. The funders had no role in the design of the study; in the collection, analyses, or interpretation of data; in the writing of the manuscript, or in the decision to publish the results.

References

  1. Davy, J.X. On an Unusual Drought in the Lake District in 1859. Trans. R. Soc. Edinb. 1861, 22, 313–318. [Google Scholar] [CrossRef] [Green Version]
  2. Mirza, M.M.Q. A review on current status of flood and drought forecasting in South Asia. In Global Environmental Changes in South Asia; Mitra, A.P., Sharma, C., Eds.; Springer: Dordrecht, The Netherlands, 2010. [Google Scholar]
  3. Naveendrakumar, G.; Vithanage, M.; Kwon, H.H.; Chandrasekara, S.S.K.; Iqbal, M.C.M.; Pathmarajah, S.; Fernando, W.C.D.K.; Obeysekara, J. South Asian perspective on temperature and rainfall extremes: A review. Atmos. Res. 2019, 225, 110–120. [Google Scholar] [CrossRef]
  4. Palmer, W.C. Research Paper No. 45, Meteorological Drought; Superintendent of Documents, U.S. Government Printing Office: Washington, DC, USA, 1965.
  5. Hoyt, J.C. Drought by 1936 with Discussion of the Significance of Drought in Relation to Climate; U.S. Geological Survey Water Supply Paper; Government Printing Office: Chicago, IL, USA, 1938; Volume 820, p. 1.
  6. Blumenstock, G. Drought in the United States analyzed by means of the theory of probability. Tech. Bull. U. S. Dep. Agric. 1942, 89, 5. [Google Scholar]
  7. Condra, G.E. Drought its affects and measures of control in Nebraska. In Nebraska Conservation Bulletin; University of Nebraska, Conservation and Survey Division: Lincoln, Nebraska, 1944; Volume 25, p. 1. [Google Scholar]
  8. Great Britain Meteorological Office. The Meteorological Glossary; Authority of the Meteorological Committee, Chemical Publishing Co.: New York, NY, USA, 1951; p. 253. [Google Scholar]
  9. White, R.C.L. Drought and effective rainfall frequency in pastoral New South Wales, west of the wheat belt. In A Meteorological Study No: 5; Bureau of Meteorology: Melbourne, Australia, 1955; p. 2. [Google Scholar]
  10. Van Bavel, C.H.M.; Verlinder, F.J. Agricultural drought in North Carolina. In Technical Bulletin; North Carolina Agricultural Experiment Station: Raleigh, NC, USA, 1956; Volume 122, p. 60. [Google Scholar]
  11. McGuire, J.K.; Palmer, W.C. The 1957 drought in the Eastern United States. Mon. Weather Rev. 1957, 85, 305–314. [Google Scholar] [CrossRef]
  12. Wilhite, D.A.; Glantz, M.H. Understanding the drought phenomenon: The role of definitions. Water Int. 1985, 10, 111–120. [Google Scholar] [CrossRef] [Green Version]
  13. United Nations International Strategy for Disaster Reduction. Drought Risk Reduction Framework and Practice: Contributing to the Implementation of the Hyogo Framework for Action; United Nation: New York, NY, USA, 2009. [Google Scholar]
  14. Wilhite, D.A. Chapter 1 drought as a natural hazard: Concepts and definitions. In Drought: A Global Assessment; Wilhite, D.A., Ed.; Routledge: Abingdon, London, UK, 2000; Volume I, p. 69. [Google Scholar]
  15. Sigdel, M.; Ikeda, M. Spatial and Temporal Analysis of Drought in Nepal using Standardized Precipitation Index and its Relationship with Climate Indices. J. Hydrol. Meteorol. 2010, 7, 59–74. [Google Scholar] [CrossRef]
  16. Schubert, S.D.; Suarez, M.J.; Pegion, P.J.; Koster, R.; Bacmeister, J.T. Potential Predictability of Long-Term Drought and Pluvial Conditions in the U.S. Great Plains. J. Clim. 2008, 21, 802–816. [Google Scholar] [CrossRef]
  17. Smakhtin, V.U.; Schipper, E.L.F. Drought: The impact of semantics and perceptions. Water Policy 2008, 10, 131–143. [Google Scholar] [CrossRef]
  18. Crausbay, S.D.; Ramirez, A.R.; Carter, S.L.; Cross, M.S.; Hall, K.R.; Bathke, D.J.; Betancourt, J.L.; Colt, S.; Cravens, A.E.; Dalton, M.S.; et al. Defining ecological drought for the twenty-first century. Am. Meteorol. Soc. 2017, 98, 2543–2550. [Google Scholar] [CrossRef]
  19. Otkin, J.A.; Svoboda, M.; Hunt, E.D.; Ford, T.W.; Anderson, M.C.; Hain, C.; Basara, J.B. Flash droughts: A review and assessment of the challenges imposed by rapid onset droughts in the United States. Bull. Am. Meteorol. Soc. 2018, 99, 911–919. [Google Scholar] [CrossRef]
  20. World Meteorological Organization and Global Water Partnership. Handbook of Drought Indicators and Indices; Integrated Drought Management Tools and Guidelines Series 2; Svoboda, M., Fuchs, B.A., Eds.; Integrated Drought Management Programme (IDMP): Geneva, Switzerland, 2016. [Google Scholar]
  21. Woldeyohannes, Y.Y.; Vaheddoost, B.; Al-Weshah, R.A. Drought indices and indicators revisited. Arab. J. Geosci. 2019, 12, 69. [Google Scholar]
  22. McKee, T.B.; Doesken, N.J.; Kleist, J. The relationship of drought frequency and duration to time scales. In Proceedings of the 8th Conference on Applied Climatology, Anaheim, CA, USA, 17–22 January 1993; American Meteorological Society: Boston, MA, USA, 1993; pp. 179–184. [Google Scholar]
  23. Gibbs, W.J.; Maher, J.V. Rainfall deciles as drought indicators. In Bulletin No 48; Bureau of Meteorology: Melbourne, Australia, 1967. [Google Scholar]
  24. Vicente-Serrano, S.M.; Begueria, S.; Lopez-Moreno, J.I. A multi-scalar drought index sensitive to global warming: The Standardized Precipitation Evapotranspiration Index. J. Clim. 2010, 23, 1696–1718. [Google Scholar] [CrossRef] [Green Version]
  25. Hore, S.K.; Werner, M.; Maskey, S. Effectiveness of drought indicators in characterizing past droughts in the northwestern part of bangladesh. In Proceedings of the International Conference on Water & Environmental Engineering (iCWEE2019), Dhaka, Bangladesh, 19–22 January 2019. [Google Scholar]
  26. Gajbhiye, S.; Gautam, R.; Kahya, E. Drought analysis in the Tons river basin, India during 1969–2008. Theor. Appl. Climatol. 2017, 132, 939–951. [Google Scholar]
  27. Royal Government of Bhutan. State of Climate Change Report for the RNR Sector; RNR Climate Change Adaptation Program, Ministry of Agriculture & Forests, Royal Government of Bhutan: Thimphu, Bhutan, 2016; p. 18. [Google Scholar]
  28. Miyan, M.A. Droughts in Asian least developed countries: Vulnerability and sustainability. Weather Clim. Extrem. 2015, 7, 8–23. [Google Scholar] [CrossRef] [Green Version]
  29. Regmi, H.R. Drought risk management in Nepal. In Proceedings of the SAARC Workshop on Drought Risk Management in South Asia, Kabul, Afghanistan, 8–9 August 2010; SAARC Disaster Management Centre: New Delhi, India, 2010; pp. 111–119. [Google Scholar]
  30. Imbulana, L. Drought management in Sri Lanka. In Proceedings of the SAARC Workshop on Drought Risk Management in South Asia, Kabul, Afghanistan, 8–9 August 2010; SAARC Disaster Management Centre: New Delhi, India, 2010; pp. 164–175. [Google Scholar]
  31. National Environment Commission Secretariat. Bhutan National Adaptation Programme of Action (NAPA 2006); National Environment Commission Secretariat, Royal Government of Bhutan: Thimphu, Bhutan, 2006.
  32. Raghib, A.B.; Rahman, M.M. Drought management scenarios in Bangladesh. In Proceedings of the SAARC Workshop on Drought Risk Management in South Asia, Kabul, Afghanistan, 8–9 August 2010; SAARC Disaster Management Centre: New Delhi, India, 2010; pp. 50–62. [Google Scholar]
  33. Muhammad, A.; Jha, S.K.; Rasmussen, P. Drought Characterization for a Snow-Dominated Region of Afghanistan. J. Hydrol. Eng. 2017, 22, 05017014. [Google Scholar] [CrossRef]
  34. Privara, A.; Privarova, M. Nexus between climate change, displacement and conflict: Afghanistan case. Sustainability 2019, 11, 5586. [Google Scholar] [CrossRef] [Green Version]
  35. WFP (World Food Programme). Afghanistan Countrywide Food Needs Assessment of Rural and Settled Populations; World Food Programme: Kabul, Afghanistan, 2003. [Google Scholar]
  36. Bhattacharyya, K.; Azizi, P.M.; Shobair, S.S.; Mohsini, M.Y. Drought Impacts and Potential for Their Mitigation in Southern and Western Afghanistan; Working Paper 91; International Water Management Institute: Colombo, Sri Lanka, 2004. [Google Scholar]
  37. Zimmermann, M.; Glombitza, K.F.; Rothenberger, B. Disaster Risk Reduction Programme for Bangladesh; The Swiss Agency for Development and Cooperation (SDC), Directorate of Humanitarian Aid and SHA: Bern, Switzerland, 2010. [Google Scholar]
  38. Dey, N.C.; Alam, M.S.; Sajjan, A.K.; Bhuiyan, M.A.; Ghose, L.; Ibaraki, Y.; Karim, F. Assessing Environmental and Health Impact of Drought in the Northwest Bangladesh. J. Environ. Sci. Nat. Resour. 2011, 4, 89–97. [Google Scholar] [CrossRef]
  39. Adnan, S. Living without Floods: Lessons from the Drought of 1992; Research & Advisory Services: Dhaka, Bangladesh, 1993; Volume 2. [Google Scholar]
  40. Hossain, M. Natural calamities, instability in production and food policy in Bangladesh. Bangladesh Dev. Stud. 1990, 18, 33–54. [Google Scholar]
  41. Erickson, N.J.; Ahmed, Q.K.; Chowdhury, A.R. Chapter 5: Socio-economic implications of climate change for Bangladesh. In The Implications of Climate and Sea–Level Change for Bangladesh; Warrick, R.A., Ahmad, Q.K., Eds.; Springer: Dordrecht, The Netherlands, 1993; pp. 205–287. [Google Scholar]
  42. Abedin, M.A.; Habiba, U.; Shaw, R. Chapter 10 health: Impacts of salinity, arsenic and drought in south-western bangladesh. In Environment Disaster Linkages (Community, Environment and Disaster Risk Management), 1st ed.; Shaw, R., Tran, P., Eds.; Emerald Group Publishing Limited: Bingley, UK, 2012; Volume 9, pp. 165–193. [Google Scholar]
  43. Venkateswarly, B. Agricultural drought management in India. In Proceedings of the SAARC Workshop on Drought Risk Management in South Asia, Kabul, Afghanistan, 8–9 August 2010; SAARC Disaster Management Centre: New Delhi, India, 2010; pp. 88–104. [Google Scholar]
  44. Shewale, M.P.; Kumar, S. Climatological Features of Drought Incidences in India; National Climate Centre Office of the Additional Director General of Meteorology (Research), India Meteorological Department: Pune, India, 2005; p. 22. [Google Scholar]
  45. Joshi, N.; Gupta, D.; Suryawanshi, S.; Adamowski, J.; Madramootoo, C.A. Analysis of trends and dominant periodicities in drought variables in India: A wavelet transform based approach. Atmos. Res. 2016, 182, 200–220. [Google Scholar] [CrossRef]
  46. Ashraf, M.; Routray, J.K. Spatio-temporal characteristics of precipitation and drought in Balochistan Province, Pakistan. Nat. Hazards 2015, 77, 229–254. [Google Scholar] [CrossRef]
  47. United Nations. Drought Risk Reduction Framework and Practices: Contribution to the Implementation of the Hyogo Framework for Action; United Nations Secretariat of the International Strategy for Disaster Reduction: Geneva, Switzerland, 2009. [Google Scholar]
  48. Wang, S.Y.; Yoon, J.H.; Gillies, R.R.; Cho, C. What caused the winter drought in western Nepal during recent years? J. Clim. 2013, 26, 8241–8256. [Google Scholar] [CrossRef]
  49. Adhikari, S. Drought impact and adaptation strategies in the mid-hill farming system of Western Nepal. Environments 2018, 5, 101. [Google Scholar] [CrossRef] [Green Version]
  50. Joshi, G.R. Agricultural Economy of Nepal: Development Challenges and Opportunities; Sustainable Research and Development Centre: Kathmandu, Nepal, 2018. [Google Scholar]
  51. Disaster Management Center. Impacts of Disasters in Sri Lanka: 2016; The Consortium of Humanitarian Agencies (CHA): Colombo, Sri Lanka, 2016. [Google Scholar]
  52. Disaster Management Center. Sri Lanka National Report on Disaster Risk, Poverty and Human Development Relationship; Disaster Management Center: Colombo, Sri Lanka, 2009. [Google Scholar]
  53. Climate Risk Profile for the Maldives. Available online: http://ndmc.gov.mv/assets/Uploads/Climate-Risk-Profile-for-the-Maldives-Final-Report-2006.pdf (accessed on 9 March 2021).
  54. Maletta, H.; Favre, R. Agricultural and Food Production in Post-War Afghanistan: A Report on the Winter Agricultural Survey 2001–2003; Food and Agriculture Organization of the United Nations: Kabul, Afghanistan, 2003. [Google Scholar]
  55. Ramamasy, S.; Baas, S. Climate Variability and Change: Adaptation to Drought in Bangladesh, a Resource Book and Training Guide; Institutions for Rural Development, FAO: Rome, Italy, 2007. [Google Scholar]
  56. Chhogyel, N.; Kumar, L.; Bajgai, Y. Consequences of climate change impacts and incidences of extreme weather events in relation to crop production in Bhutan. Sustainability 2020, 12, 4319. [Google Scholar] [CrossRef]
  57. Gadgil, S.; Vinayachandran, P.N.; Francis, P.A. Droughts of the Indian summer monsoon: Role of clouds over the Indian Ocean. Curr. Sci. 2003, 85, 1713–1719. [Google Scholar]
  58. Ahmed, S.; Hussain, Z.; Qureshi, A.S.; Majeed, R.; Saleem, M. Drought mitigation in Pakistan: Current status and options for future strategies. In Proceedings of the SAARC Workshop on Drought Risk Management in South Asia, Kabul, Afghanistan, 8–9 August 2010; SAARC Disaster Management Centre: New Delhi, India, 2010; pp. 120–163. [Google Scholar]
  59. Sarkar, J. Monitoring and early warning of drought in India. In Proceedings of the SAARC Workshop on Drought Risk Management in South Asia, Kabul, Afghanistan, 8–9 August 2010; SAARC Disaster Management Centre: New Delhi, India, 2010; pp. 78–87. [Google Scholar]
  60. Kulshreshtha, S.M. Drought Management in India and Potential Contribution of Climate Prediction, South Joint COLA/CARE Technical Report No.1; Institute of Global Environment and Society: Calverton, NY, USA, 1997; p. 105. [Google Scholar]
  61. Mishra, V.; Tiwari, A.D.; Aadhar, S.; Shah, R.; Xiao, M.; Pai, D.S.; Lettenmaier, D. Drought and famine in India, 1870–2016. Geophys. Res. Lett. 2019, 46, 2075–2083. [Google Scholar] [CrossRef]
  62. Alami, M.M.; Hayat, E.; Tayfur, G. Proposing a Popular Method for Meteorological Drought Monitoring in the Kabul River Basin, Afghanistan. Int. J. Adv. Eng. Res. Sci. 2017, 4, 103–110. [Google Scholar] [CrossRef]
  63. Jayasiri, H.B.; Dahanayaka, D.D.G.L. Saltwater intrusion and its impact on Koggala lagoon and associated waters, Southern coast of Sri Lanka. Asian J. Water Environ. Pollut. 2012, 9, 73–84. [Google Scholar]
  64. Mondol, M.A.H. Application of Standardized Precipitation Index to assess meteorological drought in Bangladesh. Jamba J. Disaster Risk Stud. 2016, 8, 1–14. [Google Scholar] [CrossRef] [Green Version]
  65. Comprehensive Disaster Management Programme. Vulnerability to Climate Induced Drought: Scenario and Impacts; Saha, S.K., Ali, M.S., Shahid, S., Eds.; Comprehensive Disaster Management Programme, Ministry of Disaster Management and Relief: Dhaka, Bangladesh, 2013. [Google Scholar]
  66. Rasheed, A. Rainfall characteristics and its distribution in Maldives. In Proceedings of the SAARC Workshop on Drought Risk Management in South Asia, Kabul, Afghanistan, 8–9 August 2010; SAARC Disaster Management Centre: New Delhi, India, 2010; pp. 105–110. [Google Scholar]
  67. Purkayastha, A.; Soundararajan, P.J. Current status on drought risk management in India. In Proceedings of the SAARC Workshop on Drought Risk Management in South Asia, Kabul, Afghanistan, 8–9 August 2010; SAARC Disaster Management Centre: New Delhi, India, 2010; pp. 63–77. [Google Scholar]
  68. Werner, W.L. Canopy dieback in the upper montane rain forests of Sri Lanka. Geo J. 1988, 17, 245–248. [Google Scholar] [CrossRef]
  69. SAARC Disaster Management Centre. Proceedings of the SAARC Workshop on Drought Risk Management in South Asia, Kabul, Afghanistan, 8–9 August 2010; SAARC Disaster Management Centre: New Delhi, India, 2010. [Google Scholar]
  70. Afghanistan: Integrated Drought Response, December 2018. Available online: https://www.humanitarianresponse.info/en/operations/afghanistan/infographic/afghanistan-integrated-drought-response-dashboard-jan-dec-2018 (accessed on 15 December 2020).
  71. Iqbal, M.W.; Donjadee, S.; Kwanyuen, B.; Liu, S.Y. Farmers’ perceptions of and adaptations to drought in Herat Province, Afghanistan. J. Mt. Sci. 2018, 15, 1741–1756. [Google Scholar] [CrossRef]
  72. Abeysingha, N.S.; Rajapaksha, U.R.L.N. SPI-Based Spatiotemporal Drought over Sri Lanka. Adv. Meteorol. 2020, 9753279. [Google Scholar] [CrossRef] [Green Version]
  73. Zubair, L.; Ralapanawe, V.; Tennakoon, U.; Yahiya, Z.; Perera, R. Chapter 4: Natural disaster risks in Sri Lanka: Mapping hazards and risk hotspots. In Natural Disaster Hotspots: Case Studies; World Bank: Washington, DC, USA, 2006; p. 109. [Google Scholar]
  74. Chithranayana, R.D.; Punyawardena, B.V.R. Identification of drought prone agro-ecological regions in Sri Lanka. J. Natl. Sci. Found. Sri Lanka 2008, 36, 117–123. [Google Scholar] [CrossRef] [Green Version]
  75. Sri Lanka: Initial Rapid Assessment on Drought 2016/17. Government of Sri Lanka. Available online: https://reliefweb.int/sites/reliefweb.int/files/resources/SLA_Drought_20170119_updated.pdf (accessed on 15 December 2020).
  76. World Food Program. Sri Lanka: Joint Assessment of Drought Impact on Food Security and Livelihoods; Ministry of Disaster Management Center: Colombo, Sri Lanka, 2017. [Google Scholar]
  77. Dahal, P.; Shrestha, N.S. Analysis of meteorological drought in Gandaki river basin Nepal by Standardized Precipitation Index. In Proceedings of the American Geophysical Union, Fall Meeting, San Francisco, CA, USA, 15–19 December 2014. [Google Scholar]
  78. Dahal, P.; Shrestha, N.S.; Shrestha, M.L.; Krakauer, N.Y.; Panthi, J.; Pradhanang, S.M.; Jha, A.; Lakhankar, T. Drought risk assessment in central Nepal: Temporal and spatial analysis. Nat. Hazards 2016, 80, 1913–1932. [Google Scholar] [CrossRef] [Green Version]
  79. Baniya, B.; Tang, Q.; Xu, X.; Haile, G.G.; Chhipi-Shrestha, G.K. Spatial and Temporal Variation of Drought Based on Satellite Derived Vegetation Condition Index in Nepal from 1982–2015. Sensors 2019, 19, 430. [Google Scholar] [CrossRef] [PubMed] [Green Version]
  80. Khatiwada, K.R.; Pandey, V.P. Characterization of hydro-meteorological drought in Nepal Himalaya: A case of Karnali river basin. Weather Clim. Extrem. 2019, 26. [Google Scholar] [CrossRef]
  81. De Beurs, K.; Henebry, G.M. War, Drought, and Phenology: Changes in the Land Surface Phenology of Afghanistan since 1982. J. Land Use Sci. 2008, 3, 95–111. [Google Scholar] [CrossRef]
  82. Alami, M.M.; Din, S.W.; Tayfur, G. Meteorological Drought Analysis by Different Methods in Helmand River Basin, Afghanistan. Int. J. Sci. Eng. Res. 2018, 9, 738–745. [Google Scholar] [CrossRef]
  83. Aich, V.; Akhundzadah, N.A.; Knuerr, A.; Khoshbeen, A.J.; Hattermann, F.; Paeth, H.; Scanlon, A.; Paton, E.N. Climate Change in Afghanistan Deduced from Reanalysis and Coordinated Regional Climate Downscaling Experiment (CORDEX)—South Asia Simulations. Climate 2017, 5, 38. [Google Scholar] [CrossRef] [Green Version]
  84. Qutbudin, S.; Shiru, M.S.; Sharafati, A.; Ahmed, K.; Al-Ansari, N.; Yaseen, Z.M.; Shahid, S.; Wang, X. Seasonal drought pattern changes due to climate variability: Case study in Afghanistan. Water 2019, 11, 1096. [Google Scholar] [CrossRef] [Green Version]
  85. Xie, H.; Ringler, C.; Zhu, T.; Waqas, A. Droughts in Pakistan: A spatiotemporal variability analysis using the Standardized Precipitation Index. Water Int. 2013, 38, 620–631. [Google Scholar] [CrossRef]
  86. Khan, M.A.; Gadiwala, M.S. A Study of Drought over Sindh (Pakistan) Using Standardized Precipitation Index (SPI) 1951 to 2010. Pak. J. Meteorol. 2013, 9, 15–22. [Google Scholar]
  87. Adnan, S.; Ullah, K.; Gao, S. Characterization of drought and its assessment over Sindh, Pakistan during 1951–2010. J. Meteorol. Res. 2015, 29, 837–857. [Google Scholar] [CrossRef]
  88. Adnan, S.; Ullah, K.; Gao, S. Investigations into precipitation and drought climatologies in South Central Asia with special focus on Pakistan over the period 1951–2010. J. Clim. 2016, 29, 6019–6035. [Google Scholar] [CrossRef]
  89. Adnan, S.; Ullah, K.; Gao, S.; Khosa, A.H.; Wang, Z. Shifting of agro-climatic zones their drought vulnerability, and precipitation and temperature trends in Pakistan. Int. J. Climatol. 2017, 37, 529–543. [Google Scholar] [CrossRef]
  90. Bilal, M.; Liaqat, M.U.; Cheema, M.J.M.; Mahmood, T.; Khan, Q. Spatial drought monitoring in Thar Desert using satellite based drought indices and geo-informatics techniques. Proceedings 2017, 2, 179. [Google Scholar] [CrossRef] [Green Version]
  91. Ahmed, K.; Shahid, S.; Chung, E.S.; Wang, X.J.; Harun, S.B. Climate change uncertainties in seasonal drought severity-area-frequency curves: Case of arid region of Pakistan. J. Hydrol. 2019, 570, 473–485. [Google Scholar] [CrossRef]
  92. Amin, M.; Khan, A.H.; Perveen, A.; Rauf, Z.; Hassan, S.S.; Goheer, M.A.; Ijaz, M. Drought Risk Assessment: A Case Study in Punjab, Pakistan. Sarhad J. Agric. 2019, 35, 234–243. [Google Scholar] [CrossRef]
  93. Kumar, M.N.; Murthy, C.S.; Sesha, M.V.R.; Sai, S.; Roy, P.S. Spatiotemporal analysis of meteorological drought variability in the Indian region using standardized precipitation index. Meteorol. Appl. 2012, 19, 256–264. [Google Scholar] [CrossRef] [Green Version]
  94. Patel, N.R.; Parida, B.R.; Venus, V.; Saha, S.K.; Dadhwal, V.K. Analysis of agricultural drought using vegetation temperature condition index (VTCI) from Terra/MODIS satellite data. Environ. Monit. Assess. 2012, 184, 7153–7163. [Google Scholar] [CrossRef] [PubMed]
  95. Palchaudhuri, M.; Biswas, S. Analysis of meteorological drought using standardized Precipitation Index—A case study of Puruliya District, West Bengal, India. World Academy of Science, Engineering and Technology. Int. J. Environ. Ecol. Eng. 2013, 7, 167–174. [Google Scholar]
  96. Mundetia, N.; Sharma, D. Analysis of rainfall and drought in Rajastan state, India. Glob. Nest J. 2015, 17, 12–21. [Google Scholar]
  97. Pai, D.S.; Guhathakurta, P.; Kulkarni, A.; Rajeevan, M.N. Variability of meteorological droughts over India. In Observed Climate Variability and Change over the Indian Region; Rajeevan, M., Nayak, S., Eds.; Springer Geology, Springer: Singapore, 2017; pp. 73–87. [Google Scholar]
  98. Guhathakurta, P.; Menon, P.; Inkane, P.M. Trends and variability of meteorological drought over the districts of India using standardized precipitation index. J. Earth Syst. Sci. 2017, 126, 120. [Google Scholar] [CrossRef] [Green Version]
  99. Thakur, A.; Liansangpuii, F.; Choudhary, S. Temporal analysis of drought using standardized precipitation index for Wainganga sub-basin, India. J. Pharmacogn. Phytochem. 2019, 8, 268–272. [Google Scholar]
  100. Bhuiyan, C.; Singha, R.P.; Koganc, F.N. Monitoring drought dynamics in the Aravalli region (India) using different indices based on ground and remote sensing data. Int. J. Appl. Earth Obs. Geoinf. 2006, 8, 289–302. [Google Scholar] [CrossRef]
  101. Mahajan, D.R.; Dodamani, B.M.; Mannina, G. Spatial and temporal drought analysis in the Krishna river basin of Maharashtra, India. Cogent Eng. 2016, 3, 15. [Google Scholar] [CrossRef]
  102. Surendran, U.; Anagha, B.; Raja, P. Analysis of Drought from Humid, Semi-Arid and Arid Regions of India Using DrinC Model with Different Drought Indices. Water Resour. Manag. 2019, 33, 1521–1540. [Google Scholar] [CrossRef]
  103. Wable, P.S.; Jha, M.K.; Shekhar, A. Comparison of Drought Indices in a Semi-Arid River Basin of India. Water Resour. Manag. 2019, 33, 75–102. [Google Scholar] [CrossRef]
  104. Pandey, R.P.; Mishra, S.K.; Singh, R.; Ramasastri, K.S. Streamflow drought severity analysis of Betwa river system (India). Water Resour. Manag. 2008, 22, 1127–1141. [Google Scholar] [CrossRef]
  105. Alamgir, M.; Shahid, S.; Hazarika, M.K.; Nashrrullah, S.; Haruns, B.; Shamsudin, S. Analysis of meteorological drought pattern during different climatic and cropping seasons in Bangladesh. J. Am. Water Resour. Assoc. 2015, 51, 794–806. [Google Scholar] [CrossRef]
  106. Rahman, M.R.; Lateh, H. Meteorological Drought in Bangladesh: Assessing, Analysing and Hazard Mapping Using SPI, GIS and Monthly Rainfall Data. Environ. Earth Sci. 2016, 75, 1026. [Google Scholar] [CrossRef]
  107. Mondol, M.A.H.; Ara, I.; Das, S.C. Meteorological Drought Index Mapping in Bangladesh by Using Standardized Precipitation Index (SPI) over 1981–2010. Adv. Meteorol. 2017, 2017, 4642060. [Google Scholar] [CrossRef] [Green Version]
  108. Shahid, S. Spatial and temporal characteristics of droughts in the western parts of Bangladesh. Hydrol. Process. 2008, 22, 2247–2265. [Google Scholar] [CrossRef]
  109. Shahid, S.; Behrawan, H. Drought risk assessment in the western part of Bangladesh. Nat. Hazards 2008, 46, 391–413. [Google Scholar] [CrossRef]
  110. Azam, M.N.; Rahman, M.A.; Kamal, S.M.M. Environmental concerns: Assessment of meteorological drought. Int. J. Environ. Sustain. Dev. 2017, 16, 156. [Google Scholar] [CrossRef]
  111. Alamgir, M.; Mohsenipour, M.; Homsi, R.; Wang, X.; Shahid, S.; Shiru, M.S.; Alias, E.; Yuzir, A. Parametric Assessment of Seasonal Drought Risk to Crop Production in Bangladesh. Sustainability 2019, 11, 1442. [Google Scholar] [CrossRef] [Green Version]
  112. Shahid, S.; Hazarika, M.K. Groundwater drought in the Northwestern districts of Bangladesh. Water Resour. Manag. 2010, 24, 1989–2006. [Google Scholar] [CrossRef]
  113. Disaster Management Center and United Nations Development Program. Chapter 3: Drought. In Hazard profiles of Sri Lanka; Disaster Management Center: Colombo, Sri Lanka, 2012. [Google Scholar]
  114. Lyon, B.; Zubair, L.; Ralapanawe, V.; Yahiya, Z. Fine Scale Evaluation of Drought in a Tropical Setting: Case Study in Sri Lanka. J. Appl. Meteorol. Climatol. 2009, 48, 77–88. [Google Scholar] [CrossRef]
  115. Ekanayake, E.M.R.S.B.; Perera, K. Analysis of drought severity and duration using copulas in Anuradhapura, Sri Lanka. Br. J. Environ. Clim. Chang. 2014, 4, 312–327. [Google Scholar] [CrossRef]
  116. Herath, H.M.R.C.; Premalal, K.H.M.S.; Kaumudie, A.L.I.; Sanjeewani, D.M.N. Analysis of Standard Precipitation Indices to Identify for Drought Condition in 2015. Sri Lanka J. Meteorol. 2015, 1, 20–31. [Google Scholar]
  117. Manesha, S.; Vimukthini, S.; Premalal, K.H.M.S. Develop drought monitoring in Sri Lanka using Standard Precipitation Index (SPI). Sri Lanka J. Meteorol. 2015, 1, 64–71. [Google Scholar]
  118. Gunda, T.; Hornbergera, G.M.; Gilliganb, J.M. Spatiotemporal patterns of agricultural drought in Sri Lanka: 1881–2010. Int. J. Climatol. 2016, 36, 563–575. [Google Scholar] [CrossRef]
  119. Jayawardana, J.M.D.R.; Yapa, R.D.; Kumarathunge, D. Modeling extreme drought events in major coconut growing agro-ecological regions in Sri Lanka. Int. J. Sci. Res. 2016, 5, 1249–1253. [Google Scholar]
  120. World Meteorological Organization. Drought Monitoring and Early Warning: Concepts, Progress and Future Challenges; World Meteorological Organization: Geneva, Switzerland, 2006. [Google Scholar]
  121. Wilhite, D.A.; Buchanan-Smith, M. Drought as hazard: Understanding the natural and social context. In Drought and Water Crises: Science, Technology, and Management Issues; Wilhite, D.A., Ed.; Taylor and Francis: Boca Raton, FL, USA, 2005; pp. 3–29. [Google Scholar]
  122. Heim, R.R. A review of twentieth-century drought indices used in the United States. Bull. Am. Meteorol. Soc. 2002, 83, 1149–1165. [Google Scholar] [CrossRef] [Green Version]
  123. Steinemann, A.; Hayes, M.; Cavalcanti, L. Drought indicators and triggers. In Drought and Water Crises: Science, Technology, and Management Issues; Wilhite, D.A., Ed.; Taylor and Francis: Boca Raton, FL, USA, 2005; pp. 71–92. [Google Scholar]
  124. Sharma, T.C.; Panu, U.S. Prediction of hydrological drought durations based on Markov chains: Case of the Canadian prairies. Hydrol. Sci. J. 2012, 57, 705–722. [Google Scholar] [CrossRef] [Green Version]
  125. Wetterhall, F.; Winsemius, H.; Dutra, E.; Werner, M.; Pappenberger, E. Seasonal predictions of agro-meteorological drought indicators for the Limpopo basin. Hydrol. Earth Syst. Sci. 2015, 19, 2577–2586. [Google Scholar] [CrossRef] [Green Version]
  126. Quan, X.-W.; Hoerling, M.P.; Lyon, B.; Kumar, A.; Bell, M.A.; Tippett, M.K.; Wang, H. Prospects for dynamical prediction of meteorological drought. J. Appl. Meteorol. Climatol. 2012, 51, 1238–1252. [Google Scholar] [CrossRef]
  127. Yoon, J.H.; Mo, K.; Wood, E.F. Dynamic model-based seasonal prediction of meteorological drought over the contiguous United States. J. Hydrometeorol. 2012, 13, 463–482. [Google Scholar] [CrossRef]
  128. Yuan, X.; Wood, E.F. Multi model seasonal forecasting of global drought onset. Geophys. Res. Lett. 2013, 40, 4900–4905. [Google Scholar] [CrossRef]
  129. Schubert, S.; Koster, R.; Hoerling, M.; Seager, R.; Lettenmaier, D.; Kumar, A.; Gutzler, D. Predicting drought on seasonal-to-decadal time scales. Bull. Am. Meteorol. Soc. 2007, 88, 1625–1630. [Google Scholar] [CrossRef] [Green Version]
  130. Shah, R.; Mishra, V. Short-term drought prediction in India. In Proceedings of the American Geophysical Union, Fall Meeting, San Francisco, CA, USA, 15–19 December 2014. [Google Scholar]
  131. Mishra, A.K.; Desai, V.R. Drought forecasting using feed-forward recursive neural network. Ecol. Modeling 2006, 198, 127–138. [Google Scholar] [CrossRef]
  132. Rahaman, A.Z.; Al Hossain, B.M.T.; Ahmed, T. Assessment of drought characteristics in Bangladesh. In Proceedings of the 6th International Conference on Water and Flood Management, Dhaka, Bangladesh, 4–6 March 2017. [Google Scholar]
  133. Illeperuma, G.D.; Sonnadara, U. Forecasting droughts using artificial neural networks. In National Symposium on Disaster Risk Reduction & Climate Change Adaptation; Ministry Of Disaster Management: Colombo, Sri Lanka, 2009. [Google Scholar]
  134. Drought Monitoring System. Available online: http://dms.iwmi.org/ (accessed on 9 January 2021).
  135. Shah, R.D.; Mishra, V. Development of an Experimental Near-Real-Time Drought Monitor for India. J. Hydrometeorol. 2015, 16, 327–345. [Google Scholar] [CrossRef]
  136. Drought Monitoring and Prediction in South Asia. Available online: https://hepex.irstea.fr/drought-monitoring-and-prediction-in-south-asia/ (accessed on 5 April 2019).
  137. Aadhar, S.; Mishra, V. High-resolution near real-time drought monitoring in South Asia. Sci. Data 2017, 4, 170145. [Google Scholar] [CrossRef] [PubMed] [Green Version]
  138. Tyalagadi, M.S.; Gadgil, A.; Krishnakumar, G. Monsoonal droughts in India—A recent assessment. Pap. Glob. Chang. IGBP 2015, 22, 19–35. [Google Scholar] [CrossRef] [Green Version]
  139. Rahman, A.T.M.S.; Jahan, C.S.; Mazumder, Q.H.; Kamruzzaman, M.D.; Hosono, T. Drought analysis and its implication in sustainable water resources management in Barind Area, Bangladesh. J. Geol. Soc. India 2017, 89, 47–56. [Google Scholar] [CrossRef]
  140. Zhou, T.J.; Hong, T. Projected changes of Palmer Drought Severity Index under an RCP 8.5 scenario. Atmos. Ocean. Sci. Lett. 2013, 6, 273–278. [Google Scholar]
  141. Barlow, M.; Zaitchik, B.; Paz, S.; Black, E.; Evans, J.; Hoell, J. A review of drought in the Middle East and Southwest Asia. J. Clim. 2016, 29, 8547–8574. [Google Scholar] [CrossRef]
  142. Huang, J.S.M.; Wood, A.; Schubert, S.; Peters-Lidard, C.; Wood, E.; Pulwarty, R.; Mariotti, A.; Barrie, D. Research to Advance National Drought Monitoring and Prediction Capabilities; NOAA Interagency Drought Task Force; NOAA/Modeling Analysis Predictions and Projections: Washington, DC, USA, 2016; p. 29.
Figure 1. The soil moisture and the areal coverage of the droughts, which were not famine. The white regions represent the no-drought condition where, soil moisture percentiles above 30 [61].
Atmosphere 12 00369 g001
Figure 2. Spatial coverage of different drought severities during the Yala and Maha season in Sri Lanka [74].
Atmosphere 12 00369 g002
Figure 3. Average Palmer Drought Severity Index (PDSI) for Afghanistan between 1982 and 2003. The black squares represent the periods with a shortage of moisture [81].
Atmosphere 12 00369 g003
Figure 4. Drought severity map for Puruliya District, West Bengal, India [95].
Atmosphere 12 00369 g004
Figure 5. The drought hazard map for Bangladesh during the Kharif season [111].
Atmosphere 12 00369 g005
Figure 6. Developed drought severity map (a) and distribution of agro-ecological regions of Sri Lanka (b) [113].
Atmosphere 12 00369 g006
Table 1. Frequently used drought indices in South Asia.
Index NameInput ParametersCalculationStrengthWeaknessApplied Area
Palmer Drought Severity Index (PDSI) [4]Rainfall, temperature, and available soil water contentMeasures difference in moisture content from an average condition based on a 2-layer, bucket-type water balance model.Assess both water supply and demand and provides the best estimation of availability of soil moisture (i.e., surplus or deficit). Globally used with widely available codes.Needs serially complete data. Difficult to identify rapidly emerging drought conditions. Cannot be applied for frozen precipitation or frozen soil.For agricultural drought identification.
Standardized Precipitation Index (SPI) [22]RainfallThe probability of precipitation for 1 to 48 months or longer duration is computed using historical rainfall data.Uses only rainfall data. Easy calculation. Ability to use for a 3-month timescale is beneficial for stations with intermittent missing rainfall.Incompetent in assessing the events that have similar SPI but different temperature scenarios because the temperature is not a parameter in this index.For basic drought monitoring, meteorological drought identification, and agricultural drought identification.
Normalized Difference Vegetation Index (NDVI) [20]NOAA AVHRR satellite dataThe radiance values measured in both the visible and near-infrared channels, and global vegetation index data are used for the calculation.Very high resolution and spatially covered. Data processing is extremely important. Historical assessment is limited due to the unavailability of historical satellite data.Identifying and monitoring droughts affecting agriculture.
Percent of Normal Precipitation (PNPI) [20]RainfallThe percentage of the value obtained from actual rainfall is divided by normal rainfall for the required duration is considered.Only requires basic mathematic skills and less time consuming.Some users could confuse mean or average rainfall.Identifying and monitoring various impacts of droughts.
Deciles (DI) [23]RainfallThe entire rainfall data for a location are ranked based on frequency and distribution.Simple and flexible for many situations including wet and dry conditions.Absence of temperature parameters causes underestimation of drought severity.Identifying meteorological, agricultural, and hydrological droughts.
Standardized Precipitation Evapotranspiration Index (SPEI) [24]Precipitation and potential evapotranspiration (PET)Monthly climatic water balance (difference between rainfall and PET) is adjusted using a three-parameter log-logistic distribution.Inclusion of temperature and standardizing the index increase the applicability of the index to all climate regimes. Data requirement is high. Monthly index does not identify rapidly developing drought scenarios.Identify and monitor conditions associated with a variety of drought impacts.
China Z Index (CZI) developed by the National Climate Centre of China in 1995 [20]Monthly rainfallRainfall is used to identify wetness, assuming that rainfall behaves as a Pearson type III distribution.Uses monthly time steps from 1 to 72 months and can identify droughts of various durations.The Z-score data do not represent shorter timescales.The wetness of the events can be monitored over different timescales.
Table 2. Selected examples for loss of crop production due to drought in South Asian countries except for the Maldives.
CountryDrought Impact on Crop ProductionSource
AfghanistanTwelve million farmers in Afghanistan were affected by the drought during 1990–2009.
In the suburbs of Ghor, Badghis, and Hirat, the cultivation area has declined by nearly 70% due to prolonged droughts.
Drought lowered the crop diversity
The yields of peas, cotton, wheat, and barley were reduced significantly by 88%, 17%, and 50–70%, respectively.
80% of forests and pastures were destroyed in the Nimroz, Helmand, and Farah provinces of Afghanistan due to drought.
[54]
BangladeshAnnually, 2.32 million ha and 1.2 million ha of rice fields are destroyed due to drought in Kharif and Rabi seasons, respectively.
The severe drought in Bogra in 1866 and 1951 hit hard on rice production, and rice prices increased massively.
Drought during 1994–1996 caused heavy damage to rice, jute, and bamboo clumps.
[55]
BhutanThe combined effect from the change in the onset of rainfall, drought, and windstorms causes crop damage of 1–19%.[56]
IndiaThe lowest crop production recorded for the last 50 years was observed in 2002 during the Kharif (March to June) season, and crop loss caused a 1% reduction in the GDP of India.
Consecutive drought during 2000–2012 caused a severe loss in crop production.
[57]
NepalDrought during 2008/09 winter season affected 70% of the agricultural areas, and the production of winter crops decreased by 17% at the national level.
Drought during 2009/10 affected rice fields, with production decreasing by up to 11% at the national level.
[29]
PakistanProduction of main crops decreased by 10%, and simultaneously, minor crops had a similar dropdown[58]
Sri LankaIntermittent drought from 1974 to 2008 decreased crop production by 56%.
The loss of seed paddy for the upcoming season was caused during the droughts in 2012/13 and 2016/17.
Failure of two consecutive cultivating seasons during the drought in 2016/17 and an enormous increase in rice prices.
[51]
Table 3. Summarized descriptions of drought in South Asia (i.e., observed severe droughts, vulnerable sectors for the droughts and, drought assessment, monitoring, and prediction methods used in the region).
CountryDescription
The Most Severe Drought Events during Recent 30 Years (1990–2020)Vulnerable Sectors to the DroughtDrought Assessment MethodDrought Monitoring MethodsDrought Prediction Methods
Afghanistan1998–2006, 2007, 2008, 2018 [33,34]Agriculture [54], Water resource [62], Social and economic; Mass migration [34,69,70,71]SPI [62], NDVI [81], PDSI [81], PNPI [62], DI [62], CZI [62]SPI, DI [62], PDSI, PHDI, Z-index [82], SPEI [83,84]SADMPS [135,136]
Bangladesh1994, 2000 [32]Agriculture [55], Water resources [25,112]SPI [25,105,106,107,108,109,110,111], SPEI [25], SGWI [25], NDVI [25]SADMS [134]sc-PDSI [132], VCI [79], SADMPS [135,136]
India2000, 2002, 2009, 2012 [44]Agriculture [57], Social and economic [38,59,60,61] Water resources [98,104]SPI [93,95,98,99,100,103], SPEI [97,103], VTCI [94], SWI [100], VCI [100], TCI [100], VHI [100], NDVI [100], PDN [103], EDI [103], RDI [103], DSI [104]SPI [101], SPEI [103], SADMS [134], SADMPS [135,136]SPI [102], RDI [102], GEFS [130], RMSNN [131], DMSNN [131], ARIMA [131], SADMPS [135,136]
Nepal1992, 2008–2009, 2012–2013, 2015 [49,50]Agriculture [29], Water resources [15,80]SPI [15,77,80], VCI [79], SPEI [80], RDI [80], sc-PDSI [80], SFI [80], PHDI [80]SADMS [134]SADMPS [135,136]
Pakistan1998–2004 [47]Agriculture [58], Water resources [86], Social and economic [60] SPI [85,86,87,90,91,92], DI [88], NDVI [90]SADMS [134]SADMPS [135,136]
Sri Lanka2001, 2004, 2012, 2014, 2016–2017 [51,52]Agriculture and livestock production [51,76], Social and economic [61], Water resources [38,43,55,63,64,65,66,67,75], Hydropower [75], Flora and Fauna [68]SPI [114,115,116,117,118,119], PDSI [118], Novel index [113]SADMS [134]SPI [133], SADMPS [135,136]
Publisher’s Note: MDPI stays neutral with regard to jurisdictional claims in published maps and institutional affiliations.

