
Recent Changes in the Low-Level Jet along the Subtropical West Coast of South America

 , and
, and
Abstract
:1. Introduction
2. Materials and Methods
2.1. Data Sets
2.2. Data Processing
3. Results
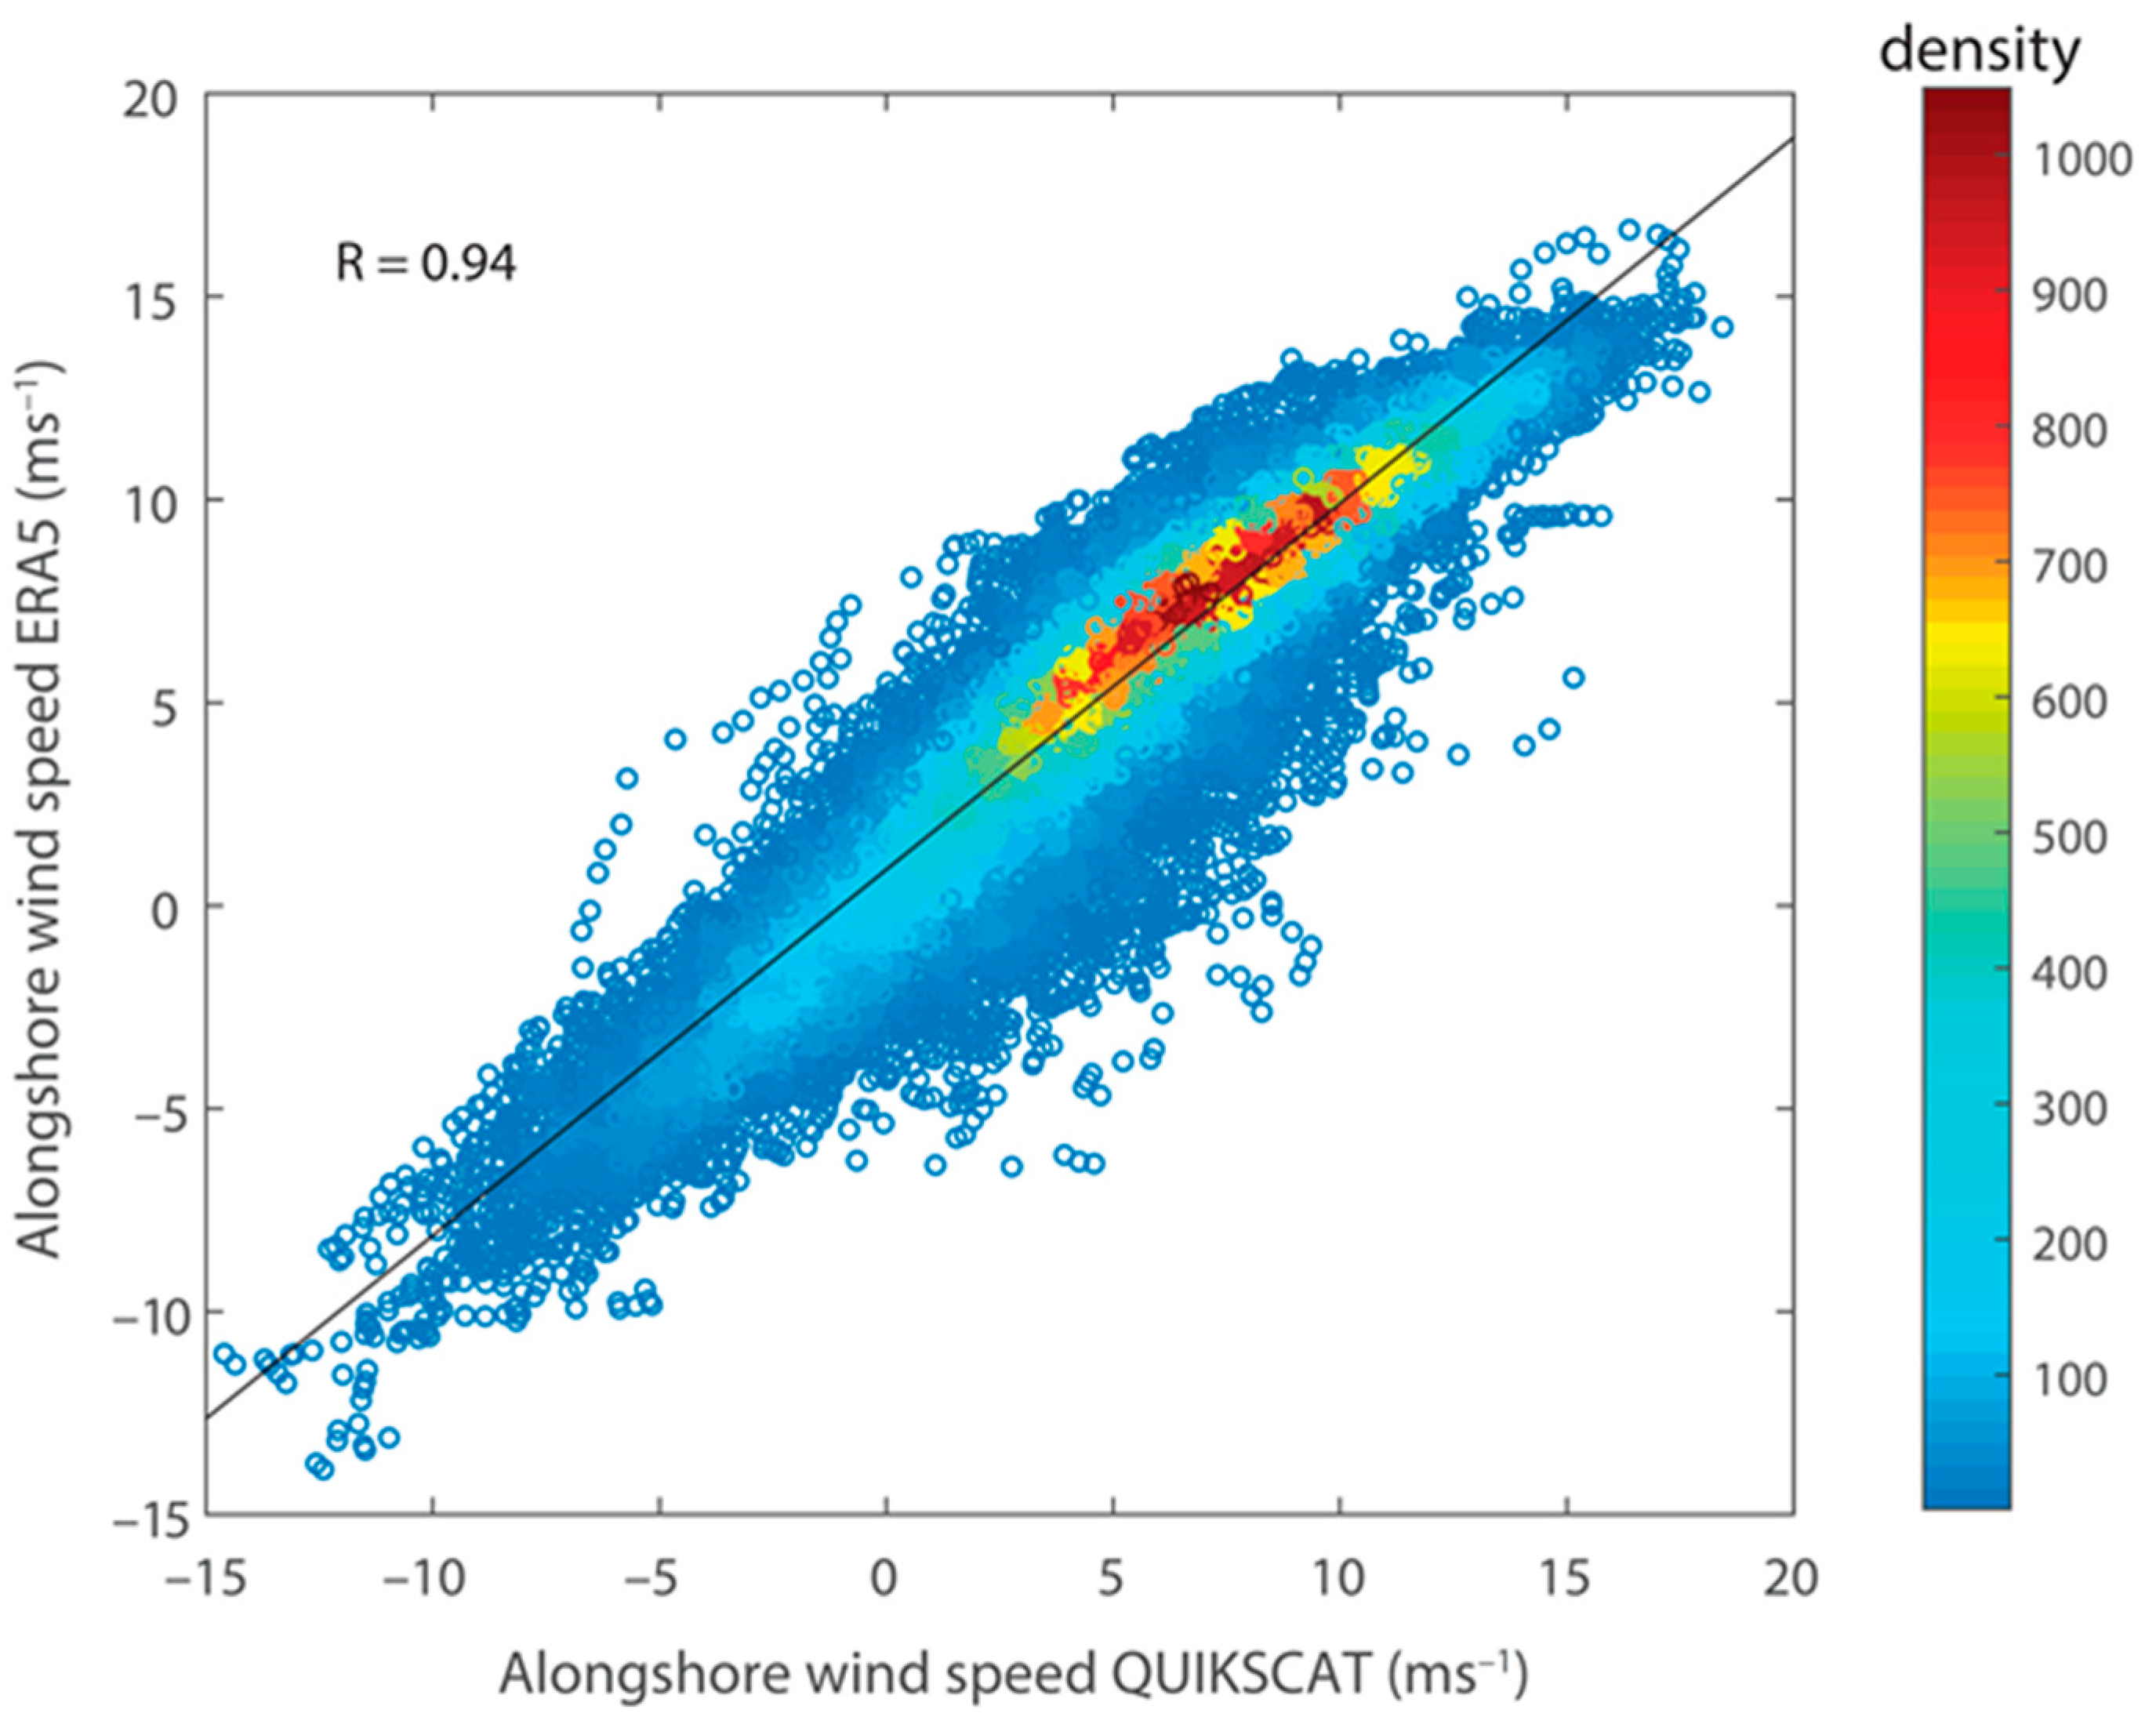
3.1. Wind Quality Assessments
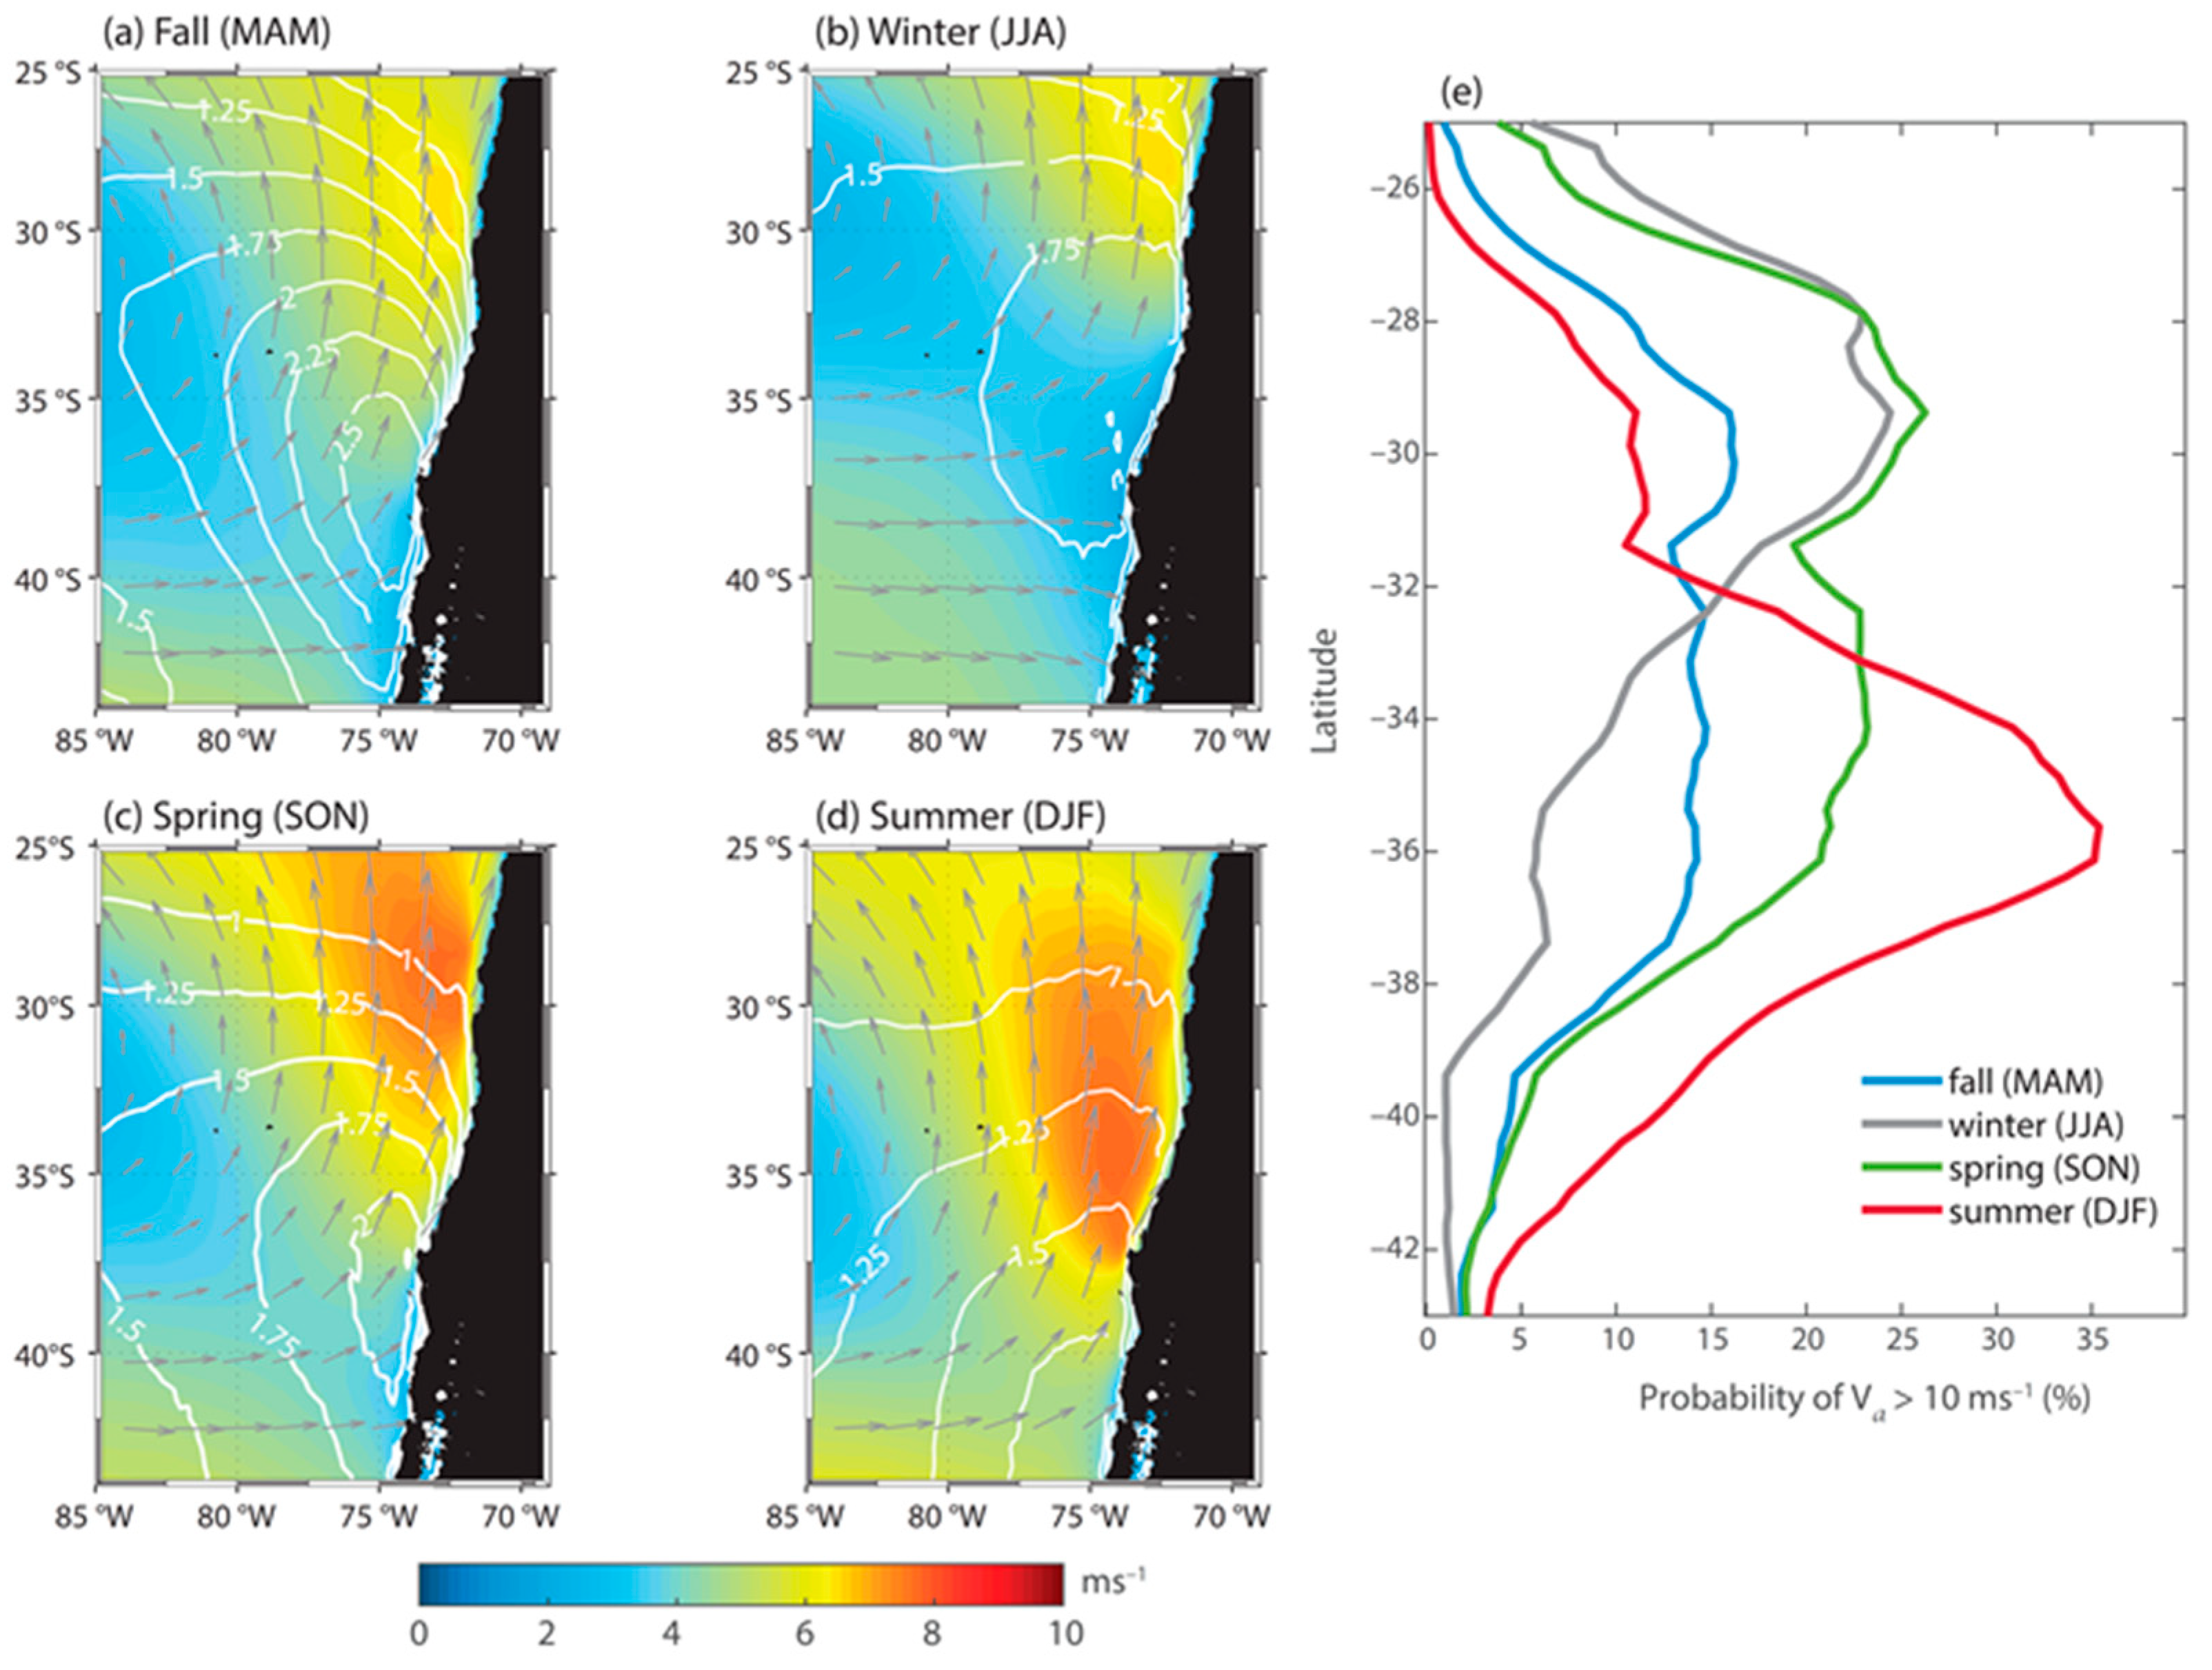
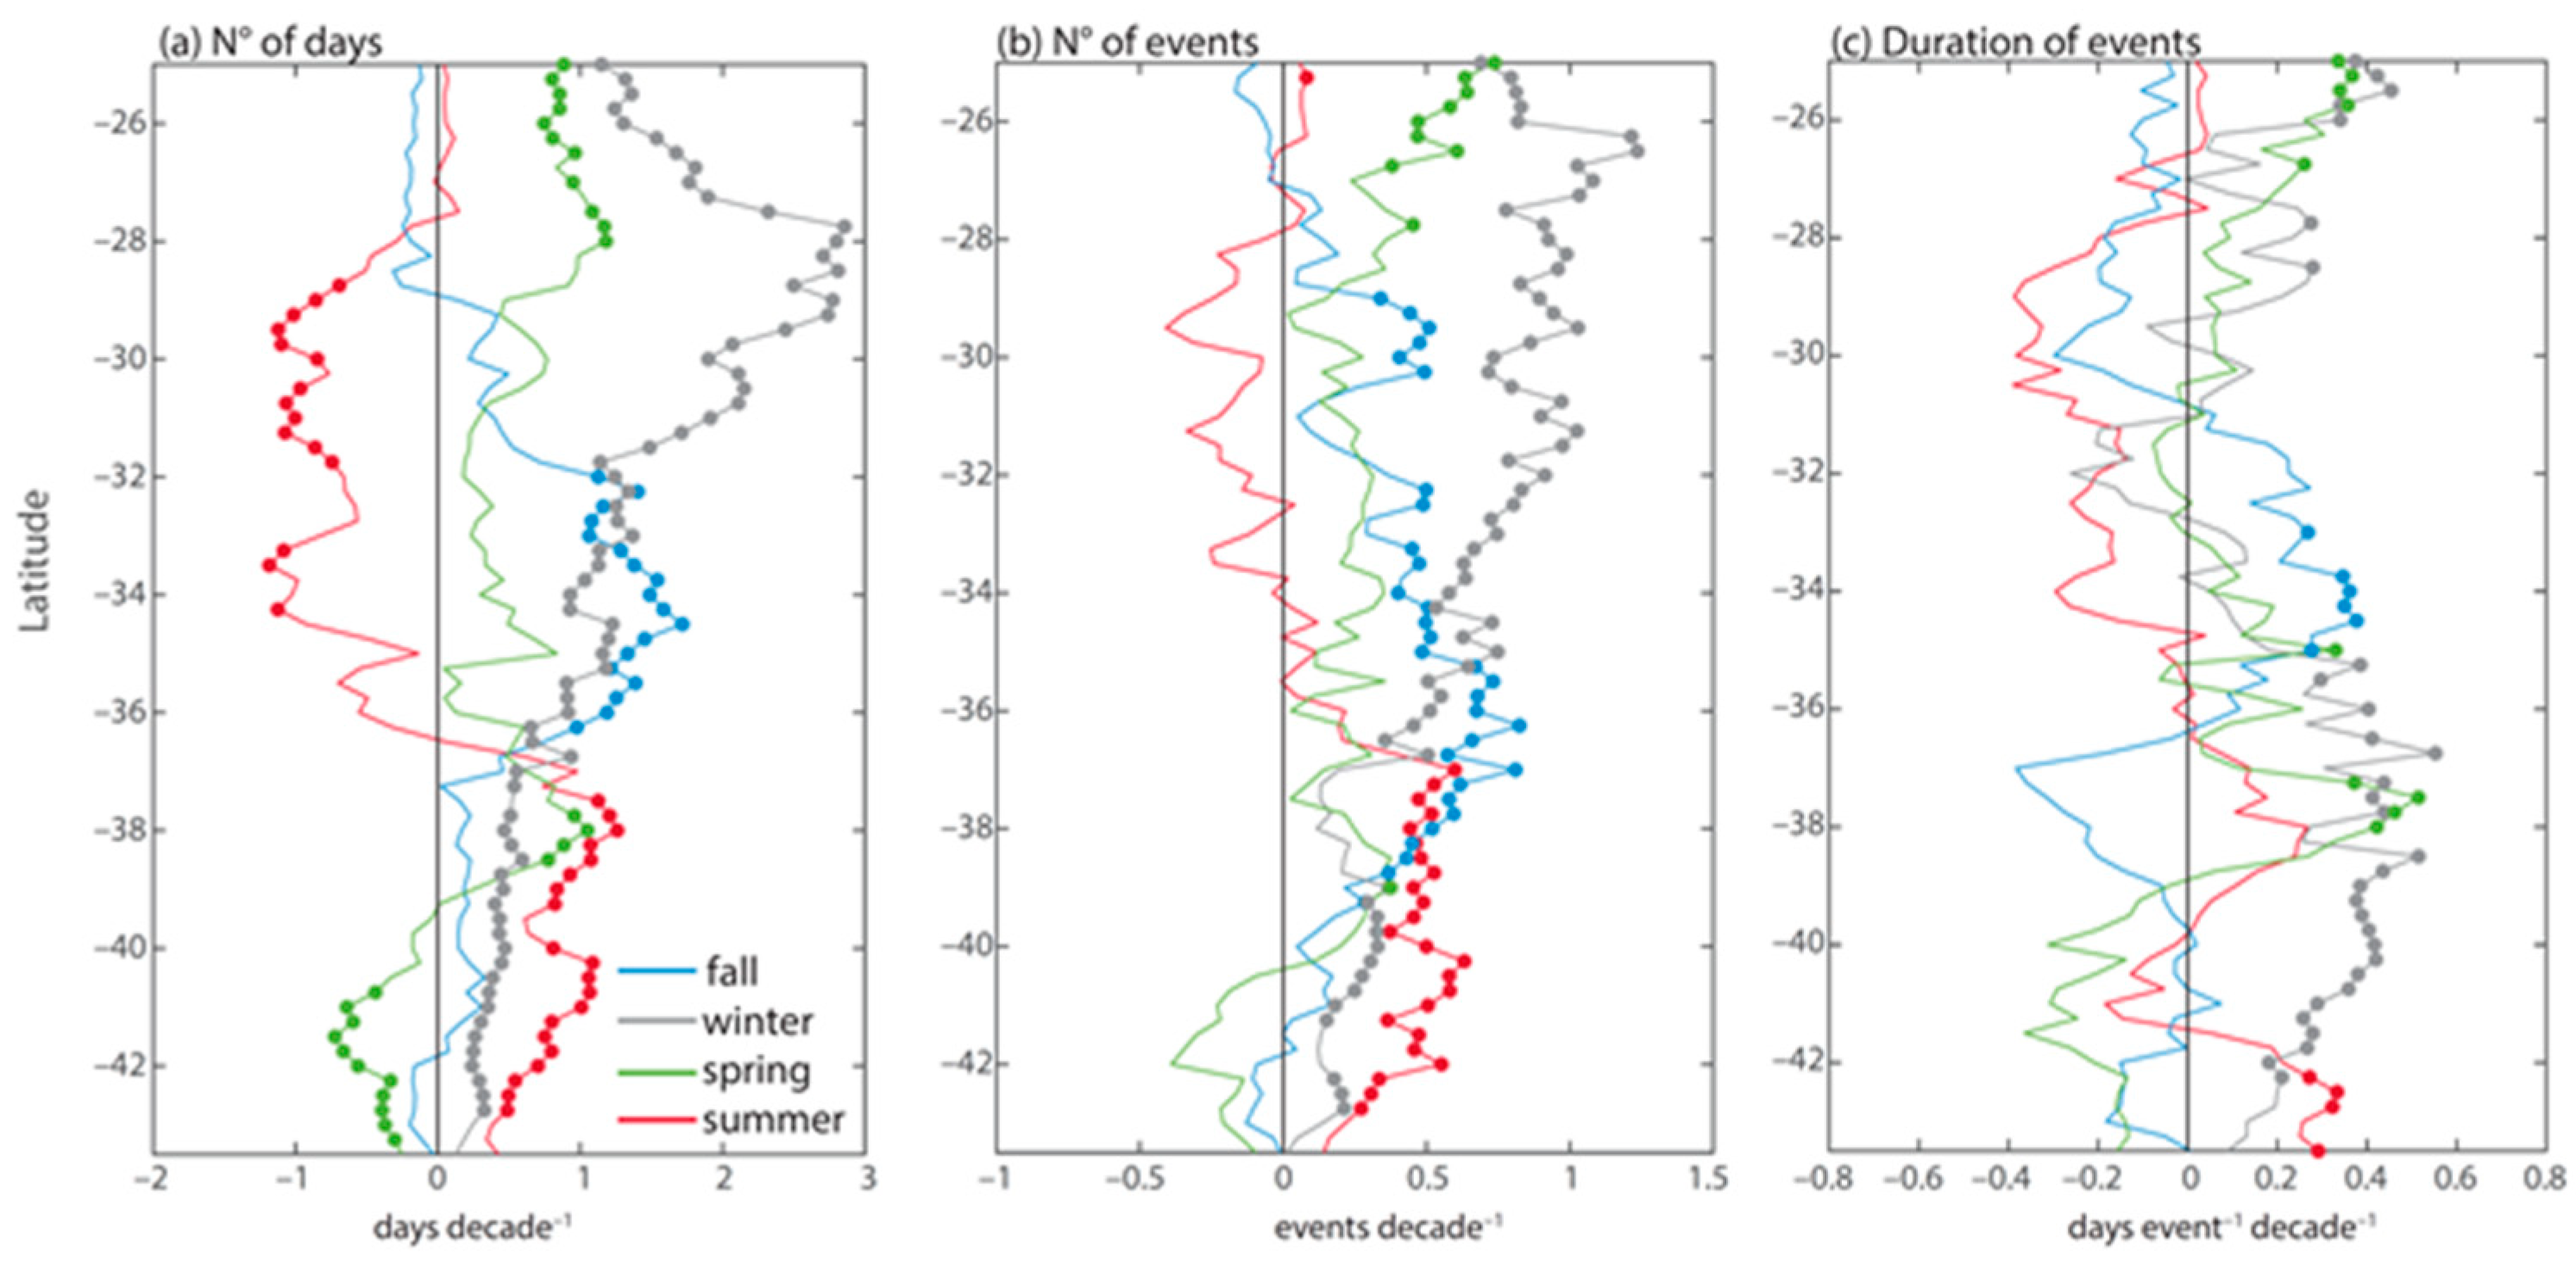
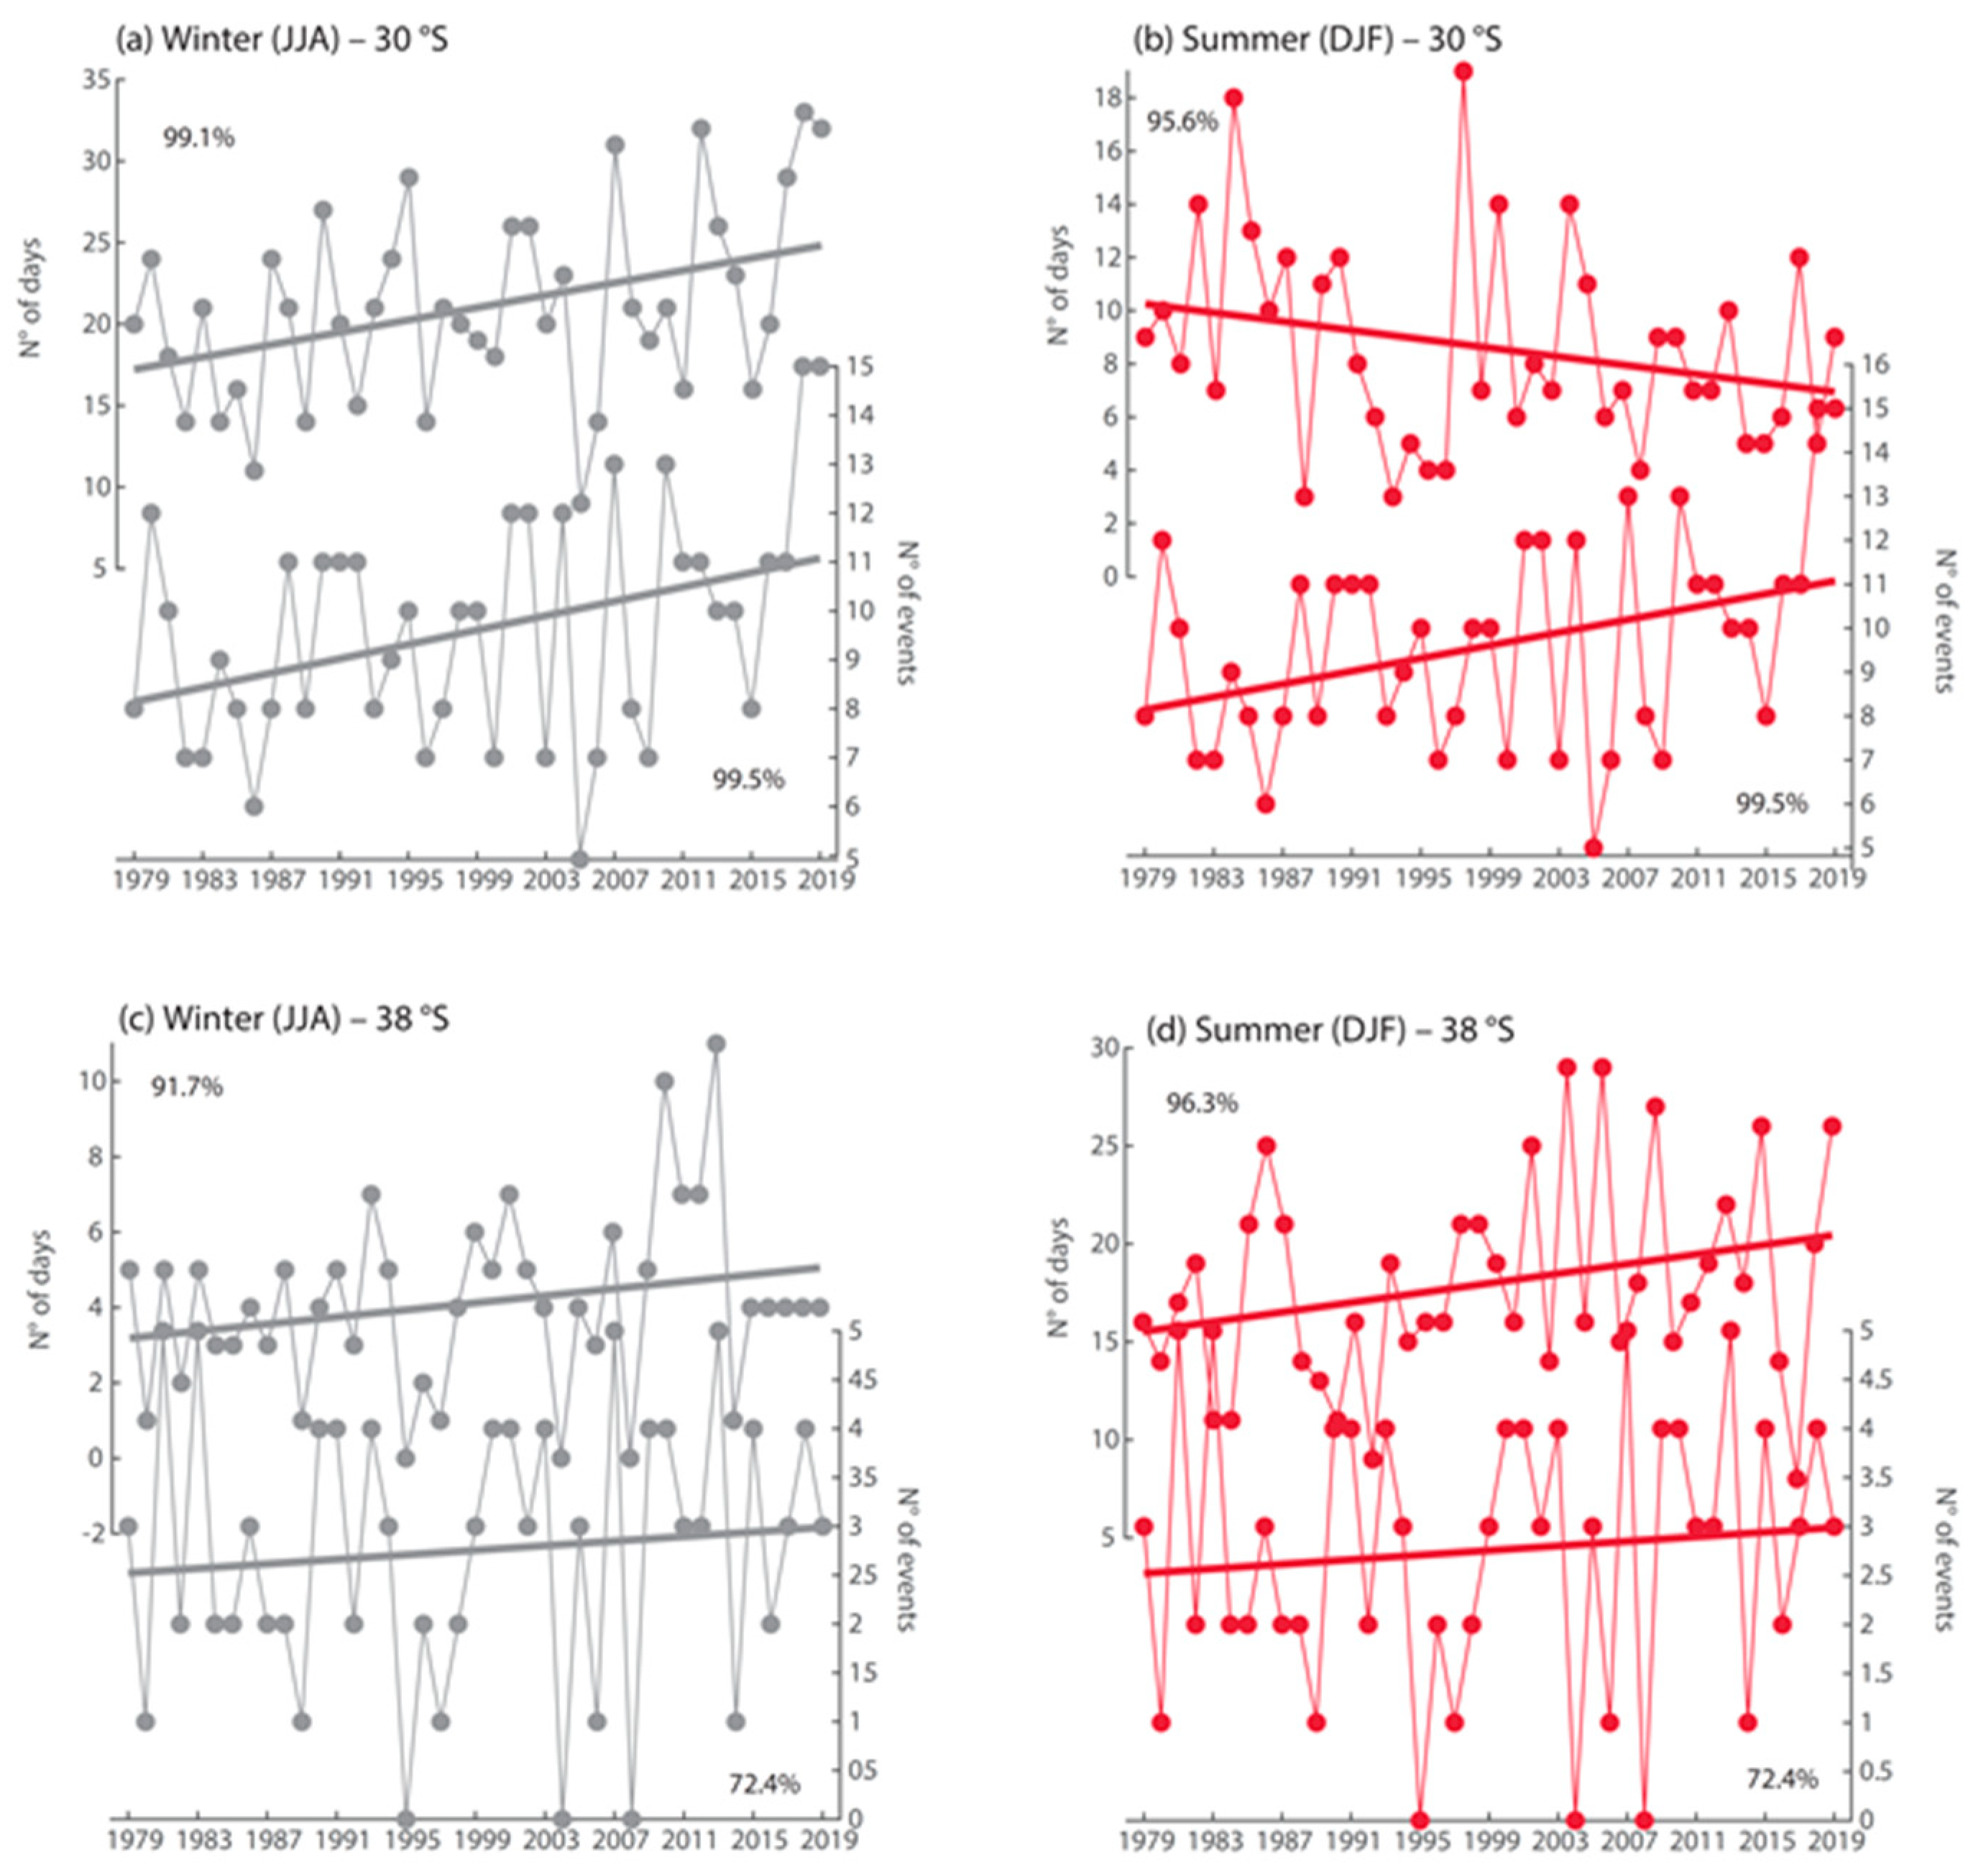
3.2. Seasonal Trends of the Southerly Coastal Jets
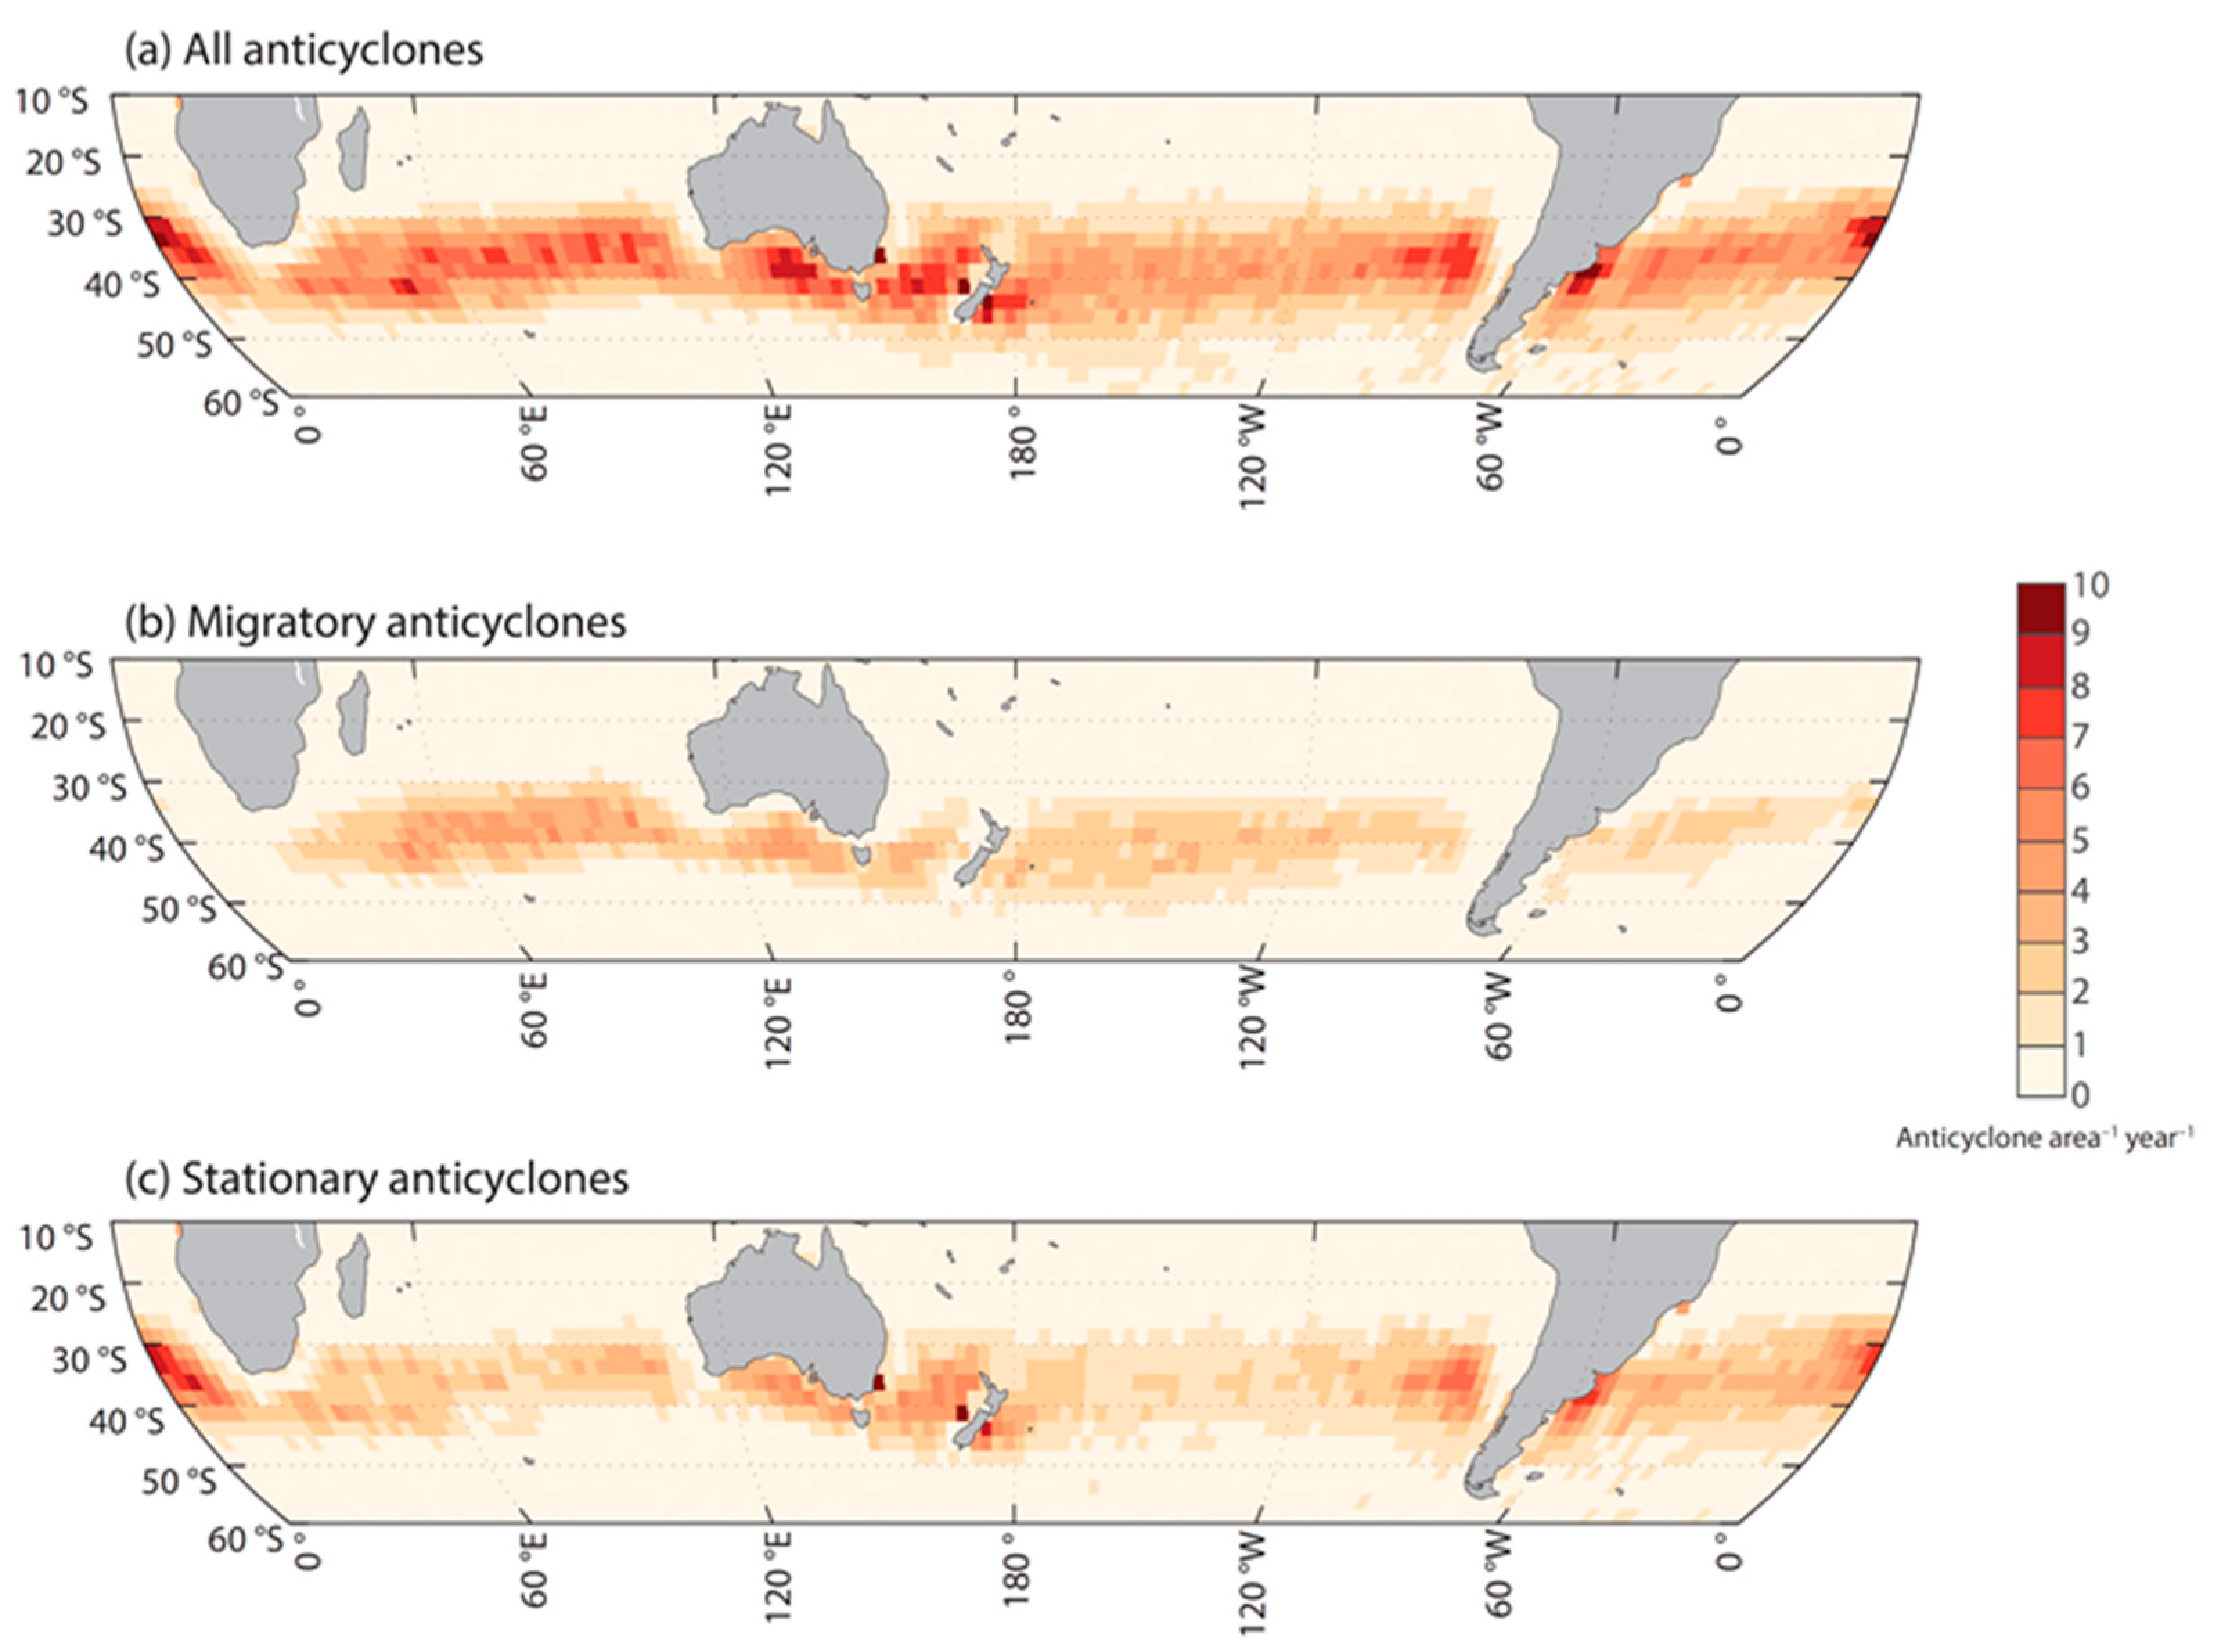
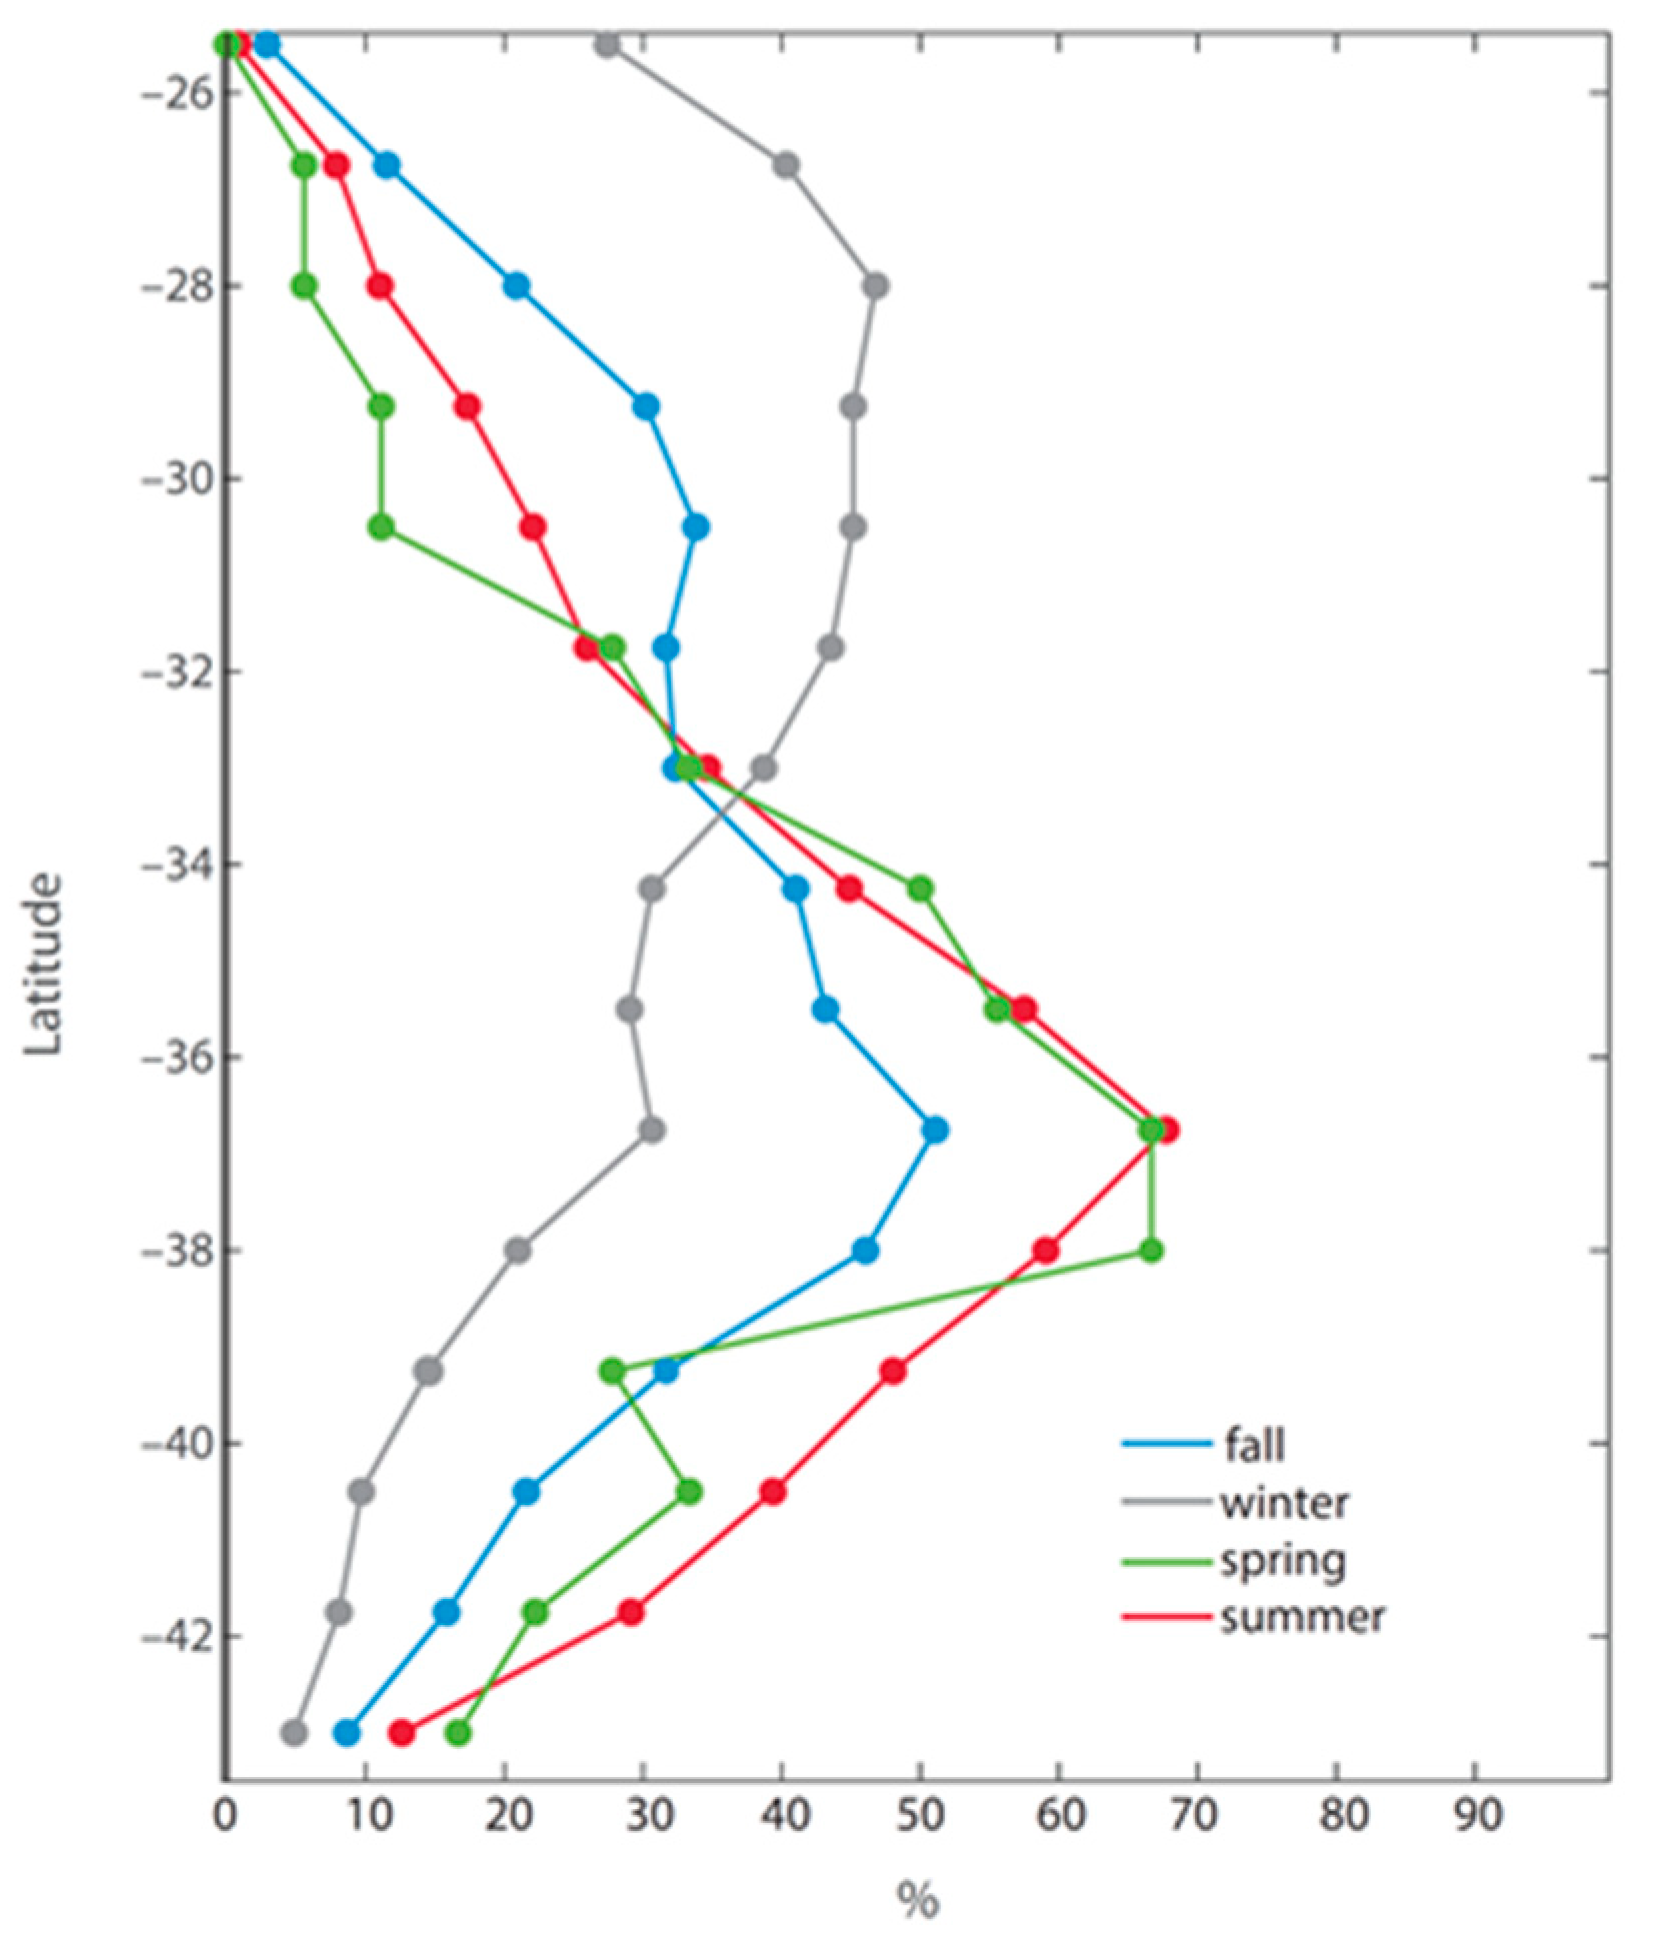
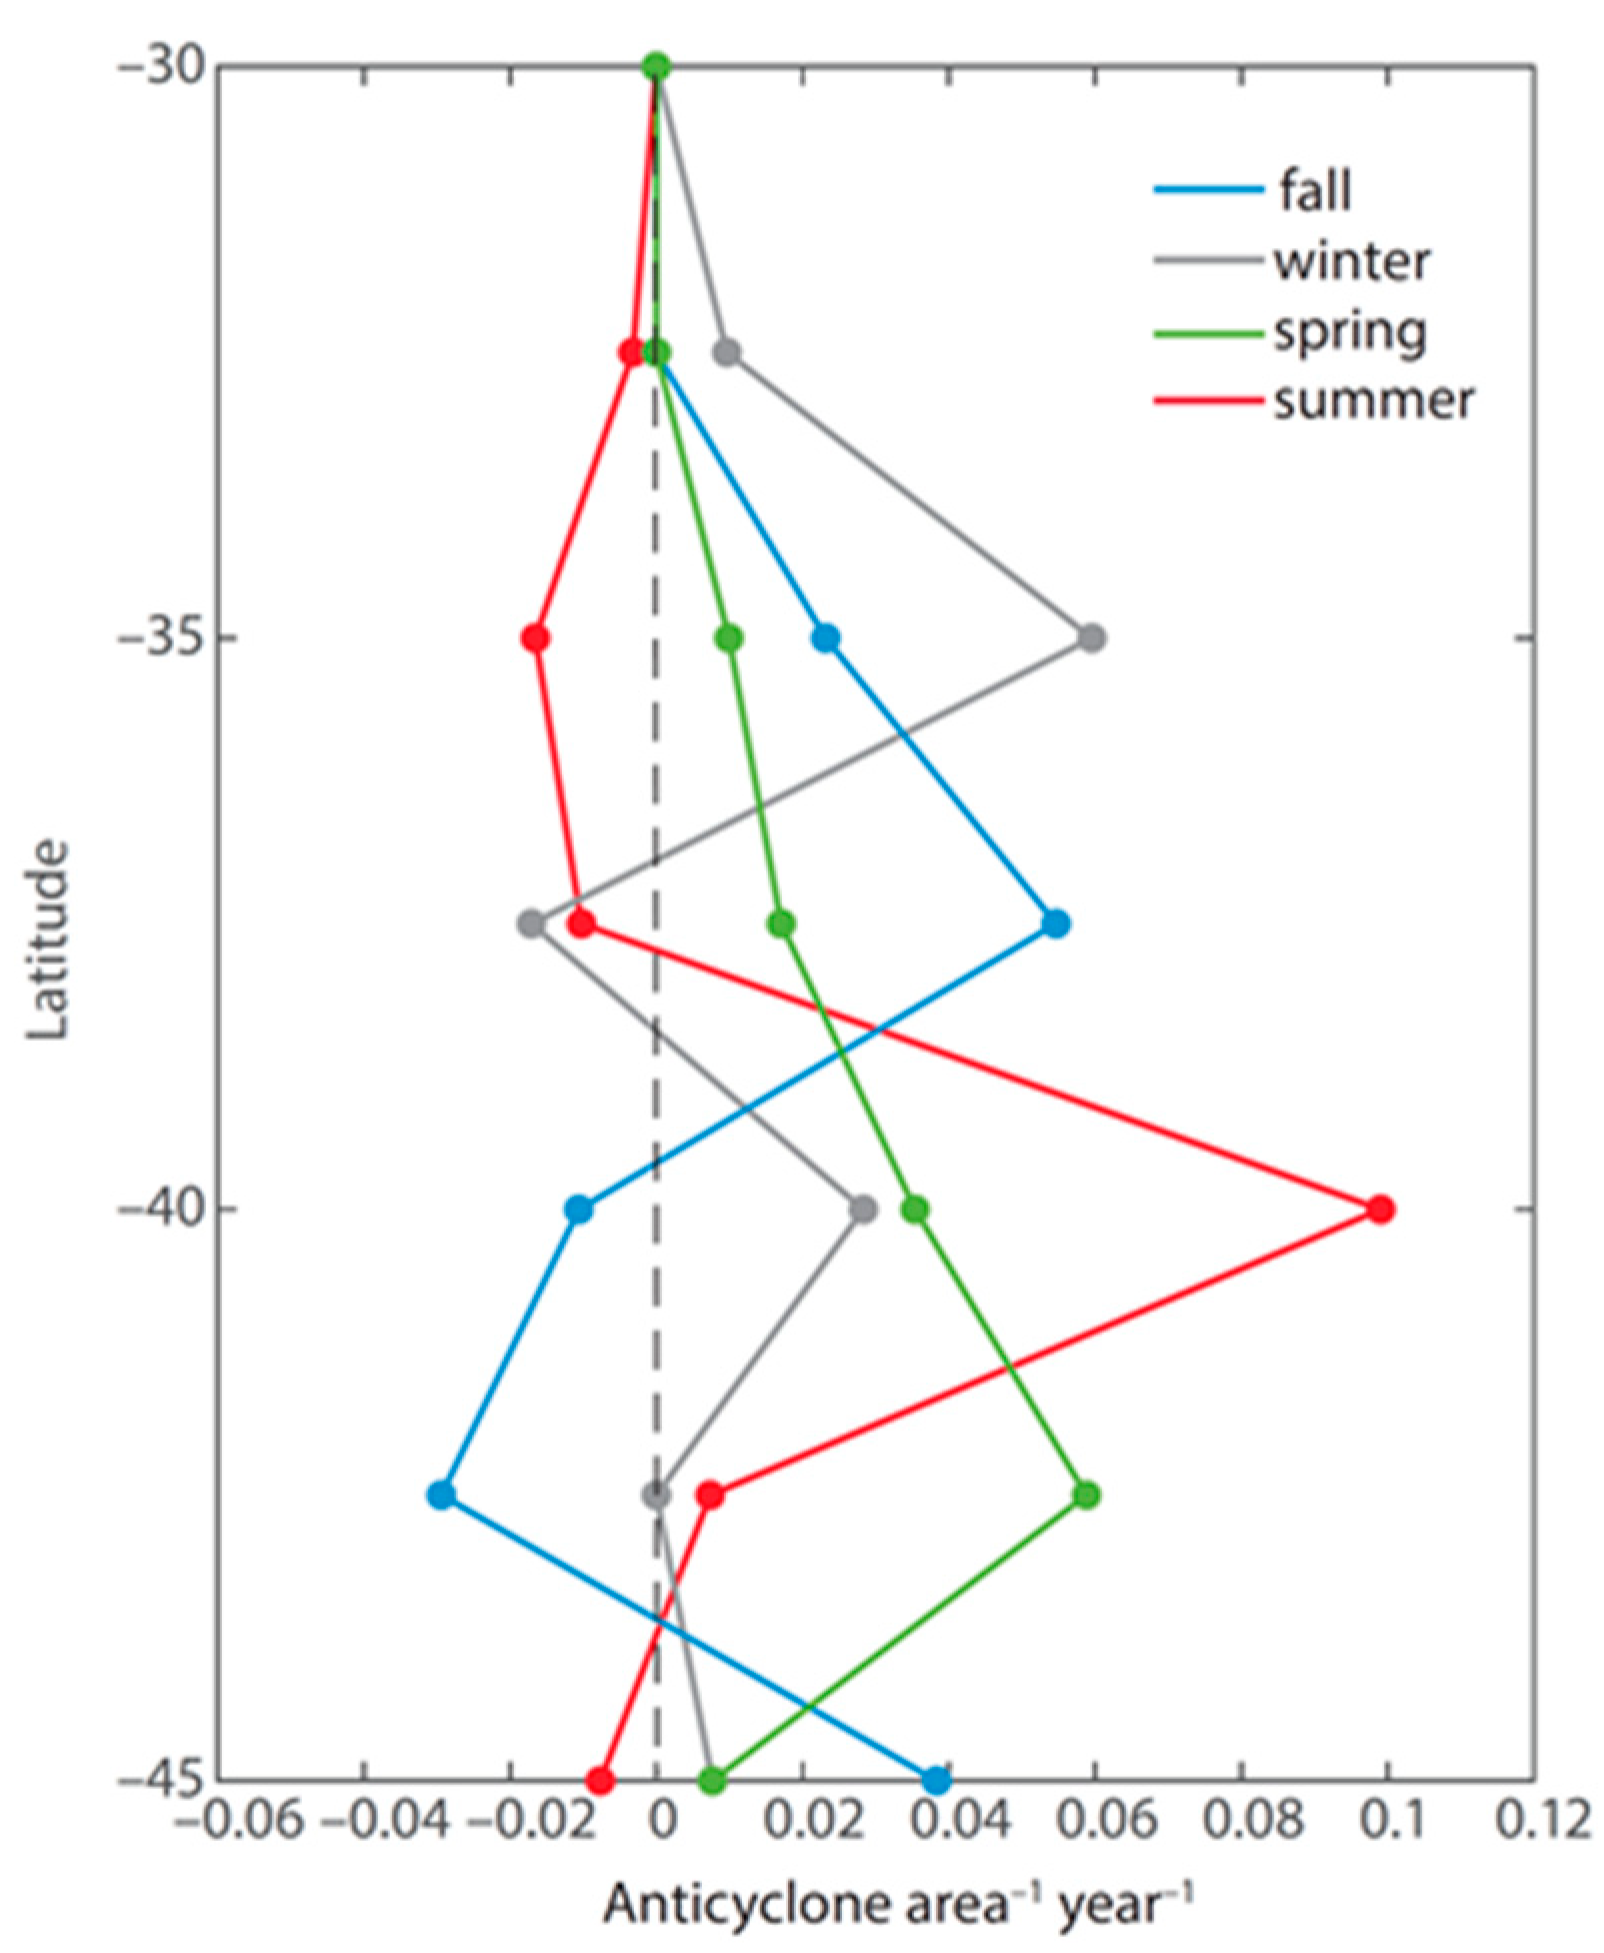
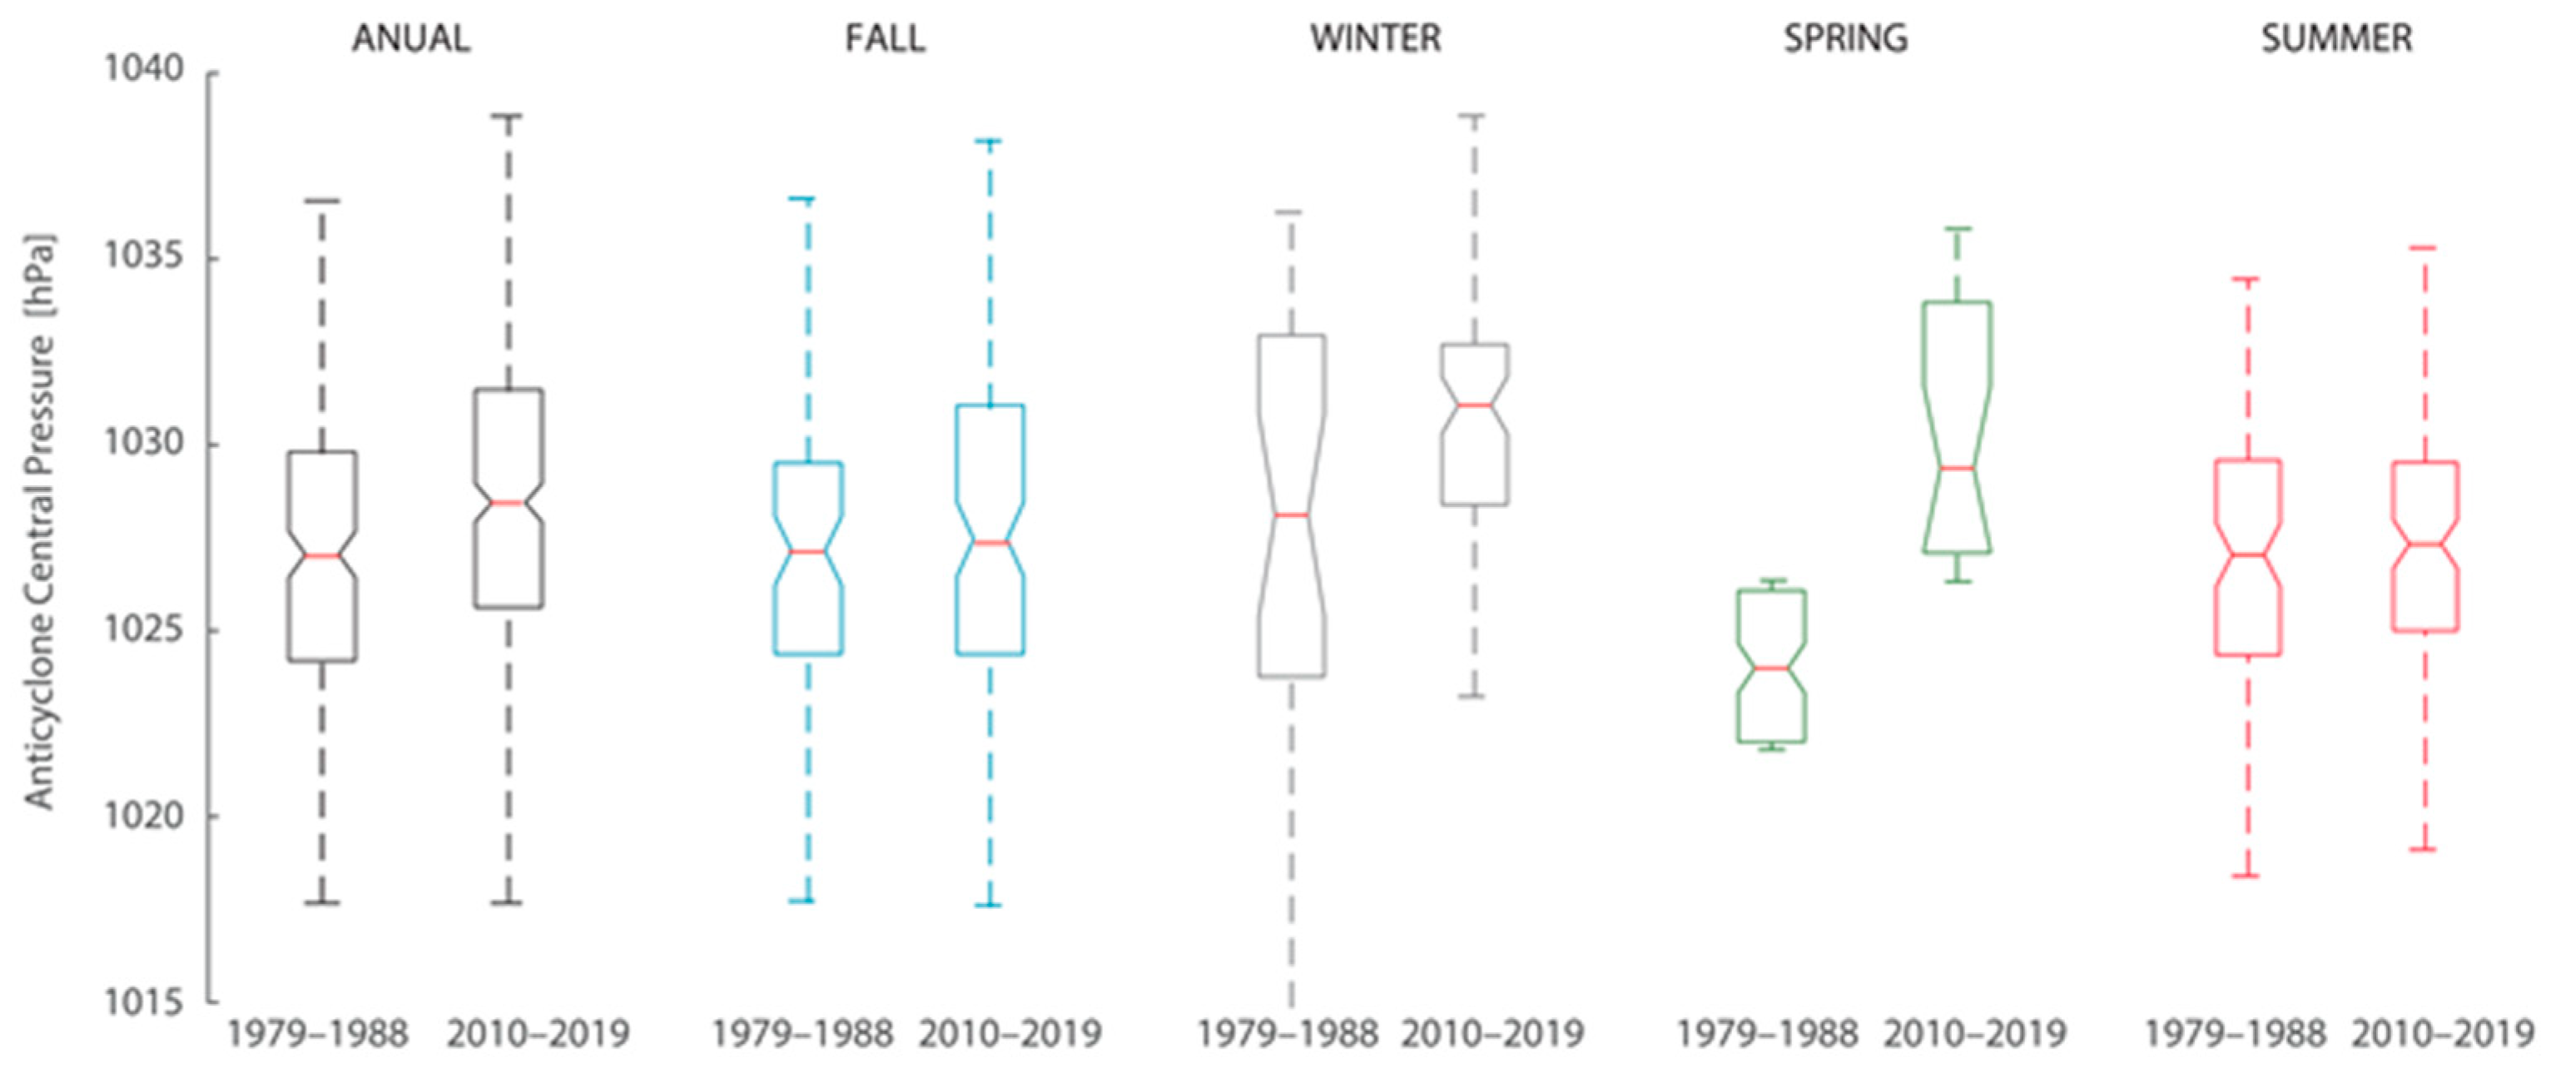
3.3. Relationship with Migratory Anticyclones
4. Discussion
5. Conclusions
Supplementary Materials
Author Contributions
Funding
Institutional Review Board Statement
Informed Consent Statement
Data Availability Statement
Acknowledgments
Conflicts of Interest
References
- Rahn, D.A.; Garreaud, R.D. A synoptic climatology of the near-surface wind along the west coast of South America. Int. J. Clim. 2014, 34, 780–792. [Google Scholar] [CrossRef]
- Sobarzo, M.; Bravo, L.; Donoso, D.; Garcés-Vargas, J.; Schneider, W. Coastal upwelling and seasonal cycles that influence the water column over the continental shelf off central Chile. Prog. Oceanogr. 2007, 75, 363–382. [Google Scholar] [CrossRef]
- Pizarro, O.; Hormazábal, S.; González, A.; Yañez, E. Variabilidad del viento, nivel del mar y temperatura en la costa norte de Chile. Investig. Mar. 1994, 22, 85–101. [Google Scholar] [CrossRef]
- Garreaud, R.; Muñoz, R. The low-level jet off the subtropical west coast of South America: Structure and variability. Mon. Weather Rev. 2005, 133, 2246–2261. [Google Scholar] [CrossRef] [Green Version]
- Garreaud, R.; Rutllant, J.; Fuenzalida, H. Coastal lows in north-central Chile: Mean structure and evolution. Mon. Weather Rev. 2002, 130, 75–88. [Google Scholar] [CrossRef] [Green Version]
- Muñoz, R.; Garreaud, R. Dynamics of the low-level jet off the west coast of subtropical South America. Mon. Weather Rev. 2005, 133, 3661–3677. [Google Scholar] [CrossRef]
- García-Reyes, M.; Sydeman, W.J.; Black, B.A.; Rykaczewski, R.R.; Schoeman, D.S.; Thompson, S.A.; Bograd, S.J. Relative influence of oceanic and terrestrial pressure systems in driving upwelling-favorable winds. Geophys. Res. Lett. 2013, 40, 5311–5315. [Google Scholar] [CrossRef] [Green Version]
- Lima, D.C.A.; Soares, P.M.M.; Semedo, A.; Cardoso, R.M. A global view of coastal low-level wind jets using an ensemble of reanalyses. J. Clim. 2018, 31, 1525–1546. [Google Scholar] [CrossRef]
- Aguirre, C.; Pizarro, O.; Strub, P.T.; Garreaud, R.; Barth, J. Seasonal dynamics of the near-surface alongshore flow off central Chile. J. Geophys. Res. 2012, 117, C01006. [Google Scholar] [CrossRef] [Green Version]
- Aguirre, C.; Garreaud, R.D.; Rutllant, J.A. Surface ocean response to synoptic-scale variability in wind stress and heat fluxes off south-central Chile. Dyn. Atmos. Ocean. 2014, 65, 64–85. [Google Scholar] [CrossRef] [Green Version]
- Renault, L.; Dewitte, B.; Falvey, M.; Garreaud, R.; Echevin, V.; Bonjean, F. Impact of the atmospheric coastal jet off central Chile on sea surface temperature from satellite observations (2000–2007). J. Geophys. Res. 2009, 114, C08006. [Google Scholar] [CrossRef] [Green Version]
- Renault, L.; Dewitte, B.; Marchesiello, P.; Illig, S.; Echevin, V.; Cambon, G.; Ramos, M.; Astudillo, O.; Minnis, P.; Ayers, K. Upwelling response to atmospheric coastal jets off central Chile: A modeling study of the October 2000 event. J. Geophys. Res. 2012, 117, C02030. [Google Scholar] [CrossRef] [Green Version]
- Semedo, A.; Suselj, K.; Rutgersson, A.; Sterl, A. A global view on the wind sea and swell climate and variability from ERA-40. J. Clim. 2011, 24, 1461–1479. [Google Scholar] [CrossRef]
- Aguirre, C.; Rutllant, J.A.; Falvey, M. Wind waves climatology of the Southeast Pacific Ocean. Int. J. Clim. 2017, 37, 4288–4301. [Google Scholar] [CrossRef]
- Ramajo, L.; Valladares, M.; Astudillo, O.; Fernández, C.; Rodríguez-Navarro, B.A.; Watt-Arévalo, P.; Núñez, M.; Grenier, C.; Román, R.; Aguayo, P.; et al. Upwelling intensity modulates the fitness and physiological performance of coastal species: Implications for the aquaculture of the scallop Argopecten purpuratus in the Humboldt Current System. Sci. Total Environ. 2020. [Google Scholar] [CrossRef] [PubMed]
- Huyer, A.; Smith, R.L.; Paluszkiewicz, T. Coastal upwelling off Peru during normal and El Niño times, 1981–1984. J. Geophys. Res. 1987, 92, 14297–14307. [Google Scholar] [CrossRef]
- Garreaud, R.; Rutllant, J.A.; Muñoz, R.; Rahn, D.; Ramos, M.; Figueroa, D. VOCALS-CUpEx: The Chilean Upwelling Experiment. Atmos. Chem. Phys. 2011, 11, 2015–2029. [Google Scholar] [CrossRef] [Green Version]
- Garreaud, R.; Falvey, M. The coastal winds off western subtropical South America in future climate scenarios. Int. J. Clim. 2009, 29, 543–554. [Google Scholar] [CrossRef]
- Semedo, A.; Soares, P.M.M.; Lima, D.C.A.; Cardoso, R.M.; Bernardino, M.; Miranda, P.M.A. The impact of climate change on the global coastal low-level wind jets: EC-EARTH simulations. Glob. Planet. Chang. 2016, 137, 88–106. [Google Scholar] [CrossRef]
- Soares, P.M.M.; Lima, D.C.A.; Cardoso, R.M.; Semedo, A. High resolution projections for the western Iberian coastal low level jet in a changing climate. Clim. Dyn. 2016, 49, 1547–1566. [Google Scholar] [CrossRef]
- Aguirre, C.; Rojas, M.; Garreaud, R.D.; Rahn, D. Role of synoptic activity on projected changes in upwelling-favourable winds at the ocean’s eastern boundaries. NPJ Clim. Atmos. Sci. 2019, 2, 44. [Google Scholar] [CrossRef]
- Schneider, W.; Donoso, D.; Garcés-Vargas, J.; Escribano, R. Water-column cooling and sea surface salinity increase in the upwelling region off central-south Chile driven by a poleward displacement of the South Pacific High. Prog. Oceanogr. 2017, 151, 38–48. [Google Scholar] [CrossRef]
- Aguirre, C.; García-Loyola, S.; Testa, G.; Silva, D.; Farias, L. Insight into anthropogenic forcing on coastal upwelling off south-central Chile. Elem. Sci. Anth. 2018, 6, 59. [Google Scholar] [CrossRef]
- Winckler, P.; Aguirre, C.; Farías, L.; Contreras-López, M.; Masotti, I. Evidence of climate-driven changes on atmospheric, hydrological, and oceanographic variables along the Chilean coastal zone. Clim. Chang. 2020, 163, 633–652. [Google Scholar] [CrossRef]
- Weidberg, N.; Ospina-Alvarez, A.; Bonicelli, J.; Barahona, M.; Aiken, C.; Broitman, B.; Navarrete, S. Spatial shifts in productivity of the coastal ocean over the past two decades induced by migration of the Pacific Anticyclone and Bakun’s effect in the Humboldt Upwelling Ecosystem. Glob. Planet. Chang. 2020, 193, 103259. [Google Scholar] [CrossRef]
- Hersbach, H.; Bell, B.; Berrisford, P.; Hirahara, S.; Horányi, A.; Muñoz-Sabater, J.; Nicolas, J.; Peubey, C.; Radu, R.; Schepers, D.; et al. The ERA5 global reanalysis. Q. J. R. Meteorol. Soc. 2020, 146, 1999–2049. [Google Scholar] [CrossRef]
- Ramon, J.; Lledó, L.; Torralba, V.; Soret, A.; Doblas-Reyes, F.J. What global reanalysis best represents near-surface winds? Q. J. R. Meteorol. Soc. 2019, 145, 3236–3251. [Google Scholar] [CrossRef] [Green Version]
- Simmonds, I.; Keay, K. Mean Southern Hemisphere Extratropical Cyclone Behavior in the 40-Year NCEP–NCAR Reanalysis. J. Clim. 2000, 13, 873–885. [Google Scholar] [CrossRef]
- Grieger, J.; Leckebusch, G.C.; Donat, M.G.; Schuster, M.; Ulbrich, U. Southern Hemisphere winter cyclone activity under recent and future climate conditions in multi-model AOGCM simulations. Int. J. Climatol. 2014, 34, 3400–3416. [Google Scholar] [CrossRef]
- Pepler, A.; Dowdy, A.; Hope, P. A global climatology of surface anticyclones, their variability, associated drivers and long-term trends. Clim. Dyn. 2019, 52, 5397–5412. [Google Scholar] [CrossRef]
- Pepler, A.; Dowdy, A.; van Rensch, P.; Rudeva, I.; Catto, J.; Hope, P. The contributions of fronts, lows and thunderstorms to southern Australian rainfall. Clim. Dyn. 2020, 55, 1489–1505. [Google Scholar] [CrossRef]
- Sato, K.; Inoue, J.; Simmonds, I.; Rudeva, I. Antarctic Peninsula warm winters influenced by Tasman Sea temperatures. Nat. Commun. 2021, 12, 1497. [Google Scholar] [CrossRef]
- Goubanova, K.; Echevin, V.; Dewitte, B.; Codron, F.; Takahashi, K.; Terray, P.; Vrac, M. Statistical downscaling of sea-surface wind over the Peru–Chile upwelling region: Diagnosing the impact of climate change from the IPSL-CM4 model. Clim. Dyn. 2011, 36, 1365–1378. [Google Scholar] [CrossRef]
- Belmadani, A.; Echevin, V.; Codron, F.; Takahashi, K.; Junquas, C. What dynamics drive future wind scenarios for coastal upwelling off Peru and Chile? Clim. Dyn. 2013, 43, 1893–1914. [Google Scholar] [CrossRef]
- Rykaczewski, R.R.; Dunne, J.P.; Sydeman, W.J.; García-Reyes, M.; Black, B.A.; Bograd, S.J. Poleward displacement of coastal upwelling-favorable winds in the ocean’s eastern boundary currents through the 21st century. Geophys. Res. Lett. 2015, 42, 6424–6431. [Google Scholar] [CrossRef]
- Wang, D.; Gouhier, T.C.; Menge, B.A.; Ganguly, A.R. Intensification and spatial homogenization of coastal upwelling under climate change. Nature 2015, 518, 390–394. [Google Scholar] [CrossRef]
- Flores-Aqueveque, V.; Rojas, M.; Aguirre, C.; Arias, P.; González, C. South Pacific Subtropical High from the late Holocene to the end of the 21st century: Insights from climate proxies and general circulation models. Clim. Past 2020, 16, 79–99. [Google Scholar] [CrossRef] [Green Version]
- Falvey, M.; Garreaud, R. Regional cooling in a warming world: Recent temperature trends in the SE Pacific and along the west coast of subtropical South America (1979–2006). J. Geophys. Res. 2009, 114, D04102. [Google Scholar] [CrossRef]
- Torres, R.; Turner, D.R.; Silva, N.; Rutllant, J. High short-term variability of CO2 fluxes during an upwelling event off the Chilean coast at 30 °S. Deep Sea Res. Part I Oceanogr. Res. Pap. 1999, 46, 1161–1179. [Google Scholar] [CrossRef]
- Torres, R.; Turner, D.; Rutllant, J.; Sobarzo, M.; Antezana, T.; E Gonzalez, H. CO2 outgassing off central Chile (31–30 °S) and northern Chile (24–23°S) during austral summer 1997: The effect of wind intensity on the upwelling and ventilation of CO2-rich waters. Deep Sea Res. Part I Oceanogr. Res. Pap. 2002, 49, 1413–1429. [Google Scholar] [CrossRef]
- Silva, N.; Rojas, N.; Fedele, A. Water masses in the Humboldt Current System: Properties, distribution, and the nitrate deficit as a chemical water mass tracer for Equatorial Subsurface Water off Chile. Deep Sea Res. Part II Top. Stud. Oceanogr. 2009, 56, 1004–1020. [Google Scholar] [CrossRef]
- Rutllant, J.; Montecino, V. Multiscale upwelling forcing cycles and biological response off north-central Chile. Rev. Chil. Hist. Nat. 2002, 75, 217–231. [Google Scholar] [CrossRef] [Green Version]
- Aguilera, V.; Escribano, R.; Herrera, L. High frequency responses of nanoplankton and microplankton to wind-driven upwelling off northern Chile. J. Mar. Syst. 2009, 78, 124–135. [Google Scholar] [CrossRef]
- Testa, G.; Masotti, I.; Farías, L. Temporal Variability in Net Primary Production in an Upwelling Area off Central Chile (36 °S). Front. Mar. Sci. 2018, 5. [Google Scholar] [CrossRef]
- Gillett, N.P.; Fyfe, J.C.; Parker, D.E. Attribution of observed sea level pressure trends to greenhouse gas, aerosol, and ozone changes. Geophys. Res. Lett. 2013, 40, 2302–2306. [Google Scholar] [CrossRef]
- Jones, J.M.; Gille, S.T.; Goosse, H.; Abram, N.J.; Canziani, P.O.; Charman, D.J.; Clem, K.R.; Crosta, X.; de Lavergne, C.; Eisenman, I.; et al. Assessing recent trends in high-latitude Southern Hemisphere surface climate. Nat. Clim. Chang. 2016, 6, 917–926. [Google Scholar] [CrossRef]
- Clément, A.; Lincoqueo, L.; Saldivia, M.; Brito, C.G.; Muñoz, F.; Fernández, C.; Pérez, F.; Maluje, C.P.; Correa, N.; Moncada, V.; et al. Exceptional Summer Conditions and HABs of Pseudochattonella in Southern Chile Create Record Impacts on Salmon Farms. Harmful Algae News 2016, 53, 1–3. [Google Scholar]
- Jacob, B.; Tapia, F.; Quiñones, R.; Montes, R.; Sobarzo, M.; Schneider, W.; Daneri, G.; Morales, C.; Montero, P.; González, H. Major changes in diatom abundance, productivity, and net community metabolism in a windier and dryer coastal climate in the southern Humboldt Current. Prog. Oceanogr. 2018, 168, 196–209. [Google Scholar] [CrossRef]
- León-Muñoz, J.; Urbina, M.A.; Garreaud, R.; Iriarte, J.L. Hydroclimatic conditions trigger record harmful algal bloom in western Patagonia (summer 2016). Sci. Rep. 2018, 8, 1330. [Google Scholar] [CrossRef] [Green Version]
- Alfaro, S.; Flores-Aqueveque, V.; Foret, G.; Caquineau, S.; Vargas, G.; Rutllant, J. A simple model accounting for the uptake, transport, and deposition of wind eroded mineral particles in the hyperarid coastal Atacama Desert of northern Chile. Earth Surf. Process. Landf. 2011, 36, 923–932. [Google Scholar] [CrossRef]
- Siffedine, A.; Gutiérrez, D.; Ortlieb, L.; Boucher, H.; Velazco, F.; Field, D.; Vargas, G.; Boussafire, M.; Salvatteci, R.; Ferreira, V.; et al. Laminated sediments from the central Peruvian continental slope: A 500-year record of upwelling system productivity, terrestrial runoff and redox conditions. Prog. Oceanogr. 2008, 79, 190–197. [Google Scholar] [CrossRef] [Green Version]
- Gutiérrez, D.; Sifeddine, A.; Field, D.B.; Ortlieb, L.; Vargas, G.; Chávez, F.P.; Velazco, F.; Ferreira, V.; Tapia, P.; Salvatteci, R.; et al. Rapid reorganization in ocean biogeochemistry off Peru towards the end of the Little Ice Age. Biogeosciences 2009, 6, 835–848. [Google Scholar] [CrossRef] [Green Version]
- Salvatteci, R.; Gutiérrez, D.; Field, D.; Sifeddine, A.; Ortlieb, L.; Bouloubassi, I.; Boussafir, M.; Boucher, H.; Cetin, F. The response of the Peruvian Upwelling Ecosystem to centennial-scale global change during the last two millennia. Clim. Past 2014, 10, 715–731. [Google Scholar] [CrossRef] [Green Version]
- Flores-Aqueveque, V.; Alfaro, S.; Vargas, G.; Rutllant, J.A.; Caquineau, S. Aeolian particles in marine cores as a tool for quantitative high-resolution reconstruction of upwelling favorable winds along coastal Atacama Desert, Northern Chile. Prog. Oceanogr. 2015, 134, 244–255. [Google Scholar] [CrossRef]
- Briceño-Zuluaga, F.J.; Sifeddine, A.; Caquineau, S.; Cardich, J.; Salvatteci, R.; Gutierrez, D.; Ortlieb, L.; Velazco, F.; Boucher, H.; Machado, C. Terrigenous material supply to the Peruvian, central continental shelf (Pisco, 14 °S) during the last 1000 years: Paleoclimatic implications. Clim. Past 2016, 12, 787–798. [Google Scholar] [CrossRef] [Green Version]


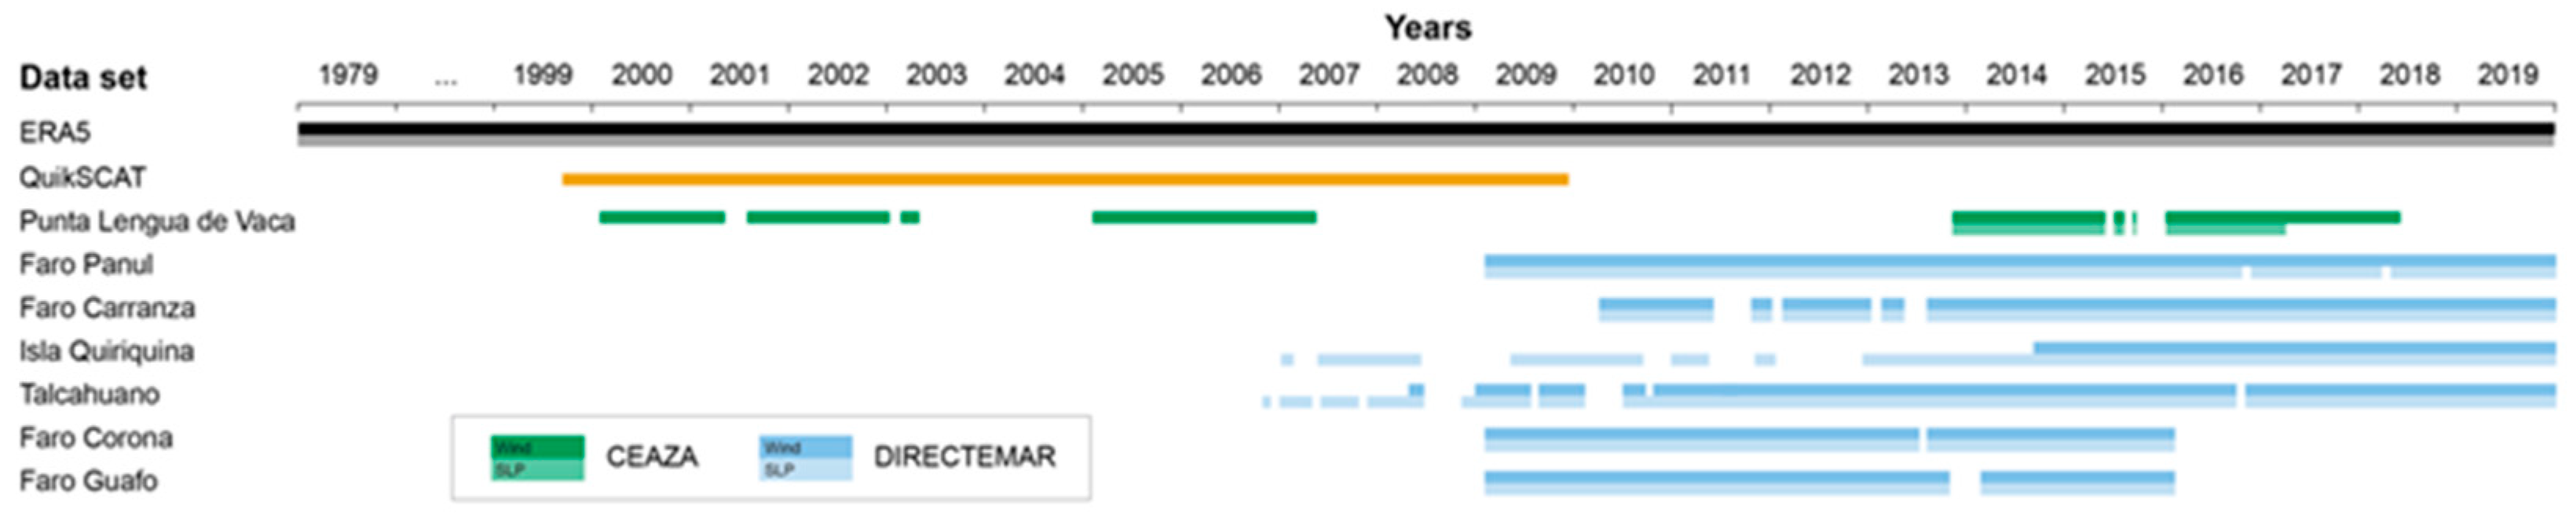
| No. | Meteorological Station | ID | Lat (°) | Lon (°) | Altitude (Masl) | Period | Frequency | Source |
|---|---|---|---|---|---|---|---|---|
| 1 | Punta Lengua de Vaca | − | −30.24 | −71.63 | 17 | 2 February 2000–18 May 2018 | Every 30 min and hourly | CEAZA |
| 2 | Faro Panul | 330028 | −33.57 | −71.62 | 30 | 1 January 2009–30 November 2020 | 3-hourly | DIRECTEMAR |
| 3 | Faro Carranza | 350007 | −35.56 | −72.62 | 21 | 1 March 2010–30 November 2020 | 3-hourly (from 12 to 24 h) | DIRECTEMAR |
| 4 | Isla Quiriquina | 360015 | −36.61 | −73.05 | 84 | 1 August 2014–30 November 2020 | 3-hourly (from 12 to 24 h) | DIRECTEMAR |
| 5 | Talcahuano | 360017 | −36.72 | −73.12 | 3 | 1 April 2008–31 August 2020 | 3-hourly | DIRECTEMAR |
| 6 | Faro Corona | 410007 | −41.78 | −73.88 | 53 | 1 January 2009–1 January 2016 | 3-hourly | DIRECTEMAR |
| 7 | Faro Guafo | 430003 | −43.57 | −74.83 | 105 | 1 January 2009–1 January 2016 | 3-hourly | DIRECTEMAR |
| 8 | QuikSCAT | − | − | − | 10 | 20 July 1999–21 November 2009 | Daily | IFREMER |
| Annual | DJF | MAM | JJA | SON | |||||||||||||
|---|---|---|---|---|---|---|---|---|---|---|---|---|---|---|---|---|---|
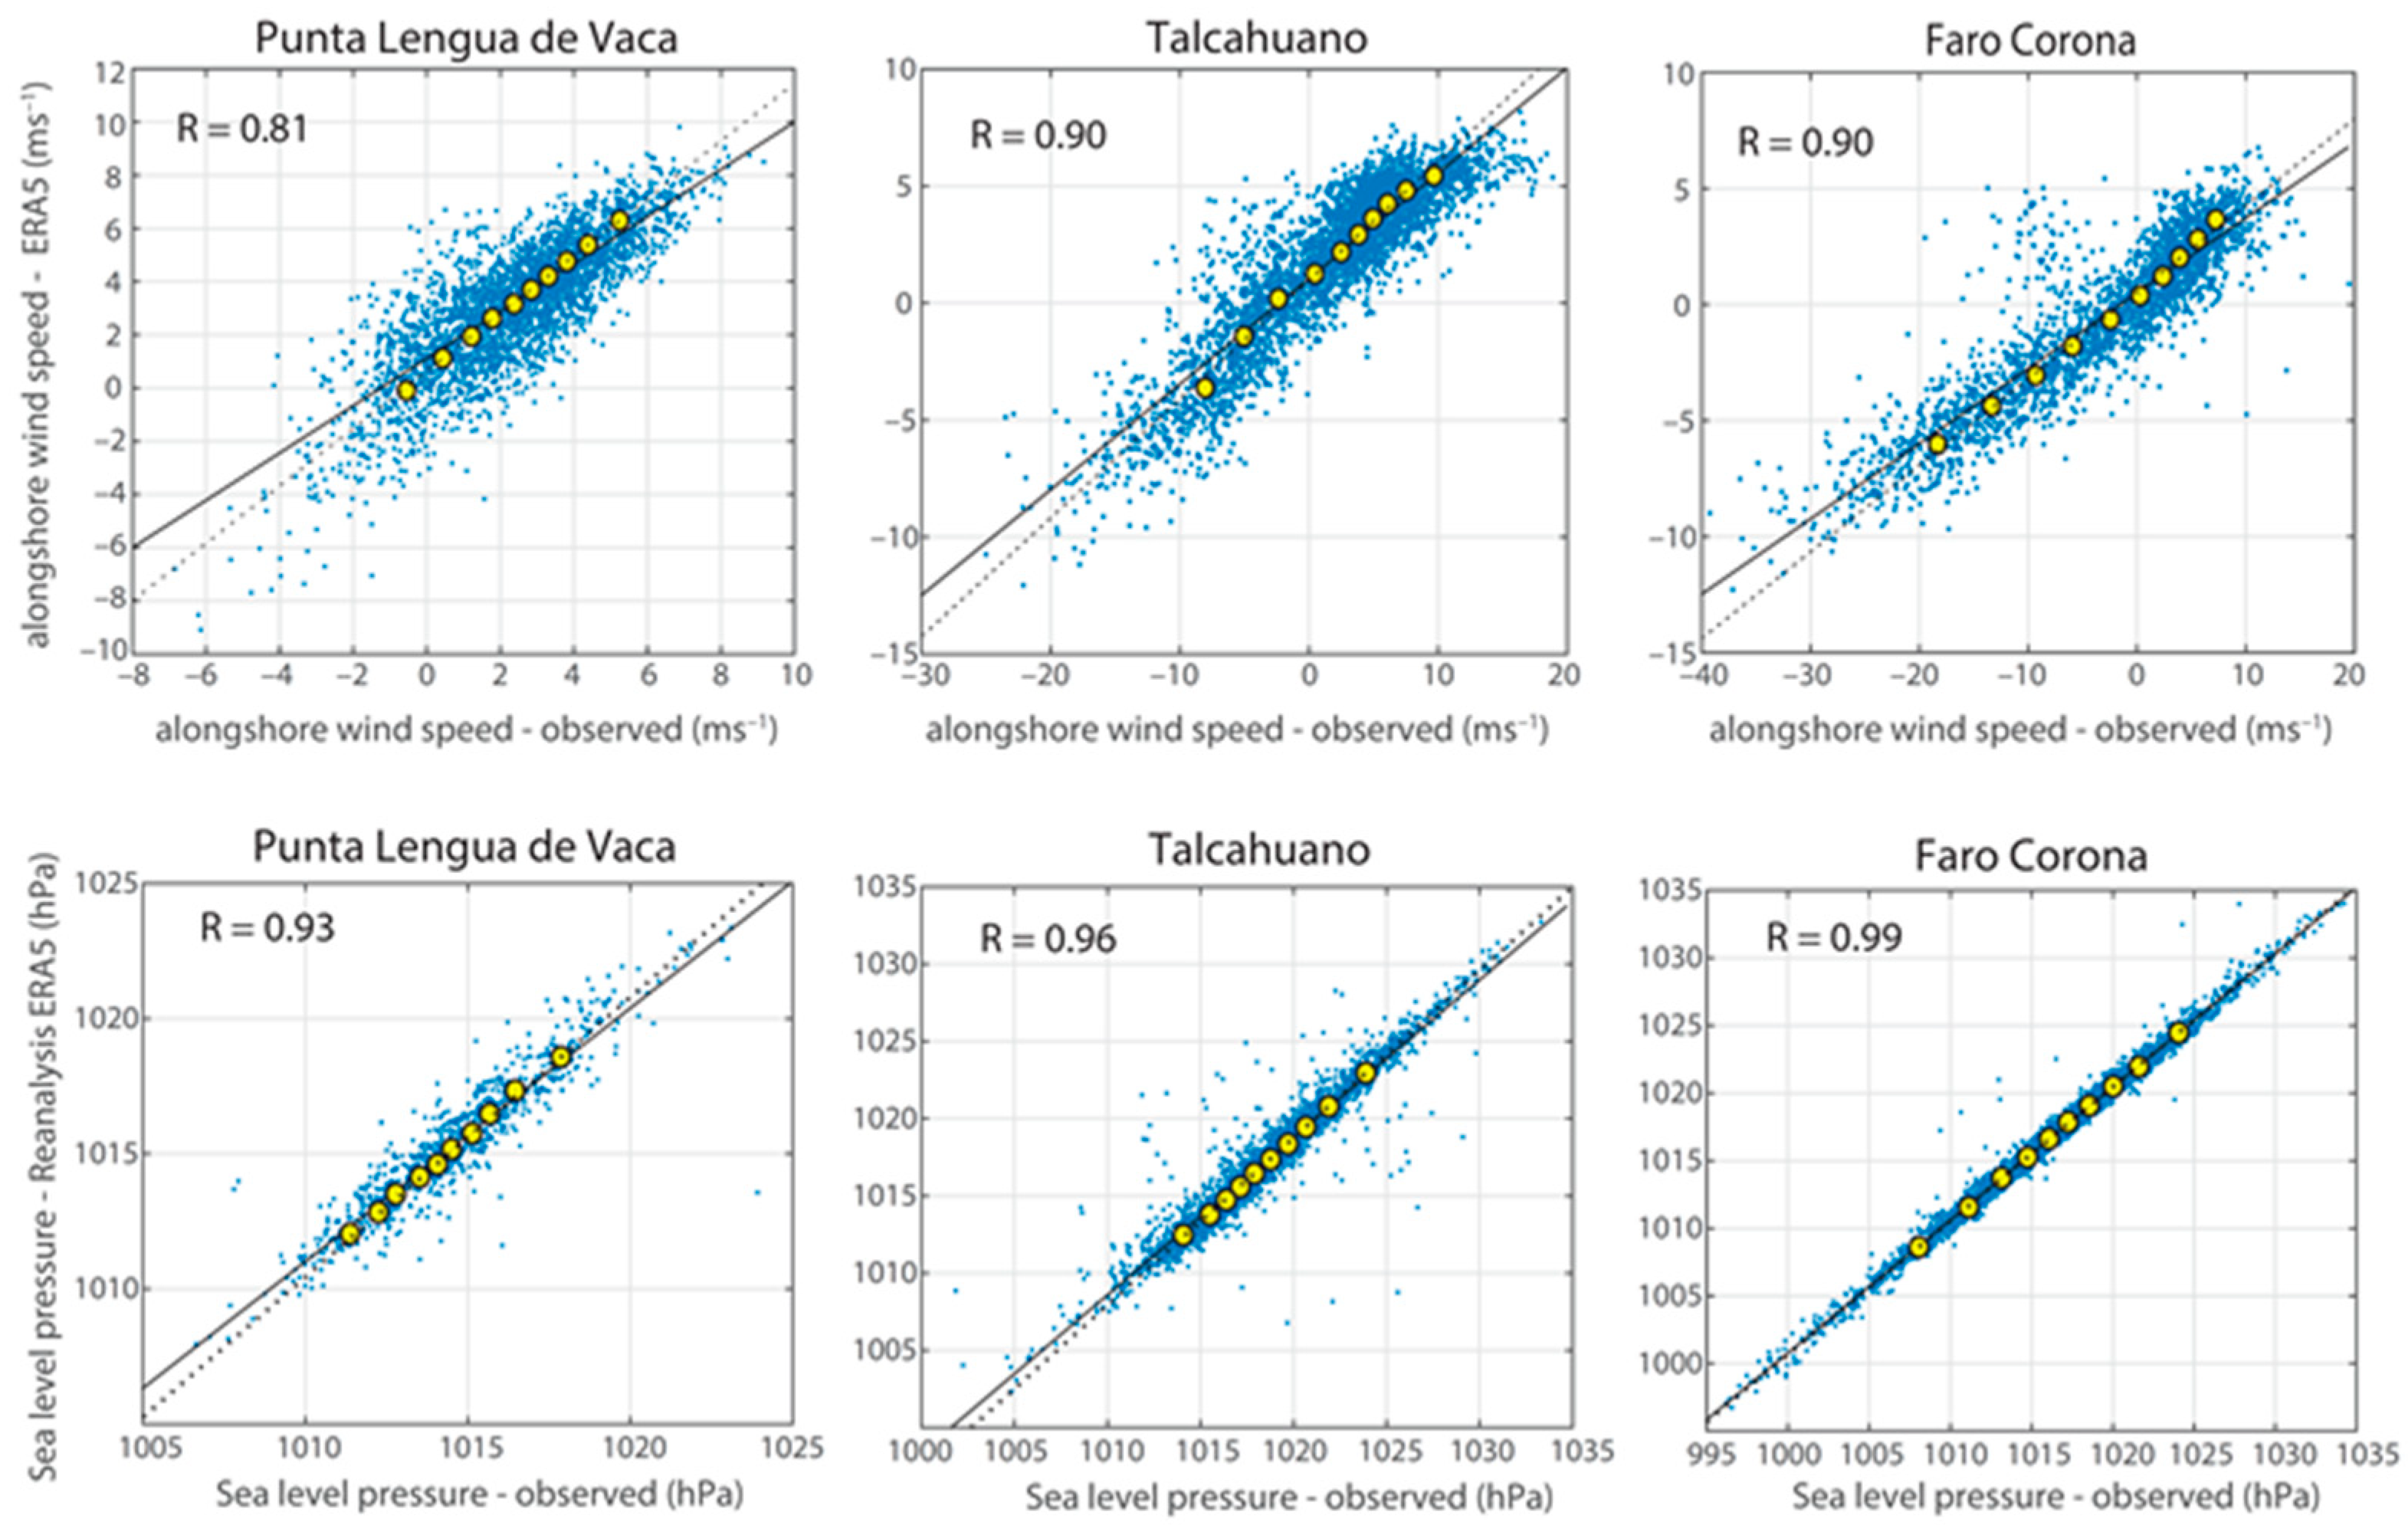
| Source (number of data) | Lat (°) | Lon (°) | R | Bias | RMSE | R | Bias | RMSE | R | Bias | RMSE | R | Bias | RMSE | R | Bias | RMSE |
| Lengua de Vaca (6681) | −30.24 | −71.63 | 0.81 | 0.77 | 0.98 | 0.79 | 0.38 | 0.81 | 0.78 | 0.82 | 0.97 | 0.82 | 1.18 | 1.12 | 0.86 | 0.69 | 0.90 |
| Faro Panul (3836) | −33.57 | −71.62 | 0.60 | 3.17 | 3.78 | 0.57 | 5.04 | 3.21 | 0.63 | 3.10 | 3.27 | 0.73 | 1.16 | 3.82 | 0.63 | 3.46 | 3.71 |
| Faro Carranza (3593) | −35.56 | −72.62 | 0.86 | −1.13 | 5.41 | 0.76 | −0.86 | 6.38 | 0.87 | −1.58 | 4.86 | 0.91 | 0.30 | 5.19 | 0.91 | −2.11 | 4.92 |
| Isla Quiriquina (1979) | −36.61 | −73.05 | 0.79 | 1.96 | 4.59 | 0.70 | 1.27 | 4.45 | 0.85 | 1.14 | 3.54 | 0.84 | 3.48 | 4.82 | 0.71 | 2.26 | 5.05 |
| Talcahuano (4292) | −36.72 | −73.12 | 0.89 | 0.05 | 3.71 | 0.84 | −0.42 | 4.10 | 0.90 | 0.48 | 3.38 | 0.93 | 1.06 | 3.35 | 0.88 | −0.49 | 3.81 |
| Faro Corona (2556) | −41.78 | −73.88 | 0.90 | 2.80 | 6.71 | 0.85 | 0.87 | 5.91 | 0.92 | 2.70 | 6.16 | 0.93 | 4.51 | 7.47 | 0.87 | 3.26 | 6.72 |
| Faro Guafo (2459) | −43.57 | −74.83 | 0.74 | 0.32 | 8.51 | 0.78 | −0.60 | 8.07 | 0.59 | 0.88 | 9.11 | 0.76 | 0.61 | 9.05 | 0.80 | 0.17 | 7.61 |
| Mean | − | – | 0.80 | 1.13 | 4.81 | 0.76 | 0.81 | 4.70 | 0.79 | 1.08 | 4.47 | 0.84 | 1.76 | 4.97 | 0.81 | 1.04 | 4.67 |
| QuikSCAT (283,350) | – | – | 0.94 | 0.19 | 1.81 | 0.94 | 0.34 | 1.51 | 0.93 | 0.12 | 1.89 | 0.95 | 0.05 | 2.07 | 0.95 | 0.28 | 1.71 |
| Source | Lat (°) | Lon (°) | Annual | DJF | MAM | JJA | SON | ||||||||||
|---|---|---|---|---|---|---|---|---|---|---|---|---|---|---|---|---|---|
| R | Bias | RMSE | R | Bias | RMSE | R | Bias | RMSE | R | Bias | RMSE | R | Bias | RMSE | |||
| Lengua de Vaca | −30.24 | −71.63 | 0.93 | 67.11 | 80.20 | 0.94 | 98.63 | 44.95 | 0.83 | 49.63 | 102.11 | 0.92 | 73.92 | 85.39 | 0.89 | 83.38 | 79.81 |
| Faro Panul | −33.57 | −71.62 | 0.93 | −210.18 | 121.40 | 0.89 | −245.52 | 95.90 | 0.91 | −210.95 | 105.15 | 0.91 | −164.12 | 143.14 | 0.91 | −221.43 | 121.44 |
| Faro Carranza | −35.56 | −72.62 | 0.94 | −0.92 | 118.90 | 0.79 | −39.47 | 131.55 | 0.93 | −1.64 | 89.36 | 0.94 | 29.60 | 125.03 | 0.92 | −1.45 | 116.79 |
| Isla Quiriquina | −36.61 | −73.05 | 0.95 | −136.42 | 101.19 | 0.96 | −165.81 | 55.97 | 0.97 | −152.76 | 67.25 | 0.95 | −109.84 | 133.11 | 0.92 | −107.74 | 116.15 |
| Talcahuano | −36.72 | −73.12 | 0.94 | −66.87 | 126.72 | 0.85 | −119.74 | 131.33 | 0.92 | −69.64 | 123.41 | 0.98 | −21.71 | 94.36 | 0.92 | −66.06 | 134.01 |
| Faro Corona | −41.78 | −73.88 | 0.99 | 51.44 | 70.85 | 0.99 | 50.71 | 49.97 | 1.00 | 41.18 | 54.86 | 0.99 | 57.04 | 91.30 | 0.99 | 60.00 | 77.69 |
| Faro Guafo | −43.57 | −74.83 | 0.93 | 272.54 | 277.88 | 0.94 | 191.16 | 199.09 | 0.82 | 268.37 | 426.43 | 0.97 | 312.83 | 207.91 | 0.96 | 295.57 | 182.39 |
| Mean | – | – | 0.95 | −3.33 | 128.16 | 0.91 | −32.86 | 101.25 | 0.91 | −10.83 | 138.37 | 0.95 | 25.39 | 125.75 | 0.93 | 6.04 | 118.33 |
Publisher’s Note: MDPI stays neutral with regard to jurisdictional claims in published maps and institutional affiliations. |
© 2021 by the authors. Licensee MDPI, Basel, Switzerland. This article is an open access article distributed under the terms and conditions of the Creative Commons Attribution (CC BY) license (https://creativecommons.org/licenses/by/4.0/).
Share and Cite
Aguirre, C.; Flores-Aqueveque, V.; Vilches, P.; Vásquez, A.; Rutllant, J.A.; Garreaud, R. Recent Changes in the Low-Level Jet along the Subtropical West Coast of South America. Atmosphere 2021, 12, 465. https://0-doi-org.brum.beds.ac.uk/10.3390/atmos12040465
Aguirre C, Flores-Aqueveque V, Vilches P, Vásquez A, Rutllant JA, Garreaud R. Recent Changes in the Low-Level Jet along the Subtropical West Coast of South America. Atmosphere. 2021; 12(4):465. https://0-doi-org.brum.beds.ac.uk/10.3390/atmos12040465
Chicago/Turabian StyleAguirre, Catalina, Valentina Flores-Aqueveque, Pablo Vilches, Alicia Vásquez, José A. Rutllant, and René Garreaud. 2021. "Recent Changes in the Low-Level Jet along the Subtropical West Coast of South America" Atmosphere 12, no. 4: 465. https://0-doi-org.brum.beds.ac.uk/10.3390/atmos12040465