Article

Climatic Variation of Maximum Intensification Rate for Major Tropical Cyclones over the Western North Pacific

1
State Key Laboratory of Marine Environmental Science, Dongshan Swire Marine Station, and College of Ocean and Earth Sciences, Xiamen University, Xiamen 361005, China
2
Center for Remote Sensing, College of Earth, Ocean and Environment, University of Delaware, Newark, DE 19716, USA
3
Joint Institute for Coastal Research and Management, University of Delaware & Xiamen University, Newark, DE 19716, USA & Xiamen 361005, China
4
School of Naval Architecture and Ocean Engineering, Jiangsu University of Science and Technology, Zhenjiang 212100, China
5
Center for Space and Remote Sensing Research, National Central University, Taoyuan City 320317, Taiwan
6
Key Laboratory of Marine Hazards Forecasting, Ministry of Natural Resources, College of Oceanography, Hohai University, Nanjing 210098, China
7
Southern Marine Science and Engineering Guangdong Laboratory (Zhuhai), Zhuhai 519082, China
*
Author to whom correspondence should be addressed.
Submission received: 2 March 2021 / Revised: 2 April 2021 / Accepted: 12 April 2021 / Published: 14 April 2021
(This article belongs to the Special Issue Asia-Pacific Region: Monsoons and Typhoons)

Abstract

:
To analyze the dependence of intensification rates of tropical cyclones (TCs) on the variation of environmental conditions, an index is proposed here to measure the lifetime maximum intensification rates (LMIRs) for the Saffir–Simpson scale category 4–5 TCs over the western North Pacific. To quantitatively describe the intensification rate of major TCs, the LMIR is defined as the maximum acceleration in the sustained-wind-speed over a 24-h period of an overwater TC. This new index, LMIR, is generally independent of the indices for RI frequency. The results show that the Pacific Decadal Oscillation (PDO) modulates the inter-annual relationship between the LMIR and El Niño/Southern Oscillation (ENSO). The PDO’s modulation on the ENSO’s effect on the LMIR is explored here by considering the relationship between the LMIR and the environmental conditions in different PDO phases. While the ENSO’s effect on the LMIR for the warm PDO phase is generally by affecting the variations of upper ocean heat content, ENSO mainly influences the variations of zonal wind and vertical wind shear for the cold PDO phase. Our results suggest that fast translating TCs tend to attain strong intensification during the warm PDO phase, while a warm subsurface condition may permit slow-translating TCs also to become strongly intensified during the cooling PDO phase. These findings have an important implication for both prediction of RI and the long-term projection of TC activities in the western North Pacific.

1. Introduction

Tropical Cyclones (TCs), especially intense TCs, are ranked among the most destructive natural hazards globally [1]. The rapid intensification (RI) of a TC is of vital importance to understand the TC intensity variation as well as the TC intensity prediction [2,3,4]. RI is defined as an increase by at least 30 knots (15.4 m/s) over a 24-h period in the maximum sustained overwater wind speed [5]. Most major TCs (maximum sustained wind speed equal to or greater than 113 knots, categories 4 and 5 on the Saffir–Simpson hurricane wind scale), both in the Northern Atlantic and western North Pacific, experience at least one RI event during their lifetime [5,6]. The TC intensity change is difficult to forecast, as illustrated by unanticipated RI events, such as that which occurred during Hurricanes Opal (1995) and Bret (1999). The frequent underestimation of RI rates makes the TC intensity forecasting even more challenging, as detailed in a report on Hurricane Wilma [7] and with the record-breaking Hurricane Patricia [8].
Indicators, such as TC number that experienced RI (TCNR) and RI Number (RIN), were adopted to examine the RI frequency in previous studies [5,6,9,10]. To reveal the large-scale characteristics of rapidly intensifying TCs, Kaplan and DeMaria [5] studied the mean initial conditions that are statistically significant different between the RI and non-RI cases, and estimated the probability of RI, based on those predictors. A revised rapid intensity index (RII) which uses 25-, 30-, and 35-kt RI thresholds is used to estimate the probability of RI with large-scale predictors from the Statistical Hurricane Intensity Prediction Scheme database [4]. A proper inner-core structure is required for the intensification of TCs, as is the interaction with large-scale oceanic and atmospheric variables [11,12,13,14]. It has been established that warmer sea surface temperature (SST), lower vertical wind shear, and higher low- to mid-troposphere moisture are necessary environmental conditions for the RI of TC [3,4]. The modulations of the RI location and frequency on climatic timescales are important in forecasting TC intensity and in understanding the variations of major TC activity. Wang and Zhou [6] show that the number of TCs that experienced RI at least once (TCNR) is significantly higher in El Niño years than that in La Niña years. Wang and Liu [10] report that the inter-annual relationship between RIN and El Niño/Southern Oscillation (ENSO) during the warm Pacific Decadal Oscillation (PDO) phases is strong and statistically significant, while during the cold PDO phases there is no significant correlation between ENSO and RIN on the interannual timescale.
The RI rate is as important as the RI frequency in terms of the study of RI of TCs [4,5,15,16]. However, the research addressing the RI rates and how the RI rates respond to the dynamical and thermodynamic condition variation is still minimal. Mei and Xie [17] found that the increased intensity of landfalling typhoons is due to strengthened intensification rates, which in turn are tied to locally enhanced ocean surface warming on the rim of East and Southeast Asia. The 6-h intensification rate that Mei and Xie [17] used is defined as the mean value of the intensification rate and mean translation speed by simply averaging the values at all locations during its intensification period (that is, from the TC reaching typhoon intensity for the first time until its lifetime peak intensity).The TC intensification rate (based on 24-h increase in maximum wind speed) depends on the storm intensity and size in the North Atlantic [16], and on SST, storm intensity, and size in the Northwest Pacific [16]. In analogy with the maximum potential intensity (MPI), the concept of the maximum potential intensification rate (MPIR), introduced by Xu et al. [18], reflects the upper bound of the intensification rate that a TC can reach given favorable environmental conditions. An empirical relationship between the MPIR and SST for TCs over the North Atlantic was constructed by Xu et al. [18] based on best-track TC data and observed SSTs between 1988 and 2014. How the maximum intensification rate (MIR) changes with the environment with observation is still not clear.
We proposed a new index to quantify the lifetime maximum intensification rate of major TCs (LMIR) in this work. LMIR is defined as the maximum increase of the sustained wind speed over a 24-h period during the lifespan of a TC (Figure 1a). Based on the best track data sets, the time-series and cumulative histogram of LMIR, and ENSO effects on the RI were diagnosed in this work. The ENSO–LMIR relationship change on the inter-annual to decadal timescales, and connections with oceanic surface and upper layer warming, atmospheric thermodynamic and dynamic conditions is also examined.

2. Materials and Methods

We use the 6-h best track data to analyze the TCs variation. Data is the International Best Track Archive for Climate Stewardship (IBTACS) [19] and available online at http://www.ncdc.noaa.gov/ibtracs/index.php?name=ibtracs−data (accessed on 13 April 2021). LMIR is defined as the maximum acceleration of the maximum sustained wind speed of a major TC over a 24-h period during its lifespan (Figure 1a). To study the climatic variations of the RI, we calculate the annual mean LMIR by taking an average of all the major TCs’ LMIR during the main typhoon season (May–November) of the years 1958 to 2013. The RIN is obtained following Kaplan and DeMaria’s definition [5], using the acceleration of 30 kt/day threshold, evaluated and counted every 6 h. The annual RIN is the sum of RIN for all the major TCs from May to November.
Our study area is the western North Pacific (WNP) TC main development region (MDR), defined as 122–170° E, 5–20° N. The Joint Typhoon Warming Center subset of IBTACS is used for TC analysis. The change of the following environmental variables in the MDR was examined to explain the variation of MIR and its relationship with ENSO: sea surface temperature anomaly (SSTA), upper layer ocean heat content (OHC), relative humidity (RHUM) in the lowest 500 hPa of troposphere, zonal components of the surface wind field (ZW), vertical wind shear (VWS) between 850 and 200 hPa and wind vorticity (WVor).
The May–November-averaged Multivariate ENSO Index (MEI) represents the phases of ENSO during the peak TC season. The MEI combines both oceanic and atmospheric observed variables to monitor ENSO over the tropical Pacific [20,21].
The operational ocean analysis/reanalysis system (ORAS4) [22] monthly mean data sets from the European Centre for Medium-Range Weather Forecasts (ECMWF) are used to analyze the SSTA and OHC of the upper 100 m layer (hereafter OHC100) in the Western Pacific. The ORAS4 reanalysis data is provided online by ECMWF online via https://www.ecmwf.int/en/research/climate-reanalysis/ocean-reanalysis (accessed on 13 April 2021). The atmospheric variables RHUM, ZW, VWS and WVor are from the 20th Century Reanalysis V2 monthly mean data [23,24], which is provided by the NOAA/OAR/ESRL PSD, Boulder, CO, USA, from their website at https://psl.noaa.gov/ (accessed on 13 April 2021). The spatial and temporal variation of atmospheric and oceanic conditions are analyzed by Empirical Orthogonal Function (EOF) to obtain the major modes contributing to their variation.

3. Results

3.1. Index for Maximum Intensification Rate of Intense TCs

Three time series of the maximum sustained wind speed are shown in Figure 1a to demonstrate the physical meaning of LMIR (index numbers by the Joint Typhoon Warming Center, similarly hereinafter). TC1979#24 underwent a quick intensification and reached the 140 kt peak intensity in less than 3 days. TC1992#17 achieved category 4 within one week with no RI process. TC1988#23 underwent a mild RI and took about 4 days to reach peak intensity. Employing the intensity change of 30 kt per 24 h for RI, the RI number for TC1979#24 and TC1988#23 both were 6. With the RI number, the intensity changes of TCs apparently were not fully represented. As the red bars shown in Figure 1a, the LMIR value is 25 kt, 35 kt, and 70 kt, for TC1992#17, TC1988#23, and TC1979#24, respectively. The intensity change of the TCs is better illustrated by LMIR. Like the TC1979#24, TCs with a large LMIR value reach peak intensity in a very short time, leaving people in areas of impacts little time to respond to TC induced damage.
Figure 1b shows the histogram of LMIR for all the major TCs in WNP from 1958 to 2013. The LMIR ranges from 20 to 90 kt. About 5% of the intense TCs in the western North Pacific have an LMIR of less than 30 kt (per 24 h), indicating no RI process took place during their lifespan. The percentage for 20 kt or for 85–90 kt is about 1%, and for LMIR of 50 kt per 24-h it increases to about 18%. For the 60 kt LMIR, the percentage reduces to about 8%. About one in two of the major TCs have an LMIR of 40 to 55 kt while about a quarter of TCs have an LMIR larger than 60 kt (Figure 1b).
In the early 1970s, the middle 1980s, and the late 2000s, the annual LMIR has large inter-annual variability (Figure 2a). The 7-year running mean LMIR also has a large variation, peaking at 60 kts in the mid-1960s and reaching a minimum of 40 kts in the early 1990s. The ratio between LMIR and TC peak intensity (wind speed), representing the LMIR’s contribution to the peak intensity, shows the same interannual trend as the LMIR time series with a range of 0.27 to 0.47 (Figure 2d). In 1999, there was no TC reaching Cat4&5 intensity in WNP MDR (Figure 2c). The annual mean LMIR index of 1999, which is shown in Figure 2a as the mean of LMIRs of 1998 and 2000, is not used in the following analyses of LMIR–ENSO and LMIR-environment factor relationship and related mechanisms. The TCNR shows large interannual and decadal variation without a clear long-term trend, consistent with Wang and Zhou [6]. The trend of LMIR is different from those for RIN and TCNR (Figure 2b,c) on the decadal time scale. Figure 2 shows that both RIN and TCNR are highly correlated with each other and with the number of Cat45 TCs, whereas LMIR does not show any correlation with Cat4&5 TC numbers.
The relationships between the annual mean LMIR and RIN, and between the annual LMIR and TCNR do not significantly correlate (Figure 2e,f). This result shows that the new LMIR provides an independent dimension for the study of the RI of TCs. It also indicates that the control factors for the variation of the annual mean LMIR and the RI frequency might be different. Further analysis of the variation of LMIR on interannual to decadal time scales and climate modulation on it would improve the understanding of RI behaviors of major TCs.

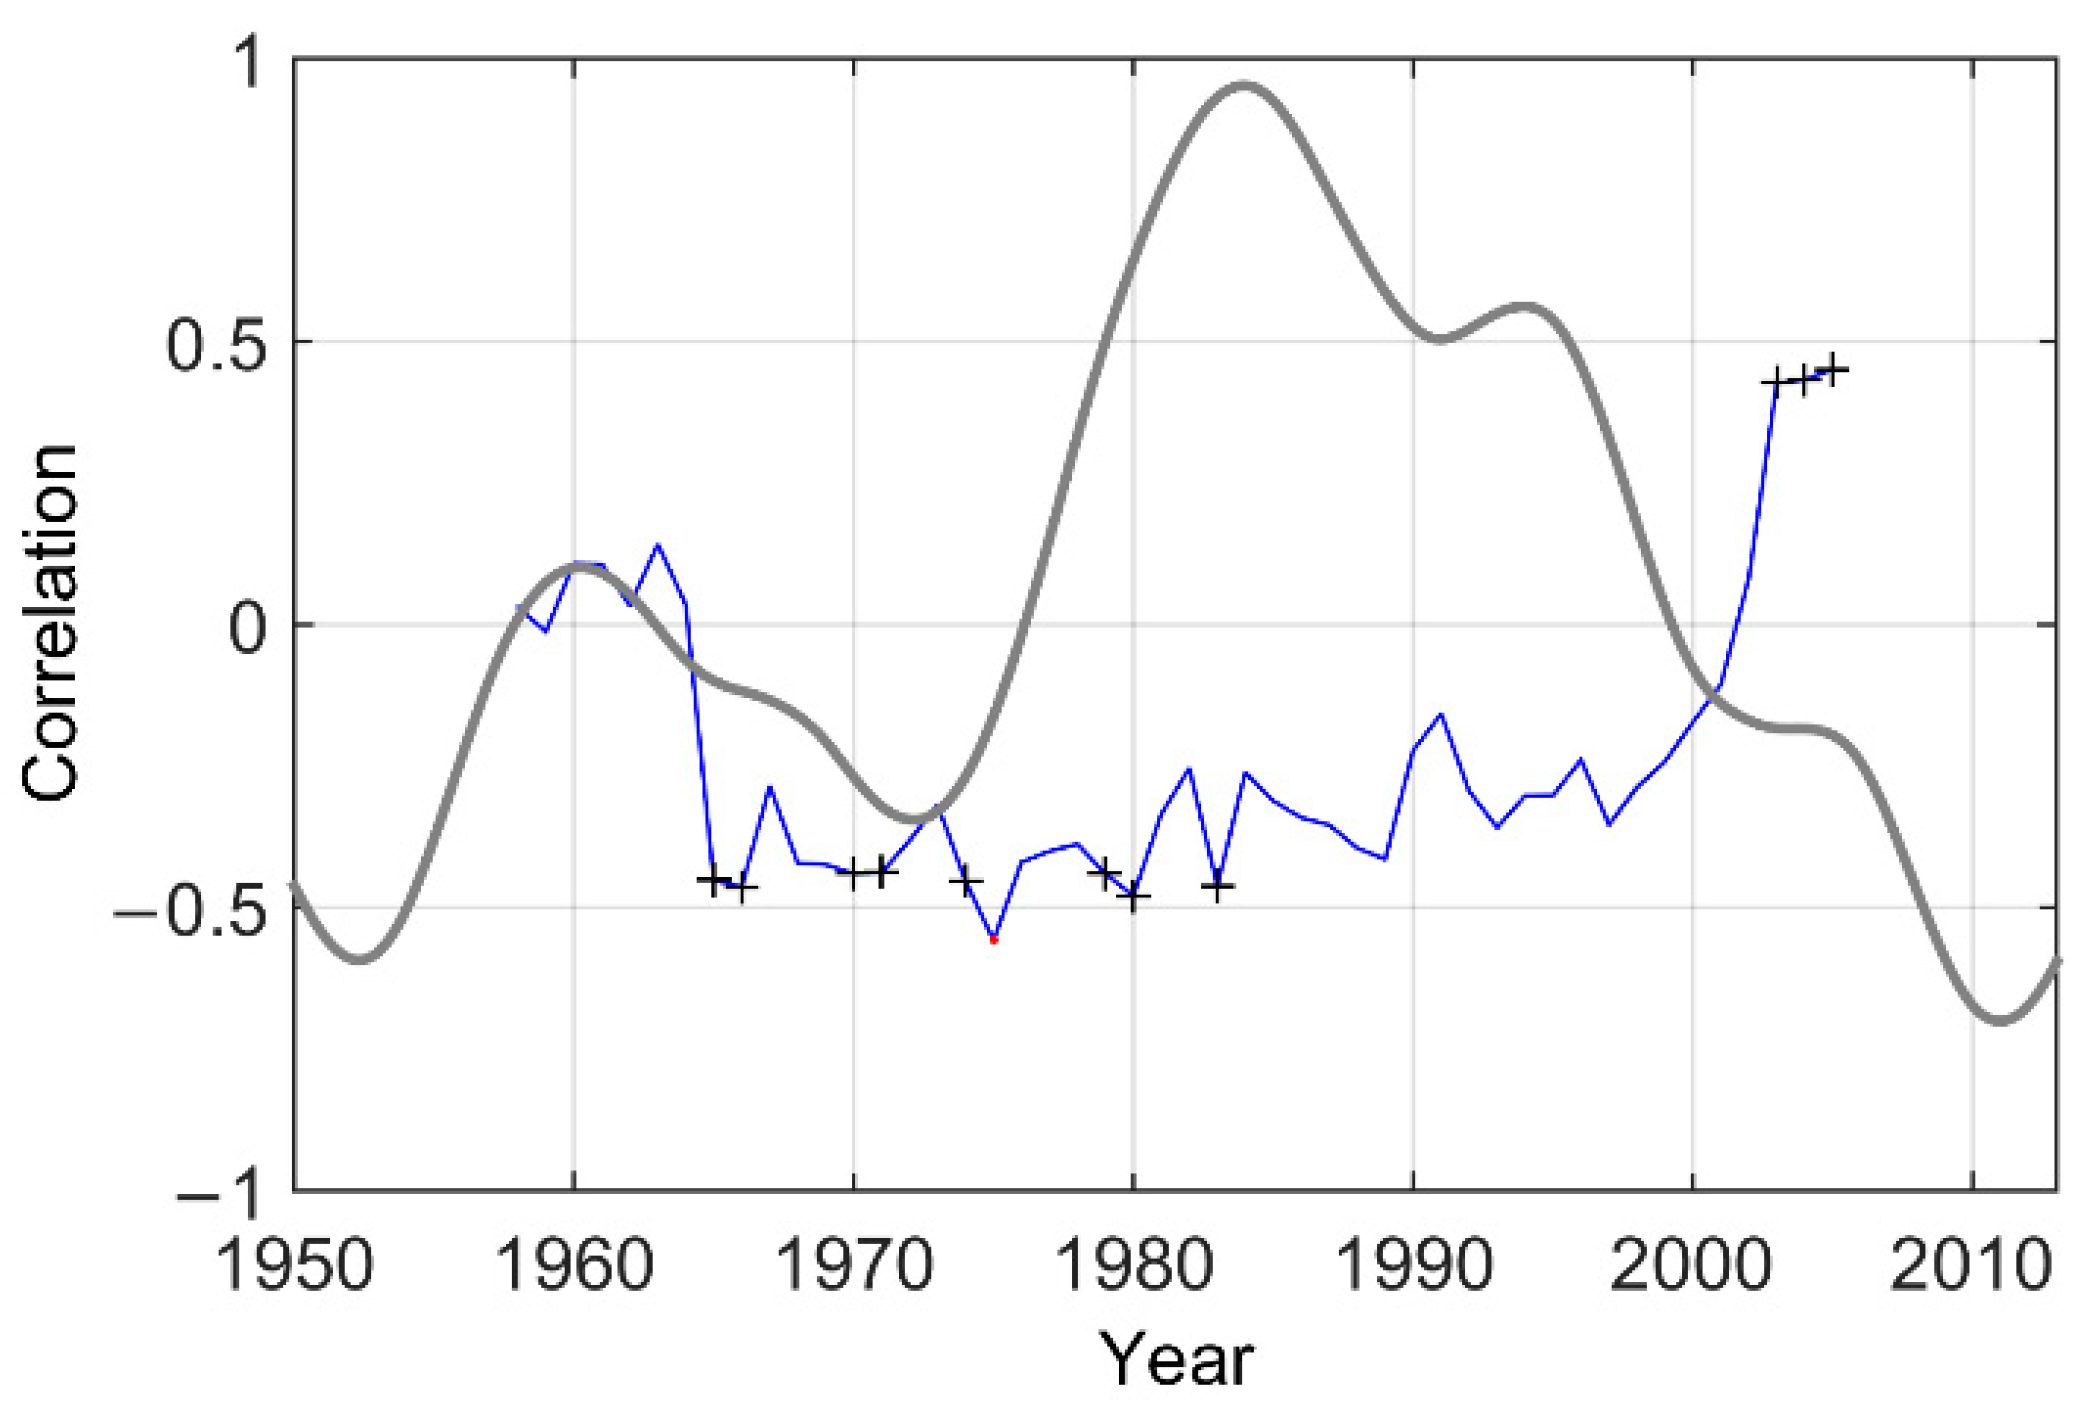
3.2. Effect of ENSO on RI Variation and PDO Modulation

The influences ENSO on the TC activities during different phases in the western North Pacific have been extensively studied [6,10,25,26,27,28,29], most in context of TC location, frequencies, intensity, RI frequency, and so on. We analyze the relationship between LMIR and ENSO to investigate how the climate variability modulates the LMIR variation. The annual mean LMIR is generally negatively correlated with the May–November-averaged MEI (r = −0.17), but the correlation is not significant. We calculated the ten-year sliding correlation between the annual mean MEI and LMIR, and the results show that negative correlation lasts from the early 1970s to the middle 1990s (significant at the 90% confidence level) and the relationship turns into positive correlation in the 2000s (Figure 3). Previous studies show that the decadal time scale variations in the large-scale variables that govern the formation, intensification, and movement of TCs lead to the variations of intense TC activities on the decadal timescales in WNP [25,26]. As the largest contribution to decadal variability of the North Pacific, the PDO is has a strong influence on the decadal large-scale variation of the atmospheric and oceanic conditions. The modulation of PDO in the relationship between ENSO and RI could result in large variation in the relationship between LMIR and MEI.
To identify the relationship between ENSO and RI of TCs, we analyzed three RI indices: LMIR, TCNR, and RIN. In the light of a previous study by Wang and Liu [10] on the PDO modulation of the RI variation, the correlation analyses between RI indices and ENSO index were conducted for different phases of PDO. The decadal variation of the detrended PDO index is obtained with a 15-year Hanning smoothed index (Figure 3). PDO is in the warm phase for 1975–1999, and in the cold phase for 1958–1974 and 2000–2013. In the following part of this paper, the PDO phase period is defined accordingly. The PDO modulation of the ENSO–RI relationship on the interannual time scales is evident from all three TC RI indices (Figure 4).
A significant negative correlation is found between the annual LMIR and the MEI (< 0.05) in the warm PDO phase. However, the correlation is not significant for the cold PDO phase (Figure 4a,b). The correlation between RIN and ENSO is similar, except it is a positive correlation and with a lower significance level (90%) for the warm PDO phase (Figure 4c,d). This result agrees with the RIN and ENSO relation [10]. For the TCNR, the difference is relatively small in the ENSO–TCNR relationship for the different PDO conditions compared to the differences for LMIR and RIN. Among all the three indices, LMIR has the largest difference in correlation coefficient and significance level for the warm PDO and for the cold PDO. This indicates that LMIR provides an additional dimension to study the PDO modulation on the ENSO and RI of the TC relationship. The inter-annual variability of LMIR is impacted by ENSO more closely during the warm PDO phase than in the cold PDO phase.
With a 7-year smoothed time series, we further identified the ENSO–RI relationship on the longer (decadal) time scales. The LMIR and the MEI are not significantly correlated on the decadal time scale (r = 0.02, p = 0.89, Figure 4g,h). The ENSO–RI is negatively (positive) correlated during the warm (cold) PDO phase, suggesting PDO modulation. A bootstrap method was adopted in the correlation analysis. The histogram of resampled correlation coefficient (Figure 5) shows that the variation in the correlation coefficients and their peak values are consistent with that in Figure 4g,h, 0.43 for the cold PDO phase and −0.59 for the warm PDO phase. The bootstrap method further confirmed the difference between the correlations between ENSO and LMIR for different PDO phases. Our results suggest that the variation of LMIR is closely related to ENSO, and their correlation reverses sign with a change in PDO status. The controlling physical mechanisms of LMIR variation might change for different PDO phases.

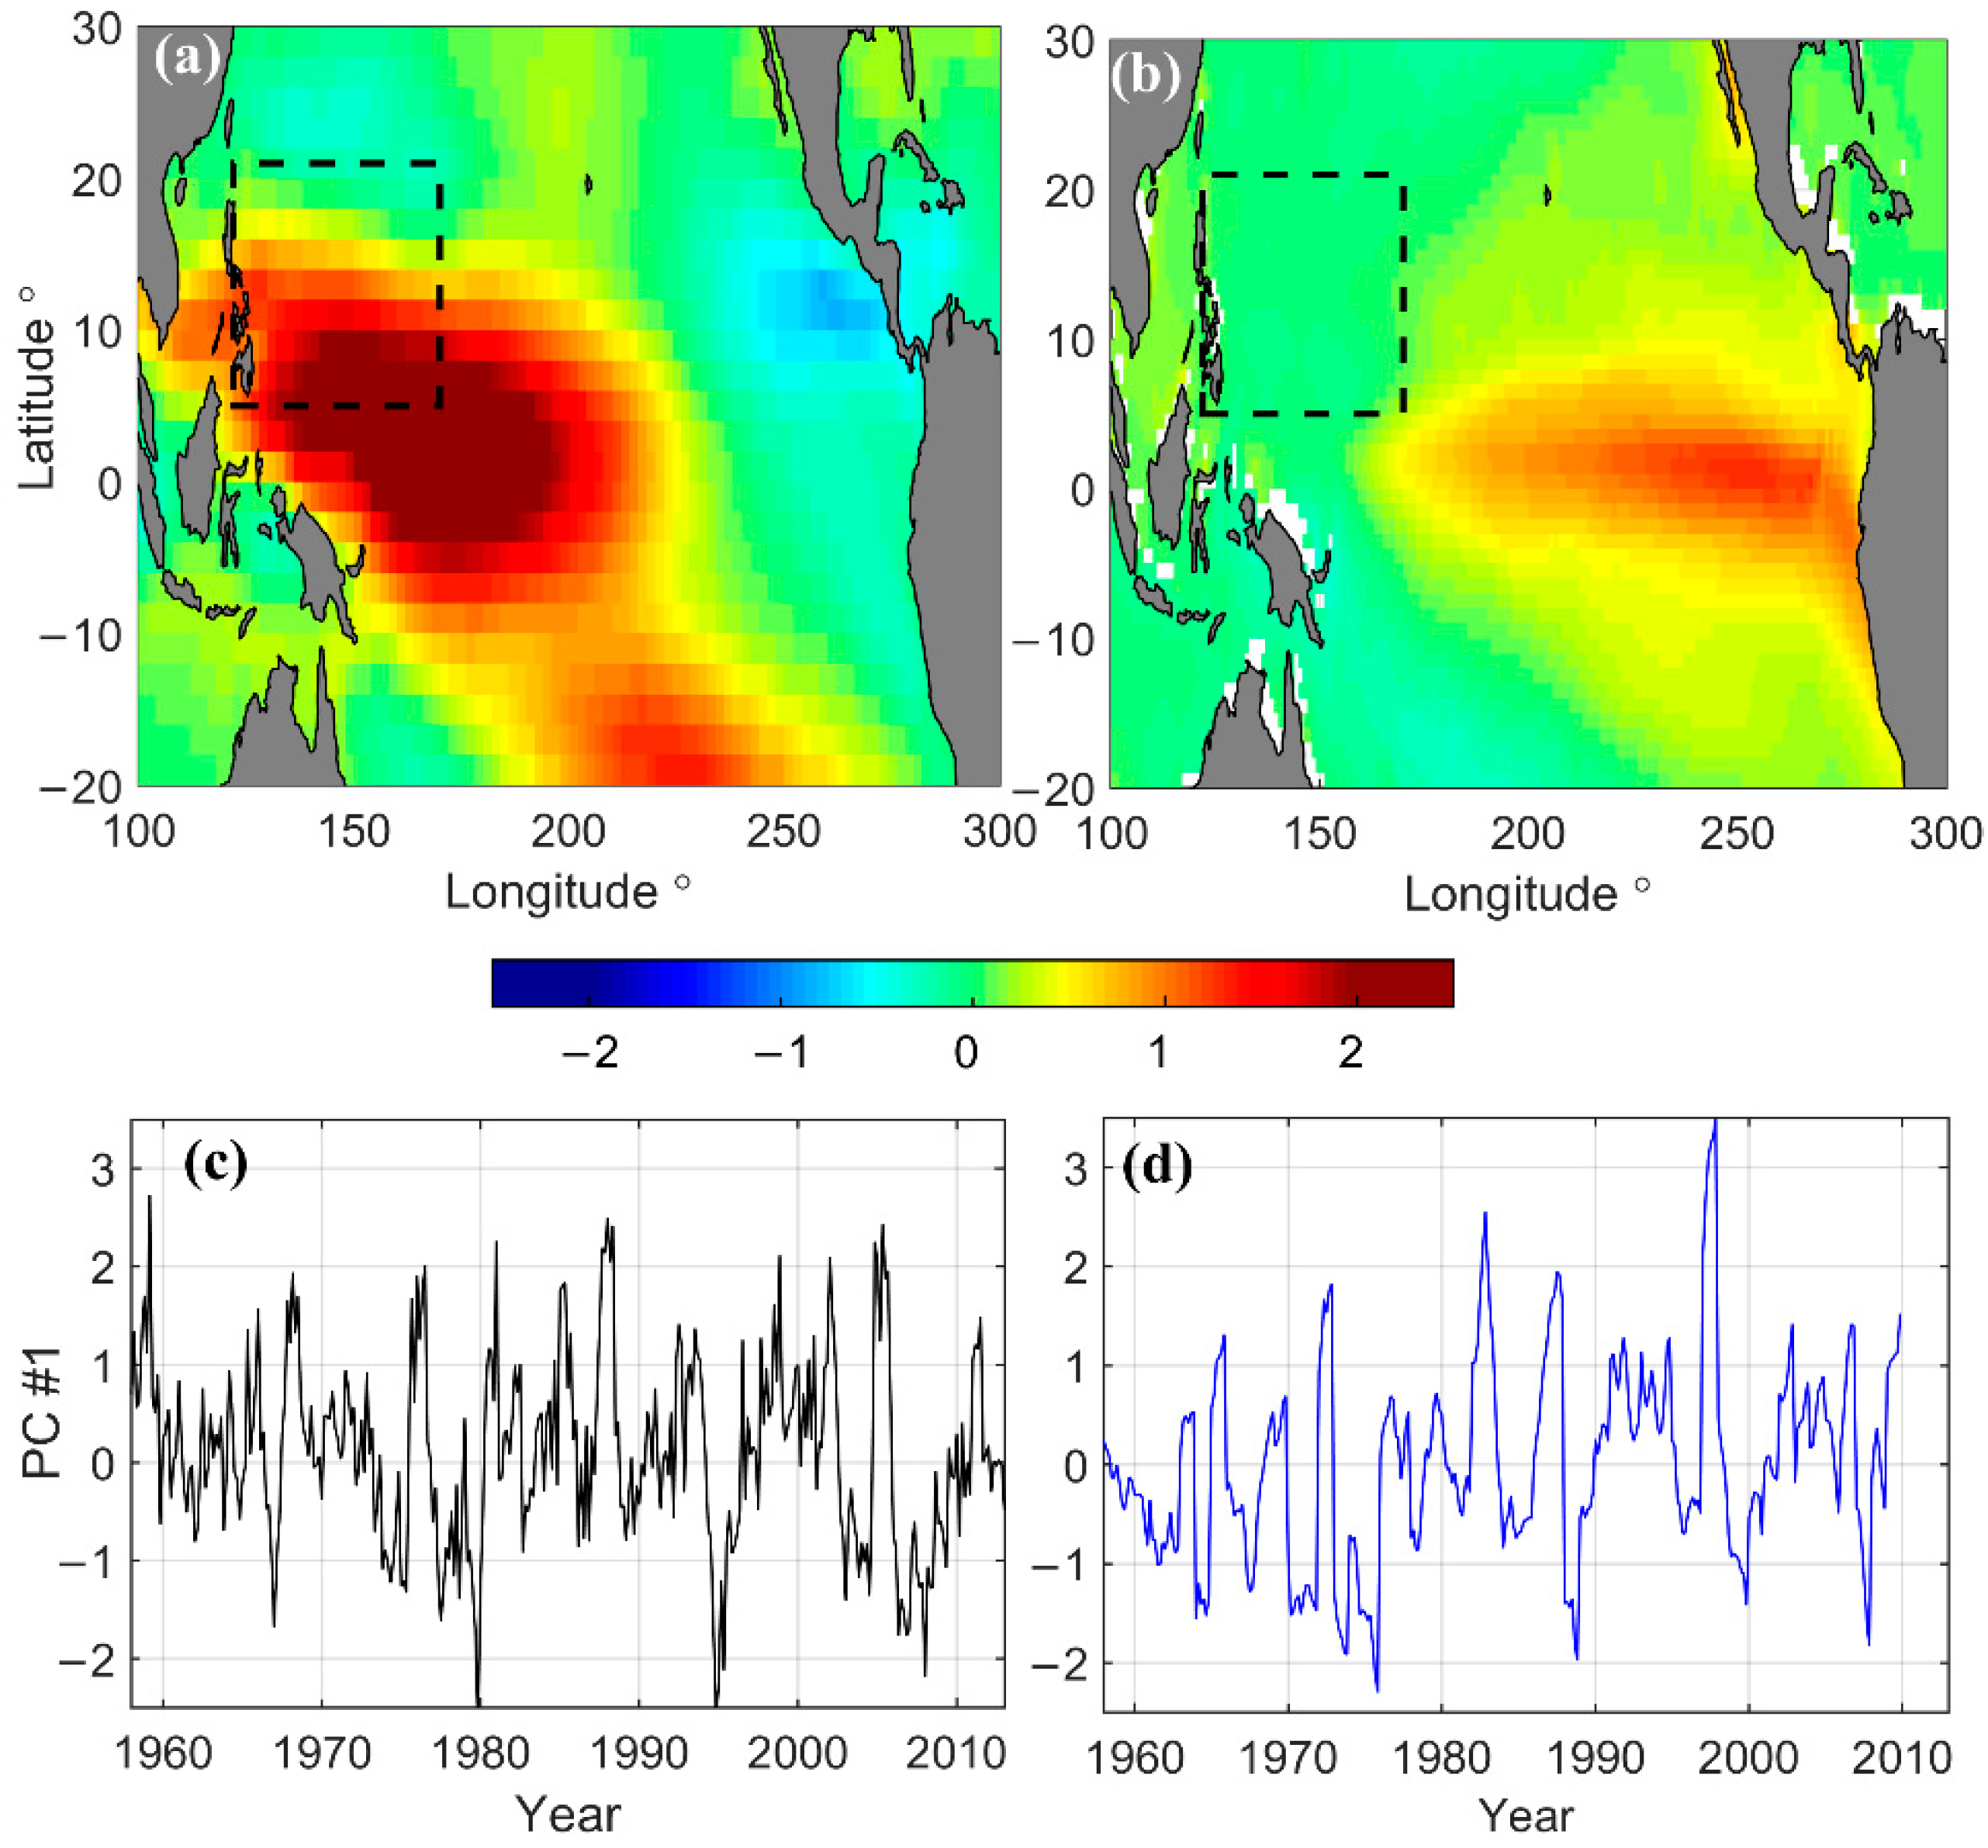
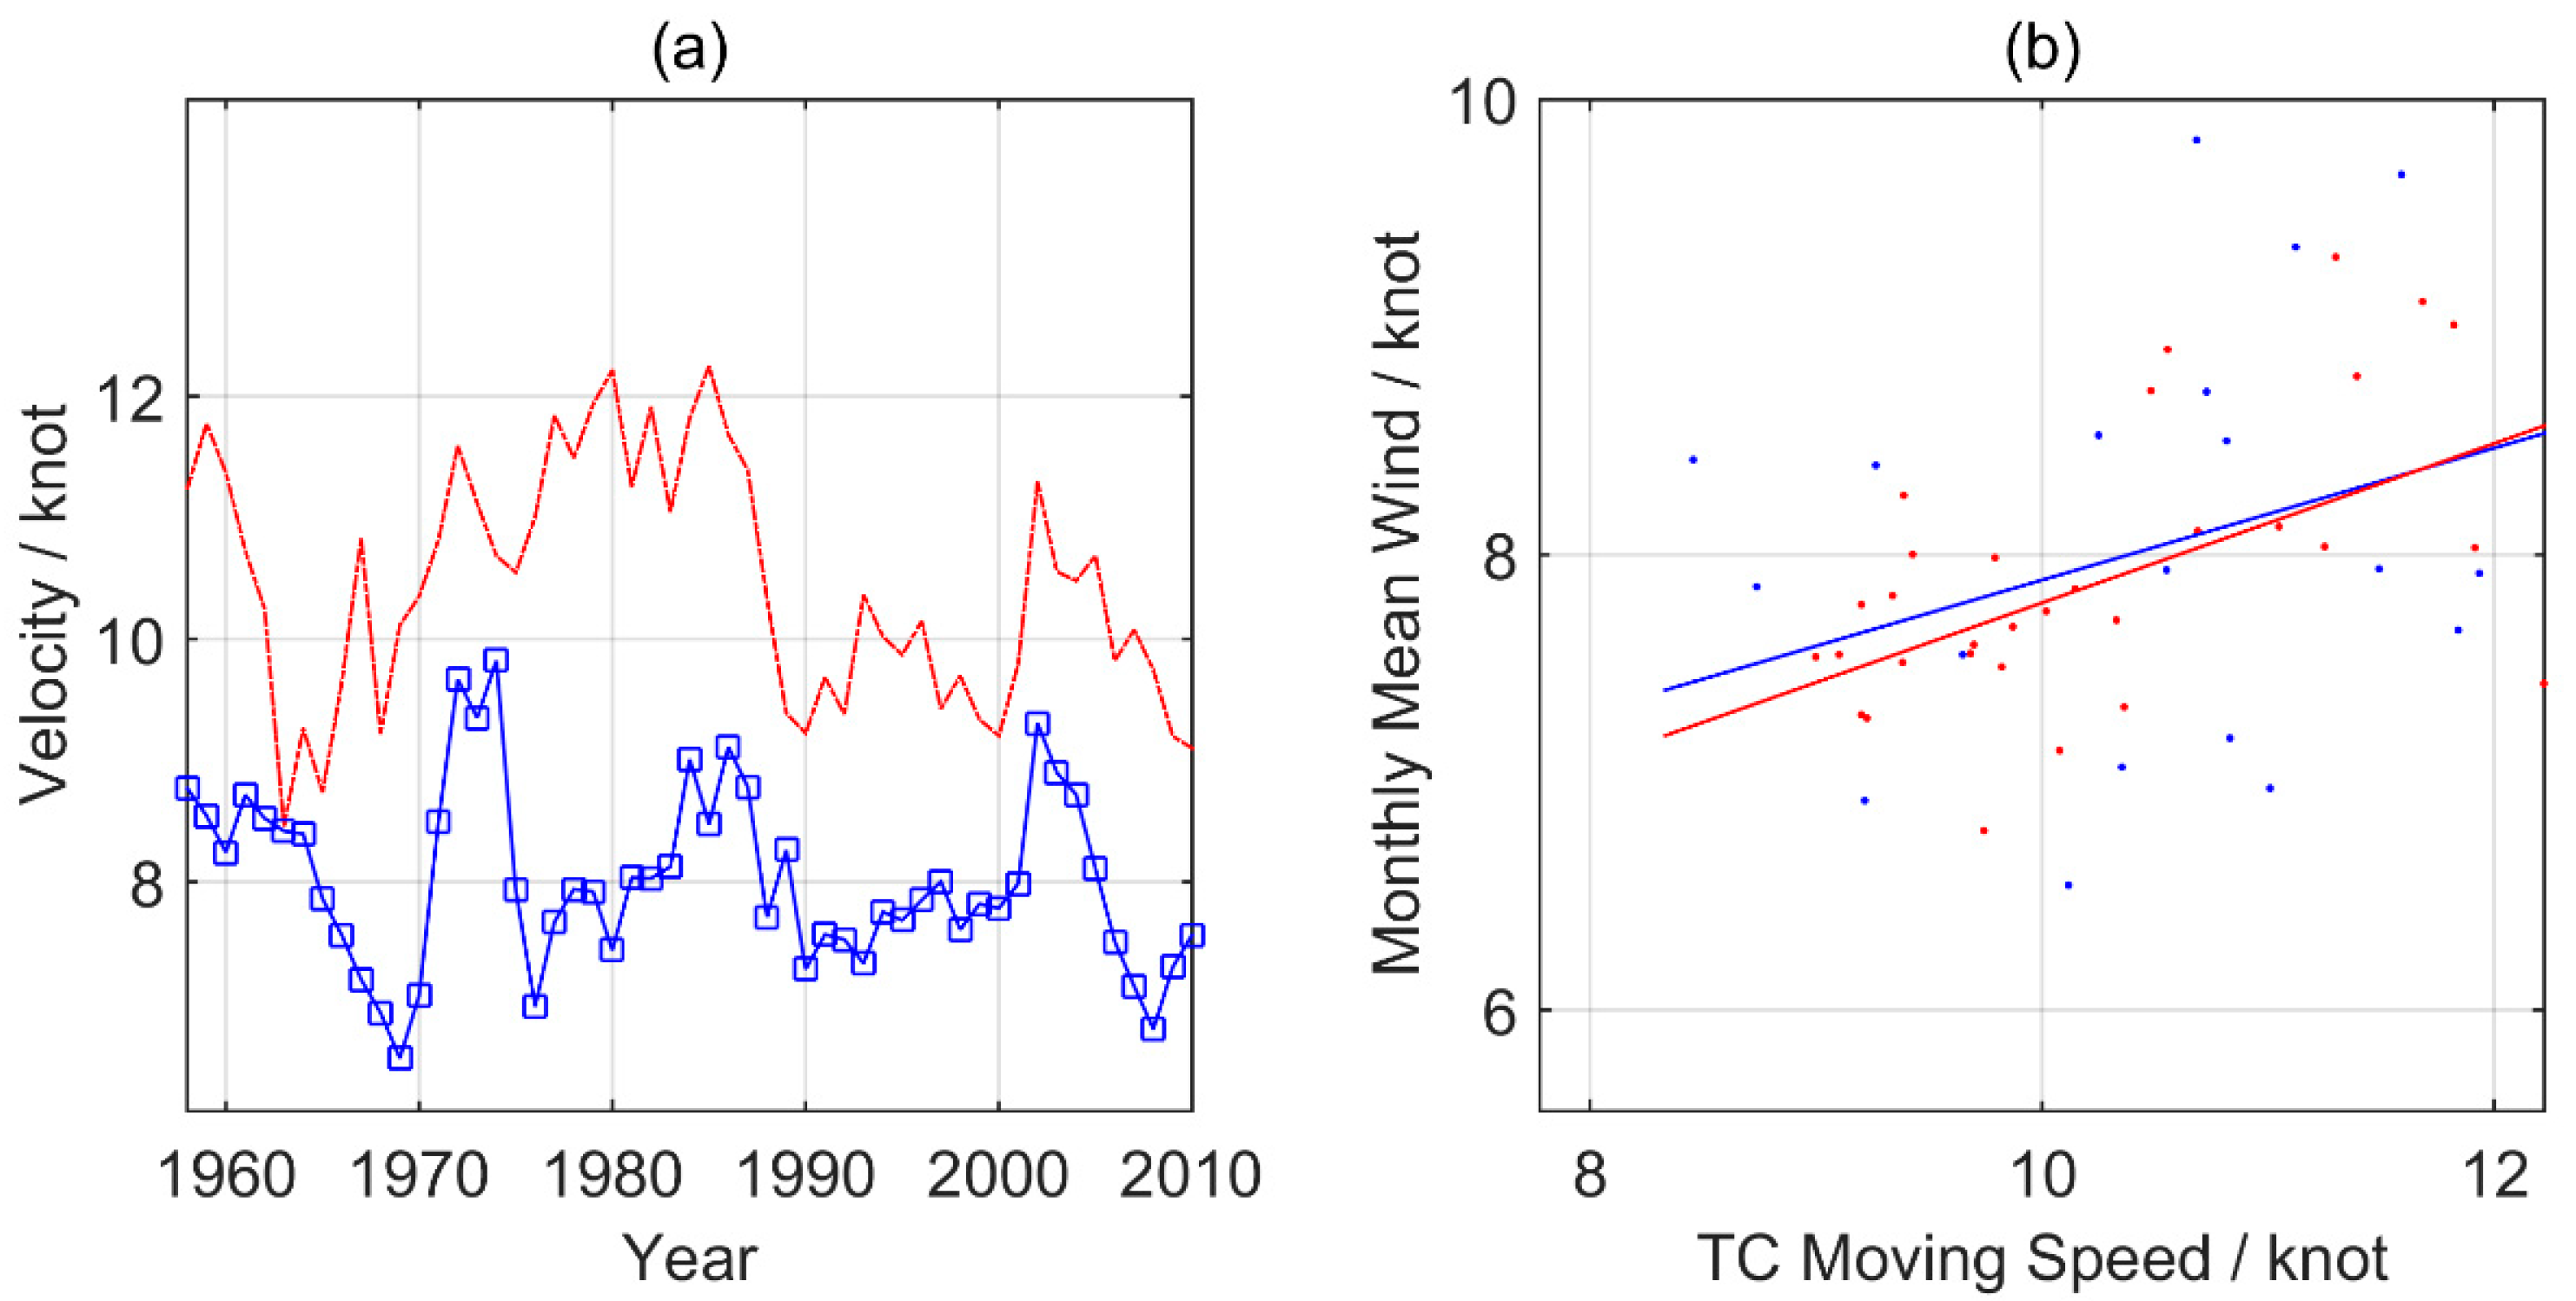
3.3. Environmental Factors Contributing to LMIR Variation

The PDO’s warm (cold) phase can strengthen (weaken) an El Niño event [10]. In conjunction, the sea surface temperature and trade wind system will respond to such variations and induce variations in environmental parameters, such as the upper OHC, relative humidity, vertical wind shear, and westward wind speed. These factors have been noted for their impact on the RI of TC during different PDO phases in the context of the RI frequency [5,6,10]. These corresponding oceanic and atmospheric conditions are further explored using EOF analysis, and correlation analysis is carried out to investigate the physical mechanisms responsible for the PDO modulation on the ENSO–LMIR relationship.
The time series of the leading principal component (PC1) and EOF (EOF1) of SSTA, RHUM, VWS, UW and OHC100 variation, were obtained via EOF analysis (Figure 6). The EOF1s of the SSTA, OHC100, UW, VWS and RHUM account for 42.4%, 41.5%, 23.8%, 19.0% and 16.9% of the total variances during peak TC season, respectively. PC1s of SSTA, OHC100, UW, VWS, and RHUM variation are significantly correlated with ENSO with the correlation coefficients of −0.97, −0.92, −0.81, 0.91, and 0.77, respectively, and all of them are statistically significant at the 99% confidence level. The OHC100, VWS and RHUM EOF1s, and their PC1s time series are consistent with the previous study [10]. The leading EOF of SSTA reveals a tongue-like pattern from the eastern to central tropical Pacific. A monopole located in the western tropical Pacific is shown in the zonal wind (UW) EOF1 (Figure 7).
Correlation analyses were performed between LMIR and PC1 time series of the VWS, UW, RHUM, OHC100, and SSTA, in the MDR of the WNP on the annual and decadal timescales in order to explorer the impacts of the atmospheric and oceanic large-scale conditions that relate LMIR with ENSO during different PDO phases (Figure 8). For the interannual variation, the leading EOF of OHC100 positively correlated with LMIR in both PDO phases, but was not statistically significant. This indicates that the contribution of OHC100 to the change of the inter-annual ENSO–LMIR relation is associated with a change in the PDO status. For the leading SSTA EOF, its correlation with LMIR is significantly positive for the warm phase of the PDO (r = 0.35, p < 0.1). By comparison, during the cold PDO phase the result reveals no statistically significant relationship between LMIR and MEI (r = 0.17). Similarly, the correlations between the annual mean LMIR and leading EOFs of VWS, RHUM, UW are significant in the warm PDO phase with a correlation coefficient of 0.37, 0.38, 0.40 respectively, at the above 90% confidence level. The coefficient is much higher than the correlation in the cold PDO phase. Therefore, the atmospheric thermodynamic (SSTA, RHUM) and the dynamic conditions (UW, VWS) contributed to the ENSO–LMIR relationship change on the inter-annual time scales during different PDO phases, and the zonal wind (UW) is the major contributor.
For the decadal variation, the leading EOF of the SSTA statistically significantly correlate with the annual mean LMIR in the warm PDO above the 95% confidence level (r = 0.44), and the correlation in the cold PDO phase is weak. The leading EOF of OHC100 is significantly correlated with LMIR (r = 0.65, p < 0.01) in the warm PDO, but in the cold phase of the PDO the correlation is not significant between LMIR and EOF1 of OHC100. The correlation between the leading PC of the VWS variation and LMIR reveals a significantly negative (positive) relationship for the warm (cold) PDO phase. Among all the environment variables, the OHC100 variation is predominate in the decadal LMIR variation in the warm PDO period, while in the cold PDO phase VWS dominates. Our results indicate that a shift of dominant driving force and the shift of VWS and ENSO relationship for different PDO phases contributed to the change in the decadal ENSO–LMIR relationship.

4. Discussion

The intensity and frequency trade-off of global TCs in recent decades was reported by Kang and Elsner [30]. Under global warming conditions, future projections based on theory and high-resolution dynamical models [31] reported a reduction in TC frequency but an increase in TC intensity. These studies suggest that it is importance to use indicators of intensity and frequency together to study TC activity and RI processes of TCs [3]. For the RI study, RIN and TCNR have been used as indicators of frequency. Our results suggest that the RIN reflects the RI intensity change but is not a complete representation (Figure 1a). LMIR, an indicator for the level of RI, provides an additional understanding of the RI variation of TCs.
In the present study, we calculate LMIR only for those TCs that have reached a lifetime maximum intensity threshold of 113 kts (the Saffir–Simpson scale category 4–5). To examine the sensitivity of annual mean LMIR to a 5 or 10 kt change to the arbitrary threshold, we also tried 103, 108, and 118 kts as the lifetime maximum intensity threshold to calculate annual mean LMIR, and list all the statistic in Table 1. With a 5 kt lower threshold of the lifetime maximum intensity, the TC numbers involved in the annual mean LMIR calculation would increase about 30 TCs (about 10%), while the annual mean LMIR value would change about 0.5–1.0 (about 1–2%). This indicates that the annual mean LMIR is insensitive to a 5 or 10 kt change to the arbitrary threshold.
LMIR is generally independent of the indices for RI frequency of TC (Figure 2e,f). During the warm PDO phase, LMIR is not statistically significantly correlated with TCNR or RIN (Figure 9b,d), indicating a difference in driving forcing for the frequency and the intensity rate of RI. The interannual ENSO–RIN relationship is strengthened in the warm PDO phase, and the change of vertical wind shear is believed to play an important role [10]. During the cool PDO phase, the LMIR correlated to TCNR (Figure 9a) and RIN (Figure 9c) significantly, indicating more similar control factors for intensity rate and frequency of RI during the cold PDO phase.
The variation of the zonal wind is dominant in the inter-annual ENSO–LMIR relationship change for different PDO phases. This might be related to the close relationship between zonal wind and translational speed of TCs. Significant correlation between the TC translational speed and the zonal wind speed in the warm PDO phase is shown in Figure 10. Lin et al. [32] reported that a fast-moving speed contributed more than the warming of the upper ocean to the RI of TC, in their case study on the intensification of super-typhoon Haiyan. A large amount of latent heat energy is required for TCs to be extracted efficiently from the upper layer ocean during RI processes [10]. However, colder subsurface water is pumped to the sea surface by the wind stress during TC intensification, inducing a surface cooling effect [14,33]. Faster-moving storms tend to generate weaker sea surface cooling and have shorter exposure to cooling, both of which tend to weaken the negative SST feedback [34]. The subsurface OHC depresses the cooling effect during the RI process [14,33,35,36,37,38]. The upper ocean heat content might be a key factor in determining the location, frequency of RI, and the annual TCNR [10,39,40,41]. The easterly trade wind is strengthened(weakened) during the cold(warm) PDO phase at low levels, which tends to make equatorial warm water spread northward into (southward out of) MDR in WNP [41]. During the warming PDO phase, the upper layer OHC in the MDR is relatively low. The strong relationship between zonal wind and LMIR suggests that only fast translating TCs will get high LMIR (experience RI) during warm PDO. During the cooling PDO phase, the upper layer OHC is relatively high in the MDR. The warm subsurface condition may permit slow-translating TCs to become high (experience RI), resulting in a week relationship between LMIR and zonal wind speed during the cooling PDO phase.
Our analysis shows that the LMIR is significantly correlated with the upper ocean heat content on the decadal time scales but not on the interannual time scales. LMIR variation is dominated by OHC100 during the warm PDO phase, suggesting that the LMIR reflects the ocean thermal control of the ENSO impact on the RI of TCs. which is of significance in the prediction of TC intensity change and projections of intense TC activity in MDR of the western North Pacific [25,26,27,42,43].

5. Conclusions

LMIR was proposed in this study to quantify the intensification rate of intense TCs over WNP. Generally, an independent relation is found between LMIR and the indices for the RI frequency of TCs, especially in the warm PDO period. LMIR variations in the western North Pacific on the inter-annual to decadal time scales were investigated with the best track TC data sets from JTWC.
The PDO-modulation of the ENSO impact on RI is examined on the inter-annual and decadal time scales using the new LMIR index. The PDO modulation on the inter-annual ENSO and rapid intensification relation is better interpreted with LMIR, compared to RIN and TCNR. On the interannual time scales, the LMIR and ENSO relationship is close and significant for the warm PDO phase while it is not significant during the cold PDO phase. On the decadal time scale, the LMIR–ENSO relationship is statistically significantly negative (positive) during the warm (cold) PDO phase.
To understand the mechanisms behind this, we investigated both the dynamic and thermodynamic conditions through which PDO modulates the impacts that ENSO exerts on LMIR, based on EOF analysis and correlation analysis. Results reveal that PDO modulates the ENSO–LMIR relationship in the warm and cold PDO phases on the inter-annual timescales, through dynamic conditions as vertical wind shear and zonal wind speed, and thermodynamic conditions like SSTA, and relative humidity. The upper layer OHC (VWS) dominates the ENSO and LMIR relationship during the warm (cold) PDO phases on the decadal timescales. The shifting in dominant environmental conditions modulates the LMIR–ENSO inter-annual relationship during different PDO phases. The dominant role of UW in the LMIR–ENSO relationship change is due to its high correlation with the TC translation speed. During warming of the PDO phase, the low OHC subsurface condition requires TCs to translate fast to get high LMIR (experience RI). In cooling the PDO phase, the warm subsurface condition permits slow-translating TCs to also achieve high LMIR (experience RI). Our study has important implications for the seasonal prediction and long-term projections of intense TC activity in the MDR of the western North Pacific.

Author Contributions

Conceptualization, X.W. and Y.L.; methodology, X.W.; writing—original draft preparation, X.W., G.L.; writing—review and editing, X.W., Y.-A.L., H.M., G.L.; supervision, X.-H.Y.; funding acquisition, X.-H.Y. All authors have read and agreed to the published version of the manuscript.

Funding

This research was funded by the National Natural Science Foundation of China (42076005 and 41831175) and the Fundamental Research Funds for the Central Universities (B210201015).

Institutional Review Board Statement

Not applicable.

Informed Consent Statement

Not applicable.

Data Availability Statement

The datasets used in this study are publicly available online.

Acknowledgments

The ORAS4 reanalysis data is provided online by ECMWF, https://www.ecmwf.int/en/research/climate-reanalysis/ocean-reanalysis (accessed on 13 April 2021). The 20th Century Reanalysis V2 data, which is provided by the NOAA/OAR/ESRL PSD, Boulder, CO, USA, from their website at https://psl.noaa.gov/ (accessed on 13 April 2021).

Conflicts of Interest

The authors declare no conflict of interest.

References

  1. Pielke, R.A., Jr.; Landsea, C.W. Normalized hurricane damages in the United States: 1925–1995. Weather Forecast. 1998, 13, 621–631. [Google Scholar] [CrossRef]
  2. Elsberry, R.L.; Lambert, T.D.B.; Boothe, M.A. Accuracy of Atlantic and Eastern North Pacific tropical cyclone intensity forecast guidance. Weather Forecast. 2007, 22, 747–762. [Google Scholar] [CrossRef]
  3. Jiang, H.; Ramirez, E.M. Necessary conditions for tropical cyclone rapid intensification as derived from 11 Years of TRMM data. J. Clim. 2013, 26, 6459–6470. [Google Scholar] [CrossRef]
  4. Kaplan, J.; DeMaria, M.; Knaff, J.A. A revised tropical cyclone rapid intensification index for the Atlantic and Eastern North Pacific basins. Weather Forecast. 2010, 25, 220–241. [Google Scholar] [CrossRef]
  5. Kaplan, J.; DeMaria, M. Large-Scale characteristics of rapidly intensifying tropical cyclones in the North Atlantic Basin. Weather Forecast. 2003, 18, 1093–1108. [Google Scholar] [CrossRef] [Green Version]
  6. Wang, B.; Zhou, X. Climate variation and prediction of rapid intensification in tropical cyclones in the western North Pacific. Meteorol. Atmos. Phys. 2008, 99, 1–16. [Google Scholar] [CrossRef]
  7. Chen, H.; Zhang, D.L.; Carton, J.; Atlas, R. On the rapid intensification of Hurricane Wilma (2005). Part I: Model prediction and structural changes. Weather Forecast. 2011, 26, 885–901. [Google Scholar] [CrossRef]
  8. Foltz, G.R.; Balaguru, K. Prolonged El Niño conditions in 2014–2015 and the rapid intensification of Hurricane Patricia in the eastern Pacific. Geophys. Res. Lett. 2016, 43, 10347–10355. [Google Scholar] [CrossRef] [Green Version]
  9. Lander, M.; Guard, C.; Camargo, S.J. Tropical cyclones, super-typhoon Haiyan, in State of the Climate in 2013. Bull. Am. Meteorol. Soc. 2014, 95, S112–S114. [Google Scholar]
  10. Wang, X.; Liu, H. PDO modulation of ENSO effect on tropical cyclone rapid intensification in the western North Pacific. Clim. Dyn. 2015, 46, 15–28. [Google Scholar] [CrossRef]
  11. Gray, W.M. Hurricanes: Their formation, structure and likely role in the tropical circulation. In Supplement to Meteorology Over Tropical Oceans; Shaw, D.B., Ed.; Royal Meteorological Society, James Glaisher House: Berkshire, UK, 1979; pp. 155–218. [Google Scholar]
  12. Emanuel, K.A. Tropical cyclones. Annu. Rev. Earth Planet. Sci. 2003, 31, 75–104. [Google Scholar] [CrossRef]
  13. Cione, J.J.; Kalina, E.A.; Zhang, J.A.; Uhlhorn, E.W. Observations of air–sea interaction and intensity change in hurricanes. Mon. Weather Rev. 2013, 141, 2368–2382. [Google Scholar] [CrossRef]
  14. Price, J.F. Upper ocean response to a hurricane. J. Phys. Oceanogr. 1981, 11, 153–175. [Google Scholar] [CrossRef] [Green Version]
  15. Mei, W.; Xie, S.P.; Primeau, F.; McWilliams, J.C.; Pasquero, C. Northwestern Pacific typhoon intensity controlled by changes in ocean temperatures. Sci. Adv. 2015, 1, e1500014. [Google Scholar] [CrossRef] [Green Version]
  16. Xu, J.; Wang, Y. A statistical analysis on the dependence of tropical cyclone intensification rate on the storm intensity and size in the North Atlantic. Weather Forecast. 2015, 30, 692–701. [Google Scholar] [CrossRef]
  17. Mei, W.; Xie, S.P. Intensification of landfalling typhoons over the northwest Pacific since the late 1970s. Nat. Geosci. 2016, 9, 753–757. [Google Scholar] [CrossRef]
  18. Xu, J.; Wang, Y.; Tan, Z. The relationship between sea surface temperature and maximum intensification rate of tropical cyclones in the North Atlantic. J. Atmos. Sci. 2016, 73, 4979–4988. [Google Scholar] [CrossRef]
  19. Knapp, K.R.; Kruk, M.C.; Levinson, D.H.; Diamond, H.J.; Neumann, C.J. The International Best Track Archive for Climate Stewardship (IBTrACS): Unifying tropical cyclone best track data. Bull. Am. Meteorol. Soc. 2010, 91, 363–376. [Google Scholar] [CrossRef]
  20. Wolter, K. The Southern Oscillation in surface circulation and climate over the tropical Atlantic, Eastern Pacific, and Indian Oceans as captured by cluster analysis. J. Clim. Appl. Meteorol. 1987, 26, 540–558. [Google Scholar] [CrossRef] [Green Version]
  21. Wolter, K.; Timlin, M.S. Measuring the strength of ENSO events—How does 1997/98 rank? Weather 1998, 53, 315–324. [Google Scholar] [CrossRef]
  22. Balmaseda, M.A.; Mogensen, K.; Weaver, A.T. Evaluation of the ECMWF ocean reanalysis system ORAS4. Q. J. R. Meteorol. Soc. 2013, 139, 1132–1161. [Google Scholar] [CrossRef]
  23. Compo, G.P.; Whitaker, J.S.; Sardeshmukh, P.D.; Matsui, N.; Allan, R.J.; Yin, X.; Gleason, B.E.; Vose, R.S.; Rutledge, G.K.; Bessemoulin, P.; et al. The twentieth century reanalysis project. Q. J. R. Meteorol. Soc. 2011, 137, 1–28. [Google Scholar] [CrossRef]
  24. Compo, G.P.; Whitaker, J.S.; Sardeshmukh, P.D. Feasibility of a 100 years reanalysis using only surface pressure data. Bull. Am. Meteorol. Soc. 2006, 87, 175–190. [Google Scholar] [CrossRef] [Green Version]
  25. Chan, J.C.L. Decadal variations of intense typhoon occurrence in the western North Pacific. Proc. R. Soc. Lond. 2008, 464A, 249–272. [Google Scholar] [CrossRef]
  26. Chan, J.C.L. Thermodynamic control on the climate of intense tropical cyclones. Proc. R. Soc. A 2009, 465, 3011–3021. [Google Scholar] [CrossRef]
  27. Chan, J.C.L. Global warming and tropical cyclone activity in the western North Pacific from an observational perspective. In Climate Dynamics: Why Does Climate Vary? Sun, D.-Z., Bryan, F., Eds.; American Geophysical Union: Washington, DC, USA, 2010; Volume 189, pp. 193–205. [Google Scholar] [CrossRef]
  28. Li, R.C.Y.; Zhou, W. Changes in Western Pacific tropical cyclones associated with the El Niño–Southern oscillation cycle. J. Clim. 2012, 25, 5864–5878. [Google Scholar] [CrossRef]
  29. Li, R.C.Y.; Zhou, W. Interdecadal changes in summertime tropical cyclone precipitation over southeast China during 1960–2009. J. Clim. 2015, 28, 1494–1509. [Google Scholar] [CrossRef]
  30. Kang, N.Y.; Elsner, J. Trade-off between intensity and frequency of global tropical cyclones. Nat. Clim. Chang. 2015, 5, 661–664. [Google Scholar] [CrossRef]
  31. Knutson, T.R.; McBride, J.L.; Chan, J.; Emanuel, K.; Holland, G.; Landsea, C.; Held, I.; Kossin, J.P.; Srivastava, A.K.; Sugi, M. Tropical cyclones and climate change. Nat. Geosci. 2010, 3, 157–163. [Google Scholar] [CrossRef] [Green Version]
  32. Lin, I.-I.; Pun, I.-F.; Lien, C.-C. “Category-6” supertyphoon Haiyan in global warming hiatus: Contribution from subsurface ocean warming. Geophys. Res. Lett. 2014, 41, 8547–8553. [Google Scholar] [CrossRef]
  33. Price, J.F. Metrics of hurricane-ocean interaction: Vertically-integrated or vertically-averaged ocean temperature? Ocean Sci. 2009, 5, 351–368. [Google Scholar] [CrossRef] [Green Version]
  34. Mei, W.; Pasquero, C.; Primeau, F. The effect of translation speed upon the intensity of tropical cyclones over the tropical ocean. Geophys. Res. Lett. 2012, 39, L07801. [Google Scholar] [CrossRef] [Green Version]
  35. Lin, I.-I.; Wu, C.C.; Pun, I.-F.; Ko, D.-S. Upper-ocean thermal structure and the western North Pacific category 5 typhoons. Part I: Ocean features and the category 5 typhoons’ intensification. Mon. Weather Rev. 2008, 136, 3288–3306. [Google Scholar] [CrossRef] [Green Version]
  36. Lin, I.-I.; Pun, I.-F.; Wu, C.-C. Upper ocean thermal structure and the western North Pacific category-5 typhoons. Part II: Dependence on translation speed. Mon. Weather Rev. 2009, 137, 3744–3757. [Google Scholar] [CrossRef]
  37. Lin, I.; Chan, J. Recent decrease in typhoon destructive potential and global warming implications. Nat. Commun. 2015, 6, 7182. [Google Scholar] [CrossRef] [Green Version]
  38. Shay, L.K.; Goni, G.J.; Black, P.G. Effects of a warm oceanic feature on hurricane opal. Mon. Weather Rev. 2000, 128, 1366–1383. [Google Scholar] [CrossRef]
  39. Pun, I.F.; Lin, I.-I.; Lo, M.-H. Recent increase in high tropical cyclone heat potential area in the Western North Pacific Ocean. Geophys. Res. Lett. 2013, 40, 4680–4684. [Google Scholar] [CrossRef]
  40. Jin, F.F.; Boucharel, J.; Lin, I.-I. Eastern Pacific tropical cyclones intensified by El Nino delivery of subsurface ocean heat. Nature 2014, 516, 82–85. [Google Scholar] [CrossRef]
  41. Wang, X.; Wang, C.; Zhang, L.; Wang, X. Multi-decadal variability of tropical cyclone rapid intensification in the Western North Pacific. J. Clim. 2015, 28, 3806–3820. [Google Scholar] [CrossRef]
  42. Liou, Y.-A.; Liu, J.-C.; Liu, C.-P.; Liu, C.-C. Season-Dependent distributions and profiles of seven super-typhoons (2014) in the Northwestern Pacific Ocean from satellite cloud images. IEEE Trans. Geosci. Remote Sens. 2018, 56, 2949–2957. [Google Scholar] [CrossRef]
  43. Nguyen, K.A.; Liou, Y.-A.; Terry, J.P. Vulnerability of Vietnam to typhoons: A spatial assessment based on hazards, exposure and adaptive capacity. Sci. Total Environ. 2019, 682, 31–46. [Google Scholar] [CrossRef] [PubMed]
Figure 1. (a) Evolution of three Cat4&5 (the Saffir–Simpson scale) tropical cyclone intensity, with rapid intensification (RI) events denoted by horizontal bars and lifetime maximum intensification rates (LMIR) denoted by vertical red bars. (b) Histogram and cumulative curve of LMIR for all the Cat4&5 tropical cyclones during typhoon season (May–November) of the years 1958 to 2013 in the western North Pacific (WNP).
Atmosphere 12 00494 g001
Figure 2. The historical time series of the annual mean tropical cyclone indices. (a) lifetime maximum intensification rate (LMIR, kt per 24-h); (b) number of rapid intensification events (RIN), (c) annual counts of tropical cyclones (TCs) (category 4 and 5 of the Saffir–Simpson scale) and counts of TCs with RI events (TCNR), (d) annual mean of the ratio between LMIR and TC maximum sustained wind speed with a gap in 1999, due to no Cat4&5 TC that year in the TC main development region (MDR) of western North Pacific (WNP). The gray polylines denote the 7-year running mean of the time series. Relationship between (e) TCNR, (f) annual RIN and the annual LMIR index with blue regression lines.
Atmosphere 12 00494 g002
Figure 3. Correlation coefficient of the 10-year sliding correlation between the May–November averaged LMIR and the May–November averaged MEI index of 1958–2013 (blue line), with the correlation significant at the 90% labelled as black crosses and 95% confidence level labelled as red dot crosses. The gray curve is the Hanning smoothed (15-year) Pacific Decadal Oscillation (PDO) index (detrended).
Atmosphere 12 00494 g003
Figure 4. Relationship between the May–November averaged El Niño/Southern Oscillation (ENSO) index (MEI) and (a,b) lifetime maximum intensification rate (LMIR), (c,d) TCNR, (e,f) RIN, and (g,h) 7-year moving smoothed MEI (May–November averaged) and LMIR for positive (right) and negative (left) PDO phases. with blue regression lines, correlation coefficient (r) and the p-value labelled.
Atmosphere 12 00494 g004
Figure 5. The variation of the correlation coefficient between the 7-year smoothed annual mean LMIR and MEI during the (a) cold-PDO and (b) warm-PDO phases across all the bootstrap samples, with correlation coefficient standard error (se) labeled. Data points for each PDO phase are resampled to create 1000 different data sets, and the correlation between the two variables is computed for each data set.
Atmosphere 12 00494 g005
Figure 6. The leading Empirical Orthogonal Function (EOF) pattern of the May–November mean environment variables of 1958–2013 in the Tropical Pacific. (a) upper 100 m layer ocean heat content (OHC100), (b) relative humidity (RHUM), (c) vertical wind shear (VWS), (d) leading principal components (PCs). The dash boxes in (ac) denote the tropical cyclone MDR in the western North Pacific.
Atmosphere 12 00494 g006
Figure 7. The leading EOF pattern of the May–November mean environment variables of 1958–2013 in the Tropical Pacific, (a) zonal wind (UW) and (b) sea surface temperature anomaly (SSTA) and (c,d) leading PCs, with dash boxes in (a,b) denoting the tropical cyclone MDR in the western North Pacific.
Atmosphere 12 00494 g007
Figure 8. Correlation between annual mean LMIR and the leading PC of the May–November averaged environmental condition variations for the year of 1958–2013, for the positive (+ denoted) and negative (− denoted) phases of PDO, with only the coefficient for the correlations significant above the 90% confidence level are plotted.
Atmosphere 12 00494 g008
Figure 9. Relationship between LMIR and (a,b) TCNR, (c,d) RINs for the negative (right) and positive (left) phases of PDO, with blue regressions lines, coefficient of correlation (r) and p-value labeled.
Atmosphere 12 00494 g009
Figure 10. Time series of (a) and the scatter plot (b) of wind speed (monthly mean) over MDR and the translation speed of TCs. (b) for warm PDO phase, 1975–1999 with red regression line (r = 0.57, p < 0.01).
Atmosphere 12 00494 g010
Table 1. Statistic of annual mean lifetime maximum intensification rates (LMIRs) using a different threshold of maximum intensity.
Maximum Intensity Threshold (kts)TC CountAnnual Mean LMIR (kts/24 h)
MeanMinMax
10336048.232.565
10833349.132.567.5
11330349.632.567.5
11827150.733.867.5
Publisher’s Note: MDPI stays neutral with regard to jurisdictional claims in published maps and institutional affiliations.

