
Air Quality Assessment in the State of Kuwait during 2012 to 2017


1
Department of Earth and Environmental Sciences, Kuwait University, P.O. Box 25944, Safat 1320, Kuwait
2
Department of Mathematics and Statistics, University of Strathclyde, Livingstone Tower (Level 9), 26 Richmond Street, Glasgow G1 1XH, UK
*
Author to whom correspondence should be addressed.
Atmosphere 2021, 12(6), 678; https://0-doi-org.brum.beds.ac.uk/10.3390/atmos12060678
Submission received: 17 April 2021
/
Revised: 21 May 2021
/
Accepted: 23 May 2021
/
Published: 26 May 2021
(This article belongs to the Collection Measurement of Exposure to Air Pollution)
Abstract
:This study aimed to examine the trend of ambient air pollution (i.e., ozone (), nitrogen monoxide (), nitrogen dioxide (), nitrogen oxides (), sulfur dioxide (), carbon monoxide (), benzene () and particulate matter with an aerodynamic diameter smaller than 10 microns (), and non-methane hydrocarbons () at 10 monitoring stations located in the main residential and industrial areas in the State of Kuwait over 6 years (2012–2017). We found that the level in industrial areas (0.065 ppm) exceeded the allowable range of in residential areas (0.030 ppm). Air pollution variables were defined by the Environmental Public Authority of Kuwait (K-EPA). In this study, integrated statistical analysis was performed to compare an established air pollution database to Kuwait Ambient Air Quality Guidelines and to determine the association between pollutants and meteorological factors. All pollutants were positively correlated, with the exception of most pollutants and and . Meteorological factors, i.e., the ambient temperature, wind speed and humidity, were also significantly associated with the above pollutants. Spatial distribution mapping indicated that the level remained high during the southwest monsoon (the hot and dry season), while the level was high during the northeast monsoon (the wet season). The and levels were high during the first intermonsoon season.
1. Introduction
Air pollution has remained a major concern in recent decades and unfavorably affects the health of residents living in both developed and underdeveloped countries [1,2,3]. Millions of people worldwide are exposed to high levels of air pollution, which has raised human health concerns. Some of the contemporary environmental threats resulting from the consequences of human activities include greenhouse effects, ozone holes, acid rain, deforestation and photochemical smog as a main responsible threat. The combined effect of ambient (outdoor) and household (indoor) air pollution poses a major threats to health and environment. In 2014, approximately 92% of the global population resided in areas where World Health Organization (WHO) air pollution standards were not satisfied [4,5]. Rapid population growth and industrial development have led to an increase in pollution rates. According to the WHO, particle pollution, ground-level ozone (), sulfur dioxide (), nitrogen dioxide (), and carbon monoxide () have been monitored. In addition, other pollutants occur in air comprising suspended material, such as dust, gaseous pollutants, smoke, hydrocarbons, fumes, volatile organic compounds (), polycyclic aromatic hydrocarbons (), and halogen derivatives, which may cause vulnerability to many diseases at high concentrations [6]. Moreover, Alsaber et al. [7] detected an increased risk of rheumatoid arthritis (RA) in subjects exposed to through evaluation of the disease activity score with 28 examined joints (DAS-28), and based on the Kuwait Registry for Rheumatic Diseases, they described the detrimental effects of short-term exposure to and on RA progression, while no correlation was found in regard to particulate matter with an aerodynamic diameter smaller than 10 microns (), and CO. Over the last few decades, Kuwait has experienced rapid socioeconomic and infrastructure development. The steady increase in its population, human activities, transportation fleet and power demand has contributed to environmental air pollution in Kuwait [8,9]. The major sources of air pollution in Kuwait include petrochemical plants, power plants, refineries and gasoline and diesel vehicles. The large number of motorized vehicles and construction expansion in industrial areas have greatly contributed to an increase in the air pollution level. In a study by [10], Kuwait was found to be the most polluted country in Southwest Asia. In July 2018, Kuwait recorded the highest air quality index (AQI) value, i.e., 301, which is hazardous and associated with serious health effects. The daily and annual concentrations of particulate matter with an aerodynamic diameter of at least 2.5 () and in Kuwait exceeded the threshold values (daily mean : 10; 24-h mean : 25; daily mean : 20; 24-h mean : 25) defined by the WHO [11]. The chemical composition of these particulates in dust fallout and reported high concentrations of calcite and quartz [12]. They concluded that long-term exposure to these particulates could cause serious respiratory effects. Several studies on air pollution in Kuwait indicated a notable increase in various air pollutants, such as methane (), , , , nitrogen oxides () and total sulfur (), over a certain period [13,14,15,16]. Another study demonstrated that traffic was the major source of air pollution in the district adjacent to the Kuwait City center, while oil refineries contributed the most to the ambient air pollution level in a rural district [17]. Albassam et al. [18] studied three pollutants, namely, , and nonmethane hydrocarbons (), in the vicinity of a congested area in Kuwait. They found that the concentration was much higher than the corresponding standard limit defined by the Environmental Public Authority of Kuwait (K-EPA) (an hourly maximum of 3.65 ppm and a daily average value of 1.6 ppm), which corresponded to the traffic conditions in the area. The authors focused on the impact of urban growth resulting in vehicle fleet increase in two case studies involving residential areas. They recorded excess and concentrations in both case studies. To date, no major analysis has been performed of air pollution in both industrial and residential areas, thereby identifying the sources of pollutants in Kuwait. Consequently, the aim of the present study is to measure the concentration of certain major air pollutants in industrial and residential areas. The pollutants addressed are , nitrogen monoxide (), , , , benzene (), and , while weather variables, such as the temperature, humidity and wind speed, were also considered.
This paper presents air pollution measurements from 2012 to 2017 based on ten monitoring stations at various locations across Kuwait. The monitoring stations were categorized into two distinct categories: the first category was defined as residential areas (including seven stations), and the second category was defined as industrial areas (including three stations). The main objective of this study is to analyze the associations with meteorological variables (wind speed, wind direction, temperature and relative humidity) on the concentrations of pollutants , and , , , , and in Kuwait via exploratory data analysis techniques. Additionally, the pollutant concentrations in residential and industrial areas were compared.
2. Data and Methods
2.1. Description of the Study Area
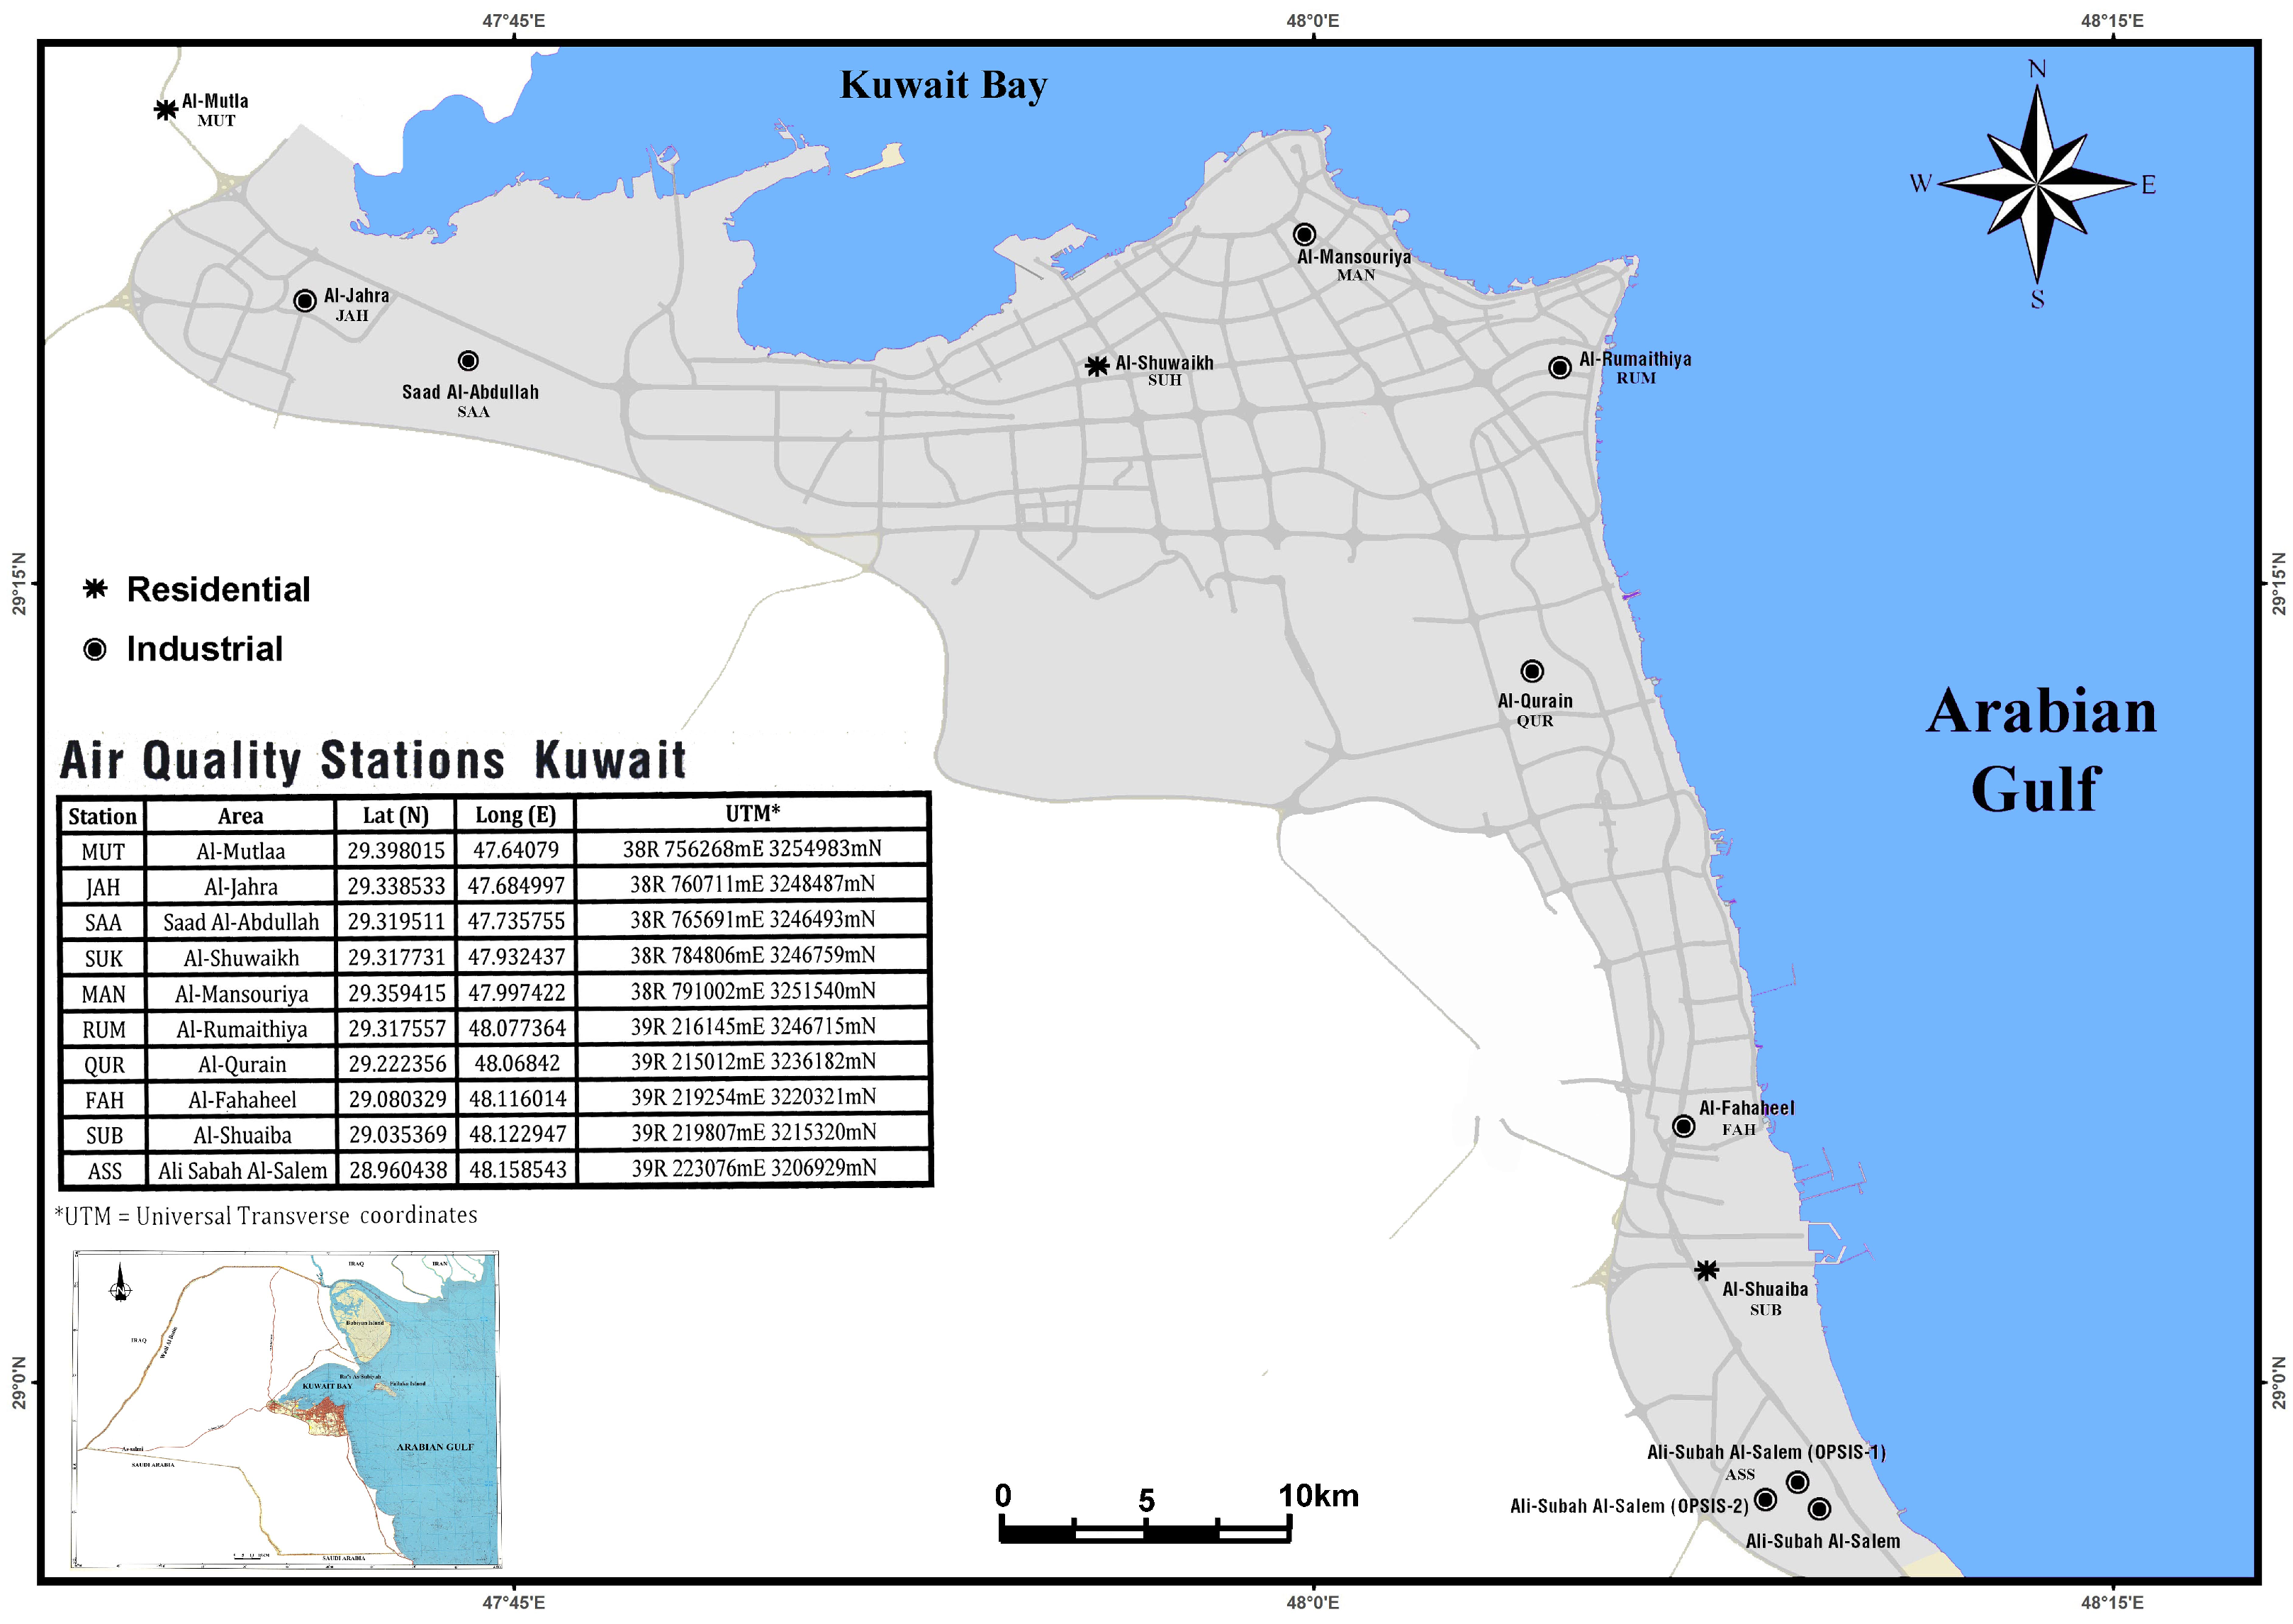
The State of Kuwait is located in the northeastern corner of the Arabian Peninsula and at the top of the Arabian Gulf. It is a small developing country with a total area of 17,818 km and depends mainly on the oil and petroleum industry. Additionally, as a desert area with a scarcity of fresh water, its main source of fresh water is desalinated sea water. Kuwait hosts three main desalination plants. Furthermore, the area is affected by severe dust storms during the summer season, which highly contribute to pollution in this area [19,20]. The K-EPA maintains 15 distributed air quality monitoring stations to achieve an adequate area coverage. Ten stations were selected in this study (Figure 1). The selection of these 10 stations was based on the observed variety of land use changes and developments, i.e., industrial and residential. This selection included the probable effect of industrial and transportation (traffic) effluents on the air quality.
2.2. Data Collection
The present study is based on daily air pollutant data pertaining to the period of 2012–2017 obtained from the Environmental Public Authority at a total of ten stations: seven residential and three industrial stations across Kuwait. The residential stations covered in this study included Ali-Subah Al-Salem (ASS), Al-Fahaheel (FAH), Al-Jahra (JAH), Al-Mansouriya (MAN), Al-Qurain (QUR), Al-Rumaithiya (RUM) and Saad Al-Abdullah (SAA), and the industrial stations included Al-Mutla (MUT), Al-Shuaiba (SUB) and Al-Shuwaikh (SUK). The data corresponding to the studied pollutants were continuously monitored at these sites. The atmospheric pollutant data consisted of , , , , , , , and , and the weather parameter data comprised the temperature, wind direction/speed and humidity.
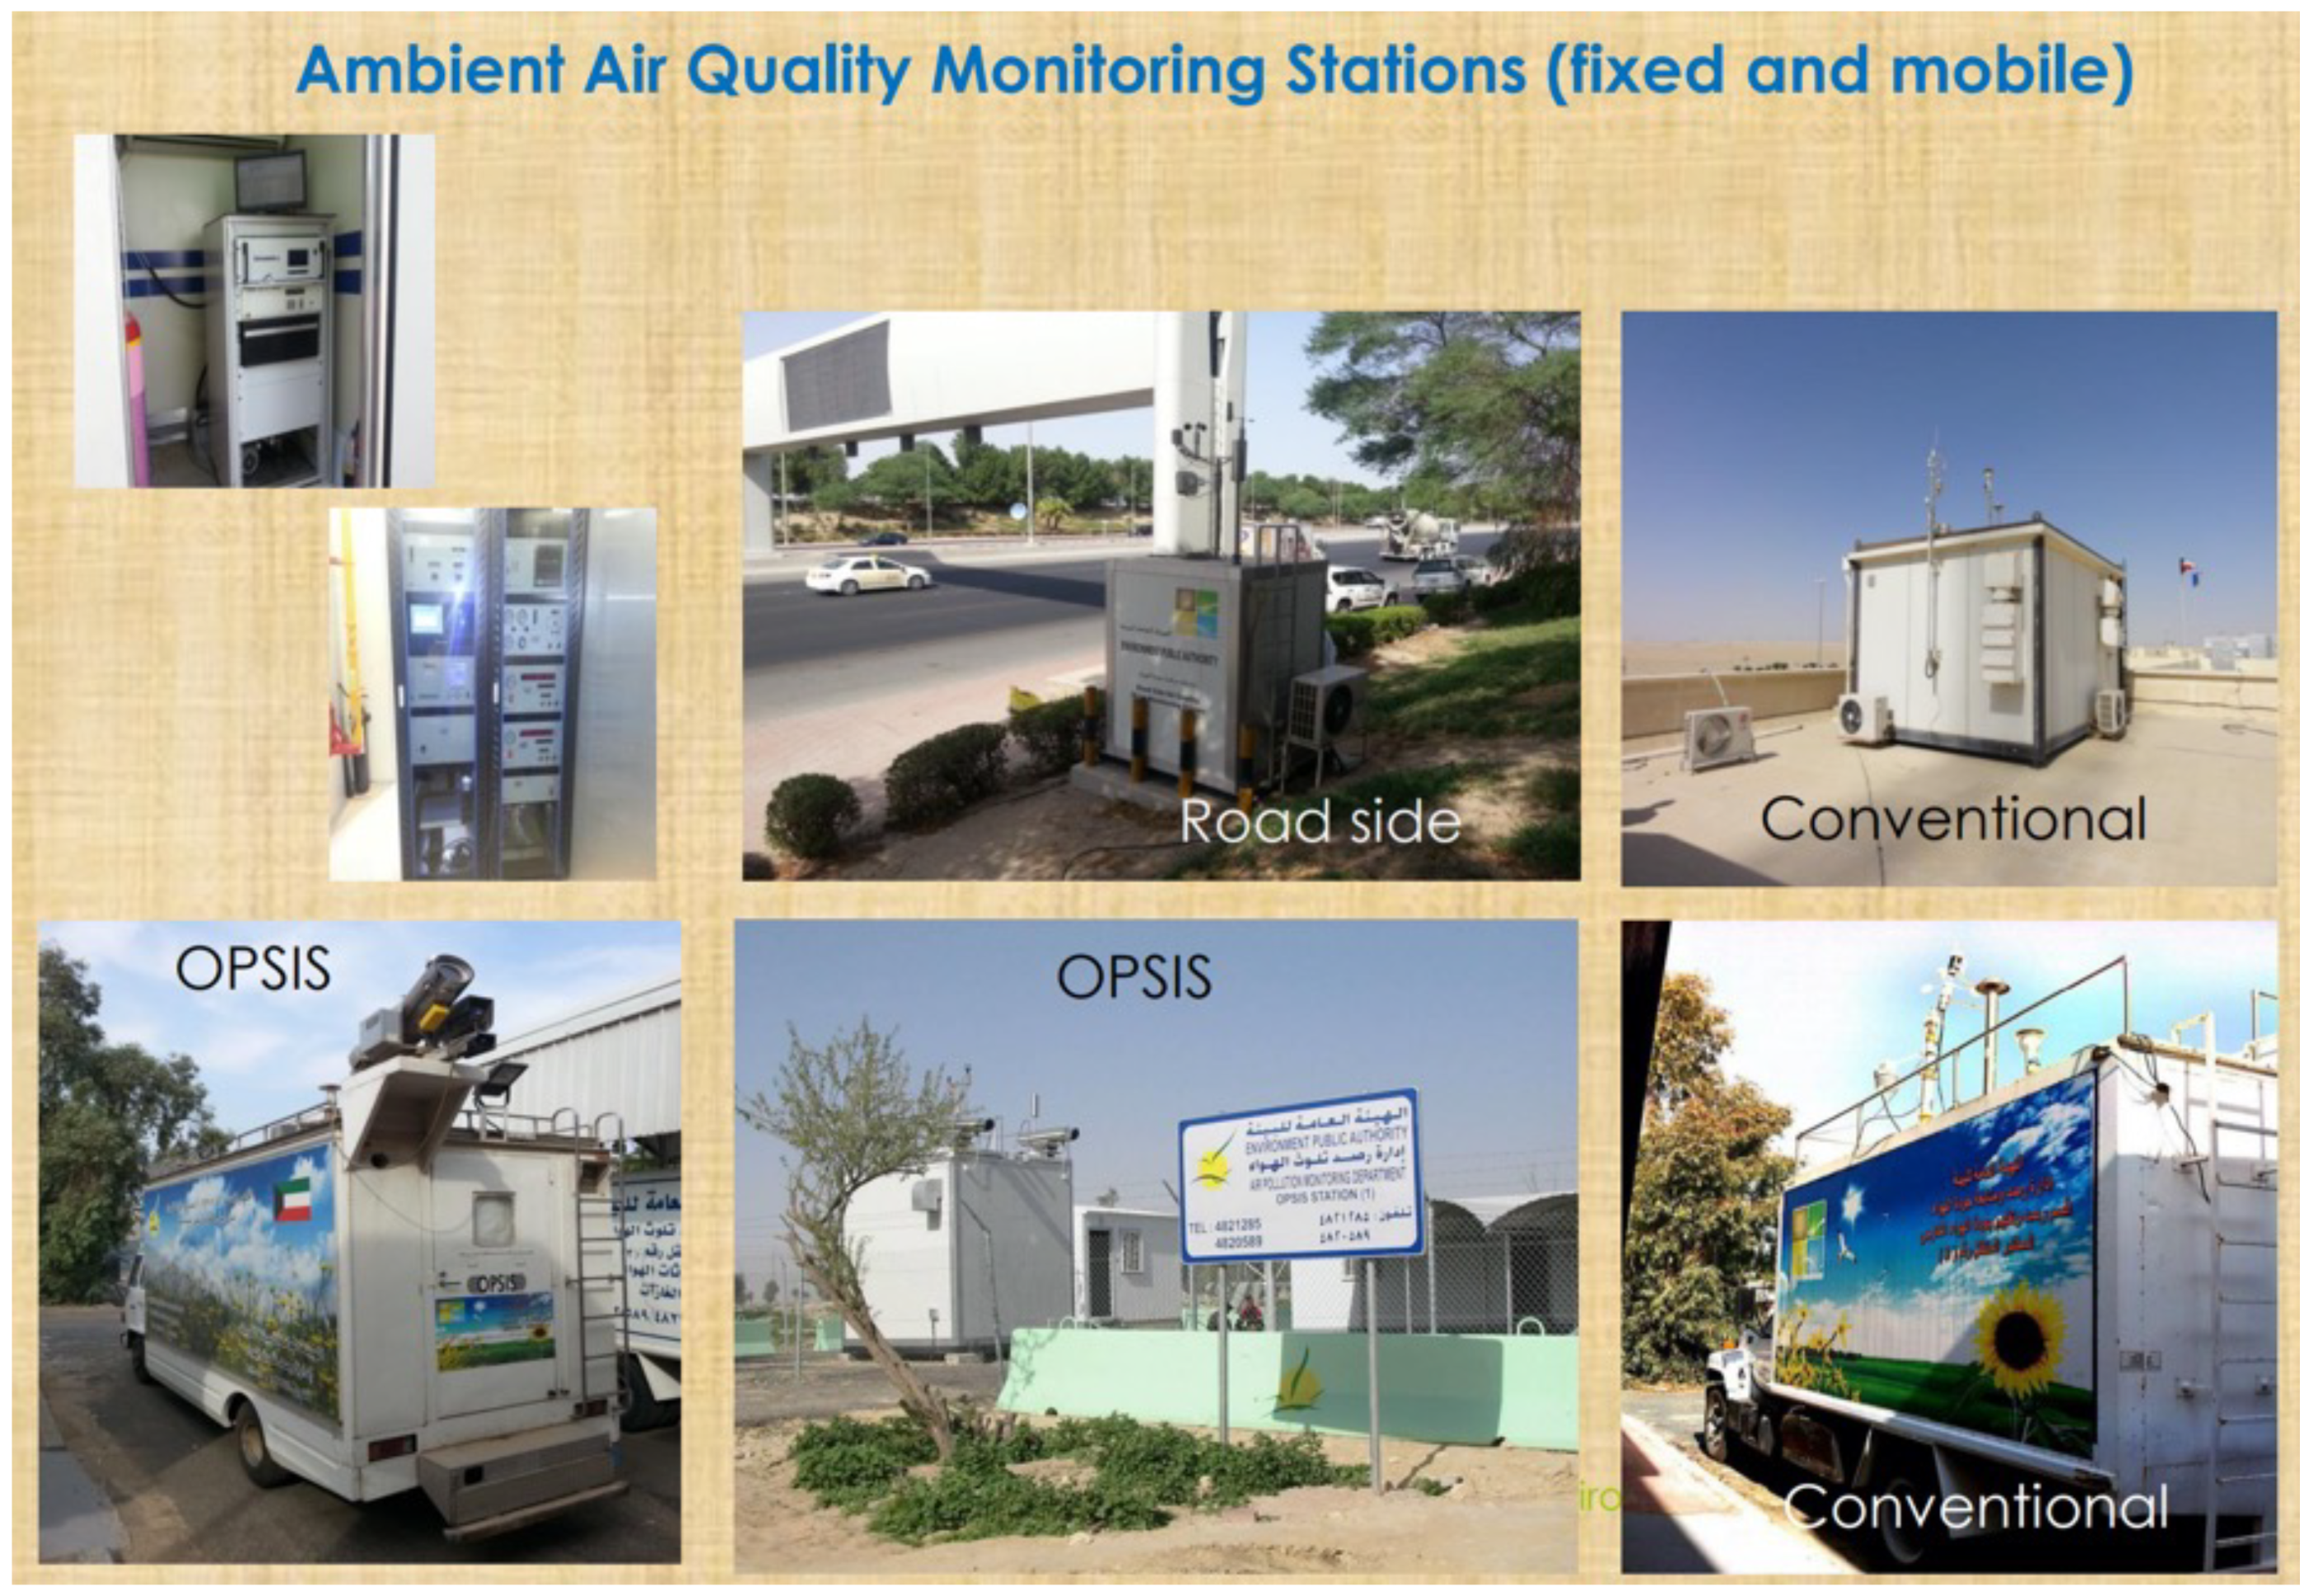
K-EPA uses 15 fixed stations and 3 mobile units (Figure 2). According to K-EPA method, environmental data acquisition (ENVIDAS-ENVISTA) data transfer (every 5 min) is saved in Environmental Monitoring Information System of Kuwait (eMISK). The climatological measurements were collected at the Kuwait International Airport by the U.S. Air Force as described in [21].
2.3. Statistical Analysis
Descriptive analysis was employed in this study to obtain an overview of the studied variables in the form of the mean, standard deviation (S.D.), percentiles and maximum and minimum values. This represented the preliminary step to statistically analyze the different datasets. After the above descriptive analysis, correlation analysis was carried out to investigate the association among the various air pollutants and with the considered meteorological variables. In addition to correlation analysis, graphical analysis (time series, polar and box plots) was conducted to reveal the effect of meteorology and investigate the association among the addressed pollutants. Time series data are useful to extract meaningful statistics and other characteristics over time.
3. Results
Table 1 summarizes the results of the descriptive statistics of the individual pollutants (, , , , , , , and ) over the six-year study period (2012–2017), including the average, S.D., percentiles, and maximum and minimum values. The results indicated that the average concentrations of air pollutants , , and during the 2012–2017 study period were , , and , respectively, with corresponding maximum values of 0.03, 0.42, 1.03 and 1.21, respectively. Furthermore, in the Kuwait environment, the average concentrations of air pollutants , and were , and , respectively, with corresponding maximum values of 68.98, 75.22 and 59.42, respectively. The average concentrations recorded for air pollutants and were and , respectively, with corresponding maximum values of 0.37 and 0.05, respectively.
Table 2 summarizes the comparison results between the industrial and residential stations corresponding to the studied pollutants. Independent sample t-test was conducted to compare the mean differences between industrial and residential stations in term of pollutants concentration. The daily mean difference among all air pollutants was significant, i.e., in terms of , , , , , , and , which also applied to weather parameter humidity. The analysis indicated high concentrations of , , , and in the residential areas, whereas the daily and concentrations were high in the industrial areas. The difference in daily concentration between air pollutants and was statistically insignificant. The recorded daily average , , , and concentrations in the residential areas were , , , and , respectively, whereas the and concentrations in the industrial areas reached and , respectively.
The study results demonstrated that the overall daily average and concentrations were lower than the corresponding K-EPA standard values in both the industrial and residential areas. Furthermore, the daily concentration exceeded the K-EPA threshold value in the residential areas, while the daily concentration exceeded the K-EPA threshold value in both the industrial and residential areas.
Table 3 presents the descriptive statistics of the meteorological parameters (the wind speed, temperature and relative humidity). The results revealed that the average value of the wind speed, temperature and relative humidity during the 2012–2017 period was , and , respectively.
Appendix A provides the daily average concentration of the studied pollutants in the industrial areas. The comparison results were significant and indicated a significant difference among the air pollutants in the considered industrial areas. The daily concentrations of , and were lower than the K-EPA standard values defined for industrial areas except for the SUK site, where the daily concentration matched the K-EPA standard value of . The daily concentration of at all the sites exceeded the corresponding threshold value defined by the K-EPA. Additionally, the results demonstrated that the daily average humidity and wind speed were high at the SUB site, whereas the daily temperature was high at the SUK site.
Appendix B lists the daily average concentration of the studied pollutants at the residential stations. The comparison results were significant and indicated a significant difference among the air pollutants in the considered residential areas. The daily concentrations of , and at all the sites exceeded the corresponding threshold values defined by the K-EPA for residential areas except for the JAH site, where the daily concentration of was lower than the standard value. Moreover, corresponding to the air pollutant , the average daily concentration was lower than the standard value in all the residential areas, while the standard value was nearly matched at only the FAH site. The results also demonstrated that the daily average humidity was high at the RUM site, whereas the daily temperature and wind speed were high at the SAA and FAH stations, respectively.
Values of the Pearson correlation coefficient are listed in Table 4, indicating the variation in each pollutant to that in the other air pollutants. If a given pollutant attains a strong correlation with other pollutants, it may thus be deduced that these pollutants most likely originate from the same emission source, while a low correlation coefficient value suggests different emission sources. The analysis results revealed a significantly high correlation between and (), followed by that between and (), suggesting a notable dependence. Moreover, the determined high correlation coefficient value indicated a high possibility of the same emission sources for , and .
The correlation among the remaining air pollutants was not strong, indicating a high possibility of different emission sources. However, the analysis results revealed a relatively high correlation between and , since the presence of in the air is a result of the No oxidation reaction in the surrounding air (), followed by that between ozone () and temperature (). Ozone production accelerates at high temperatures in summer. Short-term exposure to zone has been linked to adverse health effects [25].
The obtained values of the correlation coefficients were also significant for all the air pollutants except for the association between , and and and that between and , which were statistically insignificant at . We can see from Table 4 that most of the pollutants resulted negative correlation with atmospheric temperature and relative humidity; however, they showed variable response to seasonal variation of meteorological parameters and this results agreed with [26].
The analysis results indicated that the average daily concentration of pollutant was below the K-EPA daily standard value of for industrial areas (0.065 ppm), but it exceeded the allowable range defined for residential areas (0.030 ppm). The analysis also indicated that the daily concentration of air pollutant matched the K-EPA standard level of (0.030 ppm), whereas in regard to , it exceeded the threshold value (0.09 ). Additionally, the results demonstrated that the average daily concentration of this pollutant was below the K-EPA daily standard value (0.08 ). and were characterized by the highest measurements, while the and measurements were the lowest.
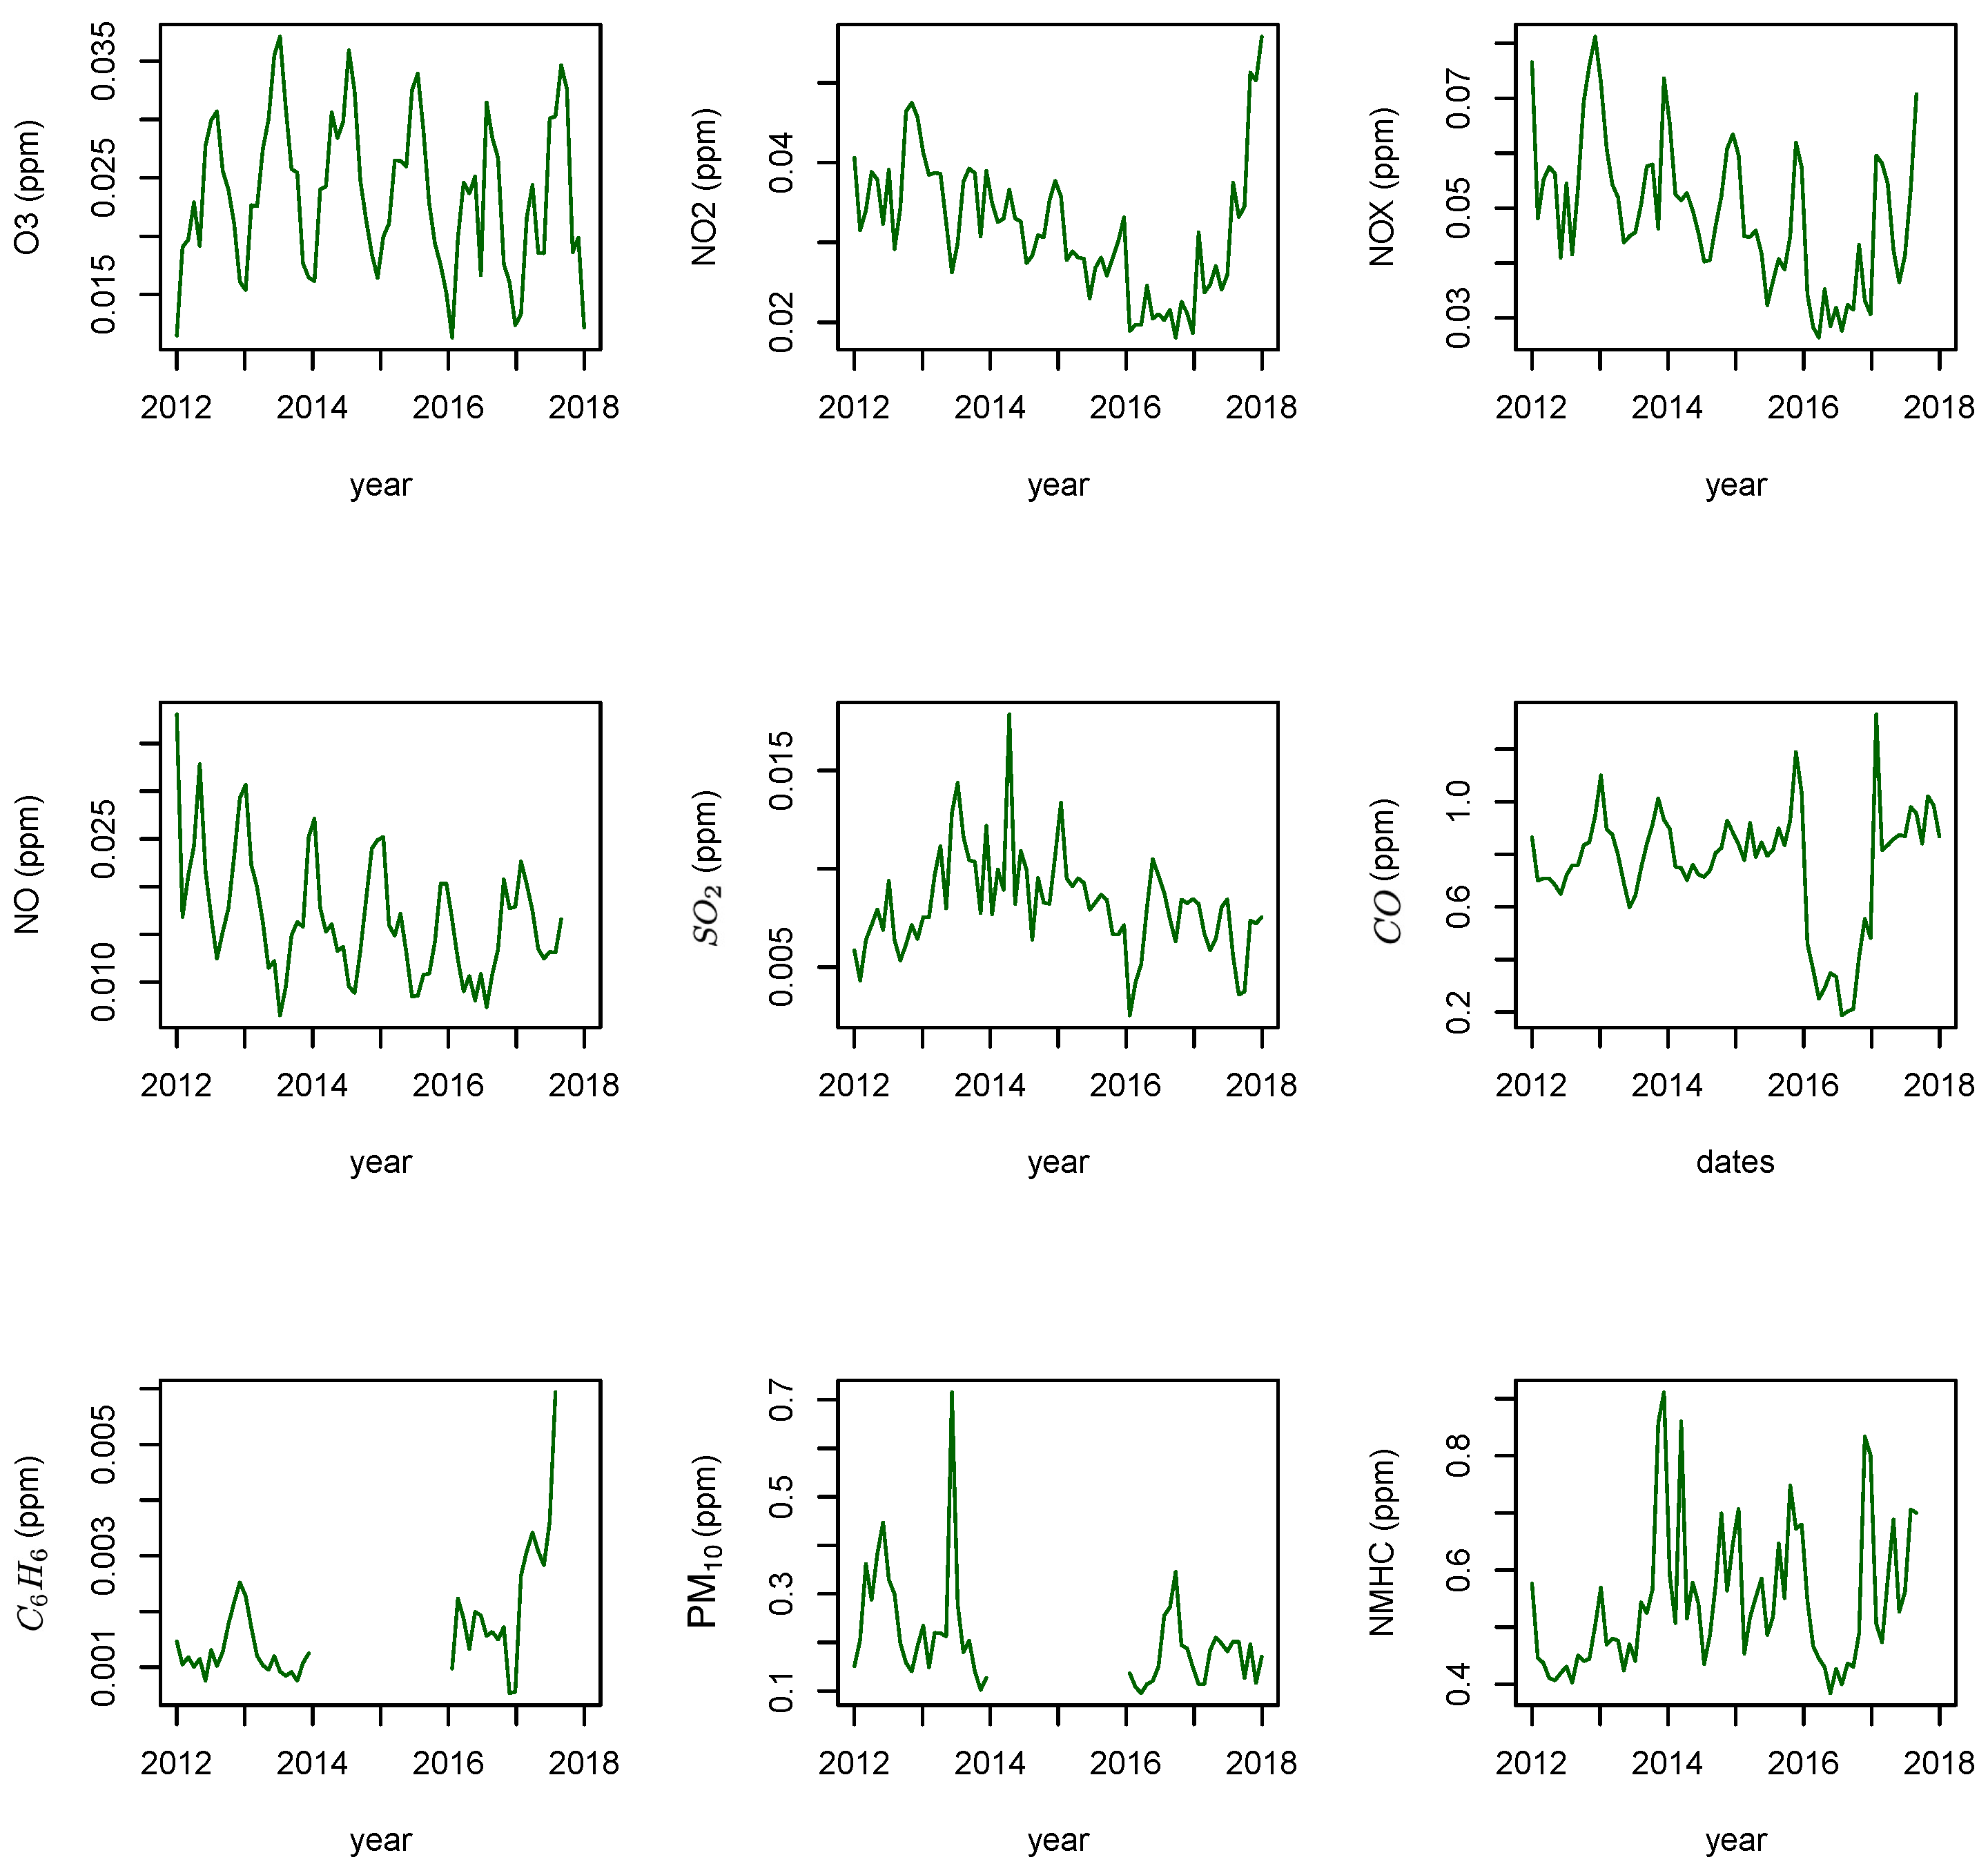
Figure 3 shows the trend of the air pollutant components during the period from 2012–2017. The observed trend demonstrated that the concentrations of pollutants , , , and were the lowest from 2016–2017, except pollutant , which exhibited an increasing trend before the beginning of 2017. Furthermore, it was observed that air pollutants and exhibited a decreasing trend for the period from 2013–2016 and then an increasing trend in 2017. It was also found that the concentration reached its highest level at a certain point during the period from 2014–2015. The analysis trend did not reveal a consistent pattern for all the pollutants. Figure 3 shows that the , and concentrations were lower than ppm, ppm and ppm, respectively. and did not reveal any trend during the period from 2014–2016 because of missing data values. It should be noted that due to the missing data and the importance of , it is preferable to replace with .
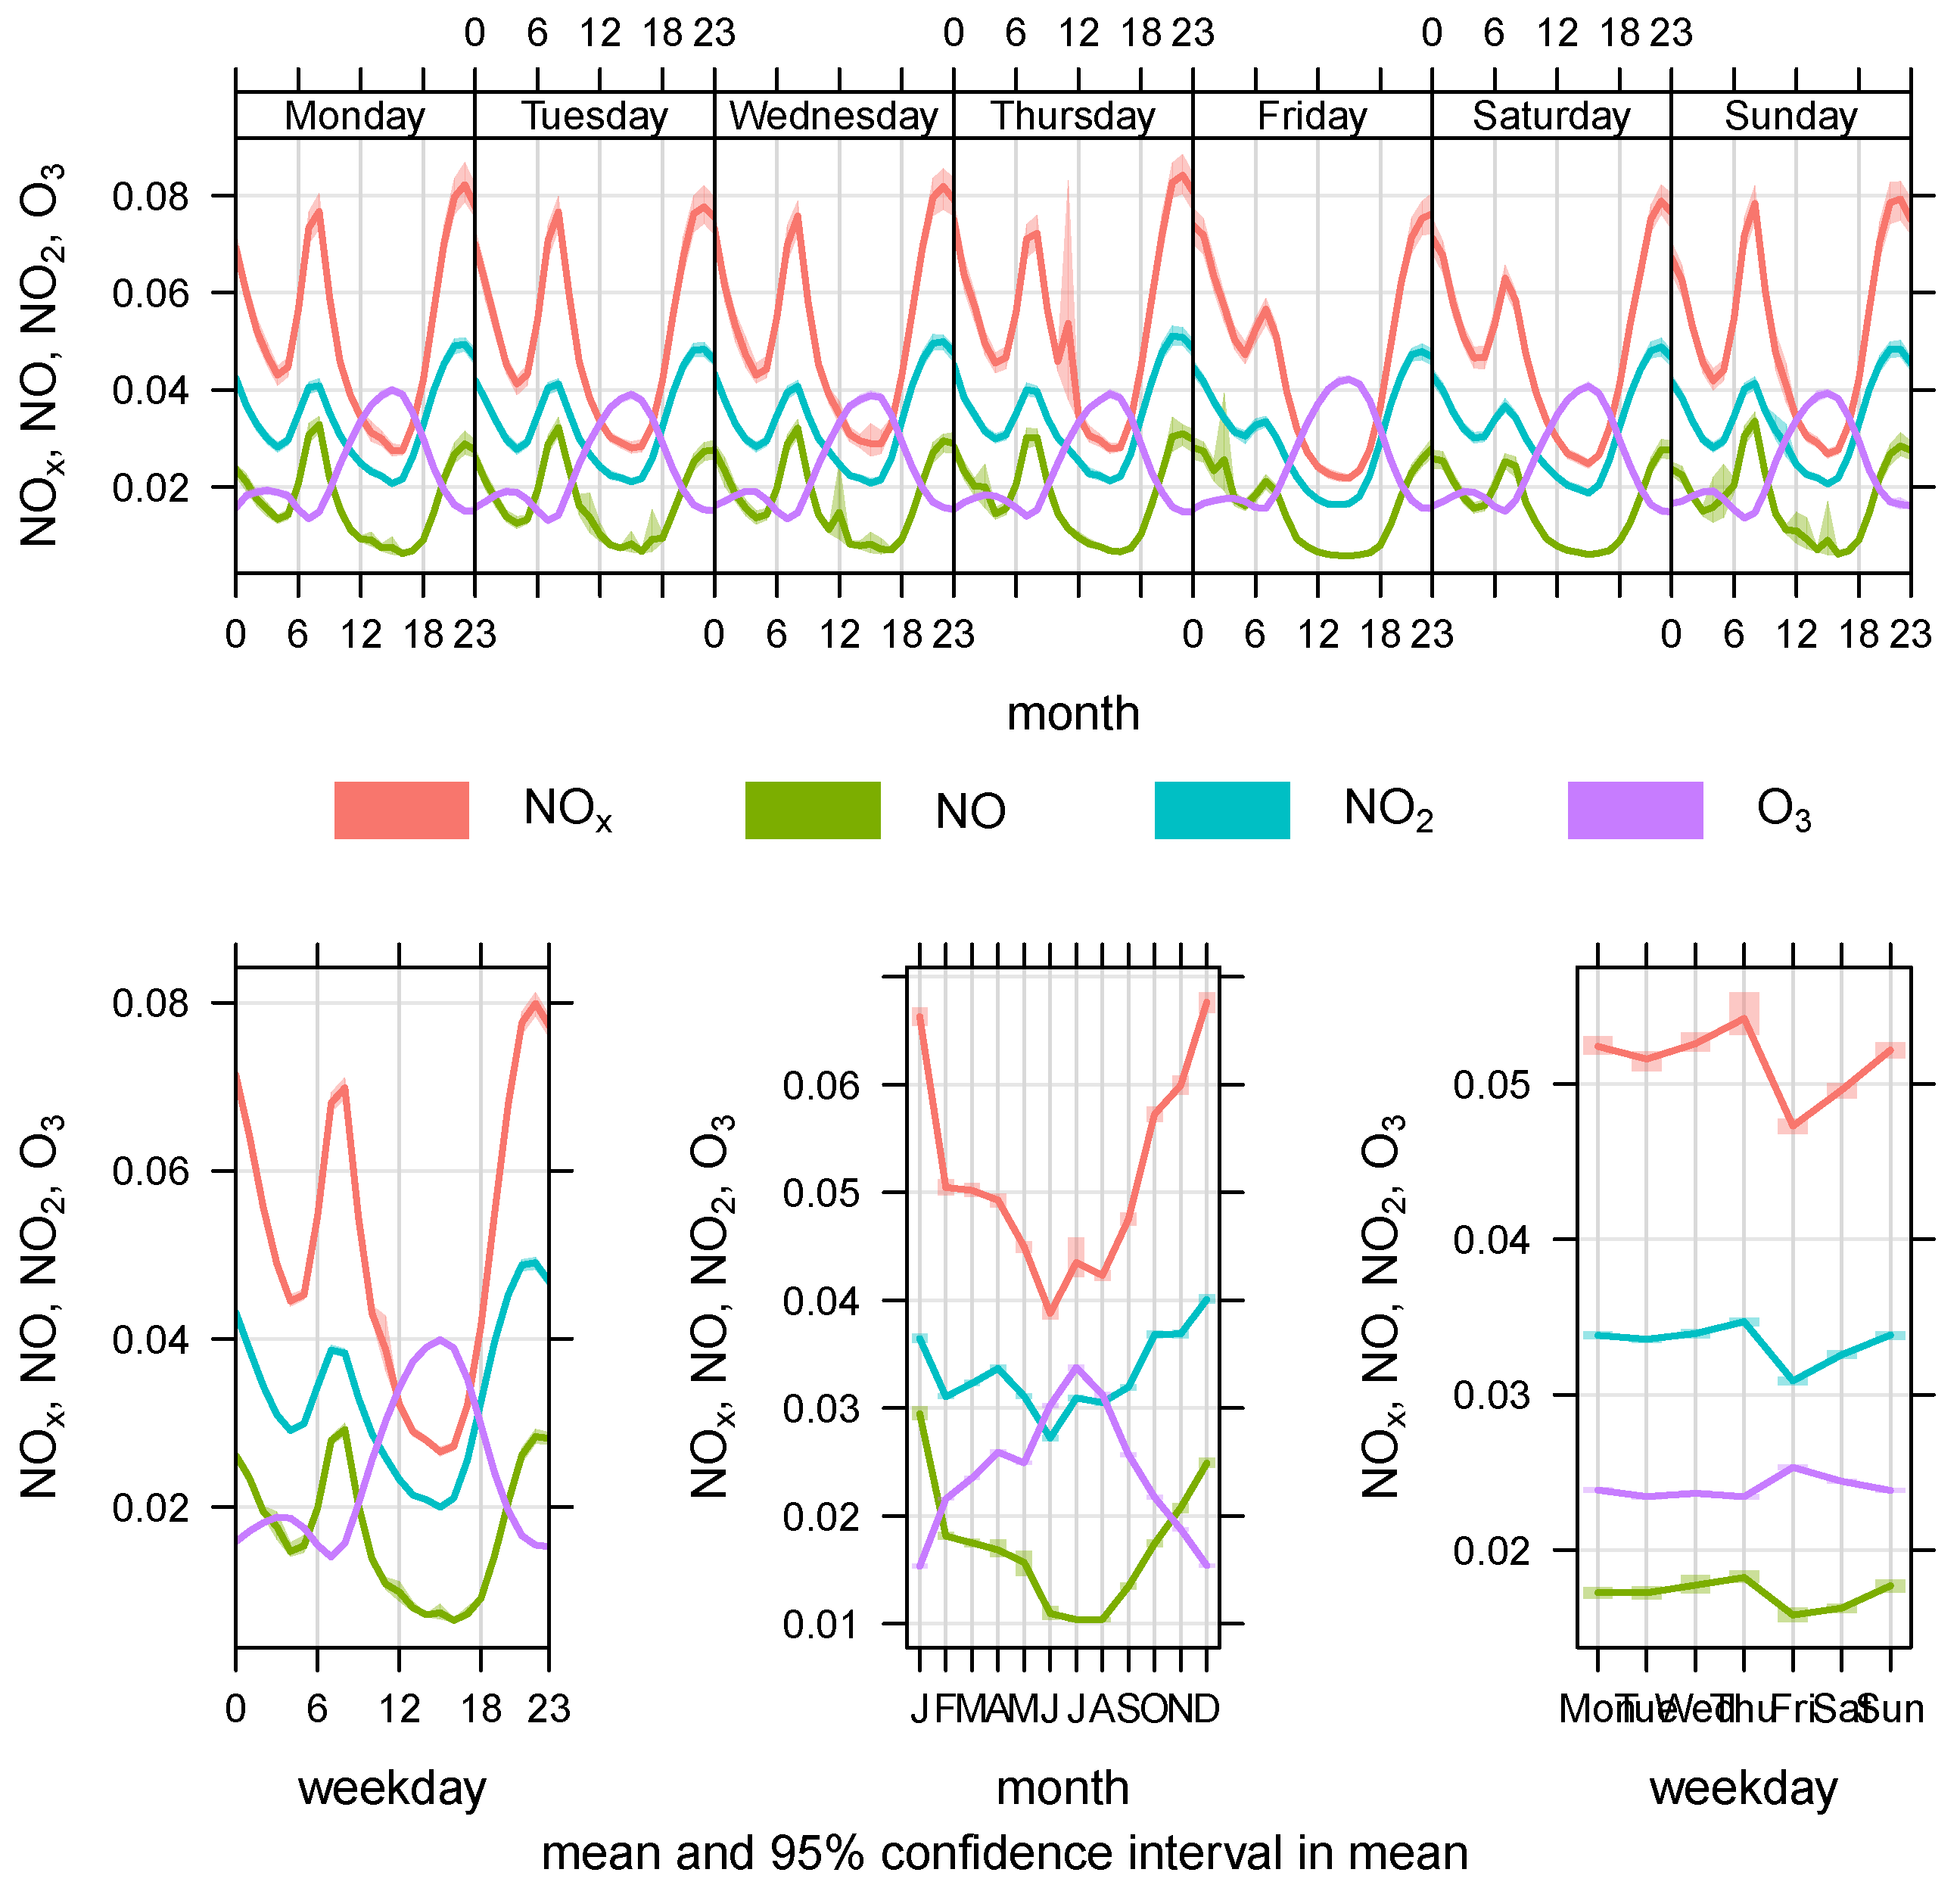
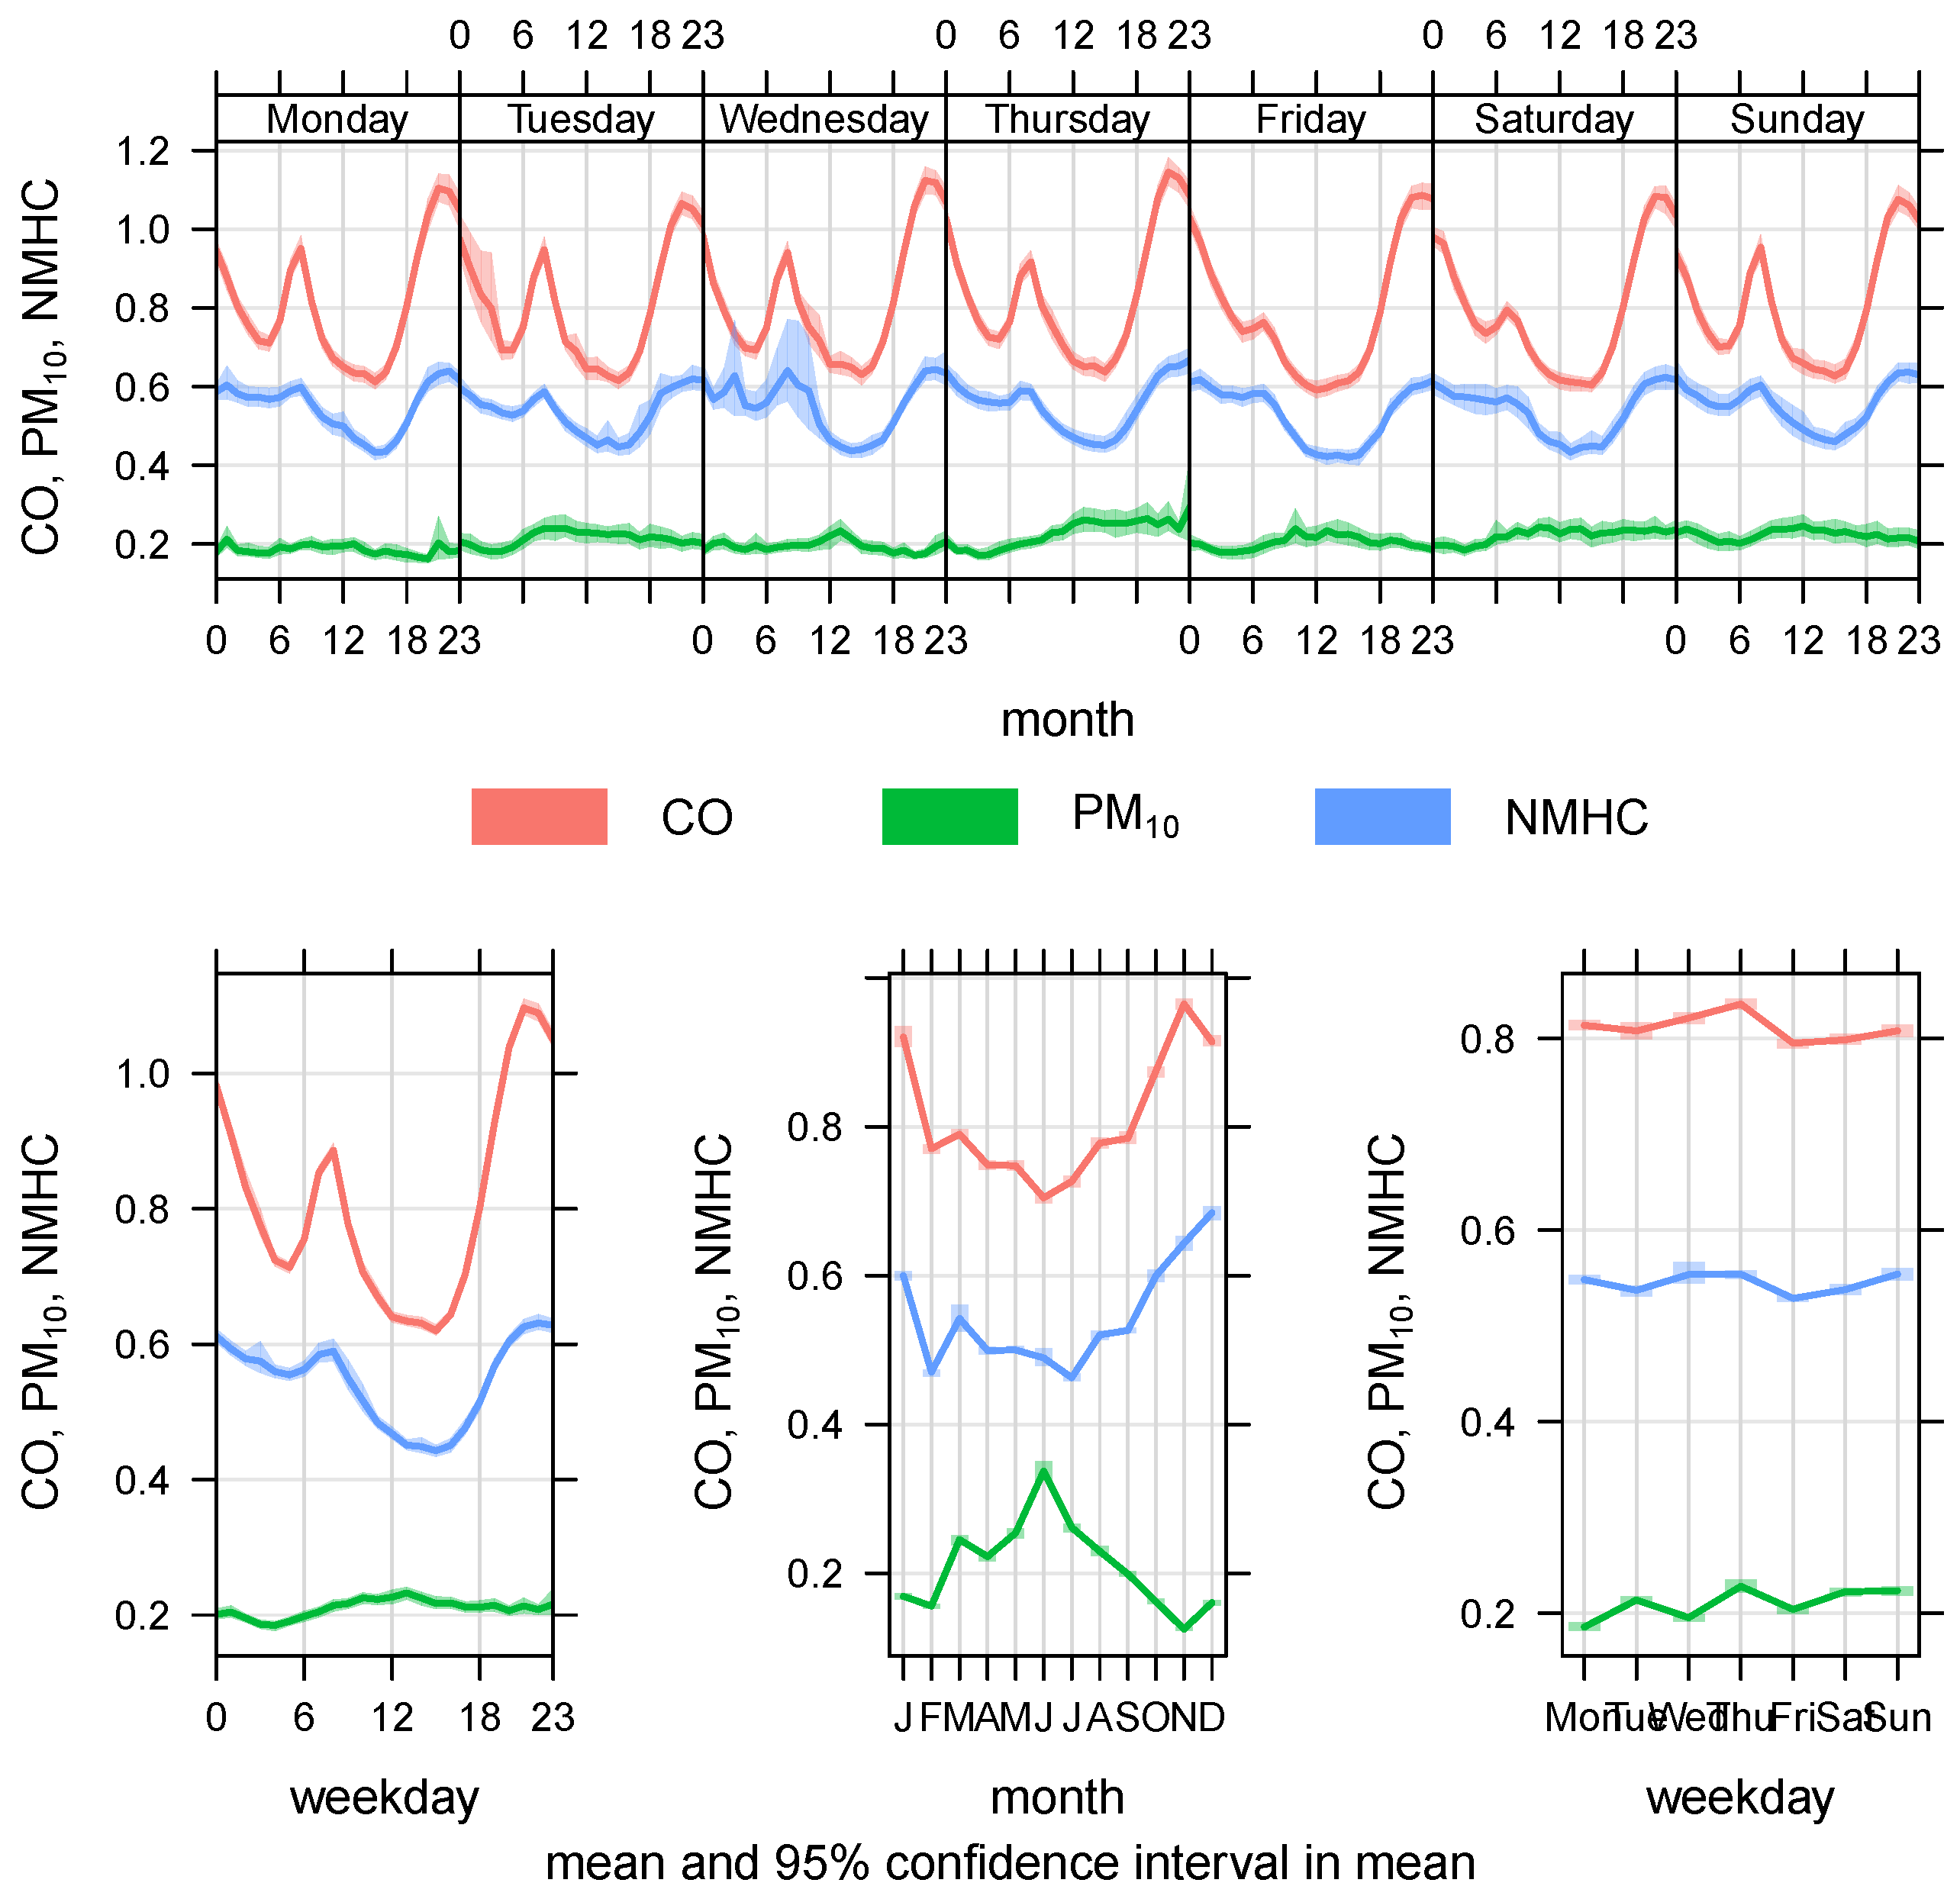
The daily, hourly, weekly and monthly mean variations in the pollutant concentration are shown in Figure 4, Figure 5 and Figure 6. In regard to , and , the two highest mean values were recorded in the months of January and December, and the lowest and concentrations were recorded in June, whereas the concentration was the lowest during the period from June to July. The concentration exhibited the reverse pattern to that of , and . The concentration peaked in July, and it gradually decreased thereafter until the end of the year, when the lowest concentration was recorded in January and December.
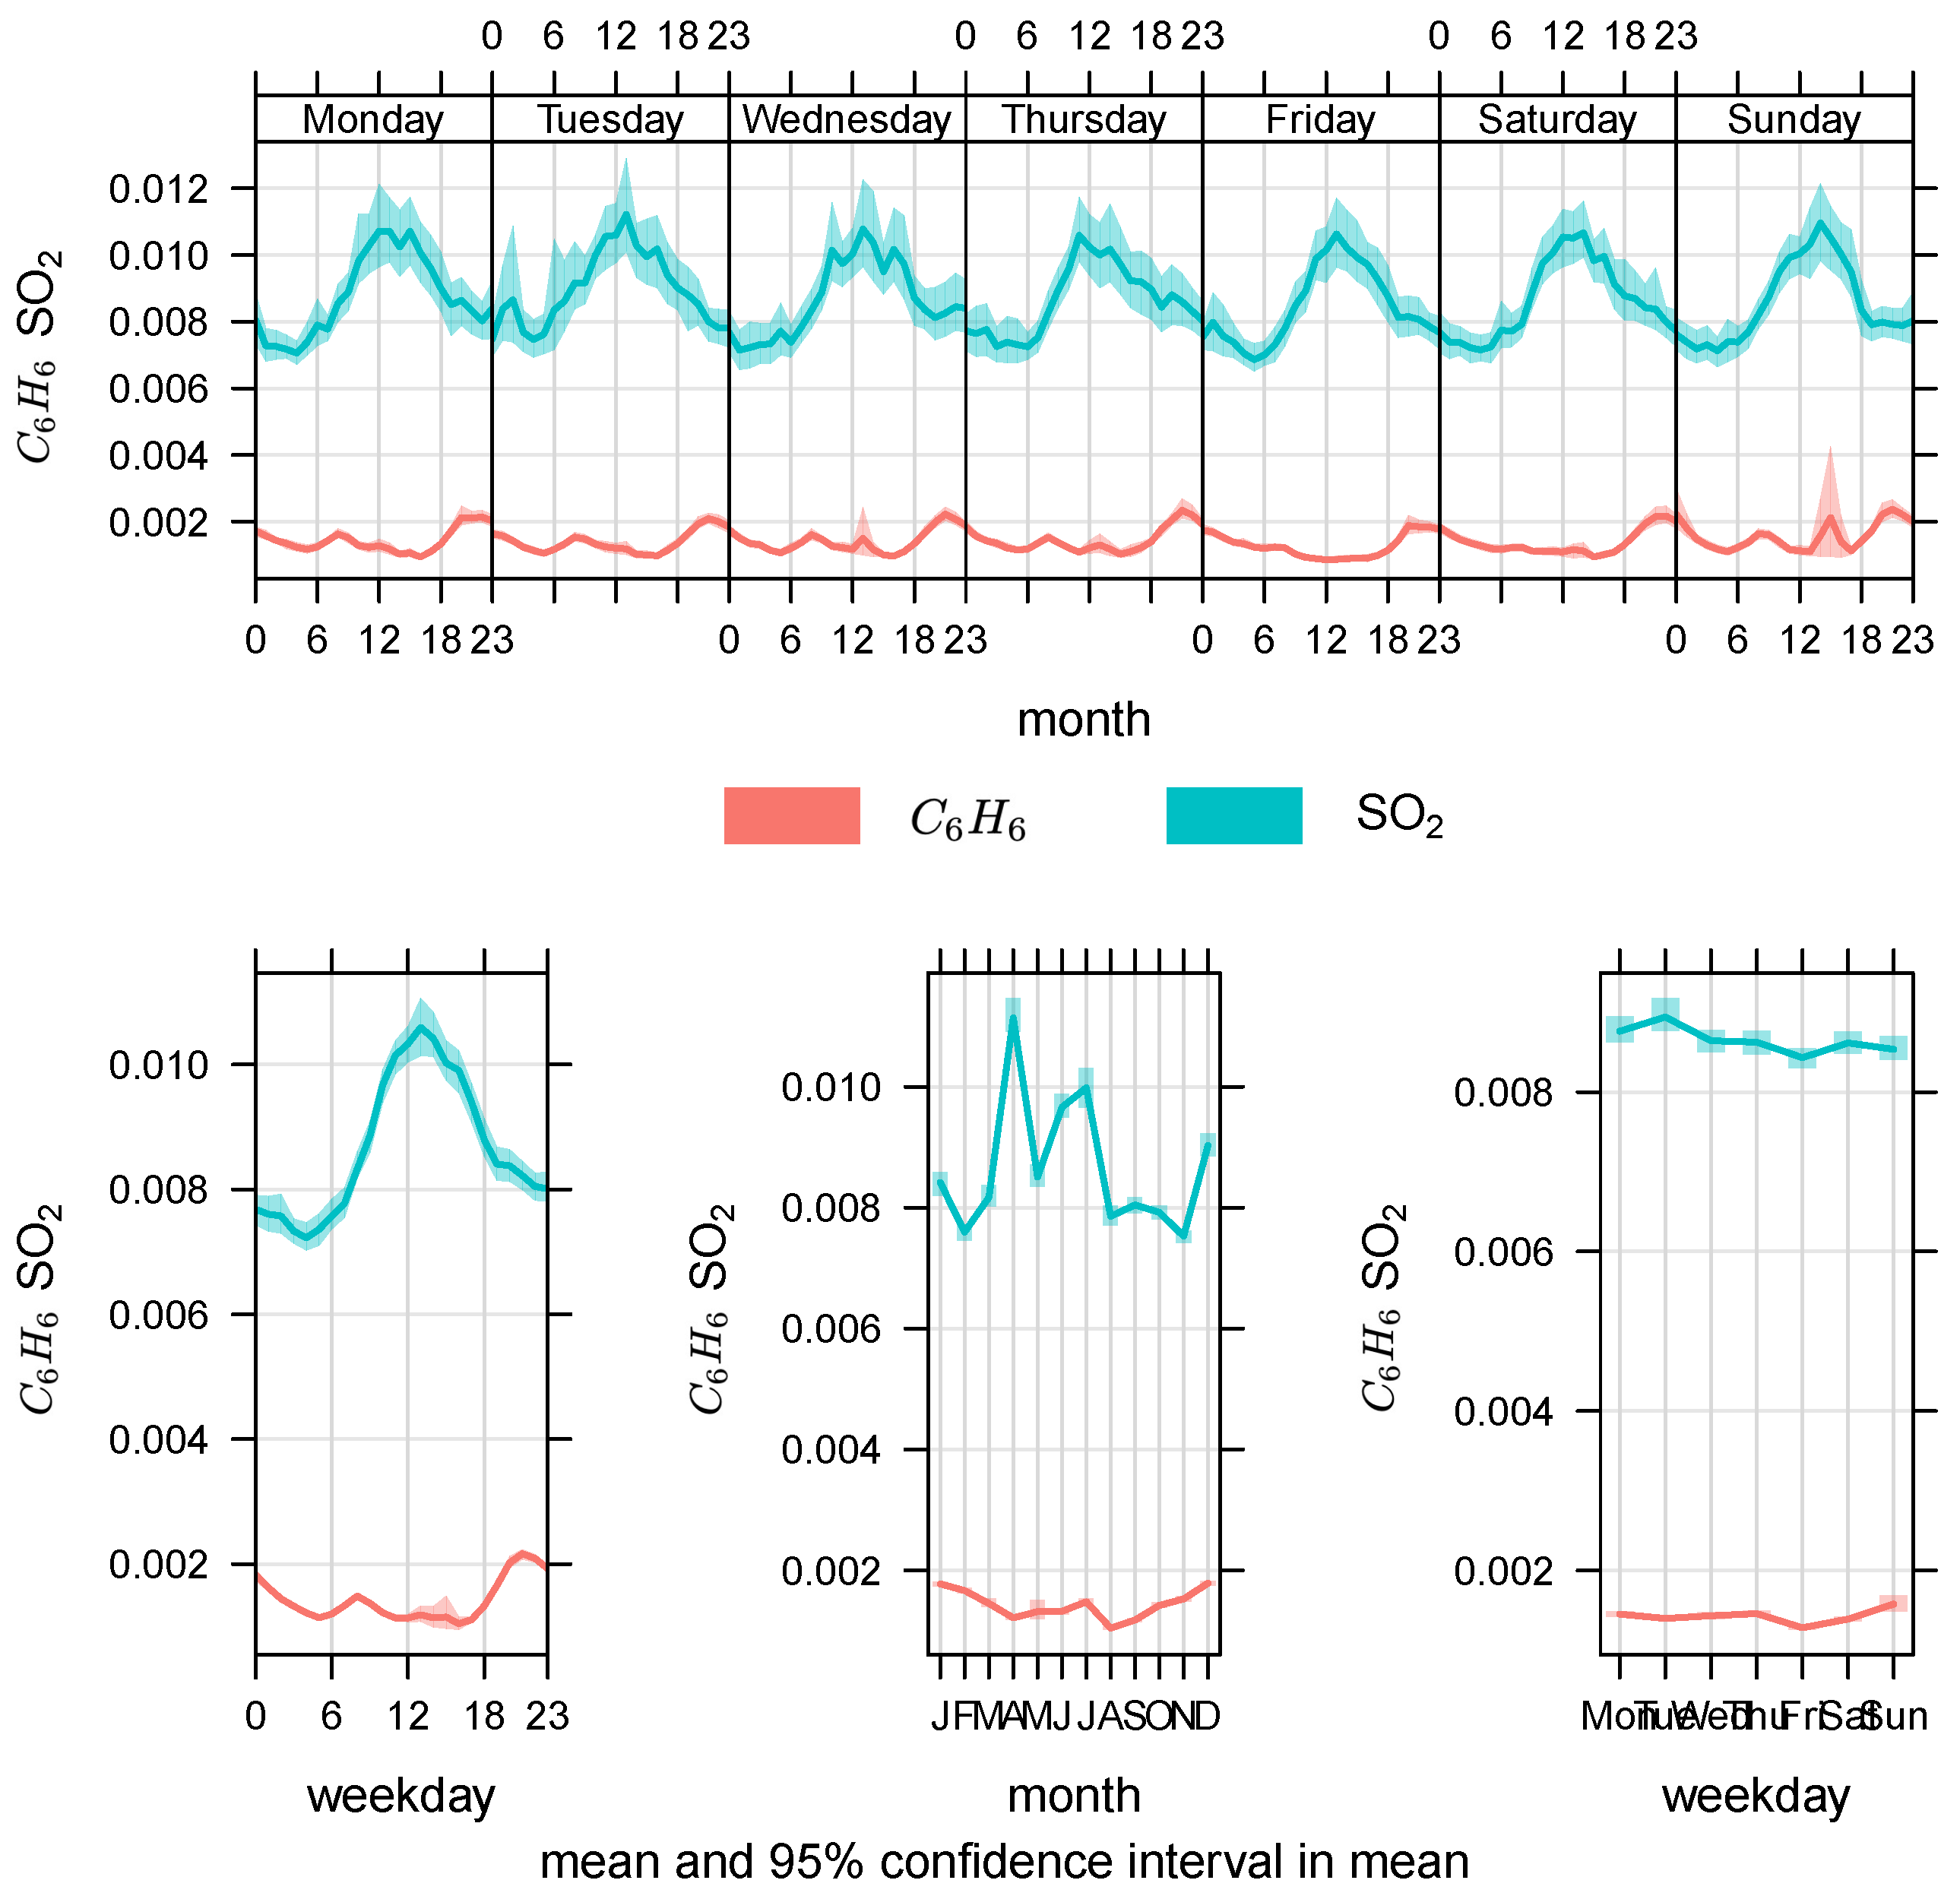
Figure 5 shows that the concentration of pollutant was the highest, followed by and . The figure shows that the and concentrations were high in the winter season and low in the summer season, whereas exhibited the opposite trend, where the concentration was high during the summer period and low during the winter period.
Generally, regarding , a high mean concentration occurred in early summer (June and August), with low mean values observed in winter (November–February). In the present study, low nitrogen oxide emission levels (, and ) were observed in the winter. This may occur because of the very mild temperatures in Kuwait during the winter, which led to a very low energy demand for heating purposes and resulted in lower nitrogen oxide emission rates. However, during the summer season, a higher energy consumption was observed because of the intense and continuous use of air conditioners. A large amount of energy is required to operate this equipment, provided by the combustion of large amounts of fuel, resulting in an increase in the nitrogen oxide emission rates (, and ).
Figure 5 shows that the concentration of pollutant was the highest, followed by and . The figure reveals that the and concentrations were high in the winter season and low in the summer season, whereas exhibited the reverse trend. In regard to , the concentration was high during the summer period and low during the winter period. Figure 6 shows that the pollution level was the highest in the summer months (April and June–July), while it was the lowest in the months of February and November. The average concentration of pollutant was low throughout the entire study period (2012–2017).
Description of Exposure Data
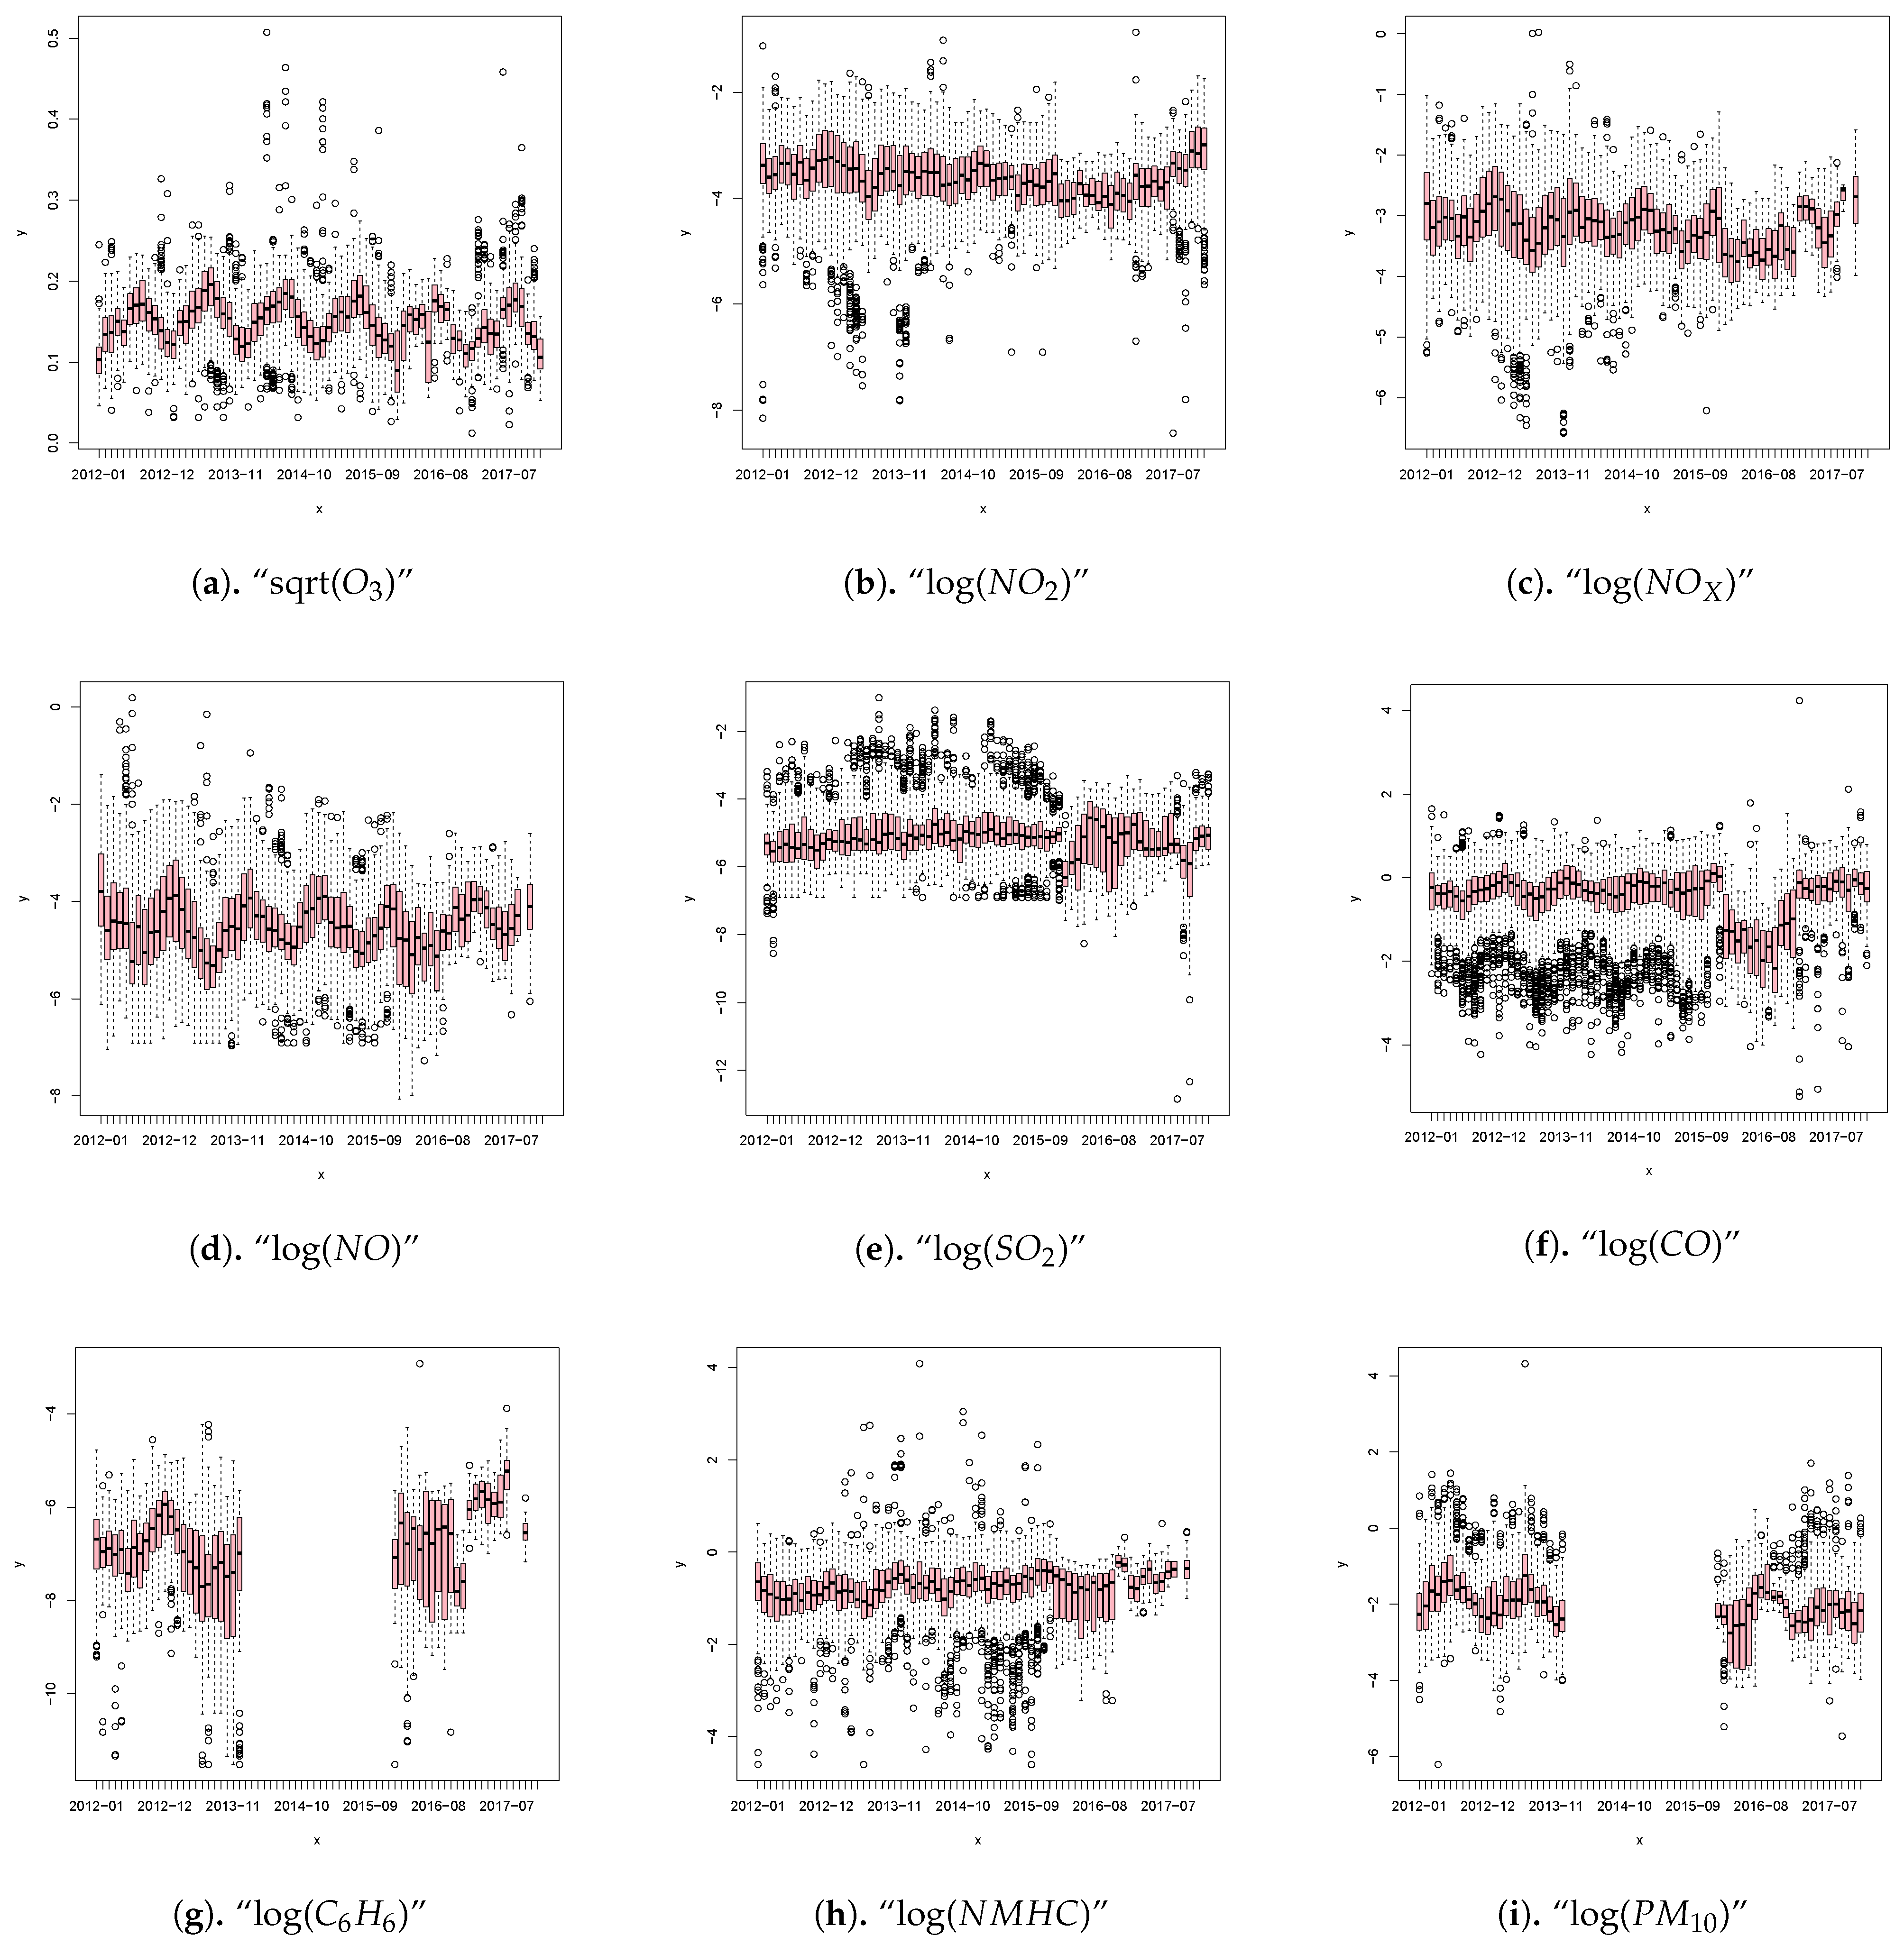
Box plots of the monthly pollutant concentration after suitable transformation from 2012 to 2017 are shown in Figure 7. Box plots constitute a method to graphically depict data based on a five-number summary (minimum, first quartile (Q1), median, third quartile (Q3), and maximum).
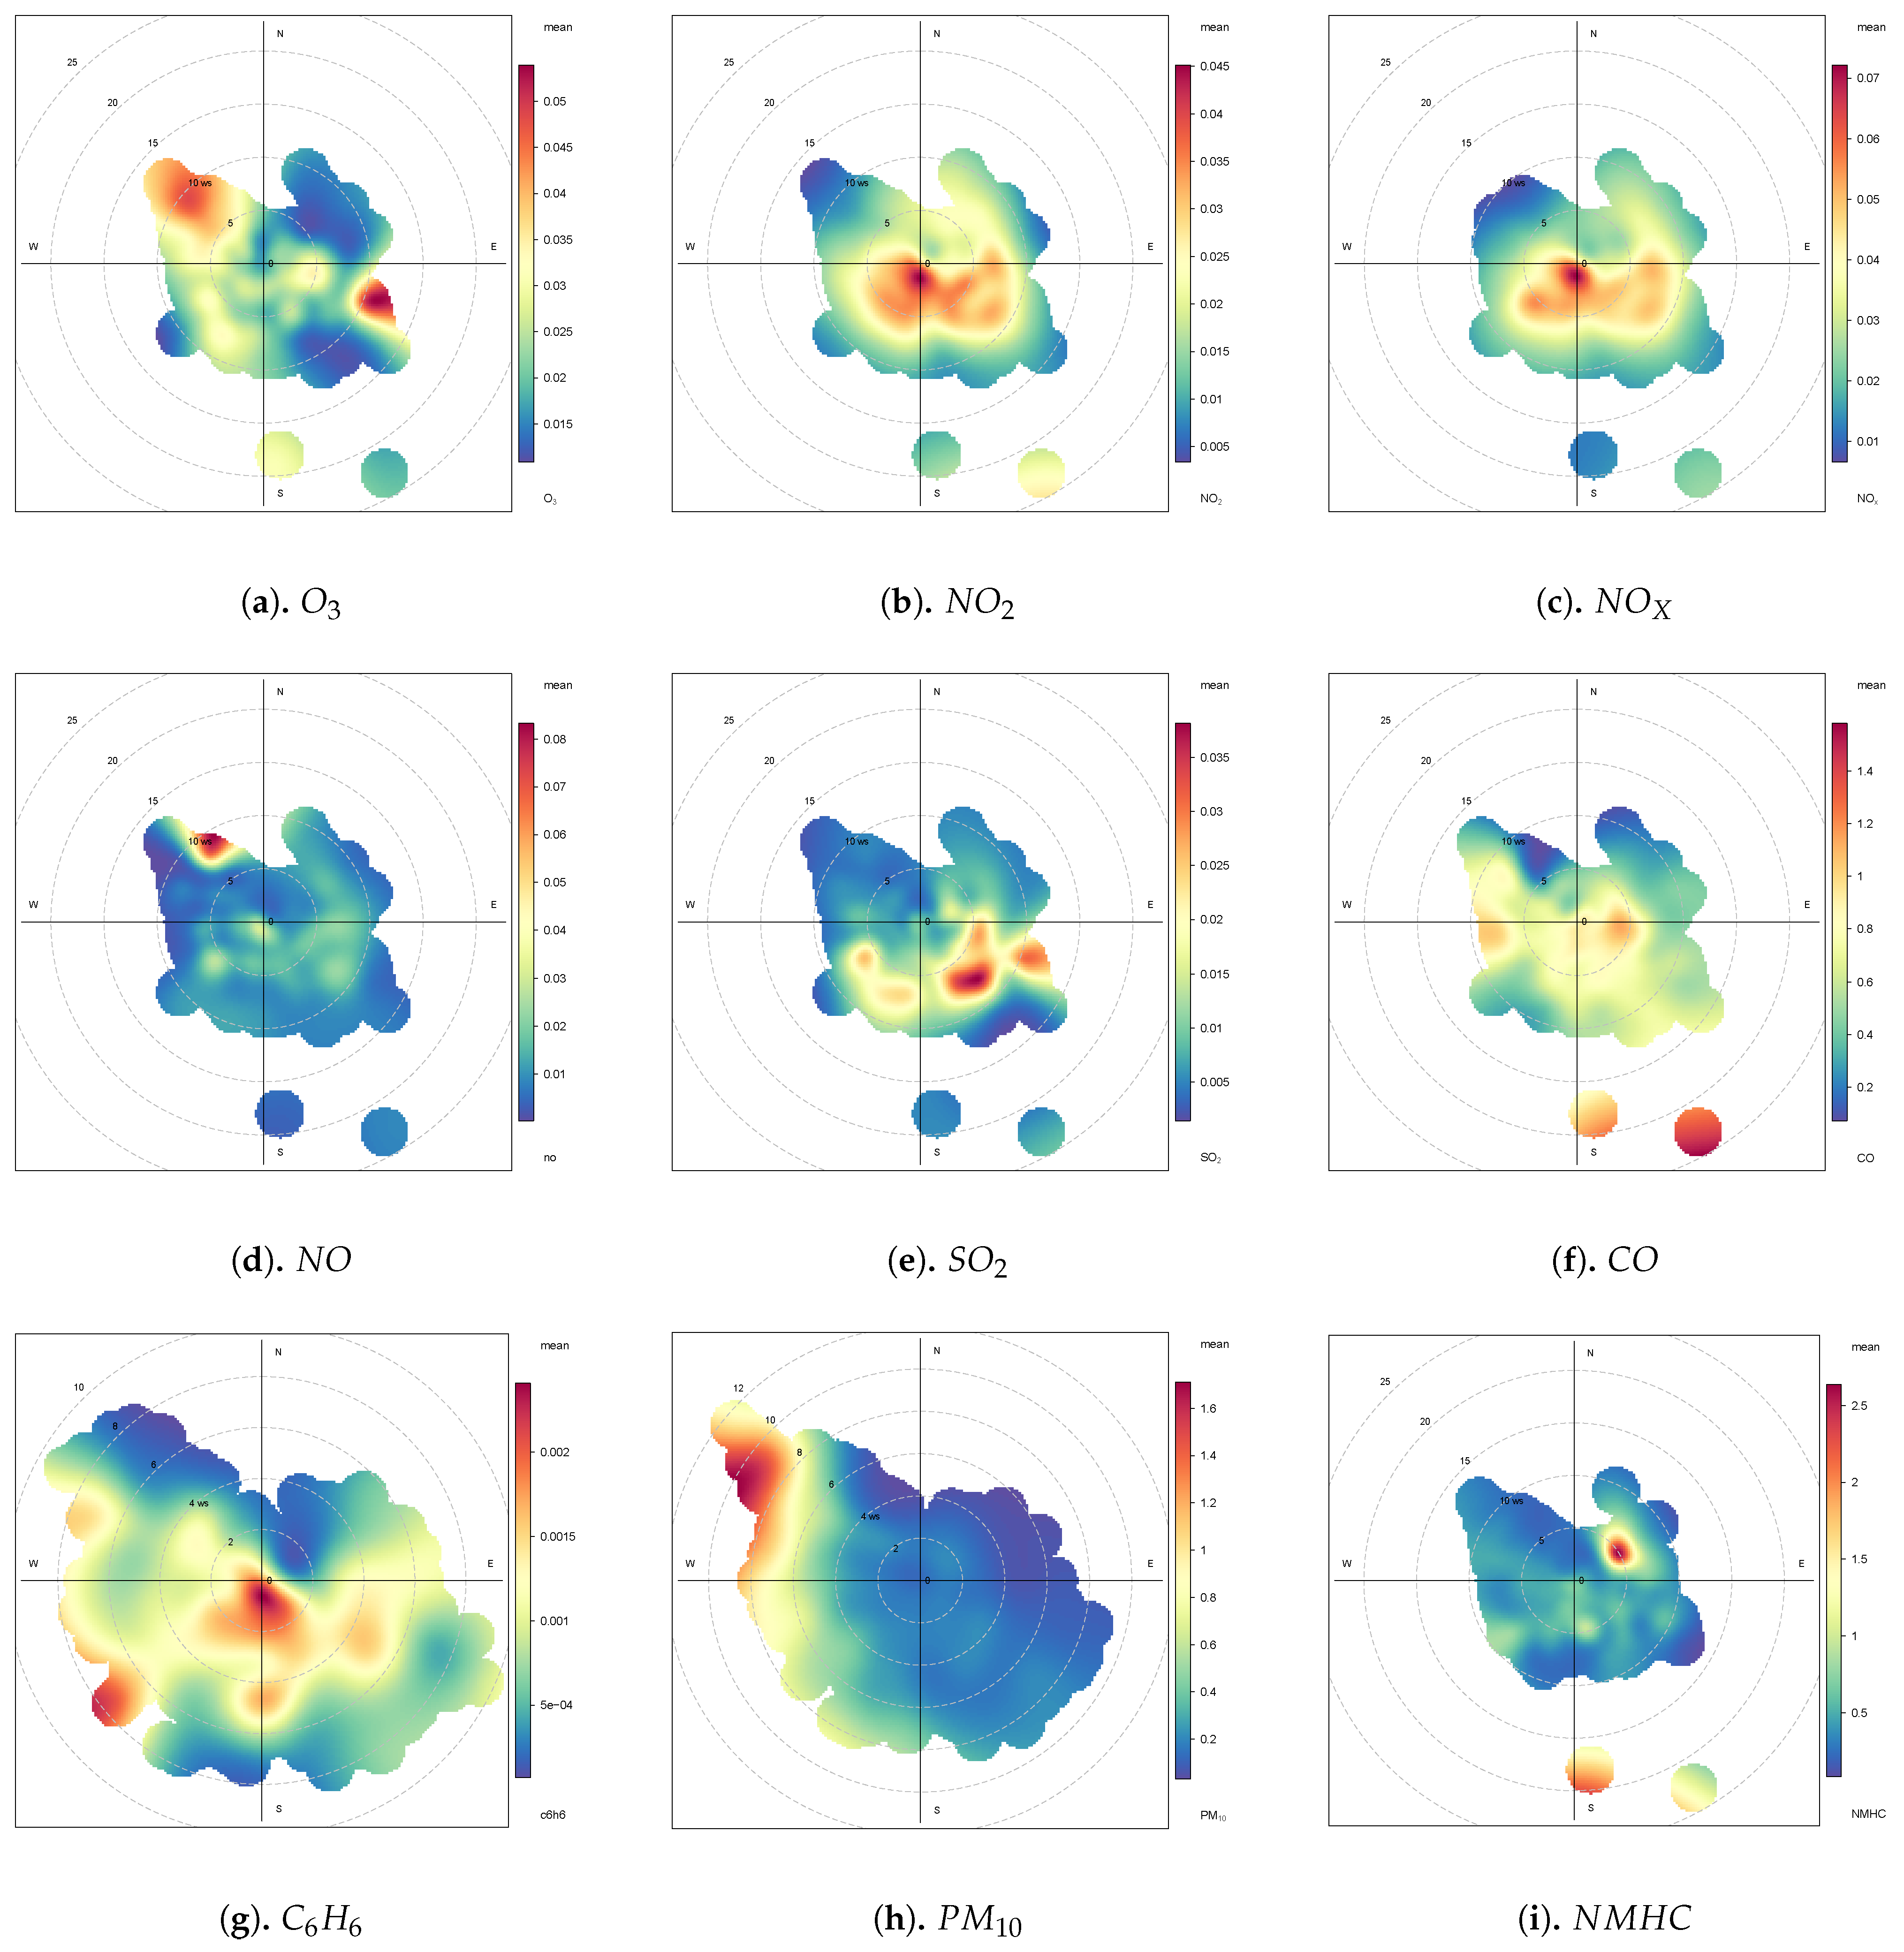
Figure 8 shows the air pollutant concentration in the form of polar coordinates throughout the study period from 2012–2017. A polar plot shows a graphical analysis of a given database rather than a quantitative analysis. It is constructed based on the average pollutant concentration as a function of the wind speed. Figure 8 shows that the concentrations of pollutants and exhibited almost the same pattern. The concentration of these pollutants was higher at a wind speed of 5 m/s from west to east and the lowest at the northwest site. The polar plots for , and with slight variations revealed low pollutant concentrations at wind speeds ranging from 5–10 m/s. However, high concentrations were also observed at certain points along the southeast direction. The polar plot for demonstrated a uniform contribution along all wind directions, except for a slightly low concentration along the east-north direction and a high concentration at a few points in time along the southeast direction at wind speeds ranging from 20–25 m/s. The high concentrations of these pollutants at low wind speeds suggested that these air pollutants may be dispersed at high wind speeds.
The State of Kuwait faces a growing risk of health-related problems due to the poor air quality originating from its various industrial and domestic activities. Dust stemming from adjacent deserts passing through areas containing industrial emission sources may carry both living (biogenic) and nonliving (chemical) constituents. Regular monitoring and careful statistical examination of all measured air pollutants could help in maintaining a clean healthy environment and resolving pollution-related problems in a timely manner. In the present study, time series statistical testing revealed low nitrogen oxide emission levels (, and ) in the winter. This may occur because of the very mild temperatures in Kuwait during the winter, which led to a very low energy demand for heating purposes and resulted in lower nitrogen oxide emission rates. However, in the summer season, a higher energy consumption was observed because of the intense and continuous use of air conditioners. A large amount of energy is required to operate air conditioners, provided by the combustion of large amounts of fuel, resulting in an increase in the nitrogen oxide emission rates (, and ). In addition, This could be due to their locations near highways and oil industries centers. Petrochemical industries and oil refineries in southern Kuwait are major sources of air pollution in the country.
4. Conclusions
On the basis of various statistical tests conducted in the present research paper regarding the measurements of eight air pollutants (, , , , , , , and ) in the State of Kuwait during the period from 2012–2017, the following conclusions can be formulated:
- -
- The daily , and concentrations exceeded the corresponding thresholds or permissible limits defined by the K-EPA in the residential areas.
- -
- The comparison results for the industrial areas indicated a significant difference among the air pollutants. The daily , and concentrations exceeded the K-EPA standard values in the SUK area, where exceeded the K-EPA threshold value at all industrial sites.
- -
- The concentrations of all pollutants in the residential areas resulted from the high emissions of industrial activities and vehicles in nearby areas and depended on meteorological conditions ( and ).
- -
- A strong interdependence occurred between ( and ), indicating the high oxidation reaction. Relatively high correlation occurred between climatology variables (Temp. and Humidity) and air pollutants such as and . Increase in ozone levels could lead to more respiratory illnesses.
- -
- A clear seasonal variation was observed, where the , and concentrations were very high in winter, while the concentration was high during the first intermonsoon season, reaching its peak in summer (July).
Author Contributions
Carried out the review of the environmental literature works with provision of the K-EPA data, in addition, analyzed the data and made all figures, graphs, and tables, A.A.-H.; provided significant details on EPA information and defining air pollutants, S.K.; developed the research methodology, analyzed the data using STATA, and finished writing the manuscript, A.A.; contributed for review and supervision, J.P. All authors have read and agreed to the published version of the manuscript.
Funding
This research received no external funding.
Data Availability Statement
The data are available from the K-EPA. We can provide the data upon request.
Acknowledgments
The authors would like to gratefully acknowledge the pollutant data provided by the Data Management Department of the K-EPA through the Environmental Monitoring Information System of Kuwait (eMISK).
Conflicts of Interest
The authors declare no conflict of interest.
Appendix A. Air Pollutants Comparison between Industrial Stations

Table A1.
Comparison between Industrial Stations.
| MUT | SUB | SUK | p-Value | N | |
|---|---|---|---|---|---|
| N = 1772 | N = 1093 | N = 1788 | |||
| (ppm) | 0.026 (0.012) | 0.019 (0.023) | 0.023 (0.011) | <0.001 | 4595 |
| (ppm) | 0.024 (0.012) | 0.018 (0.018) | 0.030 (0.012) | <0.001 | 4634 |
| (ppm) | . (.) | 0.035 (0.046) | 0.052 (0.034) | <0.001 | 2783 |
| (ppm) | 0.012 (0.008) | 0.016 (0.031) | 0.021 (0.025) | <0.001 | 4432 |
| (ppm) | 2.938 (1.814) | 3.354 (2.607) | 1.974 (0.727) | <0.001 | 4498 |
| (ppm) | 0.004 (0.002) | 0.020 (0.032) | 0.008 (0.006) | <0.001 | 4572 |
| (ppm) | 0.882 (0.345) | 0.775 (0.538) | 0.358 (0.327) | <0.001 | 4649 |
| (ppm) | . (.) | 0.001 (0.002) | 0.002 (0.002) | <0.001 | 1339 |
| () | 0.259 (0.358) | 0.128 (0.189) | 0.199 (0.194) | <0.001 | 2504 |
| (ppm) | 0.473 (0.174) | 0.602 (2.488) | 0.305 (0.204) | <0.001 | 3894 |
| Temp. | 26.985 (10.260) | 23.421 (8.806) | 30.323 (9.883) | <0.001 | 4498 |
| Hum | 29.364 (17.491) | 47.913 (25.320) | 33.030 (18.703) | <0.001 | 4476 |
Appendix B. Air Pollutants Comparison between Residential Stations
Table A2.
Comparison of the Residential Stations.
| ASA | FAH | JAH | MAN | QUR | RUM | SAA | p-Value | N | |
|---|---|---|---|---|---|---|---|---|---|
| N = 1750 | N = 1817 | N = 1818 | N = 1767 | N = 1189 | N = 1810 | N = 1726 | |||
| (ppm) | 0.022 (0.010) | 0.019 (0.009) | 0.026 (0.010) | 0.024 (0.011) | 0.030 (0.015) | 0.024 (0.011) | 0.026 (0.014) | <0.001 | 11,411 |
| (ppm) | 0.043 (0.024) | 0.051 (0.026) | 0.021 (0.010) | 0.035 (0.023) | 0.041 (0.025) | 0.031 (0.020) | 0.036 (0.023) | 0.000 | 11,430 |
| (ppm) | 0.056 (0.029) | 0.078 (0.042) | 0.034 (0.036) | . (.) | 0.060 (0.041) | 0.047 (0.034) | 0.048 (0.027) | <0.001 | 9275 |
| (ppm) | 0.013 (0.012) | 0.025 (0.020) | 0.019 (0.054) | 0.019 (0.027) | 0.019 (0.021) | 0.015 (0.018) | 0.013 (0.011) | <0.001 | 10,704 |
| (ppm) | 0.009 (0.005) | 0.016 (0.017) | 0.005 (0.005) | 0.005 (0.004) | 0.006 (0.001) | 0.009 (0.005) | 0.008 (0.008) | 0.000 | 11,381 |
| (ppm) | 0.799 (0.317) | 1.297 (0.474) | 0.364 (0.406) | 0.984 (0.409) | 0.826 (0.332) | 1.083 (1.679) | 0.747 (0.322) | 0.000 | 11,736 |
| (ppm) | 0.002 (0.001) | 0.002 (0.002) | 0.001 (0.001) | . (.) | . (.) | . (.) | 0.001 (0.001) | <0.001 | 3248 |
| () | 0.259 (0.316) | 0.174 (0.280) | 0.169 (0.198) | 0.321 (2.380) | . (.) | 0.248 (0.229) | 0.185 (0.245) | 0.002 | 6216 |
| (ppm) | 0.775 (0.304) | 0.627 (0.262) | 0.517 (0.761) | 0.546 (0.489) | 0.512 (0.206) | 0.523 (0.211) | 0.634 (0.463) | <0.001 | 10,455 |
| W.S. | 2.662 (1.290) | 3.304 (1.272) | 2.614 (1.400) | 2.217 (1.022) | 3.070 (1.093) | 2.312 (0.807) | 2.410 (1.200) | <0.001 | 11,280 |
| Temp. | 26.984 (9.366) | 25.405 (9.288) | 28.388 (10.647) | 28.282 (9.104) | 25.586 (9.212) | 27.540 (9.283) | 29.617 (9.697) | <0.001 | 11,249 |
| Hum. | 40.179 (23.777) | 35.578 (23.866) | 28.649 (19.246) | 45.755 (16.408) | 40.405 (21.757) | 58.046 (22.343) | 33.962 (21.184) | 0.000 | 11,275 |
References
- Dockery, D.W.; Pope, C.A.; Xu, X.; Spengler, J.D.; Ware, J.H.; Fay, M.E.; Ferris, B.G., Jr.; Speizer, F.E. An association between air pollution and mortality in six US cities. N. Engl. J. Med. 1993, 329, 1753–1759. [Google Scholar] [CrossRef] [PubMed] [Green Version]
- Bell, J.N.B.; Treshow, M. Air Pollution and Plant Life; John Wiley & Sons: Hoboken, NJ, USA, 2002. [Google Scholar]
- Barnes, J.H.; Chatterton, T.J.; Longhurst, J.W. Emissions vs. exposure: Increasing injustice from road traffic-related air pollution in the United Kingdom. Transp. Res. Part D Transp. Environ. 2019, 73, 56–66. [Google Scholar] [CrossRef]
- Birmili, W.; Rückerl, R.; Hoffmann, B.; Weinmayr, G.; Schins, R.; Kuhlbusch, T.; Vogel, A.; Weber, K.; Franck, U.; Cyrys, J.; et al. Ultrafeine Aerosolpartikel in der Außenluft: Perspektiven zur Aufklärung ihrer Gesundheitseffekte. Gefahrst Reinhalt Luft 2014, 74, 429–500. [Google Scholar]
- Widiana, D.R.; Wang, Y.F.; You, S.J.; Yang, H.H.; Wang, L.C.; Tsai, J.H.; Chen, H.M. Air pollution profiles and health risk assessment of ambient volatile organic compounds above a municipal wastewater treatment plant, Taiwan. Aerosol Air Qual. Res. 2019, 19, 375–382. [Google Scholar] [CrossRef]
- Ghorani-Azam, A.; Riahi-Zanjani, B.; Balali-Mood, M. Effects of air pollution on human health and practical measures for prevention in Iran. J. Res. Med. Sci. Off. J. Isfahan Univ. Med. Sci. 2016, 21. [Google Scholar] [CrossRef]
- Alsaber, A.; Pan, J.; Al-Herz, A.; Alkandary, D.S.; Al-Hurban, A.; Setiya, P.; Group, K. Influence of ambient air pollution on rheumatoid arthritis disease activity score Index. Int. J. Environ. Res. Public Health 2020, 17, 416. [Google Scholar] [CrossRef] [Green Version]
- Alenezi, R.A.; Al-Anezi, B.S. An assessment of ambient air quality in two major cities in the state of Kuwait. Int. J. Eng. Technol. 2015, 4, 358. [Google Scholar] [CrossRef]
- Vallejo, L.A.M.; Pardo, M.A.H.; Piracón, J.A.B.; Cerón, L.C.B.; Achury, N.J.M. Exposure levels to PM2.5 and black carbon for people with disabilities in rural homes of Colombia. Environ. Monit. Assess. 2021, 193, 1–19. [Google Scholar]
- Barkley, Z.R.; Lauvaux, T.; Davis, K.J.; Deng, A.; Miles, N.L.; Richardson, S.J.; Cao, Y.; Sweeney, C.; Karion, A.; Smith, M.; et al. Quantifying methane emissions from natural gas production in north-eastern Pennsylvania. Atmos. Chem. Phys. (Online) 2017, 17, 13941–13966. [Google Scholar] [CrossRef] [Green Version]
- Achilleos, S.; Al-Ozairi, E.; Alahmad, B.; Garshick, E.; Neophytou, A.M.; Bouhamra, W.; Yassin, M.F.; Koutrakis, P. Acute effects of air pollution on mortality: A 17-year analysis in Kuwait. Environ. Int. 2019, 126, 476–483. [Google Scholar] [CrossRef]
- Al-Hurban, A.E.; Al-Ostad, A.N. Textural characteristics of dust fallout and potential effect on public health in Kuwait City and suburbs. Environ. Earth Sci. 2010, 60, 169–181. [Google Scholar] [CrossRef]
- Bouhamra, W.; Abdul-Wahab, S. Description of outdoor air quality in a typical residential area in Kuwait. Environ. Pollut. 1999, 105, 221–229. [Google Scholar] [CrossRef]
- Al-Sarawi, M.; Massoud, M.; Al-Thoweini, F.; Abdulrassol, A. Environmental Impact Assessment of the Oil Sector Complex Construction Works Offshore Al-Shuwaikh Coast, Kuwait, II. Quality and Mercury Content of Ambient Air Before Construction. Technology 2002, 8, 65–77. [Google Scholar]
- Al-Salem, S. An overview of the PM10 pollution problem in Fahaheel urban area, Kuwait. Emir. J. Eng. Res. 2008, 13, 1–9. [Google Scholar]
- Al-Mutairi, N.; Koushki, P. Potential contribution of traffic to air pollution in the State of Kuwait. Am. J. Environ. Sci. 2009, 5, 218. [Google Scholar] [CrossRef]
- Al-Awadhi, J.M. Measurement of air pollution in Kuwait City using passive samplers. Atmos. Clim. Sci. 2014, 4, 253. [Google Scholar] [CrossRef] [Green Version]
- Albassam, E.; Khan, A.; Popov, V. Management of air quality in the vicinity of congested area in Kuwait. Environ. Monit. Assess. 2009, 157, 539–555. [Google Scholar] [CrossRef]
- Al-Enezi, E.; Al-Dousari, A.; Al-Shammari, F. Modeling adsorption of inorganic phosphorus on dust fallout in Kuwait bay. J. Eng. Res. 2014, 2, 1–14. [Google Scholar] [CrossRef]
- Al-Ali, Z.; Abdullah, M.; Asadalla, N.; Gholoum, M. A comparative study of remote sensing classification methods for monitoring and assessing desert vegetation using a UAV-based multispectral sensor. Environ. Monit. Assess. 2020, 192, 1–14. [Google Scholar] [CrossRef]
- Masri, S.; Garshick, E.; Hart, J.; Bouhamra, W.; Koutrakis, P. Use of visual range measurements to predict fine particulate matter exposures in Southwest Asia and Afghanistan. J. Air Waste Manag. Assoc. 2017, 67, 75–85. [Google Scholar] [CrossRef] [Green Version]
- Carslaw, D.C.; Ropkins, K. Openair—An R package for air quality data analysis. Environ. Model. Softw. 2012, 27, 52–61. [Google Scholar] [CrossRef]
- Wickham, H. ggplot2: Elegant Graphics for Data Analysis [Internet]; Springer: New York, NY, USA, 2009; Available online: http://had.co.nz/ggplot2/book (accessed on 25 May 2021).
- Wood, S.N. Thin plate regression splines. J. R. Stat. Soc. Ser. B (Stat. Methodol.) 2003, 65, 95–114. [Google Scholar] [CrossRef]
- Shen, L.; Mickley, L.J. Effects of El Niño on summertime ozone air quality in the eastern United States. Geophys. Res. Lett. 2017, 44, 12543–12550. [Google Scholar] [CrossRef] [Green Version]
- Kayes, I.; Shahriar, S.; Hasan, K.; Akhter, M.; Kabir, M.; Salam, M. The relationships between meteorological parameters and air pollutants in an urban environment. Glob. J. Environ. Sci. Manag. 2019, 5, 265–278. [Google Scholar]
Figure 1.
Location map of the selected monitoring stations—modified after K-EPA eMISK 2020.

Figure 2.
K-EPA mobiles lab and fixed stations used for air pollution monitoring.

Figure 3.
Time series of the Studied Pollutants from 2012 to 2017— EPA Kuwait.

Figure 4.
Temporal variation of the Studied Pollutants according to the station site from 2012 to 2017 for NO, , and —EPA Kuwait.
Figure 4.
Temporal variation of the Studied Pollutants according to the station site from 2012 to 2017 for NO, , and —EPA Kuwait.

Figure 5.
Temporal variation of the Studied Pollutants according to the station site from 2012 to 2017 for , and —EPA Kuwait.
Figure 5.
Temporal variation of the Studied Pollutants according to the station site from 2012 to 2017 for , and —EPA Kuwait.

Figure 6.
Temporal variation of the Studied Pollutants according to the station site from 2012 to 2017 for and —EPA Kuwait.
Figure 6.
Temporal variation of the Studied Pollutants according to the station site from 2012 to 2017 for and —EPA Kuwait.

Figure 7.
Box plot of the monthly pollutant concentration after suitable transformation from January 2012 to December 2017.
Figure 7.
Box plot of the monthly pollutant concentration after suitable transformation from January 2012 to December 2017.

Figure 8.
Air Pollutant Concentration according to the Wind Direction and Speed from 2012 to 2017.

Table 1.
Descriptive statistics of air pollutants in years (2012–2017) for the State of Kuwait.
| Statistic | Mean | St. Dev. | Min | Pctl(25) | Pctl(75) | Max |
|---|---|---|---|---|---|---|
| (ppm) | 0.024 | 0.013 | 0.0002 | 0.015 | 0.030 | 0.257 |
| (ppm) | 0.033 | 0.022 | 0.0002 | 0.018 | 0.042 | 0.419 |
| (ppm) | 0.052 | 0.039 | 0.001 | 0.027 | 0.065 | 1.025 |
| (ppm) | 0.017 | 0.027 | 0.0003 | 0.006 | 0.020 | 1.207 |
| (ppm) | 0.009 | 0.012 | 0.00000 | 0.004 | 0.009 | 0.366 |
| (ppm) | 0.815 | 0.725 | 0.005 | 0.489 | 1.072 | 68.980 |
| (ppm) | 0.001 | 0.002 | 0.00001 | 0.0005 | 0.002 | 0.054 |
| () | 0.222 | 0.852 | 0.002 | 0.084 | 0.223 | 75.216 |
| (ppm) | 0.548 | 0.715 | 0.010 | 0.330 | 0.665 | 59.415 |
Table 2.
Comparison between residential and industrial area.
| I | R | p.overall | N | |
|---|---|---|---|---|
| N = 4649 | N = 11,736 | |||
| (ppm) | 0.0235 (0.0153) | 0.0242 (0.0120) | 0.006 | 16,006 |
| (ppm) | 0.0248 (0.0145) | 0.0368 (0.0239) | <0.001 | 16,064 |
| (ppm) | 0.0454 (0.0401) | 0.0535 (0.0379) | <0.001 | 12,058 |
| (ppm) | 0.0168 (0.0226) | 0.0176 (0.0281) | 0.063 | 15,136 |
| (ppm) | 0.0094 (0.0167) | 0.0082 (0.0091) | <0.001 | 15,953 |
| (ppm) | 0.6556 (0.4599) | 0.8783 (0.7980) | <0.001 | 16,385 |
| (ppm) | 0.0016 (0.0022) | 0.0014 (0.0012) | 0.001 | 4587 |
| () | 0.2130 (0.2776) | 0.2261 (0.9931) | 0.342 | 8720 |
| (ppm) | 0.4264 (1.1460) | 0.5928 (0.4518) | <0.001 | 14,349 |
| Wind Speed | 2.6662 (1.8385) | 2.6444 (1.2339) | 0.465 | 15,778 |
| Temp. | 27.4251 (10.1415) | 27.4535 (9.6500) | 0.872 | 15,747 |
| Hum. | 35.1748 (21.3329) | 40.1788 (23.1217) | <0.001 | 15,751 |
Table 3.
Descriptive statistics of the air climatology.
| Statistic | N | Mean | St. Dev. | Pctl(25) | Pctl(75) | Max |
|---|---|---|---|---|---|---|
| Wind Speed | 15,778 | 2.651 | 1.432 | 1.692 | 3.300 | 22.771 |
| Temp. | 15,747 | 27.445 | 9.793 | 18.654 | 36.300 | 50.575 |
| Hum. | 15,751 | 38.757 | 22.739 | 19.833 | 53.583 | 199.000 |
Table 4.
Correlation between the pollutants—all stations.
| W.S. | W.D. | Temp. | ||||||||||
|---|---|---|---|---|---|---|---|---|---|---|---|---|
| (ppm) | ||||||||||||
| (ppm) | −0.16 **** | |||||||||||
| (ppm) | −0.23 **** | 0.84 **** | ||||||||||
| (ppm) | −0.18 **** | 0.40 **** | 0.59 **** | |||||||||
| (ppm) | 0.11 **** | 0.24 **** | 0.20 **** | 0.11 **** | ||||||||
| (ppm) | −0.12 **** | 0.20 **** | 0.39 **** | 0.20 **** | 0.07 **** | |||||||
| (ppm) | −0.14 **** | 0.28 **** | 0.30 **** | 0.15 **** | 0.02 | 0.25 **** | ||||||
| () | 0.06 **** | −0.04 *** | −0.09 **** | −0.02 | −0.02 * | −0.01 | −0.01 | |||||
| (ppm) | −0.10 **** | 0.14 **** | 0.13 **** | 0.07 **** | 0.02 ** | 0.12 **** | 0.07 **** | −0.01 | ||||
| W.S. | 0.26 **** | −0.23 **** | −0.23 **** | −0.16 **** | 0.09 **** | −0.13 **** | −0.16 **** | 0.11 **** | −0.05 **** | |||
| W.D. | 0.11 **** | −0.17 **** | −0.16 **** | −0.09 **** | −0.16 **** | −0.20 **** | −0.08 **** | 0.05 **** | −0.13 **** | 0.20 **** | ||
| Temp. | 0.38 **** | −0.10 **** | −0.18 **** | −0.16 **** | 0.00 | −0.16 **** | −0.01 | 0.05 **** | −0.09 **** | 0.17 **** | 0.14 **** | |
| Hum. | −0.26 **** | 0.04 **** | 0.05 **** | 0.06 **** | −0.03 **** | 0.23 **** | 0.12 **** | −0.04 *** | 0.08 **** | −0.16 **** | −0.28 **** | −0.61 **** |
Note: * p < 0.1; ** p < 0.05; *** p < 0.01; **** p < 0.001.
Publisher’s Note: MDPI stays neutral with regard to jurisdictional claims in published maps and institutional affiliations. |
© 2021 by the authors. Licensee MDPI, Basel, Switzerland. This article is an open access article distributed under the terms and conditions of the Creative Commons Attribution (CC BY) license (https://creativecommons.org/licenses/by/4.0/).
Share and Cite
MDPI and ACS Style
Al-Hurban, A.; Khader, S.; Alsaber, A.; Pan, J. Air Quality Assessment in the State of Kuwait during 2012 to 2017. Atmosphere 2021, 12, 678. https://0-doi-org.brum.beds.ac.uk/10.3390/atmos12060678
AMA Style
Al-Hurban A, Khader S, Alsaber A, Pan J. Air Quality Assessment in the State of Kuwait during 2012 to 2017. Atmosphere. 2021; 12(6):678. https://0-doi-org.brum.beds.ac.uk/10.3390/atmos12060678
Chicago/Turabian StyleAl-Hurban, Adeeba, Sawsan Khader, Ahmad Alsaber, and Jiazhu Pan. 2021. "Air Quality Assessment in the State of Kuwait during 2012 to 2017" Atmosphere 12, no. 6: 678. https://0-doi-org.brum.beds.ac.uk/10.3390/atmos12060678
Note that from the first issue of 2016, this journal uses article numbers instead of page numbers. See further details here.