
Statistical Approaches for Forecasting Primary Air Pollutants: A Review
by
 and
and
Kuo Liao
1,2, 
Xiaohui Huang
1,2,*,
Haofei Dang
1,2,
Yin Ren
3,4,
Shudi Zuo
3,4 and
Chensong Duan
3,4 1
Wuyi Mountain National Meteorological Observation Station, Nanping 354300, China
2
Fujian Institute of Meteorological Sciences, Fuzhou 350001, China
3
Institute of Urban Environment, Chinese Academy of Sciences, Xiamen 361021, China
4
Key Laboratory of Urban Environment and Health, Xiamen 361021, China
*
Author to whom correspondence should be addressed.
Atmosphere 2021, 12(6), 686; https://0-doi-org.brum.beds.ac.uk/10.3390/atmos12060686
Submission received: 31 March 2021
/
Revised: 18 May 2021
/
Accepted: 24 May 2021
/
Published: 27 May 2021
(This article belongs to the Special Issue Dust Aerosols in Urban Atmospheres: Emissions, Air Quality Impact and Source Apportionment)
Abstract
:Air pollutant forecasting can be used to quantitatively estimate pollutant reduction trends. Combining bibliometrics with the evolutionary tree and Markov chain methods can achieve a superior quantitative analysis of research hotspots and trends. In this work, we adopted a bibliometric method to review the research status of statistical prediction methods for air pollution, used evolutionary trees to analyze the development trend of such research, and applied the Markov chain to predict future research trends for major air pollutants. The results indicate that papers mainly focused on the effects of air pollution on human diseases, urban pollution exposure models, and land use regression (LUR) methods. Particulate matter (PM), nitrogen oxides (NOx), and ozone (O3) were the most investigated pollutants. Artificial neural network (ANN) methods were preferred in studies of PM and O3, while LUR were more widely used in studies of NOx. Additionally, multi-method hybrid techniques gradually became the most widely used approach between 2010 and 2018. In the future, the statistical prediction of air pollution is expected to be based on a mixed method to simultaneously predict multiple pollutants, and the interaction between pollutants will be the most challenging aspect of research on air pollution prediction. The research results summarized in this paper provide technical support for the accurate prediction of atmospheric pollution and the emergency management of regional air quality.
1. Introduction
Air pollution not only has direct impacts on animals, plants, and human health but also has indirect negative effects on ecosystems and material circulation. Scholars have found that the non-accidental mortality of patients with cardiovascular and respiratory diseases is closely related to the concentration of particulate matter (PM) in the atmosphere [1], and an increase in black carbon levels can increase the mortality of coronary heart disease [2]. Moreover, mountain fires, the ozone hole, and global warming are considered relevant to air quality deterioration [3,4]. To better understand and manage the risks associated with air pollution, an accurate prediction of the trend of air pollution is crucial.
Many methods have been developed for the prediction of air pollution. These can be roughly divided into three categories: deterministic models, traditional statistical methods, and artificial intelligence (AI) methods. Deterministic models have been developed into third-generation air quality models based on the “single atmosphere”. This kind of model can simulate physical and chemical atmospheric processes at various three-dimensional scales. The representative deterministic models are the Community Multiscale Air Quality modeling system (CMAQ), the Atmospheric Dispersion Modeling System (ADMS) model, and the Weather Research and Forecasting model coupled with Chemistry (WRF-Chem) model [5]. Deterministic models have allowed a series of important advances in the field of air quality prediction; for example, Hu’s study demonstrated the ability of CMAQ to reproduce severe air pollution in China [6]; Mathur extended CMAQ to simulate the distribution of ozone and PM throughout the northern hemisphere [7]; and Rafee applied the WRF-Chem model to evaluate the contribution of mobile, fixed, and biological sources to air pollution in the Amazon rainforest, with the results showing that the air pollution plume from the city of Manaus was mainly transported to the west and southwest [8]. In view of the fact that air pollution forecasting has received increased attention from research communities and governments, the World Meteorological Organization published a classic study on training material and best practice regarding the use of 3D chemical weather and air quality forecasting (CW-AQF) models for operational forecasting, early warning, and policymaking [9]. If the use of statistical methods can be further increased, better results may be achieved in terms of the prediction accuracy and cost–performance ratio of calculation methods [10].
Statistical methods have been developed from traditional multiple linear regression methods. With the development of computer science and the continuous improvement and innovation of statistical prediction methods, traditional regression methods and spatial statistical methods have been combined into a complex analysis method. Artificial intelligence methods—which include machine learning methods such as artificial neural networks (ANNs), deep learning (DL), and support vector machines (SVMs), and which have data adaptation and data-driving at their core—have emerged in recent years. Many studies have shown that the accuracy of artificial intelligence technology is superior to that of traditional statistical methods [11].
Some previous studies have reviewed these methods that are used to predict air pollution. For instance, Bai et al. [12] introduced detailed statistical methods for the prediction of air pollution. They listed the basic principles of these methods but focused less on the advantages, disadvantages, and application effects of the methods. Rybarczyk and Zalakeviciute [10] analyzed 46 papers related to machine learning and concluded that researchers preferred to use integrated learning and regression for estimation applications but tended to use neural networks and support vector machines for prediction applications. However, due to the limited number of papers that were considered, this review could only represent the research status at that time and failed to provide clues on the research inclination and tendency of prediction methods for different pollutants. Therefore, it is necessary to perform a quantitative analytical review of a large number of studies involving air pollution prediction to help researchers in this field to locate the research focus more quickly and accurately.
Bibliometrics is an interdisciplinary discipline that uses mathematical and statistical methods to quantitatively analyze all knowledge carriers. Bibliometrics has been applied to perform literature reviews on environmental topics, such as urban heat islands, air pollution source analysis, and the impact of air pollution on human health [13,14]. Beyond obtaining background knowledge of the research topic, bibliometrics helps to elucidate the connections between different literature subjects. However, the identification of the future prospects of research topics requires the careful interpretation of the results of bibliometric analysis and the visualization of technology. Therefore, it is necessary to use another quantitative analysis method to analyze the evolution mechanism of spatiotemporal data. Evolutionary trees can be a good solution to this problem. When applied in biology, evolutionary trees are drawn based on the distance of the biological genetic relationship and organisms are placed on the branches of a tree chart. These diagrams concisely display the evolutionary processes of, and genetic relationships between, organisms. Additionally, these features also make evolutionary trees an effective tool for spatiotemporal data analysis. Graphical Phylogenetic Analysis (GraPhlAn) is used in biocoenology and genetics research [15]. Additionally, another quantitative analysis method is needed to determine the development speed of different academic fields. The Markov chain method can quantitatively show the process of urban development and transformation [16].
In this paper, we use bibliometrics to quantitatively review the research status of statistical methods for the prediction of air pollution in recent years. We firstly analyze all collected papers in terms of the number of publications, journal types, and subject categories to obtain an overall understanding of the development status of this discipline. Then, according to the cooperation among countries, authors, and institutions, we identify research gaps and cooperative relationships within and outside of China. An evolutionary tree is drawn to analyze the method development trend of major pollutants and statistical prediction methods in different time periods. Finally, the Markov chain method is applied to quantitatively predict the development trend of research on the prediction of major air pollutants.
2. Data and Methods
2.1. Data Sources and Preprocessing
Based on the Web of Science core database, which was developed by the American Institute of Science and Information, a search was performed for articles and reviews with the keywords “air pollution” and “prediction”; this returned 5437 related studies (Table 1), and the full records of these were downloaded. The Microsoft Excel and BibExcel software was used to extract the title (TI), abstract (AB), author (AU), author information (CI), publication time (PY), subject category (CS), published journal (SO), keywords (DE), and references (CR) of each article. To identify the research objects and prediction methods, the titles, abstracts, and keywords of all the articles were studied. Finally, a total of 727 articles were selected that used statistical prediction methods to study PM, ozone (O3), nitrogen oxides (NOx), the air quality index (AQI), and composite pollutants.
2.2. Bibliometric Analysis
Bibliometrics is a scientific analysis method that uses mathematical and statistical methods to quantitatively analyze the quantitative relationship, distribution, and changing rule of the literature on a given topic. The full record of the published literature (books, journals, newspapers, conference articles, etc.) is fundamental for obtaining the data structure needed for bibliometric research. Through mathematical statistical analysis, the rule of article publishing, research trends, institutional cooperation, etc., can be quantitatively analyzed. In the bibliometric analysis performed in this study, the first step was extracting and counting the features of the subject categories, publishing journals, and publication dates. This information can provide the basic situation of research on air pollution prediction. Then, VOSviewer, a software program used for constructing and visualizing bibliometric networks, was used to analyze cooperation, co-occurrence, and co-citation. By extracting research institutions (top 120 with a frequency of more than five times), keywords (top 100 with a frequency of more than 10 times), and references (top 120 with a frequency of more than 20 times), the cooperation network of research institutions, the keyword co-occurrence network, and the literature co-citation network were drawn. The connections within these networks depict the structure, evolution, and cooperative relationships of the research field of air pollution prediction.
2.3. Evolutionary Tree Analysis
In this study, the evolutionary tree analysis was divided into two parts: one involving an evolutionary tree and one involving Markov chain analysis. In biology, the evolutionary tree method is used to represent evolutionary relationships among species. By placing species on a tree chart with branches, the evolutionary processes of, and genetic relationships between, the species can be displayed concisely. The evolutionary tree was drawn using GraPhlAn, a Python-based command-line tree-drawing tool developed by the Huttentower Laboratory. This tool is frequently applied in phylogenic and taxonomic research and can directly and concisely display the systematic classification structure in the form of a circular tree. In this study, borrowing the idea of taxonomy from biology, the 727 articles were classified into three levels: the first level represents the pollutant object studied in the article; the second level represents the statistical prediction method used in the article; and the third level represents each individual article (see Table A1 in Appendix A for details). The GraPhlAn tool was used to draw evolutionary trees for articles published in 1990–1999, 2000–2009, and 2010–2018.
The Markov chain method is used to describe the transition process from one state to another [17]. This transition needs to meet the requirement of being “memoryless”—that is, the distribution probability of the next state can only be determined by the current state. In this paper, we group papers that study the same pollutant and use the same prediction method into one category and define five levels based on the number of publications: Level 1: 0–1 papers; Level 2: 2–5 papers; Level 3: 6–10 papers; Level 4: 11–30 papers; and Level 5: more than 31 papers. The Geotree software was applied to draw the Markov chain from 2000–2009 to 2010–2018. Then, the changes in development status were quantitatively analyzed for each level in the two above periods to identify research hotspots.
3. Results
3.1. Basic Information
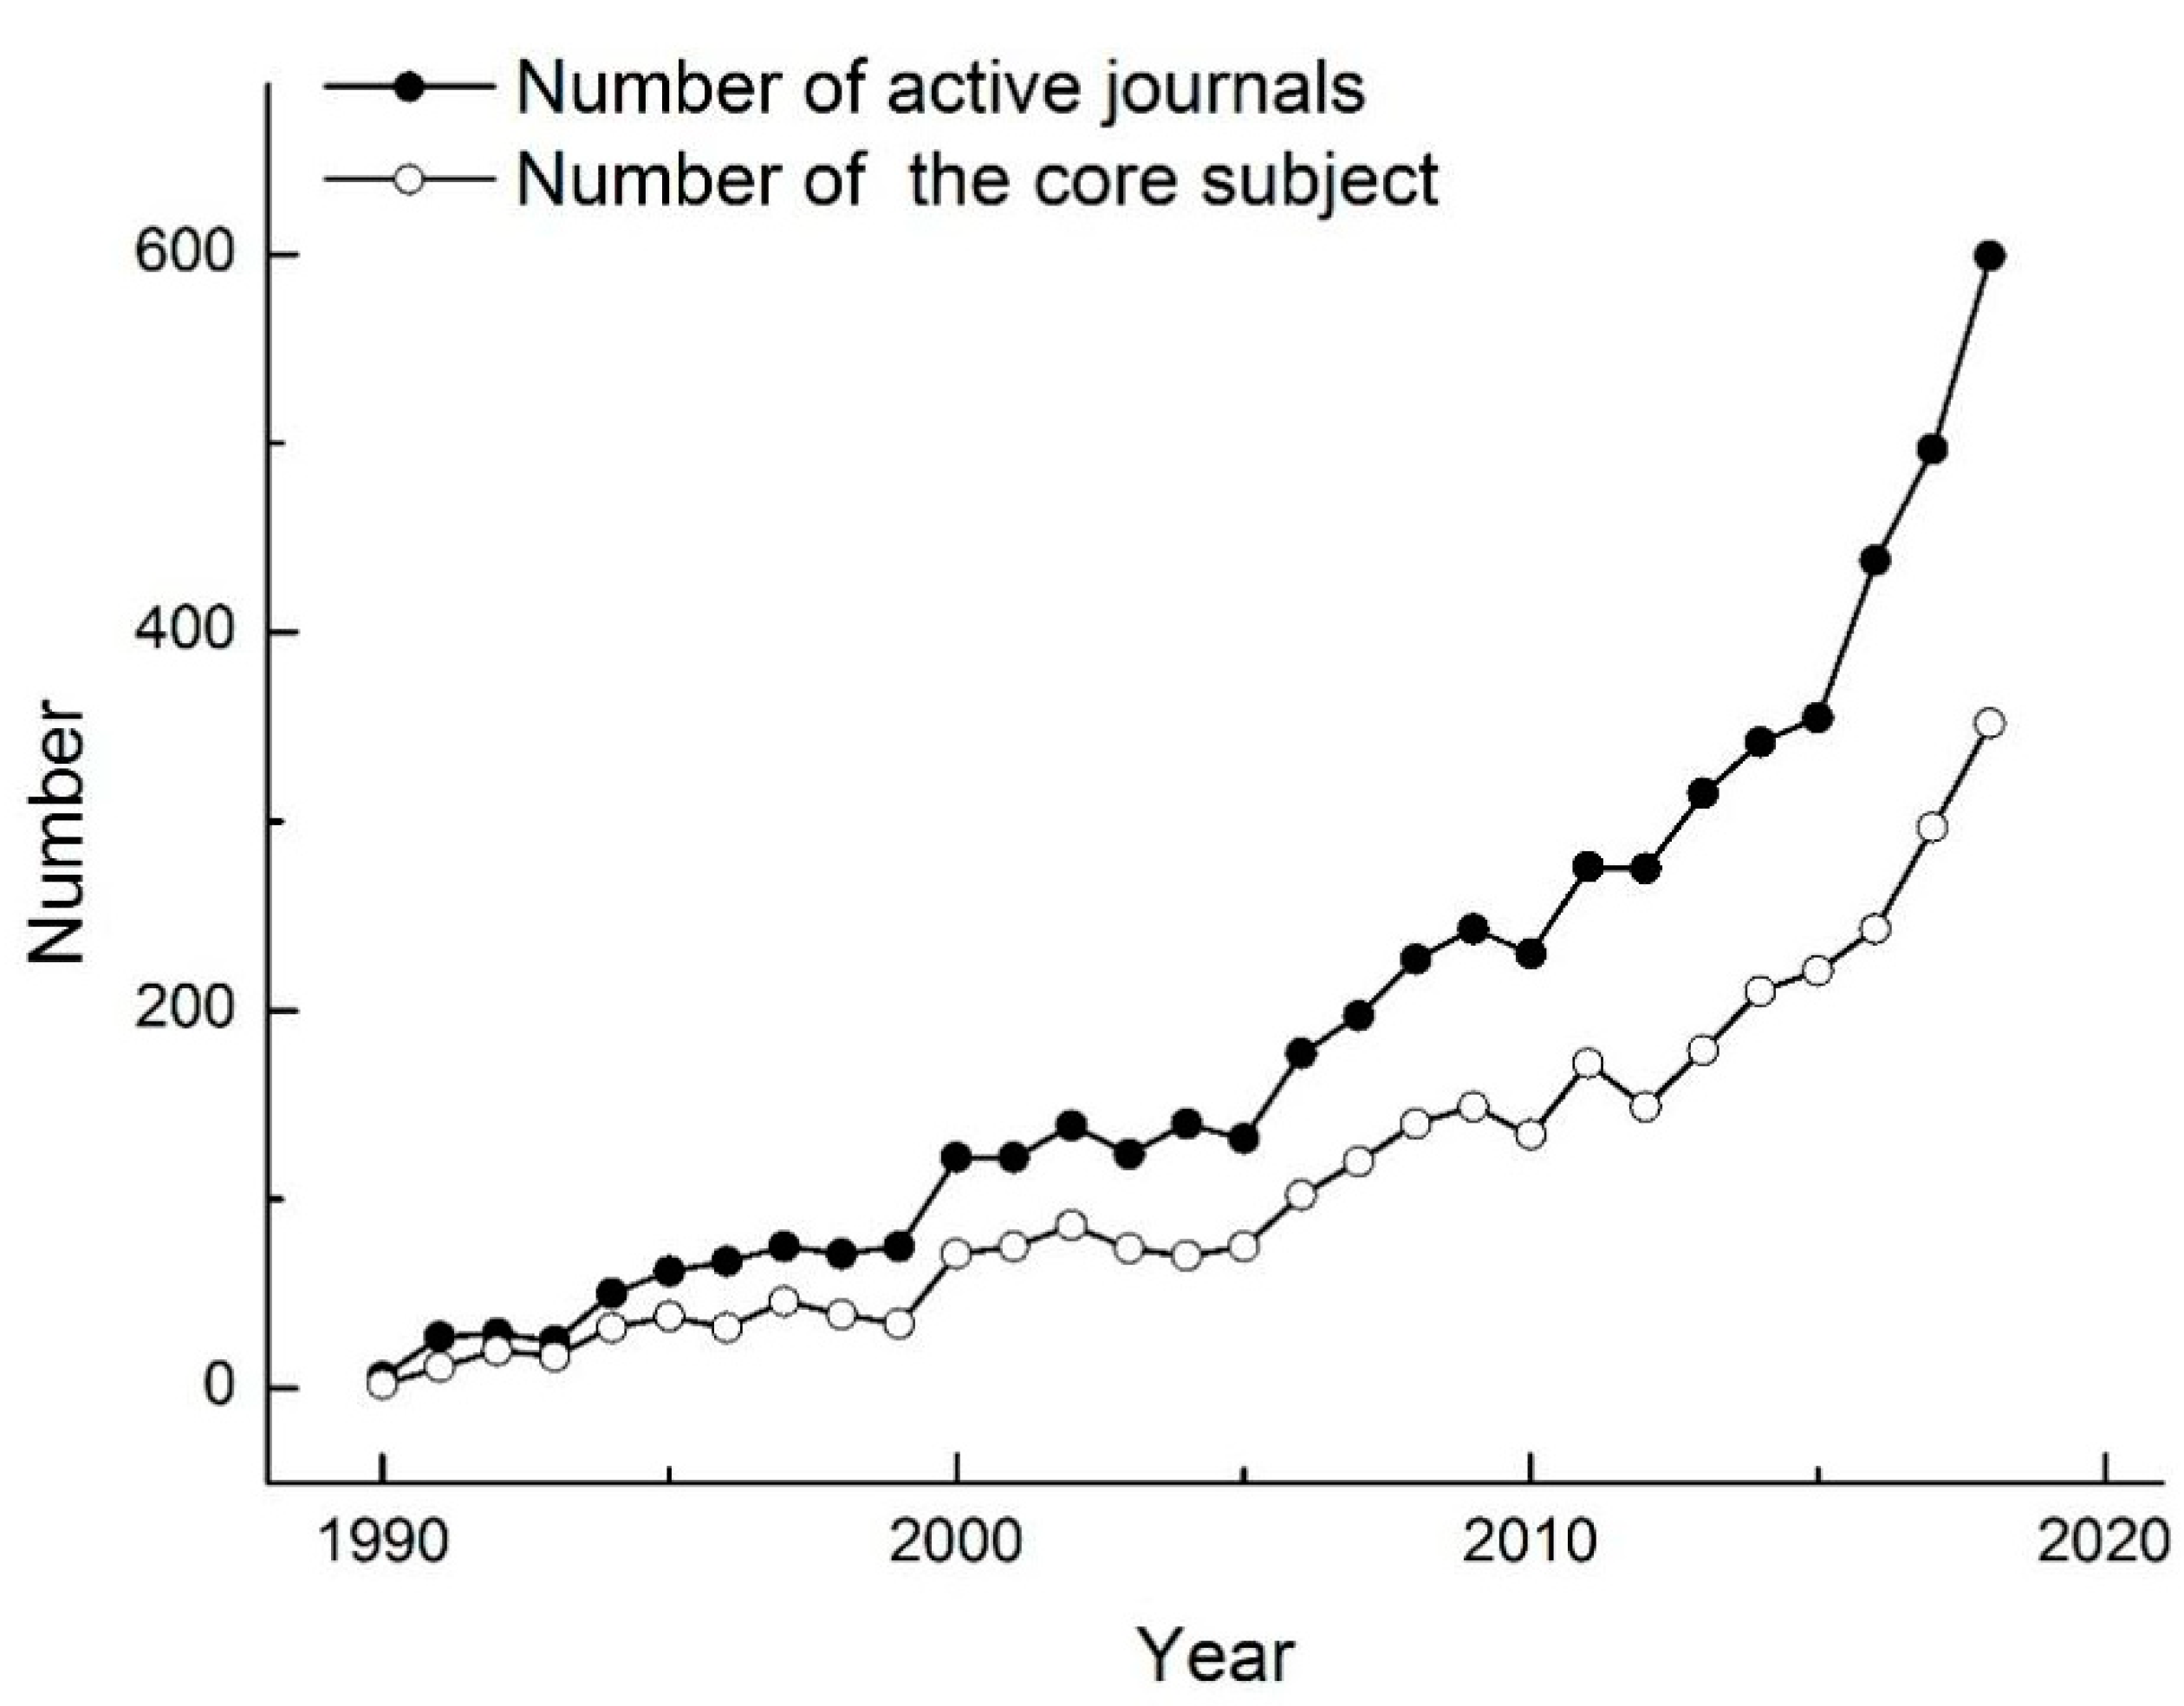
Between 1990 and 1999, the number of published studies regarding air pollutant prediction increased from 6 to 75, with an average annual growth of 6.9 studies; between 2000 and 2009, the number of published studies rose from 122 to 283, with an average annual growth of 16.1 studies; and between 2010 and 2018, the number of published studies grew from 230 to 597, with an average annual growth of 36.7 studies. In the following, this study will discuss the bibliometric results for these three periods one by one (Figure 1).
By analyzing the top 10 disciplines producing papers involving air pollution prediction in the three periods, “Environmental Sciences & Ecology” is always the core (Table A1). In all of the three periods, the number of studies published in the discipline of “Environmental Sciences & Ecology” is basically consistent with the growth trend of the total number of papers involving air pollutant prediction. The number of papers accounts for 58.67% of the total number of published papers, and the proportion over the years is more than half (Figure 1). In the three periods, the disciplines of “Meteorology & Atmospheric Sciences”, “Engineering”, and “Public, Environmental & Occupational Health” also rank at the top of studies involving air pollutant research. In all of the three periods, “Environmental Sciences & Ecology”, together with the above three disciplines, was always in the top four. The discipline of “Public, Environmental & Occupational Health” developed rapidly in the third period; although it ranked fourth in this period, the number of papers published in this discipline was close to that of the third-ranked discipline. In 2000–2009, the discipline of “Chemistry” began to enter the top 10 disciplines; additionally, it kept increasing in the third period, which indicated a growing research focus on the relationship between air pollutant prediction and chemistry.
Regarding journals, “Atmospheric Environment” occupied first place in terms of publication number in all of the three periods, accounting for 11.72% of the total number of publications (Table A2). The journal “Atmospheric Chemistry and Physics” entered the top 10 in the second period and rose to second place in the third period. This indicates a significant growth in the influence of this journal from 2010 to 2018. In the third period, “Atmospheric Pollution Research”, “Environmental Research”, and “Aerosol and Air Quality Research” also developed rapidly and entered the top 10 journals publishing studies involving air pollutant prediction.
3.2. Analysis of Research Institutions and Co-Citation
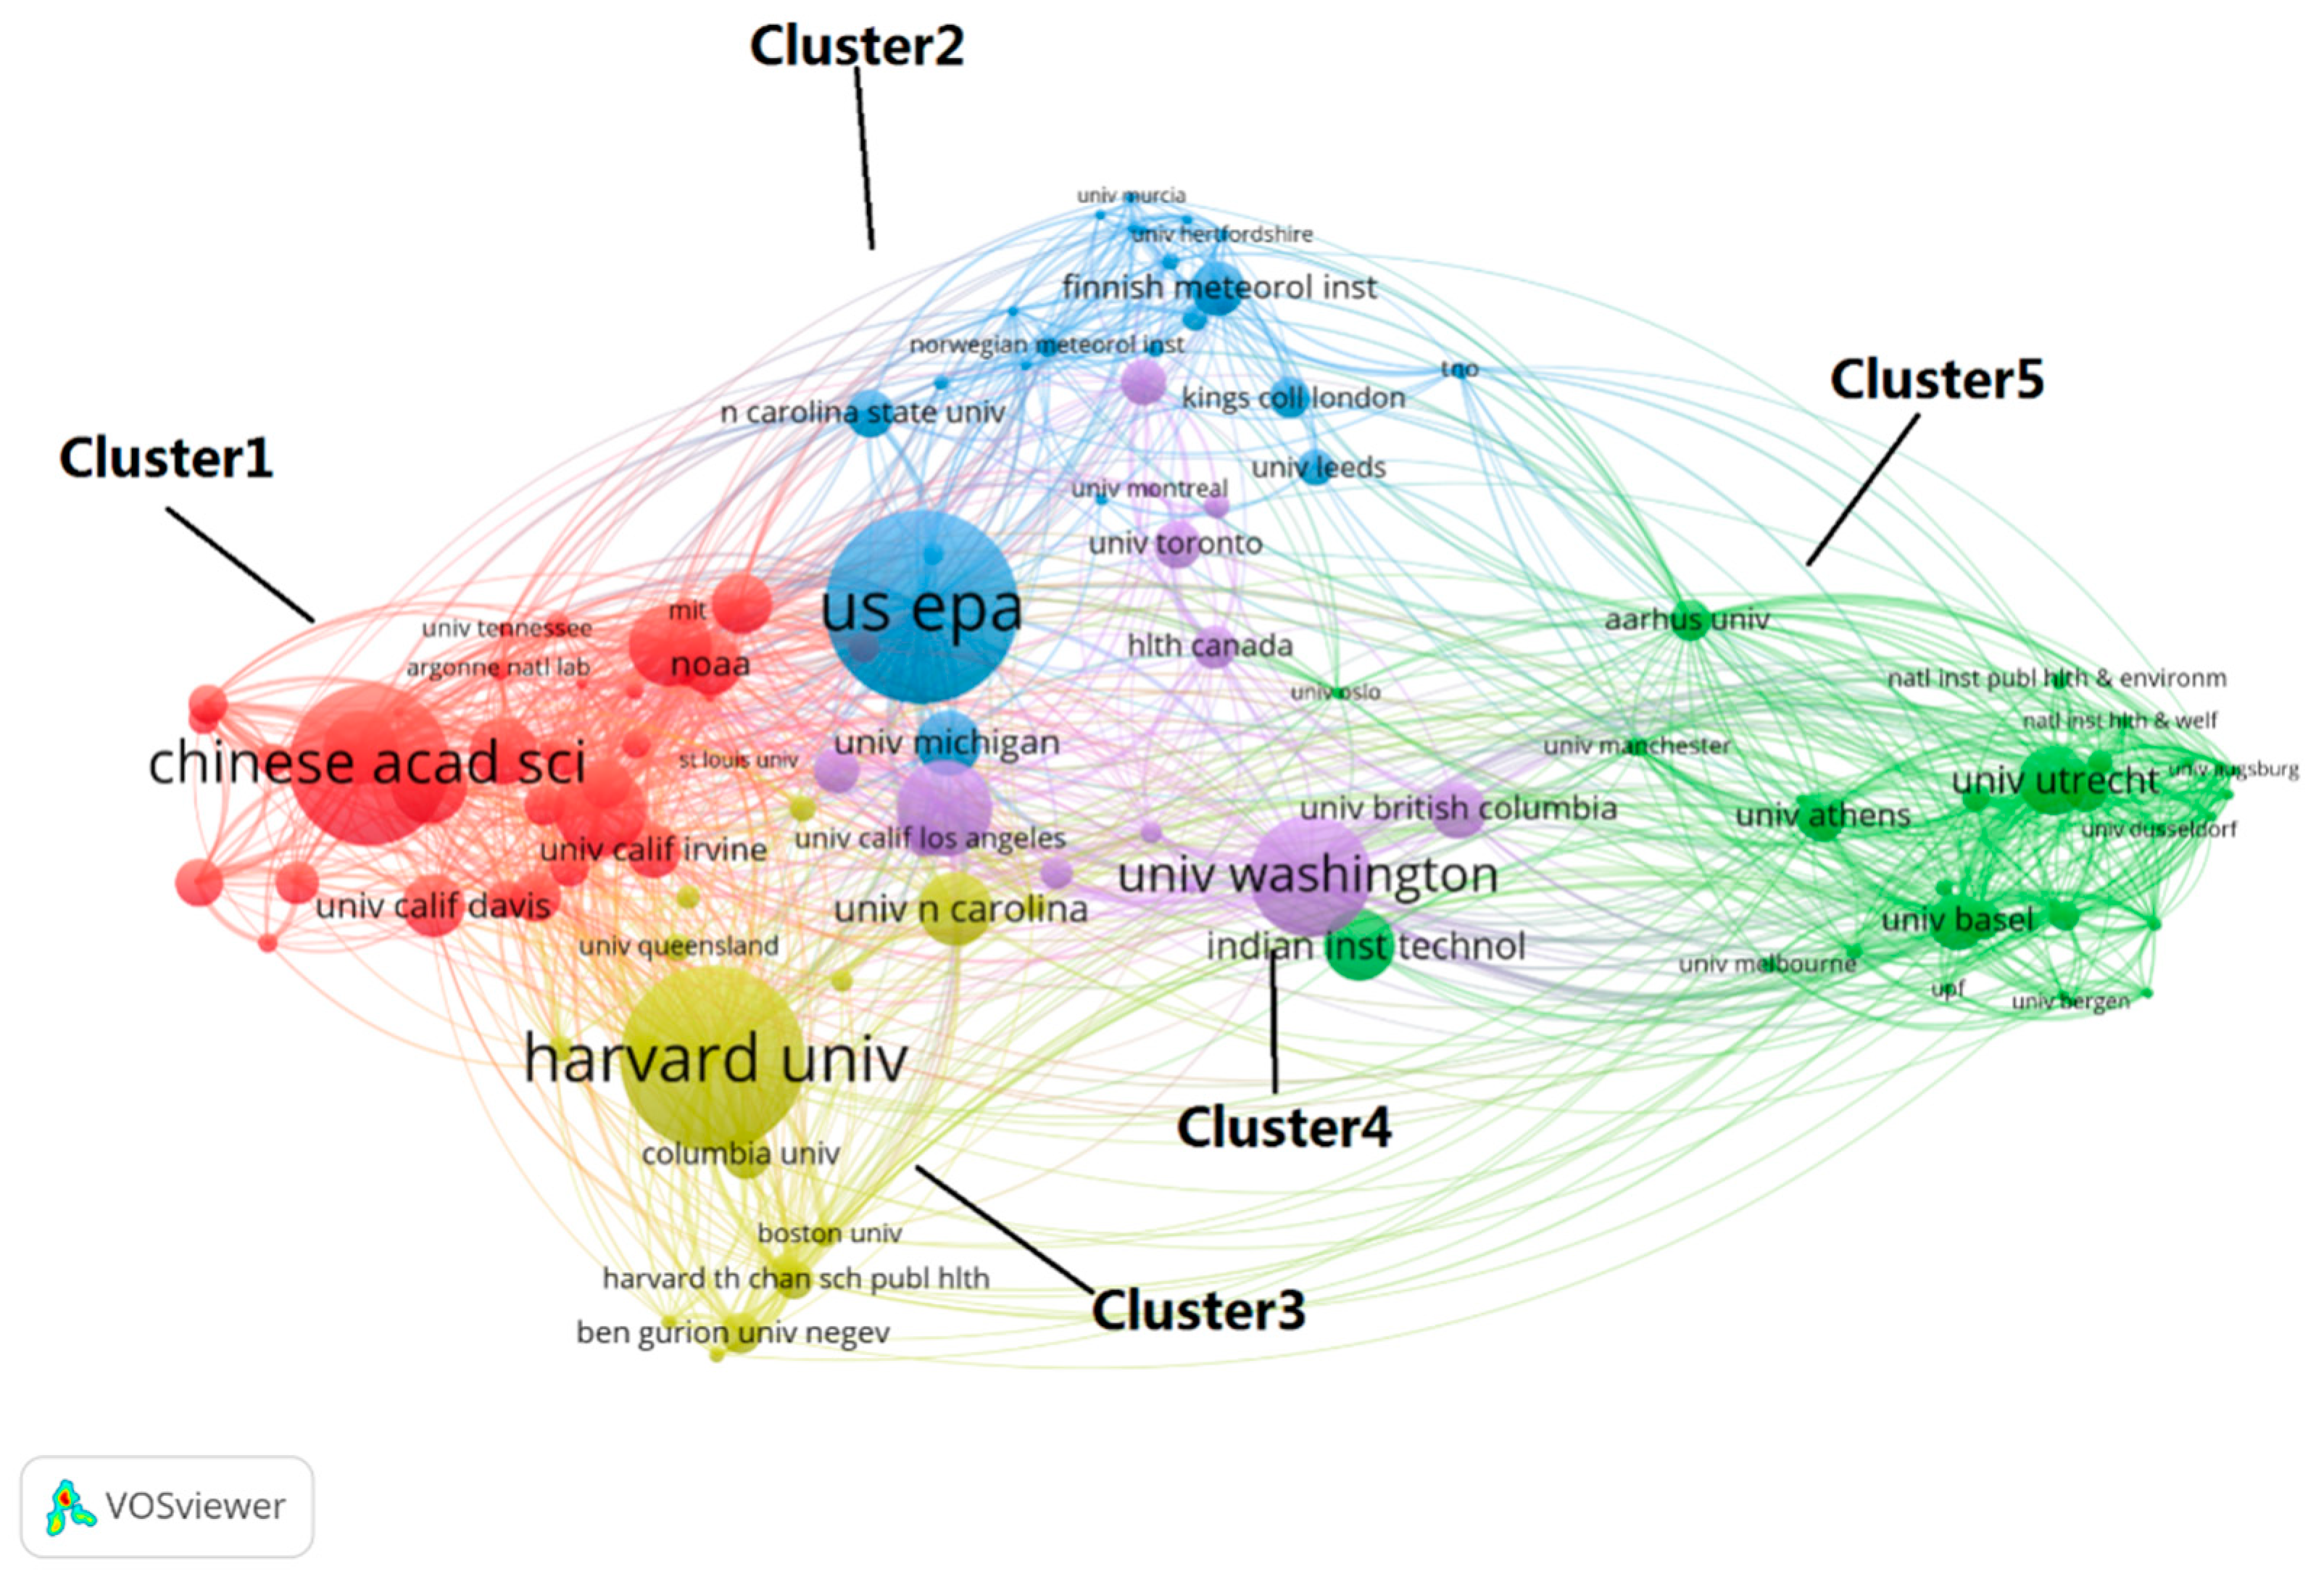
Throughout 1990–2018, the research institutions that were involved in studies of air pollution prediction can be divided into five clusters based on their cooperative relationships: Cluster 1 is led by the Chinese Academy of Sciences. Members of this cluster have a certain number of papers published and are closely connected (Figure A1). Cluster 2 is led by the United States Environmental Protection Agency (US EPA), and the number of papers published by its members is slightly less than in Cluster 1. The US EPA and the University of Michigan cooperated frequently with Cluster 1 and Cluster 2. Both Cluster 3 and Cluster 4 are led by universities in the United States: Cluster 3 is led by Harvard University, and its members are closely connected; Harvard University cooperates most with Cluster 1, while the University of North Carolina cooperates most with Cluster 4; Cluster 4 is led by the University of Washington, which maintains a relationship with the other four clusters and plays an important role in connecting the other clusters (examples include the University of California, Los Angeles; the University of Toronto; and the University of British Columbia). Cluster 5 mainly includes research institutions in Europe and developing countries; among these, the Indian Institutes of Technology and the University of Utrecht (The Netherlands) published the most papers, although not as many as in other clusters. The Indian Institutes of Technology acts as a cooperative bridge between institutions of Cluster 5 and other clusters.
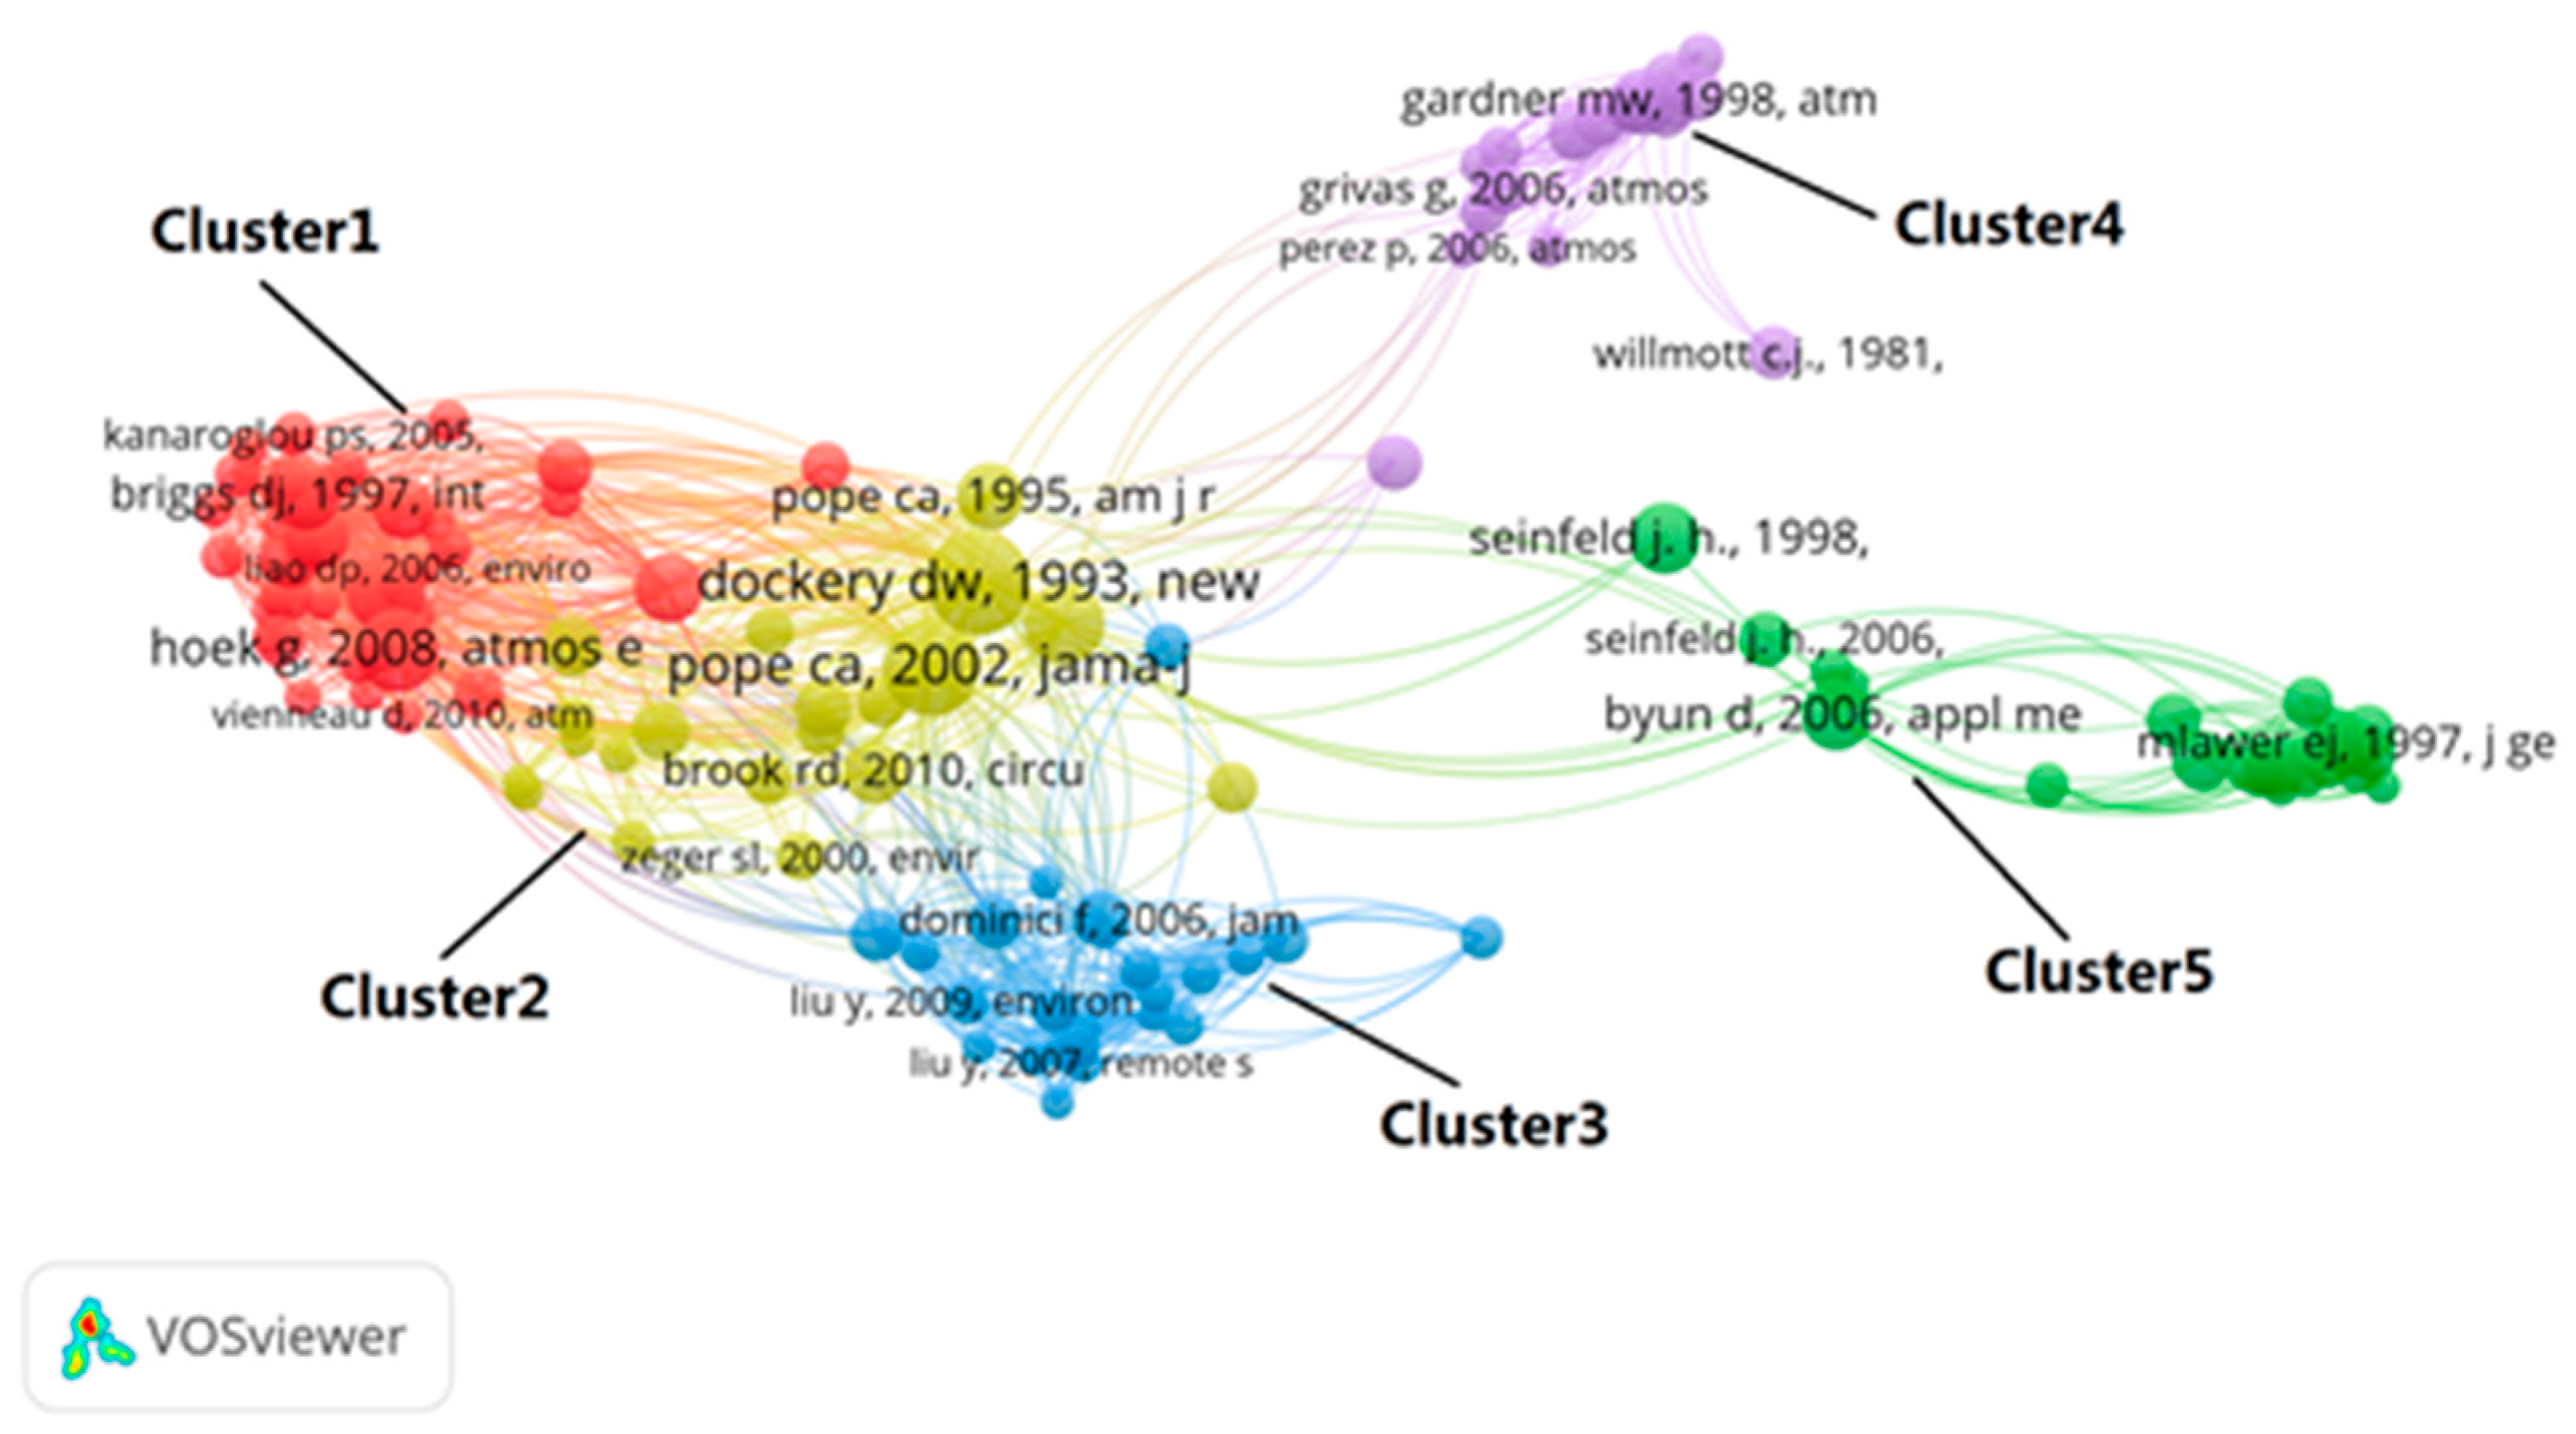
The most frequently cited references in the selected research papers involving air pollutant prediction can also be divided into five clusters. Cluster 1 groups is an important basis for geospatial estimation method of air pollution. Two papers conducted detailed evaluations and comparisons of land use regression (LUR) [18,19], while two other studies applied Geographic Information Systems (GISs) to this field [20,21]. Cluster 2 consists of studies on the relationship between air pollution and human health. In this cluster, studies by Pope focused on the effects of PM on cardiopulmonary function [22,23], while Dockery explored the relationship between air pollution and mortality [24]. Studies in Cluster 3 investigated the use of the satellite aerosol optical thickness to predict PM pollutants [25]. The studies in Cluster 4 involve the application of ANNs to the prediction of PM pollutants [26]. Lastly, Cluster 5 consists of studies that apply deterministic models for air pollution prediction (Figure A2) [27].
3.3. Keyword Analysis
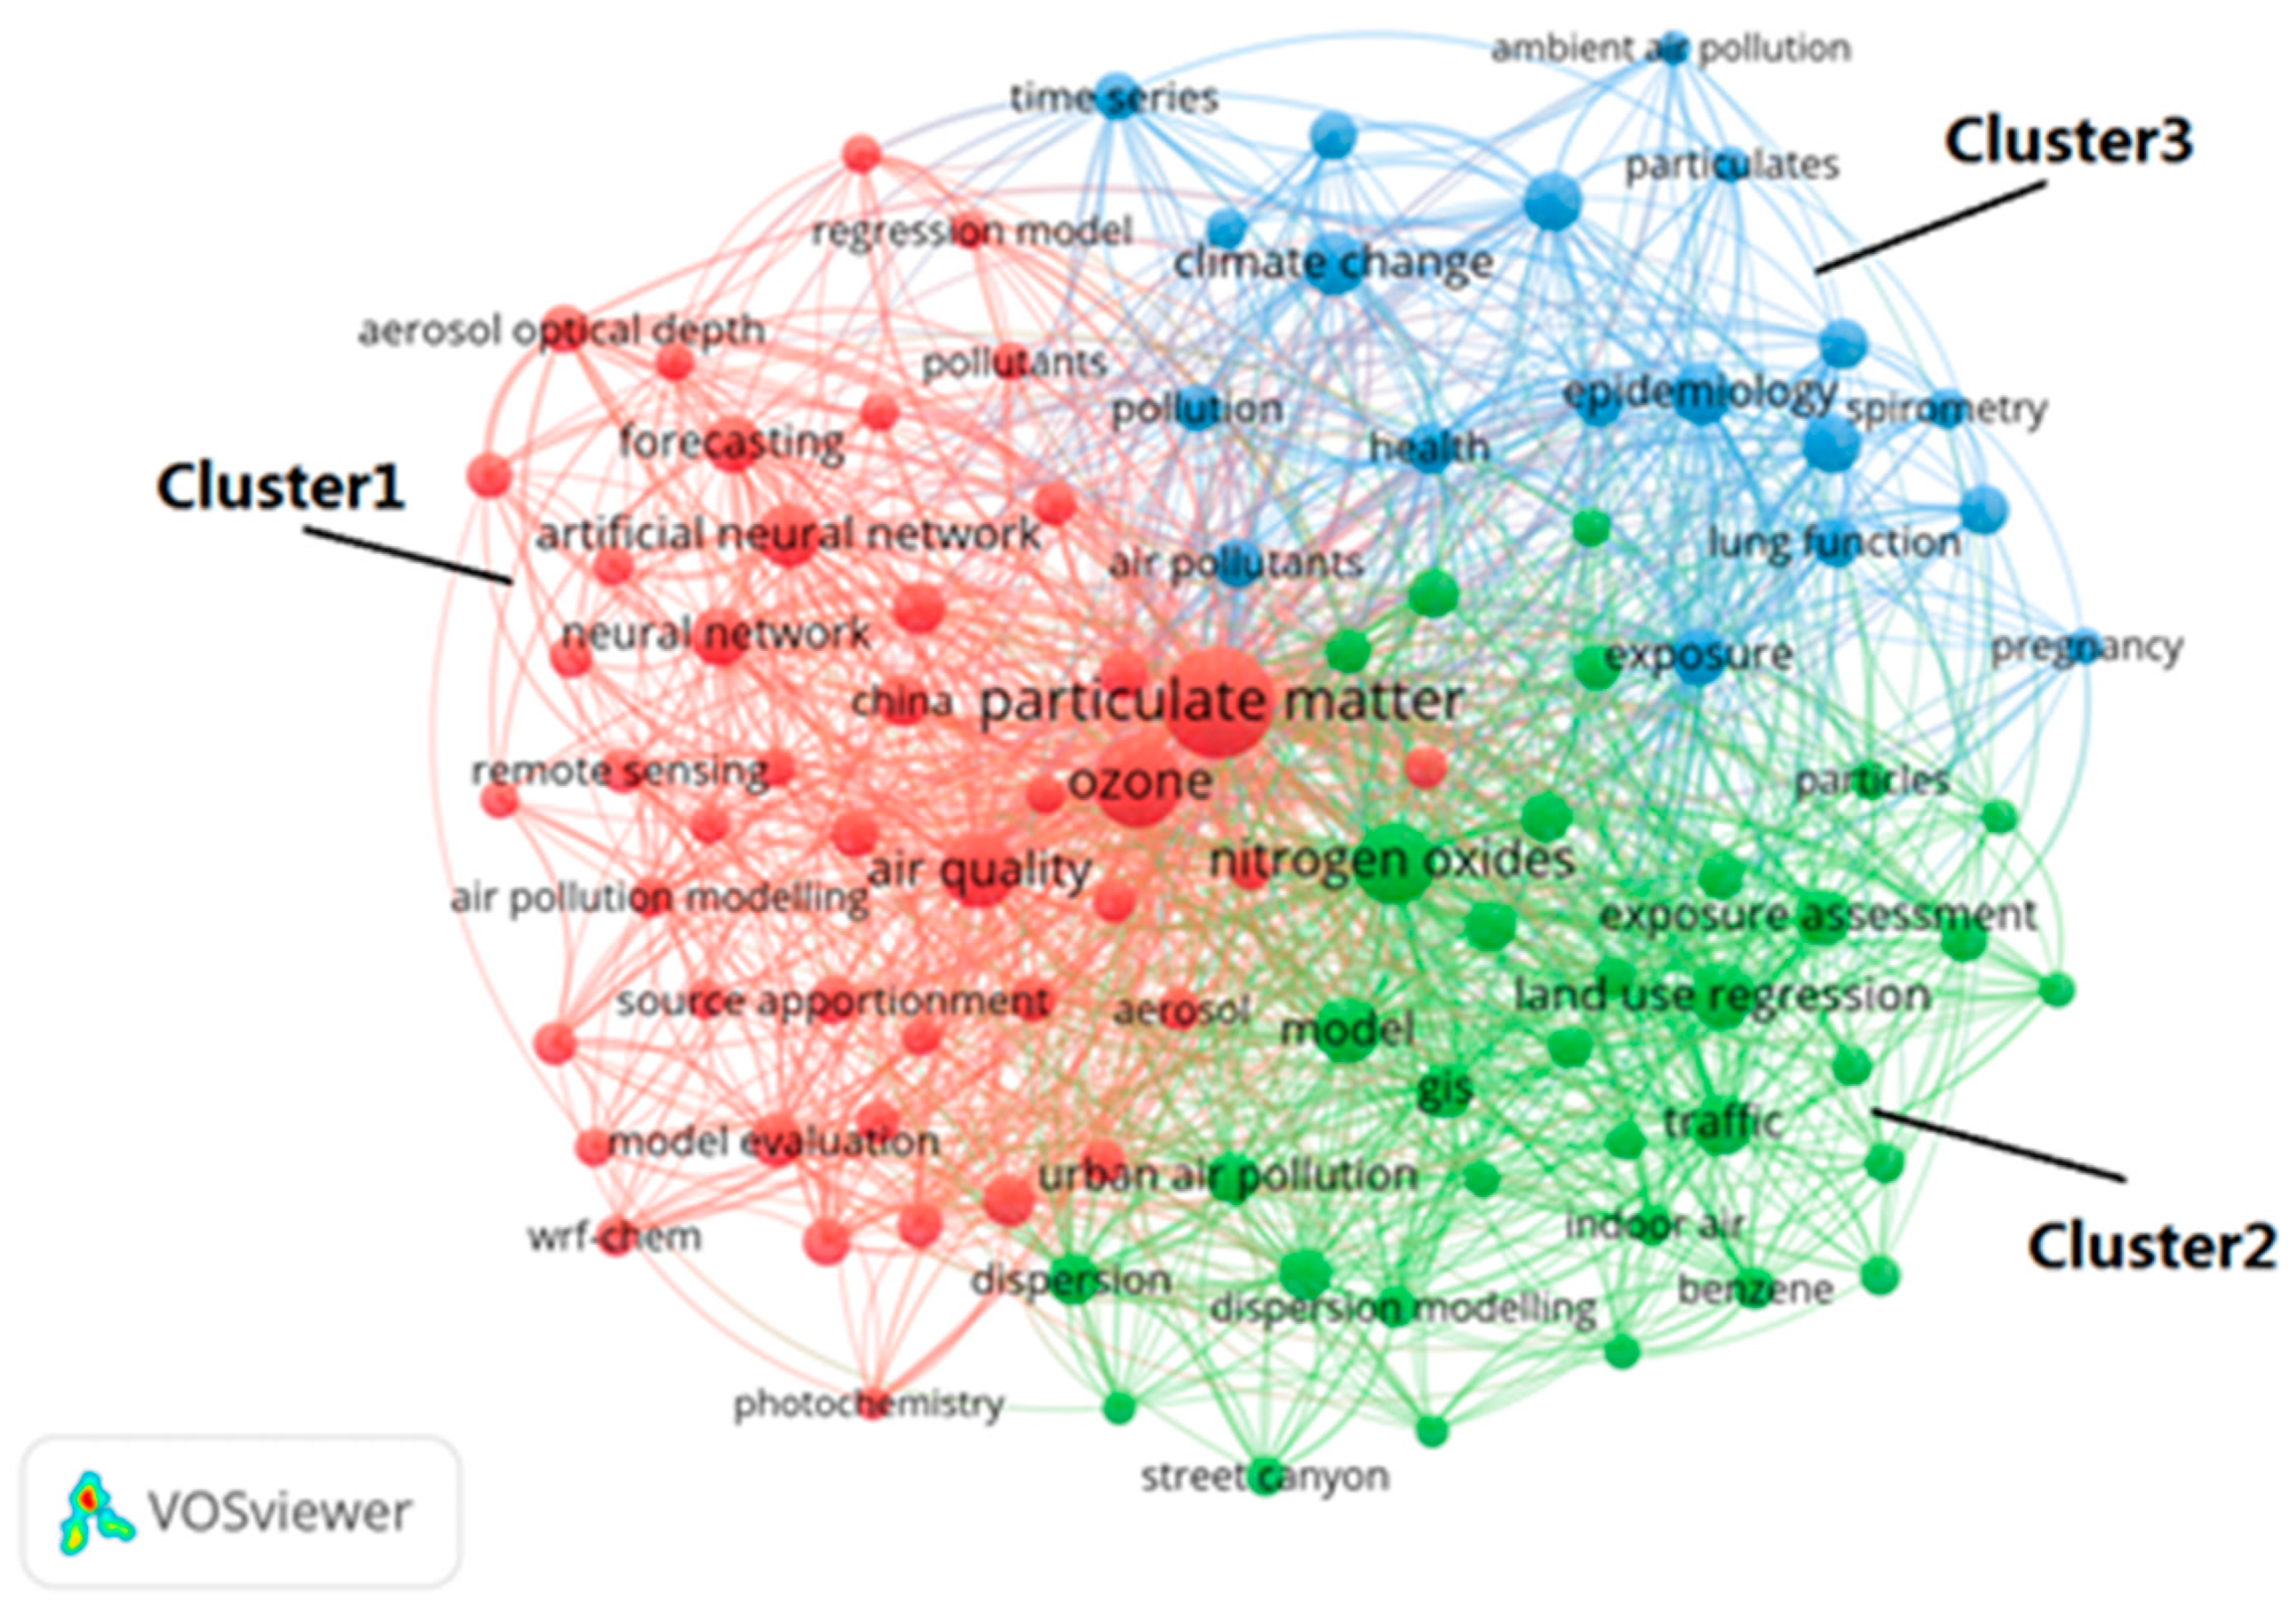
Keywords are a summary of the theme of an article. Through the co-occurrence analysis of keywords, one can identify the key points in a research field and the relationship between the points. In this study, the keywords of the air pollution prediction papers were automatically divided into three clusters based on the frequency of co-occurrence. From 1990 to 2018, the analyzed studies were mainly based on three pollutants: PM, ozone, and nitrogen oxide (Figure 2). The co-occurrence of PM and ozone is close, and both belong to Cluster 1. Additionally, air quality is also an important research object in Cluster 1; this topic involves a wide range of prediction methods, including artificial neural networks (i.e., machine learning), regression models, and WRF-Chem (a chemical transport model). The main pollutants discussed in Cluster 2 are nitrogen oxides, which are studied in exposure assessment and pollution diffusion research. The main prediction methods are land use regression, geographic information systems, Kriging, etc. Additionally, this cluster focuses on topics regarding spaces such as cities, indoor spaces, and traffic lines. Cluster 3 contains studies on the impacts of air pollution, such as climate change and health issues. In terms of health, studies in this direction are more focused on lung function, pregnancy, and fetal health.
3.4. Evolutionary Tree Analysis
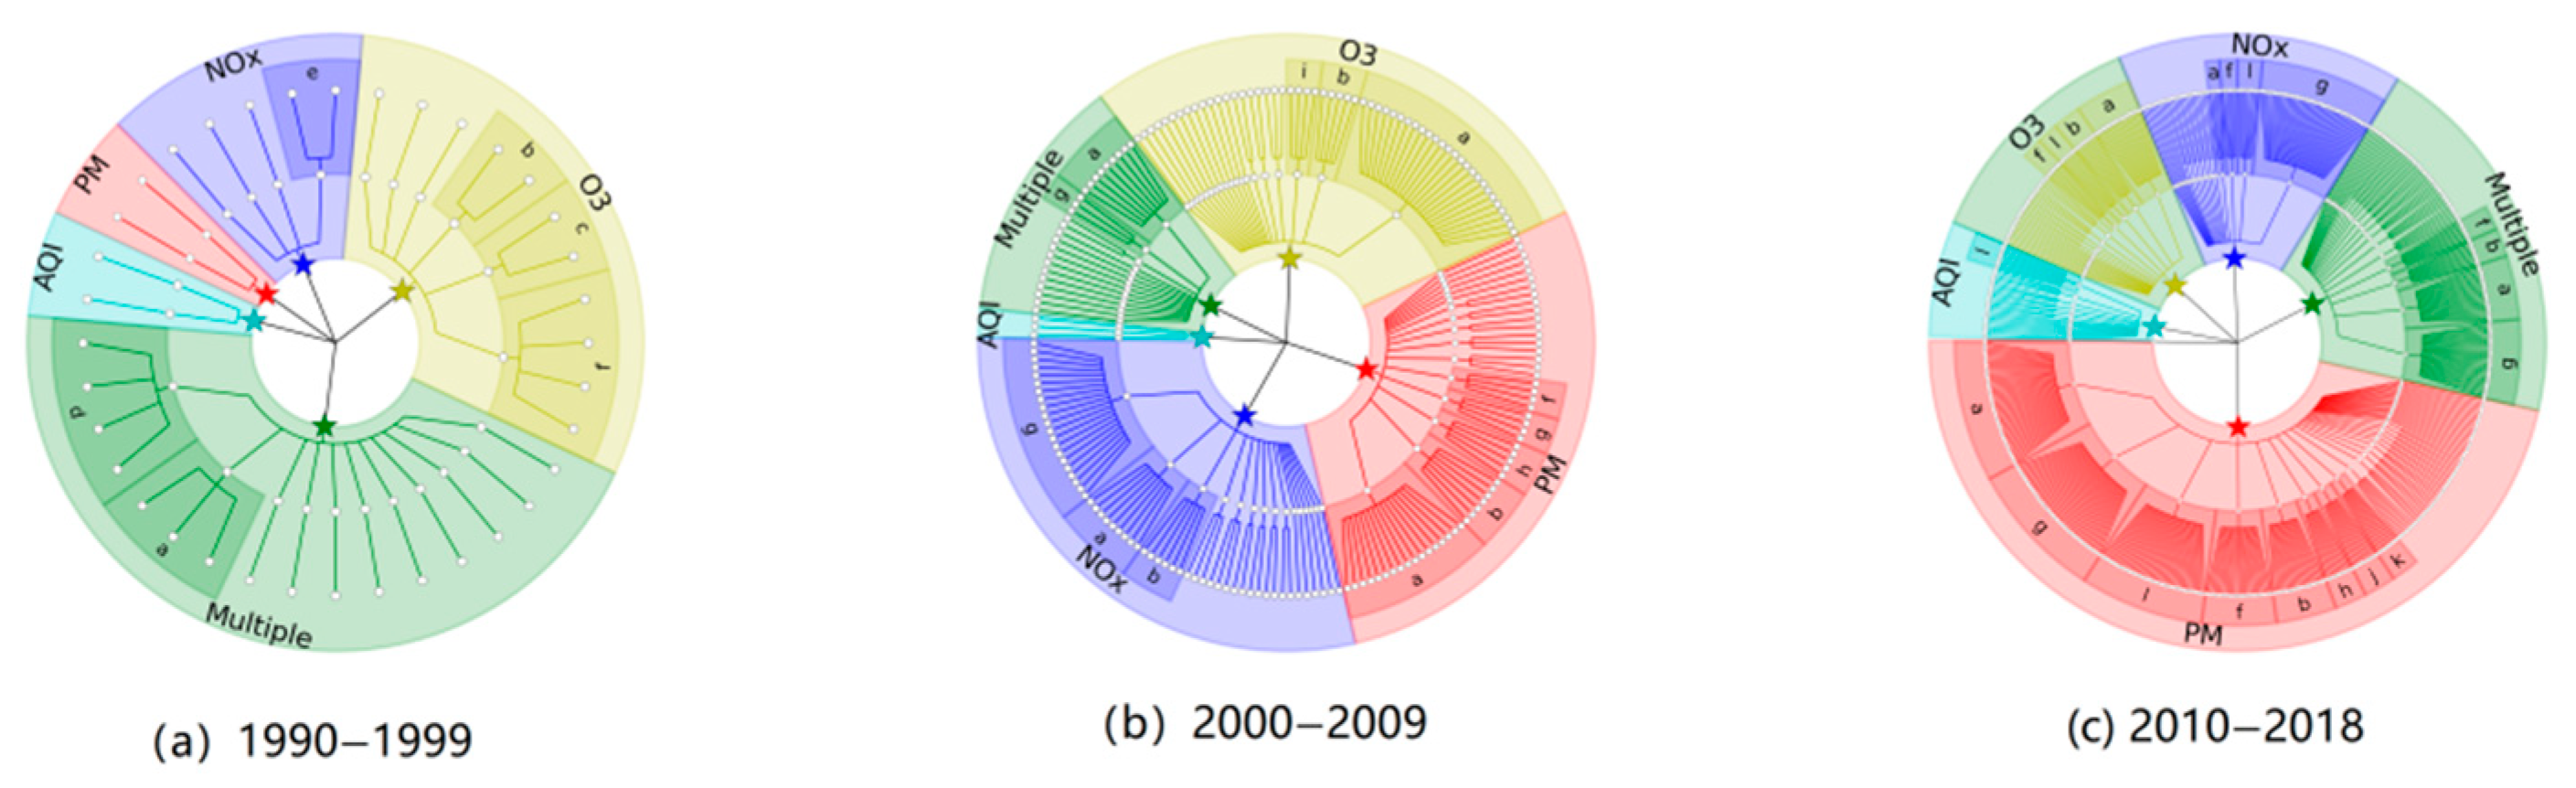
In this step, we firstly examine the papers that studied PM, NOx, O3, AQI, and composite pollutants. The numbers of such papers published in the three periods are as follows: 1990–1999: 37; 2000–2009: 195; and 2010–2018: 495. As shown in Figure 3, in the past 30 years, the methods applied for the statistical prediction of air pollutants have changed considerably (Figure 3).
In 1990–1999, the analyzed articles were more focused on multiple pollutants (referring to the simultaneous prediction of multiple pollutants in one paper), which consisted of 3–5 pollutants (around 43%), while only a few studied single pollutants (Figure 3a). In this period, the Gaussian method and ANN were the methods that were most commonly used for the simultaneous prediction of multiple pollutants, while multiple linear regression (MLR) and correlation analysis were used for the prediction of O3.
During 2000–2009, with the development of research methods, the analyzed studies became mostly focused on single pollutants, and research on NOx (57 papers) and PM (55 papers) grew rapidly, exceeding and equaling, respectively, the number of papers on O3 (55 papers) (Figure 3b). Meanwhile, the proportion of papers considering composite pollutants declined by 12.8% (25 papers) compared to 1990–1999. In this period, the papers considering composite pollutants mainly used ANN and LUF for prediction; these two methods were also used for studies of PM and NOx, while studies of O3 only applied ANN. Additionally, the MLR method gradually began to be widely applied in this period.
In 2010–2018, PM pollutants became the mainstream of research interest (Figure 3c). Between 1990 and 2018, the number of studies on PM pollutants grew steadily (231 papers), while the number of studies on O3 increased more slowly (61 papers). In 2010–2018, more studies on multiple pollutants were published compared to 2000–2009. This indicates that research on air pollution prediction has recently begun to focus more on the correlation between pollutants. During this period, hybrid methods for air pollution prediction rapidly gained popularity, ranking third in the methods used in studies of PM, O3, and NOx; this was also the most widely used prediction method in studies using the AQI. Additionally, the generalized additive model (GAM) and SVM also attracted increasing attention.
3.5. Markov Chain Analysis
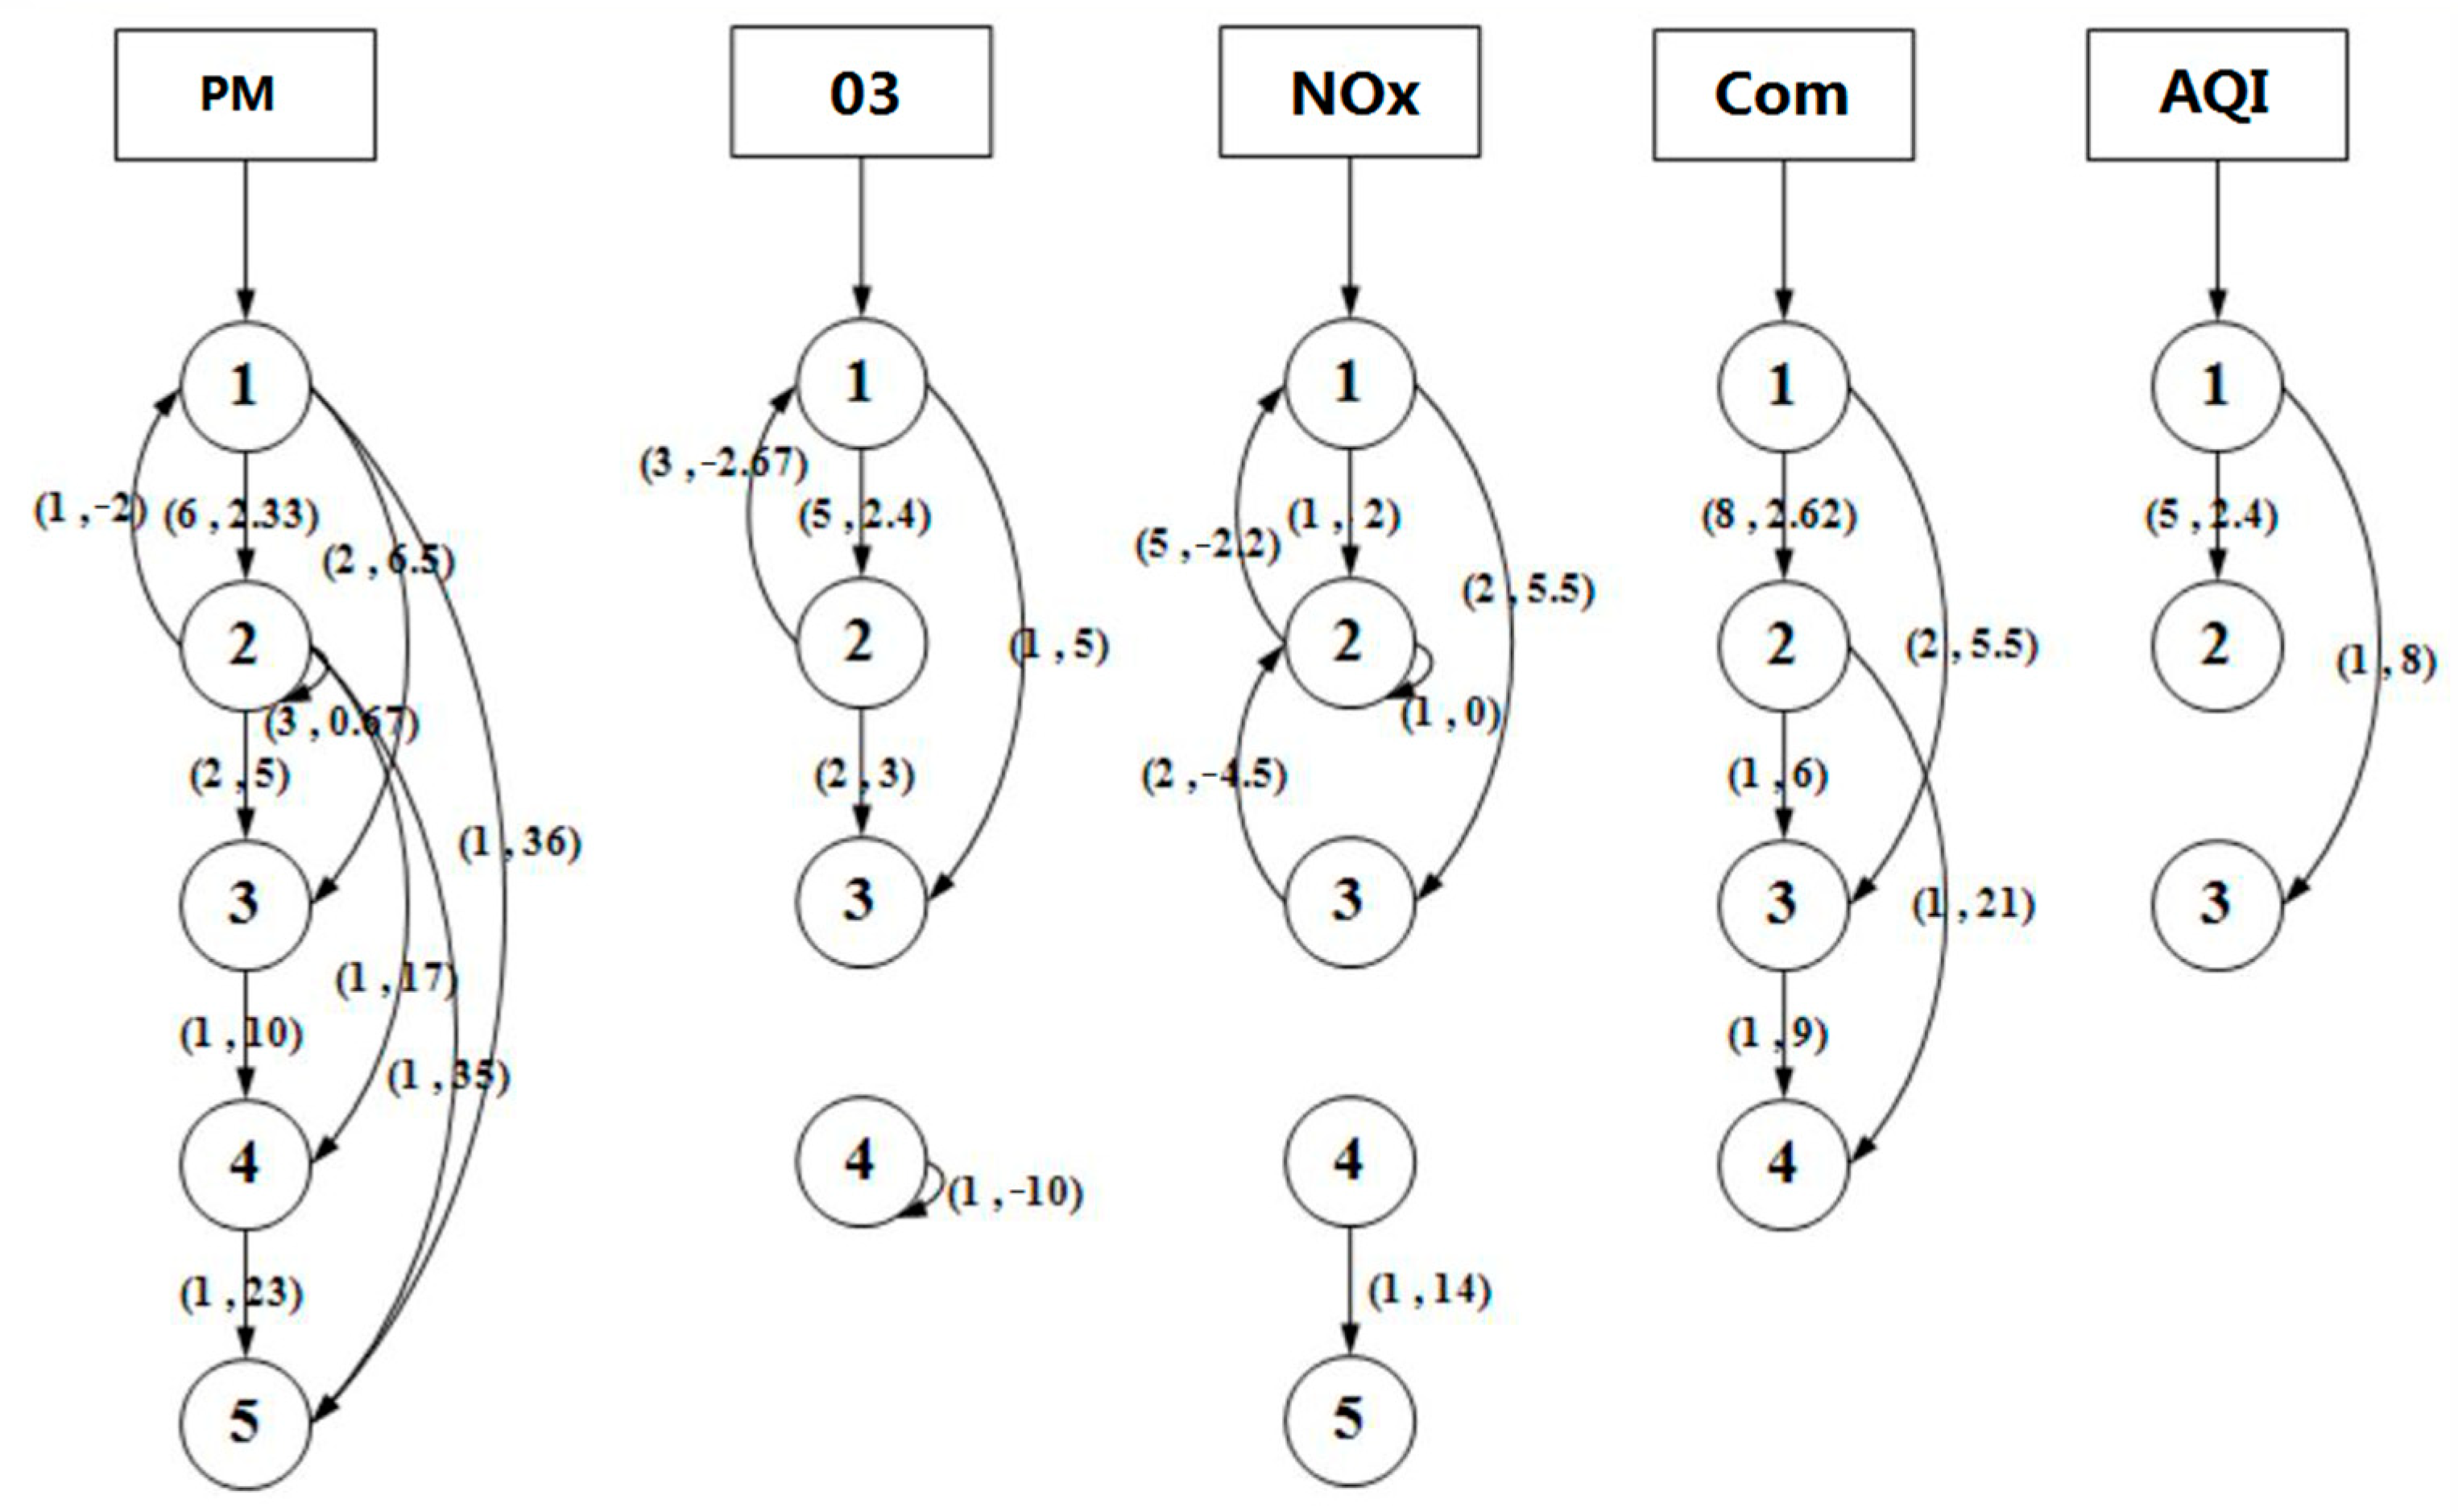
The Markov chain method quantitatively displays the development status of prediction methods for research on different air pollutants (Figure 4). For PM prediction, the hybrid method is the fastest-developing method, growing from Level 1 to Level 5. Additionally, another four methods developed rapidly; the random forest (RF) and SVM methods grew from Level 1 to Level 3, and the multiple and LUR methods increased from Level 2 to Level 4 and Level 5, respectively. The LUR method had the second-fastest growth rate, increasing from Level 2 (four papers) to Level 5 (39 papers). During 2000–2009, the ANN method was at Level 4 (17 papers), and it increased to Level 5 (40 papers) in 2000–2018. The extreme value theory (EVT) is the only method to show a decreasing trend; for O3 prediction, the hybrid method increased from Level 1 to Level 3. However, the autoregressive integrated moving average (ARIMA), Lagrangian, and adaptive neuro-fuzzy inference system (ANFIS) methods dropped from Level 2 to Level 1.
The hybrid method and multiple method for NOx prediction both jumped from Level 1 to Level 3. However, ANN, MLR, ARIMA, and four other methods decreased to varying degrees, some of them falling from Level 2 to Level 1 and others falling from Level 3 to Level 2. The growth trend of prediction methods for multiple pollutants was similar to that of studies on NOx. The main difference is that the LUR method increased from Level 2 to Level 4 from NOx studies. For pollutant prediction based on the AQI, the hybrid method is the only one whose level increased. The hybrid method is especially preferred in studies of PM. The number of published papers increased from 1 to 36. The application of the hybrid method also grew for research on O3 and NOx, especially when combined with multiple pollutants and the AQI. For studies of O3 and NOx, the number of papers using the hybrid method increased from an average of 1 to an average of 5 and 5.5, respectively, while for studies of multiple pollutants and the AQI, the number of papers using the hybrid method increased from an average of 1 to an average of 5.5 and 8, respectively (Figure 4).
4. Discussion
This study applies bibliometrics to quantitatively analyze the literature on air pollution prediction (publications, research institutions, keywords, etc.) and integrates the statistical spatiotemporal analysis with the evolutionary tree method. By reviewing the spatiotemporal pattern in the literature, we visualize the inter-connection of multi-dimensional data and the mutations of the evolutionary pathway. The results indicate the hotspots and trends of air pollution prediction research. Regarding air pollution prediction, PM, O3, and NOx are the most widely studied single pollutants. Additionally, multiple pollutants and the AQI are also popular research targets. In the following, we will further discuss the research hotspots and the difficulties of research on pollution prediction for different pollutants.
4.1. Particulate Matter (PM)
PM2.5 and PM10 are the pollutants of greatest concern. In recent years, the number of studies on PM1 or finer PM has increased [28,29]. For these pollutants, when conducting statistical prediction, ANNs are the most widely applied method. The ANN interpolation method has significant advantages in most cases, especially under the condition of limited air quality network density [30]. However, for solving the problem of air pollution source allocation, the BP-ANN method requires as many emission sources as possible to complete training [31].
In 2000, when applying a multi-layer neural network method for predicting the hourly PM2.5 concentration at a fixed point, the prediction error was around 30–60% [32]. However, by 2018, with the development of a variety of neural network algorithms, the prediction error had been greatly reduced and was far lower than that of the general statistical prediction method [33]. For example, the Self-Organizing Deep Belief Network (SODBN), which is based on a growth and pruning algorithm, can dynamically adjust the weights in the process of structure self-organization, effectively shortening the running time and improving the accuracy [34]. The extended model of a long-term short-term memory neural network considering temporal and spatial correlation automatically extracts the inherent useful features of historical air pollutant data through a long-term and short-term memory (LSTM) layer and combines auxiliary data (including meteorological data and time-stamp data) into the proposed model to enhance the performance. For the simulation of the hourly PM2.5 concentration, this method is superior to other statistical models, such as the spatiotemporal deep learning (STDL) model, the delayed neural network (TDNN) model, the autoregressive moving average (ARMA) model, and the support vector regression (SVR) model [35].
Land use regression models can obtain the distribution of air pollutant concentrations at a fine scale using a small number of monitoring stations and prediction factors without air pollution source data. It is a promising technique for the high-spatial-resolution prediction of ambient air pollutant concentration. Due to the strong heterogeneity of the urban land surface, the LUR model cannot fully characterize the spatial characteristics of urban pollutant emissions. Previous studies have shown that this method can only explain 61% to 64% of the spatial distribution trend of PM2.5 concentration [36]. The choice of the boundary buffer distance is key in LUR models since this determines the predicted spatial distribution of PM2.5 [37]. With the progression of the study of the factors influencing changes in surface PM concentration based on the result layer obtained by the LUR method, an increasing number of relevant factors and their interactions have been used to predict changes in PM concentration. For example, Liu et al. [38] used meteorological factor regression (MFR) and backpropagation neural network (BPNN) modeling techniques combined with LUR to simulate the temporal variation of PM10. Li et al. [37] studied the combination effect of AOD and LUR and found that the introduction of LUR can improve the performance of the urban–rural transition area (land use characteristics change rapidly), while AOD can improve the model performance in spring.
Multiple linear regression (MLR) is a mature statistical forecasting method that can quantitatively describe the linear relationship between the target variable and multiple independent variables in order to predict variables. Since many factors can affect the particle concentration, the MLR model is suitable for the prediction of particle concentration. In the process of building a multivariate linear model, the selection of influencing factors is crucial. The results of a previous study show that humidity, temperature, wind speed, wind direction, carbon monoxide, and ozone are the main factors causing PM10 changes in the Malaysian Peninsula [39]. The least squares method is the most commonly used method to estimate parameters in MLR models. Its performance is slightly better than that of the maximum likelihood method and the squares estimation method [40]. The test of MLR mainly includes a test of goodness of fit, a significance test of variables, and the model as a whole [41]. The MLR equation has a high prediction accuracy for PM2.5 concentrations for high-emission areas; for example, Hou et al. [42] found that the correlation coefficient between the predicted and measured PM2.5 concentration passed the 95% confidence test.
Furthermore, recently, other methods for air pollution prediction have emerged, such as Bayesian maximum entropy (BME) and SVM. Compared with the vector autoregressive moving average (VARMA), ARIMA, and multi-layer perceptron (MLP) neural network models, the SVM model performs better for predicting air pollutant concentrations in the following month [43]. Unlike SVM models, Bayesian models are seldom compared with other methods. Research shows that the BME method can effectively improve the spatiotemporal estimation accuracy of PM2.5 by combining PM10 and total suspended particulate (TSP) data. Yang and Christakos [44] used the BME method to evaluate the spatiotemporal variability of PM2.5 concentration in western Shandong Province and found that this region has experienced long-term heavy PM2.5 pollution and experiences much more serious pollution in winter than in other seasons.
The application of hybrid methods for the prediction of air pollution has developed rapidly since 2010. The ANN method is the most widely coupled with other methods. For example, it is combined with the EEMD method to form the EEMD–GRNN model, which is based on data preprocessing and data analysis integrated with an empirical pattern [45]; the EEMD part is used to decompose the original PM2.5 data into several intrinsic mode functions (IMFs), and the GRNN part is used to predict each IMF. This combination produces better results compared to the GRNN model, MLR model, PCR model, and traditional ARIMA model. Combining a traditional ANN model with the principal component analysis, radial basis function network, and K-means clustering methods can improve the training speed and prediction performance [15,46]. The combination of a linear regression model and an ANN model can better predict the daily average concentration of PM10 on the following day compared to the MLR model alone [47]; combined with air quality trajectory analysis, the original time series can be decomposed into several sub-series with less variability by using wavelet transform, and then the ANN can be used to predict the PM2.5 concentration. Using this hybrid approach can reduce the root-mean-square error (RMSE) by 40% and improve the prediction of the high-value part [48]. In periods of high PM concentration, the optimization performance of the combination of numerical prediction and statistical methods is more prominent [49].
As well as the ANN method, LUR is also applied in hybrid methods for air pollution prediction. The hybrid Kriging/LUR model used by Wu et al. [50] achieved a better prediction of PM2.5 concentration compared to the LUR method and Kriging method, respectively; its annual model normalized cross-validation R2 value was 0.85, which is better than those of LUR (0.66) and Kriging (0.82). Moreover, a hybrid Grey Markov/LUR model achieved a significantly higher accuracy of PM10 concentration prediction for urban environments compared to the LUR model; the average relative error was 5.13% (vs. 24.09% for LUR) and the RMSE was 5.50 μg/m (vs. 21.31 μg/m for LUR) [51]. Overall, hybrid approaches have become a research hotspot in air pollution prediction, and their use is growing rapidly.
4.2. Ozone (O3)
Deterministic models are the main models that are applied for the formulation of air quality control policies (the US EPA requires an air quality simulation to have an accuracy within 15%). Such models are widely used in the study of O3 prediction. Additionally, in recent years, many statistical predictions have been applied to the prediction of O3. Statistical prediction methods are commonly combined with ANN, MLR, and multi-method coupling models to predict ozone concentration. In the 1990s, the MLR and Lagrangian particle models were two representative methods that were widely used to predict ozone concentration. The Lagrangian particle model has been used to simulate the motion and diffusion trajectory of surface ozone [52,53], while MLR has been applied to develop ozone prediction models. The results of the aforementioned studies show that there is a positive correlation between temperature and ozone concentration when the temperature is lower than 27 °C and a negative correlation when the temperature is higher than 27 °C [54].
In the 21st century, ANNs have gradually become the mainstream method for ozone prediction, while the use of the Lagrangian particle model has gradually decreased. Multiple linear regression is often used for comparison with the prediction effect of the ANN method [55]. Some studies found that the complexity of the ANN structure did not guarantee better ozone prediction results. The prediction of ozone using a simplified ANN model (using only six regular meteorological parameters and time data as a covariate input) is also acceptable. Maximum temperature, atmospheric pressure, sunshine hours, and maximum wind speed have been shown to be the main input variables affecting the prediction of ozone concentration in ANN models [56]. The combination of an ANN and an adaptive radial basis function (ARBF) network has also been applied to predict the daily maximum ozone concentration [57]. Additionally, support vector machine regression (SVMR) and an RF model have been used to simulate urban ozone concentrations and assess human exposure [58,59]. The training ability of SVMR can be improved by verifying the significance of adding different variables.
Furthermore, a hybrid model for ozone prediction was proposed by Di et al. [60], which performs well even for low ozone concentrations. In this model, neural networks are used to simulate interaction and nonlinearity, and the convolution kernel is used to gather nearby information to explain the spatial and temporal autocorrelation. The results showed that the cross-validation R2 of monitoring points was between 0.74 and 0.80 (average 0.76) and the performance of the model was good. Moreover, Durao et al. [61] developed a two-step method to predict tropospheric ozone concentrations. This method first determines the best prediction factors by classification and regression and then uses a multi-layer perceptron model to predict the O3 concentration at each monitoring location [62].
However, the concentration of ozone varies greatly in time due to rapid ozone exchange between the upper layer and surface, which causes difficulties in using ground stations combined with other variables to predict ozone concentrations using statistical models. To solve this problem, Tan et al. [57] conducted statistical analysis and found that many air pollutants (CO2, CH4, NO2, etc.) are related to the vertical distribution of ozone. Based on this finding, an MLR model of columnar ozone for Peninsular Malaysia was developed. The correlation coefficient between the vertical distribution of columnar ozone predicted using the model and the vertical distribution of ozone measured by SCIAMACHY (Satellite Scanning Imaging Atmospheric Chart Absorption Spectrometer) was 0.75–0.80.
4.3. Nitrogen Oxides (NOx)
In the last decade, LUR has been the most popular method for NOx prediction. In 2001, a simple statistical prediction model was established, which allowed the prediction of NO2 concentrations several hours in advance [32]. Subsequently, LUR models have gradually gained popularity for estimating the high-resolution spatial distribution of NOx. Novotny used this method to estimate the NO2 concentration, and the results showed that the method could capture the distribution of NO2 in cities and areas close to roads [63]. Additionally, Huang et al. [64] found that the corrected LUR model can explain 87% of the NO2 concentration in Nanjing in 2013.
When using LUR models, at different research scales, different related environmental variables should be considered to improve their prediction ability. At the regional scale or larger scales, as well as road and railway density, traffic volume, and land use, meteorological factors can improve the prediction ability, while short-term meteorological changes are generally not considered [65]. For example, Mavko et al. [66] found that, after incorporating wind direction into the regression model, the prediction capability for the spatial variation of NO2 concentration increased from 66% to 81%. Furthermore, studies have shown that the wind field information of global models (GEM-HiMAP) has a significant impact on the overall model prediction after it is incorporated into the LUR framework [67]. Furthermore, Li et al. [68] showed that it is more convenient to introduce wind direction in an LUR model based on a semi-circular buffer. At the block- or street-scale, more detailed urban morphology and traffic information should be included in the model. For example, Weissert et al. [69] developed a micro-LUR model for Auckland, New Zealand. The predictive variables identified at this scale included street width, distance to main roads, the presence of awnings, and the number of bus stops.
Coupling land use models with other methods is an increasing trend in the field of NOx prediction. Adding Kriging or satellite data to specific NO2 LUR models can improve the prediction result, especially when predicting points far away from a monitoring position (clustering cross-validation) [70]. Araki et al. [71] established a spatiotemporal land use random forest (LURF) model for the metropolitan area of Japan, using RF to express the nonlinear relationship between NO2 concentration and predictive variables. Cross-validation testing showed that the R2 value of the LURF model is 0.79, which is better than that of the traditional linear regression land use model (R2 = 0.73).
4.4. Multiple Pollutants and AQI
The focus of mixed pollutants is not on the accuracy of prediction methods but is mainly on obtaining more information on pollutant concentrations and distribution. With the development of science and technology, researchers are no longer satisfied to predict only single pollutants but also attempt to predict multiple pollutants. The research object of multiple pollutants is to holistically study common and wide-ranging pollutants such as PM2.5, NO2, BC, O3, and SO2 to comprehensively reflect the overall level of air pollution and provide a basis for environmental management. Therefore, the application of the AQI is urgently needed for the overall evaluation of air quality. Common air quality prediction models usually predict multiple pollutants first and then calculate the air quality index [72,73]. The prediction effect of multiple pollutants is an important premise of the AQI prediction model.
The study of multiple pollutants is often complicated by the difference in the prediction effect of different pollutants. For example, the prediction results of a composite pollution LUR model developed by Huang et al. [64] can explain 87%, 83%, 72%, and 65% of NO2, SO2, PM2.5, and O3, respectively. The correlation between the types of pollutants, seasons, and meteorological variables at different altitudes is also different. The sensitivity of pollutants to meteorological variables is higher in winter than in other seasons, and the sensitivity of ozone to meteorological variables is also different from the other two pollutants [74]. Therefore, improving the overall prediction accuracy of composite pollution models is very difficult.
4.5. Air Pollutants and Their Health Impacts
Combining prediction models with environmental risk and exposure assessment is an important direction of air pollution prediction. By studying the relationship between pollutants and human health/the environment, the potential impacts of future air pollution can be evaluated. Meanwhile, using a stable and timely warning platform to predict the probability of pollution events or extreme pollution situations can provide an important basis for decision-makers [75].
Based on data of PM2.5 and the numbers of emergency and inpatient hospital visits for respiratory cardiovascular disease in New York City in 2004–2006, Weber et al. [16] found that high PM2.5 exposure was associated with an increased risk of asthma, cardinal infarction, and heart failure. Long-term exposure to air pollutants has adverse effects on the lung function of LTRs, although macrolides may ameliorate this effect [76]. Air pollution also has adverse effects on fetal development. During the critical period of 2–8 weeks of pregnancy, exposure to PM with a diameter of less than 2.5 microns (PM2.5) seriously affects the development of the heart of the fetus [77]. By studying the relationship between the behavior rating and exposure to black carbon (BC) and fine particulate matter (PM2.5) in children aged 0–6 years, Harris et al. [78] concluded that air pollution may affect the development and function of the brain, thus affecting children’s problems.
To better evaluate the impact of air pollution on different activity spaces, scholars focused on two spatial scales: (1) special places (industrial areas, mining areas, urban traffic light intersections, outdoor bus stations, road construction sites, etc.), and (2) urban-scale air pollution prediction. The prediction of air pollution in special places has a more direct impact on people’s production and life. For example, polycyclic aromatic hydrocarbons (PAHs)—which are emitted during combustion and have carcinogenic and genotoxic effects—are the focus of the prediction of indoor air pollution [79]. Additionally, the assessment of the impact of temple incense on increased exposure to PMS and PAHs can provide guidance for the healthy lifestyles of residents [80]. Moreover, in the vicinity of industrial and traffic pollution sources, the concentration prediction and impact assessment of heavy metals and PM can provide a scientific basis for urban planning and design for urban managers. For example, it is possible to predict atmospheric heavy metal concentrations based on the biomagnetism of tree leaves [81].
5. Conclusions
Based on the number of papers, subjects, countries, institutions, journals, and keywords, this paper used bibliometrics and geographic evolutionary tree analysis to determine the research trends of statistical methods for air pollution prediction between 1990 and 2018. The results showed that, during the study period, an increasing number of subjects have been involved in the prediction of air pollutants, such as “Environmental Sciences & Ecology”, “Meteorology & Atmospheric Sciences”, “Engineering”, and “Public, Environmental, & Occupational Health”. Since 2000, researchers have started to pay more attention to the influence of PM on air pollution. The results of this analysis suggest that studies that investigate the effect of the incidence rate of air pollution on the incidence of human diseases, city pollution exposure models, and land use regression methods are cited more frequently.
Among the research papers analyzed in this study, PM is the most widely studied pollutant, followed by NOx and O3. The most popular statistical prediction methods are artificial neural networks (ANNs), land use regression (LUR), multiple linear statistical analysis, and multi-method coupling models. Air pollution prediction involves quantifying the concentration and spatial distribution of air pollutants that may appear in the future, and its ultimate purpose is to prevent the occurrence of pollution-related hazards. Therefore, pollution prediction cannot be superficial. Studies of air pollution assessment and early warning are particularly important. Although, after years of effort, the accuracy of air pollution prediction has been increased, more work remains to be done. In the future, it is necessary to further study the interaction mechanisms between air pollutants, human health, and the urban environment.
By using bibliometrics and the evolutionary tree method, this paper determined the evolution of statistical research methods for major air pollutants between 1990 and 2018. The results show that the ANN method became an increasingly popular means to predict air pollution, and the interaction between different pollutants attracted increasing research attention, with PM + NOx and PM + O3 being the main combinations. Furthermore, the results indicate that, since 2010, hybrid methods have rapidly joined the mainstream of air pollution prediction and have been the fastest-developing research method through Markov chain analysis. It is predicted that the future statistical prediction of air pollution will be based on hybrid methods to predict composite pollutants and that the interaction between pollutants will be a key focus. The methods used in this study may be instructive to other studies and could provide efficient and economical methods to understand the past and future state of research on air pollution prediction.
Author Contributions
Conceptualization, K.L. and X.H.; project administration, K.L. and Y.R.; formal analysis, K.L., X.H. and H.D.; visualization, K.L., X.H. and H.D.; writing—original draft, X.H. and H.D.; writing—review and editing, K.L., X.H., Y.R., S.Z. and C.D. All authors have read and agreed to the published version of the manuscript.
Funding
This work was funded by the Open-End Fund of Fujian Province, China (grant number 2020KX03), the National Science Foundation of China (Grant Nos. 31670645, 31972951, 41801182, and 41807502), the National Social Science Fund (Grant No. 17ZDA058), the National Key Research Program of China (Grant No. 2016YFC0502704), Fujian Provincial Department of S&T Project (Grant No. 2018T3018), the Strategic Priority Research Program of the Chinese Academy of Sciences (Grant No. XDA23020502), the Ningbo Municipal Department of Science and Technology (Grant No. 2019C10056), the Xiamen Municipal Department of Science and Technology (Grant Nos. 3502Z20130037 and 3502Z20142016), the Key Laboratory of Urban Environment and Health of CAS (Grant No. KLUEH-C-201701), the Key Program of the Chinese Academy of Sciences (Grant No. KFZDSW-324), and the Youth Innovation Promotion Association CAS (Grant No. 2014267).
Acknowledgments
We want to thank the editor and anonymous reviewers for their valuable comments and suggestions to this paper.
Conflicts of Interest
The authors declare no conflict of interest.
Appendix A

Table A1.
The number of publications in the field of air pollutant prediction in the 10 disciplines that were most active in publishing studies in this field during three periods.
Table A1.
The number of publications in the field of air pollutant prediction in the 10 disciplines that were most active in publishing studies in this field during three periods.
| 1990–1999 | 2000–2009 | 2010–2018 | |||
|---|---|---|---|---|---|
| Subject Category | Number of Publications | Subject Category | Number of Publications | Subject Category | Number of Publications |
| Environmental Sciences & Ecology | 271 | Environmental Sciences & Ecology | 962 | Environmental Sciences & Ecology | 1957 |
| Meteorology & Atmospheric Sciences | 165 | Meteorology & Atmospheric Sciences | 527 | Meteorology & Atmospheric Sciences | 891 |
| Engineering | 93 | Engineering | 302 | Engineering | 507 |
| Public, Environmental, & Occupational Health | 55 | Public, Environmental, & Occupational Health | 175 | Public, Environmental, & Occupational Health | 408 |
| Toxicology | 31 | Toxicology | 128 | Science & Technology—Other Topics | 181 |
| Respiratory System | 19 | Computer Science | 81 | Toxicology | 143 |
| Mathematics | 19 | Mathematics | 66 | Mathematics | 123 |
| General & Internal Medicine | 18 | Water Resources | 49 | Chemistry | 100 |
| Computer Science | 17 | Chemistry | 38 | Computer Science | 99 |
| Energy & Fuels | 14 | Energy & Fuels | 37 | Geology | 91 |
Table A2.
The number of papers in the field of air pollutant prediction published by the 10 journals that were most active in publishing studies in this field during three periods.
Table A2.
The number of papers in the field of air pollutant prediction published by the 10 journals that were most active in publishing studies in this field during three periods.
| 1990–1999 | 2000–2009 | 2010–2018 | |||
|---|---|---|---|---|---|
| Journal | Number of Publications | Journal | Number of Publications | Journal | Number of Publications |
| Atmospheric Environment | 71 | Atmospheric Environment | 237 | Atmospheric Environment | 329 |
| Journal of the Air & Waste Management Association | 18 | Journal of Geophysical Research—Atmospheres | 70 | Atmospheric Chemistry and Physics | 179 |
| Journal of Geophysical Research—Atmospheres | 15 | Science of the Total Environment | 50 | Science of the Total Environment | 135 |
| Science of the Total Environment | 13 | Environmental Science & Technology | 47 | Environmental Science & Technology | 100 |
| Atmospheric Environment Part A—General Topics | 12 | Atmospheric Chemistry and Physics | 43 | Atmospheric Pollution Research | 73 |
| Environmental Science & Technology | 11 | International Journal of Environment and Pollution | 42 | Environmental Research | 70 |
| Environmental Pollution | 11 | Environmental Health Perspectives | 40 | Environmental Pollution | 69 |
| Water Air and Soil Pollution | 10 | Environmental Modelling & Software | 38 | Aerosol and Air Quality Research | 58 |
| Journal of Applied Meteorology | 9 | Journal of the Air & Waste Management Association | 34 | Environmental Health Perspectives | 55 |
| Environmental Health Perspectives | 9 | Environmental Monitoring and Assessment | 33 | Journal of Geophysical Research—Atmospheres | 55 |
Figure A1.
A cooperation map of research institutions producing studies involving air pollutant prediction from 1990 to 2018 (note: the node size in the figure represents the number of documents issued by the institution, and the connection between nodes represents the cooperation between institutions; the more connections, the closer the partnership).

Figure A2.
A co-citation map of the selected studies involving air pollutant prediction from 1990 to 2018 (note: each node represents a document, the node size represents the number of citations, and the connection between nodes represents the co-citation relationship).
Figure A2.
A co-citation map of the selected studies involving air pollutant prediction from 1990 to 2018 (note: each node represents a document, the node size represents the number of citations, and the connection between nodes represents the co-citation relationship).

Table A3.
Classification rules of the evolutionary tree.
| Symbol | Full Name | Explanation |
|---|---|---|
| PM | Particulate matter | Includes PM2.5 and PM10 |
| NOx | Nitrogen oxides | Includes NO2 and NO |
| O3 | Ozone | - |
| AQI | Air quality index | The names are all air quality indexes but the indexes defined in different articles may be different. |
| Multiple | Multiple pollutants | Multiple pollutants episodes, including at least one of PM, NOx, or O3. These three kinds of simultaneous multiple air pollutant forecasting cases are not included in this study. |
| ANN | Artificial neural network | Artificial neural network |
| ANFIS | Adaptive neuro-fuzzy inference system | Adaptive neuro-fuzzy inference system |
| SVM | Support vector machine | Includes support vector machine and support vector regression |
| RF | Random forest | Random forest |
| DL | Deep learn | Deep learning |
| PCA | Principal Component Analysis | Principal component analysis |
| LUR | Land use regression | Land use return |
| Kriging | Kriging interpolation method | Kriging spatial interpolation method |
| GP | Genetic programming | Genetic programming |
| PF | Probabilistic Forecasting | Probability prediction |
| ESM | Exponential Smoothing Method | Exponential smoothing method |
| ARIMA | Autoregressive integrated moving average model | Autoregressive comprehensive moving average model |
| FTS | Fuzzy time series | Fuzzy time series |
| MLR | Multi-linear regression | Multiple linear regression |
| GAM | Generalized additive model | Generalized additive model |
| GLM | Generalized linear models | Generalized linear models |
| Bayesian | Bayesian model | Bayesian models and other Bayesian-related models |
| Markov | Markov model | Markov models and Markov-related models |
| Gaussian | Gaussian process model | Gaussian process models and Gaussian-related models |
| Multiple | The abovementioned methods are used simultaneously, each method is used (not mixed), and the discussion is not biased to a particular method. | |
| Hybrid | Mixtures of the above methods |
References
- Goldberg, M.S.; Burnett, R.T.; Bailar, J.C., 3rd; Brook, J.; Bonvalot, Y.; Tamblyn, R.; Singh, R.; Valois, M.F. The association between daily mortality and ambient air particle pollution in Montreal, Quebec. 1. Nonaccidental mortality. Environ. Res. 2001, 86, 12–25. [Google Scholar] [CrossRef]
- Gan, W.Q.; Davies, H.W.; Koehoorn, M.; Brauer, M. Association of long-term exposure to community noise and traffic-related air pollution with coronary heart disease mortality. Am. J. Epidemiol. 2012, 175, 898–906. [Google Scholar] [CrossRef] [PubMed] [Green Version]
- Andersen, T.K.; Radcliffe, D.E.; Shepherd, J.M. Quantifying Surface Energy Fluxes in the Vicinity of Inland-Tracking Tropical Cyclones. J. Appl. Meteorol. Climatol. 2013, 52, 2797–2808. [Google Scholar] [CrossRef]
- Makkonen, M.; Berg, M.P.; Handa, I.T.; Hattenschwiler, S.; van Ruijven, J.; van Bodegom, P.M.; Aerts, R. Highly consistent effects of plant litter identity and functional traits on decomposition across a latitudinal gradient. Ecol. Lett. 2012, 15, 1033–1041. [Google Scholar] [CrossRef] [PubMed]
- Garaga, R.; Sahu, S.K.; Kota, S.H. A Review of Air Quality Modeling Studies in India: Local and Regional Scale. Curr. Pollut. Rep. 2018, 4, 59–73. [Google Scholar] [CrossRef]
- Hu, J.L.; Chen, J.J.; Ying, Q.; Zhang, H.L. One-year simulation of ozone and particulate matter in China using WRF/CMAQ modeling system. Atmos. Chem. Phys. 2016, 16, 10333–10350. [Google Scholar] [CrossRef] [Green Version]
- Mathur, R.; Xing, J.; Gilliam, R.; Sarwar, G.; Hogrefe, C.; Pleim, J.; Pouliot, G.; Roselle, S.; Spero, T.L.; Wong, D.C. Extending the Community Multiscale Air Quality (CMAQ) modeling system to hemispheric scales: Overview of process considerations and initial applications. Atmos. Chem. Phys. 2017, 17, 12449–12474. [Google Scholar] [CrossRef] [Green Version]
- Rafee, S.A.; Martins, L.D.; Kawashima, A.B.; Almeida, D.S.; Morais, M.; Souza, R.; Oliveira, M.B.L.; Souza, R.A.F.; Medeiros, A.S.S.; Urbina, V. Contributions of mobile, stationary and biogenic sources to air pollution in the Amazon rainforest: A numerical study with the WRF-Chem model. Atmos. Chem. Phys. 2017, 17, 7977–7995. [Google Scholar] [CrossRef] [Green Version]
- Zhang, Y.; Baklanov, A. Training Materials and Best Practices for Chemical Weather/Air Quality Forecasting; Report ETR-26; World Meteorological Organization: Geneva, Switzerland, 2020; Available online: https://library.wmo.int/index.php?lvl=notice_display&id=21801 (accessed on 18 May 2021).
- Rybarczyk, Y.; Zalakeviciute, R. Machine Learning Approaches for Outdoor Air Quality Modelling: A Systematic Review. Appl. Sci. 2018, 8, 2570. [Google Scholar] [CrossRef] [Green Version]
- Taheri Shahraiyni, H.; Sodoudi, S. Statistical Modeling Approaches for PM10 Prediction in Urban Areas; A Review of 21st-Century Studies. Atmosphere 2016, 7, 15. [Google Scholar] [CrossRef] [Green Version]
- Bai, L.; Wang, J.; Ma, X.; Lu, H. Air Pollution Forecasts: An Overview. Int. J. Environ. Res. Public Health 2018, 15, 780. [Google Scholar] [CrossRef] [Green Version]
- Wu, Z.F.; Ren, Y. A bibliometric review of past trends and future prospects in urban heat island research from 1990 to 2017. Environ. Rev. 2019, 27, 241–251. [Google Scholar] [CrossRef]
- Zuo, S.D.; Dou, P.F.; Ren, Y. Mapping sources of atmospheric pollution: Integrating spatial and cluster bibliometrics. Environ. Rev. 2020, 28, 1–11. [Google Scholar] [CrossRef]
- Franceschi, F.; Cobo, M.; Figueredo, M. Discovering relationships and forecasting PM10 and PM2.5 concentrations in Bogotá, Colombia, using Artificial Neural Networks, Principal Component Analysis, and k-means clustering. Atmos. Pollut. Res. 2018, 9, 912–922. [Google Scholar] [CrossRef]
- Weber, R.J.; Guo, H.; Russell, A.G.; Nenes, A. High aerosol acidity despite declining atmospheric sulfate concentrations over the past 15 years. Nat. Geosci. 2016, 9, 282–285. [Google Scholar] [CrossRef]
- Duan, C.; Zuo, S.; Wu, Z.; Qiu, Y.; Wang, J.; Lei, Y.; Liao, H.; Ren, Y. A review of research hotspots and trends in biogenic volatile organic compounds (BVOCs) emissions combining bibliometrics with evolution tree methods. Environ. Res. Lett. 2020, 16, 013003. [Google Scholar] [CrossRef]
- Hoek, G.; Kos, G.; Harrison, R.M.; de Hartog, J.; Meliefste, K.; ten Brink, H.; Katsouyanni, K.; Karakatsani, A.; Lianou, M.; Kotronarou, A.; et al. Indoor-outdoor relationships of particle number and mass in four European cities. Atmos. Environ. 2008, 42, 156–169. [Google Scholar] [CrossRef]
- Vienneau, D.; de Hoogh, K.; Beelen, R.; Fischer, P.; Hoek, G.; Briggs, D. Comparison of land-use regression models between Great Britain and the Netherlands. Atmos. Environ. 2010, 44, 688–696. [Google Scholar] [CrossRef]
- Briggs, D.J.; Collins, S.; Elliott, P.; Fischer, P.; Kingham, S.; Lebret, E.; Pryl, K.; VanReeuwijk, H.; Smallbone, K.; VanderVeen, A. Mapping urban air pollution using GIS: A regression-based approach. Int. J. Geogr. Inf. Sci. 1997, 11, 699–718. [Google Scholar] [CrossRef] [Green Version]
- Liao, D.P.; Peuquet, D.J.; Duan, Y.K.; Whitsel, E.A.; Dou, J.W.; Smith, R.L.; Lin, H.M.; Chen, J.C.; Heiss, G. GIS approaches for the estimation of residential-level ambient PM concentrations. Environ. Health Perspect. 2006, 114, 1374–1380. [Google Scholar] [CrossRef] [PubMed]
- Pope, C.A.; Thun, M.J.; Namboodiri, M.M.; Dockery, D.W.; Evans, J.S.; Speizer, F.E.; Heath, C.W. Particulate air-pollution as a predictor of mortality in a prospective-study of us adults. Am. J. Respir. Crit. Care Med. 1995, 151, 669–674. [Google Scholar] [CrossRef] [PubMed]
- Pope, C.A.; Burnett, R.T.; Thun, M.J.; Calle, E.E.; Krewski, D.; Ito, K.; Thurston, G.D. Lung cancer, cardiopulmonary mortality, and long-term exposure to fine particulate air pollution. J. Am. Med. Assoc. 2002, 287, 1132–1141. [Google Scholar] [CrossRef] [PubMed] [Green Version]
- Dockery, D.W.; Pope, C.A.; Xu, X.P.; Spengler, J.D.; Ware, J.H.; Fay, M.E.; Ferris, B.G.; Speizer, F.E. An association between air-pollution and mortality in 6 united-states cities. N. Engl. J. Med. 1993, 329, 1753–1759. [Google Scholar] [CrossRef] [PubMed] [Green Version]
- Dominici, F.; Peng, R.D.; Bell, M.L.; Pham, L.; McDermott, A.; Zeger, S.L.; Samet, J.M. Fine particulate air pollution and hospital admission for cardiovascular and respiratory diseases. J. Am. Med. Assoc. 2006, 295, 1127–1134. [Google Scholar] [CrossRef] [Green Version]
- Gardner, M.W.; Dorling, S.R. Artificial neural networks (the multilayer perceptron)—A review of applications in the atmospheric sciences. Atmos. Environ. 1998, 32, 2627–2636. [Google Scholar] [CrossRef]
- Byun, D.; Schere, K.L. Review of the governing equations, computational algorithms, and other components of the models-3 Community Multiscale Air Quality (CMAQ) modeling system. Appl. Mech. Rev. 2006, 59, 51–77. [Google Scholar] [CrossRef]
- Hu, J.; Jathar, S.; Zhang, H.; Ying, Q.; Chen, S.-H.; Cappa, C.D.; Kleeman, M.J. Long-term particulate matter modeling for health effect studies in California–Part 2: Concentrations and sources of ultrafine organic aerosols. Atmos. Chem. Phys. 2017, 17, 5379–5391. [Google Scholar] [CrossRef] [Green Version]
- Wang, Y.Y.; Li, Q.; Guo, Y.; Zhou, H.; Wang, X.; Wang, Q.; Shen, H.; Zhang, Y.; Yan, D.; Zhang, Y.; et al. Association of Long-term Exposure to Airborne Particulate Matter of 1 mum or Less With Preterm Birth in China. JAMA Pediatr. 2018, 172, e174872. [Google Scholar] [CrossRef] [PubMed] [Green Version]
- Alimissis, A.; Philippopoulos, K.; Tzanis, C.G.; Deligiorgi, D. Spatial estimation of urban air pollution with the use of artificial neural network models. Atmos. Environ. 2018, 191, 205–213. [Google Scholar] [CrossRef]
- Song, X.H.; Hopke, P.K. Analysis of source contributions to the ambient aerosol sample by simulated annealing. Chemom. Intell. Lab. Syst. 1996, 34, 275–281. [Google Scholar] [CrossRef]
- Perez, P.; Trier, A.; Reyes, J. Prediction of PM2.5 concentrations several hours in advance using neural networks in Santiago, Chile. Atmos. Environ. 2000, 34, 1189–1196. [Google Scholar] [CrossRef]
- Ceylan, Z.; Bulkan, S. Forecasting PM10 levels using ANN and MLR: A case study for Sakarya City. Global Nest J. 2018, 20, 281–290. [Google Scholar]
- Qiao, J.; Wang, G.; Li, X.; Li, W. A self-organizing deep belief network for nonlinear system modeling. Appl. Soft Comput. 2018, 65, 170–183. [Google Scholar] [CrossRef]
- Li, X.; Peng, L.; Yao, X.; Cui, S.; Hu, Y.; You, C.; Chi, T. Long short-term memory neural network for air pollutant concentration predictions: Method development and evaluation. Environ. Pollut. 2017, 231, 997–1004. [Google Scholar] [CrossRef] [PubMed]
- Ross, Z.; Jerrett, M.; Ito, K.; Tempalski, B.; Thurston, G. A land use regression for predicting fine particulate matter concentrations in the New York City region. Atmos. Environ. 2007, 41, 2255–2269. [Google Scholar] [CrossRef]
- Li, R.; Ma, T.; Xu, Q.; Song, X. Using MAIAC AOD to verify the PM2.5 spatial patterns of a land use regression model. Environ. Pollut. 2018, 243, 501–509. [Google Scholar] [CrossRef]
- Liu, W.; Li, X.; Chen, Z.; Zeng, G.; León, T.; Liang, J.; Huang, G.; Gao, Z.; Jiao, S.; He, X.; et al. Land use regression models coupled with meteorology to model spatial and temporal variability of NO2 and PM10 in Changsha, China. Atmos. Environ. 2015, 116, 272–280. [Google Scholar] [CrossRef]
- Ng, K.Y.; Awang, N. Multiple linear regression and regression with time series error models in forecasting PM10 concentrations in Peninsular Malaysia. Environ. Monit. Assess. 2018, 190, 63. [Google Scholar] [CrossRef]
- Dimitriou, K.; Kassomenos, P. A study on the reconstitution of daily PM10 and PM2.5 levels in Paris with a multivariate linear regression model. Atmos. Environ. 2014, 98, 648–654. [Google Scholar] [CrossRef]
- Dimitriou, K. Upgrading the Estimation of Daily PM10 Concentrations Utilizing Prediction Variables Reflecting Atmospheric Processes. Aerosol Air Qual. Res. 2016, 16, 2245–2254. [Google Scholar] [CrossRef] [Green Version]
- Hou, X.; Fei, D.; Kang, H.; Zhang, Y.; Gao, J. Seasonal statistical analysis of the impact of meteorological factors on fine particle pollution in China in 2013–2017. Nat. Hazards 2018, 93, 677–698. [Google Scholar] [CrossRef]
- Garcia Nieto, P.J.; Sanchez Lasheras, F.; Garcia-Gonzalo, E.; de Cos Juez, F.J. PM10 concentration forecasting in the metropolitan area of Oviedo (Northern Spain) using models based on SVM, MLP, VARMA and ARIMA: A case study. Sci. Total Environ. 2018, 621, 753–761. [Google Scholar] [CrossRef] [PubMed]
- Yang, Y.; Christakos, G. Uncertainty assessment of heavy metal soil contamination mapping using spatiotemporal sequential indicator simulation with multi-temporal sampling points. Environ. Monit. Assess. 2015, 187, 187. [Google Scholar] [CrossRef] [PubMed]
- Zhou, Q.; Jiang, H.; Wang, J.; Zhou, J. A hybrid model for PM2.5 forecasting based on ensemble empirical mode decomposition and a general regression neural network. Sci. Total Environ. 2014, 496, 264–274. [Google Scholar] [CrossRef] [PubMed]
- Lu, W.Z.; Wang, W.J.; Wang, X.K.; Yan, S.H.; Lam, J.C. Potential assessment of a neural network model with PCA/RBF approach for forecasting pollutant trends in Mong Kok urban air, Hong Kong. Environ. Res 2004, 96, 79–87. [Google Scholar] [CrossRef]
- Voukantsis, D.; Karatzas, K.; Kukkonen, J.; Rasanen, T.; Karppinen, A.; Kolehmainen, M. Intercomparison of air quality data using principal component analysis, and forecasting of PM10 and PM2.5 concentrations using artificial neural networks, in Thessaloniki and Helsinki. Sci. Total Environ. 2011, 409, 1266–1276. [Google Scholar] [CrossRef] [PubMed]
- Feng, X.; Li, Q.; Zhu, Y.; Hou, J.; Jin, L.; Wang, J. Artificial neural networks forecasting of PM2.5 pollution using air mass trajectory based geographic model and wavelet transformation. Atmos. Environ. 2015, 107, 118–128. [Google Scholar] [CrossRef]
- Chen, D.; Xu, T.; Li, Y.; Zhou, Y.; Lang, J.; Liu, X.; Shi, H. A Hybrid Approach to Forecast Air Quality during High-PM Concentration Pollution Period. Aerosol Air Qual. Res. 2015, 15, 1325–1337. [Google Scholar] [CrossRef] [Green Version]
- Wu, C.D.; Zeng, Y.T.; Lung, S.C. A hybrid kriging/land-use regression model to assess PM2.5 spatial-temporal variability. Sci. Total Environ. 2018, 645, 1456–1464. [Google Scholar] [CrossRef]
- Xu, S.; Zou, B.; Shafi, S.; Sternberg, T. A hybrid Grey-Markov/ LUR model for PM10 concentration prediction under future urban scenarios. Atmos. Environ. 2018, 187, 401–409. [Google Scholar] [CrossRef]
- Fast, J.D.; Zhong, S. Meteorological factors associated with inhomogeneous ozone concentrations within the Mexico City basin. J. Geophys. Res. Atmos. 1998, 103, 18927–18946. [Google Scholar] [CrossRef]
- Wotawa, G.; Stohl, A.; Neininger, B. The urban plume of Vienna: Comparisons between aircraft measurements and photochemical model results. Atmos. Environ. 1998, 32, 2479–2489. [Google Scholar] [CrossRef]
- Abdul-Wahab, S.; Bouhamra, W.; Ettouney, H.; Sowerby, B.; Crittenden, B.D. Predicting ozone levels—A statistical model for predicting ozone levels in the Shuaiba Industrial Area, Kuwait. Environ. Sci. Pollut. Res. 1996, 3, 195–204. [Google Scholar] [CrossRef]
- Nghiem-Buffet, S.; Cohen, S.Y. Retinal vein occlusion: Anti-VEGF treatments. J. Fr. D’ophtalmologie 2009, 32, 679–686. [Google Scholar] [CrossRef]
- Gao, M.; Yin, L.; Ning, J. Artificial neural network model for ozone concentration estimation and Monte Carlo analysis. Atmos. Environ. 2018, 184, 129–139. [Google Scholar] [CrossRef]
- Wang, W.; Lu, W.; Wang, X.; Leung, A.Y.T. Prediction of maximum daily ozone level using combined neural network and statistical characteristics. Environ. Int. 2003, 29, 555–562. [Google Scholar] [CrossRef]
- Ortiz-García, E.G.; Salcedo-Sanz, S.; Pérez-Bellido, Á.M.; Portilla-Figueras, J.A.; Prieto, L. Prediction of hourly O3 concentrations using support vector regression algorithms. Atmos. Environ. 2010, 44, 4481–4488. [Google Scholar] [CrossRef]
- Zhan, Y.; Luo, Y.; Deng, X.; Grieneisen, M.L.; Zhang, M.; Di, B. Spatiotemporal prediction of daily ambient ozone levels across China using random forest for human exposure assessment. Environ. Pollut. 2018, 233, 464–473. [Google Scholar] [CrossRef]
- Di, Q.; Rowland, S.; Koutrakis, P.; Schwartz, J. A hybrid model for spatially and temporally resolved ozone exposures in the continental United States. J. Air Waste Manag. Assoc. 2017, 67, 39–52. [Google Scholar] [CrossRef] [Green Version]
- Durão, R.M.; Mendes, M.T.; João Pereira, M. Forecasting O3 levels in industrial area surroundings up to 24 h in advance, combining classification trees and MLP models. Atmos. Pollut. Res. 2016, 7, 961–970. [Google Scholar] [CrossRef] [Green Version]
- Tan, K.C.; Lim, H.S.; Mat Jafri, M.Z. Multiple regression analysis in modeling of columnar ozone in Peninsular Malaysia. Environ. Sci. Pollut. Res. Int. 2014, 21, 7567–7577. [Google Scholar] [CrossRef]
- Novotny, E.V.; Bechle, M.J.; Millet, D.B.; Marshall, J.D. National satellite-based land-use regression: NO2 in the United States. Environ. Sci. Technol. 2011, 45, 4407–4414. [Google Scholar] [CrossRef] [PubMed]
- Huang, L.; Zhang, C.; Bi, J. Development of land use regression models for PM2.5, SO2, NO2 and O3 in Nanjing, China. Environ. Res. 2017, 158, 542–552. [Google Scholar]
- Michanowicz, D.R.; Shmool, J.L.C.; Tunno, B.J.; Tripathy, S.; Gillooly, S.; Kinnee, E.; Clougherty, J.E. A hybrid land use regression/AERMOD model for predicting intra-urban variation in PM2.5. Atmos. Environ. 2016, 131, 307–315. [Google Scholar] [CrossRef]
- Mavko, M.E.; Tang, B.; George, L.A. A sub-neighborhood scale land use regression model for predicting NO2. Sci. Total Environ. 2008, 398, 68–75. [Google Scholar] [CrossRef] [PubMed]
- Arain, M.A.; Blair, R.; Finkelstein, N.; Brook, J.R.; Sahsuvaroglu, T.; Beckerman, B.; Zhang, L.; Jerrett, M. The use of wind fields in a land use regression model to predict air pollution concentrations for health exposure studies. Atmos. Environ. 2007, 41, 3453–3464. [Google Scholar] [CrossRef]
- Li, X.; Liu, W.; Chen, Z.; Zeng, G.; Hu, C.; León, T.; Liang, J.; Huang, G.; Gao, Z.; Li, Z.; et al. The application of semicircular-buffer-based land use regression models incorporating wind direction in predicting quarterly NO2 and PM10 concentrations. Atmos. Environ. 2015, 103, 18–24. [Google Scholar] [CrossRef]
- Weissert, L.F.; Salmond, J.A.; Miskell, G.; Alavi-Shoshtari, M.; Williams, D.E. Development of a microscale land use regression model for predicting NO2 concentrations at a heavy trafficked suburban area in Auckland, NZ. Sci. Total Environ. 2018, 619–620, 112–119. [Google Scholar] [CrossRef]
- Young, M.T.; Bechle, M.J.; Sampson, P.D.; Szpiro, A.A.; Marshall, J.D.; Sheppard, L.; Kaufman, J.D. Satellite-Based NO2 and Model Validation in a National Prediction Model Based on Universal Kriging and Land-Use Regression. Environ. Sci. Technol. 2016, 50, 3686–3694. [Google Scholar] [CrossRef] [PubMed] [Green Version]
- Araki, S.; Shima, M.; Yamamoto, K. Spatiotemporal land use random forest model for estimating metropolitan NO2 exposure in Japan. Sci. Total Environ. 2018, 634, 1269–1277. [Google Scholar] [CrossRef]
- Wu, L.; Li, N.; Yang, Y. Prediction of air quality indicators for the Beijing-Tianjin-Hebei region. J. Clean. Prod. 2018, 196, 682–687. [Google Scholar] [CrossRef]
- Gupta, S.; Pebesma, E.; Degbelo, A.; Costa, A. Optimising Citizen-Driven Air Quality Monitoring Networks for Cities. ISPRS Int. J. Geo-Inf. 2018, 7, 468. [Google Scholar] [CrossRef] [Green Version]
- Tong, C.H.M.; Yim, S.H.L.; Rothenberg, D.; Wang, C.; Lin, C.-Y.; Chen, Y.D.; Lau, N.C. Assessing the impacts of seasonal and vertical atmospheric conditions on air quality over the Pearl River Delta region. Atmos. Environ. 2018, 180, 69–78. [Google Scholar] [CrossRef]
- Yang, Z.; Wang, J. A new air quality monitoring and early warning system: Air quality assessment and air pollutant concentration prediction. Environ. Res 2017, 158, 105–117. [Google Scholar] [CrossRef] [PubMed]
- Benmerad, M.; Slama, R.; Botturi, K.; Claustre, J.; Roux, A.; Sage, E.; Reynaud-Gaubert, M.; Gomez, C.; Kessler, R.; Brugiere, O.; et al. Chronic effects of air pollution on lung function after lung transplantation in the Systems prediction of Chronic Lung Allograft Dysfunction (SysCLAD) study. Eur. Respir. J. 2017, 49, 1600206. [Google Scholar] [CrossRef] [PubMed] [Green Version]
- Warren, J.L.; Stingone, J.A.; Herring, A.H.; Luben, T.J.; Fuentes, M.; Aylsworth, A.S.; Langlois, P.H.; Botto, L.D.; Correa, A.; Olshan, A.F.; et al. Bayesian multinomial probit modeling of daily windows of susceptibility for maternal PM2.5 exposure and congenital heart defects. Stat. Med. 2016, 35, 2786–2801. [Google Scholar] [CrossRef] [Green Version]
- Harris, M.H.; Gold, D.R.; Rifas-Shiman, S.L.; Melly, S.J.; Zanobetti, A.; Coull, B.A.; Schwartz, J.D.; Gryparis, A.; Kloog, I.; Koutrakis, P.; et al. Prenatal and childhood traffic-related air pollution exposure and childhood executive function and behavior. Neurotoxicol. Teratol. 2016, 57, 60–70. [Google Scholar] [CrossRef] [Green Version]
- Tiwari, A.; Singh, S.; Nagar, R. Feasibility assessment for partial replacement of fine aggregate to attain cleaner production perspective in concrete: A review. J. Clean. Prod. 2016, 135, 490–507. [Google Scholar] [CrossRef]
- Jiang, K.; Liao, Q.M.; Xiong, Y. A novel white blood cell segmentation scheme based on feature space clustering. Soft Comput. 2006, 10, 12–19. [Google Scholar] [CrossRef]
- Leng, X.; Qian, X.; Yang, M.; Wang, C.; Li, H.; Wang, J. Leaf magnetic properties as a method for predicting heavy metal concentrations in PM2.5 using support vector machine: A case study in Nanjing, China. Environ. Pollut. 2018, 242, 922–930. [Google Scholar] [CrossRef]
Figure 1.
The number of published studies on the prediction of air pollutants and its main disciplines from 1990 to 2018.
Figure 1.
The number of published studies on the prediction of air pollutants and its main disciplines from 1990 to 2018.

Figure 2.
A co-occurrence map of keywords in the selected papers involving air pollutant prediction from 1990 to 2018 (note: the node size in the figure represents the frequency of keywords, and the connection between nodes represents the co-occurrence of keywords; the more connections, the closer the relationship).

Figure 3.
Evolutionary tree of air pollution prediction research from 1990 to 2018 (note: “a” represents artificial neural network (ANN), “b” represents multiple linear regression (MLR), “c” represents the Lagrangian, “d” represents the Gaussian, “e” represents correlation, “f” represents multiple (using multiple methods for comparison), “g” represents land use regression (LUR), “h” represents Bayesian, “i” represents the autoregressive comprehensive moving average model (ARIMA), “j” represents the generalized additive model (GAM), “k” represents support vector machine (SVM), and “l” represents hybrid (combining multiple methods for prediction).

Figure 4.
The numbers in the circles represent the number of published papers that use a certain research method for the prediction of the pollutant shown at the top of the column. The arrows coupled with two numbers in parentheses represent the change trend of the number of published studies from 2000–2009 to 2010–2018; the first number represents the number of prediction methods with this type of change and the second number represents the difference between the average number of papers published in 2000–2009 and 2010–2018.

Table 1.
Data sources.
| Database | Web of Science Core Collection |
|---|---|
| Retrieval method | TS = ((“air pollutants” OR “air pollution” OR “atmospheric pollutants” OR “atmospheric pollutant”) AND (Predict OR Prediction OR Forecast OR Forecasts)) |
| Timespan | 1990–2018 |
| Document type | Articles and reviews |
Publisher’s Note: MDPI stays neutral with regard to jurisdictional claims in published maps and institutional affiliations. |
© 2021 by the authors. Licensee MDPI, Basel, Switzerland. This article is an open access article distributed under the terms and conditions of the Creative Commons Attribution (CC BY) license (https://creativecommons.org/licenses/by/4.0/).
Share and Cite
MDPI and ACS Style
Liao, K.; Huang, X.; Dang, H.; Ren, Y.; Zuo, S.; Duan, C. Statistical Approaches for Forecasting Primary Air Pollutants: A Review. Atmosphere 2021, 12, 686. https://0-doi-org.brum.beds.ac.uk/10.3390/atmos12060686
AMA Style
Liao K, Huang X, Dang H, Ren Y, Zuo S, Duan C. Statistical Approaches for Forecasting Primary Air Pollutants: A Review. Atmosphere. 2021; 12(6):686. https://0-doi-org.brum.beds.ac.uk/10.3390/atmos12060686
Chicago/Turabian StyleLiao, Kuo, Xiaohui Huang, Haofei Dang, Yin Ren, Shudi Zuo, and Chensong Duan. 2021. "Statistical Approaches for Forecasting Primary Air Pollutants: A Review" Atmosphere 12, no. 6: 686. https://0-doi-org.brum.beds.ac.uk/10.3390/atmos12060686
Note that from the first issue of 2016, this journal uses article numbers instead of page numbers. See further details here.