
Performance Evaluation of IMERG GPM Products during Tropical Storm Imelda


Department of Civil & Environmental Engineering, The University of Texas at San Antonio, One UTSA Circle, San Antonio, TX 78249, USA
*
Author to whom correspondence should be addressed.
Atmosphere 2021, 12(6), 687; https://0-doi-org.brum.beds.ac.uk/10.3390/atmos12060687
Submission received: 5 May 2021
/
Revised: 20 May 2021
/
Accepted: 24 May 2021
/
Published: 27 May 2021
(This article belongs to the Special Issue Weather Conditions Triggering Floods)
Abstract
:Tropical Storm Imelda struck the southeast coastal regions of Texas from 17–19 September, 2019, and delivered precipitation above 500 mm over about 6000 km2. The performance of the three IMERG (Early-, Late-, and Final-run) GPM satellite-based precipitation products was evaluated against Stage-IV radar precipitation estimates. Basic and probabilistic statistical metrics, such as CC, RSME, RBIAS, POD, FAR, CSI, and PSS were employed to assess the performance of the IMERG products. The products captured the event adequately, with a fairly high POD value of 0.9. The best product (Early-run) showed an average correlation coefficient of 0.60. The algorithm used to produce the Final-run improved the quality of the data by removing systematic errors that occurred in the near-real-time products. Less than 5 mm RMSE error was experienced in over three-quarters (ranging from 73% to 76%) of the area by all three IMERG products in estimating the Tropical Storm Imelda. The Early-run product showed a much better RBIAS relatively to the Final-run product. The overall performance was poor, as areas with an acceptable range of RBIAS (i.e., between −10% and 10%) in all the three IMERG products were only 16% to 17% of the total area. Overall, the Early-run product was found to be better than Late- and Final-run.
Keywords:
satellite data; GPM; IMERG; radar; Imelda; rainfall estimates; precipitation; remote sensing; performance evaluation1. Introduction
The U.S. has faced around 258 weather and climate disasters, each of which reached an overall damage exceeding a billion dollars, since 1980. The National Centers for Environmental Information (NCEI), a subsidiary of the National Oceanic and Atmospheric Association (NOAA), records weather and climate events with significant economic and societal impacts in the United States [1]. The total cost of all of these disasters exceeded an estimated damage cost of 1.75 trillion dollars. During 2019 alone, the U.S. experienced 14 separate billion-dollar disasters, and 2019 was marked as the fifth consecutive year (2015–2019) in recorded history with 10 or more individual billion-dollar disasters [1]. The natural disasters in 2019 included: three major inland floods, eight severe storms, two tropical cyclones or depressions (Dorian and Imelda), and one major wildfire event; totaling an overall damage cost exceeding 14 billion dollars [1]. The state of Texas currently leads the nation in the total number of billion-dollar disasters since 1980, with a total estimated damage cost of around 250 billion dollars [2]. In recent history, Texas has experienced some of the nation’s deadliest and most expensive natural disasters, such as the Memorial Day Flood (2015), Tax Day Flood (2016), Hurricane Harvey (2017), The Great June Flood (2018), and Tropical Storm Imelda (2019) [3]. Major drivers of these natural disasters were extreme precipitation and heavy downpour, which have left scientists and researchers looking for solutions to better model and predict such extreme scenarios. About three billion or nearly half of the world’s population lives in coastal areas, and in the United States the southern coastal states like Louisiana, Florida, and Texas face recurring extreme hydrological events [4,5,6]. In the future, Texas will likely face similar extreme natural disasters, and the need for accurate precipitation estimates is key to better understand and model these hydrological scenarios.
The National Hurricane Center started monitoring an area of disturbed weather for possible tropical development near the west coast of Florida on 14 September 2019 [7]. The area of disturbed weather had moved westward by 16 September, reaching the coast of Southeast Texas and Southeast Louisiana. Before daybreak on 17 September, the disturbed weather area underwent significant organization and was being observed by the GOES satellite and the Houston, TX and Lake Charles, and LA WSR-88D radars. By midday, the weather area strengthened, and soon after, it was classified as Tropical Storm Imelda by the National Hurricane Center (NHC) tropical cyclone update. Around 1:30 PM on 17 September 2019, Tropical Storm Imelda made landfall near Freeport, Texas, and was weakened to a tropical depression by the evening. It moved inland shortly after and hovered between Houston and Lufkin in Texas throughout 19 September. During the stalling of Imelda over Southeast Texas, precipitation events caused significant flooding in the Houston and Galveston areas. Along the I-10 corridor from Winnie eastward to Fannett, Beaumont, Vidor, and Orange Texas faced devastating flooding in many areas. Tropical Storm Imelda was the fifth wettest tropical cyclone in the history of the continental United States and the fourth wettest in the state of Texas [7]. It inflicted damage worth over 5 billion dollars [7]. To analyze the impacts of these severe natural disasters, scientists have been trying to evaluate different precipitation estimate tools in terms of their performance and accuracy.
Precipitation modeling is an essential part of weather prediction, hydrological analysis, climate modeling, and agricultural applications [8,9,10]. Accurate precipitation predictions are crucial for the analysis of impacts caused by natural disasters such as hurricanes, tropical storms, and tornadoes [11]. Obtaining reliable and accurate precipitation data has been a challenge for scientists and users, even though precipitation data is vital for many environmental and hydrological analyses [12,13]. To verify and enhance predictions, precipitation measurements are generally obtained through rain gauges, weather radars, and satellite sensors [14,15]. All of these data sources provide measurements with specific spatiotemporal resolutions and are distinguished by their instrumental and environmental uncertainty. The difference in the spatiotemporal resolutions of the data introduces a novel challenge for the comparative evaluation of the measurements in hydrological modeling and analysis studies [16].
Historically, rain gauges have been the main source of precipitation data with variable temporal frequencies at ground level. Rain gauge measurements are considered to be ground-truth observations at the point level in comparison to radar and satellite sensors [17]. Conversely, the sparse distribution of rain gauges makes it harder to interpret the actual precipitation for coverage over larger areas [18,19]. Spatial interpolation of the gauge data in mountainous regions is more challenging, considering the geography of the landscape [20]. The use of ground-based radar allows users to have a higher spatiotemporal resolution of the precipitation data and increases the understanding of storm structures and precipitation estimates. However, the acquisition of radar data is sometimes limited in mountainous regions, as the terrain complexity and radar beam obstruction effects distort the measurements [21,22,23,24,25,26,27,28]. Moreover, the construction and maintenance of radar systems in difficult terrain is expensive and unfeasible for almost every country [29]. Combining the strengths and weaknesses of both measurement systems, methods such as Bayesian combination or conditional merging, ordinary kriging correction, and mean bias correction have been developed for better precipitation estimates [30,31,32,33].
The Global Precipitation Measurement (GPM) mission, a successor of the Tropical Rainfall Measuring Mission (TRMM), has been providing precipitation estimates since 2014 [29]. Precipitation estimates using the GPM satellite constellation have major advantages over the other previous satellite precipitation products in terms of global spatial coverage and temporal and spatial resolution [29]. After the introduction of the Integrated Multi-Satellite Retrievals for the Global Precipitation Mission (IMERG) products in 2014, the use of satellite-based precipitation estimates in hydrologic applications has seen great interest from researchers. Researchers have validated the IMERG products using ground-based observations (radar and rain gauges) and found an overall improvement in precipitation estimates over previous similar products, such as TRMM, PERSIANN, CMORPH, GSMAP, and MSWEP [34,35]. Stage-IV radar data have been widely used as a validation dataset to evaluate the performance of the IMERG products, as researchers aim to improve the algorithm of the IMERG products [36,37,38,39]. Data acquisition from the satellite-based measurements can be almost real-time, with only a 4-hr latency between capture and acquisition and 3.5 months latency for the availability of post-real-time research data. IMERG GPM precipitation product estimates overcome the limitations of both gauge and radar systems by warranting real-time data and global spatial coverage [29]. These products are less affected by localized weather or terrain conditions during weather events such as storms, tornadoes, and flooding, and by other technical issues, than measurements obtained with ground-based radar instruments. Although these products provide precipitation estimates with near-global spatial coverage, especially valuable for mountainous regions, the spatial resolution is still rather coarse [40,41,42,43]. Hence, many researchers have tried to evaluate and validate the performance of IMERG GPM precipitation estimates in different hydrological scenarios and applications [29]. Detailed analysis of the IMERG GPM precipitation estimates and quantification of the errors associated with these products will contribute towards both hydrology and climatology applications if IMERG is used as reference data for poorly instrumented or remote regions [44].
Although IMERG products provide almost global spatial coverage and high temporal resolution, earlier studies have shown unsatisfactory performance of their estimates in Northern China and the Indian subcontinent based on seasonal variations [45,46,47]. The inconsistency of the IMERG products’ performance over various regions can be attributed to various sources of errors, which were investigated in multiple error modeling studies [48,49,50,51,52]. Owing to their limitations in terms of spatial resolution and performance inconsistencies, the need remains for the evaluation of IMERG GPM products at regional scales and under major precipitation and flood events, such as hurricanes and tropical storms [53].
Accurate precipitation estimates of major natural disasters are immensely important for many hydrological applications. Better prediction and modeling of the hydrological events will provide key insights for environmental design and will offer opportunities to influence policy and planning for resilient infrastructure networks during crisis events [54,55,56,57,58,59]. Therefore, researchers need to assess the performance of the IMERG GPM products during severe natural disasters and evaluate their potential for filling crucial precipitation measurement gaps [40,47,48,60,61]. The objective of this study was to evaluate the performance of the IMERG GPM products at a local scale in southeast Texas, which is vulnerable to hurricane and storm events. The study also focused on assessing the performance accuracy of GPM satellite-based precipitation products during the Imelda Tropical Storm that made its landfall on 17 September 2019. Section 2 provides a detailed description of the study area, the datasets used, and the methodology, while Section 3 elaborates the results and relevant discussion on the findings. Section 4 represents the study conclusions.
2. Materials and Methods
2.1. Study Area
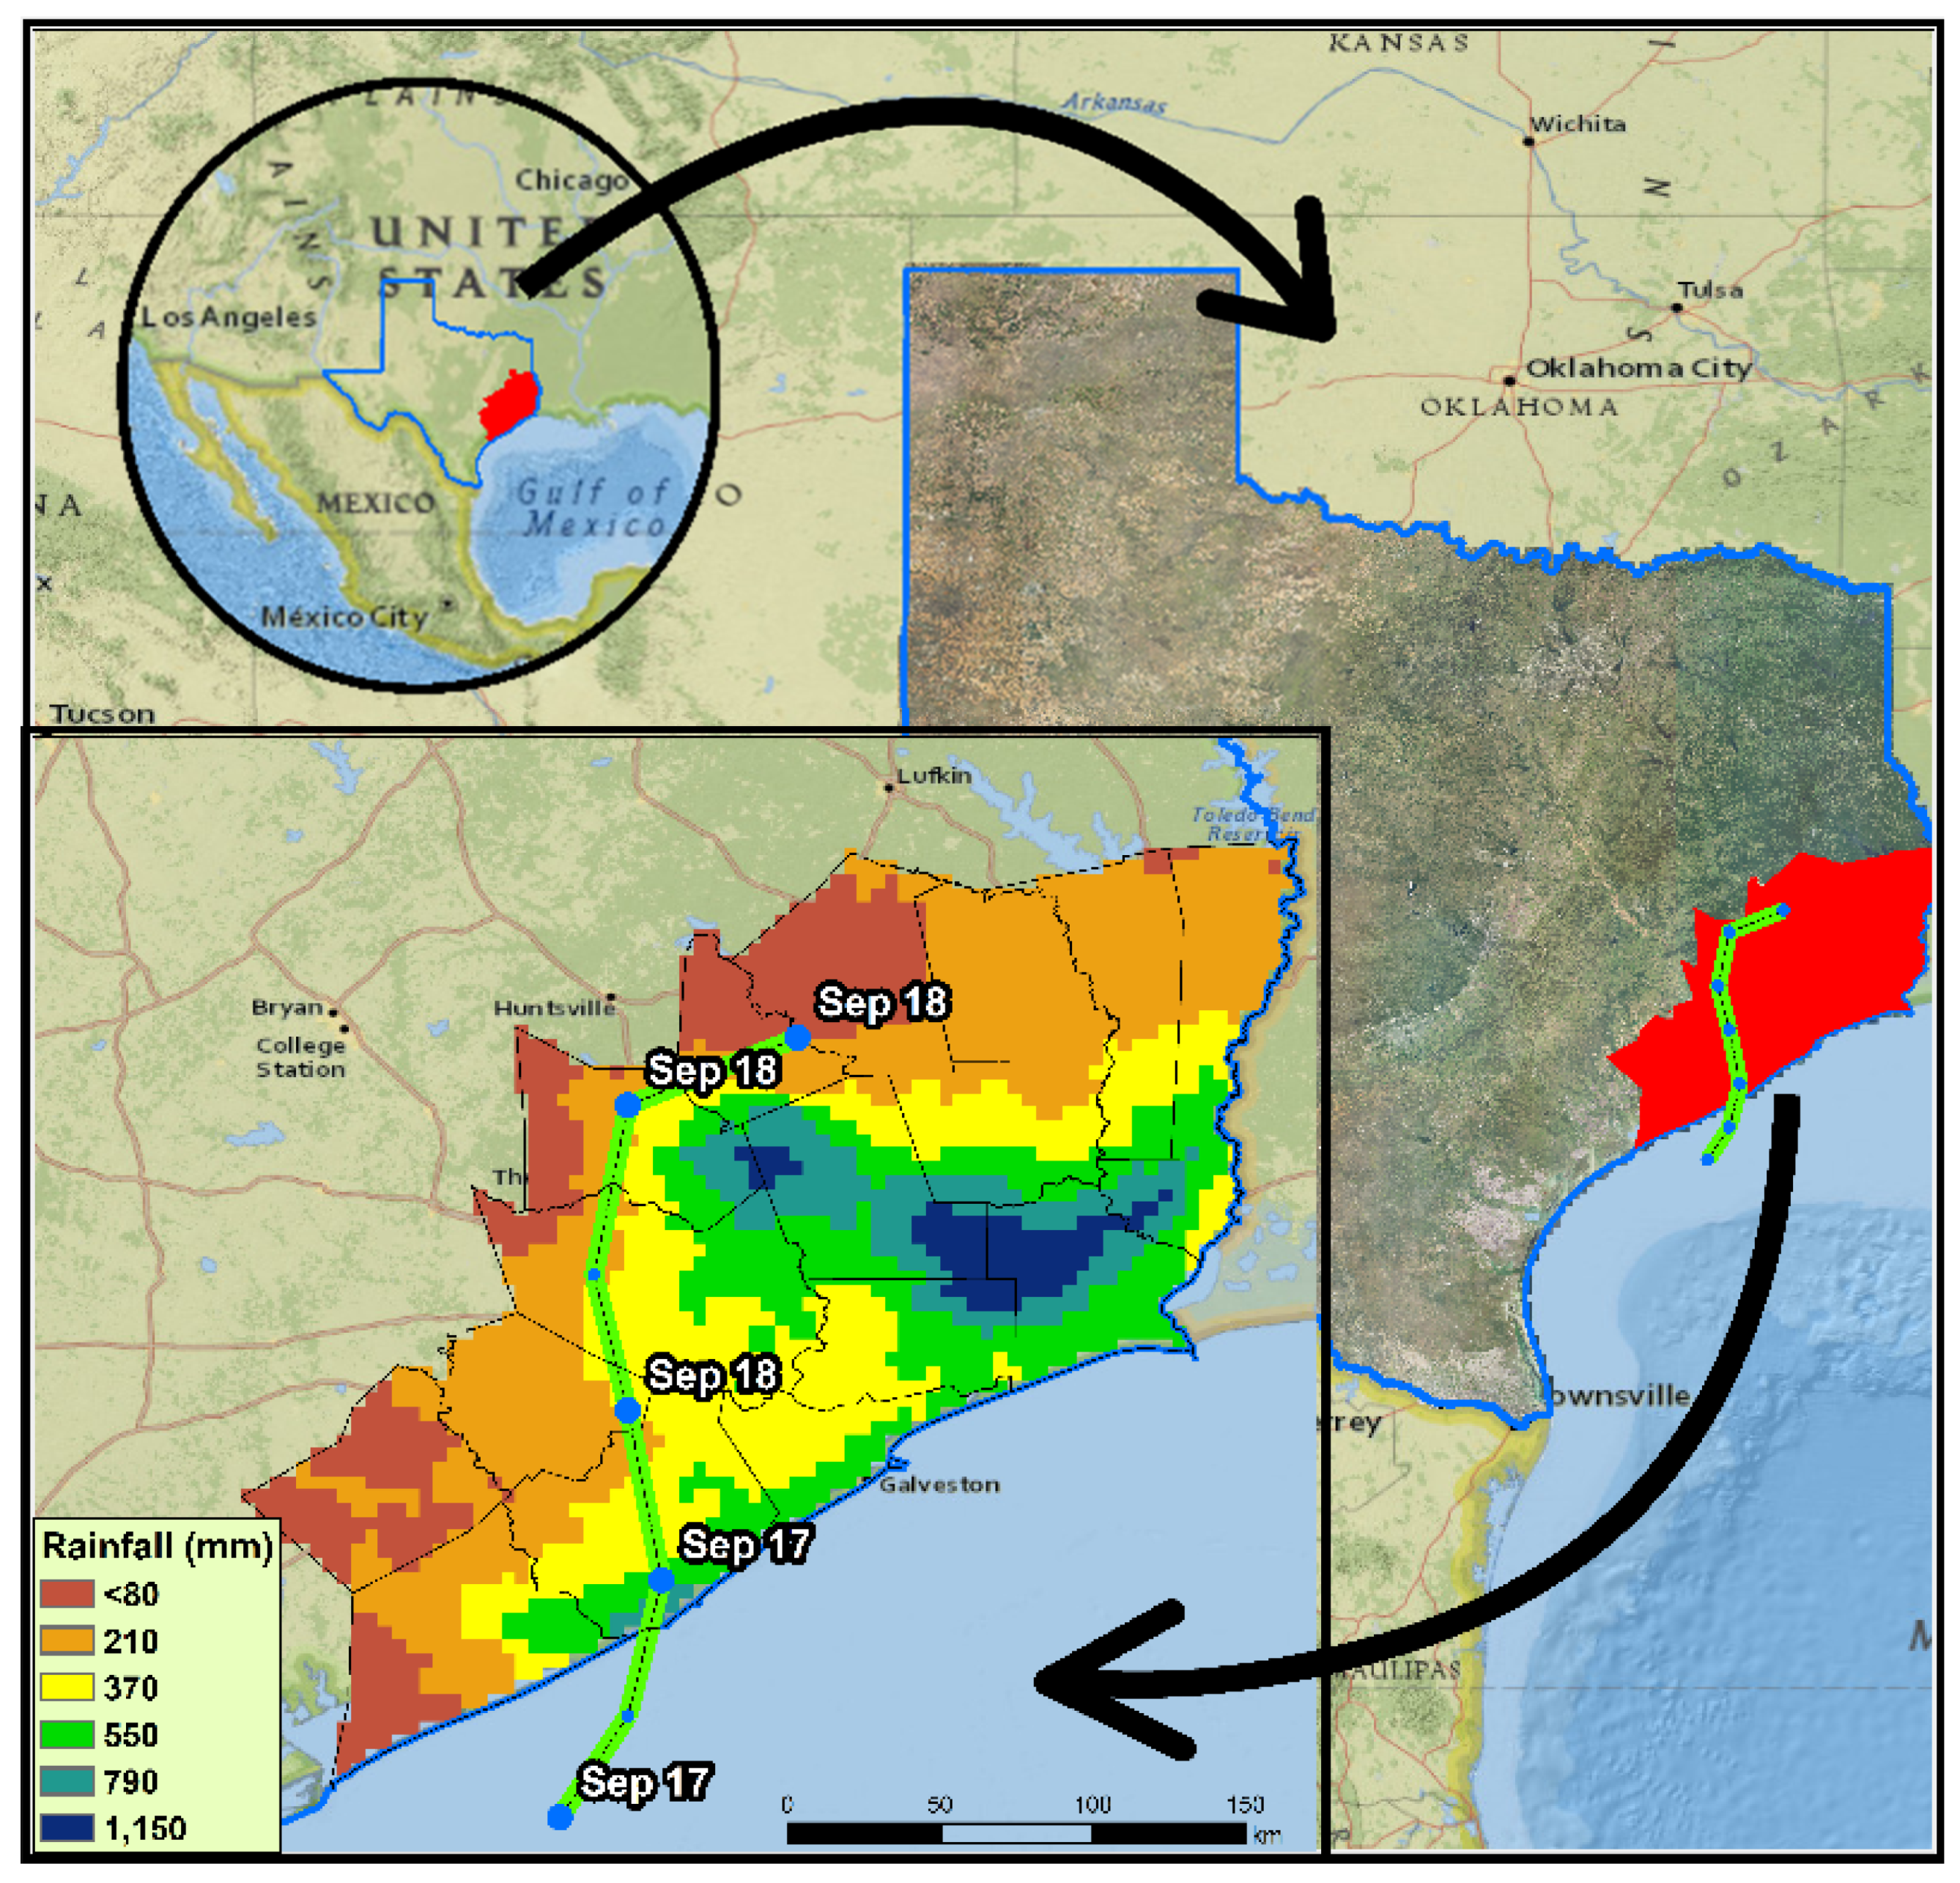
The current study area focuses on the southeast region of the state of Texas, the largest state in the contiguous United States, with three climatic regions. The regions differ from each other based on hydrometeorological conditions, topography and land cover. The western region is typically arid and dry, the central and eastern regions are under humid climatic conditions, and the southeastern region is predominantly wet, with subtropical weather conditions [15,62,63]. The southeast region is one of the most vulnerable regions in the United States to extreme precipitation events such as hurricanes, tropical storms, and flash-floods. Tropical Storm Imelda struck the southeast coastal regions of Texas and caused massive flooding in the Houston and Galveston areas extending along the I-10 corridor from Winnie eastward to Fannett, Beaumont, Vidor, and Orange Texas. It was the second most expensive natural disaster in the contiguous United States in 2019 costing a total of 3.5 billion. Our current study area ranges from 93.4° to 106.7° West in longitude and 25.7° to 36.6° North in latitude. Within this study area, data from radar and GPM IMERG products were used for precipitation estimate analysis. Figure 1 shows the path tracking of the storm as it made landfall in Freeport, TX on 17 September 2019, and continued inward in the latter days.
2.2. Precipitation Data
The IMERG GPM data was downloaded from the Precipitation Measurement Missions website that uses the algorithm version V06B (http://pmm.nasa.gov/data-access/downloads/gpm/ accessed on 22 March 2020). The IMERG is the unified U.S. algorithm that provides the multi-satellite precipitation product for the U.S. GPM team. The IMERG GPM is available in three products, namely Early, Late, and Final. All of the IMERG products have a temporal resolution of one hour and a spatial resolution of 0.1° × 0.1°. The Early-run product is produced with the first run of the IMERG algorithm, which has a latency of about 4 h from the observation time. Another product is produced when the algorithm is run for the second time, with more information from the satellites at a latency of about 14 h. This product is called Late-run. The Final-run product is developed when the monthly gauge analysis data is obtained, and it has a latency period of about 3.5 months from the observation time. The baseline for the post-real-time Final-run half-hour estimates is calibrated so that they sum to the monthly satellite-gauge Final-run combination. This product is developed mainly for research purposes. The Final-run product is adjusted with a gauge-network which converts it to a more accurate product relative to the Early- and Late-run products. Since the radar products have an hourly temporal resolution, the IMERG products used in this study were also converted to an hourly format at the end of each hour.
The National Weather Service/National Centers for Environmental Prediction (NWS/NCEP) Stage-IV Quantitative Precipitation Estimates (QPEs) gridded radar-rainfall (http://data.eol.ucar.edu/ accessed on 22 March 2020) serves as the source of radar precipitation measurements. The operational Stage-IV precipitation radar data production started its journey in 2001 at NWS River Forecast Centers (RFCs) and has been continued since then [64]. It contains bias-adjusted, quality-controlled hourly rain-gauge precipitation records with a 4 × 4-km spatial resolution. The measurements are in a cumulative hourly format at the end of each hour.
2.3. Methodology
Tropical Storm Imelda predominantly affected the southeastern counties of Texas. To better track the devastation of the event, this study focuses on the precipitation downpour around the Houston and Galveston areas. IMERG products at Early-, Late-, and Final-run stages of the event were compared to the NCEP Stage-IV gridded radar product at an hourly temporal resolution for eight consecutive days, starting from 14 September and ending on 21 September, during Tropical Storm Imelda. Three days before and after landfall (17 September 2019) were included in the analysis to reduce the impact of the presence of the extreme storm event on the probabilistic statistical indices.
Euclidean distance was used to identify the nearest radar grid to each satellite grid. For each grid of the satellite product, a nearest radar grid was found using the advantage of the satellite product’s spatial spacing being three times higher than that of the radar grids. Subsequently, statistical metrics were calculated to compare the precipitation estimates of the IMERG grids and their nearest radar grids at an hourly temporal resolution. There are 40,434 NWS/NCEP radar grids versus 6577 IMERG satellite grids in Texas. However, only 2570 grids of Stage-IV radar data and 418 IMERG grids were used that cover the analysis area spanning across 17 counties located in southeast Texas.
2.4. Statistical Indices
The IMERG products were evaluated using two types of statistical comparative metrics to assess their performance (Table 1), using the radar product as reference. The basic statistical indices included Pearson’s correlation coefficient (CC), relative bias (RBIAS), and root mean squared error (RMSE). These statistical parameters were calculated to examine the consistency of the data in contrast to the precipitation radar data. The probabilistic statistical indices: probability of (rainfall) detection (POD), false alarm ratio (FAR), critical success index (CSI), and Peirce skill score (PSS) were calculated to obtain information about the probability and accuracy of precipitation detection by the IMERG products compared to the reference radar products. Probabilistic statistical indices are widely used to assess the probabilistic quality of satellite products in this category [9,15]. The probability of rainfall detection by IMERG satellites during the precipitation reporting of the radar data is evaluated with POD. The FAR index provided information on the inconsistencies between the IMERG satellites falsely detecting rainfall while the radar products were without detection. CSI index aggregates all reports captured by both satellite and radar. The CSI index provides more harmony over the precipitation reporting of both radar and satellite products over the study area, while also providing more insight into the satellite data in various spatiotemporal resolutions [15]. The system’s overall accuracy in capturing rainfall events was indicated by PSS, which is the difference between the probability of detection and the probability of false detection. The Kling–Gupta model efficiency coefficient is another powerful statistical metric that measures the goodness-of-fit of a model. Gupta et al. [65] developed this method as an alternative to the mean squared error (MSE) and Nash–Sutcliffe efficiency (NSE) in the context of hydrological modeling. This coefficient has three main components: correlation, bias, and variability. In this study, the updated version, i.e., Kling et al. [66] was used to ensure the variability and bias components were not cross-related. This means the coefficient of variation was used as a measure of variability instead of standard deviation. Table 1 lists all the parameters with their formulae, ranges, and perfect values.
3. Results and Discussion
3.1. Exploratory Data Analysis and Visualization
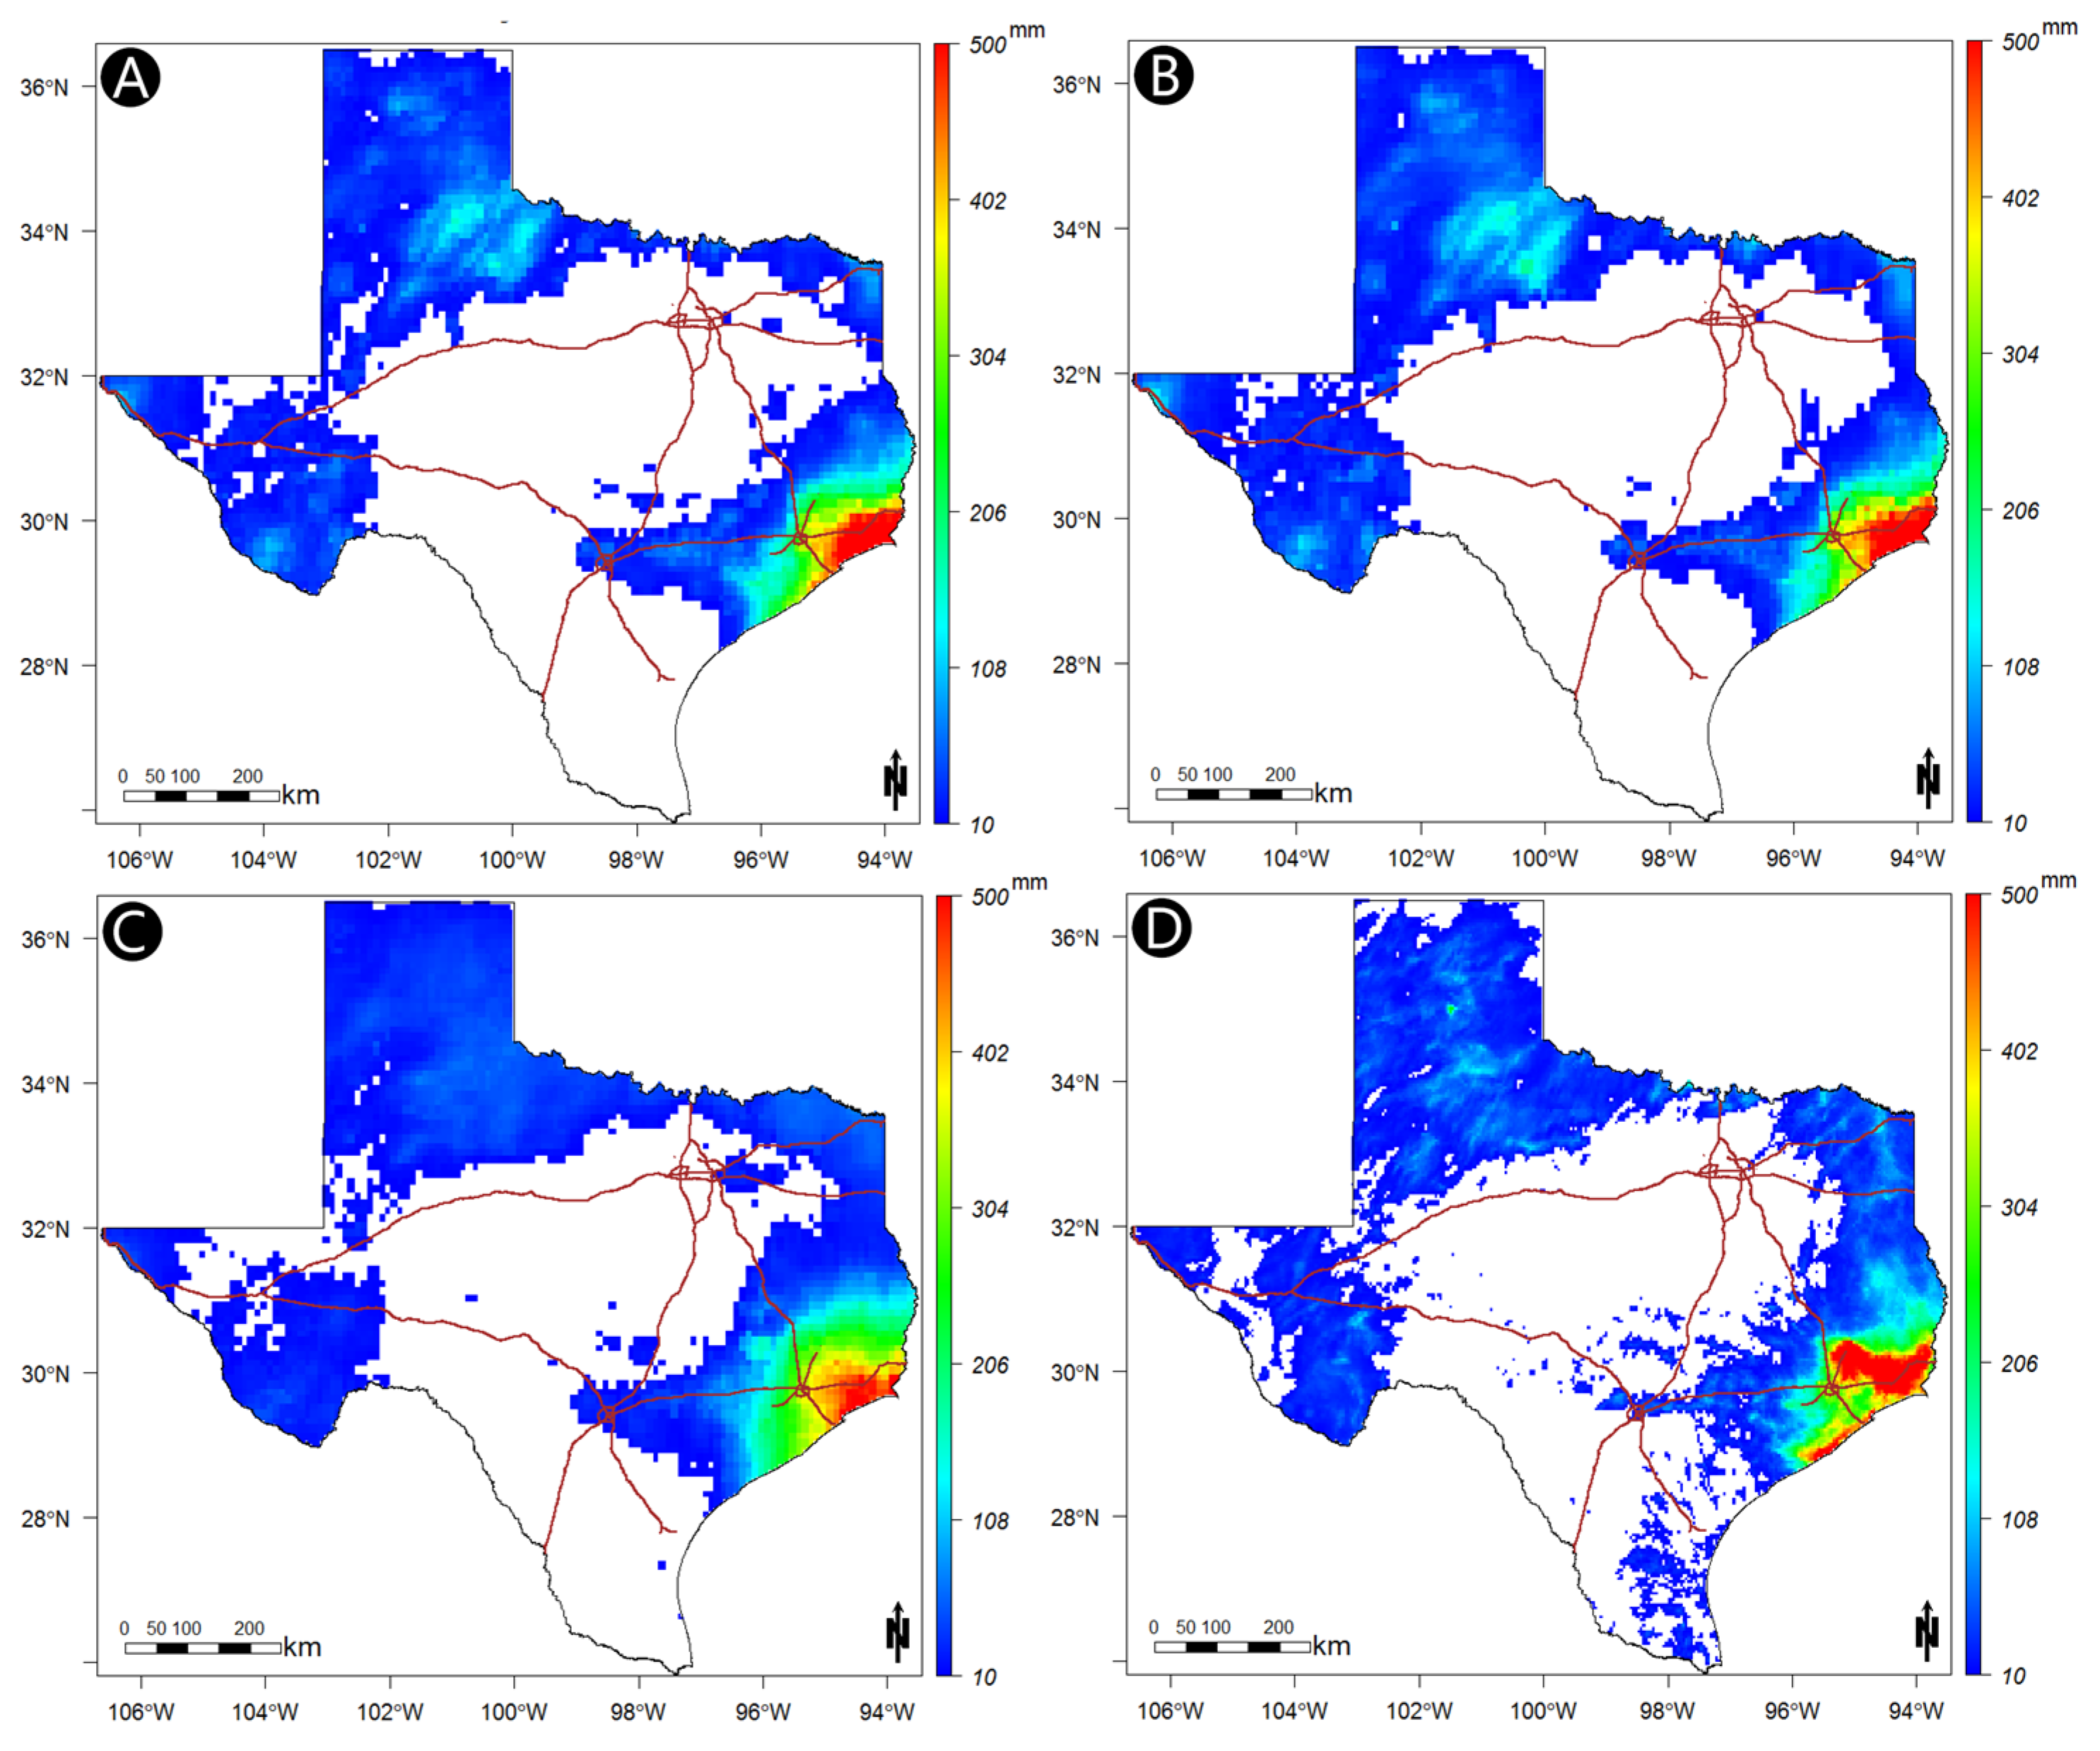
Figure 2 depicts the spatial distribution of the cumulative precipitation captured by both the radar and GPM IMERG products during Tropical Storm Imelda. Cumulative rainfall estimates show variability in spatial patterns between the Stage-IV gridded product and the three IMERG satellite products for the same grids during the study period (Figure 2). Both the Early- and Late-run IMERG products showed similar spatial patterns in the coastal and inland areas in the southeast coastal region receiving a high amount of precipitation during the study period (7 days). The products showed the area of highly hit areas (areas receiving more than 250 mm) as ~15,000 km2 and ~14,000 km2 for Early- and Late-run respectively. The Final-run product showed a different pattern, with a more expanded distribution of the tropical storm, with a ~21,500 km2 area getting more than 250 mm during the seven-day event (Figure 2C). The Stage-IV radar product (Figure 2D) showed a different spatial distribution in the cumulative rainfall estimation, showing two hot spots along the southeast coastal region. However, when considering the extreme peak that is about the limit of the NWS rain gauges (~500 mm), the pattern reverses. The Early- and Late-run reported areas about 3700 km2 and 3500 km2 to have received precipitation more than 500 mm, respectively. While, the Final-run showed only a 900 km2 area with precipitation higher than 500 mm. The most extreme rainfall area was observed on the Stage-IV radar product, with almost 6000 km2 getting precipitation higher than 500 mm.
When it comes to the maximum recorded grid totals by the products, all three IMERG products reported close enough totals, ranging from 740 mm to 775 mm. However, the maximum precipitation from the radar product was about 1.5 times the IMERG product at the peak grid reported value of 1150 mm. The maps shown in Figure 2 show that the IMERG satellite product generally overestimated the precipitation in the places which received lower precipitation, but underestimated the storm in places where there was very high precipitation. The satellite also did not detect precipitation in some coastal areas where radar products recorded values. All products successfully recoded the center of the storm near the southeast side of the Houston area. Overall, the radar product estimates were more concentrated over the storm center and satellite products covered a larger spatial extent of the southeast Texas region (Houston, Galveston, and Beaumont areas).
3.2. Temporal Evolution of the Tropical Storm
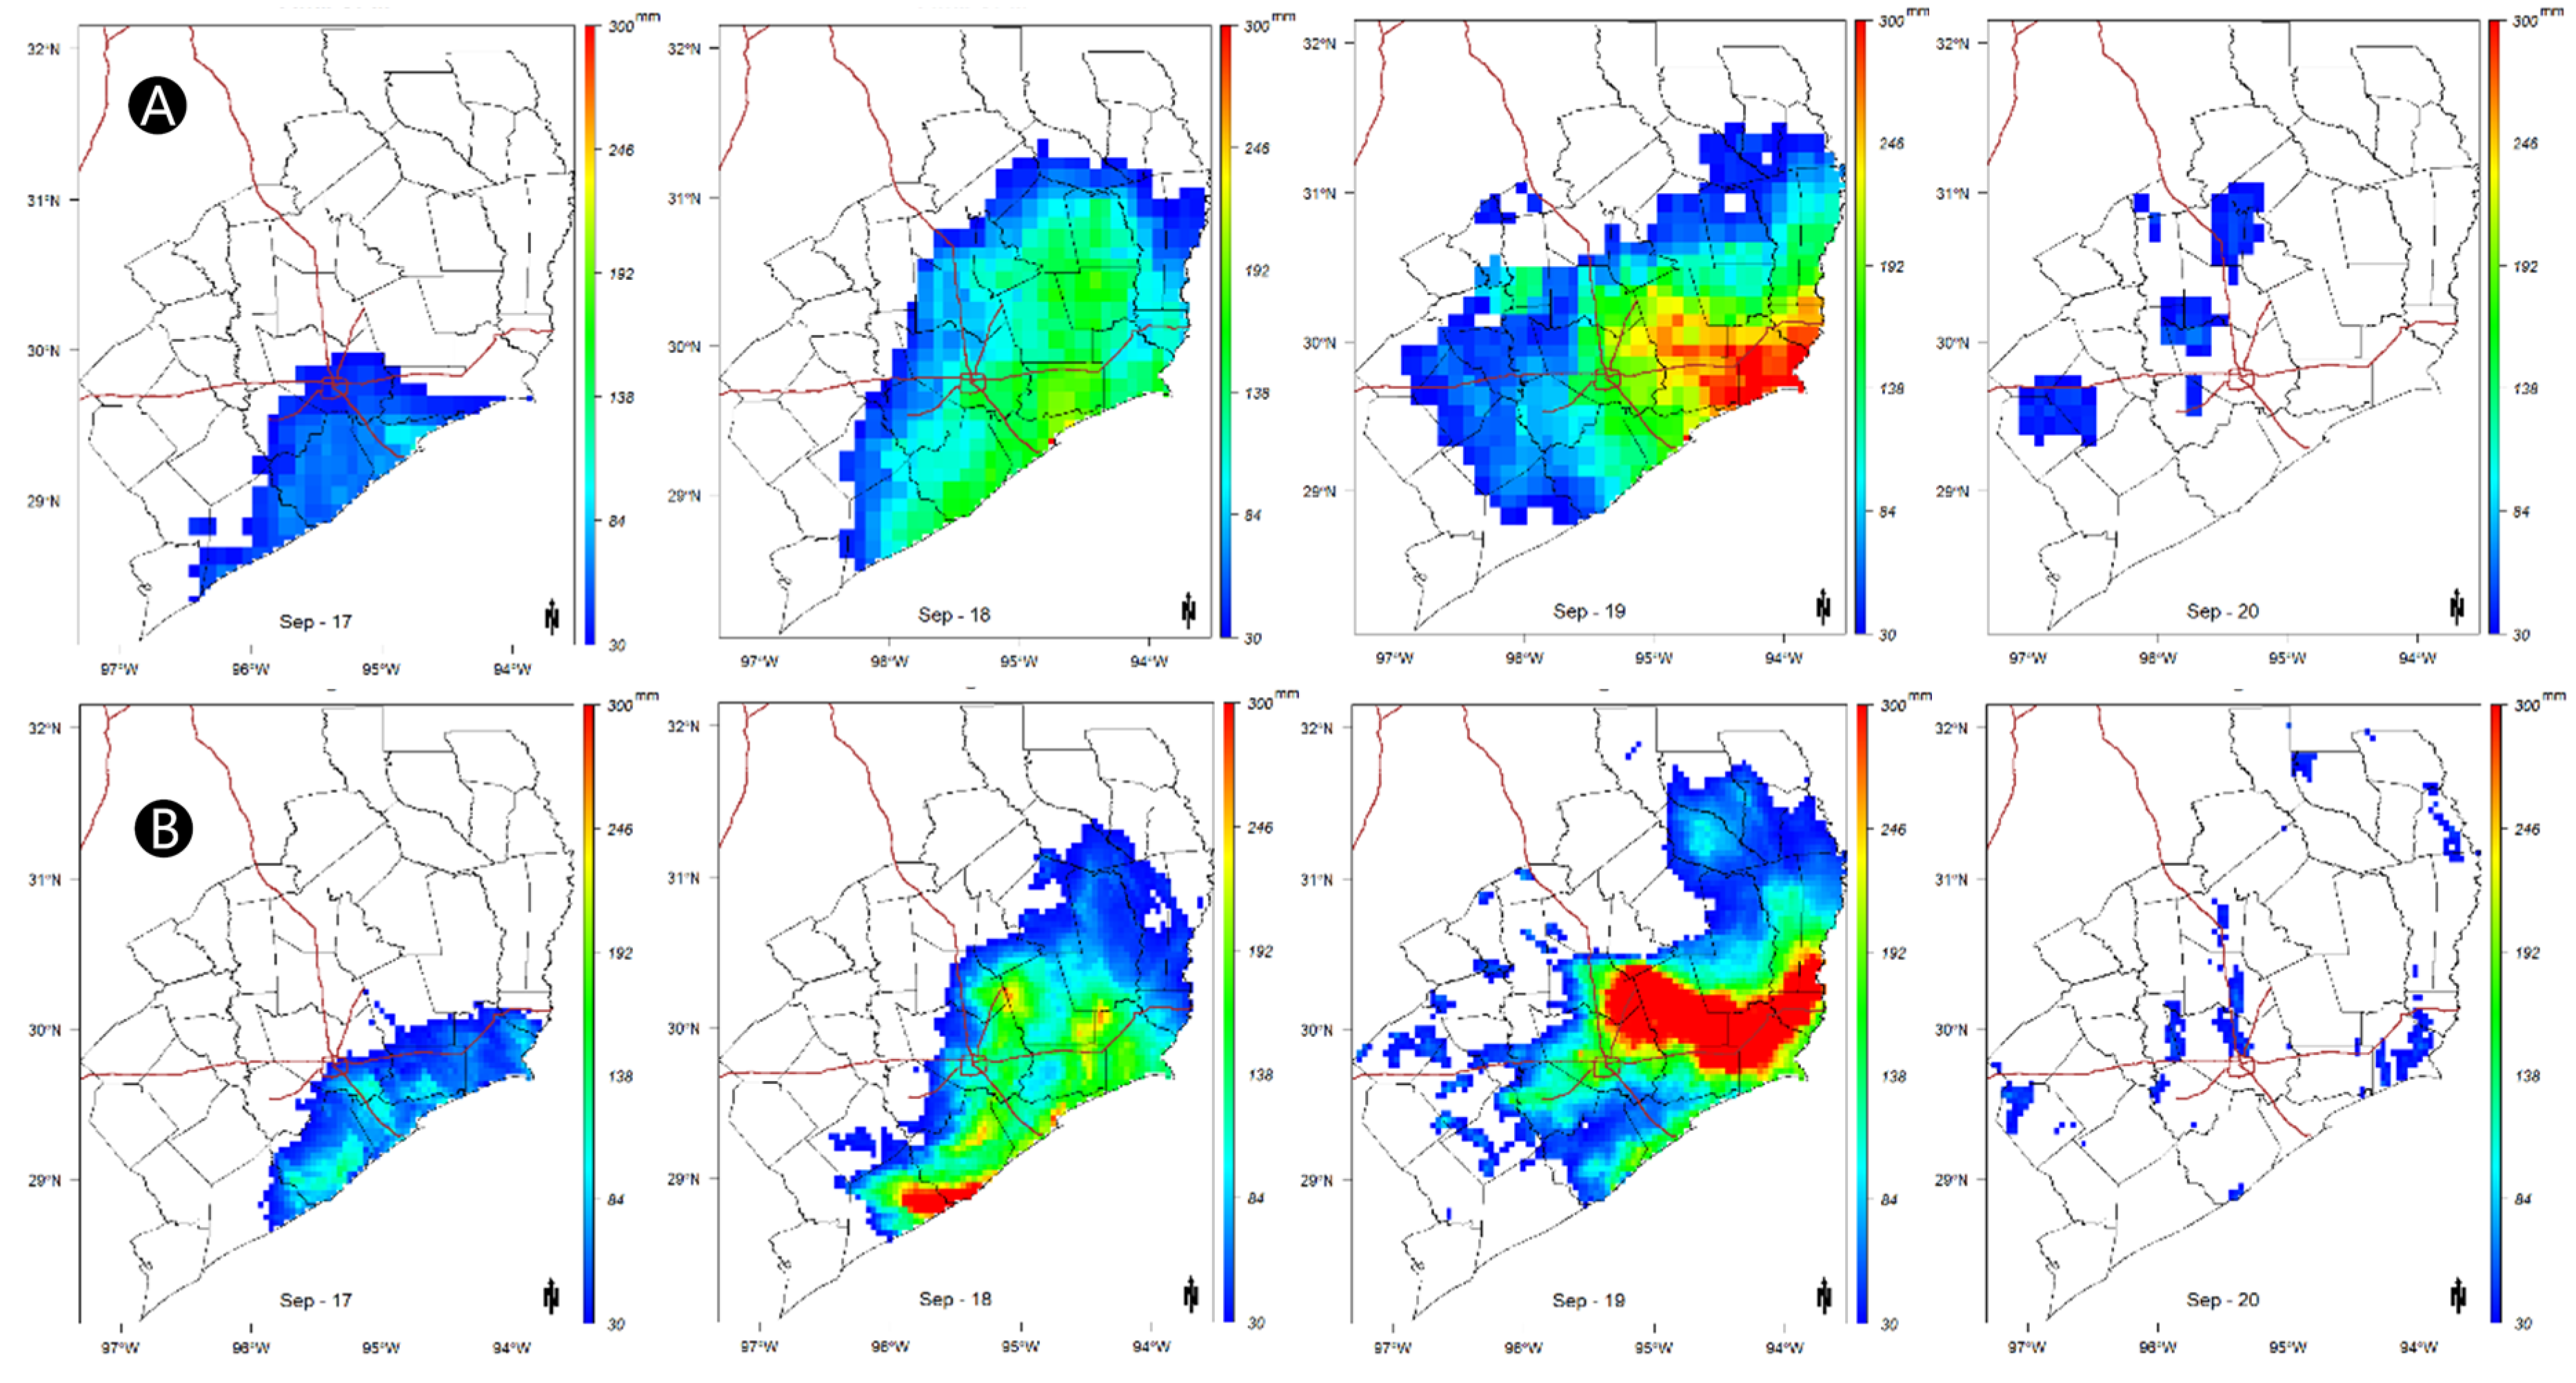
Figure 3 illustrates the temporal evolution (17–20 September 2019) of the storm after its landfall and the spatial patterns captured by IMERG Final-run product (Figure 3A) and Stage-IV (Figure 3B). On the day of the landfall (17 September), the Final-run and Stage-IV showed a similar pattern. On the next day (18 September), the two products reported different spatial distributions of the storm. The satellite product missed the hotspot in the southern part of the region, as shown in Figure 3. On the day of the heavy precipitation event (19 September), the satellite-based product failed to capture the intensity of the tropical storm, with a relatively smaller area (4200 km2) getting more than 250 mm. However, the radar product estimated almost twice (7700 km2) the area reported by IMERG to have received precipitation of more than 250 mm on that day. Moreover, the maximum daily rainfall observed on that day by radar was 2.3 times the maximum daily rainfall observed by IMERG, which was 380 mm. Lastly, the dissipation of the tropical storm was observed on 20 September from both products with quite different spatial patterns.
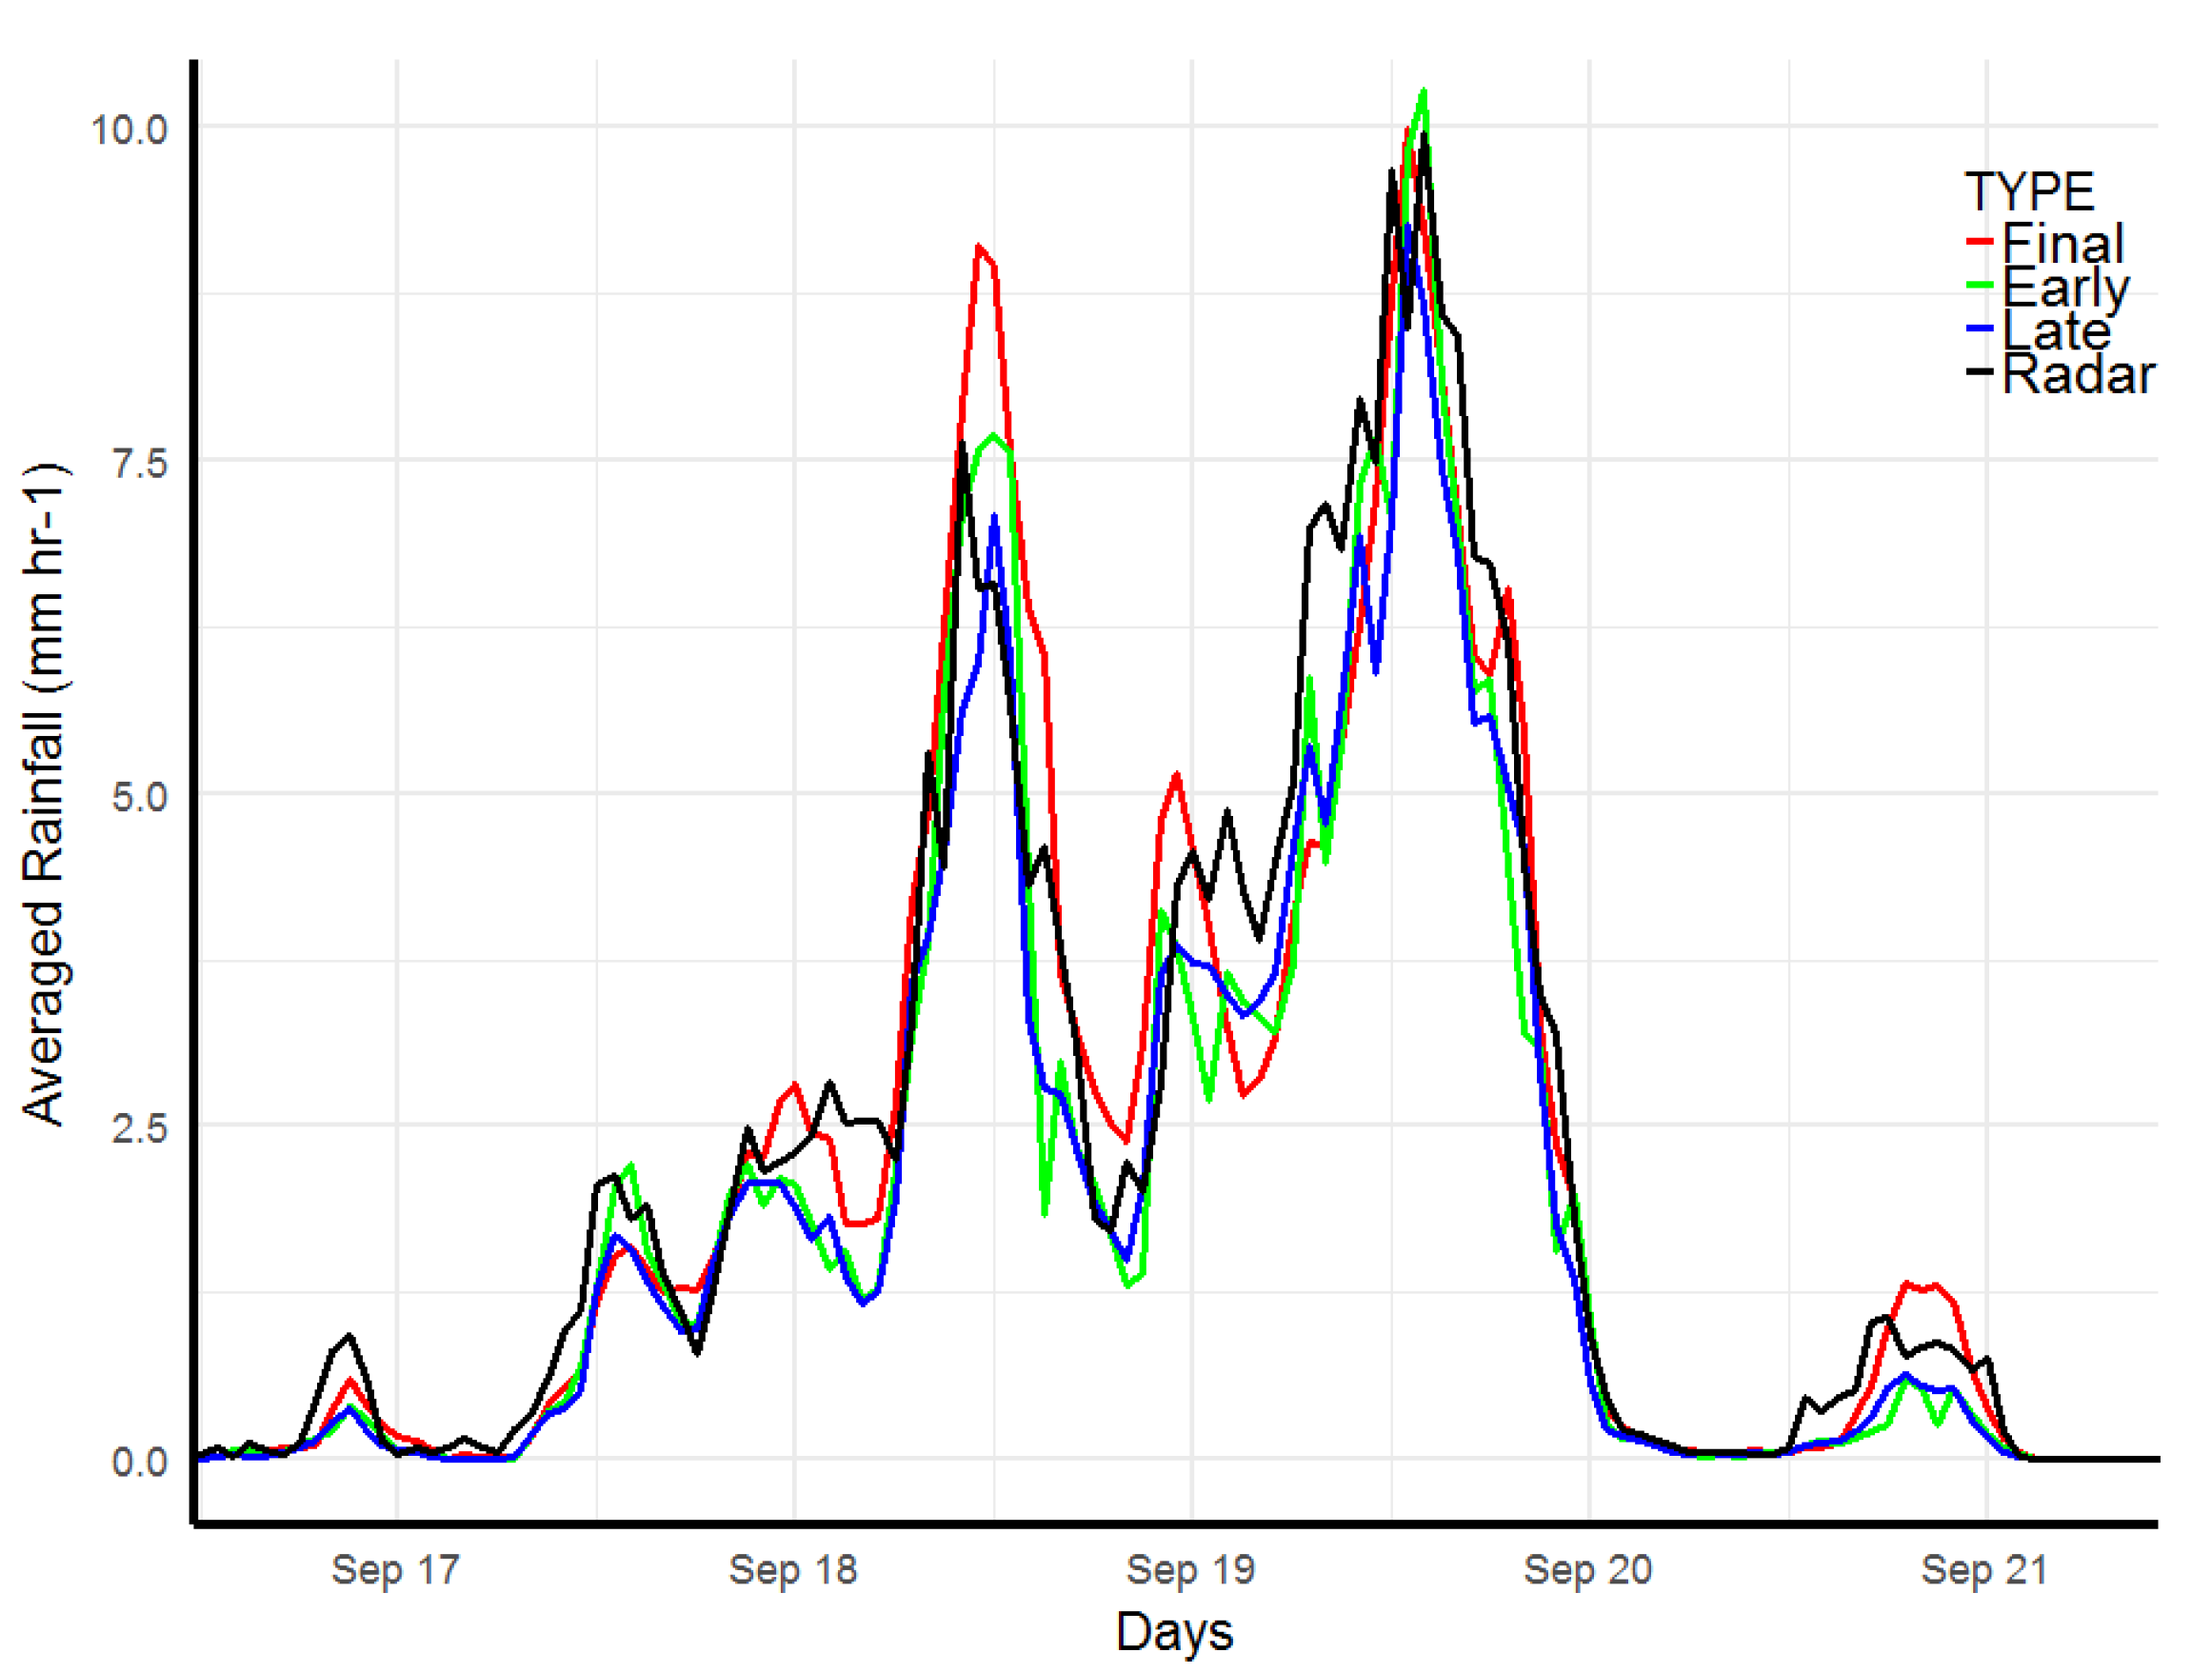
A time series plot of an area average of the tropical storm shows the temporal evolution at a higher temporal resolution as shown in Figure 4. The time series of the event showed that the precipitation data during Tropical Strom Imelda had a bimodal distribution. The first peak was reached at about 11:00 AM on 18 September UTC time zone. The second and largest peak came more than 24 h later at 2:00 PM on 19 September UTC time zone (Figure 4). The second peak was captured by all the products with reasonable accuracy in its rise and fall. However, the first peak was overestimated significantly by the IMERG Final-run product, with an average of 1.5 mmhr−1 over the study area, which included an area of around 41,100 km2. This was approximately 62 million cubic meters of water in an hour spread across the entire study area. The Early-run product showed the best fit among the other IMERG products matching both of the peaks of the radar product. The Late-run also showed a similar underestimation in both of the peaks. However, the highest correlation coefficient of the time series was shown between the radar and the Late-run, with a value of 0.98. Moreover, the other two products also showed high correlation coefficients of 0.97 and 0.96 for the Early- and Final-run, respectively. A recent study conducted over the Sichuan Basin of China revealed that the precipitation deviation of the Final-run products was mainly observed during moderate precipitation events (1–10 mmhr−1) [67]. Final-run products showed better detection over Early- and Late-run products for light precipitation (<1 mmhr−1) events [67]. This might explain the slight underestimations on 17 September and 18 September when precipitation was lower than 1 mmhr−1, and the overestimations on the following days when precipitation ranged between 1.25–10 mmhr−1.
3.3. Basic Statistical Indices
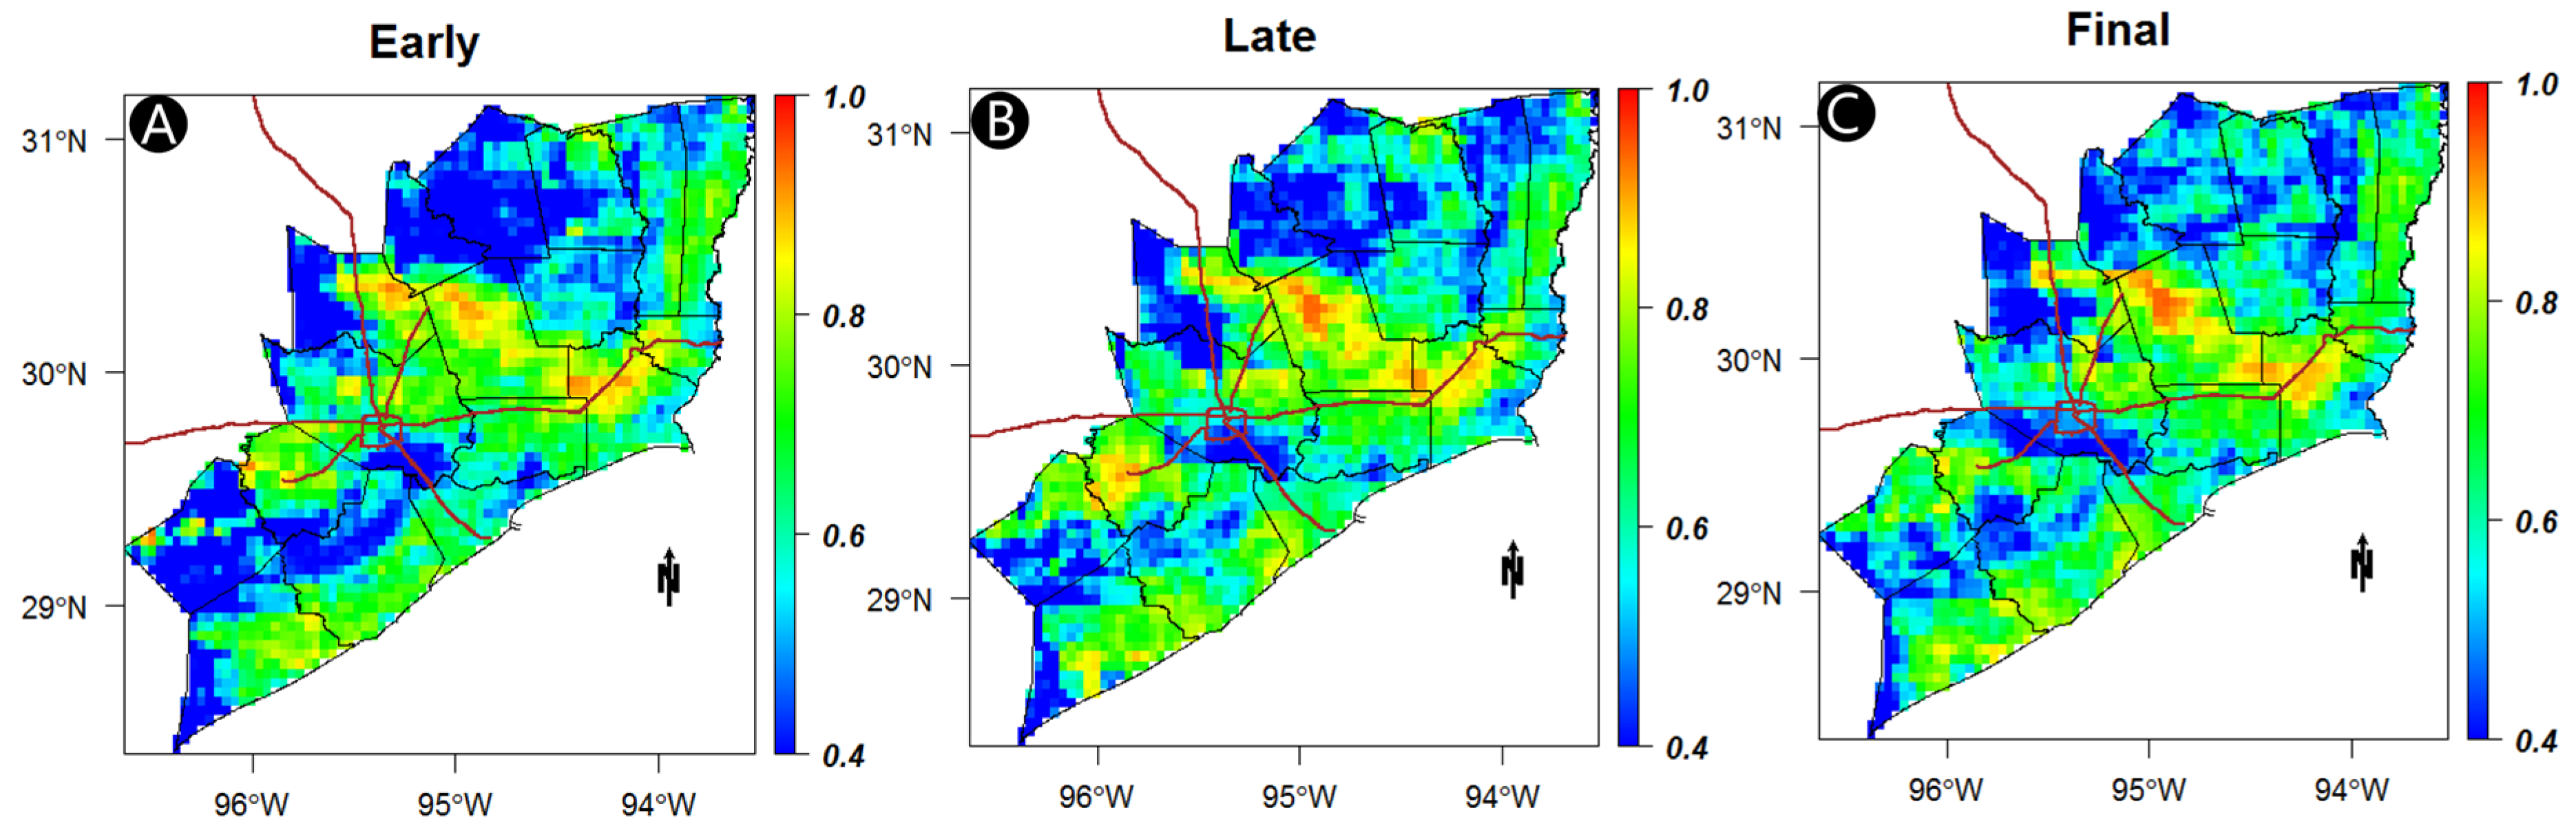
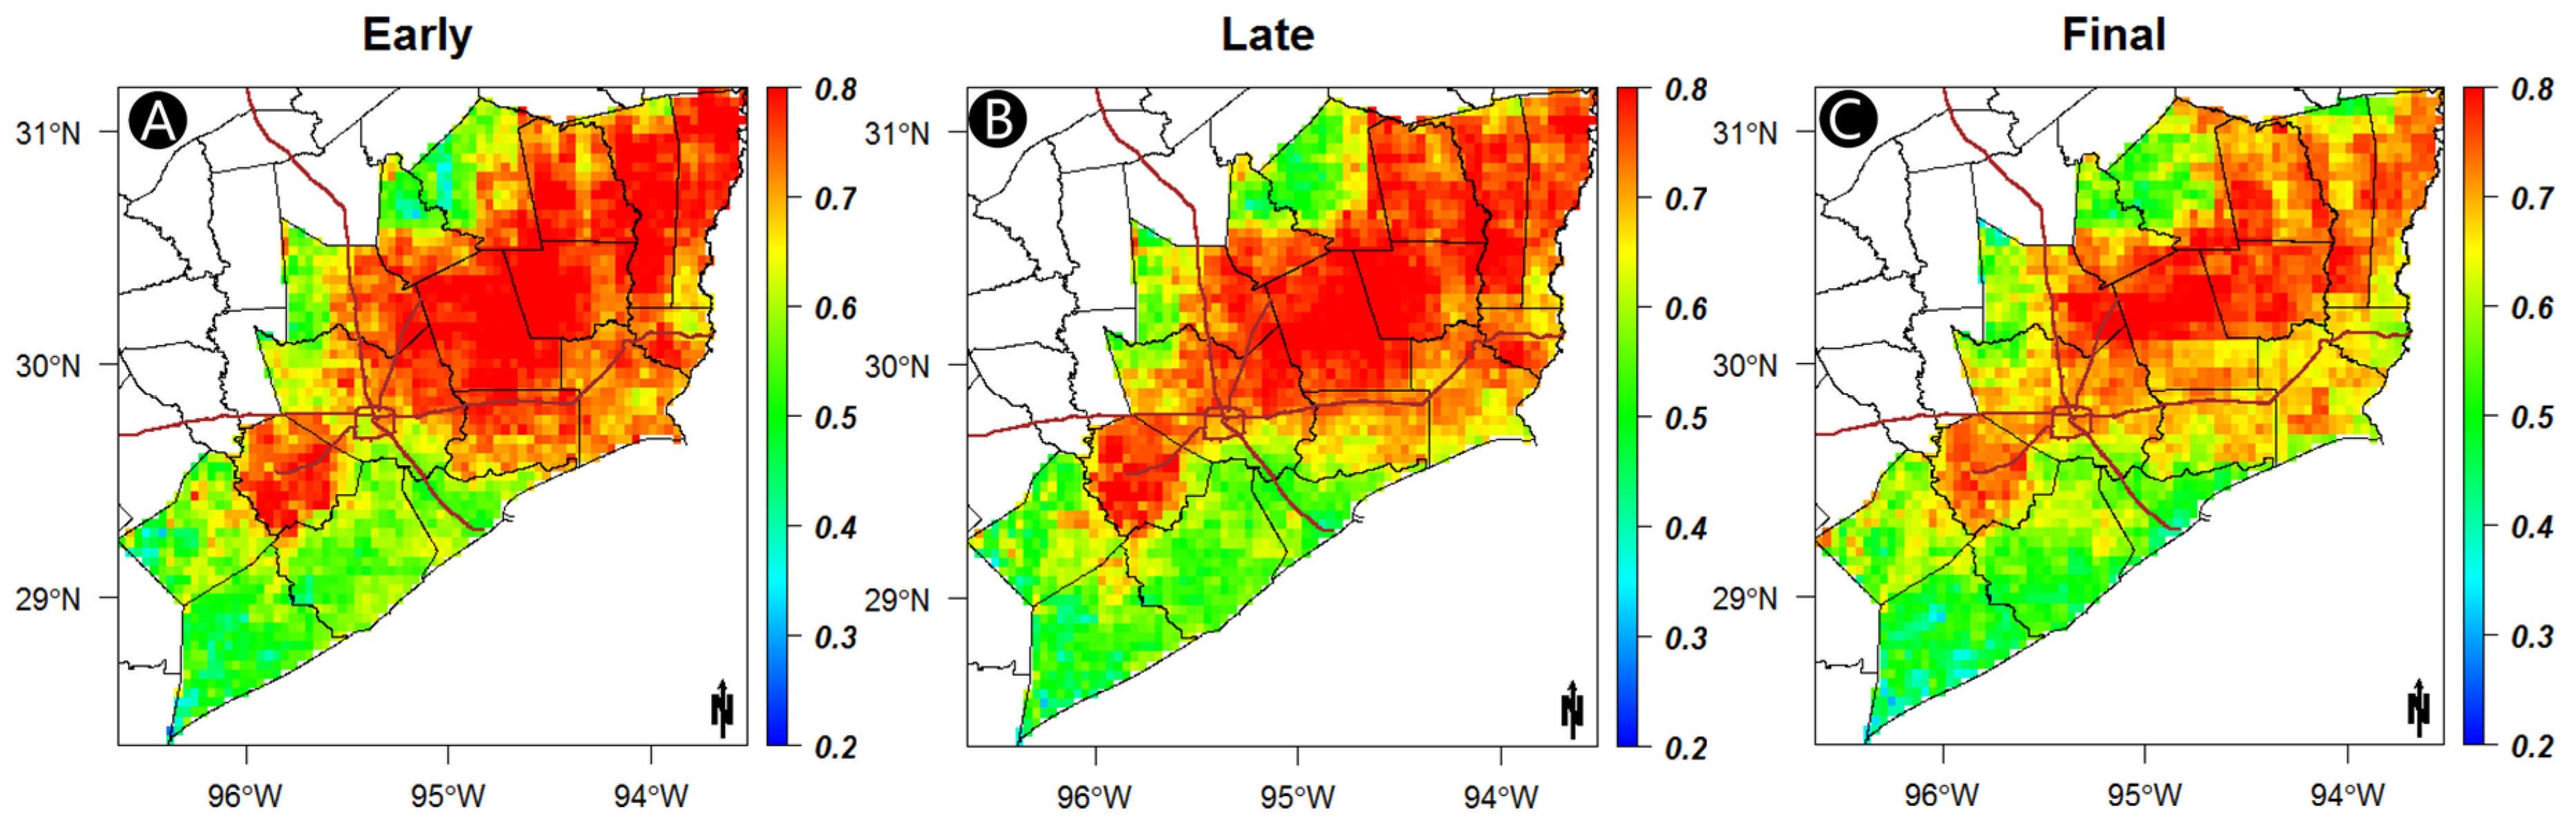
Figure 5 shows the CC spatial patterns between Stage-IV radar data and each of the three IMERG-GPM satellite products during Tropical Storm Imelda. The CC spatial pattern shows the consistency of the IMERG-GPM products with more detail. As there is high spatial variability during extreme events, the CC pattern helps to evaluate the performance of the satellite products and illustrate their characteristics.
The spatial patterns of CC show a higher consistency in the coastal areas and in places hit hardest by the storm (Figure 5). The average CC was almost the same for the three IMERG products, at 0.574, 0.600, and 0.595 for the Early-, Late-, and Final-run products, respectively. The spatial distribution also shows similar behaviors for all of the IMERG products. Higher CC values were observed for all comparisons over the counties of Jefferson, Liberty, and Montgomery in the northeastern part of the study area (Figure 5). Generally, coastal areas with a high amount of precipitation had relatively higher correlation coefficients (CC) than the areas further inland. Two-thirds of the study area (above 67%) showed a CC higher than 0.5 for all IMERG products. Though the Late-run product showed the highest consistency of CC throughout the study area, the Final-run product showed a better consistency in the regions near the center of the storm. An earlier study [53] on the same region during hurricane Harvey found that the complex structure of hurricane Harvey might have significantly affected the performance of the satellite products near the center of the hurricane.
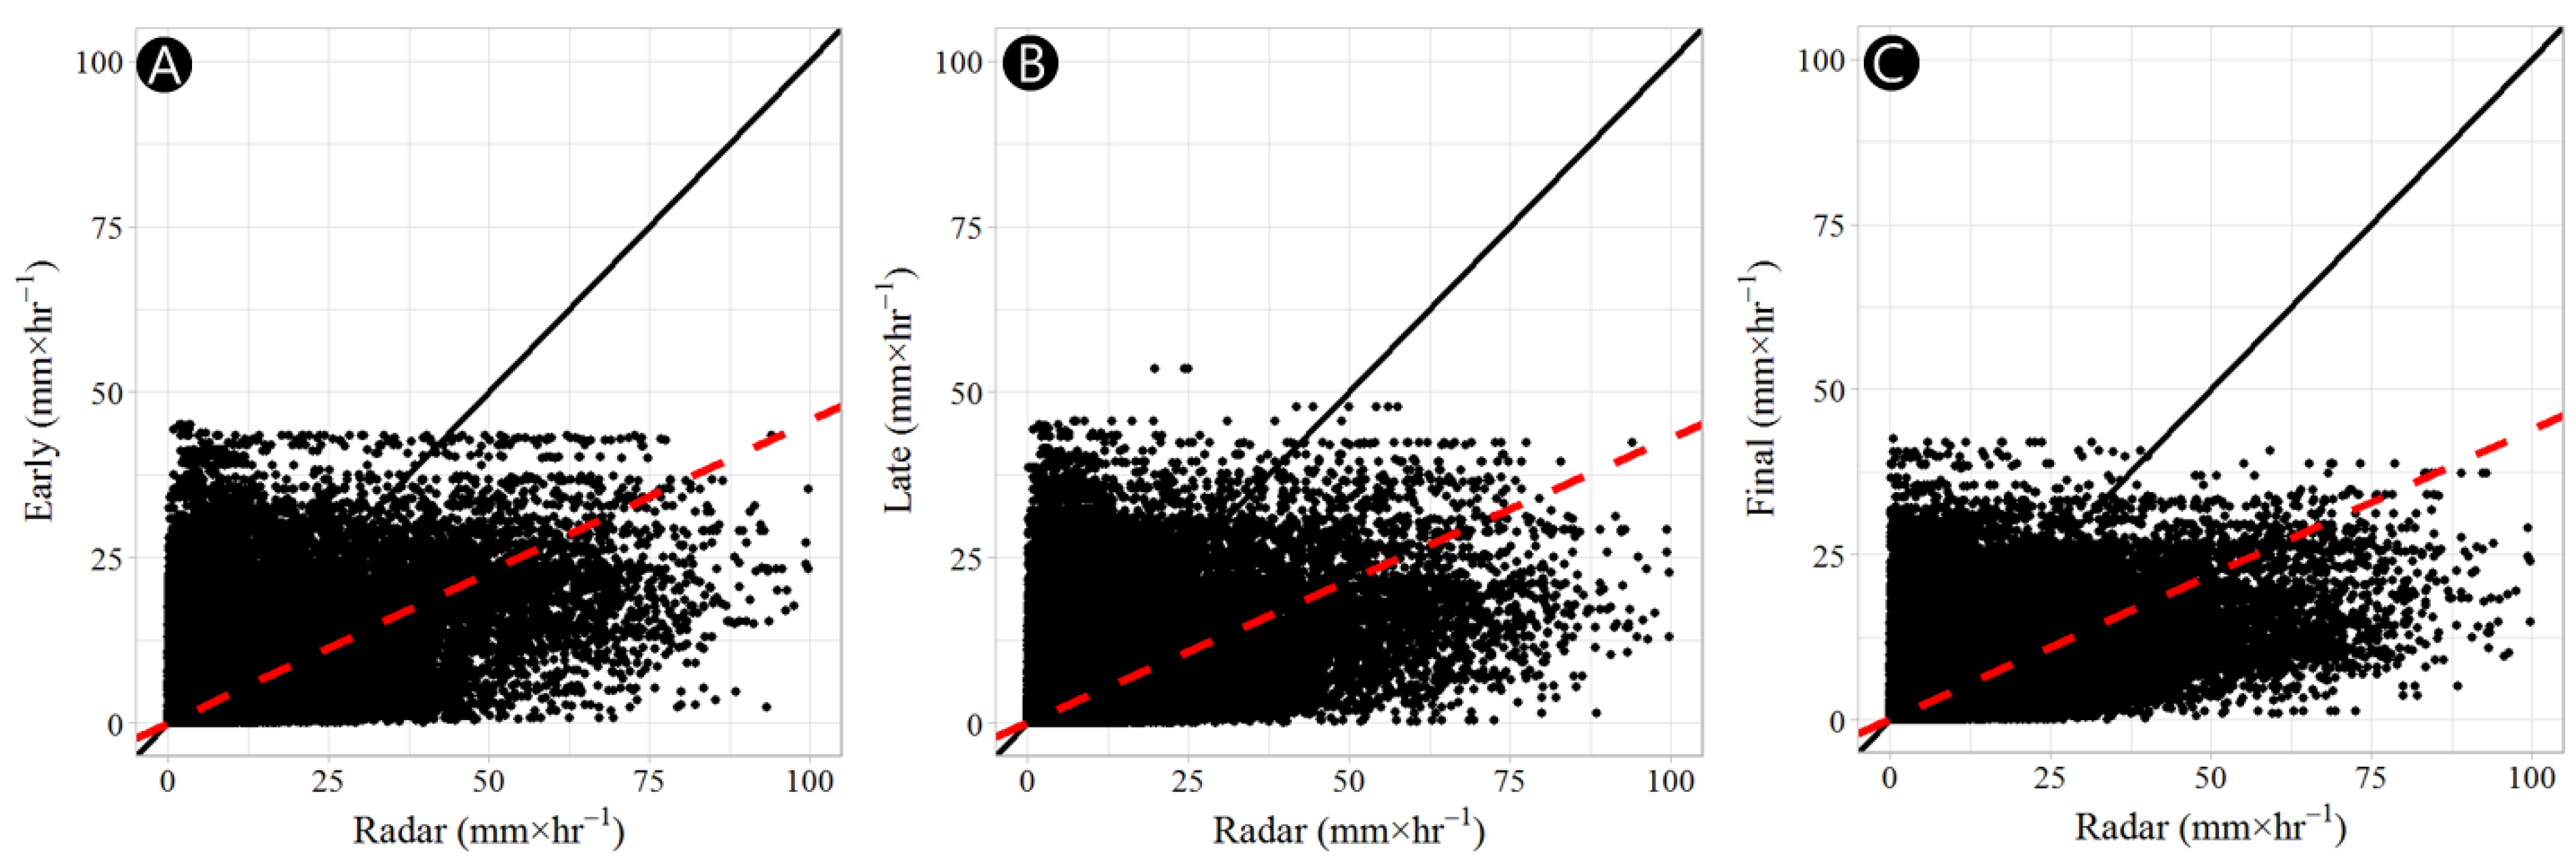
Figure 6 shows scatterplots of IMERG Early-, Late- and, Final-run satellite products with Stage-IV radar product during Tropical Storm Imelda. The scatterplot helps to visually inspect the alignment of the individual pixels of the two products during the event). Similar to the CC values, all products followed similar patterns, with almost the same linear model fit (R2) with minor variations in the slopes (0.46, 0.43, and 0.44 for Early-, Late-, and Final-run, respectively). All the slopes were found to be significantly different than zero at a 0.01 significance level. There were significant differences between the radar estimates and those of the satellite at a pixel scale. Moreover, overestimation of light precipitation and underestimation of heavy precipitation is evident from the scatterplots. However, there was a clear improvement in the quality of the data from the Early-run to the Final-run. In Figure 6, the systematic error is seen as an apparent point cloud, appearing as a ceiling in the top part (Figure 6A). That ceiling of the point cloud is much lower in the Late-run and disappears in the Final-run. The coefficient of determination (R2) with a value around 0.4 shows a poor fit for the IMERG products. The data visualization and analysis in Figure 6 shows that the IMERG algorithm needs further improvements to minimize systematic errors for the Early- and Late-run products.
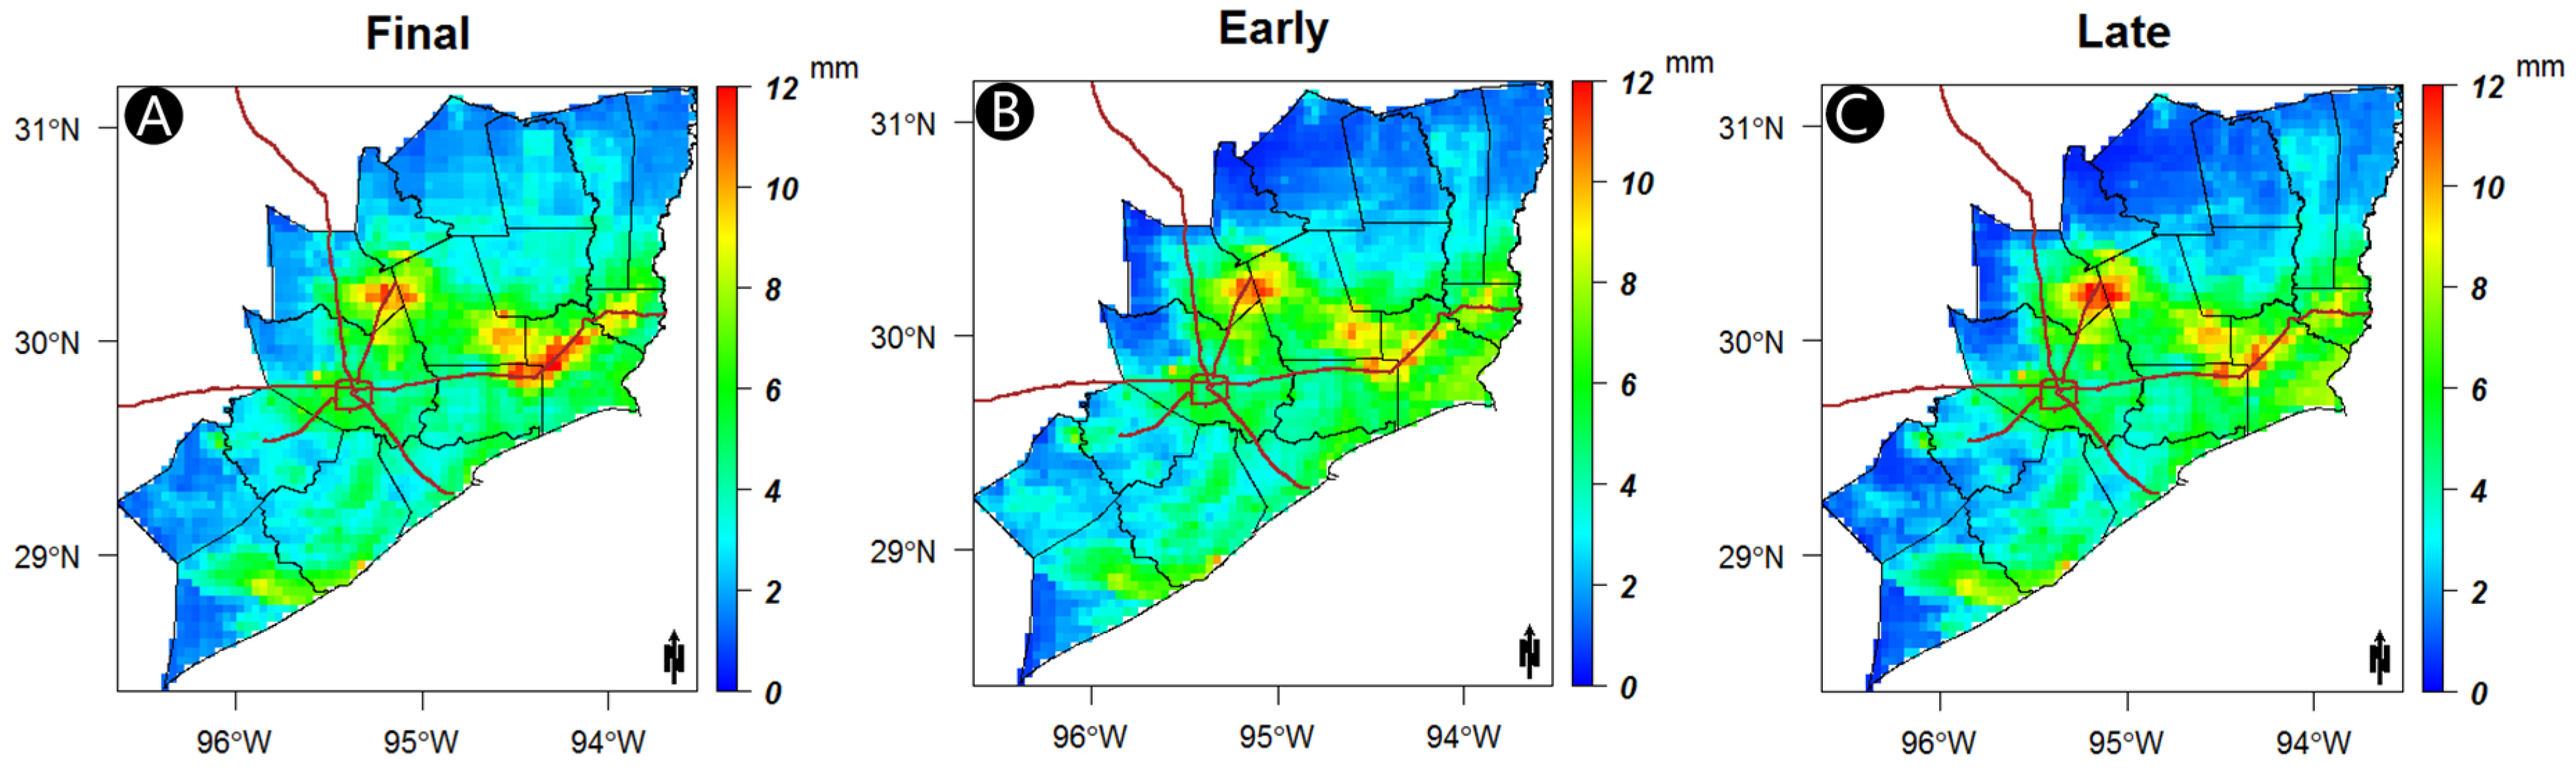
The spatial distribution of the RMSE (Figure 7) shows an almost similar pattern in all the IMERG products. It is clearly seen that areas highly affected by Tropical Strom Imelda (southeast coastal regions stretching up to the border with Louisiana) show a higher RMSE, with two hot spots in all three products. The RMSE of the products suggests that the products were improved, in minimizing the average error compared to a similar study conducted in the same area earlier [53]. The mean and median RMSE was 3.74 mm and 3.67 mm, 3.88 mm and 3.27 mm, and 3.15 mm and 3.42 mm for the Early-, Late-, and Final-run, respectively. In all of the three IMERG products, about three quarters (ranging from 73% to 76%) of the area experienced an RMSE of less than 5 mm in estimating the Tropical Storm Imelda. Cui et al. [44] conducted a study over the central and eastern United States comparing IMERG products with ground-based observations and found that the IMERG products showed the largest RMSE values during summer and fall months, caused by severe underestimation. They attributed this error to dry biases of the IMERG algorithm for precipitation estimation of convective systems.
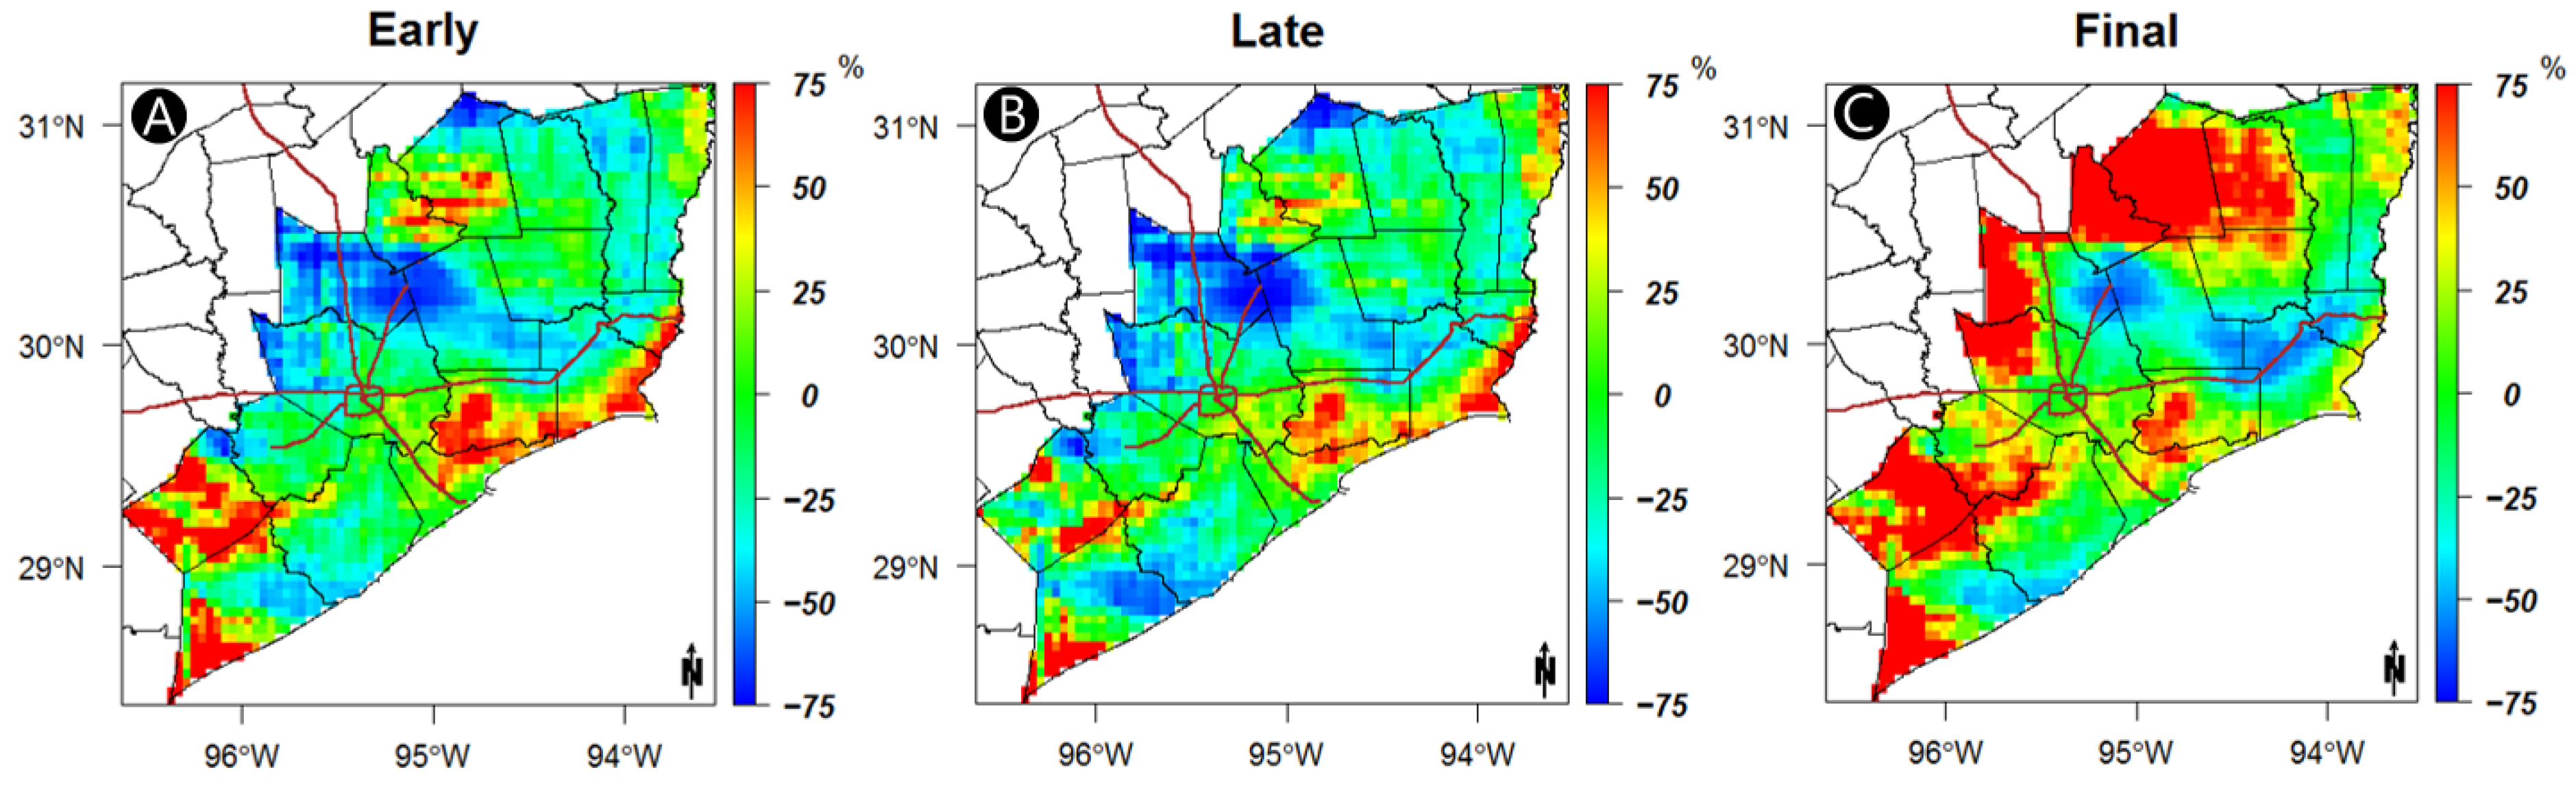
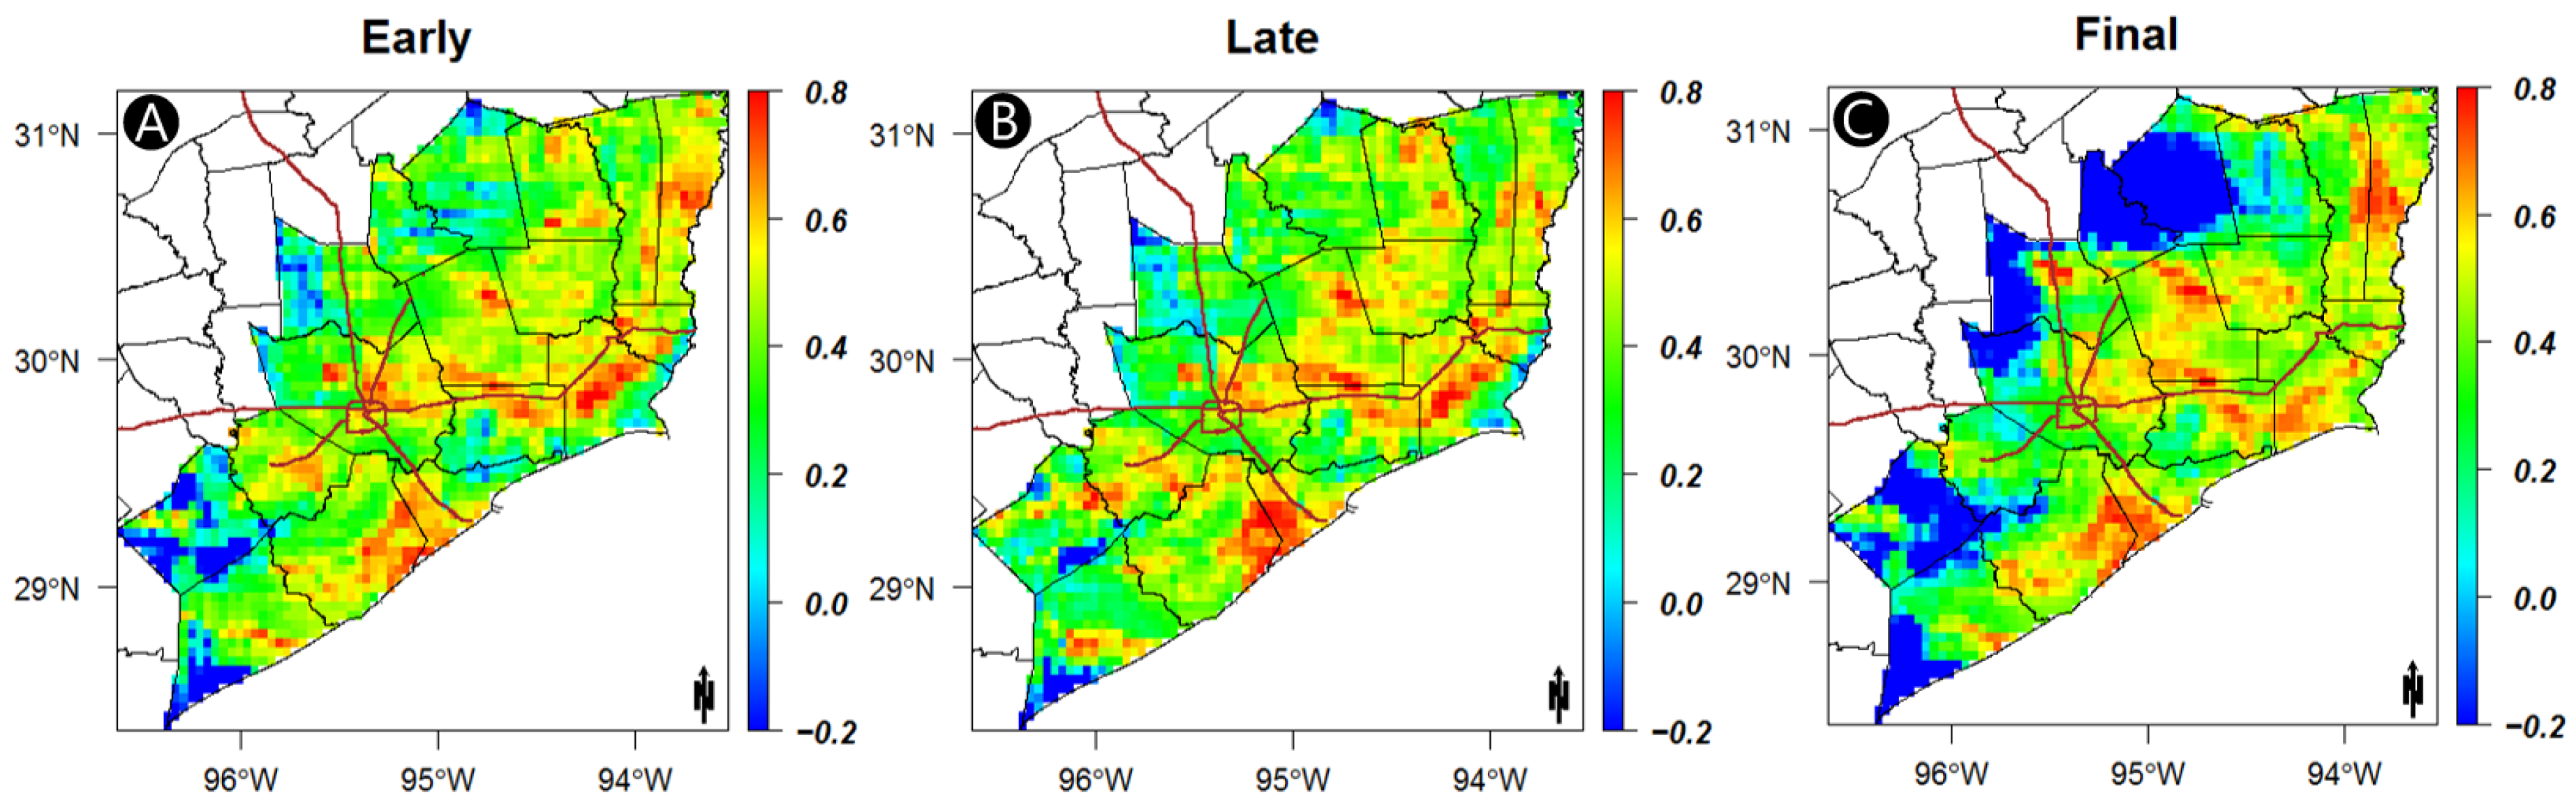
Figure 8 illustrates the spatial variability of the relative bias (RBIAS) over the study area during Tropical Storm Imelda. The spatial distribution of the RBIAS shows similar patterns for the near-real-time IMERG products (Early and Late). However, the spatial pattern was different for the Final-run product, which had a latency of about 3.5 months (Figure 8). The inland areas show much higher positive RBIAS (overestimation) in the Final-run product than the two earlier products, especially in counties such as San Jacinto, Polk, and Fort Bend, where the positive RBIAS was more than 75%. This might be attributed to the tendency of IMERG Final-run products to overestimate precipitation measurements in inland areas during extreme storm events [68,69]. With the Early- and Late-run products, the coastal areas show a higher positive RBIAS and the inlands show a lower negative RBIAS. Overall, the Early- and Late-run products underestimated the tropical storm, with mean RBIAS values of −4% and −11%, and medians of −15% and −18%, respectively. However, the Final-run product showed contrasting results by providing a mean RBIAS of 41% and a median RBIAS of 20%. This suggested that the Final-run product overestimated the tropical storm by a large margin. However, when we follow the spatial distribution of the RBIAS (Figure 8C), it is very clear that the Final-run product significantly overestimated precipitation in less-hit areas. In contrast, it underestimated precipitation in the hard-hit areas. For all three products, about 50% of the areas experienced RBIAS between −30% and 30%. Hence, it can be said that the performance of the IMERG Final-run product was not as good as the Early- and Late-run products in capturing the storm event. In more than 30% of the study area, the Final-run product indicated an overestimation of the storm event by more than 50%. However, the Late and Early product estimates showed an overestimation of more than 50%, in 8% and 12% of the study area, respectively. This suggest that there was a significant problem of overestimation in the Final product, especially in the outskirts of the study area (Figure 8C). The areas with an acceptable range of RBIAS (i.e., between −10% and 10%) in all the three IMERG products were about 16% to 17% of the total area. This outcome follows similar ones from earlier studies, where GPM products underestimated precipitation measurements during extreme events [35,53,68,69]. Table 2 summarizes the performance of the three IMERG-GPM products based on basic statistical indices for the study period.
The Kling–Gupta model efficiency coefficient (KGE) shows a spatial distribution pattern similar to the other basic statistical indices above. The early and late products outperformed the final product, especially in the places that were less affected by the storm events (low precipitation), as shown in Figure 9. The average values of the KGE show that the late product was found to be the best model for capturing the event, with an average of 0.39, followed by the Early and Final products, with KGE values of 0.36 and 0.16, respectively. Around one-third of the study area showed a KGE of more than 0.5 in the Early and Late products, whereas only one-quarter was indicated in the Final product.
3.4. Probabilistic Statistical Indices
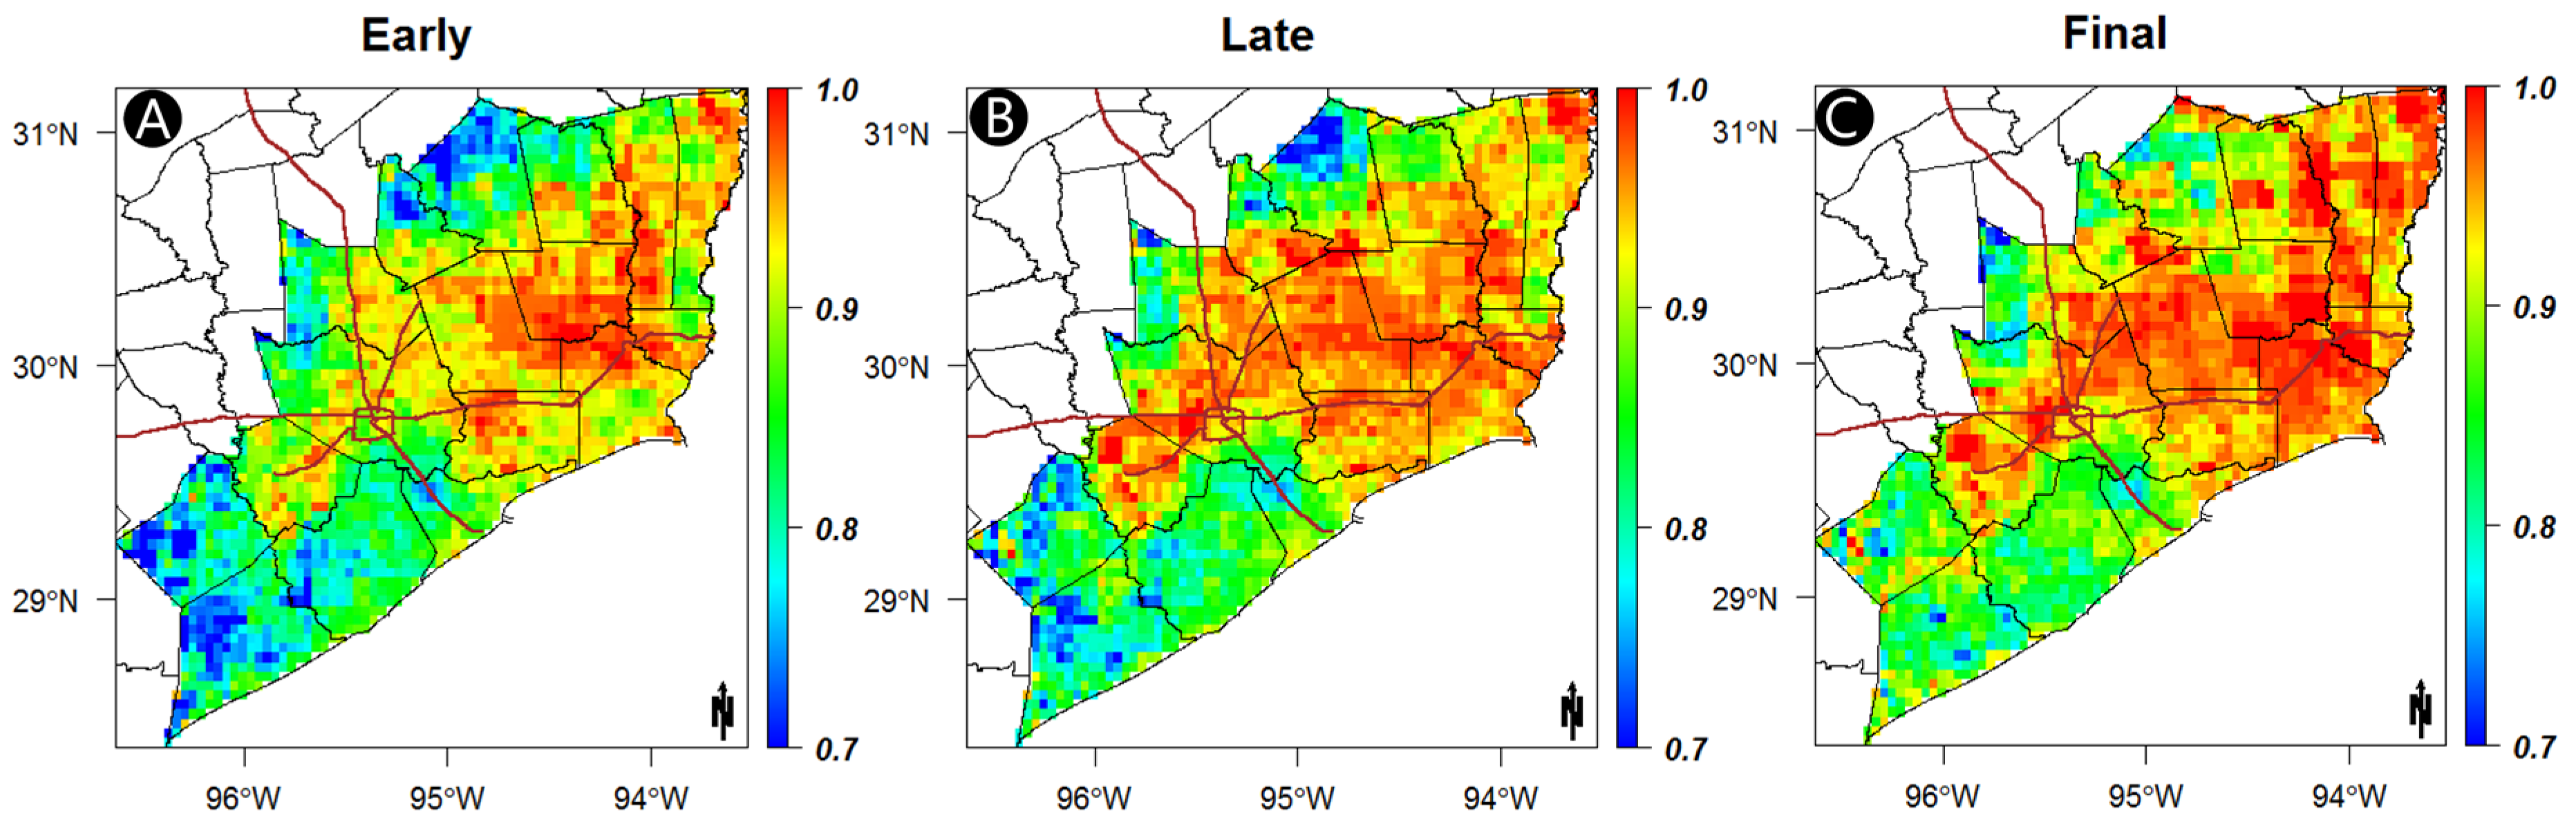
In the POD analysis (Figure 10), Final-run was found to have the best results, with the highest POD values out of the three GPM products. The spatial distribution of the POD in all three products reveals that, as expected, the POD was found to be higher in counties that registered higher precipitation. The average POD for all three products was around 0.90, with a higher median of 0.92. For the Final-run product, the POD was observed to be greater than 0.80 in about 95% of the study area. However, the short study period and small study area (8 days with 192 observations) could have skewed the POD values. Moreover, the timeframe included in the study covers an extreme event that can be easily detected by both radar and satellite products. Hence, to normalize the presence of the extreme event, three days before landfall and after dissipation were included in the analysis.
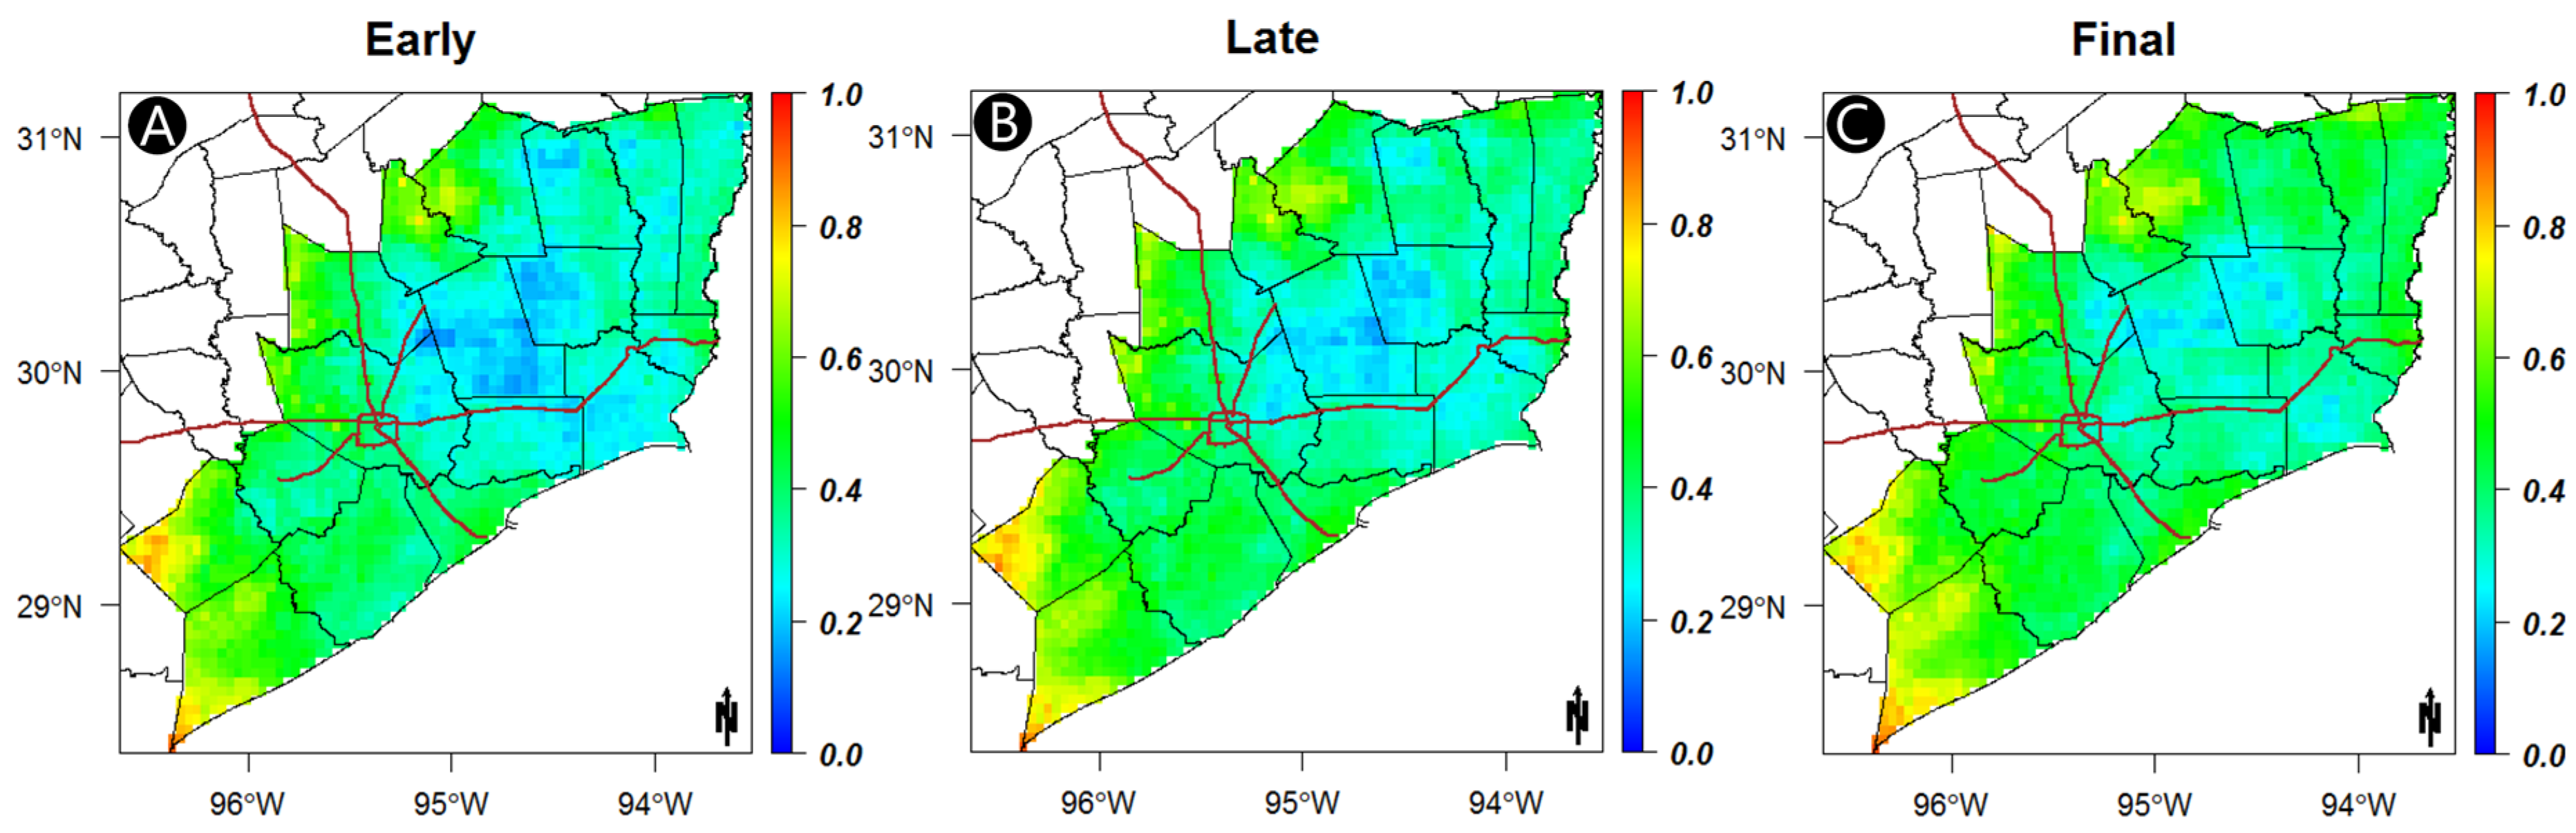
In Figure 11, the false alarm ratio (FAR) followed similar patterns to those of the POD. Lower FAR values were registered in the areas heavily affected by the storm, and higher FAR values were seen in the periphery of the study area. All three IMERG products showed a similar spatial pattern. The Early- and Late-run products showed a relatively better FAR, with an average value of 0.40, however, the Final-run product registered a FAR value of 0.44. The Early product showed its advantage in FAR by registering a lower median, of about 0.35, compared to 0.38 and 0.42 in the Late- and Final-run products, respectively. Nearly two-thirds (67%) of the study area for the Early-run product showed a FAR of less than 0.4, whereas, only 40% of the areas in the Final-run showed a FAR of less than 0.4. Generally, the FAR by all the IMERG products was found to be very high, especially when considering the analysis was performed for a short period (8 days) and in an extreme event condition.
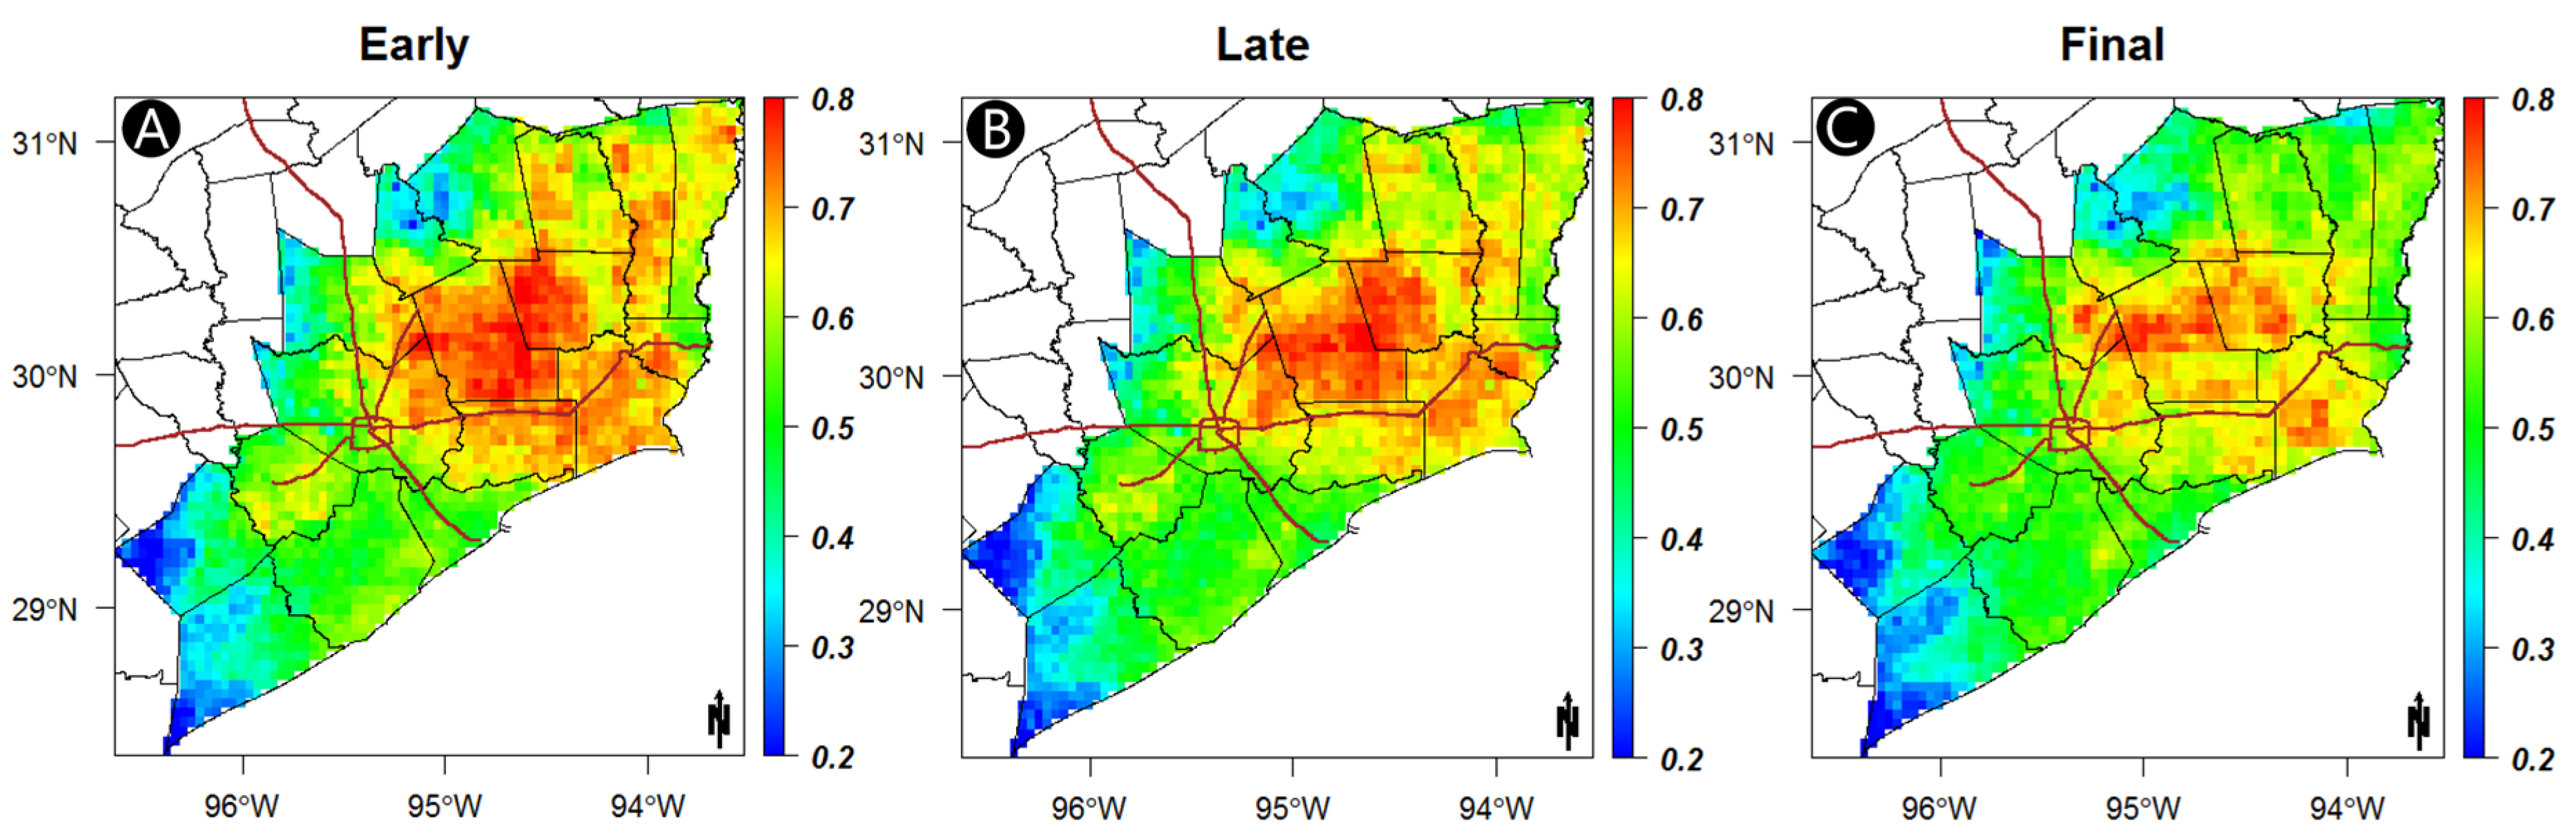
The spatial distribution of the critical success index (CSI) again supported that the near-real-time IMERG products (Early and Late) outperformed the Final-run, especially in the areas where the storm was most severe (Figure 12). The Early-run product showed the best performance in terms of CSI, with an average CSI of 0.57 and a median of 0.60. The Final-run product was found to have the lowest CSI, having an average value of 0.53 and a median of 0.55. To put this into perspective, in the Early-run product, about 20% of the study area showed a CSI of more than 0.7, but only 5% of the area recorded a similar CSI in the Final-run product.
The Peirce skill score (PSS) helps by providing insights into the ability of satellite products to separate the actual occurrences of precipitation from the no-occurrence instances. PSS shows the overall robustness of the system to accurately predict the tropical storm event. The Early- and Late- products again outperformed the Final-run in the PSS analysis (Figure 13), in a similar way as for FAR and CSI. The spatial distribution of PSS from the three products showed a PSS of more than 0.70 in case of the Early and Late products, however, only 36% of the area was found to have a PSS higher than 0.70 in the Final-run product. Table 3 summarizes the probabilistic statistical indices of the performance of the Early-, Late-, and Final-run products. A comparison of the summarized data with an earlier study [44] conducted over the central United States showed similar values of POD (~0.91), slightly lower values of FAR (~0.33), and slightly higher values of CSI (~0.62) for fall months (September, October and November).
4. Conclusions
This study focused on the performance of the GPM-IMERG- Early-, Late-, and Final-run satellite precipitation products during the Tropical Storm Imelda. Categorized as a tropical storm at midday on 17 September by the National Hurricane Center (NHC), Imelda made landfall with massive downpours during 17–19 September 2019. The spatial distribution and temporal evolution of the storm during 17–20 September showed that the storm caused two major peak precipitations; one on 18 September and one on 19 September.
The quality of IMERG products at hourly and 0.1° × 0.1° temporal resolutions during the storm was evaluated using Stage-IV radar measurements as a reference. The hourly Stage-IV radar product was calibrated and adjusted using rain gauge networks in the surrounding study area. The timeframe of the data was adjusted to include three days before the landfall and three days after the dissipation to better capture the temporal and spatial variability of the event.
Generally, areas that received a higher amount of precipitation were found to have relatively good statistical metrics by all three of the IMERG GPM products. Maps of the CC showed that the alignment of the IMERG and radar was not as good as other studies have shown, with an average of 0.60 for the best product [53,62,70]. Moreover, the coefficient of determination (R2) for all three IMERG products was just 0.4. When it comes to RMSE, three-quarters (ranging from 73% to 76%) of the area experienced an RMSE of less than 5 mm in all three IMERG products. The IMERG GPM Final-run product showed a huge overestimation of the storm, which was confirmed by basic statistical indices. The spatial distribution of the RBIAS indicated similar patterns in the near-real-time IMERG products (Early and Late). However, the gauge-adjusted IMERG product (Final-run) showed the very high overestimation and underestimation across the affected region varied by location (inland and coastal areas). Significant underestimation was found in the hard-hit coastal areas, whereas significant overestimation was recorded in the relatively less-hit inland areas. This summarizes the weakness of satellite-based precipitation products; it has been reported in the literature for a long time that the IMERG products underestimate precipitations during extreme (heavy) events and overestimate average to low events [70,71,72,73,74,75]. It is also notable that during summer and fall months, IMERG products have been found to show dry biases for convective systems [44]. The Early-run showed a much better RBIAS relative to the Final-run product. However, when considering the overall performance of the IMERG products, it was poor, because areas with an acceptable range of RBIAS (i.e., between −10% and 10%) in all the three IMERG products were only about 16% to 17% of the total area.
Probabilistic statistical indices showed that all three products were successful in capturing the precipitation event with adequate accuracy (average POD ≈ 0.9). FAR index results were less strong, with the Early- and Late-run products having almost 67% of the areas with a FAR <0.4; however, only 40% of the areas in the Final-run product showed a FAR <0.4. PSS and CSI scores showed that the IMERG GPM Final-run product was outperformed by the near-real-time IMERG products (Early and Late) in capturing the entire storm event with better accuracy.
Overall, between the products, the Early-run was found to be better than the Late- and Final-run products for capturing the storm precipitation. Thus, it can be opined that the processing algorithm that used the monthly gauge analysis to develop the Final-run failed to capture extreme events that occurred for more than a few days. Furthermore, better precipitation estimates for all stages of the GPM products will be crucial in hydrological analysis and modeling during extreme events, such as hurricanes, tornadoes, and tropical storms. This conclusion is supported by earlier studies on IMERG-GPM products during extreme precipitation events [35,53,68,69].
Author Contributions
Conceptualization, S.S., D.G. and H.O.S.; methodology, S.S. and D.G.; software, D.G.; validation, S.S., D.G. and H.O.S.; formal analysis, S.S.; investigation, D.G.; resources, H.O.S.; data curation, D.G.; writing—original draft preparation, S.S.; writing—review and editing, S.S. and H.O.S.; visualization, S.S. and D.G.; supervision, H.O.S. All authors have read and agreed to the published version of the manuscript.
Funding
This research was partially funded by U.S. Army Research Office (Grant W912HZ-14-P-0160) and a grant from UTSA (University of Texas at San Antonio) Open Cloud Institute (OCI) entitled “Prediction of Crash Incidence and Severity on Texas Roadways”.
Institutional Review Board Statement
Not applicable.
Informed Consent Statement
Not applicable.
Data Availability Statement
The data presented in this study are available in http://pmm.nasa.gov/data-access/downloads/gpm/ (accessed on 26 May 2021) and http://data.eol.ucar.edu/ (accessed on 26 May 2021).
Acknowledgments
The aforementioned funding and supports are committedly acknowledged.
Conflicts of Interest
The authors declare no conflict of interest.
References
- NOAA National Centers for Environmental Information (NCEI) U.S. Billion-Dollar Weather and Climate Disasters. 2020. Available online: https://www.ncdc.noaa.gov/billions/ (accessed on 22 March 2020).
- Smith, A.B. U.S. Billion-Dollar Weather and Climate Disasters, 1980–Present (NCEI Accession 0209268); NOAA National Centers for Environmental Information 2020. Available online: https://doi.org/10.25921/stkw-7w73 (accessed on 22 March 2020).
- Schuetz, R.A. Texas Leads Country in Disasters. 18 April 2019. Available online: https://www.houstonchronicle.com/business/real-estate/article/Texas-leads-country-in-disasters-13777748.php (accessed on 22 March 2020).
- Besse, G.; Sakib, S.; Gang, D.; Hayes, D. Performance characterization of a novel marsh shoreline protection technology: The Wave Suppression and Sediment Collection (WSSC) system. Ocean Eng. 2018, 154, 216–225. [Google Scholar] [CrossRef]
- Sakib, S. Design Optimization and Field Performance Evaluation of the Wave Suppression and Sediment Collection (WSSC) System: Computational Fluid Dynamics (CFD) Modeling, Surface Elevation Table (SET) Survey, and Marker Clay Study; University of Louisiana at Lafayette: Lafayette, Louisiana, 2017. [Google Scholar]
- Sakib, S.; Gang, D.; Besse, G.; Tang, B.-B.; McCoy, N.; Hayes, D. Laboratory study and mathematical modeling of a novel marsh shoreline protection technology for sand collection. Appl. Ocean Res. 2018, 76, 22–33. [Google Scholar] [CrossRef]
- Landreneau, D.; Brazzell, J.; Mogged, T.; Erickson, R.; Warthen, S. Tropical Storm Imelda. Tropical Weather 2019. Available online: https://www.weather.gov/lch/2019Imelda (accessed on 22 March 2020).
- Bui, H.T.; Ishidaira, H.; Shaowei, N. Evaluation of the use of global satellite–gauge and satellite-only precipitation products in stream flow simulations. Appl. Water Sci. 2019, 9, 53. [Google Scholar] [CrossRef] [Green Version]
- Prakash, S.; Mitra, A.K.; AghaKouchak, A.; Liu, Z.; Norouzi, H.; Pai, D.S. A preliminary assessment of GPM-based multi-satellite precipitation estimates over a monsoon dominated region. J. Hydrol. 2018, 556, 865–876. [Google Scholar] [CrossRef] [Green Version]
- Liu, Z. Comparison of Integrated Multisatellite Retrievals for GPM (IMERG) and TRMM Multisatellite Precipitation Analysis (TMPA) Monthly Precipitation Products: Initial Results. J. Hydrometeorol. 2016, 17, 777–790. [Google Scholar] [CrossRef]
- Guo, H.; Chen, S.; Bao, A.; Hu, J.; Gebregiorgis, A.S.; Xue, X.; Zhang, X. Inter-Comparison of High-Resolution Satellite Precipitation Products over Central Asia. Remote Sens. 2015, 7, 7181–7211. [Google Scholar] [CrossRef] [Green Version]
- Wang, W.; Lu, H.; Zhao, T.; Jiang, L.; Shi, J. Evaluation and Comparison of Daily Rainfall From Latest GPM and TRMM Products Over the Mekong River Basin. IEEE J. Sel. Top. Appl. Earth Obs. Remote Sens. 2017, 10, 2540–2549. [Google Scholar] [CrossRef]
- Wang, Z.; Zhong, R.; Lai, C.; Chen, J. Evaluation of the GPM IMERG satellite-based precipitation products and the hydrological utility. Atmos. Res. 2017, 196, 151–163. [Google Scholar] [CrossRef]
- Afshari, S.; Tavakoly, A.A.; Rajib, M.A.; Zheng, X.; Follum, M.L.; Omranian, E.; Fekete, B.M. Comparison of new generation low-complexity flood inundation mapping tools with a hydrodynamic model. J. Hydrol. 2018, 556, 539–556. [Google Scholar] [CrossRef]
- Omranian, E.; Sharif, H. Evaluation of the Global Precipitation Measurement (GPM) Satellite Rainfall Products over the Lower Colorado River Basin, Texas. JAWRA J. Am. Water Resour. Assoc. 2018, 54, 882–898. [Google Scholar] [CrossRef]
- Gilewski, P.; Nawalany, M. Inter-Comparison of Rain-Gauge, Radar, and Satellite (IMERG GPM) Precipitation Estimates Performance for Rainfall-Runoff Modeling in a Mountainous Catchment in Poland. Water 2018, 10, 1665. [Google Scholar] [CrossRef] [Green Version]
- Tapiador, F.J.; Turk, F.J.; Petersen, W.; Hou, A.Y.; García-Ortega, E.; Machado, L.A.T.; Angelis, C.F.; Salio, P.; Kidd, C.; Huffman, G.J.; et al. Global precipitation measurement: Methods, datasets and applications. Atmos. Res. 2012, 104–105, 70–97. [Google Scholar] [CrossRef]
- Li, Z.; Yang, D.; Hong, Y. Multi-scale evaluation of high-resolution multi-sensor blended global precipitation products over the Yangtze River. J. Hydrol. 2013, 500, 157–169. [Google Scholar] [CrossRef]
- Michaelides, S.; Levizzani, V.; Anagnostou, E.; Bauer, P.; Kasparis, T.; Lane, J. Precipitation: Measurement, remote sensing, climatology and modeling. Atmos. Res. 2009, 94, 512–533. [Google Scholar] [CrossRef]
- Guo, H.; Chen, S.; Bao, A.; Behrangi, A.; Hong, Y.; Ndayisaba, F.; Hu, J.; Stepanian, P.M. Early assessment of Integrated Multi-satellite Retrievals for Global Precipitation Measurement over China. Atmos. Res. 2016, 176, 121–133. [Google Scholar] [CrossRef]
- Aksoy, A.; Dowell, D.C.; Snyder, C. A Multicase Comparative Assessment of the Ensemble Kalman Filter for Assimilation of Radar Observations. Part I: Storm-Scale Analyses. Mon. Weather. Rev. 2009, 137, 1805–1824. [Google Scholar] [CrossRef] [Green Version]
- Berne, A.; Krajewski, W. Radar for hydrology: Unfulfilled promise or unrecognized potential? Adv. Water Resour. 2013, 51, 357–366. [Google Scholar] [CrossRef]
- Gabella, M.; Morin, E.; Notarpietro, R.; Michaelides, S. Winter precipitation fields in the Southeastern Mediterranean area as seen by the Ku-band spaceborne weather radar and two C-band ground-based radars. Atmos. Res. 2013, 119, 120–130. [Google Scholar] [CrossRef]
- Germann, U.; Galli, G.; Boscacci, M.; Bolliger, M. Radar precipitation measurement in a mountainous region. Q. J. R. Meteorol. Soc. 2006, 132, 1669–1692. [Google Scholar] [CrossRef]
- Heinselman, P.L.; Priegnitz, D.L.; Manross, K.L.; Smith, T.M.; Adams, R.W. Rapid Sampling of Severe Storms by the National Weather Radar Testbed Phased Array Radar. Weather. Forecast. 2008, 23, 808–824. [Google Scholar] [CrossRef]
- Krajewski, W.F.; Villarini, G.; Smith, J.A. RADAR-Rainfall Uncertainties: Where are We after Thirty Years of Effort? Bull. Am. Meteorol. Soc. 2010, 91, 87–94. [Google Scholar] [CrossRef]
- McKee, J.L.; Binns, A.D. A review of gauge–radar merging methods for quantitative precipitation estimation in hydrology. Can. Water Resour. J. Rev. Can. Ressour. Hydr. 2016, 41, 186–203. [Google Scholar] [CrossRef]
- Szturc, J.; Ośródka, K.; Jurczyk, A. Quality index scheme for quantitative uncertainty characterization of radar-based precipitation. Meteorol. Appl. 2011, 18, 407–420. [Google Scholar] [CrossRef]
- Sharifi, E.; Steinacker, R.; Saghafian, B. Assessment of GPM-IMERG and Other Precipitation Products against Gauge Data under Different Topographic and Climatic Conditions in Iran: Preliminary Results. Remote Sens. 2016, 8, 135. [Google Scholar] [CrossRef] [Green Version]
- Cecinati, F.; Wani, O.; Rico-Ramirez, M.A. Comparing Approaches to Deal With Non-Gaussianity of Rainfall Data in Kriging-Based Radar-Gauge Rainfall Merging. Water Resour. Res. 2017, 53, 8999–9018. [Google Scholar] [CrossRef]
- Gabella, M.; Amitai, E. Radar rainfall estimates in an alpine environment using different gage-adjustment techniques. Phys. Chem. Earth, Part B Hydrol. Oceans Atmos. 2000, 25, 927–931. [Google Scholar] [CrossRef]
- Keblouti, M.; Ouerdachi, L.; Berhail, S. The use of weather radar for rainfall-runoff modeling, case of Seybouse watershed (Algeria). Arab. J. Geosci. 2013, 8, 1–11. [Google Scholar] [CrossRef]
- Sikorska, A.; Seibert, J. Value of different precipitation data for flood prediction in an alpine catchment: A Bayesian approach. J. Hydrol. 2018, 556, 961–971. [Google Scholar] [CrossRef]
- Gebregiorgis, A.S.; Kirstetter, P.; Hong, Y.E.; Gourley, J.J.; Huffman, G.J.; Petersen, W.A.; Xue, X.; Schwaller, M.R. To What Extent is the Day 1 GPM IMERG Satellite Precipitation Estimate Improved as Compared to TRMM TMPA-RT? J. Geophys. Res. Atmos. 2018, 123, 1694–17077. [Google Scholar] [CrossRef]
- Sunilkumar, K.; Yatagai, A.; Masuda, M. Preliminary Evaluation of GPM-IMERG Rainfall Estimates Over Three Distinct Climate Zones With APHRODITE. Earth Space Sci. 2019, 6, 1321–1335. [Google Scholar] [CrossRef] [Green Version]
- AghaKouchak, A.; Behrangi, A.; Sorooshian, S.; Hsu, K.; Amitai, E. Evaluation of satellite-retrieved extreme precipitation rates across the central United States. J. Geophys. Res. Space Phys. 2011, 116, D02115. [Google Scholar] [CrossRef]
- Mehran, A.; AghaKouchak, A. Capabilities of satellite precipitation datasets to estimate heavy precipitation rates at different temporal accumulations. Hydrol. Process. 2014, 28, 2262–2270. [Google Scholar] [CrossRef]
- Romine, G.S.; Schwartz, C.S.; Snyder, C.; Anderson, J.L.; Weisman, M.L. Model Bias in a Continuously Cycled Assimilation System and Its Influence on Convection-Permitting Forecasts. Mon. Weather. Rev. 2013, 141, 1263–1284. [Google Scholar] [CrossRef]
- Smalley, M.; L’Ecuyer, T.; Lebsock, M.; Haynes, J. A Comparison of Precipitation Occurrence from the NCEP Stage IV QPE Product and the CloudSat Cloud Profiling Radar. J. Hydrometeorol. 2014, 15, 444–458. [Google Scholar] [CrossRef]
- Chen, J.; Wang, Z.; Wu, X.; Chen, X.; Lai, C.; Zeng, Z.; Li, J. Accuracy evaluation of GPM multi-satellite precipitation products in the hydrological application over alpine and gorge regions with sparse rain gauge network. Hydrol. Res. 2019, 50, 1710–1729. [Google Scholar] [CrossRef] [Green Version]
- Gosset, M.; Alcoba, M.; Roca, R.; Cloché, S.; Urbani, G. Evaluation of TAPEER daily estimates and other GPM-era products against dense gauge networks in West Africa, analysing ground reference uncertainty. Q. J. R. Meteorol. Soc. 2018, 144, 255–269. [Google Scholar] [CrossRef] [Green Version]
- Sungmin, O.; Foelsche, U.; Kirchengast, G.; Fuchsberger, J.; Tan, J.; Petersen, W.A. Evaluation of GPM IMERG Early, Late, and Final rainfall estimates using WegenerNet gauge data in southeastern Austria. Hydrol. Earth Syst. Sci. 2017, 21, 6559–6572. [Google Scholar]
- Zubieta, R.; Getirana, A.; Espinoza, J.C.; Lavado-Casimiro, W.; Aragon, L. Hydrological modeling of the Peruvian–Ecuadorian Amazon Basin using GPM-IMERG satellite-based precipitation dataset. Hydrol. Earth Syst. Sci. 2017, 21, 3543–3555. [Google Scholar] [CrossRef] [Green Version]
- Cui, W.; Dong, X.; Xi, B.; Feng, Z.; Fan, J. Can the GPM IMERG Final Product Accurately Represent MCSs’ Precipitation Characteristics over the Central and Eastern United States? J. Hydrometeorol. 2020, 21, 39–57. [Google Scholar] [CrossRef]
- Chen, F.; Li, X. Evaluation of IMERG and TRMM 3B43 Monthly Precipitation Products over Mainland China. Remote Sens. 2016, 8, 472. [Google Scholar] [CrossRef] [Green Version]
- Islam, M.A. Statistical comparison of satellite-retrieved precipitation products with rain gauge observations over Bangladesh. Int. J. Remote Sens. 2018, 39, 2906–2936. [Google Scholar] [CrossRef] [Green Version]
- Krishna, U.V.M.; Das, S.K.; Deshpande, S.M.; Doiphode, S.L.; Pandithurai, G. The assessment of Global Precipitation Measurement estimates over the Indian subcontinent. Earth Space Sci. 2017, 4, 540–553. [Google Scholar] [CrossRef]
- Bhuiyan, M.A.E.; Yang, F.; Biswas, N.K.; Rahat, S.H.; Neelam, T.J. Machine Learning-Based Error Modeling to Improve GPM IMERG Precipitation Product over the Brahmaputra River Basin. Forecasting 2020, 2, 14. [Google Scholar] [CrossRef]
- Bhuiyan, M.A.E.; Anagnostou, E.N.; Kirstetter, P.-E. A Nonparametric Statistical Technique for Modeling Overland TMI (2A12) Rainfall Retrieval Error. IEEE Geosci. Remote Sens. Lett. 2017, 14, 1898–1902. [Google Scholar] [CrossRef]
- Biemans, H.; Hutjes, R.W.A.; Kabat, P.; Strengers, B.J.; Gerten, D.; Rost, S. Effects of Precipitation Uncertainty on Discharge Calculations for Main River Basins. J. Hydrometeorol. 2009, 10, 1011–1025. [Google Scholar] [CrossRef]
- Bhuiyan, M.A.E.; Nikolopoulos, E.I.; Anagnostou, E.N. Machine Learning–-Based Blending of Satellite and Reanalysis Precipitation Datasets: A Multiregional Tropical Complex Terrain Evaluation. J. Hydrometeorol. 2019, 20, 2147–2161. [Google Scholar] [CrossRef]
- Bhuiyan, M.A.E.; Nikolopoulos, E.I.; Anagnostou, E.N.; Polcher, J.; Albergel, C.; Dutra, E.; Fink, G.; la Torre, A.M.; Munier, S. Assessment of precipitation error propagation in multi-model global water resource reanalysis. Hydrol. Earth Syst. Sci. 2019, 23, 1973–1994. [Google Scholar] [CrossRef] [Green Version]
- Omranian, E.; Sharif, H.; Tavakoly, A. How Well Can Global Precipitation Measurement (GPM) Capture Hurricanes? Case Study: Hurricane Harvey. Remote Sens. 2018, 10, 1150. [Google Scholar] [CrossRef] [Green Version]
- Billah, K.; Adegbite, Q.; Sharif, H.; Dessouky, S.; Simcic, L. Analysis of Intersection Traffic Safety in the City of San Antonio, 2013–2017. Sustainability 2021, 13, 5296. [Google Scholar] [CrossRef]
- Hinojosa, J.; Green, J.; Estrada, F.; Herrera, J.; Mata, T.; Phan, D.; Pasha, A.T.; Matta, A.; Johnson, D.; Kapoor, V. Determining the primary sources of fecal pollution using microbial source tracking assays combined with land-use information in the Edwards Aquifer. Water Res. 2020, 184, 116211. [Google Scholar] [CrossRef]
- Kapoor, V.; Gupta, I.; Pasha, A.B.M.T.; Phan, D. Real-Time Quantitative PCR Measurements of Fecal Indicator Bacteria and Human-Associated Source Tracking Markers in a Texas River following Hurricane Harvey. Environ. Sci. Technol. Lett. 2018, 5, 322–328. [Google Scholar] [CrossRef]
- Morshed, S.A.; Arafat, M.; Mokhtarimousavi, S.; Khan, S.S.; Amine, K. 8R Resilience Model: A stakeholder-centered approach of disaster resilience for transportation infrastructure and network. Transp. Eng. 2021, 4, 100058. [Google Scholar] [CrossRef]
- Morshed, S.A.; Arafat, M.; Ahmed, A.; Saha, R. Discovering the Commuters’ Assessments on Disaster Resilience of Transportation Infrastructure. In Proceedings of the International Conference on Transportation and Development 2020, Seattle, WA, USA, 26–29 May 2020; pp. 23–34. [Google Scholar]
- Pasha, A.B.M.T.; Hinojosa, J.; Phan, D.; Lopez, A.; Kapoor, V. Detection of human fecal pollution in environmental waters using human mitochondrial DNA and correlation with general and human-associated fecal genetic markers. J. Water Heal. 2019, 18, 8–18. [Google Scholar] [CrossRef]
- Anjum, M.N.; Ahmad, I.; Ding, Y.; Shangguan, D.; Zaman, M.; Ijaz, M.W.; Sarwar, K.; Han, H.; Yang, M. Assessment of IMERG-V06 Precipitation Product over Different Hydro-Climatic Regimes in the Tianshan Mountains, North-Western China. Remote Sens. 2019, 11, 2314. [Google Scholar] [CrossRef] [Green Version]
- Moazami, S.; Najafi, M. A comprehensive evaluation of GPM-IMERG V06 and MRMS with hourly ground-based precipitation observations across Canada. J. Hydrol. 2021, 594, 125929. [Google Scholar] [CrossRef]
- Furl, C.; Ghebreyesus, D.; Sharif, H.O. Assessment of the Performance of Satellite-Based Precipitation Products for Flood Events across Diverse Spatial Scales Using GSSHA Modeling System. Geosciences 2018, 8, 191. [Google Scholar] [CrossRef] [Green Version]
- Nielsen-Gammon, J.W.; Zhang, F.; Odins, A.M.; Myoung, B. Extreme Rainfall in Texas: Patterns and Predictability. Phys. Geogr. 2005, 26, 340–364. [Google Scholar] [CrossRef] [Green Version]
- Lin, Y.; Mitchell, K.E. The NCEP stage II/IV hourly precipitation analyses: Development and applications. In Proceedings of the 19th Conference Hydrology, American Meteorological Society, San Diego, CA, USA, 9–13 January 2005. [Google Scholar]
- Gupta, H.V.; Kling, H.; Yilmaz, K.K.; Martinez, G.F. Decomposition of the mean squared error and NSE performance criteria: Implications for improving hydrological modelling. J. Hydrol. 2009, 377, 80–91. [Google Scholar] [CrossRef] [Green Version]
- Kling, H.; Fuchs, M.; Paulin, M. Runoff conditions in the upper Danube basin under an ensemble of climate change scenarios. J. Hydrol. 2012, 424–425, 264–277. [Google Scholar] [CrossRef]
- Tang, S.; Li, R.; He, J.; Wang, H.; Fan, X.; Yao, S. Comparative Evaluation of the GPM IMERG Early, Late, and Final Hourly Precipitation Products Using the CMPA Data over Sichuan Basin of China. Water 2020, 12, 554. [Google Scholar] [CrossRef] [Green Version]
- Asong, Z.E.; Razavi, S.; Wheater, H.S.; Wong, J.S. Evaluation of Integrated Multisatellite Retrievals for GPM (IMERG) over Southern Canada against Ground Precipitation Observations: A Preliminary Assessment. J. Hydrometeorol. 2017, 18, 1033–1050. [Google Scholar] [CrossRef]
- He, Z.; Yang, L.; Tian, F.; Ni, G.; Hou, A.; Lu, H. Intercomparisons of Rainfall Estimates from TRMM and GPM Multisatellite Products over the Upper Mekong River Basin. J. Hydrometeorol. 2017, 18, 413–430. [Google Scholar] [CrossRef]
- Alsumaiti, T.S.; Hussein, K.; Ghebreyesus, D.T.; Sharif, H.O. Performance of the CMORPH and GPM IMERG Products over the United Arab Emirates. Remote Sens. 2020, 12, 1426. [Google Scholar] [CrossRef]
- Bajracharya, S.R.; Palash, W.; Shrestha, M.S.; Khadgi, V.R.; Duo, C.; Das, P.J.; Dorji, C. Systematic Evaluation of Satellite-Based Rainfall Products over the Brahmaputra Basin for Hydrological Applications. Adv. Meteorol. 2015, 2015, 398687. [Google Scholar] [CrossRef]
- Liechti, T.C.; Matos, G.D.S.C.; Boillat, J.; Schleiss, A.J. Comparison and evaluation of satellite derived precipitation products for hydrological modeling of the Zambezi River Basin. Hydrol. Earth Syst. Sci. 2012, 16, 489–500. [Google Scholar] [CrossRef] [Green Version]
- Milewski, A.; Elkadiri, R.; Durham, M. Assessment and Comparison of TMPA Satellite Precipitation Products in Varying Climatic and Topographic Regimes in Morocco. Remote Sens. 2015, 7, 5697–5717. [Google Scholar] [CrossRef] [Green Version]
- Wehbe, Y.; Ghebreyesus, D.; Temimi, M.; Milewski, A.; Al Mandous, A. Assessment of the consistency among global precipitation products over the United Arab Emirates. J. Hydrol. Reg. Stud. 2017, 12, 122–135. [Google Scholar] [CrossRef]
- Wehbe, Y.; Temimi, M.; Ghebreyesus, D.T.; Milewski, A.; Norouzi, H.; Ibrahim, E. Consistency of precipitation products over the Arabian Peninsula and interactions with soil moisture and water storage. Hydrol. Sci. J. 2018, 63, 408–425. [Google Scholar] [CrossRef]
Figure 1.
Path track of the Tropical Storm Imelda before and after its landfall in Freeport, TX at 17:45–18:00 UTC 17 September 2019 (green line shows the path of the Tropical Strom Imelda). Precipitation estimates are based on radar data.
Figure 1.
Path track of the Tropical Storm Imelda before and after its landfall in Freeport, TX at 17:45–18:00 UTC 17 September 2019 (green line shows the path of the Tropical Strom Imelda). Precipitation estimates are based on radar data.

Figure 2.
The spatial distribution of the cumulative precipitation estimation (≥10 mm) captured by IMERG (A) Early-, (B) Late-, (C) Final-run products, and (D) Stage-IV products during Tropical Storm Imelda from 14 to 21 September 2019.
Figure 2.
The spatial distribution of the cumulative precipitation estimation (≥10 mm) captured by IMERG (A) Early-, (B) Late-, (C) Final-run products, and (D) Stage-IV products during Tropical Storm Imelda from 14 to 21 September 2019.

Figure 3.
Evolution of the Tropical Storm Imelda after its landfall on 17 September 2019 (daily rainfall ≥30 mm are shown) and spatial pattern captured by (A) IMERG Final-run, (B) Stage-IV products.
Figure 3.
Evolution of the Tropical Storm Imelda after its landfall on 17 September 2019 (daily rainfall ≥30 mm are shown) and spatial pattern captured by (A) IMERG Final-run, (B) Stage-IV products.

Figure 4.
Time series plot of areal average precipitation estimates captured by the IMERG and Stage-IV products during Tropical Storm Imelda (17–21 September 2019).
Figure 4.
Time series plot of areal average precipitation estimates captured by the IMERG and Stage-IV products during Tropical Storm Imelda (17–21 September 2019).

Figure 5.
Spatial distributions of the correlation coefficient (CC) between Stage-IV radar data and (A) IMERG Early-, (B) Late-, and (C) Final-run products over 17 Counties in Texas (n = 192; hourly from 14–21 September 2019).
Figure 5.
Spatial distributions of the correlation coefficient (CC) between Stage-IV radar data and (A) IMERG Early-, (B) Late-, and (C) Final-run products over 17 Counties in Texas (n = 192; hourly from 14–21 September 2019).

Figure 6.
Scatterplot of IMERG (A) Early-, (B) Late-, and (C) Final-run products, and Stage-IV average hourly precipitation data from 14 to 21 September 2019.
Figure 6.
Scatterplot of IMERG (A) Early-, (B) Late-, and (C) Final-run products, and Stage-IV average hourly precipitation data from 14 to 21 September 2019.

Figure 7.
Spatial distribution of RSME for the IMERG (A) Early-, (B) Late-, and (C) Final-run hourly products during Tropical Storm Imelda.
Figure 7.
Spatial distribution of RSME for the IMERG (A) Early-, (B) Late-, and (C) Final-run hourly products during Tropical Storm Imelda.

Figure 8.
Spatial distribution of RBIAS for the IMERG (A) Early-, (B) Late-, and (C) Final-run products during Tropical Storm Imelda.
Figure 8.
Spatial distribution of RBIAS for the IMERG (A) Early-, (B) Late-, and (C) Final-run products during Tropical Storm Imelda.

Figure 9.
Spatial distribution of KGE for the IMERG (A) Early-, (B) Late-, and (C) Final-run products during Tropical Storm Imelda.
Figure 9.
Spatial distribution of KGE for the IMERG (A) Early-, (B) Late-, and (C) Final-run products during Tropical Storm Imelda.

Figure 10.
Spatial distribution of POD for the IMERG (A) Early-, (B) Late-, and (C) Final-run products during Tropical Storm Imelda.
Figure 10.
Spatial distribution of POD for the IMERG (A) Early-, (B) Late-, and (C) Final-run products during Tropical Storm Imelda.

Figure 11.
Spatial distribution of FAR for the IMERG (A) Early-, (B) Late-, and (C) Final-run products during Tropical Storm Imelda.
Figure 11.
Spatial distribution of FAR for the IMERG (A) Early-, (B) Late-, and (C) Final-run products during Tropical Storm Imelda.

Figure 12.
Spatial distribution of CSI for the IMERG (A) Early-, (B) Late-, and (C) Final-run products during Tropical Storm Imelda.
Figure 12.
Spatial distribution of CSI for the IMERG (A) Early-, (B) Late-, and (C) Final-run products during Tropical Storm Imelda.

Figure 13.
Spatial distribution of PSS for the IMERG (A) Early-, (B) Late-, and (C) Final-run products during Tropical Storm Imelda.
Figure 13.
Spatial distribution of PSS for the IMERG (A) Early-, (B) Late-, and (C) Final-run products during Tropical Storm Imelda.


Table 1.
Statistical performance indicators used for evaluation of the satellite products.
| Category | Index | Formula | Range | Perfect Value |
|---|---|---|---|---|
| Basic Statistical Indices 1 | Correlation Coefficient (CC) 2 | 1 | ||
| Relative Bias (RBIAS) | 0 | |||
| Root Mean Square Error (RMSE) | 0 | |||
| Kling–Gupta model efficiency coefficient (KGE) | 1 | |||
| Probabilistic Statistical Indices 1 | Probability of detection (POD) | 1 | ||
| False Alarm Ratio (FAR) | 0 | |||
| Critical Success Index (CSI) | 1 | |||
| Peirce Skill Score (PSS) | 1 |
1n: Sample size; Satn: IMERG rainfall estimate; Radn: Radar rainfall estimate; : IMERG average rainfall estimate; : Radar average rainfall estimate; SDSat: Standard deviation of IMERG rainfall estimates; SDRat: Standard deviation of radar rainfall estimates; CSR: Number of detected rainfall hours recorded by GPM satellite and radar; CRMS: Number of detected rainfall hours recorded by radar but absent in GPM satellite estimates; CSMR: Number of detected rainfall hours recorded by GPM satellite and absent in radar estimates; MSR: Number of rainfall hours missed by both IMERG and radar products (no estimate). 2 In this study, the negative correlation coefficients were also examined to better understand the discrepancies.
Table 2.
The areal average of the basic statistical indices of the satellite products.
| Study Period | Product | CC | RMSE | RBIAS (%) | KGE |
|---|---|---|---|---|---|
| 14–21 September 2019 | Early | 0.574 | 3.74 | −4.0 | 0.36 |
| Late | 0.600 | 3.66 | −11.00 | 0.39 | |
| Final | 0.595 | 3.88 | 41.00 | 0.16 |
Table 3.
The areal average of the probabilistic statistical indices of the satellite products.
| Study Period | Product | POD | FAR | CSI | PSS |
|---|---|---|---|---|---|
| 14–21 September 2019 | Early | 0.87 | 0.38 | 0.57 | 0.68 |
| Late | 0.90 | 0.41 | 0.56 | 0.68 | |
| Final | 0.91 | 0.44 | 0.53 | 0.65 |
Publisher’s Note: MDPI stays neutral with regard to jurisdictional claims in published maps and institutional affiliations. |
© 2021 by the authors. Licensee MDPI, Basel, Switzerland. This article is an open access article distributed under the terms and conditions of the Creative Commons Attribution (CC BY) license (https://creativecommons.org/licenses/by/4.0/).
Share and Cite
MDPI and ACS Style
Sakib, S.; Ghebreyesus, D.; Sharif, H.O. Performance Evaluation of IMERG GPM Products during Tropical Storm Imelda. Atmosphere 2021, 12, 687. https://0-doi-org.brum.beds.ac.uk/10.3390/atmos12060687
AMA Style
Sakib S, Ghebreyesus D, Sharif HO. Performance Evaluation of IMERG GPM Products during Tropical Storm Imelda. Atmosphere. 2021; 12(6):687. https://0-doi-org.brum.beds.ac.uk/10.3390/atmos12060687
Chicago/Turabian StyleSakib, Salman, Dawit Ghebreyesus, and Hatim O. Sharif. 2021. "Performance Evaluation of IMERG GPM Products during Tropical Storm Imelda" Atmosphere 12, no. 6: 687. https://0-doi-org.brum.beds.ac.uk/10.3390/atmos12060687
Note that from the first issue of 2016, this journal uses article numbers instead of page numbers. See further details here.