
Development of a Flash Drought Intensity Index

 , , , , ,
  , and
, and 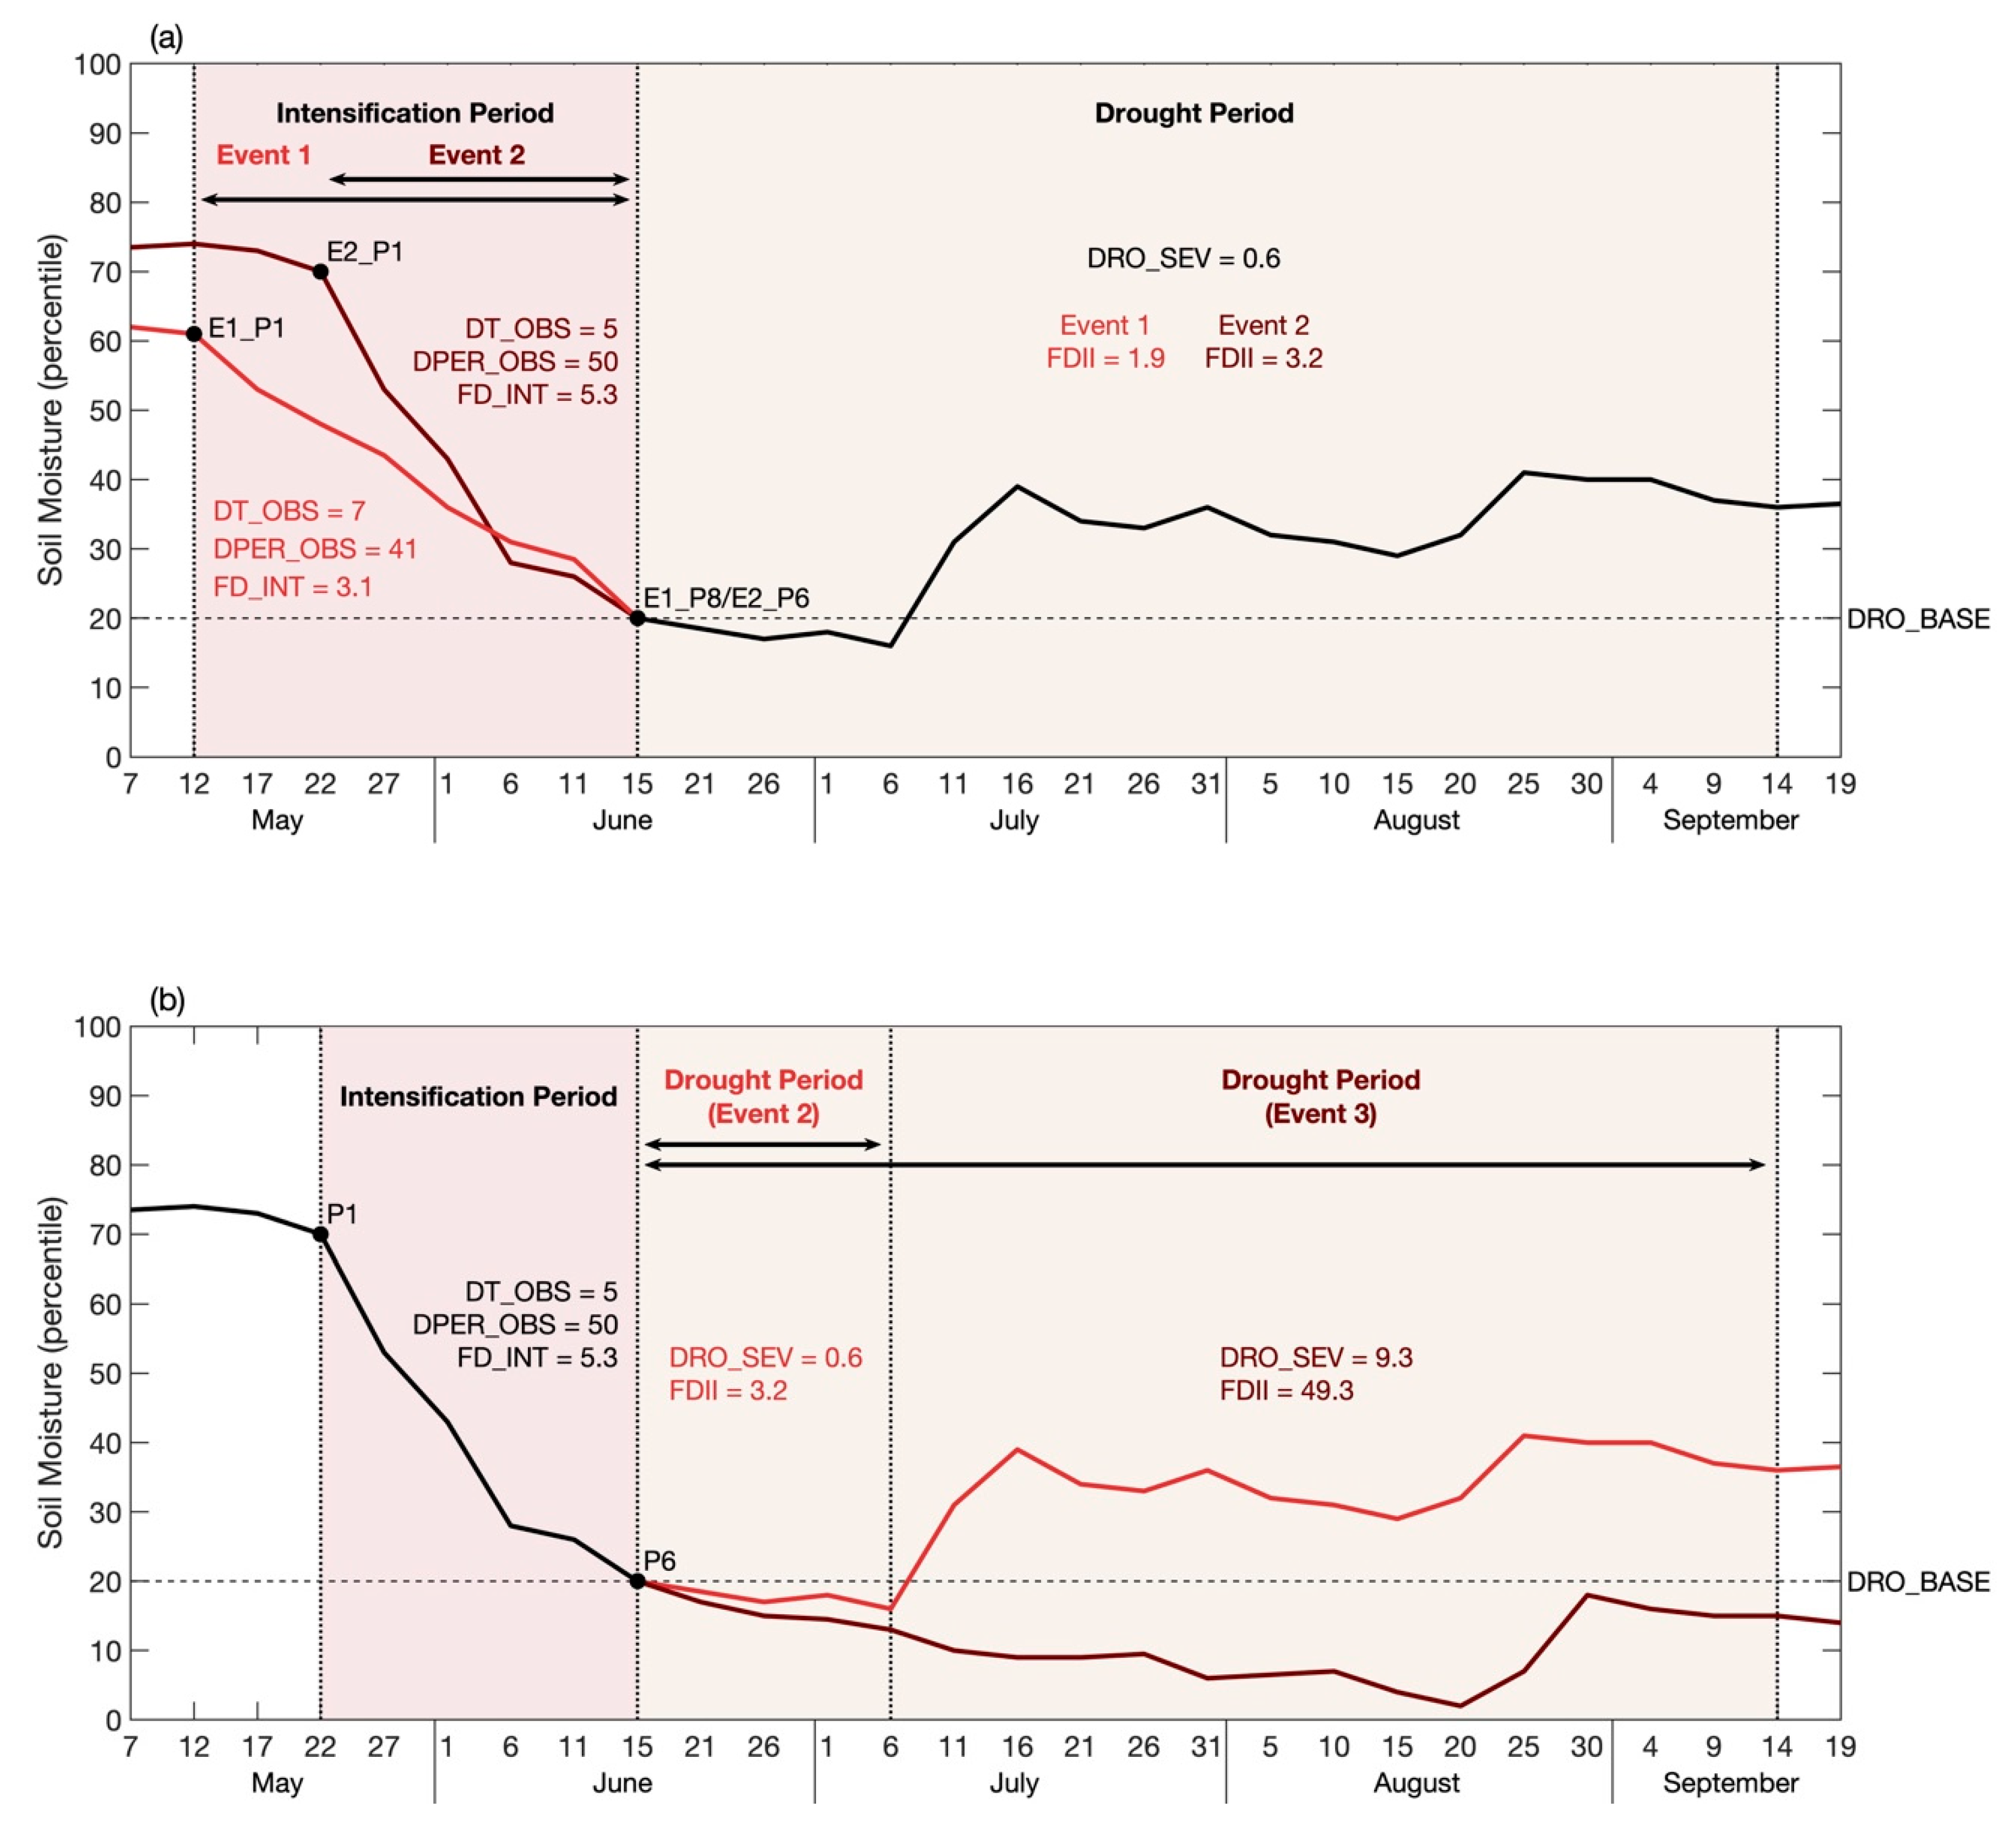
Abstract
:1. Introduction
2. Materials and Methods
2.1. Soil Moisture
2.2. Flash Drought Intensity Index (FDII)
3. Results
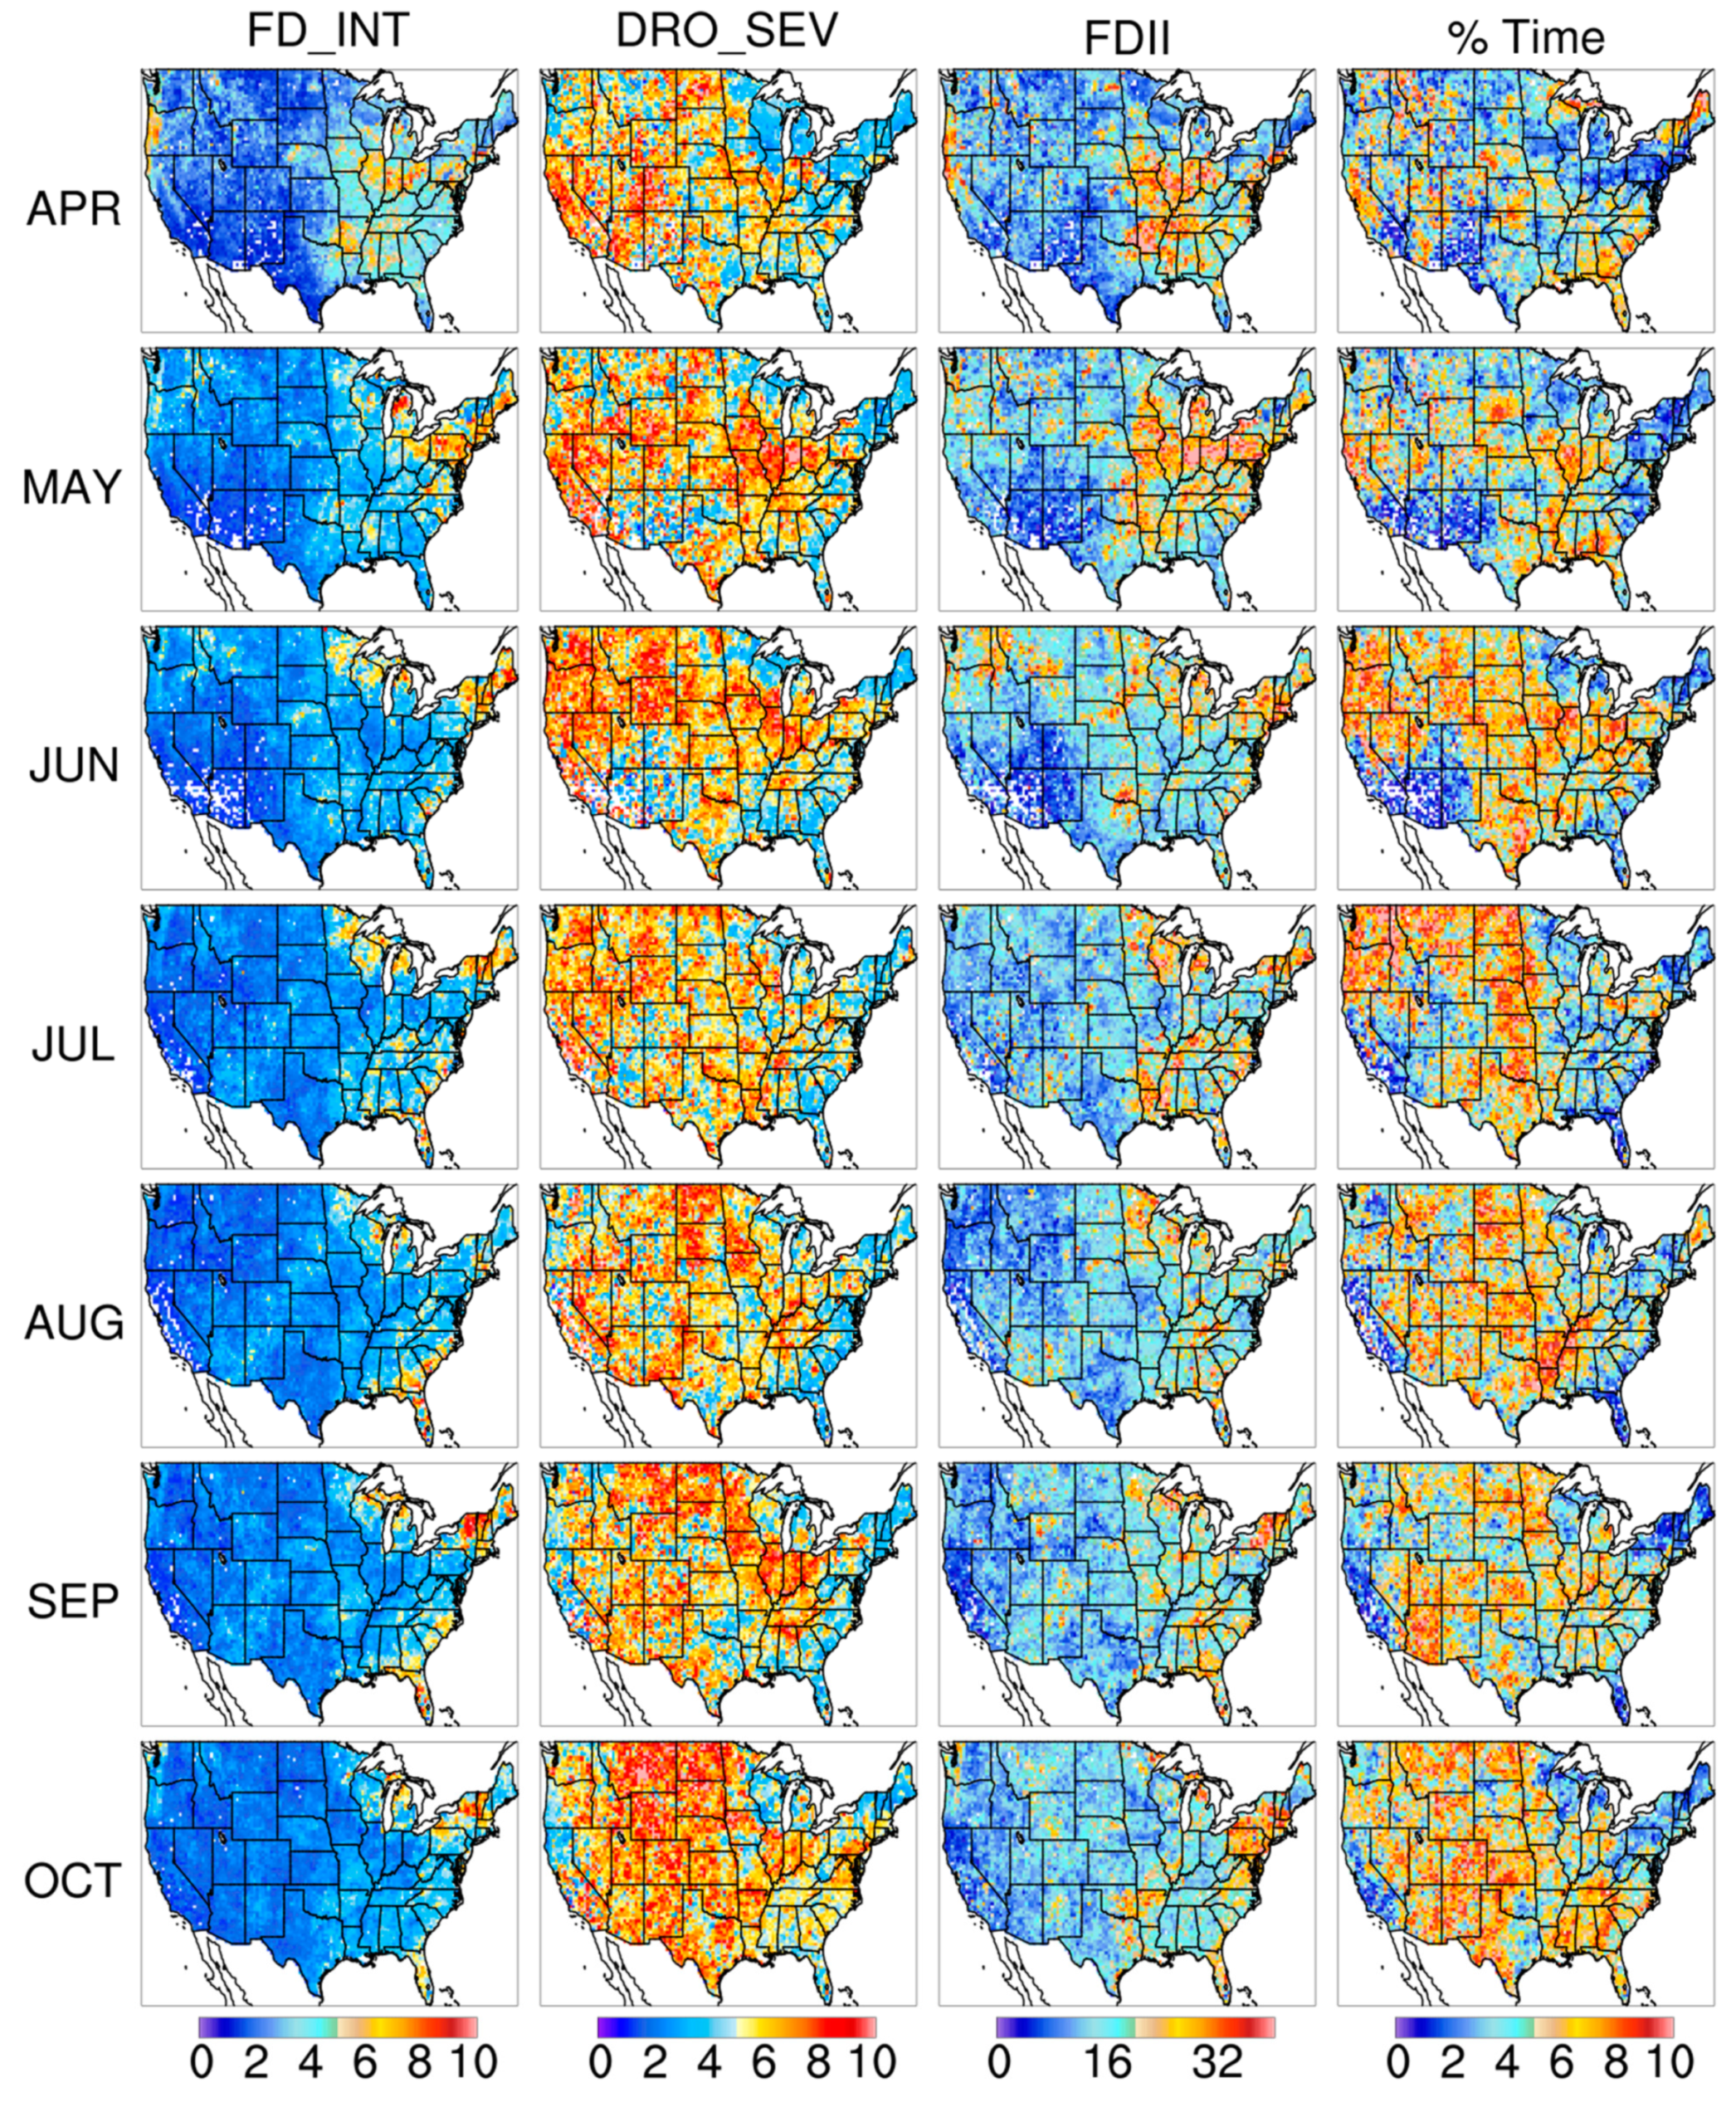
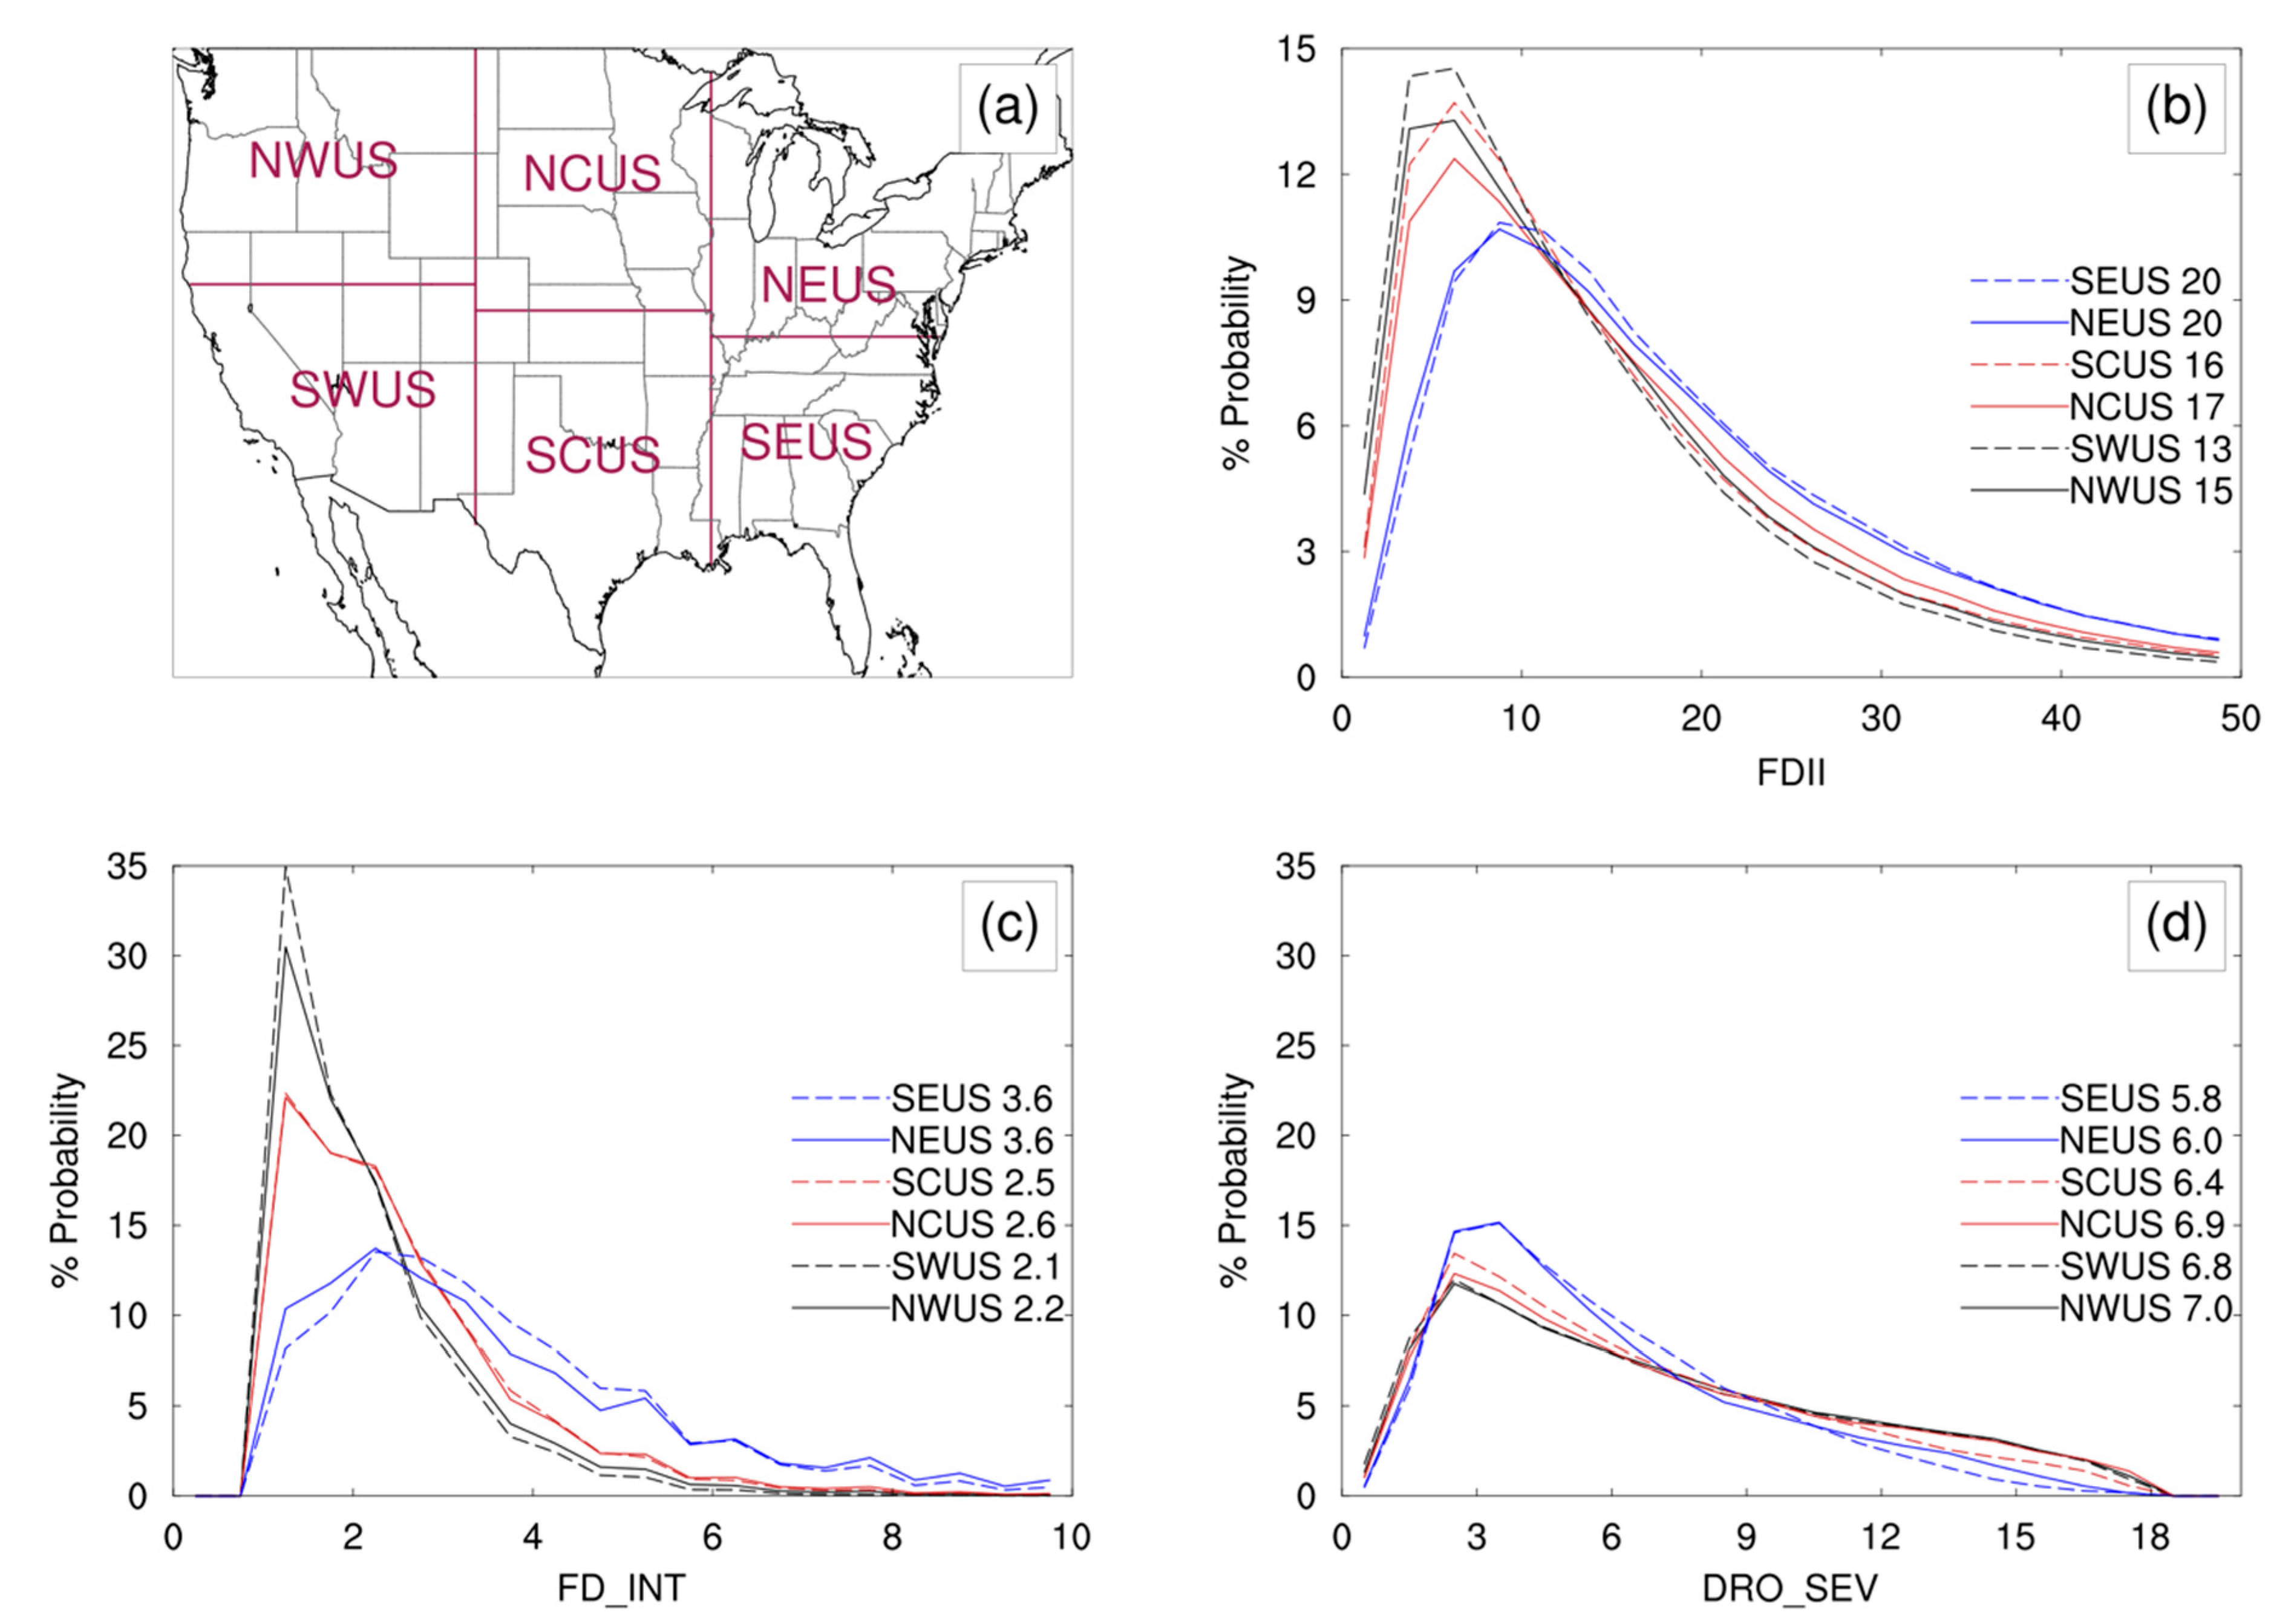
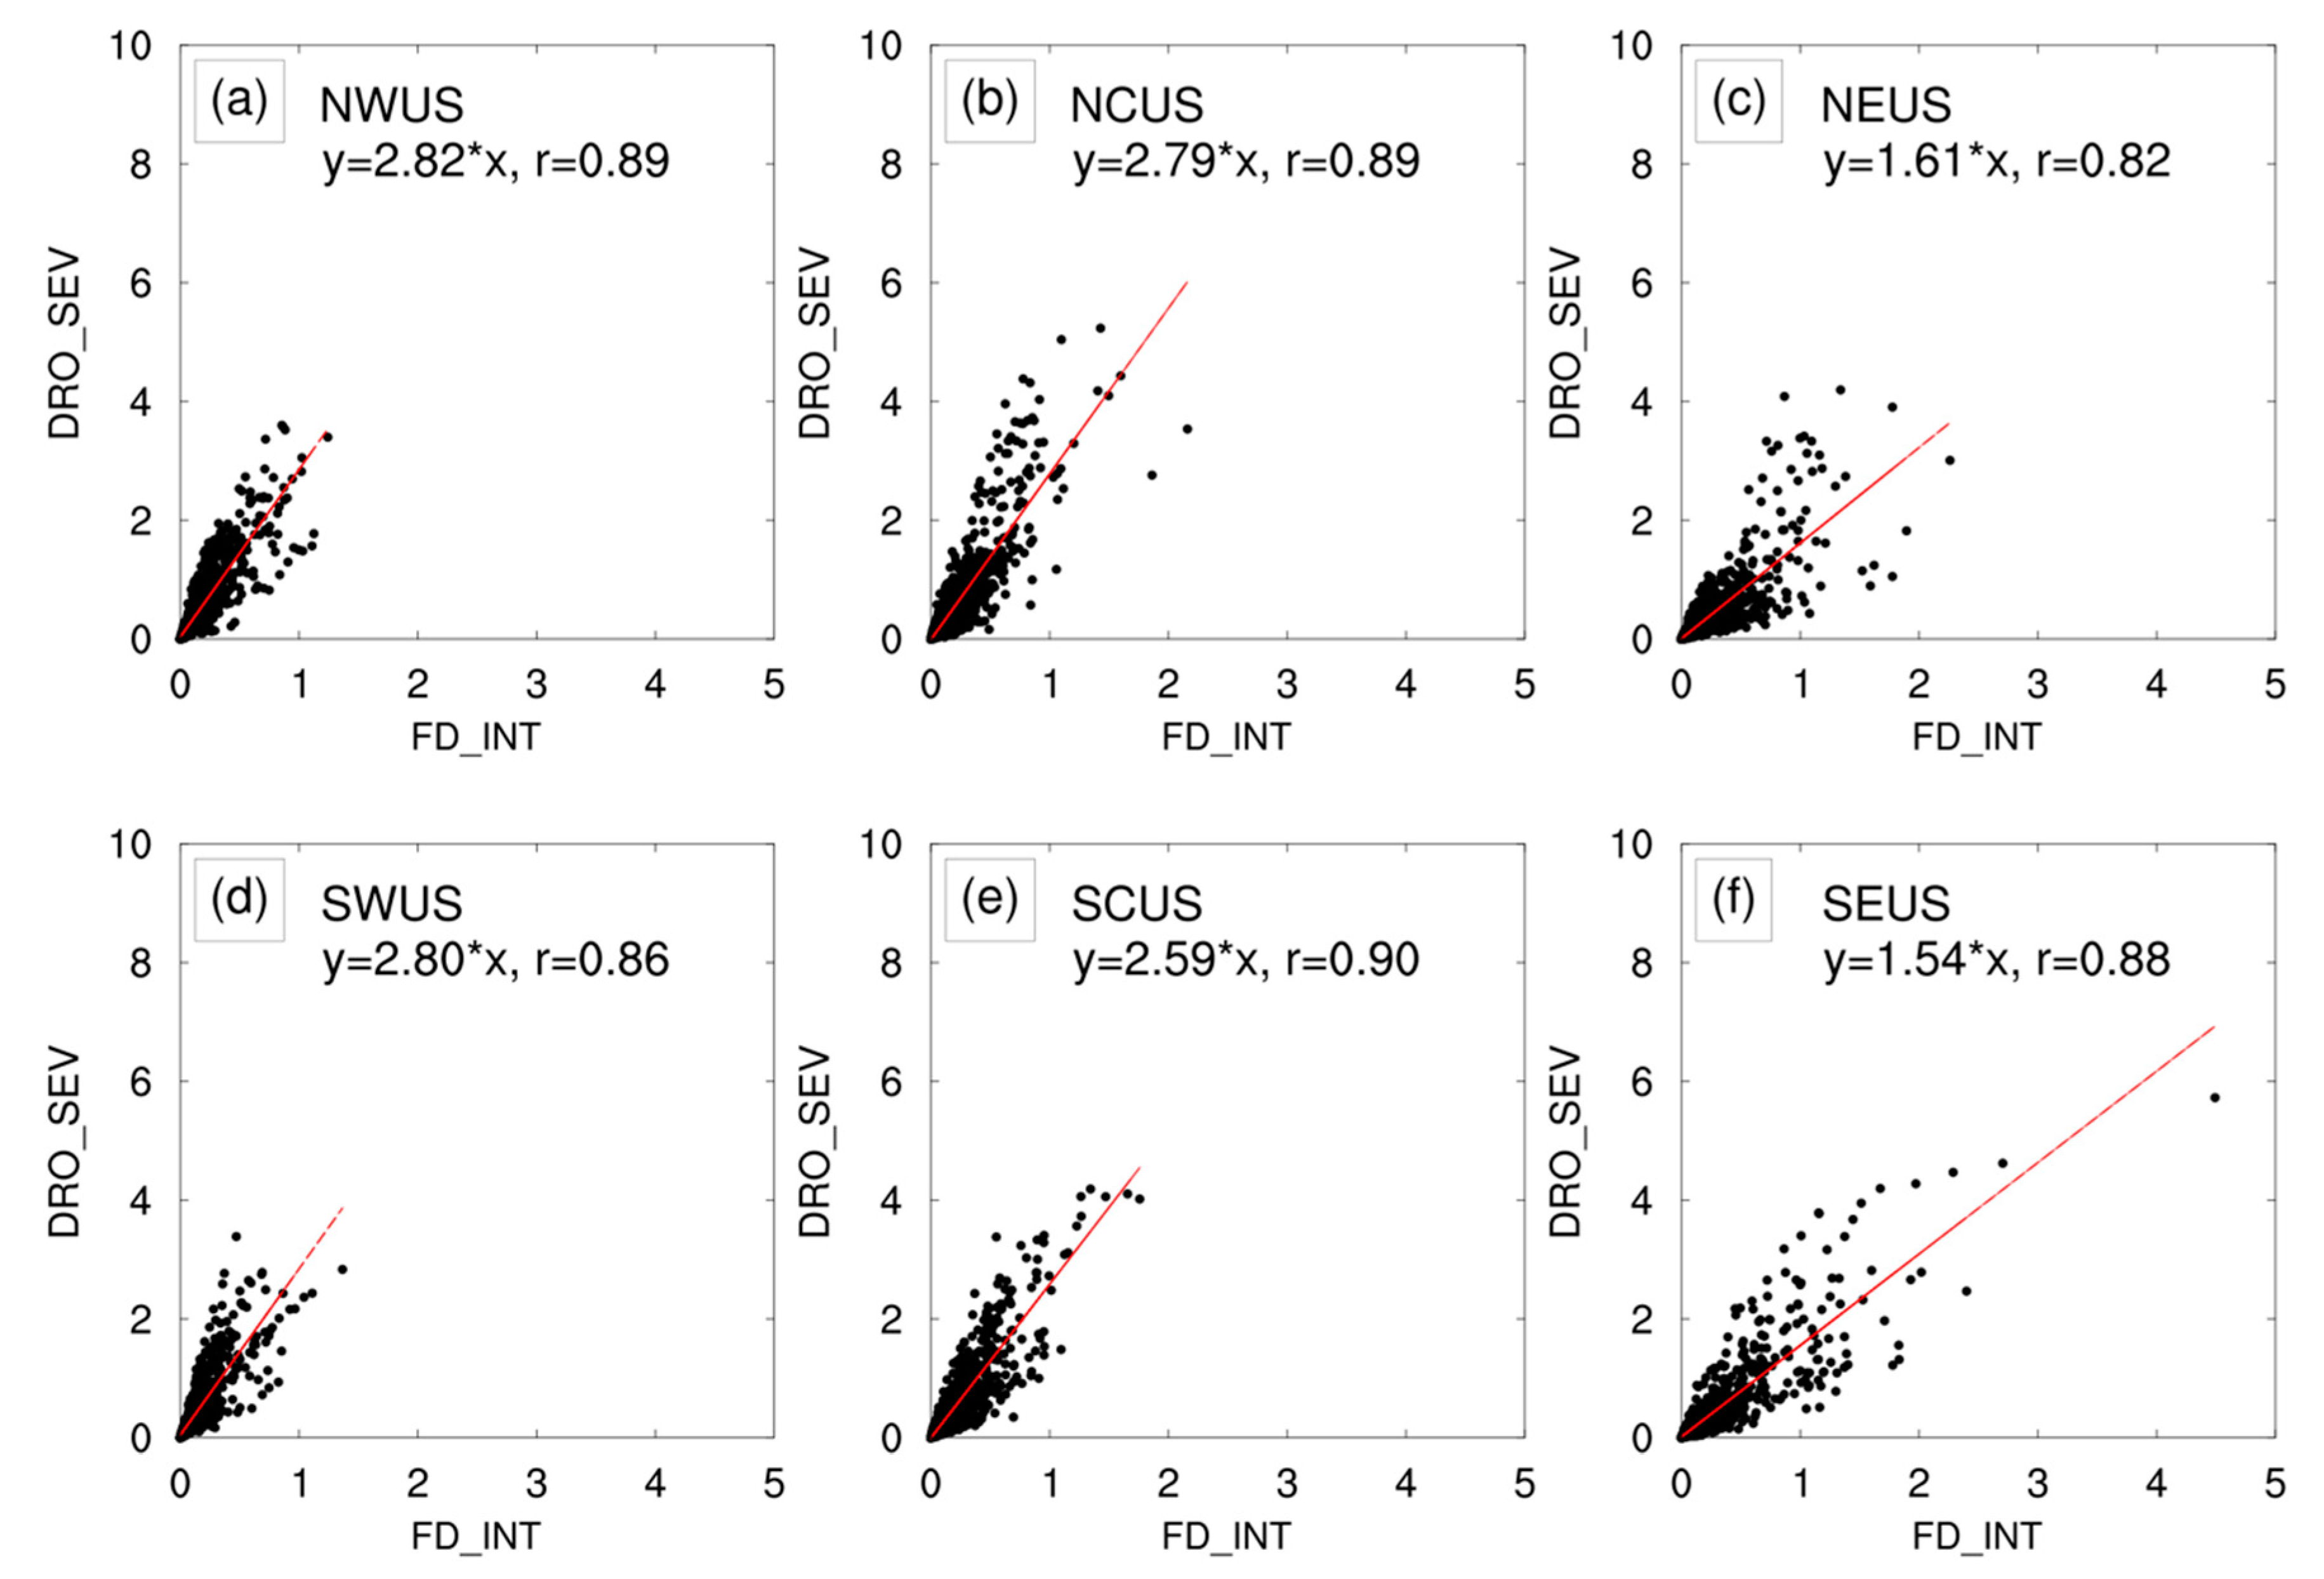
3.1. Flash Drought Climatology
3.2. Flash Drought Case Study
4. Discussion
Author Contributions
Funding
Institutional Review Board Statement
Informed Consent Statement
Data Availability Statement
Acknowledgments
Conflicts of Interest
References
- Otkin, J.A.; Svoboda, M.; Hunt, E.D.; Ford, T.W.; Anderson, M.C.; Hain, C.; Basara, J.B. Flash Droughts: A Review and Assessment of the Challenges Imposed by Rapid-Onset Droughts in the United States. Bull. Am. Meteorol. Soc. 2018, 99, 911–919. [Google Scholar] [CrossRef]
- Otkin, J.A.; Anderson, M.C.; Hain, C.; Mladenova, I.; Basara, J.; Svoboda, M. Examining flash drought development using the thermal infrared based Evaporative Stress Index. J. Hydrometeorol. 2013, 14, 1057–1074. [Google Scholar] [CrossRef]
- Ford, T.W.; Labosier, C.F. Meteorological conditions associated with the onset of flash drought in the eastern United States. Agric. For. Meteorol. 2017, 247, 414–423. [Google Scholar] [CrossRef]
- Anderson, M.C.; Hain, C.; Otkin, J.A.; Zhan, X.; Mo, K.; Svoboda, M.; Wardlow, B.; Pimstein, A. An intercomparison of drought indicators based on thermal remote sensing and NLDAS simulations with U.S. Drought Monitor Classifications. J. Hydrometeorol. 2013, 14, 1035–1056. [Google Scholar] [CrossRef]
- Mozny, M.; Trnka, M.; Zalud, Z.; Hlavinka, P.; Nekovar, P.; Potop, V.; Virag, M. Use of a soil moisture network for drought monitoring in the Czech Republic. Theor. Appl. Climatol. 2012, 107, 99–111. [Google Scholar] [CrossRef]
- Otkin, J.A.; Anderson, M.C.; Hain, C.; Svoboda, M. Examining the relationship between drought development and rapid changes in the Evaporative Stress Index. J. Hydrometeorol. 2014, 15, 938–956. [Google Scholar] [CrossRef]
- Hunt, E.; Svoboda, M.; Wardlow, B.; Hubbard, K.; Hayes, M.J.; Arkebauer, T. Monitoring the effects of rapid onset of drought on non-irrigated maize with agronomic data and climate-based drought indices. J. Agric. For. Meteorol. 2014, 191, 1–11. [Google Scholar] [CrossRef]
- Ford, T.W.; McRoberts, D.B.; Quiring, S.M.; Hall, R.E. On the utility of in situ soil moisture observations for flash drought early warning in Oklahoma, USA. Geophys. Res. Lett. 2015, 42, 9790–9798. [Google Scholar] [CrossRef]
- Zscheischler, J.; Westra, S.; Hurk, B.J.J.M.V.D.; Seneviratne, S.I.; Ward, P.J.; Pitman, A.; AghaKouchak, A.; Bresch, D.N.; Leonard, M.; Wahl, T.; et al. Future climate risk from compound events. Nat. Clim. Chang. 2018, 8, 469–477. [Google Scholar] [CrossRef]
- Christian, J.I.; Basara, J.B.; Otkin, J.A.; Hunt, E.D. Regional characteristics of flash droughts across the United States. Environ. Res. Commun. 2019, 1, 125004. [Google Scholar] [CrossRef]
- Otkin, J.A.; Anderson, M.C.; Hain, C.; Svoboda, M.; Johnson, D.; Mueller, R.; Tadesse, T.; Wardlow, B.; Brown, J. Assessing the evolution of soil moisture and vegetation conditions during the 2012 United States flash drought. Agric. For. Meteorol. 2016, 218–219, 230–242. [Google Scholar] [CrossRef] [Green Version]
- Anderson, M.C.; Zolin, C.; Sentelhas, P.; Hain, C.R.; Semmens, K.; Yilmaz, M.T.; Gao, F.; Otkin, J.A.; Tetrault, R. Assessing correlations of satellite-derived evapotranspiration, precipitation, and leaf area index anomalies with yields of major Brazilian crops. Remote Sens. Environ. 2016, 174, 82–99. [Google Scholar] [CrossRef]
- Zhang, M.; Yuan, X.; Otkin, J.A. Remote sensing of the impact of flash drought events on terrestrial carbon dynamics over China. Carbon Balance Manag. 2020, 15, 20. [Google Scholar] [CrossRef]
- Case, J.L.; Zavodsky, B.T. Evolution of 2016 drought in the Southeastern United States from a land surface modeling perspective. Results Phys. 2018, 8, 654–656. [Google Scholar] [CrossRef]
- NOAA National Centers for Environmental Information (NCEI) US Billion-Dollar Weather and Climate Disasters. 2017. Available online: https://www.ncdc.noaa.gov/billions/ (accessed on 1 June 2021).
- Sternberg, T. Chinese drought, bread and the Arab Spring. Appl. Geogr. 2012, 34, 519–524. [Google Scholar] [CrossRef]
- Otkin, J.A.; Shafer, M.; Svoboda, M.; Wardlow, B.; Anderson, M.C.; Hain, C.; Basara, J. Facilitating the use of drought early warning information through interactions with agricultural stakeholders. Bull. Am. Meteorol. Soc. 2015, 96, 1073–1078. [Google Scholar] [CrossRef]
- Otkin, J.A.; Haigh, T.; Mucia, A.; Anderson, M.C.; Hain, C.R. Comparison of agricultural stakeholder survey results and drought monitoring datasets during the 2016 US Northern Plains flash drought. Weather Clim. Soc. 2018, 10, 867–883. [Google Scholar] [CrossRef]
- Otkin, J.A.; Zhong, Y.; Hunt, E.D.; Basara, J.; Svoboda, M.; Anderson, M.C.; Hain, C. Assessing the evolution of soil moisture and vegetation conditions during a flash drought—flash recovery sequence over the south-central United States. J. Hydrometeorol. 2019, 20, 549–562. [Google Scholar] [CrossRef]
- Haigh, T.R.; Otkin, J.A.; Mucia, A.; Hayes, M.; Burbach, M. When do livestock producers’ take action during drought? How environmental cues, climate information resources, and adaptive capacity shape response. Adv. Meteorol. 2019. [Google Scholar] [CrossRef]
- Nguyen, H.; Wheeler, M.C.; Otkin, J.A.; Cowan, T.; Frost, A.; Stone, R. Using the evaporative stress index to monitor flash drought in Australia. Environ. Res. Lett. 2019, 14. [Google Scholar] [CrossRef] [Green Version]
- Basara, J.B.; Christian, J.I.; Wakefield, R.A.; Otkin, J.A.; Hunt, E.H.; Brown, D.P. The evolution, propagation, and spread of flash drought in the Central United States during 2012. Environ. Res. Lett. 2019, 14. [Google Scholar] [CrossRef] [Green Version]
- Christian, J.I.; Basara, J.B.; Hunt, E.D.; Otkin, J.A.; Xiao, X. Flash drought development and cascading impacts associated with the 2010 Russian heatwave. Environ. Res. Lett. 2020, 15, 094078. [Google Scholar] [CrossRef]
- Liu, Y.; Zhu, Y.; Ren, L.; Otkin, J.A.; Hunt, E.D.; Yang, X.; Yuan, F.; Jian, S. Two different methods for flash drought identification: Comparison of their strengths and limitations. J. Hydrometeorol. 2020, 21, 691–704. [Google Scholar] [CrossRef]
- Christian, J.I.; Basara, J.B.; Otkin, J.A.; Hunt, E.D.; Wakefield, R.A.; Flanagan, P.X.; Xiao, X. A methodology for flash drought identification: Application of flash drought frequency across the United States. J. Hydrometeorol. 2019, 20, 833–846. [Google Scholar] [CrossRef] [Green Version]
- Li, J.; Wang, Z.; Wu, X.; Chen, J.; Guo, S.; Zhang, Z. A new framework for tracking flash drought events in space and time. Catena 2020, 194, 104763. [Google Scholar] [CrossRef]
- Koster, R.D.; Schubert, S.D.; Wang, H.; Mahanama, S.P.; Deangelis, A.M. Flash drought as captured by reanalysis data: Disentangling the contributions of precipitation deficit and excess evapotranspiration. J. Hydrometeorol. 2019, 20, 1241–1258. [Google Scholar] [CrossRef]
- Liu, Y.; Zhu, Y.; Zhang, L.; Ren, L.; Yuan, F.; Yang, X.; Jiang, S. Flash droughts characterization over China: From a perspective of the rapid intensification rate. Sci. Total Environ. 2020, 704, 135373. [Google Scholar] [CrossRef]
- Osman, M.; Zaitchik, B.F.; Badr, H.S.; Christian, J.I.; Tadesse, T.; Otkin, J.A.; Anderson, M.C. Flash drought onset over the Contiguous United States: Sensitivity of inventories and trends to quantitative definitions. Hydrol. Earth Syst. Sci. 2021, 25, 565–581. [Google Scholar] [CrossRef]
- Hobbins, M.T.; Wood, A.; McEvoy, D.; Huntington, J.; Morton, C.; Anderson, M.C.; Hain, C. The Evaporative Demand Drought Index: Part I—Linking drought evolution to variations in evaporative demand. J. Hydrometeorol. 2016, 17, 1745–1761. [Google Scholar] [CrossRef]
- McEvoy, D.J.; Huntington, J.L.; Hobbins, M.T.; Wood, A.; Morton, C.; Anderson, M.C.; Hain, C. The Evaporative Demand Drought Index. Part II: CONUS-wide assessment against common drought indicators. J. Hydrometeorol. 2016, 17, 1763–1779. [Google Scholar] [CrossRef]
- Noguera, I.; Domínguez-Castro, F.; Vicente-Serrano, S.M. Characteristics and trends of flash droughts in Spain, 1961–2018. Ann. N. Y. Acad. Sci. 2020, 1472, 155–172. [Google Scholar] [CrossRef] [PubMed]
- Svoboda, M.; LeComte, D.; Hayes, M.; Heim, R.; Gleason, K.; Angel, J.; Rippey, B.; Tinker, R.; Palecki, M.; Stooksbury, D.; et al. The Drought Monitor. Bull. Am. Meteorol. Soc. 2002, 83, 1181–1190. [Google Scholar] [CrossRef] [Green Version]
- Chen, L.G.; Gottschalck, J.; Hartman, A.; Miskus, D.; Tinker, R.; Artusa, A. Flash Drought Characteristics Based on US Drought Monitor. Atmosphere 2019, 10, 498. [Google Scholar] [CrossRef] [Green Version]
- Pendergrass, A.G.; Meehl, G.A.; Pulwarty, R.; Hobbins, M.; Hoell, A.; AghaKouchak, A.; Bonfils, C.J.W.; Gallant, A.J.E.; Ho-erling, M.; Hoffmann, D.; et al. Flash droughts present a new challenge for subseasonal-to-seasonal prediction. Nat. Clim. Chang. 2020, 10, 191–199. [Google Scholar] [CrossRef]
- Lisonbee, J.; Woloszyn, M.; Skumanich, M. Making sense of flash drought: Definitions, indicators, and where we go from here. J. Appl. Serv. Climatol. 2021. [Google Scholar] [CrossRef]
- Otkin, J.A.; Anderson, M.C.; Hain, C.; Svoboda, M. Using temporal changes in drought indices to generate probabilistic drought intensification forecasts. J. Hydrometeorol. 2015, 16, 88–105. [Google Scholar] [CrossRef]
- Hoell, A.; Parker, B.-A.; Downey, M.; Umphlett, N.; Jencso, K.; Akyuz, F.A.; Peck, D.; Hadwen, T.; Fuchs, B.; Kluck, D.; et al. Lessons learned from the 2017 flash drought across the US Northern Great Plains and Canadian Prairies. Bull. Am. Meteorol. Soc. 2020, 101, E2171–E2185. [Google Scholar] [CrossRef]
- McNeeley, S.M.; Beeton, T.A.; Ojima, D.S. Drought risk and adaptation in the interior United States: Understanding the importance of local context for resource management in times of drought. Weather Clim. Soc. 2016, 8, 147–161. [Google Scholar] [CrossRef] [Green Version]
- Ummenhofer, C.C.; Meehl, G.A. Extreme weather and climate events with ecological relevance: A review. Philos. Trans. R. Soc. B 2018, 8, 372. [Google Scholar] [CrossRef]
- Walsh, J.E.; Ballinger, T.J.; Euskirchen, E.S.; Hanna, E.; Mard, J.; Overland, J.E.; Tangen, H.; Vihma, T. Extreme weather and climate events in northern areas: A review. Earth-Sci. Rev. 2020, 209. [Google Scholar] [CrossRef]
- Ojima, D.S.; Conant, R.T.; Parton, W.J.; Lackett, J.M.; Even, T.L. Recent climate changes across the Great Plains and implications for natural resource management practices. Rangel. Ecol. Manag. 2021, in press. [Google Scholar] [CrossRef]
- Yuan, X.; Wang, L.; Wu, P.; Ji, P.; Sheffield, J.; Zhang, M. Anthropogenic shift towards higher risk of flash drought over China. Nat. Commun. 2019, 10, 4661. [Google Scholar] [CrossRef] [Green Version]
- Driouechi, F.; ElRhaz, K.; Moufouma-Okia, W.; Aridal, K.; Balhane, S. Assessing future changes of climate extreme events in the CORDEX-MENA region using regional climate model ALADIN-Climate. Earth Syst. Environ. 2020, 4, 477–492. [Google Scholar] [CrossRef]
- Cutter, S.L.; Boruff, B.J.; Shirley, W.L. Social vulnerability to environmental hazards. Soc. Sci. Q. 2003. [Google Scholar] [CrossRef]
- Tánago, I.G.; Urquijo, J.; Blauhut, V.; Villarroya, F.; De Stefano, L. Learning from experience: A systematic review of vulnerability to drought. Nat. Hazards 2016, 80, 951–973. [Google Scholar] [CrossRef]
- Engstrom, J.; Jafarzadegan, K.; Moradkhani, H. Drought vulnerability in the United States: An integrated assessment. Water 2020, 12, 2033. [Google Scholar] [CrossRef]
- Singh, N.P.; Bantilan, C.; Byjesh, K. Vulnerability and policy relevance to drought in the semi-arid tropics of Asia–A retrospective analysis. Weather Clim. Extrem. 2014, 3, 54–61. [Google Scholar] [CrossRef] [Green Version]
- Weis, S.W.M.; Agostini, V.N.; Roth, L.M.; Gilmer, B.; Schill, S.R.; Knowles, J.E.; Blyther, R. Assessing vulnerability: An integrated approach for mapping adaptive capacity, sensitivity, and exposure. Clim. Chang. 2016, 136, 615–629. [Google Scholar] [CrossRef] [Green Version]
- Anderson, C.C.; Hagenlocher, M.; Renaud, F.G.; Sebesvari, Z.; Cutter, S.L.; Emrich, C.T. Comparing index-based vulnerability assessments in the Mississippi Delta: Implications of contrasting theories, indicators, and aggregation methodologies. Int. J. Disaster Risk Reduct. 2019, 39, 101128. [Google Scholar] [CrossRef] [Green Version]
- Wei, H.; Xia, Y.; Mitchell, K.E.; Ek, M.B. Improvement of the Noah land surface model for warm season processes: Evaluation of water and energy flux simulation. Hydrol. Process. 2013, 27, 297–303. [Google Scholar] [CrossRef]
- Xia, Y.; Mitchell, K.; Ek, M.; Sheffield, J.; Cosgrove, B.; Wood, E.; Luo, L.; Alonge, C.; Wei, H.; Meng, J.; et al. Continental-scale water and energy flux analysis and validation of the North American Land Data Assimilation System project phase 2 (NLDAS-2): 1. Intercomparison and application of model products. J. Geophys. Res. 2012, 117, D03110. [Google Scholar] [CrossRef]
- Ford, T.W.; Quiring, S. Comparison of contemporary in situ, model, and satellite remote sensing soil moisture with a focus on drought monitoring. Water Resour. Res. 2019, 55, 1565–1582. [Google Scholar] [CrossRef]
- Koster, R.D.; Dirmeyer, P.A.; Guo, Z.; Bonan, G.; Chan, E.; Cox, P.; Gordon, C.T.; Kanae, S.; Kowalczyk, E.; Lawrence, D.; et al. Regions of strong coupling between soil moisture and precipitation. Science 2004, 305, 1138–1140. [Google Scholar] [CrossRef] [Green Version]
- Dirmeyer, P. The terrestrial segment of soil moisture–climate coupling. Geophys. Res. Lett. 2011, 38. [Google Scholar] [CrossRef]
- Basara, J.B.; Christian, J.I. Seasonal and interannual variability of land–atmosphere coupling across the Southern Great Plains of North America using the North American regional reanalysis. Int. J. Climatol. 2018, 38, 964–978. [Google Scholar] [CrossRef]
- Wakefield, R.A.; Basara, J.B.; Furtado, J.C.; Illston, B.G.; Ferguson, C.R.; Klein, P.M. A modified framework for quantifying land-atmosphere covariability during hydrometeorological and soil wetness extremes in Oklahoma. J. Appl. Meteorol. Climatol. 2019, 58, 1465–1483. [Google Scholar] [CrossRef]
- Zhong, Y.; Otkin, J.A.; Anderson, M.C.; Hain, C.R. Observational assessment of the relationship between the Evaporative Stress Index and soil moisture and temperature across the United States. J. Hydrometeorol. 2020, 21, 1469–1484. [Google Scholar] [CrossRef]
- Hoerling, M.; Eischeid, J.K.; Kumar, A.J.; Leung, R.; A Mariotti, A.W.; Mo, K.; Schubert, S.D.; Seager, R. Causes and predictability of the 2012 Great Plains drought. Bull. Am. Meteorol. Soc. 2014, 95, 269–282. [Google Scholar] [CrossRef] [Green Version]
- Gerken, T.; Bromley, G.T.; Ruddell, B.L.; Williams, S.; Stoy, P.C. Convective suppression before and during the United States Northern Great Plains flash drought of 2017. Hydrol. Earth Syst. Sci. 2018, 22, 4155–4163. [Google Scholar] [CrossRef] [Green Version]
- DeAngelis, A.M.; Wang, H.; Koster, R.D.; Schubert, S.D.; Chang, Y.; Marshark, J. Prediction skill of the 2012 US Great Plains flash drought in Subseasonal Experiment (SubX) Models. J. Clim. 2020, 33, 6229–6253. [Google Scholar] [CrossRef]
- Lobell, D.B.; Roberts, M.J.; Schlenker, W.; Braun, N.; Little, B.B.; Rejesus, R.M.; Hammer, G. Greater sensitivity of drought accompanies maize yield increase in the US Midwest. Science 2014, 344, 516–519. [Google Scholar] [CrossRef] [PubMed]
- Mishra, V.; Cherkauer, K. Retrospective droughts in the crop growing season: Implications to corn and soybean yield in the Midwestern United States. Agric. For. Meteorol. 2010, 150, 1030–1045. [Google Scholar] [CrossRef]
- Gini, C. Measurement of inequality of incomes. Econ. J. 1921, 31, 124–126. [Google Scholar] [CrossRef]


Publisher’s Note: MDPI stays neutral with regard to jurisdictional claims in published maps and institutional affiliations. |
© 2021 by the authors. Licensee MDPI, Basel, Switzerland. This article is an open access article distributed under the terms and conditions of the Creative Commons Attribution (CC BY) license (https://creativecommons.org/licenses/by/4.0/).
Share and Cite
Otkin, J.A.; Zhong, Y.; Hunt, E.D.; Christian, J.I.; Basara, J.B.; Nguyen, H.; Wheeler, M.C.; Ford, T.W.; Hoell, A.; Svoboda, M.; et al. Development of a Flash Drought Intensity Index. Atmosphere 2021, 12, 741. https://0-doi-org.brum.beds.ac.uk/10.3390/atmos12060741
Otkin JA, Zhong Y, Hunt ED, Christian JI, Basara JB, Nguyen H, Wheeler MC, Ford TW, Hoell A, Svoboda M, et al. Development of a Flash Drought Intensity Index. Atmosphere. 2021; 12(6):741. https://0-doi-org.brum.beds.ac.uk/10.3390/atmos12060741
Chicago/Turabian StyleOtkin, Jason A., Yafang Zhong, Eric D. Hunt, Jordan I. Christian, Jeffrey B. Basara, Hanh Nguyen, Matthew C. Wheeler, Trent W. Ford, Andrew Hoell, Mark Svoboda, and et al. 2021. "Development of a Flash Drought Intensity Index" Atmosphere 12, no. 6: 741. https://0-doi-org.brum.beds.ac.uk/10.3390/atmos12060741