
Associations between Incense-Burning Temples and Respiratory Mortality in Hong Kong


1
Science Unit, Lingnan University, Hong Kong
2
Institute of Policy Studies, Lingnan University, Hong Kong
*
Author to whom correspondence should be addressed.
Atmosphere 2021, 12(6), 774; https://0-doi-org.brum.beds.ac.uk/10.3390/atmos12060774
Submission received: 11 May 2021
/
Revised: 8 June 2021
/
Accepted: 11 June 2021
/
Published: 16 June 2021
(This article belongs to the Collection Measurement of Exposure to Air Pollution)
Abstract
:Incense burning is an important topic facing many countries in Asia. As a highly urbanized area, the overlapping of urban functional blocks in Hong Kong has resulted in many temples being located near residential and commercial areas. Therefore, the pollutants emitted by temples’ incense burning could cause severe health problems to the population. This study identified 366 Hong Kong temples and classified them into four categories: open, semi-closed, closed, and non-active, according to their incense burning characteristics. Among them, open temples have the largest average area and least quantity. Principal component analysis (PCA) indicated that building density, greenery density, water density, and temple weight are the most highly influencing factors. The temple weight is the only loading factor with a contributing factor from PC2, especially in 2006 and 2011. Furthermore, the linear regression model has been applied to analyze the correlation between variables. Although this study did not reach conclusive results about the actual impact of each temple type, the model results confirm that the temple is a sub-factor to respiratory mortality. This provides the theoretical foundation for government policy establishment of temple construction planning and community optimization in Asian cities.
1. Introduction
Traditional practice for millions of people who believe in Buddhism or Taoism includes incense burning. Their worship place is in a temple where people regularly celebrate their patron deities’ birthdays, and they visit temples impetrating the deities’ blessing when facing difficulties or seeking divine guidance [1,2]. This phenomenon is quite common, especially in East and South-East Asia. Incenses or joss sticks have been made from various substances, including resins, essential oils, aromatic substances, and synthetic substitute chemicals used in the perfume industry [3]. Generally, temples are the most concentrated sites of incense burning. Hong Kong has more than 300 registered Chinese temples. Over 70% of them are situated in urban areas with a close proximity to residential and commercial areas and are suffering from severe air pollution.
Air pollutants from incense burning have been characterized in previous studies, including particulate matter (PM10, PM2.5), volatile organic compounds (VOCs), carbonyl compounds, carbon monoxide (CO), carbon dioxide (CO2), nitrogen oxides (NOx), methane (CH4), and nonmethane hydrocarbons (NMHC) [4,5,6]. According to former experimental studies, some air pollutants emitted from temples’ incense burning, such as particulate matter and CO, had exceeded the Recommended Indoor Air Quality Objectives for Office Buildings and Public Places in Hong Kong (HKIAQO) [6]. Although pollutants’ levels vary during peak and non-peak periods and in different sites, their concentrations remain higher than the recommended level [7]. The fine and ultrafine particles lead to adverse health risks, since the particles can penetrate deep into the human respiratory system [8]. The genotoxicity and cytotoxicity of burning incense were determined to be higher than cigarette smoke [9]. The adverse health effects also include increased respiratory symptoms, increased mortality from cardiovascular disease, decreased lung function, increased incidence of lung cancer, accelerated atherosclerosis, and vascular inflammation [10,11].
Growing evidence has shown the association of incense burning with a risk to respiratory health. Even short-term exposure to particulate matter could increase the respiratory disease risk [12,13,14], particularly for worshipers who frequently visit the temple and temple workers [15,16]. Adverse effects are also associated with an elevated risk of mortality, particularly for the elderly group [17]. The incense burning emissions of benzene, 1,3-butadiene, and polycyclic aromatic hydrocarbons (PAHs) are of great concern due to their carcinogenic effects and potential cancer risk [18]. The particulate matter leads to an increase in the risk for cardiovascular and respiratory diseases [15,19,20]. Sun et al. developed an experimental animal model to show that long-term air pollution exposure to low concentrations of particulate matter altered vasomotor tone, induced vascular inflammation, and potentiated atherosclerosis [10]. In comparison, Dominici et al. estimated the effects of short-term exposure to particulate matter on the risk for hospitalization and emphasized an ongoing health threat for the elderly population [12]. Moreover, several studies have indicated that indoor particulate matter concentrations exceed that of outdoor concentrations, and the association between indoor air quality and children’s respiratory health is significant [20,21].
Lau and Luk carried out an experimental study guided by the premise that incense burning inside temples would negatively impact the air quality inside the temples as well as within their surroundings [22]. Their experimental results confirmed that the levels of pollutants outside the temples were higher than their respective background levels. Some scholars have already established the primary pollutants of incense burning and how diffusion of those pollutants occurs [4,5]. However, only a handful of them focused on the temple type with regards to the burning characteristics, their surrounding environment, and their corresponding impact on human health. Hong Kong is a unique city with a high density of residential buildings. Most of the temples are located inside the urban street canyons, with extremely close proximity to residential estates, commercial buildings, and schools, which would affect not only the people working in the temples but also those who live/work nearby. Moreover, some active temples will burn incense 24-h per day and the burning activities would be more intense during special occasions such as the Chinese New Year and other festivals. Hence, higher intensity of incense burning in temples would result in a higher concentration of particulate matter in both indoor and outdoor air [23]. Ventilation conditions, building design, burning characteristics, and the amount of incense being burned would also be major factors affecting the pollutant distributions [16,24]. Accordingly, to understand the association of air pollutants emitted from temples and human health, this study aims to explore the association between temple types and respiratory mortality in the increasingly vertical development of Hong Kong from 2001 to 2016 at a district scale. The temple would be categorized into four types according to their burning characteristic and temple design. The impact of Hong Kong’s local environmental settings, socio-economic factors, and other daily activities are also considered.
This paper aims to provide an overview of the association between different types of temples’ incense burning and respiratory mortality, explore its influence on human health, and analyze the main influencing factors in combination with the surrounding environment and background pollution. The study provides a research foundation for environmental and health issues with temples as the main research object and theoretically supports the further examination of pollutant emissions in temples. The results of this study lay a good foundation for government regional planning and community public health optimization in Asian cities.
2. Materials and Methods
2.1. Study Area
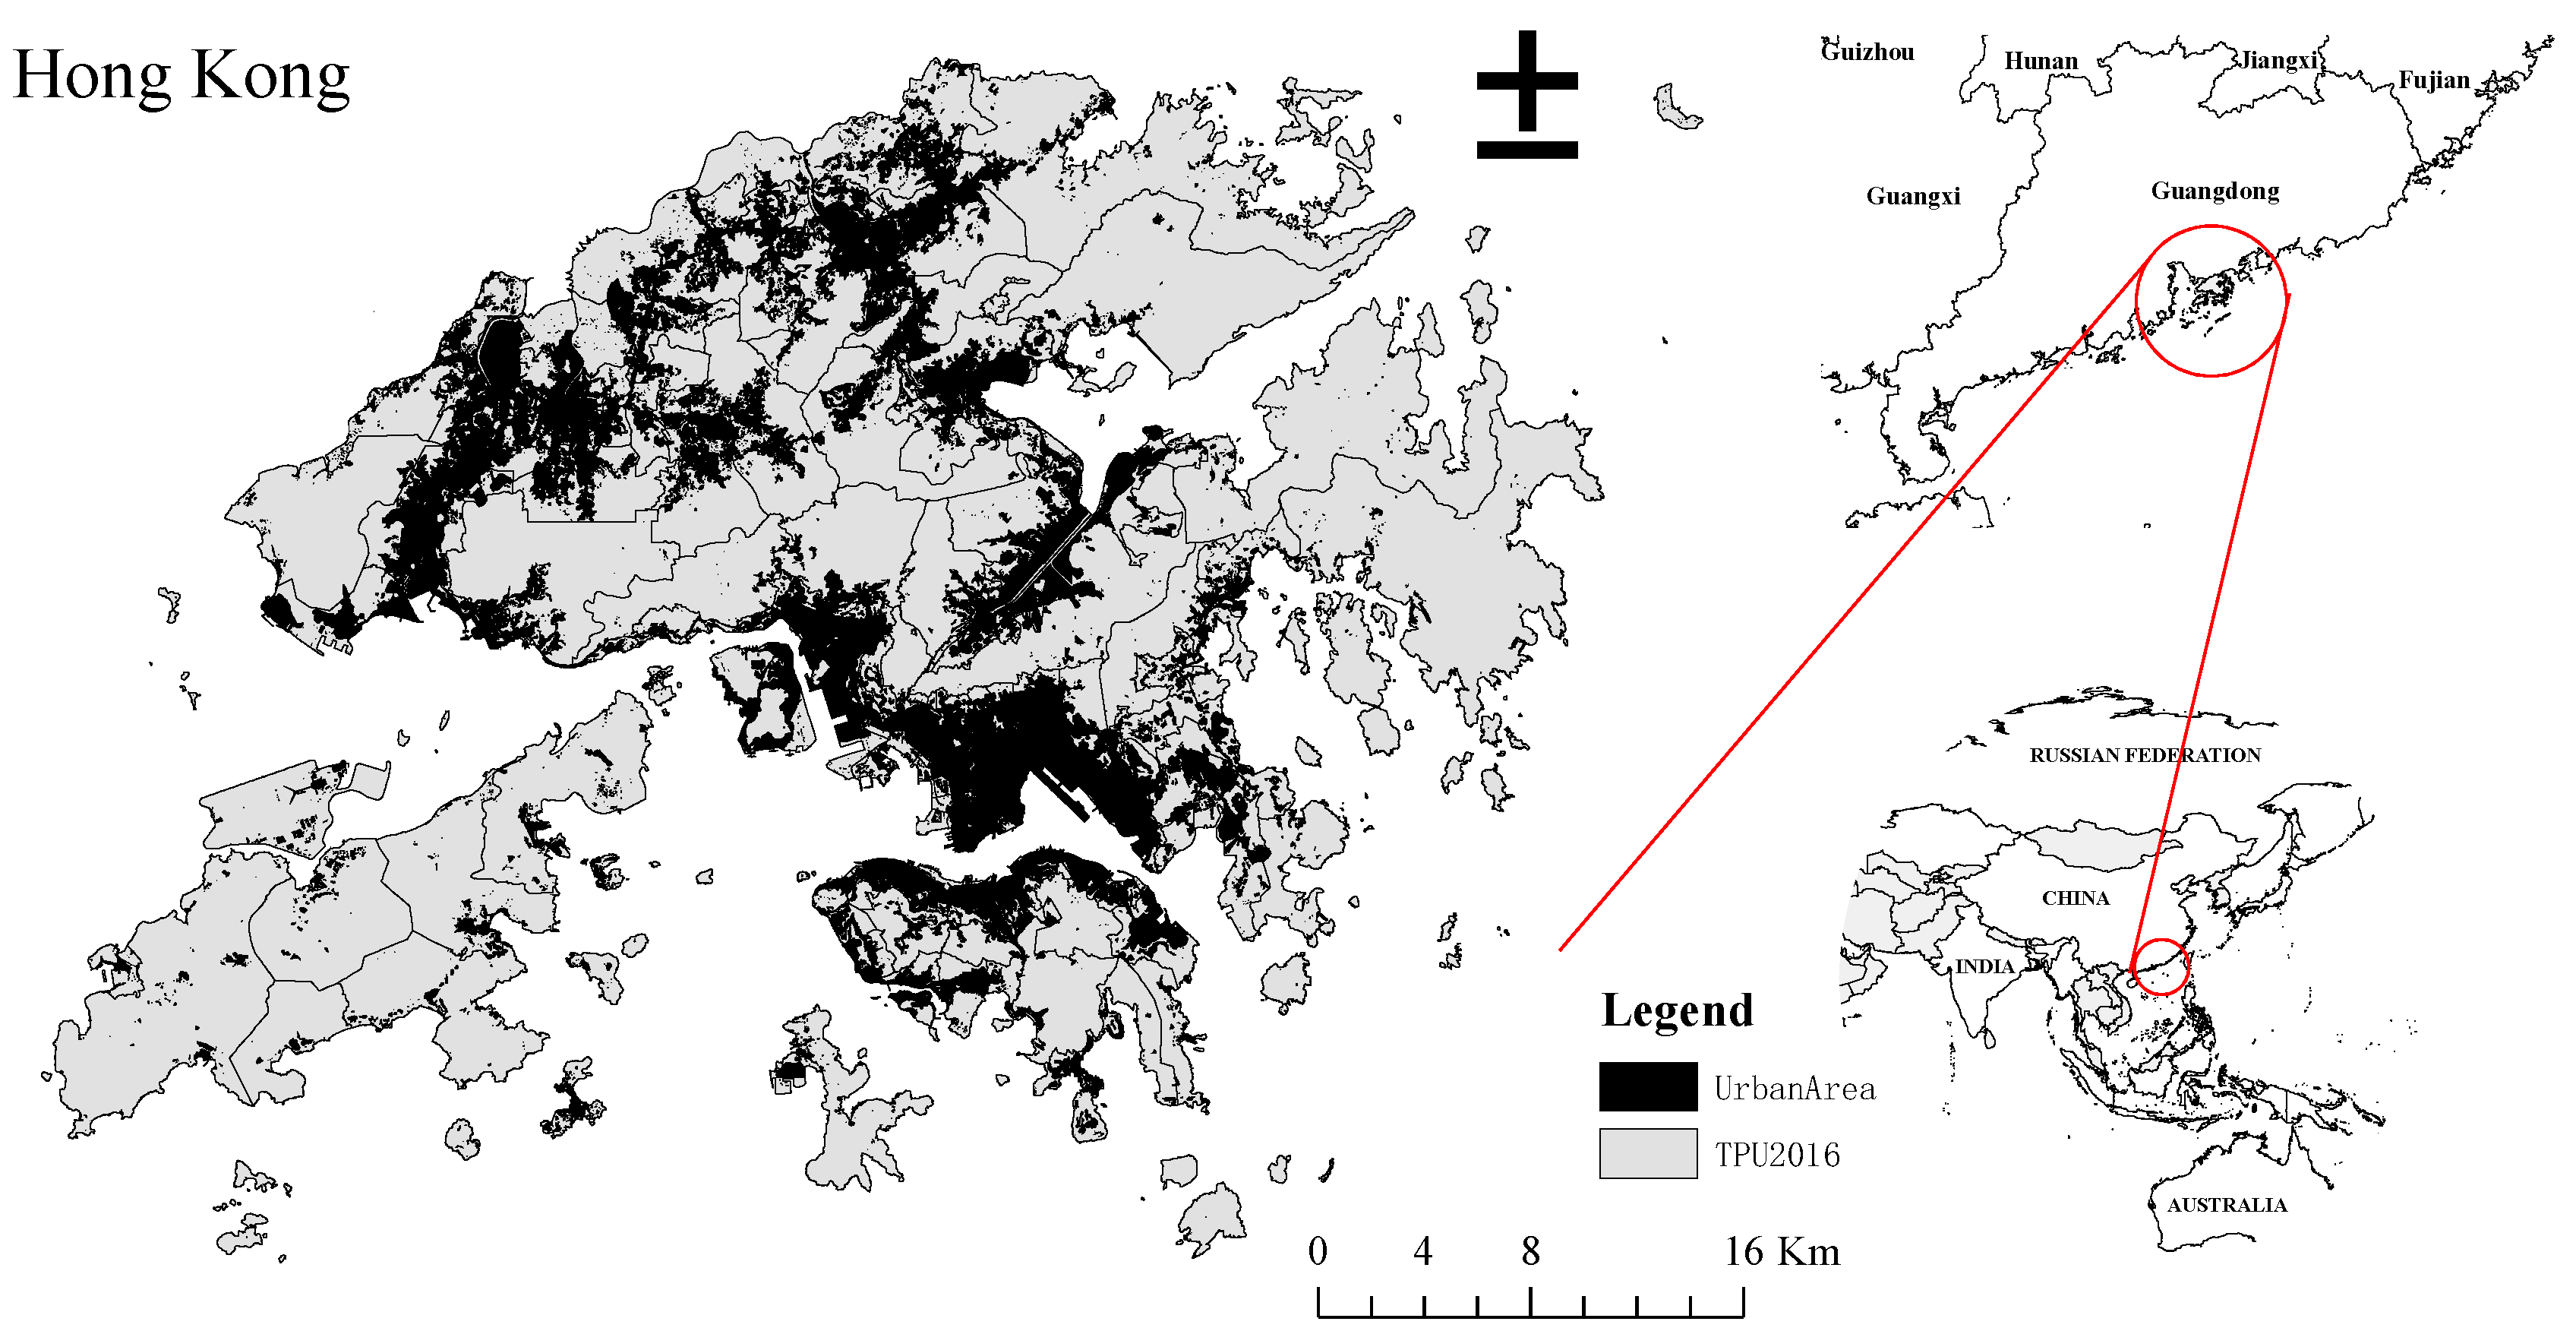
The Hong Kong Special Administrative Region (HKSAR) (Figure 1) of China is located at the southern tip of mainland China, on the northern shore of the South China Sea. The whole territory consists of Hong Kong Island, Kowloon, and the New Territories. As of 2020, the population of Hong Kong reached approximately 7.5 million (Census and Statistics Department of Hong Kong). Hong Kong has a sub-tropical climate with hot and humid summer and relatively mild winter. The annual air temperature and relative humidity throughout the study period was an average of 23.4 °C and 78.8%. The average wind speed and direction were 22.5 km/h and 60 degrees [25].
This study’s spatial unit is based on the Hong Kong Tertiary Planning Units (TPU), a geographic reference system demarcated by the Planning Department for Hong Kong’s territory. Its boundary is defined by geographical attributes and includes roads, railway lines, coastlines, contours, waterways, lot boundaries, and zoning boundaries. Each TPU has a unique ID. Boundaries of each TPU are updated every five years with the territory-wide population census. A TPU with less than 1000 persons is merged with adjacent TPU(s) to produce a fact sheet that considers the data precision issues. In this study, four individual years (Year 2001, 2006, 2011, and 2016) of the dataset, aligned with the population census update were adopted for analysis.
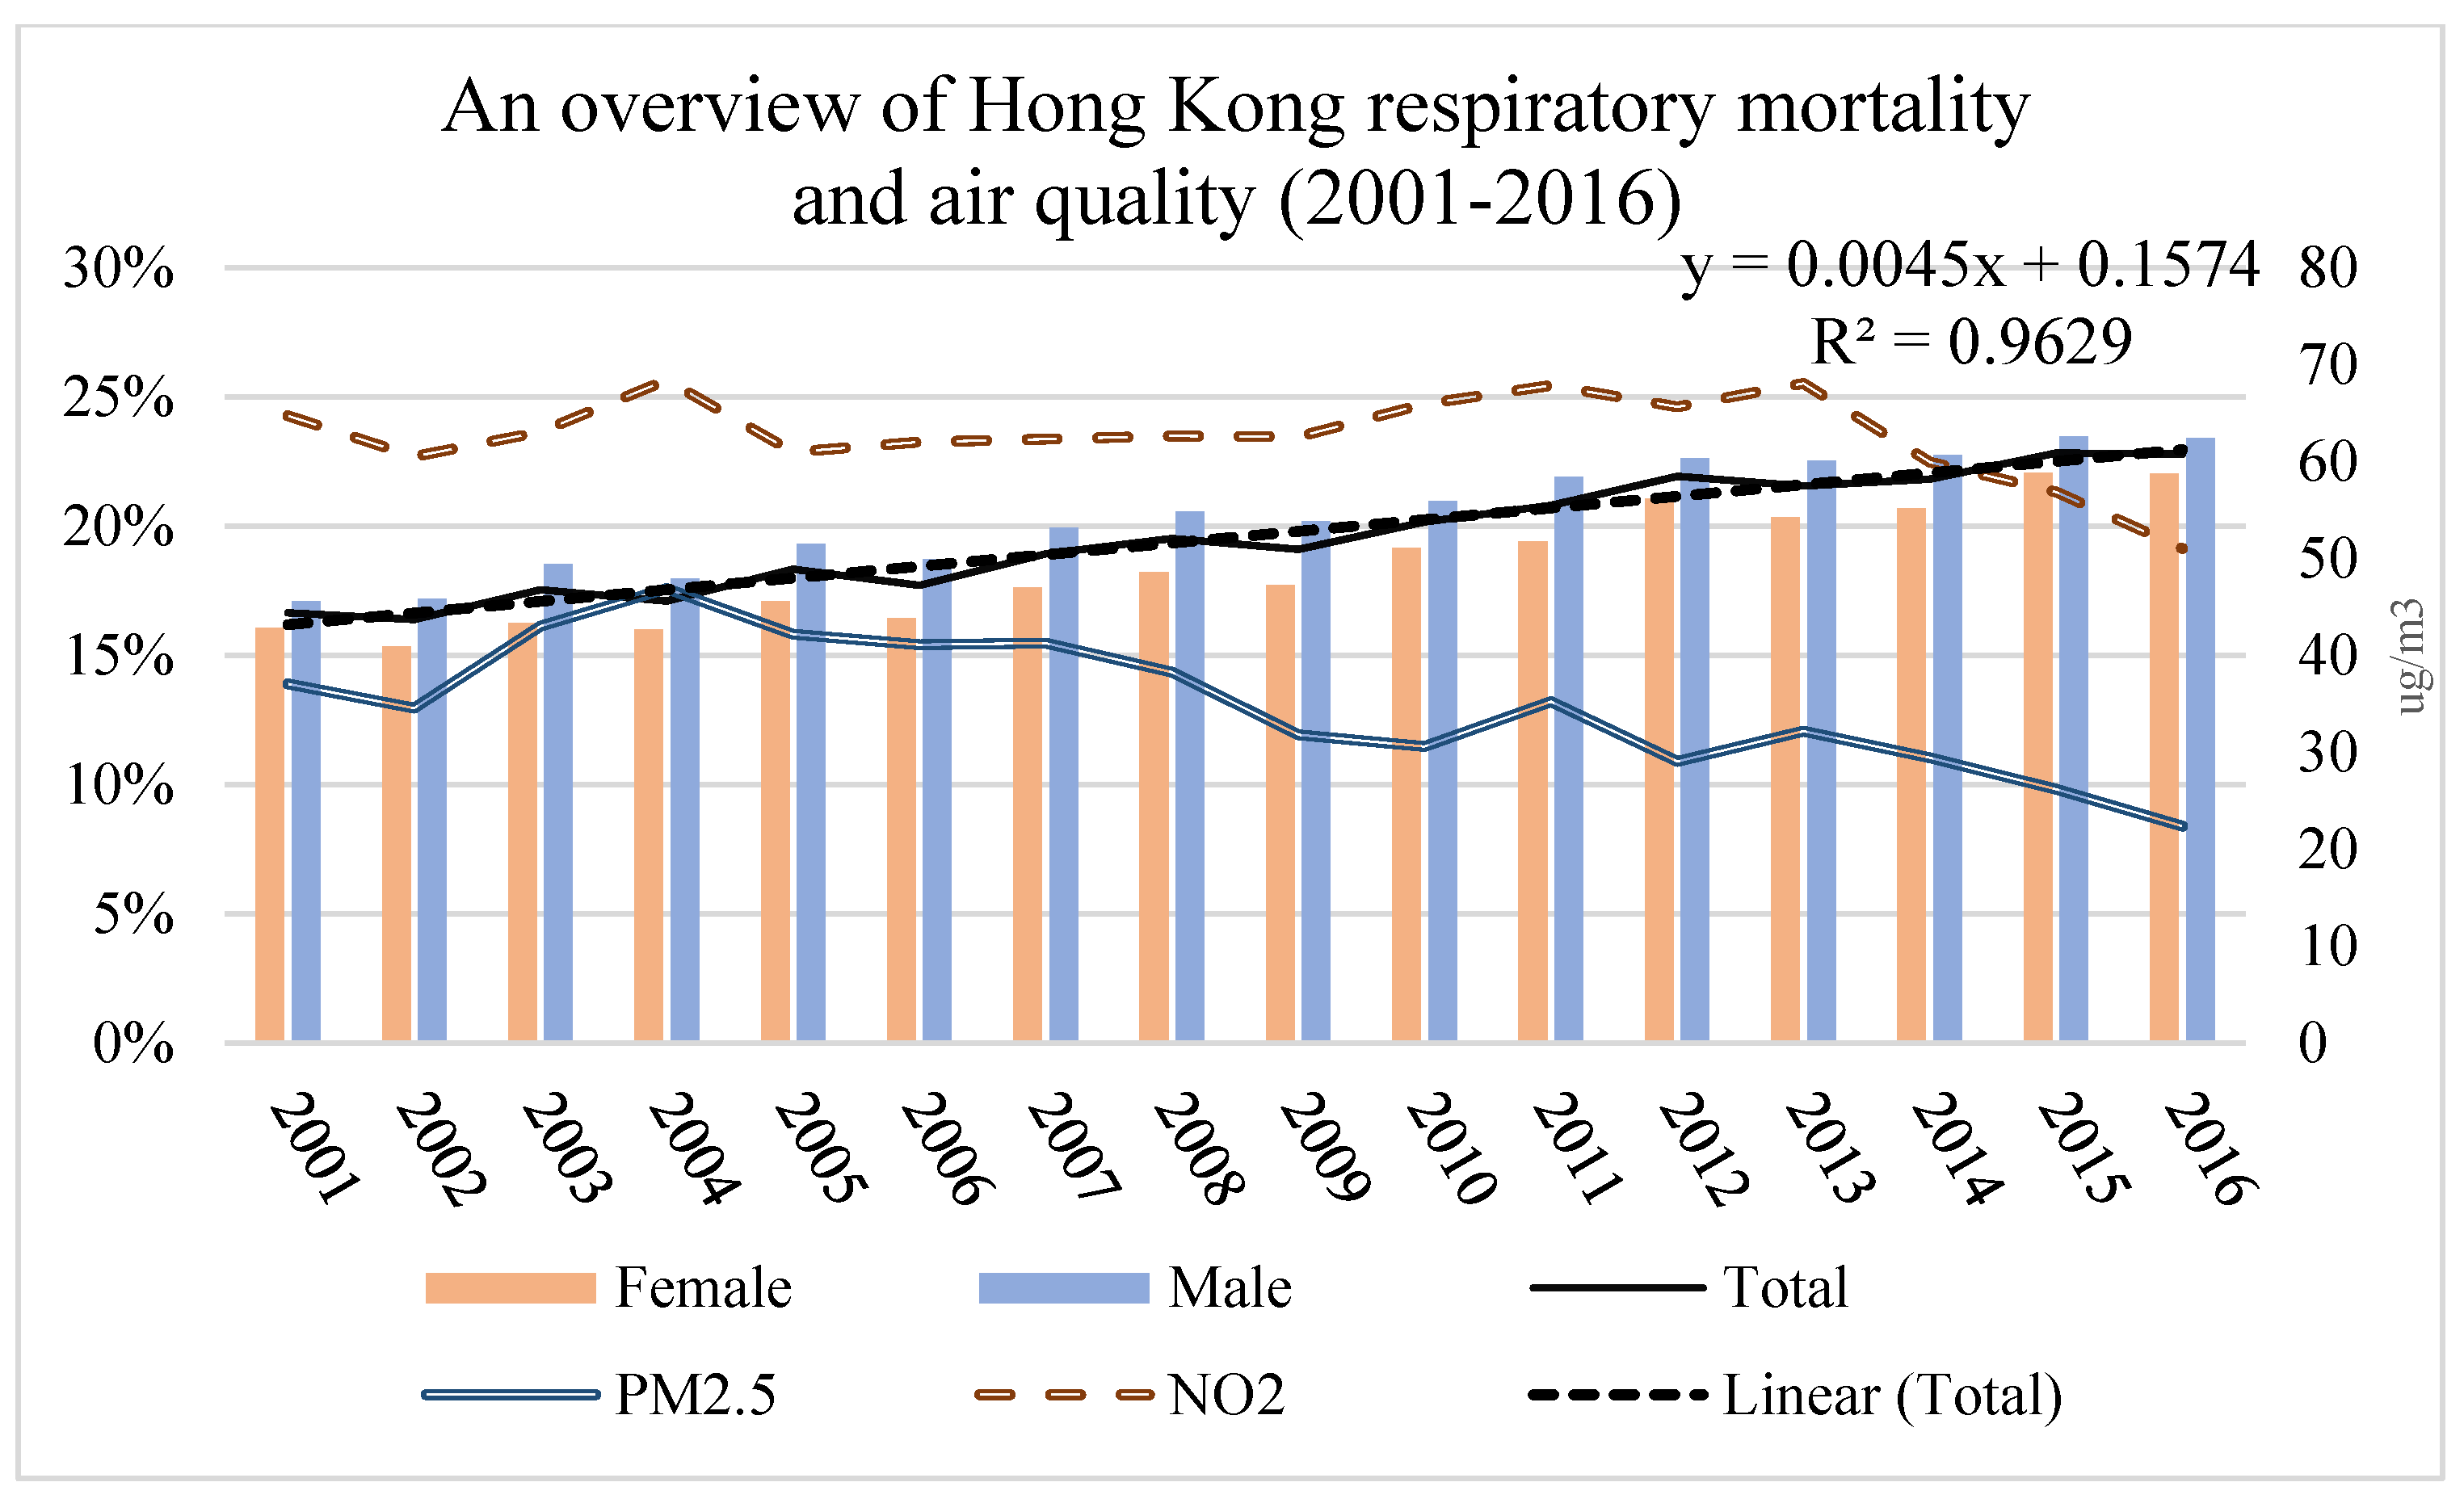
The respiratory mortality rate in Hong Kong from 2001 to 2016 is shown in Figure 2. The respiratory mortality rate was 16.65% in 2001, and it increased to 22.79% in 2016. The male mortality rate was generally higher than the female rate.
2.2. Data
All the data used in this study are listed in Table 1.
Temple polygon data was digitized using Google Earth. The point feature was separated from the iB5000 dataset. Basic environmental data included building density, greenery density, road density, and water density. Here the water density is represented by combined water bodies area and coastline accessibility.
The Medicare data analyzed for this study did not involve individual identifiers; consent was not specifically obtained. Each case contained the date of death, cause of death, age, sex, place of residence (using TPU units), and occupation. Classification of cause of death was based on the Tenth Revision of the International Statistical Classification of Diseases and Related Health Problems (ICD-10) and the updated ICD-10. Case selection was based on Chapter X: Diseases of the respiratory system (J00−J99) as the target category. Population data was to assist in calculating population density and respiratory mortality rate. The crude mortality rate was adopted in this study, as it denotes the total number of deaths in a specified geographic area divided by its total population and multiplied by 100,000. Monthly air quality data, NO2, and PM2.5 (or Fine Suspended Particulates, FSP) were used to adjust the regression model.
All the data were pre-processed to unify the units to TPUs. The basic environmental indices were computed based on the area of each TPUs in the units of percentage. Among them, the water density combined the water body area percentage and the accessibility to the coastline. The air quality data (NO2 and PM2.5) was acquired from 17 official air quality stations (managed by EPD) in Hong Kong. The air quality data was first prepared by spatial interpolation method (Inverse distance weighted [IDW]) to statistically transform the point station data into a statistical surface which covers all of Hong Kong. The IDW method determines the unknown cell values between known values (stations) using the weighted linear combination decision rule. The statistical surface generated was then computed and averaged for each TPU to support further analysis.
2.3. Methods of Analysis
2.3.1. Temple Classification
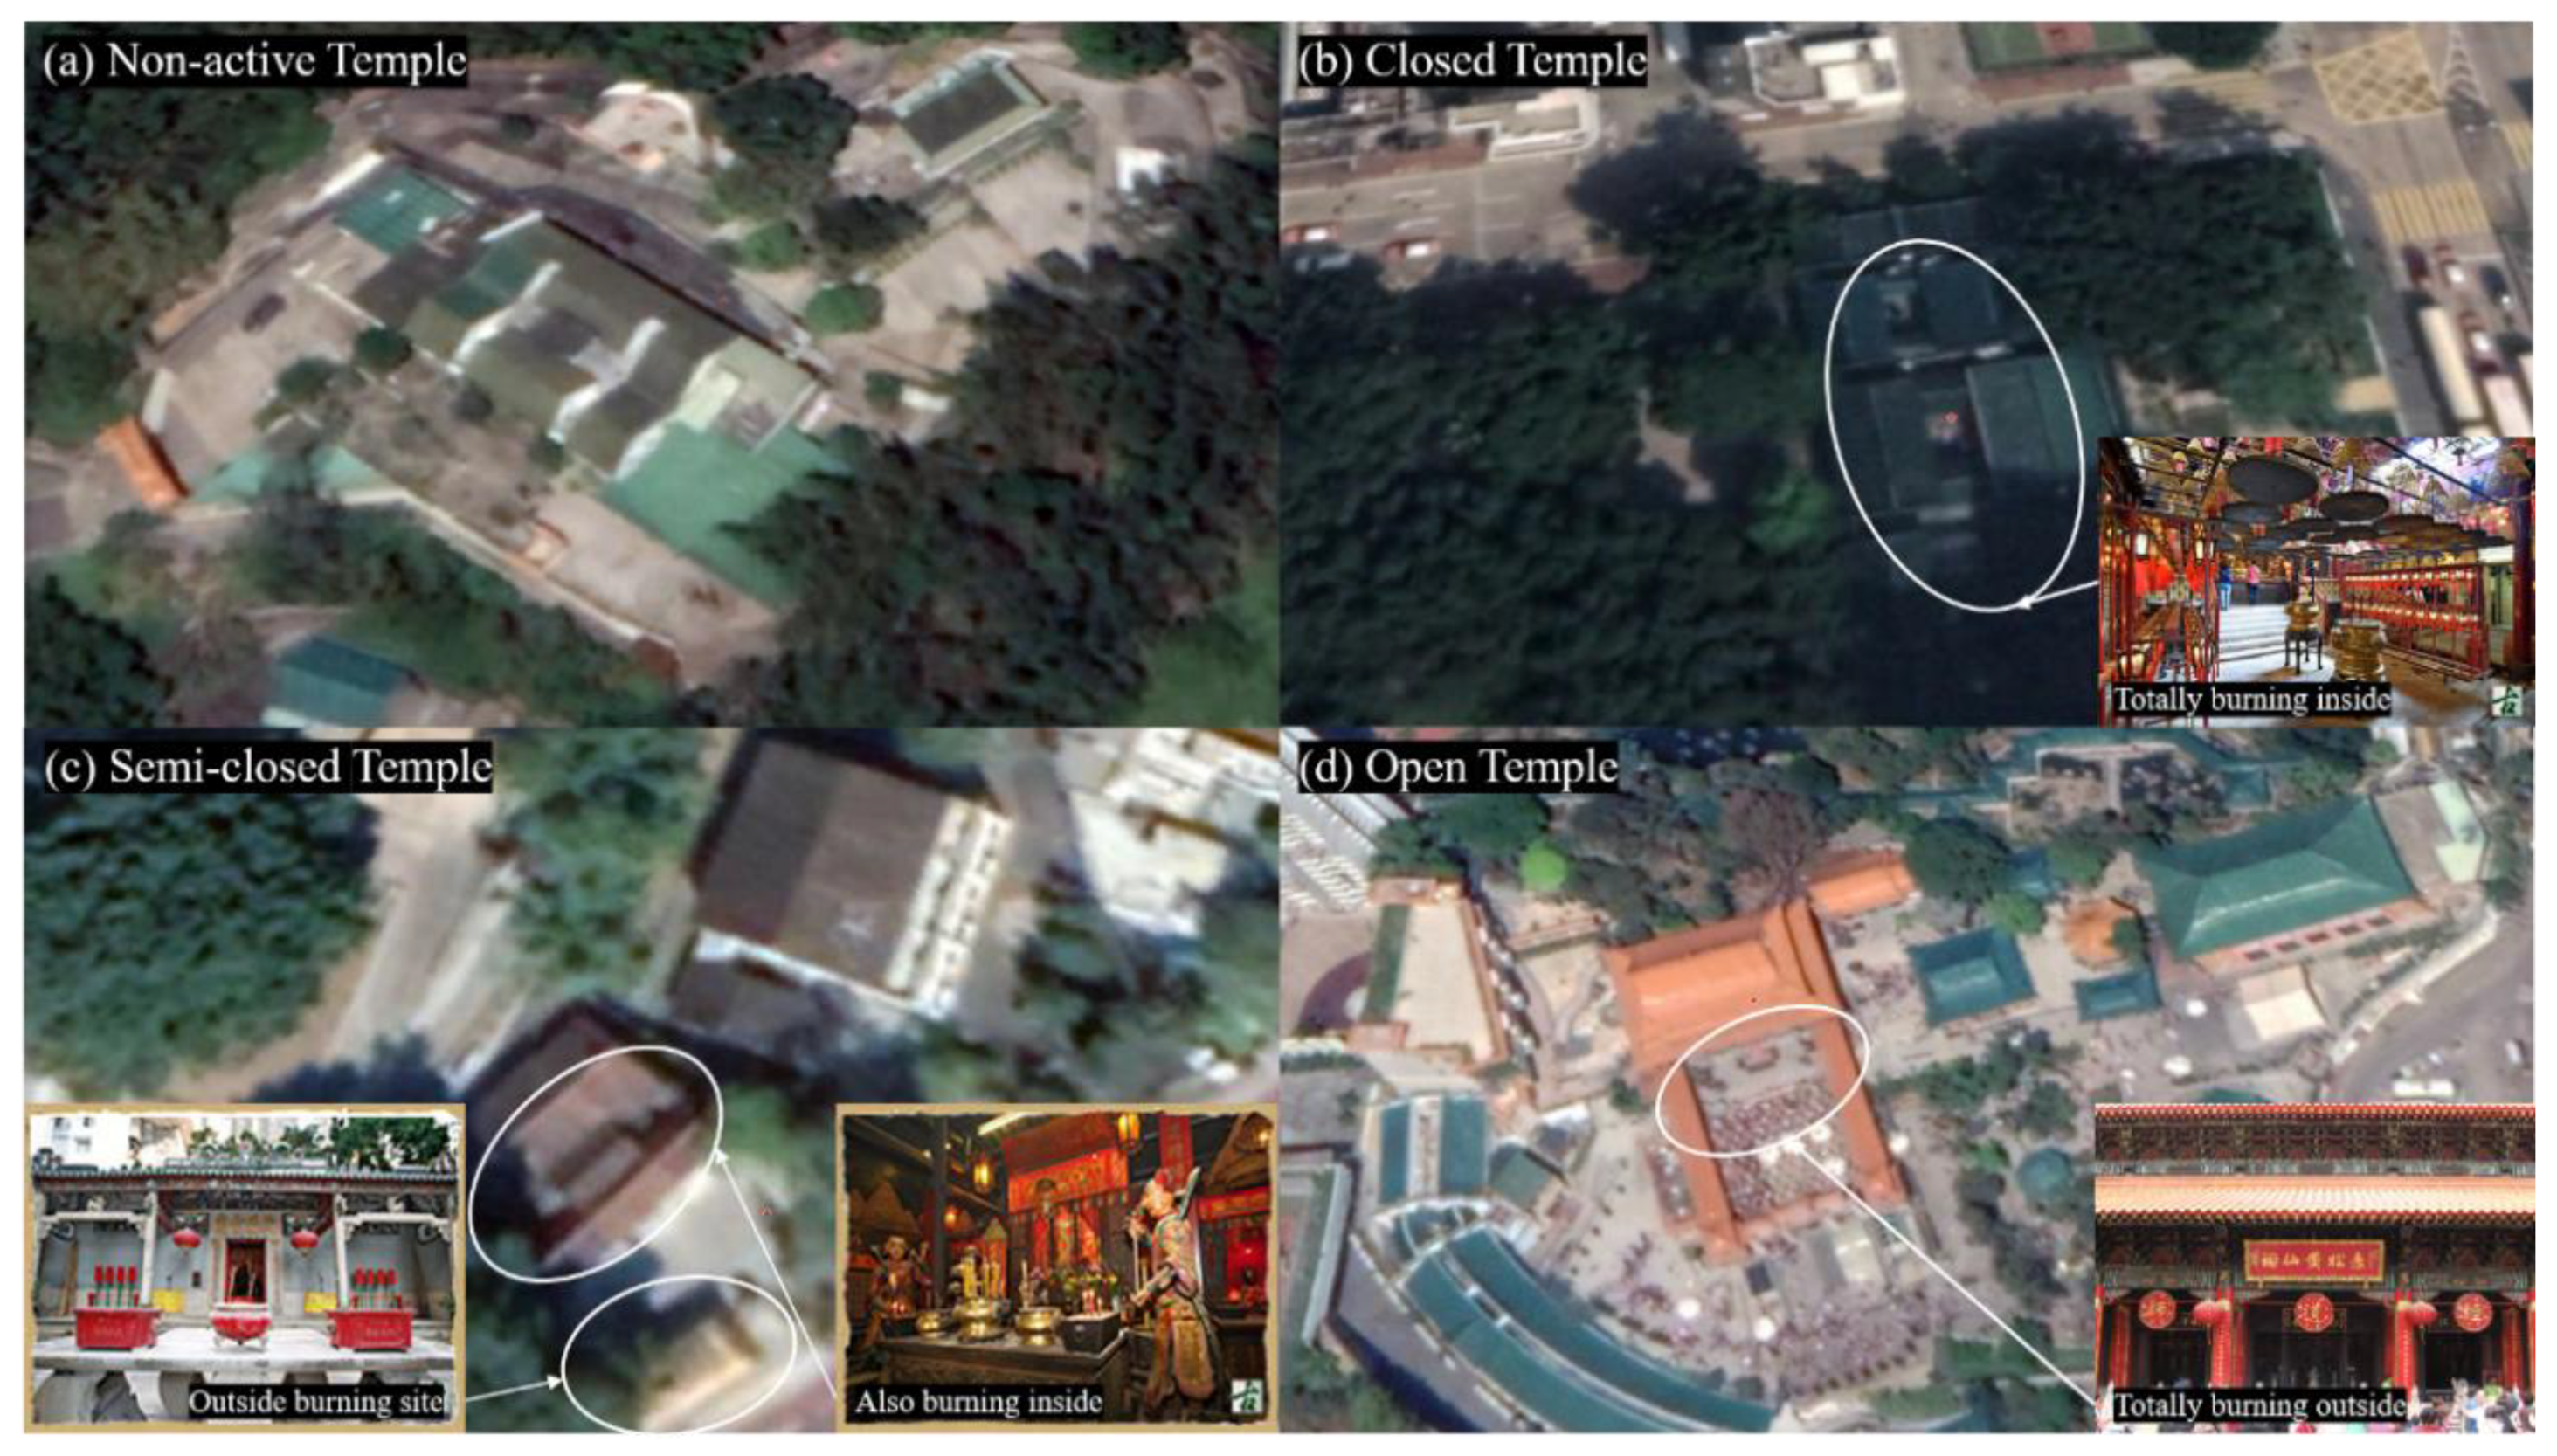
To understand the incense burning impacts of different types of temples on surroundings, this study classified all 366 temples into four groups: non-active, closed, semi-closed, and open (Figure 3). Non-active temples only have a religious purpose but no incense burning within them, such as religious practice school. Closed temples are the temples that only burn incense inside the temple. Semi-closed temples burn incense both inside and outside. Typically, they have an incense holder outside the temple. Open temples burn incenses completely outside the temple, and their number is the smallest. According to their incense burning characteristics, we hypothesized that open temples would have significantly higher adverse effects on their surroundings than semi-closed temples. Thus, this study gave weights to temples based on this hypothesis: 4 for open temples, 3 for semi-closed temples, 2 for closed temples, and 1 for non-active temples. The temple index of each TPUs was computed based on the average weights of temples within it. As illustrated in Figure 4. As illustrated in Figure 4, each TPU may contains several temples mixed with different temple type. Hence, the temple weight was calculated as the average weight of all the temples within each TPU.
For each TPU:
where WTPU is the temple weight of TPU and Ntemple is the number of temples within one TPU.
Spatial analysis and mapping adopted ArcGIS Desktop 10.7 version (ESRI 2019. ArcGIS Desktop: Release 10. 7 Redlands, CA: Environmental Systems Research Institute.) based on Windows, and for statistical significance, this study only chose the TPUs that have temples within them.
2.3.2. Statistical Analysis
To analyze what factors are the dominant factors and their influence on respiratory mortality, Principal Component Analysis (PCA) and the linear regression model were applied to all parameters. These two statistical methods can analyze the impact factors in terms of importance, contribution, and correlation.
Principal Component Analysis (PCA), a multivariate observation-based statistical method, was used to identify major control factors of respiratory mortality [26]. PCA can predict the amount of information by only focusing on a dataset itself and its PCs can eliminate the mutual influence factors between original data components [27]. However, the non-principal components with small variance may also contain important information, which is the limitation of only use PCA to identify the major control factors. Since there is a specific correlation between the variables, it compresses and transforms a dataset with m variables into a new dataset of n variables, where n < m, so that these new variables, known as principal components (PCs), are pairwise uncorrelated. These fewer comprehensive variables can be used to represent original variables without losing essential information.
Kaiser’s criteria [28] of eigenvalues were used for selecting PCs of optimal numbers. Thus, PCA can identify the most important factors. Linear regression is a statistical modeling method used to explain the relationship between one or more independent and dependent variables [29]. To estimate the effects of a temple incense burning on respiratory mortality, an empirical model was developed incorporating the linear regression model with a significance level of 0.05. Respiratory mortality was the dependent variable, while temple weights, population density, and environmental factors were the independent variables. The statistical analysis of the data used the SPSS version 25 software package (IBM Corp. Released 2017. IBM SPSS Statistics for Windows, Version 25. 0. Armonk, NY, USA: IBM Corp) based on Windows.
3. Results
3.1. Temples’ Map
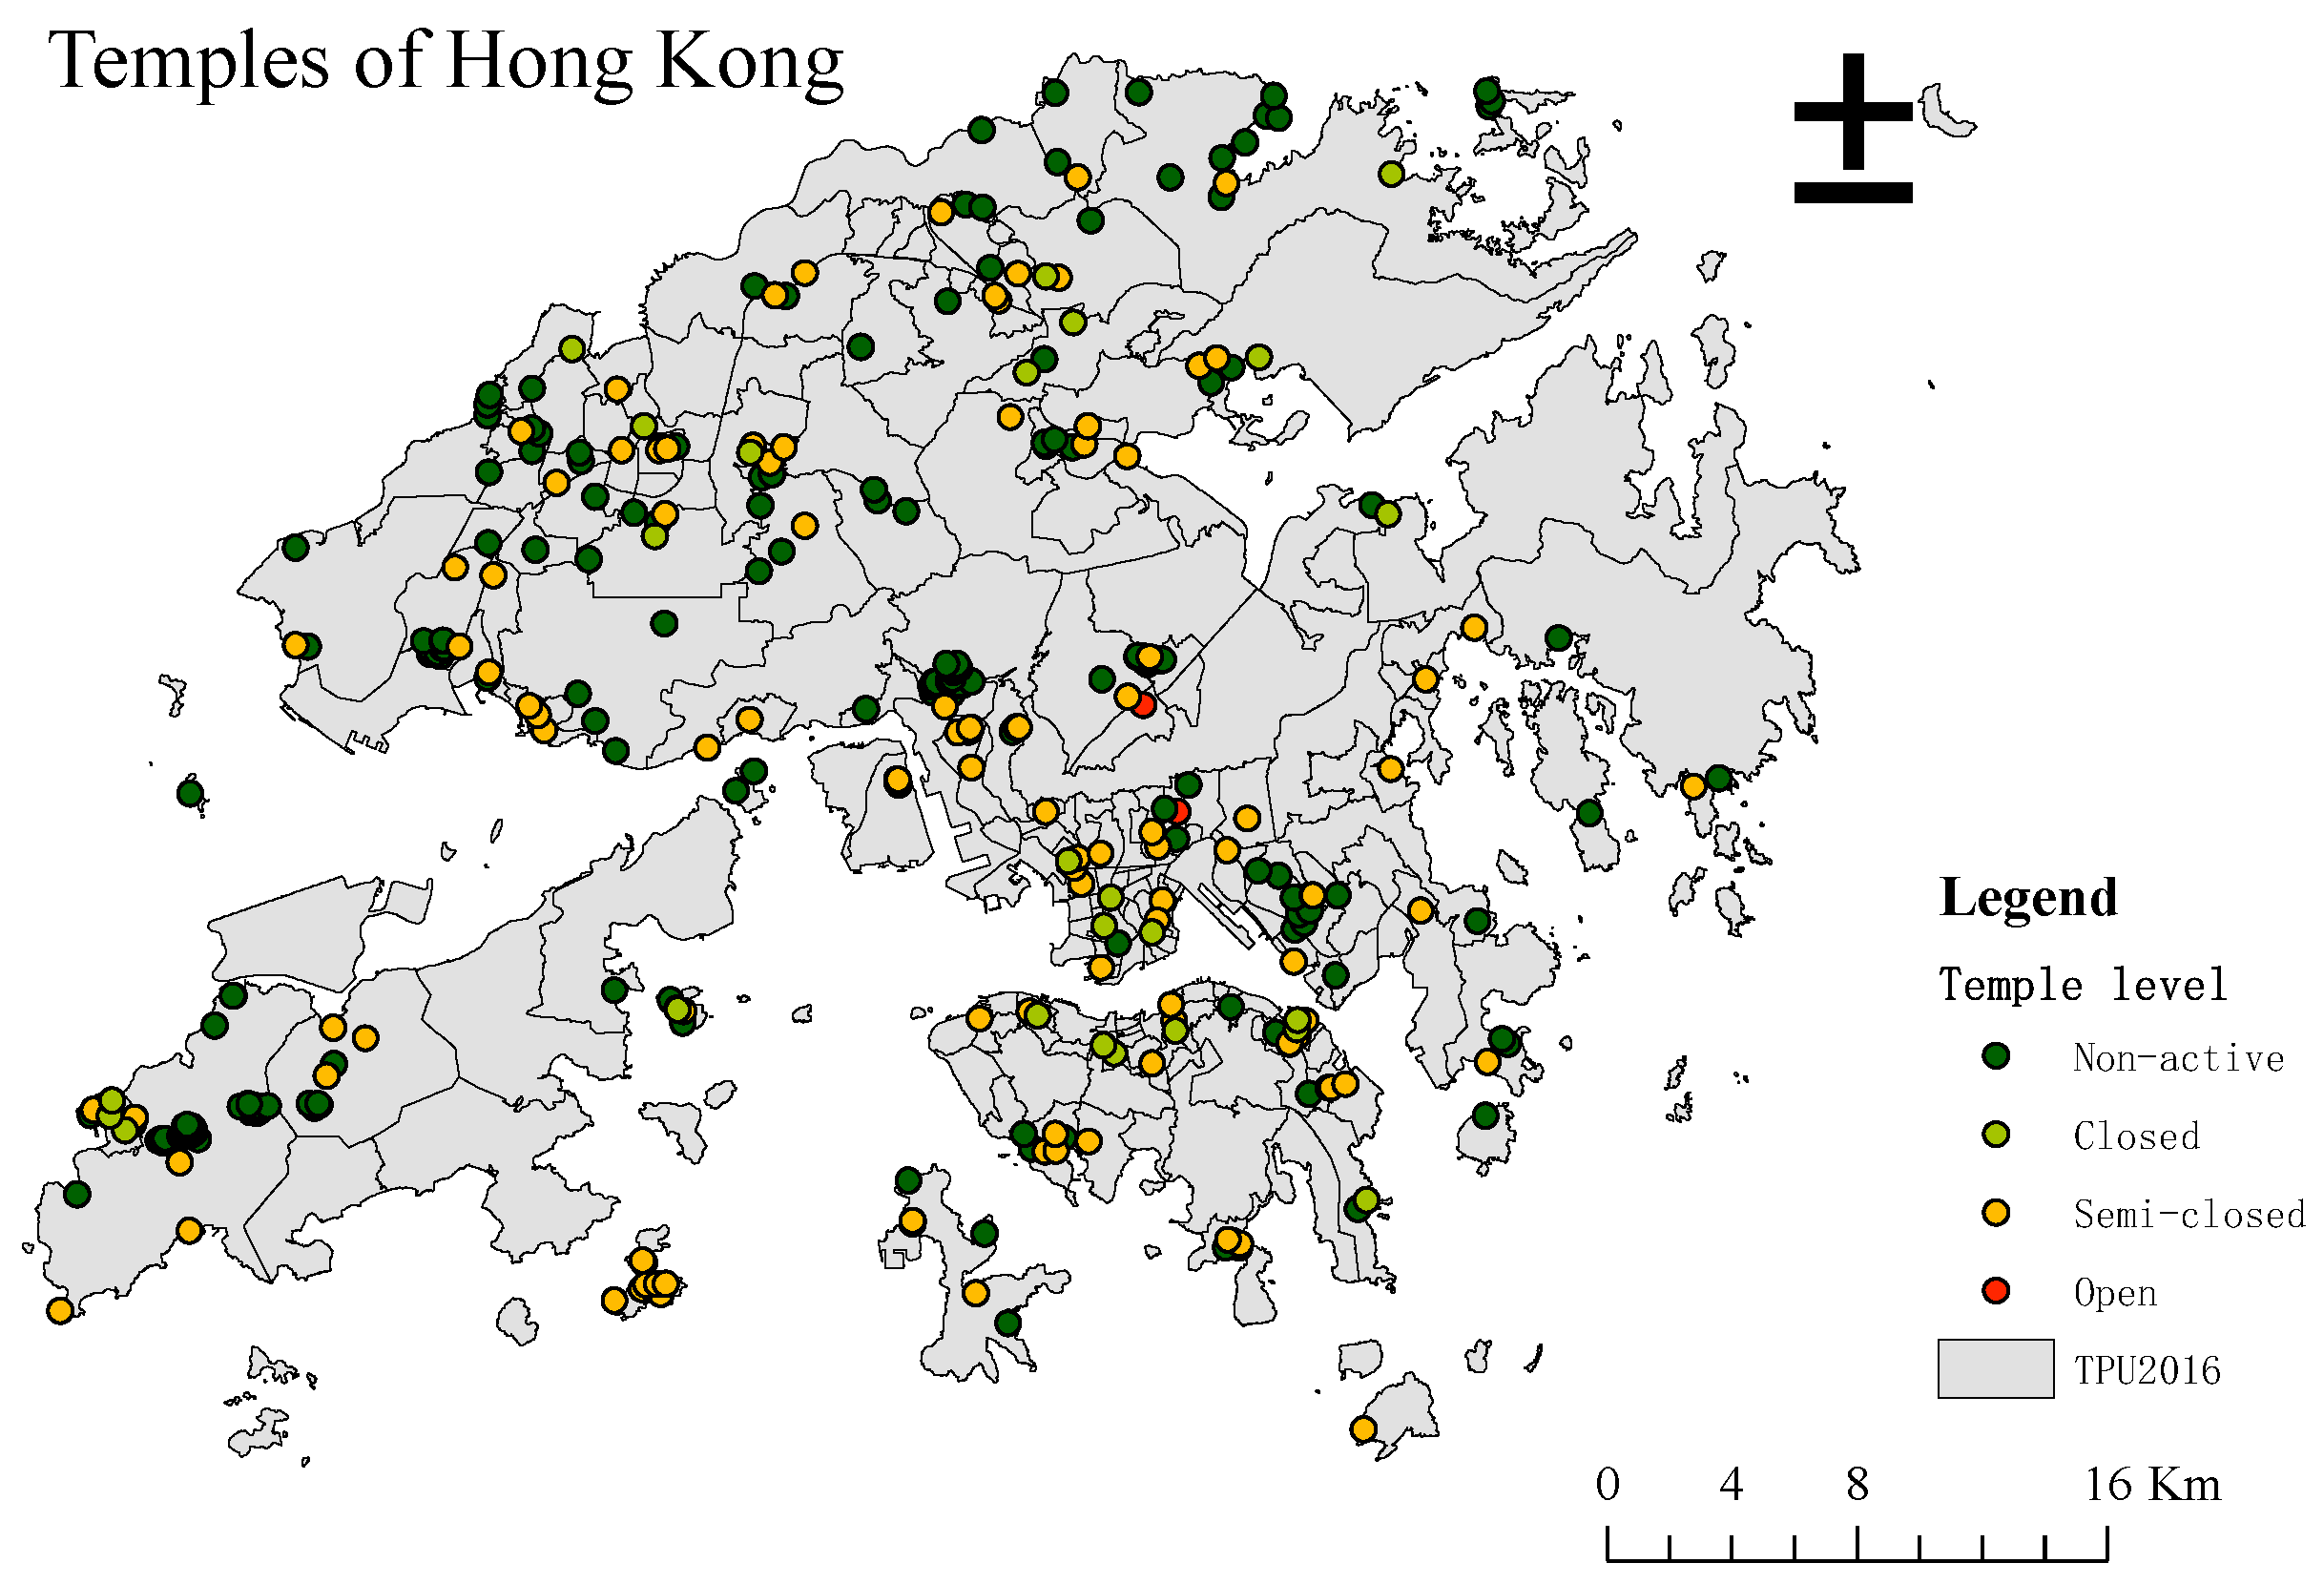
The temples of Hong Kong were classified into four groups; their distribution is shown in Figure 4.
Among the 366 temples in Hong Kong, five were classified as open temples, 104 were classified as semi-closed temples, 26 were classified as closed temples, and the remaining 231 were classified as non-active temples. In terms of their average area, open temples have the largest area and the largest gap with other types of temples, at 6690 m2. This result is in line with reality because open temples usually have the highest passenger volume and are active year-round. The average area of closed temples is similar to that of inactive temples, both of which are more than 400 m2. The average area of semi-enclosed temples is 905 m2, twice their size. Generally, the distribution of temples in Hong Kong is not regular. The high concentration areas are Lantau Island and Sam Dip Tam. Of the five open temples, three are located on Lantau Island, one is located in Sha Tin, and the other is located in Wong Tai Sin. In comparison, there is no apparent regularity in the distribution of the other three types of temples.
3.2. Principal Component Analysis
The modeling variables included the weighted temple index, building density, greenery density, road density, water density, and population density. Before performing principal component analysis, this study first used KMO and ballet tests to verify that the data structure is measurable and meets the sphericity assumption. The test results are shown in Table 2.
The KMO test for these four years was greater than 0.7; that is, the data structure was middling. In this research, the p-value of Bartlett’s test was less than 0.05, which means that the research data could be extracted by PCs. After the above two tests were satisfied, the PCA was based on the Eigenvalue > 1 criterion to extract the principal components. Here, two PCs were extracted for each year, as shown in Table 3, and their cumulative variance was greater than 70%. The first component only explained around 60%, while the second component explained around 17%. Thus, the first component contained most of the information.
To further understand the variable system, PCs were rotated using varimax rotation with Kaiser normalization. The rotation results are shown in Table 4. In general, PC1 is mainly environmental background factors, and PC2 mainly indicates the influence from temples. For 2001, if a threshold set is at 0.7 for vari-factors’ selection, these two PCs are the factors that influence respiratory mortality. These sub-factors are building density, water density, temple index, and population density. For 2006 and 2011, these sub-factors are building density, greenery density, road density, water density, and temple.
Notably, our results suggest that, although temple types in the area are not the most influential sub-factor, it does contribute to respiratory mortality. In the models pertaining to 2001, 2006, and 2011, the temple index has the highest correlation with PC2 (all correlations > 0.85). In the 2016 model, it is highly correlated with PC1 (correlations of 0.71) and has a value similar to that of other factors such as building density. Generally, factors with high loadings in PC1 exert a greater influence on respiratory mortality. According to the PCA eigenvalue, PC2 has an interpretation rate of approximately 17%, where the temple index has the highest correlation with it.
3.3. Linear Regression Model
In this study, the linear regression model was adopted to explore the relationship between respiratory mortality and six variables (the weighted temple index, building density, greenery density, road density, water density, and population density) in the four years (2001, 2006, 2011, and 2016) that coincided with the population census. The model summary is shown in Table 5. From the F value and its significance p-value, it can be seen that at the test level of α = 0.05, the fitted multiple linear regression equation can be considered statistically significant. Residuals of four models are mostly normally distributed.
The data in Table 6 are obtained by multiple linear regressions on four-year data. Through the VIF value in the model, it could be concluded that there is no collinearity among the variables. Overall, greenery density has a significant positive correlation with respiratory mortality. In the regression model of 2001, temple index, building density, greenery density, and road density were significantly correlated with respiratory mortality at the 95% confidence level. Meanwhile in 2006, population density, temple index, building density, and greenery density were significantly correlated. In 2011, only building density and greenery density had a response. The contribution rate of each variable could be obtained from the standardized coefficients in the regression model results. Based on these findings, building density and greenery density have a significant correlation with respiratory mortality, but the correlation with the temple index in the 2001 and 2006 models is also significant.
3.4. Air-Quality Adjusted Model
This study further investigated the relationship between the main pollutants from temple incense burning and mortality in the context of the significant correlation between temple types and respiratory mortality. To improve the regression model and to further explore the correlation, in this study, local air pollution level during the study period, PM2.5, and NO2 data were incorporated into the model using 2016 as an example. The results in Table 7 indicate that PM2.5 and NO2 significantly correlate with respiratory mortality at a 95% confidence level.
4. Discussion
This study aims to identify the correlation between temples and respiratory mortality in the increasingly vertical development of Hong Kong from 2001 to 2016 at a district scale. The distribution of temples in Hong Kong has no pattern. Most of them are located in urban areas. Open temples have the smallest number but the largest average area, while semi-closed temples and closed temples have relatively similar sizes and quantities. The temple index in the living environment has a positive correlation with respiratory diseases, and the weight assigned to temples in our models emerged as an important sub-variable according to the PCA results. According to Višić et al., incense burning will lead to 20- to 30-fold higher air pollution than background levels [30]. These authors further found that tick smoke emitted from heavy incense burning may promote the development of lung cancer and other respiratory diseases. Based on their studies carried out inside and outside temples, Lau and Luk found that air pollutant concentrations around temples exceeded their background levels, indicating that activities within temples adversely impact their surroundings [22]. On the other hand, Višić et al. conducted fixed source studies involving joss burning in a laboratory setting and used sensors placed at 1 m, 2 m, and 3 m distances from the source to detect pollutants [30]. Their results indicate that particles are released immediately and their concentration in ambient air continue to increase as joss burning progresses [30]. However, the influence of temple types is relatively small, far less than environmental background variables, so it is also necessary to conduct field surveys for temples. In this study, temples were divided into four categories based on the characteristics of incense burning. However, given the small number of samples, they could not be directly analyzed by statistics. According to its building design and incense burning sites’ characteristics, this study’s hypothesis still needs experimental data to address it. The open temples have relatively large areas resulting in their pollutants not easily affecting the surrounding residential areas. On the other hand, the semi-open temples and closed temples are located in the center of the city, aside to residential and commercial areas, which may adversely affect the surrounding pedestrians and residents. Therefore, it is necessary to use experimental data to conduct further research on different types of temples.
The main pollutants of temple incense burning, NO2, and PM2.5, are significantly related to respiratory mortality. The PM2.5 and NO2 data used in this study have certain limitations. They are obtained by IDW interpolation from 17 meteorological stations in Hong Kong and have low spatial accuracy. Moreover, there is no doubt that temples’ incense burning emissions are affected by factors such as traffic, especially in Hong Kong, where temples are mostly located on the roadside and near residences. The findings yielded by the PCA analysis indicated that the building density and greenery density exerted significant effects on respiratory mortality, as demonstrated by other scholars. For example, Wong et al. reported that traffic-related air pollution (TRAP) increases outdoor pollutant concentration, whereby their infiltration also reduces the quality of indoor air [31]. Long term vehicle traffic exposure has also been proved to be associated with increased risks of mortality [32]. In an earlier study, scholars found that acute building-related health symptoms primarily affect individuals residing in high-density buildings without greenery [33,34]. In their study on the effects of road density, on the other hand, Chris et al. found that heavy traffic leads to ambient air pollution with adverse respiratory health effects [35]. Consequently, waterbodies and greenery are landscape components that should be considered in the strategies aimed at reducing particulate matter concentration [36]. These findings are in line with our model results, indicating that temple weight has the highest correlation with PC2 (all correlations > 0.85), especially in 2006 and 2011. Combined with the regression model, these results suggest that the adverse effects of incense burning in temples increase the risk of respiratory diseases, indicating that pollutant emissions from temples adversely impact public health in the surrounding areas.
In this case, structural adjustments in the planning area are necessary. Especially in Hong Kong, most temples are located in urban areas, aside to residential areas, and connected to high road and traffic density. This makes the impact of the temple’s pollutants on the surrounding residents more severe. To make improvements, collaboration through synergy among academic institutions, businesses, government agencies, and society is necessary [37]. According to the results of our regression model, greenery and water densities have negative relationships with respiratory mortality; thus, the structural adjustments in the planning area could focus on the greenery. Yu’s research found that the water spray geo-engineering method could efficiently reduce the PM2.5 pollution in the atmosphere within a very short period of time (ranging from a few minutes to hours or days) [38]. When burning incense, temples could consider measures, such as mist spraying, to reduce smoke dispersion. In addition to good regional planning, the management of temples also needs to be taken seriously. Whether the temple is open to display incense, the location of places to burn incense, and whether there is a treatment of pollutants discharged are all factors having an impact on the harmful effect of pollutants. Furthermore, research shows that characteristics of incense smoke may vary with the ingredients contained in the incense sticks [39]. Hence, temples are highly encouraged to use incense with less volatile materials and lower carbon levels to minimize the pollutant emissions and consequently reduce associated health risks.
5. Conclusions
In summary, this study identified a correlation between temples’ incense burning and respiratory mortality. The impact of Hong Kong’s local environmental settings, socio-economic factors, and other daily activities was also considered. The 366 temples of Hong Kong have been classified into four categories based on their incense burning characteristic: 5 open temples, 104 semi-closed temples, 26 closed temples, and 231 non-active temples. Closed temples and non-active temples have the smallest average area, while the open temples’ average area is more than 10 times larger. Principle component analysis was applied to identify the major control factors on respiratory mortality. PCA results indicated that environmental factors are the most influential factors. At the same time, the temple index is the only loading factor with a contributing factor from PC2, which means it has a certain contribution rate to respiratory mortality. The statistical analysis presented in this study explored the correlation between respiratory mortality and temple incense burning. Although the data have certain limitations, the linear regression model results confirmed the connection between the temple types and respiratory mortality. When this study incorporated the PM2.5 and NO2 data into the model, these pollutants related to temple incense burning also showed a high correlation with respiratory mortality. This study did not yield conclusive results about the actual impact of each temple category as classified. Further research is needed using field monitoring. These results provide theoretical support for government and community participation in public health, particularly for Asian cities, and lay the foundation for further experimental research.
Author Contributions
Conceptualization, P.P.Y.W.; methodology, P.P.Y.W.; validation, W.H.C. and P.P.Y.W.; formal analysis, W.H.C.; investigation, W.H.C.; resources, P.P.Y.W.; data curation, W.H.C.; writing—original draft preparation, W.H.C.; writing—review and editing, W.H.C. and P.P.Y.W.; visualization, W.H.C.; supervision, P.P.Y.W.; project administration, P.P.Y.W.; funding acquisition, P.P.Y.W. All authors have read and agreed to the published version of the manuscript.
Funding
This research was funded by Lam Kei on Memorial Trust (Lam Woo Research Fund), grant number LWI20007.
Institutional Review Board Statement
Not applicable.
Informed Consent Statement
Not applicable.
Conflicts of Interest
The authors declare no conflict of interest.
References
- Mariani, S. Traditional Chinese Religion trusts in Hong Kong. Trusts Trustees 2015, 21, 538–545. [Google Scholar] [CrossRef]
- Liu, T.S. A Nameless but Active Religion: An Anthropologist’s View of Local Religion in Hong Kong and Macau. China Q. 2003, 373–394. [Google Scholar] [CrossRef] [Green Version]
- Jetter, J.J.; Guo, Z.; McBrian, J.A.; Flynn, M.R. Characterization of emissions from burning incense. Sci. Total Environ. 2002, 295, 51–67. [Google Scholar] [CrossRef]
- Lin, T.; Chang, F.; Hsieh, J.; Chao, H.; Chao, M. Characteristics of PAH and total suspended particulate in indoor and outdoor atmosphere of a Taiwanese temple. Hazard. Mater. 2002, 95, 1–12. [Google Scholar] [CrossRef]
- Wang, B.; Lee, S.C.; Ho, K.F.; Kang, Y.M. Characteristics of emissions of air pollutants from burning of incense in temples, Hong Kong. Sci. Total Environ. 2007, 377, 52–60. [Google Scholar] [CrossRef]
- Lee, S.C.; Wang, B. Characteristics of emissions of air pollutants from burning of incense in a large environmental chamber. Atmos. Environ. 2004, 38, 941–951. [Google Scholar] [CrossRef]
- Zhang, J.; Chen, W.; Li, J.; Yu, S.; Zhao, W. VOCs and Particulate Pollution due to Incense Burning in Temples, China. Procedia Eng. 2015, 121, 992–1000. [Google Scholar] [CrossRef] [Green Version]
- Ibald-mulli, A.; Wichmann, H.; Kreyling, W. Epidemiological Evidence on Health Effects of Ultrafine Particles. J. Aerosol Med. 2002, 15, 189–201. [Google Scholar] [CrossRef]
- Zhou, R.; An, Q.; Pan, X.W.; Yang, B.; Hu, J.; Wang, Y.H. Higher cytotoxicity and genotoxicity of burning incense than cigarette. Environ. Chem. Lett. 2015, 13, 465–471. [Google Scholar] [CrossRef]
- Sun, Q.; Wang, A.; Jin, X.; Natanzon, A.; Duquaine, D.; Brook, R.D.; Aguinaldo, J.G.S.; Fayad, Z.A.; Fuster, V.; Lippmann, M.; et al. Long-term air pollution exposure and acceleration of atherosclerosis and vascular inflammation in an animal model. J. Am. Med. Assoc. 2005, 294, 3003–3010. [Google Scholar] [CrossRef] [PubMed] [Green Version]
- Geng, T.T.; Jafar, T.H.; Yuan, J.M.; Koh, W.P. Long-term incense use and the risk of end-stage renal disease among Chinese in Singapore: The Singapore Chinese health study. BMC Nephrol. 2019, 20, 9. [Google Scholar] [CrossRef]
- Dominici, F.; Peng, R.D.; Bell, M.L.; Pham, L.; McDermott, A.; Zeger, S.L.; Samet, J.M. Fine particulate air pollution and hospital admission for cardiovascular and respiratory diseases. J. Am. Med. Assoc. 2006, 295, 1127–1134. [Google Scholar] [CrossRef] [Green Version]
- Janssen, N.A.H.; Fischer, P.; Marra, M.; Ameling, C.; Cassee, F.R. Short-term effects of PM2.5, PM10 and PM2.5–10 on daily mortality in the Netherlands. Sci. Total Environ. 2013, 463–464, 20–26. [Google Scholar] [CrossRef] [Green Version]
- Sun, S.; Tian, L.; Cao, W.; Lai, P.; Wong, P.; Lee, R.S.-Y.; Mason, T.G.; Krämer, A.; Wong, C.-M. Urban climate modified short-term association of air pollution with pneumonia mortality in Hong Kong. Sci. Total. Environ. 2019, 646, 618–624. [Google Scholar] [CrossRef]
- Navasumrit, P.; Arayasiri, M.; Hiang, O.M.T.; Leechawengwongs, M.; Promvijit, J.; Choonvisase, S.; Chantchaemsai, S.; Nakngam, N.; Mahidol, C.; Ruchirawat, M. Potential health effects of exposure to carcinogenic compounds in incense smoke in temple workers. Chem. Biol. Interact. 2008, 173, 19–31. [Google Scholar] [CrossRef]
- Goel, A.; Wathore, R.; Chakraborty, T.; Agrawal, M. Characteristics of exposure to particles due to incense burning inside temples in Kanpur, India. Aerosol Air Qual. Res. 2017, 17, 608–615. [Google Scholar] [CrossRef] [Green Version]
- Yang, Y.; Tang, R.; Qiu, H.; Lai, P.C.; Wong, P.; Thach, T.Q.; Allen, R.; Brauer, M.; Tian, L.; Barratt, B. Long term exposure to air pollution and mortality in an elderly cohort in Hong Kong. Environ. Int. 2018, 117, 99–106. [Google Scholar] [CrossRef] [PubMed] [Green Version]
- Bootdee, S.; Chantara, S.; Prapamontol, T. Determination of PM2.5 and polycyclic aromatic hydrocarbons from incense burning emission at shrine for health risk assessment. Atmos. Pollut. Res. 2016, 7, 680–689. [Google Scholar] [CrossRef] [Green Version]
- Brook, R.D.; Rajagopalan, S.; Pope, C.A.; Brook, J.R.; Bhatnagar, A.; Diez-Roux, A.V.; Holguin, F.; Hong, Y.; Luepker, R.V.; Mittleman, M.A.; et al. Particulate matter air pollution and cardiovascular disease: An update to the scientific statement from the american heart association. Circulation 2010, 121, 2331–2378. [Google Scholar] [CrossRef] [Green Version]
- Chen, R.Y.; Ho, K.F.; Hong, G.B.; Chuang, K.J. Houseplant, indoor air pollution, and cardiovascular effects among elderly subjects in Taipei, Taiwan. Sci. Total Environ. 2020, 705, 135770. [Google Scholar] [CrossRef] [PubMed]
- Franklin, P.J. Indoor air quality and respiratory health of children. Paediatr. Respir. Rev. 2007, 8, 281–286. [Google Scholar] [CrossRef] [PubMed]
- Lau, O.W.; Luk, S.F. Leaves of Bauhinia blakeana as indicators of atmospheric pollution in Hong Kong. Atmos. Environ. 2001, 35, 3113–3120. [Google Scholar] [CrossRef]
- Shen, H.; Tsai, C.M.; Yuan, C.S.; Jen, Y.H.; Ie, I.R. How incense and joss paper burning during the worship activities influences ambient mercury concentrations in indoor and outdoor environments of an Asian temple? Chemosphere 2017, 167, 530–540. [Google Scholar] [CrossRef] [PubMed]
- Chen, J.; Brager, G.S.; Augenbroe, G.; Song, X. Impact of outdoor air quality on the natural ventilation usage of commercial buildings in the US. Appl. Energy 2019, 235, 673–684. [Google Scholar] [CrossRef]
- Environmental Protection Department, Air Quality in Hong Kong 2019. 2019. Available online: https://www.aqhi.gov.hk/api_history/english/report/files/AQR2019e_final.pdf (accessed on 2 February 2021).
- Jo, B.W.; Khan, R.M.A. An internet of things system for underground mine air quality pollutant prediction based on azure machine learning. Sensors 2018, 18, 930. [Google Scholar] [CrossRef] [Green Version]
- Smith, L.I. A tutorial on Principal Components Analysis (Computer Science Technical Report No. OUCS-2002-12). 2002. Available online: http://hdl.handle.net/10523/7534 (accessed on 25 February 2021).
- Kaiser, H.F. The Application of Electronic Computers to Factor Analysis. Educ. Psychol. Meas. 1960, 20, 141–151. [Google Scholar] [CrossRef]
- Helsel, D.R.; Hirsch, R.M.; Ryberg, K.R.; Archfield, S.A.; Gilroy, E.J. Statistical methods in water resources. U.S. Geol. Surv. Tech. Methods 2020, 2020, 1–484. [Google Scholar] [CrossRef]
- Višić, B.; Kranjc, E.; Pirker, L.; Bačnik, U.; Tavčar, G.; Škapin, S.; Remškar, M. Incense powder and particle emission characteristics during and after burning incense in an unventilated room setting. Air Qual. Atmos. Health 2018, 11, 649–663. [Google Scholar] [CrossRef]
- Wong, P.P.Y.; Lai, P.C.; Allen, R.; Cheng, W.; Lee, M.; Tsui, A.; Tang, R.; Thach, T.Q.; Tian, L.; Brauer, M.; et al. Vertical monitoring of traffic-related air pollution (TRAP) in urban street canyons of Hong Kong. Sci. Total Environ. 2019, 670, 696–703. [Google Scholar] [CrossRef] [Green Version]
- Thach, T.-Q.; Tsang, H.; Lai, P.; Lee, R.S.-Y.; Wong, P.P.-Y. Long-term effects of traffic exposures on mortality in a Chinese cohort. J. Transp. Health 2019, 14, 100609. [Google Scholar] [CrossRef]
- Wang, H.C.; Tseng, C.H. Health damages from indoor air pollution quantified using a novel office building diagnosis methodology. Environ. Eng. Manag. J. 2018, 17, 2061–2069. [Google Scholar] [CrossRef]
- Wong, L.P.; Alias, H.; Aghamohammadi, N.; Sulaiman, N.M.N.; Lin, H.; Zhao, J. Commuting on Public Transport: Health Risks and Responses. In Air Pollution-Monitoring, Quantification and Removal of Gases and Particles; IntechOpen: London, UK, 2018. [Google Scholar]
- Ekpenyong, C.E.; Ettebong, E.O.; Akpan, E.E.; Samson, T.K.; Daniel, N.E. Urban city transportation mode and respiratory health effect of air pollution: A cross-sectional study among transit and non-transit workers in Nigeria. BMJ Open 2012, 2. [Google Scholar] [CrossRef] [Green Version]
- Wu, J.; Xie, W.; Li, W.; Li, J. Effects of urban landscape pattern on PM2.5 Pollution—A Beijing Case Study. PLoS ONE 2015, 10, e0142449. [Google Scholar] [CrossRef] [PubMed] [Green Version]
- Caraka, R.E.; Noh, M.; Chen, R.C.; Lee, Y.; Gio, P.U.; Pardamean, B. Connecting climate and communicable disease to penta helix using hierarchical likelihood structural equation modelling. Symmetry 2021, 13, 657. [Google Scholar] [CrossRef]
- Yu, S. Water spray geoengineering to clean air pollution for mitigating haze in China’s cities. Environ. Chem. Lett. 2014, 12, 109–116. [Google Scholar] [CrossRef]
- Yang, T.T.; Lin, T.S.; Chang, M. Characteristics of emissions of volatile organic compounds from smoldering incense. Bull. Environ. Contam. Toxicol. 2007, 78, 308–313. [Google Scholar] [CrossRef] [PubMed]
Figure 1.
Hong Kong Special Administrative Region (SAR) of China.

Figure 2.
An overview of Hong Kong respiratory mortality and air quality (2001–2016). (The respiratory mortality rate was 16.65% in 2001, and it increased to 22.79% in 2016. The male mortality rate was generally higher than the female rate. The PM2.5 and NO2 showed a slight decrease from 2001 to 2016).

Figure 3.
Four Temple Types: (a) non-active temple; (b) closed temple; (c) semi-closed temple; (d) open temple (Picture from Hong Kong Antiquities and Monuments Office https://www.amo.gov.hk and Wikipedia, accessed on 5 January 2021).
Figure 3.
Four Temple Types: (a) non-active temple; (b) closed temple; (c) semi-closed temple; (d) open temple (Picture from Hong Kong Antiquities and Monuments Office https://www.amo.gov.hk and Wikipedia, accessed on 5 January 2021).

Figure 4.
Four Types of Temples after Classification (Base on TPUs of 2016).


Table 1.
Data Sources.
| Data | Period | Sources |
|---|---|---|
| TPU | 2001, 2006, 2011, 2016 | Planning Department (PlanD) |
| Temple | - | Digitize using Google Earth |
| Basic environmental data | - | Lands Department (iB5000 Digital Topographic Map) |
| Respiratory Mortality data (ICD-10) | 2001–2016 | Census and Statistics Department (C&SD) |
| Population | 2001, 2006, 2011, 2016 | |
| Air quality (NO2, FSP/PM2.5) | 2001, 2006, 2011, 2016 | Environmental Protection Department (EPD) |
Table 2.
KMO and Bartlett’s Test.
| KMO and Bartlett’s Test | 2001 | 2006 | 2011 | 2016 | |
|---|---|---|---|---|---|
| Kaiser-Meyer-Olkin Measure of Sampling Adequacy | 0.772 | 0.785 | 0.776 | 0.786 | |
| Bartlett’s Test of Sphericity | Approx. Chi-Square | 1182 | 1485 | 1514 | 1469 |
| df | 15 | 15 | 15 | 15 | |
| p value | <0.05 | <0.05 | <0.05 | <0.05 | |
Table 3.
Eigenvalue of Each PCs (PCs with a cumulative percentage of 70% are selected).
| PCs | 2001 | 2006 | 2011 | 2016 | |
|---|---|---|---|---|---|
| 1 | Eigenvalue | 3.365 | 3.608 | 3.595 | 3.638 |
| % of Variance | 56.089 | 60.133 | 59.912 | 60.630 | |
| Cumulative % | 56.089 | 60.133 | 59.912 | 60.630 | |
| 2 | Eigenvalue | 1.070 | 1.041 | 1.056 | 1.012 |
| % of Variance | 17.831 | 17.342 | 17.608 | 16.863 | |
| Cumulative % | 73.920 | 77.475 | 77.520 | 77.493 |
Table 4.
Rotated Components (variable values of each PC; in 2001, the sub-factors include building density, water density, temple index, and population density; in 2006 and 2011, they comprised of building density, greenery density, the and temple index; while all factors were as considered sub-factors for 2016).
| PCs | Variables | 2001 | 2006 | 2011 | 2016 |
|---|---|---|---|---|---|
| 1 | Temple index | 0.712 | |||
| Population density | 0.617 | 0.622 | 0.830 | ||
| Building density | 0.789 | 0.849 | 0.860 | 0.900 | |
| Greenery density | −0.692 | −0.724 | −0.720 | −0.757 | |
| Road density | 0.636 | 0.730 | 0.741 | 0.899 | |
| Water density | −0.867 | −0.838 | −0.832 | −0.314 | |
| 2 | Temple index | 0.829 | 0.874 | 0.872 | 0.510 |
| Population density | 0.740 | 0.608 | 0.607 | ||
| Building density | 0.503 | 0.419 | 0.398 | −0.303 | |
| Greenery density | −0.389 | ||||
| Road density | 0.654 | 0.574 | 0.564 | ||
| Water density | 0.848 |
Table 5.
Linear Regression Model Summary (as the p-value corresponding to the F value is less than 0.05, the regression model is statistically significant).
Table 5.
Linear Regression Model Summary (as the p-value corresponding to the F value is less than 0.05, the regression model is statistically significant).
| Model Summary | R | R Square | Adjusted R Square | F | p-Value |
|---|---|---|---|---|---|
| 2001 | 0.390 | 0.152 | 0.138 | 10.747 | <0.01 |
| 2006 | 0.602 | 0.363 | 0.352 | 34.079 | <0.01 |
| 2011 | 0.592 | 0.35 | 0.34 | 32.271 | <0.01 |
| 2016 | 0.341 | 0.117 | 0.102 | 7.895 | <0.01 |
Table 6.
Linear Regression Model Coefficients (in 2001, temple index, building density, greenery density, and road density were significantly correlated with respiratory mortality at the 95% confidence level; in 2006 and 2011, population density, temple index, building density, and greenery density were significantly correlated with respiratory mortality at the 95% confidence level, but only building density and greenery density had a response; in 2016, only greenery density was statistically significant).
| Model | Variables | Unstandardized | Standardized | t | Sig. | 95% Confidence Interval for B | Correlations | Collinearity Statistics | ||||
|---|---|---|---|---|---|---|---|---|---|---|---|---|
| B | Std. Error | Beta | Lower Bound | Upper Bound | Partial | Part | Tolerance | VIF | ||||
| 2001 | (Constant) | 0.154 | 0.011 | 14.460 | 0.000 | 0.133 | 0.175 | |||||
| Population Density | −0.124 | 0.089 | −0.092 | −1.397 | 0.163 | −0.299 | 0.051 | −0.073 | −0.068 | 0.546 | 1.830 | |
| Temple index | −0.011 | 0.005 | −0.136 | −2.435 | 0.015 ** | −0.020 | −0.002 | −0.127 | −0.118 | 0.752 | 1.331 | |
| Building Density | 0.001 | 0.000 | 0.540 | 4.637 | 0.000 ** | 0.001 | 0.001 | 0.237 | 0.225 | 0.174 | 5.750 | |
| Greenery Density | 0.001 | 0.000 | 0.374 | 5.393 | 0.000 ** | 0.000 | 0.001 | 0.273 | 0.262 | 0.489 | 2.047 | |
| Road Density | −0.002 | 0.001 | −0.245 | −2.240 | 0.026 * | −0.003 | 0.000 | −0.117 | −0.109 | 0.197 | 5.068 | |
| Water Density | −0.008 | 0.004 | −0.113 | −1.920 | 0.056 | −0.016 | 0.000 | −0.101 | −0.093 | 0.683 | 1.463 | |
| 2006 | (Constant) | 0.131 | 0.018 | 7.350 | 0.000 ** | 0.096 | 0.166 | |||||
| Population Density | −0.797 | 0.306 | −0.213 | −2.609 | 0.009 ** | −1.398 | −0.196 | −0.136 | −0.110 | 0.267 | 3.740 | |
| Temple index | 0.023 | 0.007 | 0.151 | 3.120 | 0.002 ** | 0.009 | 0.038 | 0.162 | 0.131 | 0.758 | 1.319 | |
| Building Density | 0.001 | 0.000 | 0.347 | 3.222 | 0.001 ** | 0.168 | 0.136 | 0.153 | 6.519 | |||
| Greenery Density | −0.001 | 0.000 | −0.457 | −7.282 | 0.000 ** | −0.359 | −0.307 | 0.450 | 2.223 | |||
| Road Density | −0.001 | 0.002 | −0.094 | −0.849 | 0.397 | −0.045 | −0.036 | 0.145 | 6.918 | |||
| Water Density | 0.013 | 0.007 | 0.099 | 1.907 | 0.057 | 0.100 | 0.080 | 0.658 | 1.521 | |||
| 2011 | (Constant) | 0.160 | 0.018 | 8.989 | 0.000 | 0.125 | 0.195 | |||||
| Population Density | −0.454 | 0.306 | −0.128 | −1.486 | 0.138 | −1.056 | 0.147 | −0.078 | −0.063 | 0.242 | 4.125 | |
| Temple index | 0.008 | 0.007 | 0.054 | 1.109 | 0.268 | −0.006 | 0.022 | 0.058 | 0.047 | 0.754 | 1.327 | |
| Building Density | 0.001 | 0.000 | 0.279 | 2.580 | 0.010 ** | 0.000 | 0.001 | 0.135 | 0.110 | 0.154 | 6.479 | |
| Greenery Density | −0.001 | 0.000 | −0.383 | −6.022 | 0.000 ** | −0.001 | −0.001 | −0.303 | −0.256 | 0.448 | 2.234 | |
| Road Density | 0.000 | 0.002 | 0.032 | 0.276 | 0.783 | −0.003 | 0.004 | 0.015 | 0.012 | 0.135 | 7.411 | |
| Water Density | −0.001 | 0.007 | −0.009 | −0.170 | 0.865 | −0.014 | 0.012 | −0.009 | −0.007 | 0.654 | 1.528 | |
| 2016 | (Constant) | 0.197 | 0.030 | 6.662 | 0.000 | 0.139 | 0.255 | |||||
| Population Density | 0.537 | 0.409 | 0.118 | 1.313 | 0.190 | −0.267 | 1.342 | 0.069 | 0.065 | 0.306 | 3.266 | |
| Temple index | 0.007 | 0.013 | 0.034 | 0.578 | 0.563 | −0.018 | 0.033 | 0.031 | 0.029 | 0.702 | 1.425 | |
| Building Density | 0.000 | 0.001 | 0.039 | 0.293 | 0.770 | −0.001 | 0.001 | 0.015 | 0.015 | 0.141 | 7.078 | |
| Greenery Density | −0.001 | 0.000 | −0.275 | −3.732 | 0.000 ** | −0.002 | −0.001 | −0.193 | −0.185 | 0.454 | 2.204 | |
| Road Density | −0.001 | 0.002 | −0.046 | −0.370 | 0.711 | −0.006 | 0.004 | −0.020 | −0.018 | 0.157 | 6.389 | |
| Water Density | 0.012 | 0.011 | 0.066 | 1.110 | 0.268 | −0.010 | 0.034 | 0.058 | 0.055 | 0.687 | 1.455 | |
* Significant at the 95% confidence level; ** Significant at the 99% confidence level.
Table 7.
Linear Regression Model Coefficients (greenery density, water density, NO2, and PM2.5 were significantly correlated with respiratory mortality at the 99% confidence level).
Table 7.
Linear Regression Model Coefficients (greenery density, water density, NO2, and PM2.5 were significantly correlated with respiratory mortality at the 99% confidence level).
| Variables | Unstandardized Coefficients | Standardized Coefficients | t | Sig. | 95. 0% Confidence Interval for B | ||
|---|---|---|---|---|---|---|---|
| B | Std. Error | Beta | Lower Bound | Upper Bound | |||
| (Constant) | −0.304 | 0.255 | −1.194 | 0.233 | −0.805 | 0.197 | |
| Population Density | 0.025 | 0.014 | 0.194 | 1.763 | 0.079 | −0.003 | 0.053 |
| Temple weight | 0.006 | 0.010 | 0.040 | 0.603 | 0.547 | −0.014 | 0.026 |
| Building Density | 0.026 | 0.020 | 0.192 | 1.321 | 0.188 | −0.013 | 0.066 |
| Greenery Density | −0.056 | 0.011 | −0.415 | −5.019 | 0.000 ** | −0.079 | −0.034 |
| Road Density | −0.028 | 0.018 | −0.212 | −1.552 | 0.122 | −0.064 | 0.008 |
| Water Density | 0.042 | 0.011 | 0.262 | 3.827 | 0.000 ** | 0.020 | 0.063 |
| NO2 | −0.006 | 0.002 | −0.229 | −3.454 | 0.001 ** | −0.010 | −0.003 |
| PM2.5 | 0.036 | 0.014 | 0.178 | 2.655 | 0.008 ** | 0.009 | 0.063 |
** Significant at a 99% confidence level.
Publisher’s Note: MDPI stays neutral with regard to jurisdictional claims in published maps and institutional affiliations. |
© 2021 by the authors. Licensee MDPI, Basel, Switzerland. This article is an open access article distributed under the terms and conditions of the Creative Commons Attribution (CC BY) license (https://creativecommons.org/licenses/by/4.0/).
Share and Cite
MDPI and ACS Style
Cai, W.H.; Wong, P.P.Y. Associations between Incense-Burning Temples and Respiratory Mortality in Hong Kong. Atmosphere 2021, 12, 774. https://0-doi-org.brum.beds.ac.uk/10.3390/atmos12060774
AMA Style
Cai WH, Wong PPY. Associations between Incense-Burning Temples and Respiratory Mortality in Hong Kong. Atmosphere. 2021; 12(6):774. https://0-doi-org.brum.beds.ac.uk/10.3390/atmos12060774
Chicago/Turabian StyleCai, Wen Hui, and Paulina Pui Yun Wong. 2021. "Associations between Incense-Burning Temples and Respiratory Mortality in Hong Kong" Atmosphere 12, no. 6: 774. https://0-doi-org.brum.beds.ac.uk/10.3390/atmos12060774
Note that from the first issue of 2016, this journal uses article numbers instead of page numbers. See further details here.