
Long-Term eBC Measurements with the Use of MAAP in the Polluted Urban Atmosphere (Poland)


1
Institute of Environmental Engineering of the Polish Academy of Sciences, 34 M. Skłodowska-Curie Str., 41-819 Zabrze, Poland
2
Institute of Earth Sciences, University of Silesia, Będzińska 60, 41-200 Sosnowiec, Poland
*
Authors to whom correspondence should be addressed.
Atmosphere 2021, 12(7), 808; https://0-doi-org.brum.beds.ac.uk/10.3390/atmos12070808
Submission received: 26 May 2021
/
Revised: 10 June 2021
/
Accepted: 21 June 2021
/
Published: 23 June 2021
(This article belongs to the Special Issue Air Quality in Poland)
Abstract
:In recent years, black carbon (BC) has been gaining more attention due to the diversity of anthropogenic sources and the harmful effects on human health, environment, and climate. In this paper, for the first time in Poland, the results of long-term measurements of eBC concentrations (2009–2020) at the urban background station in Zabrze (southern Poland) are presented. A Multi-Angle Absorption Photometer (MAAP) was used, which enables the measurement of eBC concentration in fine particulate matter (PM2.5). The mean concentration of eBC over the 11-year period (3.82 μg·m−3) was higher compared to the values recorded at most European urban stations. Annual averaged eBC levels showed a downward trend and clear seasonal variations, which was caused mainly by changes in the intensity of anthropogenic emissions. The impact of meteorological parameters, in particular air temperature and wind speed, which determine the intensity of emissions and the conditions of pollutant dispersion, was not without significance. The work additionally attempts to assess the possible impact of remedial actions carried out in Zabrze over the last decade. The results showed that modernization in industry and heating and maintenance of green areas potentially had the most important impact on the decline in eBC concentrations.
1. Introduction
Changes taking place in the environment as a result of urbanization pose a significant environmental, climatic, and economic threat. In many regions, the phenomenon of industrialization and urbanization had a negative impact on air quality [1,2,3]. Mitigation of atmospheric pollutants has become an issue of great importance due to the increase in the number of sources and types of atmospheric pollutants because of the rapid development of industry and transport, as well as the scale of its spread. Deteriorating air quality mainly affects cities and is one of the main problems of all developed and developing countries [4].
The dynamic evolution of the road transport sector observed in recent decades is an important factor of economic development and at the same time a significant source of nuisance, both for the general public and the natural environment [5,6,7,8]. The ecological and health risk is mainly due to the toxicity of substances contained in car exhaust fumes. Both the products of full and incomplete combustion of liquid fuels are emitted from vehicle engines, such as: carbon monoxide and dioxide (CO and CO2, respectively), nitrogen oxides (NOx), sulfur oxides (SOx), ozone (O3), hydrocarbons (HC), aldehydes, lead compounds (Pb), solid particles (the so-called PM—particulate matter), and soot (BC—black carbon) [9]. Overall, road transport remains the most important source of nitrogen oxide emissions in Europe (39% of total emissions) and contributes significantly to the emissions of soot (26%), CO (20%), PM2.5 (11%), and Pb (16%) [10].
Particulate and gaseous pollutants have a detrimental effect, in particular on human health, vegetation, soil, water, and materials. The World Health Organization estimated that ~3.7 million premature deaths in 2012 worldwide could be attributed to poor outdoor air quality [11]. According to the European Environmental Protection Agency, health effects related to exposure to air pollutants in Europe (including 41 countries) in 2018 included ~417,000 premature deaths due to long-term exposure to fine particulate matter (PM2.5) [10]. In addition, some substances affect the absorption and scattering of light radiation, are condensation nuclei for water vapor, and contribute to the formation of mists [12].
The carbon fraction is an important component of atmospheric dust and is generally between 20% and 50% of the total weight of the aerosol [13,14]. The carbon component of particulate matter from incomplete combustion of fossil fuels, biomass, and biofuels is commonly referred to as soot, BC, or EC. The difference between BC and EC is the measuring method used, because BC refers to the optical method, while EC is obtained by the thermo-optical one. In the optical method, the mass concentration of BC is obtained indirectly from the light attenuation measurements—therefore the term BC equivalent should be used (eBC). The most widely used instruments for optical eBC measurements are etalometers—including a modern aethalometer model AE33—and Multi-angle Absorption Photometer (MAAP) [12]. BC particles are mainly emitted only as a primary pollutant, mainly from anthropogenic sources such as transport, industry, and household combustion of solid fuels and biomass [15,16]. After releasing into the atmosphere, BC negatively affects human health, the environment, and its ecosystems [15]. The greatest danger of BC to humans is due to its submicron size and developed surface area. BC particles, along with the absorbed heavy metals and polycyclic aromatic hydrocarbons (PAHs) on the surface, can easily get into the lungs and into the alveoli, and then to other organs, along with the bloodstream. The interaction of BC particles with body tissues can result in serious human health problems, including respiratory, cardiovascular, and cerebrovascular diseases, affecting morbidity and mortality [17,18].
In addition to its impact on human health, BC is a significant contributor to global warming. This is due to the ability of BC particles to absorb solar radiation. Moreover, BC has a long lifetime in the atmosphere (from several days to weeks), and under favorable weather conditions (e.g., no precipitation) it can be transported far away from the emission sources, even towards the polar regions [19,20,21,22]. This is a particular risk because BC deposited on snow or ice can accelerate the melting of glaciers by increasing their surface temperature [23].
The harmful effects of black carbon on the climate, the environment, and human health make it an important parameter influencing air quality. Moreover, it has been shown that eBC can be a quick and reliable parameter for assessing air quality in urban areas [15]. For these reasons, tests of the content of carbon matter in the atmospheric air should be introduced as a standard, especially in areas such as the Silesian Voivodeship, which is an area of particular importance on the pollution map in Europe. With the above in mind, in this study, for the first time in Poland, a comprehensive datasets on eBC concentrations, measured for the period of eleven years, were presented. The study also examined the relationship of eBC concentrations with meteorological parameters and concentrations of selected gaseous pollutants, which allowed for preliminary identification of factors influencing air pollution by black carbon, including preliminary determination of possible sources of BC emission. The introduction of eBC measurements with the use of automatic devices will allow the improvement of the air quality monitoring network in Poland, similar to many regions in Europe [16,24,25].
2. Methods
2.1. Sampling Site
Concentrations of eBC were measured in the years 2009–2020 at the urban background station of the Institute of Environmental Engineering of the Polish Academy of Sciences in Zabrze (IEE PAS) (50.1° N, 18.2° E), localized in the western part of the Silesian Voivodeship (SW Poland), within the Upper Silesian Industrial District (USID) (Figure 1). The measurement station is located in the central-western part of the city and in its immediate vicinity there are residential buildings, houses, allotment gardens, internal roads, and the provincial road No. 921—approx. 300 m away. The nearest industrial area is approximately 1 km southeast of the IEE PAS station and includes facilities for the manufacturing, metallurgy, and coke industries. The detailed development of the area of the city of Zabrze was presented in [15].
In most parts of the city of Zabrze (approx. 60%), the average annual concentration of PM2.5 in the atmospheric air ranges from 30 to 35 μg·m−3 and from 45 to 50 μg·m−3 for PM10 [26], which indicates that the permissible levels for average annual concentrations of PM2.5 and PM10 (25 and 40 μg·m−3, respectively) [27] have been exceeded. The air quality in Zabrze was also assessed in terms of the content of eBCff (eBC from fossil fuels) and eBCbb (eBC from biomass burning), with average annual concentrations of 2.33 ± 2.16 and 0.93 ± 0.76 μg·m−3, respectively [15]. The seasonal behavior of both eBC fractions confirmed a significant impact of local emission sources—especially combustion of solid (household) and liquid (road transport) fossil fuels—on air pollution by eBC in the urban area of Zabrze.
Despite the improving of air quality in Poland, there is still the problem of exceeding the limit values for concentrations of regulated air pollutants, especially particulate matter (PM). One such area is southern Poland, and within it, the Upper Silesian Industrial District (USIP)—a zone with a significant concentration of industrial and municipal emission sources, with a dense road network and a high population density [28]. Dust emissions in the USID accounts for 30% of the total dust emissions in Poland, and the phase composition studies of atmospheric dust collected in selected USID locations showed the presence of soot in all samples [29]. Zabrze is a typical city of the USID, although the growing ecological awareness of society and efforts made by local authorities have made the problem of satisfactory air quality a priority. In order to reduce emissions of harmful substances and improve the quality of life of residents and the urban environment, in the area of Zabrze and the entire Silesian Voivodeship, remedial and corrective measures have been taken for many years, specified in strategic documents—environmental protection programs, low emission reduction programs, and programs of co-financing of investments related to the change of the heating system to pro-ecological heating. In one of the most up-to-date documents—i.e., “Updating the assumptions to the heat, electricity, and gaseous fuels supply plan in the area of the City of Zabrze” [30]—indicated that the main problem to be solved within the framework of cooperation between municipal services and residents is the modernization of individual coal heating systems, which are a source of “low-level emissions”. The city should continue educational and stimulating activities for projects aimed at changing the heat supply method, from low-efficiency, based on coal fuel, to pro-ecological solutions, i.e., connections to the gas or heating system or replacement of individual coal-fired boiler houses with new, high-efficiency and low-emission ones. An extremely important element is also supporting the development of renewable energy sources (RES), consisting of the use of solar collectors, photovoltaic installations, and heat pumps.
2.2. Multi-Angle Absorption Photometer 5012 (MAAP)
A Multi-angle Absorption Photometer 5012 (Thermo Scientific, Waltham, MA, USA) was used for continuous eBC measurements of the PM2.5 dust fraction suspended in the atmospheric air. The apparatus was located at the measurement station site belonging to IEE PAS and could obtain the eBC concentration at a height of about 2 m above ground level, with a time resolution of 10 min. As indicated in [31], the detection limits of the instrument—obtained from filter blank value fluctuations—were 20 and 50 ng·m−3, which were calculated for a time base of 30 min or 10 min, respectively.
MAAP is based on the optical method, using aerosol absorbing properties. These devices are commonly used in the measurement of carbonaceous matter, because BC is currently the only type of light-absorbing aerosol [16]. The basis of the optical method is the measurement of the attenuation of the light beam by a sample deposited on the filter belt. MAAP uses a glass fiber filter tape, and the wavelength measuring the deposited BC particles is 637 nm. The basis for calculating the eBC concentration is the aerosol absorption coefficient, which is a constant for MAAP [32,33,34,35,36]. In addition, the aerosol sample with the filter matrix forms a specific two-layer system. The optical properties of the sample are affected by the optical properties of the filter matrix. Therefore, to determine the absorption coefficient of the sample, it is necessary to calculate the transfer of radiation passing through the filter matrix [34].
Another MAAP feature is the three-angle BC measurement, which distinguishes the MAAP from other optical devices, such as the AE33, which emits electromagnetic radiation at one angle (90°) [16,36,37,38]. Measurements at 0, 130, and 165° are a combination of scattering and light transmission. The device’s photodetector system consists of forward and back hemisphere photodetectors. For the back hemisphere photodetectors, the reflection of light at 135 and 165° is measured. For the forward hemisphere photodetectors, the incident light transmission is measured at 0°.
2.3. Statistical Analysis
The data collected over the 11-year period was statistically analyzed—for this purpose, the MSExcel 2013 (Redmond, Washington, DC, USA) and software package Statistica 13.0 (Stat Soft, Cracow, Poland) were used. First, the time coverage of datasets was assessed, which determines the percentage of valid data for the considered measurement period. Although BC is not a pollutant covered by air quality standards, the data quality objectives set out in Directive 2008/50/EC were followed, ensuring high data quality [15]. Thus, the required time coverage is 75% when calculating the hourly and daily average concentrations and 90% for annual averages. After this initial verification of the datasets, descriptive statistics were calculated, i.e., mean, minimum, maximum, standard deviation, median, variance, and coefficient of change, to describe the concentrations of BC in the following periods: calendar year, heating (January–March and October–December), and non-heating season (April–September), as well as individual months.
Additionally, the statistical significance of differences of the compared datasets was assessed—annual mean and seasonal mean concentrations of BC. The Kurskal–Wallis test, which is a non-parametric equivalent of the one-way analysis of variance, was used. This test is recommended when we compare datasets of different sizes, the distribution of which differs from the normal distribution. In the analyzed case, the normality of the distribution was checked with the Shapiro–Wilk test (α = 0.05)—the requirement of the normality of the distribution was not met, both in relation to the annual measurement periods and in terms of the heating and non-heating season.
In addition to eBC concentrations, other auxiliary data were available from the urban background station in Zabrze. In the period of 2015–2020, parallel automatic measurement of particulate matter (PM2.5 and PM10), gaseous pollutants (SO2, NO, NO2, NOx, O3, CO), and selected meteorological parameters (air temperature, humidity, pressure, wind speed and direction, precipitation) were carried out. Measurements of PM2.5 concentrations and meteorological parameters were conducted by the IEE PAS using a tapered element oscillating microbalance (TEOM) and Vantage Pro weather station, respectively. The concentrations of PM10 and gaseous pollutants were registered as part of the measurement program of the monitoring station belonging to the Regional Inspectorate for the Environmental Protection (RIEP), located approximately 70 m from the IEE PAS building. All data was collected in the internal IEE PAS database and was cross-checked with the BC concentrations recorded during this period.
Finally, the annual mean eBC concentrations from 2010–2019 were compared with data on selected thematic areas of the Central Statistical Office (CSO) (see Section 3.3). They covered areas such as annual pollutant emissions (sulphur dioxide, nitrogen oxides, carbon monoxide, total suspended particulates (TSP)) from plants of significant nuisance to air quality, data on the transport network (number of registered vehicles, length of public roads), information related to the heating network (number of connections to networks), and annual expenditure on environmental protection. To investigate the interrelationship of eBC concentrations with particulate and gaseous pollutant concentrations, meteorological parameters, and CSO thematic areas, a non-parametric Spearman correlation analysis with 95% confidence intervals around the point estimates was used. The strength of the correlation—at the level of statistical significance α = 0.05—was classified according to the following ranges of the correlation coefficient (r): r < 0.1, no or very weak correlation; r = 0.1–0.3, weak correlation; r = 0.3–0.5, moderate correlation; r = 0.5–0.7, strong correlation; r > 0.7, very strong correlation.
3. Results
3.1. Concentrations of eBC
The concentrations of eBC recorded by the MAAP are given with a resolution of 10 min. Taking into account the entire measurement period (October 2009–December 2020), the total number of 10-min eBC measurements was 557,858, resulting in a time coverage of 94%. On the basis of the raw eBC dataset, the mean one-hour concentrations were calculated, from which the mean daily, monthly, seasonal, and annual concentrations were then determined.
Descriptive statistics of eBC concentrations in the entire 11-year measurement period and in individual years are summarized in Table 1. Taking into account the entire research period, the obtained time coverage was 90%, which confirms the correctness of the long-term average calculations. On the other hand, it was found that the condition of the required time coverage for the annual averaged period (not less than 90%) was not met in 2013–2016. Thus, data from this period will not be taken into account when discussing in detail the average annual concentrations of eBC. In addition, data from 2009 were also eliminated from further consideration as the measurements did not cover the entire calendar year.
The eleven-year averaged concentration of eBC at the urban background station in Zabrze was 3.82 ± 4.23 μg·m−3 (Table 1), which was clearly lower compared to the average concentrations of eBC from long-term measurements (2006–2015) carried out at urban stations in China, e.g., Chengdu (9.97 μg·m−3), Beijing (7.17 μg·m−3), and Zhengzhou (9.59 μg·m−3) [39]. Higher eBC concentrations were also recorded at the urban station in Colombo (Sri Lanka) during five-year measurements (11.30 μg·m−3) [40] and at the urban station in Varanasi (India) (11.8 μg·m−3) (4-year period) [41]. Focusing only on the results of studies conducted in Europe, it was found that the concentrations of eBC observed in Zabrze are generally higher compared to the values recorded at most urban or urban background stations, e.g., Helsinki (Finland, October 2015–May 2017) (BC = 1.69 μg·m−3) [42], Madrid (Spain, 2015) (BC = 2.33 μg·m−3) [43], Granada (Spain, December 2005–November 2008) (BC = 3.0 μg·m−3) [44], Paris (France, September 2009–September 2010) (BC = 1.8 μg·m−3) [45], London (UK, 2009) (BC = 2.0 μg·m−3) [45], and urban stations in Germany (2005–2014) (BC = 2.07 μg·m−3) [46]. Comparable values were recorded only at urban industrial site in Ostrava (Czech Republic, 2012–2014) [47] (BC = 3.48 μg·m−3) and urban traffic site in Madrid (Spain, 2015) (BC = 3.7 μg·m−3) [43]. It should be noted that, generally, there is a lack of data on eBC concentrations from long-term measurements in urban areas in Europe. Most studies discuss the results of short-term studies (less than a calendar year), often aiming to assess the impact of communication sources [43,48,49]. Some, however, focus on the analysis of eBC concentrations during periods of increased pollutant concentration called episodes [50]. Long-term measurements were carried out, especially at sites located far from emission sources, and were focused primarily on the assessment of pollution of clean areas and the role of eBC in climate change [51,52]. Therefore, in our opinion, the research we conduct is very important in the context of the exposure of the population of urban areas to air pollution by soot and the assessment of the effectiveness of the preventive and control measures taken (see also Section 3.3).
Average annual concentrations of eBC ranged from 2.85 ± 3.10 μg·m−3 (2020) to 4.71 ± 4.89 μg·m−3 (2010) (Table 1). When analyzing the values of the coefficient of variation, which is the ratio of the standard deviation to the arithmetic mean, a measure of the relative differentiation of a given feature, it can be noticed that the most visible intra-annual variations of eBC concentrations were recorded in 2011. In turn, the most homogeneous concentrations of eBC were found in 2010, and then in 2018 and 2020. Based on Figure 2, it can be concluded that there is also a relatively large variation between individual years, which was also confirmed by the non-parametric Kruskal–Wallis test (H = 1500.689, p < 0.05). Multiple comparison tests showed that statistically significant differences between BC concentrations were not recorded only in 2012, 2017, and 2018 (p > 0.05), when the average annual eBC concentrations were close to the mean for the entire 11-year measurement period. A particularly high mean concentration of eBC was also recorded in 2010 (BC = 4.71 μg·m−3) and subsequently in 2016 (BC = 4.51 μg·m−3), although, in the latter case, the time coverage was relatively low (82%). Thus, a clear spike in eBC concentration should be interpreted in this case with great caution, as many data were missing, especially in the non-heating season, when eBC levels are usually relatively low (e.g., [14,15,38]) (see Section 3.2). On the other hand, the year 2017, when the maximum hourly concentration of eBC (49.19 μg·m−3) occurred, is special. Such high temporary levels of eBC in Europe are nothing unusual—similar values were observed at some measurement stations in Spain (BC = 52 μg·m−3) [43], the Czech Republic (BC = 32.78 μg·m−3) [47], and Poland (BC = 49.9 μg·m−3) [50].
Despite these fluctuations between individual years, the concentrations of eBC in Zabrze showed a general downward trend that occurs regardless of whether the entire dataset is considered or only the years in which the condition of the required time coverage is met (Figure 3). A systematic decrease in eBC concentrations was also noticed in previous studies on the long-term course of eBC concentrations measured at an urban station in China (2006–2017) [39] and in Germany (2005–2014) [46]. Moreover, the work [46] indicated that the decrease in eBC concentrations over time was also noted at other European measurement stations, while it was most visible at sites influenced by communication sources. Annual fluctuations in eBC concentrations with a decreasing tendency at the urban background station in Zabrze reflect the general situation of eBC emissions in Poland in the period 1990–2016 [53]. According to [53], the long-term eBC emission in Poland over the years is characterized by two peaks—one in 1997 and the other in 2005—while, in 1997, the eBC emission was relatively high and amounted to about 26 Gg. After 2005, a downward trend in eBC emissions was observed, which indicates a reduced share of anthropogenic sources, such as: (a) commercial/institutional sector: stationary (from 0.799 to 0.343 Gg), public electricity and heat production (from 1.020 to 0.271 Gg); (b) fugitive emission from solid fuels: solid fuel transformation (from 0.637 to 0.476 Gg); (c) transport: light duty vehicles (from 1.601 to 1.287 Gg), heavy duty vehicles and buses (from 1.949 to 1.733 Gg), railways (from 1.927 to 0.248 Gg).
3.2. Seasonal Variations of eBC Concentrations
During the entire 11-year measurement period, eBC concentrations in the urban atmosphere of Zabrze showed similar annual fluctuations. Figure 4 shows BC time series measured by the MAAP, where individual data points refer to daily average. Within each year, relatively high concentrations of eBC occurred in the form of two peak periods, falling at the beginning (January–March) and the end (October–December) of the year, i.e., in the heating season. The highest daily mean concentrations of eBC were recorded in 2017 (9 January, BC = 25.51 μg·m−3), and then at the beginning of the measurement period—in 2011 (20 December, BC = 24.28 μg·m−3) and 2010 (4 December, BC = 21.05 μg·m−3).
Temporal variations in daily eBC concentrations are common and have also been observed at other urban stations, e.g., at Varanasi (India, South Asia), where significantly higher eBC concentrations were recorded (1.4–48.1 μg·m−3) [41]. Maximum concentrations at a level similar to those in this study were recorded in the form of a single peak during long-term measurements of eBC at urban site in Beijing (BCmax = 24.28 μg·m−3) [54]. Annual fluctuations in daily eBC concentrations were also noted for other types of measurement stations—including rural and traffic sites [39,42,55]. The occurrence of an episodic increase in the diurnal course of eBC concentrations may therefore be characteristic and independent of the localization characteristics. Annual variability of eBC concentrations may be caused, on the one hand, by a change in the intensity of anthropogenic emission sources, and, on the other hand, by a change in meteorological conditions [41,56,57].
Figure 5 and Figure 6 represent monthly and seasonal fluctuations in the concentration of eBC, averaged over the years 2009–2020. Taking into account the average monthly concentrations of eBC (Figure 3), a general constant decrease in concentrations was observed from January (BCave = 6.66 µg·m−3) until reaching the minimum in June (BCave = 1.19 µg·m−3). After this period, eBC concentrations begin to increase and reach their maximum value in November (BCave = 7 µg·m−3). Despite some slight differences in individual years, Figure 3 clearly shows that in the winter months (December, January, February) the eBC concentration was much higher (BCave = 5.90 µg·m−3) than in the summer months (BCave = 1.87µg·m−3). A comparison of long-term eBC concentrations with the values from the 13-year period (1989–2002) in the area of the Canadian Arctic shows a similar relationship; however, the peak concentrations of eBC were observed in the period from January to April [58]. Considering only measurement stations with similar characteristics, the average monthly eBC concentrations recorded at the urban station in Varanasi (Indo-Gangetic Plain, South Asia) (from ~5 to ~24 µg·m−3) were higher than those registered in Zabrze, but revealed similar variations, with a maximum falling in January [41]. High concentrations of eBC in the fall and winter months were also observed during long-term measurements carried out at urban background and industrial in Germany [46]. The exceptionally high mean monthly concentration of eBC observed in January was explained by the influence of unfavorable weather conditions (such as low air temperatures, lack of precipitation, low wind speeds, and frequent occurrence of the inversion layer), as well as general differences in emissions between winter and summer [46]. In turn, the maximum mean monthly concentration of eBC in February (BC) was recorded during the 3-year study conducted in Ostrava (Czech Republic), and this fact was explained by the influence of the burning of solid fuels for heating purposes in the area of investigation [47].
In the entire measurement period, high data quality, i.e., time coverage not less than 90%, was achieved for seven heating and eight non-heating seasons (Table 2), and only these seasons were included in further statistical analyzes. The concentrations of eBC are characterized by clear seasonal variations, which has already been found by analyzing the course of daily (Figure 4) and monthly (Figure 5) averages. In the heating season, the concentrations of eBC ranged from 4.77 to 7.37 µg·m−3 and were much higher than in the non-heating one (0.86–2.51 µg·m−3). As can be seen when analyzing the values of the coefficient of variation, the concentrations of eBC in the spring–summer period were, however, much more diversified, which can be explained by the greater dynamics of the atmosphere at this time of the year. Averaged over the entire 11-year measurement period, the mean concentration of eBC in the non-heating season was 1.77 ± 1.98 µg·m−3, while in the heating season it was over three times higher (5.99 ± 4.90 µg·m−3). Particularly noteworthy is the heating season at the turn of 2010 and 2011, with the average concentration of eBC at the level of 7.37 ± 5.58 µg·m−3, and the non-heating season in 2011, when the average concentration of eBC was the lowest and did not exceed 1 µg·m−3. Relatively low mean concentrations of eBC were recorded at the end of the measurement campaign (2018–2020), especially in relation to the heating season. Interesting data for comparisons are provided by the studies conducted at the same measurement site in Zabrze, in which the aethalometer AE33 was used to measure eBC concentrations in TSP [15]. It was observed that the concentration of eBC in the non-heating season of 2019 and the heating season of 2019/2020, recorded by MAAP (1.57 and 4.77 µg·m−3, respectively), was similar to the values registered by AE33 (1.75 and 4.70 µg·m−3, respectively). Thus, it can be concluded that similar levels of eBC obtained from two devices measuring different fractions (PM2.5 and TSP) support the fact that eBC is concentrated mainly in the finest PM fraction, which is consistent with the results of other scientific studies (e.g., [33,52]).
Increased eBC concentrations in the heating season are conditioned, on the one hand, by meteorological conditions and, on the other hand, by human activity [15,47,59]. Unfavorable weather conditions prevailing at this time of the year make it difficult to disperse and wash out pollutants from the atmosphere. As a consequence, the concentrations of eBC recorded in the autumn and winter period often reach the highest values, regardless of the dominant sources of eBC emissions in a given area. It is worth noting here that low air temperatures are mainly responsible for the increased intensity of burning solid fossil fuels, biomass, and other biofuels for heating purposes [60,61]. Other important local emission sources of black carbon—such as industry and car exhaust fumes—affect eBC concentrations evenly throughout the year [62,63]. Therefore, it can be concluded that the main factors affecting the concentration of eBC and other pollutants are municipal sources, the activity of which increases significantly in the heating season. Similar conclusions were found in the earlier works of the authors [15,28,64] and in other studies conducted in Europe and in the world. For example, the combustion of solid fuels for heating was also identified as the main source of eBC emissions in Ostrava (Czech Republic), based on long-term measurements of eBC concentrations in the area [47]. The same relationships were observed in studies conducted in India [65], where the extremely high eBC loads recorded in winter (21.5 ± 9.9 µg·m−3) were attributed to an increase in emissions from households related to the combustion of fossil fuels and biomass. On the other hand, the authors considered changes in meteorological conditions to be the key factor in the dynamics of eBC concentrations during the year [65,66]. In general, the increase in the concentration of many pollutants observed during the heating season is a common phenomenon and concerns, not only urban areas, but also rural areas or clean areas far away from large emission sources. For example, in the previous research [64], a clear increase in PM2.5 concentrations was demonstrated in the winter months at a regional background site in Diabla Góra. Due to stable weather conditions, the seasonal fluctuations of PM2.5 levels were explained by the influence of local fuel combustion sources, rather than by the influx of pollutants from more polluted areas.
3.3. Identification of Factors Influencing the Concentration of eBC
In studies on air pollution, correlation analysis is a commonly used method to assess the contribution of various emission sources or source categories to the observed concentration levels of the analyzed substances, as well as the possible impact of meteorological parameters on these concentrations. Strong links between the pollutants concerned may indicate [67]: (a) a similar source; (b) a similar generation and removal from the atmosphere; (c) a similar transport mechanism.
In this study, the non-parametric correlation analysis was carried out separately for the dataset for the entire measurement period (here: 2015–2020), and by heating and non-heating season (see also Section 2.3). On the one hand, this method of result presentation will allow obtaining information on the general relationship between the concentrations of eBC and the concentrations of gaseous and particulate substances as well as meteorological conditions in the study area. On the other hand, treating the data from the heating and non-heating seasons separately will allow us to capture the specificity of these measurement periods.
The results of the non-parametric correlation analysis between the average daily eBC concentrations and the meteorological parameters measured at the urban background station in Zabrze are presented in Table 3. According to numerous literature data, the local meteorology plays an important role in the dispersion of aerosols into the atmosphere at any location [61,67,68]. Considering the data from the entire measurement period, it was found that the change in eBC concentration was most influenced by air temperature (r = −0.63), although, in seasonal terms, a clear weakening of the relationship was observed, with r values at the level of −0.27 and −0.49, respectively, in the heating and non-heating season. The negative association between the temperature and the concentration of BC is consistent with the results presented in the literature and can be attributed to an increase in residential combustion of fossil fuels and biomass during low air temperatures and at stable atmospheric conditions [15,47,68]. The relatively weak correlation of eBC concentrations with this parameter in the heating season may indicate a dominant influence of local emission sources [15,61]. It is also worth noting that, in scientific research, a lot of attention is paid to the relationship between eBC concentrations and the occurrence of the urban heat island [69]; however, in the context of the conducted measurements, this issue requires further and more intensive research.
The correlation between the concentration of eBC and the values of atmospheric pressure, relative humidity, and precipitation was weak or statistically insignificant (Table 3). Lack of a clear relationship between precipitation and relative humidity and eBC concentration may result from the fact that freshly emitted BC particles have a hydrophobic character; thus, they are excluded from liquid droplets or are associated with an insoluble phase [47,70,71]. Compared to the above-mentioned meteorological parameters, wind speed is more effective in reducing eBC concentration at the sampling site. However, the effect of wind speed was only visible on a seasonal basis, with r values of −0.62 and −0.09 in the heating and non-heating season, respectively. As indicated by the literature data, wind speed plays an essential role in identifying periods of stagnation and transport of black carbon and other air pollutants [44,54,61,67]. High wind speeds favor the dispersion of atmospheric pollutants, while low wind speeds allow pollutant levels to rise. Week negative correlation between eBC levels and wind speed during the non-heating period suggest that other factors may have a major influence, such as transport of eBC particles from more distant sources [47,70].
The results obtained in this study allowed us to conclude that the temporal variability of eBC concentrations is caused primarily by changes in the intensity of black carbon emission from different anthropogenic sources, which increases during the heating period, while it clearly decreases in the non-heating one. In the analyzed urban area, there are mixed sources of pollutant emissions, mainly: industry, transport—car exhaust fumes—and combustion of solid fossil fuels and biomass in households for heating purposes. The high positive correlations of eBC with the measured particulate and gaseous pollutants (r = 0.73–0.90) in Zabrze in the 5-year measurement period (2015–2020) are therefore the expected results, and strong relationships persist for all three averaging periods. The only exception is ozone—a typical secondary air pollutant—with a relatively strong negative correlation between eBC and O3 concentrations (r = −0.54–−0.69), which results from a different mechanism of these substances formation [15,60,72].
On the basis of Table 4, it was found that the concentration of eBC correlated most strongly with the concentration of PM2.5, with r values of 0.89 (all periods, non-heating period) and 0.85 (heating period). Fine particulate matter is formed in the urban atmosphere to a large extent in the reactions of secondary gaseous precursors emitted from anthropogenic sources such as industrial plants [29,64,70,73], and high correlations of eBC vs. PM2.5, especially in the non-heating season, suggest the impact of this sector on air quality in Zabrze. The second common source of PM2.5 emissions is the combustion of fossil fuels and biomass in households [15,28,61,64], and its impact is confirmed by high eBC vs. PM2.5 correlations during the heating season. High values of correlation coefficients were also noted between eBC and PM10 concentrations. However, it was noted that, contrary to the eBC measurements in 2019–2020 [15], higher eBC correlations with PM10 in 2015–2020 occurred in the non-heating season (r = 90) compared to the heating season (r = 0.78), which additionally confirms the huge importance of other emission sources besides municipal fuel combustion on the eBC concentrations in Zabrze.
All trace gases listed in Table 4 correlated very strongly with the eBC concentration as these substances are co-emitted during different combustion processes. High CO concentrations are generally found in high-traffic urban areas, where up to 95% of CO emissions may come from vehicle exhaust [74]. Consequently, given that road traffic is a common source of CO and eBC emissions, and both have a relatively long atmospheric lifetimes (BC = 6–10 days and CO = 1–3 days), this suggests that eBC concentrations are affected by diffuse road emissions [72,73]. This is also supported by the strong correlation between eBC and gaseous nitrogen compounds (r = 0.76–0.86). Slightly lower values of correlation coefficients for eBC vs. NO, which is a good indicator of communication emissions [75], as well as high correlations during the heating season, may in turn suggest the influence of other emission sources on eBC concentrations, such as combustion processes in households and industry [47,72,73]. The influence of the industry sector on the concentrations of eBC over 6 years was significant, as evidenced by the high correlation between eBC and SO2 concentrations, higher in the non-heating season (r = 0.84) compared to the heating one (r = 0.73). As indicated by literature data, sulfur dioxide is a pollutant generated by the domestic and industrial combustion of various fuels, including coal, oil, and gas [15,73]. However, the areas most exposed to high SO2 concentrations are those near coal-fired power plants and oil refineries, and areas dominated by heavy industry [76].
In Poland, despite a significant improvement in air quality, higher concentrations of air pollutants are still recorded every year, mainly in the case of fine fraction of particulate matter in southern Poland [10]. According to the EEA report from 2020 [10], in 2009–2018 there was a decrease of 22% year on year average PM2.5 concentrations for all types of stations. However, the data from 2018 show that the southwestern area of Poland is still a “hot spot” on the map of the annual average PM2.5 concentration distribution. In this area, the concentrations of PM2.5 reach over 30 µg·m−3, thus exceeding the level recommended by WHO for the average annual concentration of PM2.5 (10 µg·m−3) [77]. Taking into account the courses of daily PM2.5 concentrations (Figure 7), it was noticed that, despite similar temporal variations during the each year, PM2.5 levels gradually increased until 2017, when the highest daily average was recorded (Jan 09, PM2.5 = 515.63 µg·m−3). Interestingly, on the same day, the maximum daily concentration of eBC (eBC = 25.51 µg·m−3) was found in the entire 6-year period under consideration. In the years 2015–2020, a total of 699 cases of exceeding the value recommended by WHO for the average daily PM2.5 concentrations (25 µg·m−3) were recorded. Elevated concentrations of eBC and PM2.5 occurred in the same periods, which points to common sources of these substances.
With respect to the BC fraction present in the PM2.5, it was necessary to calculate the percentage of eBC in PM2.5 mass, considering only those days when both eBC and PM2.5 data were available. The average share of eBC in PM2.5 over the entire 6-year period was 14.22%, and was slightly higher in the heating season (16.75%) compared to the non-heating one (13.09%). The eBC/PM2.5 ratio was relatively constant in individual years and ranged from 13.49% (2020) to 14.88% (2016). In general, the eBC/PM2.5 ratios recorded in Zabrze are higher compared to those registered in many urban areas, e.g., Gualalajara (Mexico) (1.4–9.6%), Los Angeles (USA) (1.5–8.8%), and Hong Kong (China) (9.0%) [73]. Therefore, it can be concluded that fine particles in Zabrze were largely polluted by the anthropogenic activities and associated BC. Quite similar eBC/PM2.5 values have been reported for New York City (USA) (~13%) [78] and Helsinki (Finland) [73].
Air protection programs have been implemented since 2003 in order to reduce air pollutant emissions in the Silesian Voivodeship. Since then, a number of measures have been taken in Zabrze to improve air quality. According to the document from 2019 [79], the most important activities include: development of a system of bicycle paths and bicycle infrastructure, parking policy, development and modernization of the public transport system, environmental education, promotional activities, co-financing of pro-ecological campaigns in schools, increasing the share of green areas in the city space, increasing the energy efficiency of cities, reducing the energy consumption of devices and installations as well as energy losses (including by modernizing heating networks), modernizing industrial plants to reduce pollutant emissions, replacing coal heating in public buildings, eliminating existing individual obsolete heating sources (stoves and local boiler houses), and the possibility of using renewable energy sources as sources of support for heat production.
Evaluation of the main BC sources and their generalized emission budget may well be useful to understand BC emissions and their trends over a region. In order to assess the possible impact of the remedial measures on eBC concentrations recorded in Zabrze over the last ten years, selected data collected by the Central Statistical Office [80] (Figure 8) (see Section 2.3) was analyzed. In addition, the correlation between the average annual concentrations of eBC and the values of the considered parameters collected in the CSO database was examined, with the potentially greatest impact on air pollution being by black carbon (Table 5). It should be mentioned here that such an analysis is difficult, which results mainly from the resolution of emission data and those relating to the road network, heating network, or incurred expenses, which are reported to the CSO on an annual basis. Moreover, considering that the eBC concentrations from 2013–2016 did not meet the time coverage requirements, they were excluded from the analysis. A small amount of data may explain the lack of statistically significant correlation in many cases. It is recommended to continue the continuous measurements of eBC concentrations in the ambient air to better capture possible interactions. The obtained results may also indicate that a comprehensive research effort is also required in constructing an emission base with a better resolution, even taking into account diurnal variability of anthropogenic emissions.
Analyzing the data presented in Figure 8, it was found that, in the period 2010–2019, there was a downward trend in the emission of pollutants, which was more pronounced in the case of gaseous pollutants. This is in line with the general tendency observed in many Polish and European cities [5,7,10]. Despite the fact that black carbon is a typical primary pollutant, the decrease in concentrations observed in the period under consideration was not so clear; however, it should be remembered that the prevailing meteorological situation is also largely responsible for the inter annual variations of eBC concentrations [47,57,70]. The mean annual concentrations of eBC were highly correlated with the annual emissions of gaseous and particulate pollutants (r = 0.60–0.83), although statistically significant correlations were found only for eBC vs. SO2 (r = 0.83). This confirmed earlier assumptions about the important role of industrial sources in shaping eBC levels in the urban air of Zabrze.
The concentration of people and their various activities in cities are exerting increasing stress on the natural environment, with impacts at local, regional, and even continental scales [5,17,45]. It has long been known that controlling anthropogenic emissions could be an effective way to mitigate the air pollution level [55]. The downward trend in eBC concentration in the period 2010–2019 in Zabrze may be caused, on the one hand, by a decrease in electricity consumption and, on the other hand, by an increase in the number of apartments connected to central heating systems as well as by the modernization and extension of the heating network (Figure 8).
This is confirmed by the negative values of the correlation coefficients for the above-mentioned variables, especially the statistically significant high negative correlation with the length of the heating network (r = −0.83). In many cases, the sources of low-level emissions are the most important cause of exceeding air quality standards, although in many areas there is a positive trend related to the replacement of coal stoves with liquid petroleum gas stoves and expansion of centralized heating system [44,54].
Interestingly, a negative correlation was observed between the concentration of eBC and the number of newly registered vehicles, although it was statistically insignificant (Table 5). According to the data shown in Figure 5, the number of newly registered vehicles has systematically increased over the last decade, which theoretically should translate into an increase in eBC concentrations and a positive correlation coefficient. Similar results were also recorded in other works (e.g., [44,48,54,55]). For example, in [54] the slight decrease in eBC concentrations observed in Beijing has been attributed to the implementation of new emission regulations for gasoline and diesel vehicles, and consequently advances in technology and compliance to control facilities. Please note that the change in vehicle composition was part of the EU strategy to reduce greenhouse gases emissions and to comply with the Kyoto Protocol [48]. Advances introduced could explain why the correlations between eBC and total number of newly registered motor vehicles were low when the number of cars increased [48,55].
Finally, it is noteworthy that there is a very strong negative correlation between the concentration of eBC and expenditure on the development of green areas (r = −0.94), which, after a marked decrease from 2011 to 2013, systematically increased from year to year (Figure 8). The achieved result should be treated with some caution and it should be confirmed by more intensive measurements aimed at determining the real impact of urban greenery on black carbon air pollution. Undoubtedly, however, our results may support the statement that urban green areas have the potential to attenuate some of the negative effects of urbanization, making cities a more pleasant place to live [81]. The role of such sites is important as they can contribute to mitigate climate change impacts via carbon sequestration and offer several co-benefits in cities [82]. Deposition of pollutants onto the surface of plants can result in permanent loss from the atmosphere, and hence a reduction in total atmospheric loading [83]. It has been proven that soils and associated microbial processes regulate the carbon cycle and provide a sink for atmospheric black carbon [84]. Moreover, soil in urban areas contaminated with BC may act as an effective sorbent of anthropogenic contaminants in green spaces [84].
4. Conclusions
In this study, the results of continuous measurements of eBC concentration carried out at the urban background station in Zabrze with the use of automatic measuring equipment—a Multi-Angle Absorption Photometer (MAAP)—were analyzed. To our knowledge, this is the first work of this type in Poland in which data from such a long measurement period, from October 2009 to December 2020, were taken into account. Over 500,000 temporary concentrations of eBC were collected, and on their basis the average hourly concentrations were calculated, which were then used to calculate the average daily, monthly, seasonal, and annual concentrations. Research efforts were focused primarily on the analysis of the eBC concentration trend in the study area and the assessment of inter-annual and seasonal variation, as well as the identification of factors influencing the variability of eBC concentrations. In addition, data on selected thematic areas of the Central Statistical Office were analyzed—including data on particulate and gaseous emissions from nuisance plants, data on the road network (number of newly registered vehicles), heat engineering (length of the heating network), and environmental protection expenditures. On this basis, the role of remedial measures taken in Zabrze over the last decade on the decrease of eBC concentrations in the atmospheric air was initially assessed.
The average annual concentration of eBC ranged from 2.85 μg·m−3 (2020) to 4.71 μg·m−3 (2010), with the average value for the entire measurement period at the level of 3.82 μg·m−3. The recorded levels of eBC in the urban air of Zabrze were comparable to the values recorded at measurement stations in Asia (e.g., China, India), while they were clearly higher than those recorded at many urban and urban background stations in Europe (Helsinki (Finland), Ostrava (Czech Republic), and German stations). During the entire measurement period, eBC concentrations showed similar annual fluctuations, with relatively high levels occurring at the beginning (January–March) and at the end of the year. Significantly higher concentrations of eBC recorded in the heating season (eBCave = 5.99 μg·m−3) compared to the non-heating one (eBCave = 1.77 μg·m−3) is a typical situation and should be associated with changes in the intensity of BC emissions from anthropogenic sources—especially the combustion of fossil fuels and biomass for heating purposes—as well as the variability of meteorological conditions.
Non-parametric correlation analysis showed that, apart from air temperature and wind speed, the relationships between eBC concentrations and meteorological parameters were weak or statistically insignificant. The clear weakening of the relationship with the temperature in the heating season, and the increase in the importance of wind speed in this period, speaks for the significant role of local emission sources in shaping eBC concentrations in the urban area of Zabrze. This fact is also supported by the high positive correlation of eBC concentrations with the concentrations of selected gaseous and particulate substances (r = 0.73–0.90), with the exception of ozone, which is a typical secondary pollutant. The strong relationships between eBC and CO and gaseous nitrogen compounds demonstrate, on the one hand, the high impact of communication emissions and, on the other hand, the strong impact of combustion sources in households and industry. The influence of the industrial sector on the concentrations of eBC recorded in Zabrze is also confirmed by the high correlation of eBC with sulfur dioxide, which is higher during the non-heating season (r = 0.84) than during the heating one (r = 0.73). Overall, the percentage of eBC in PM2.5 mass was relatively high (on average: 14.22%) compared to the values recorded in many urban areas, suggesting that fine particles in Zabrze were largely polluted by the anthropogenic activities and associated BC particles.
Summarizing the results obtained, despite the presence of a relatively large variation between individual years, the concentrations of eBC showed a general downward trend, which reflects the general situation of eBC emissions in Poland, and specifically a reduced share of anthropogenic sources, due to the fuel and technology improvements, both in industrial and commercial sectors. Preliminary analysis of the data of the Central Statistical Office showed that the average annual concentrations of eBC correlated highly with the emission of pollutants from plants of significant nuisance to air quality, while statistically significant relations were noted only with the emission of sulfur dioxide, which confirms the influence of industry as a source of eBC emissions in the studied area. Recommended pathways to reduce emissions of BC in the Zabrze area may also include modernizations in the heating sector, such as modernization of the existing and construction of a new heating network. The activities aimed at managing green areas in the city may also be of importance, as evidenced by the high correlation of average annual concentrations of eBC with the expenditure on maintaining urban greenery. Interestingly, there was no clear relationship between eBC concentrations and the number of registered vehicles, and this fact could be explained by the technological improvements of the newly produced car fleet.
In our opinion, the conducted research is of great scientific importance, especially in the context of the proven detrimental effect of BC on human health and the environment, as well as participation in global climate change. Moreover, they constitute a remarkable contribution to the knowledge of air pollution by fine particulate matter and PM-bounded black carbon, the more so because there is still a lack of studies on the measurement of long-term concentrations of eBC in Europe, especially in urban areas. Most studies discuss the results of short-term studies (less than a calendar year), and long-term studies were carried out mainly at sites located far from emission sources. It is recommended to continue the automatic measurements of eBC concentrations in the ambient air to better capture a possible interactions between ambient eBC levels, BC emissions, and weather conditions. A comprehensive investigation of eBC concentrations in Zabrze is of particular importance, due to the city’s location in a highly urbanized and industrialized area of southern Poland, whose inhabitants are often exposed to increased concentrations of air pollutants.
Moreover, eBC is a primary pollutant that does not transform in the ambient air, therefore it can be a simple and quick indicator of air quality. For this reason, long-term monitoring of eBC levels in the urban atmosphere can be a direct tool to guide remedial action, but it is necessary to establish limit values for this pollutant, defined by relevant legal standards.
Author Contributions
Conceptualization, N.Z. and B.B.; methodology, N.Z. and B.B.; formal analysis, N.Z. and B.B.; investigation, K.K.; resources, K.K.; data curation, N.Z. and B.B.; writing—original draft preparation, N.Z. and B.B.; writing—review and editing, N.Z. and B.B.; visualization, N.Z. and B.B.; supervision, N.Z., B.B., and K.K.; funding acquisition, K.K. All authors have read and agreed to the published version of the manuscript.
Funding
This work was supported by the Institute of Environmental Engineering of the Polish Academy of Sciences statutory research project no. 1a-128/2021 (“Primary and secondary components of the atmospheric aerosol in the context of the impact on the climate and natural environment of urban and non-urban areas”). The work was also prepared as a part of the research project no. POIR.04.02.00-00-D019/20-00 “ACTRIS—Infrastructure for the study of aerosols, clouds, and trace gases”, implemented under Measure 4.2 of the Smart Growth Operational Program 2014–2020, co-financed by the European Regional Development Fund.
Institutional Review Board Statement
Not applicable.
Informed Consent Statement
Not applicable.
Data Availability Statement
Data supporting reported results can be found in the data repository of the Institute of Environmental Engineering of the Polish Academy of Sciences in Zabrze, Poland.
Acknowledgments
The authors would like to thank the Regional Inspectorate for Environmental Protection in Katowice for providing data on the concentrations of gaseous pollutants (SO2, NOx, NO, NO2, CO) at the urban background station in Zabrze. The authors also thank three anonymous reviewers for critical and valuable comments that considerably improved the final version of the manuscript.
Conflicts of Interest
The authors declare no conflict of interest. The funders had no role in the design of the study; in the collection, analyses, or interpretation of data; in the writing of the manuscript, or in the decision to publish the results.
References
- Li, J.; Deng, X.; Seto, K.C. The impact of urban expansion on agricultural land use intensity in China. Land Use Policy 2013, 35, 33–39. [Google Scholar]
- Barbera, E.; Currò, C.; Valenti, G. A hyperbolic model for the effects of urbanization on air pollution. Appl. Math. Model. 2010, 34, 2192–2202. [Google Scholar] [CrossRef] [Green Version]
- Wang, S.; Gao, S.; Li, S.; Feng, K. Strategizing the relation between urbanization and air pollution: Empirical evidence from global countries. J. Clean. Prod. 2020, 243, 118615. [Google Scholar] [CrossRef]
- Sofia, D.; Gioiella, F.; Lotrecchiano, N.; Giuliano, A. Mitigation strategies for reducing air pollution. Environ. Sci. Pollut. Res. 2020, 27, 19226–19235. [Google Scholar] [CrossRef]
- Gulia, S.; Nagendra, S.M.S.; Khare, M.; Khanna, I. Urban air quality management—A review. Atmos. Pollut. Res. 2015, 6, 286–304. [Google Scholar] [CrossRef] [Green Version]
- Baklanov, A.; Molina, L.T.; Gauss, M.M. Megacities, air quality and climate. Atmos. Environ. 2016, 126, 235–249. [Google Scholar] [CrossRef]
- Gulia, S.; Nagendra, S.M.S.; Barnes, J.; Khare, M. Urban local air quality management framework for non-attainment areas in Indian cities. Sci. Total Environ. 2018, 619–620, 1308–1318. [Google Scholar] [CrossRef]
- Othman, B.; De Nuzio, G.; Di Domenico, D.; Canudas-de-Wit, C. Ecological traffic management: A review of the modeling and control strategies for improving environmental sustainability of road transportation. Annu. Rev Control 2019, 48, 292–311. [Google Scholar] [CrossRef]
- European Environment Agency. Air Quality in Europe—2016 Report; EEA Report No 28/2016; Publication Office of the European Union: Luxembourg, 2016; ISBN 978-92-9213-847-9. [Google Scholar]
- European Environment Agency. Air Quality in Europe—2020 Report; EEA Report No 09/2020; Publication Office of the European Union: Luxembourg, 2020; ISBN 978-92-9480-292-7. [Google Scholar]
- World Health Organization. Burden of Disease from Ambient Air Pollution for 2012. Summary of Results. Available online: http://www.who.int/airpollution/data/AAP_BoD_results_March2014.pdf (accessed on 12 April 2021).
- Bond, T.C.; Doherty, S.J.; Fahey, D.W.; Forster, P.M.; Bernsten, T.; DeAngelo, B.J.; Flanner, M.G.; Ghan, S.; Kärcher, B.; Koch, D.; et al. Bounding the role of black carbon in the climate system: A scientific assessment. J. Geophys. Res. Atmos. 2013, 118, 5380–5552. [Google Scholar] [CrossRef]
- Kanakidou, M.; Seinfeld, J.H.; Pandis, S.N.; Barnes, I.; Dentener, F.J.; Facchini, M.C.; Van Dingenen, R.; Ervens, B.; Nenes, A.; Nielsen, C.J.; et al. Organic aerosol and global clomate modelling: A review. Atmos. Chem. Phys. 2005, 5, 1053–1123. [Google Scholar] [CrossRef] [Green Version]
- Putaud, J.P.; Cavalli, F.; Crippa, M. Long-Term Trends in Black Carbon from Biomass and Fossil Fuel Combustion Detected at the JRC Atmospheric Observatory in Ispra, EUR 29147 EN; JRC110502; Publications Office of the European Union: Luxembourg, 2018; ISBN 978-92-79-80976-7. [Google Scholar]
- Zioła, N.; Błaszczak, B.; Klejnowski, K. Temporal Variability of Equivalent Black Carbon Components in Atmospheric Air in Southern Poland. Atmosphere 2021, 12, 119. [Google Scholar] [CrossRef]
- Petzold, A.; Ogren, J.A.; Fiebig, M.; Laj, P.; Li, S.-M.; Baltensperger, U.; Holzer-Popp, T.; Kinne, S.; Pappalardo, G.; Sugimoto, N.; et al. Recommendations for reporting “black carbon” measurements. Atmos. Chem. Phys. 2013, 13, 8365–8379. [Google Scholar] [CrossRef] [Green Version]
- Araya, R.T.; Flocchini, R.; Segura, R.G.E.M.; Guzmán, M.A.L. Carbonaceous Aerosols in Fine Particulate Matter of Santiago Metropolitan Area, Chile. Sci. World J. 2014, 2014, 794590. [Google Scholar]
- Magalhaes, S.; Baumgartner, J.; Weichenthal, S. Impacts of exposure to black carbon, elemental carbon, and ultrafine particles from indoor and outdoor sources on blood pressure in adults: A review of epidemiological evidence. Environ. Res. 2018, 161, 345–353. [Google Scholar] [CrossRef]
- Balakrishnaiah, G.; Ragjavendra-Kumar, K.; Suresh-Kumar Reddy, B.; Swamulu, C.; Rama-Gopal, K.; Reddy, R.R.; Reddy, L.S.S.; Nazeer-Ahammed, Y.; Narasimhulu, K.; Krishna-Moorthy, K. Anthropogenic impact on the temporal variations of black carbon and surface aerosol mass concentrations at a tropical semi-arid station in southeastern region of India. J. Asia Earth Sci. 2011, 42, 1297–1308. [Google Scholar] [CrossRef]
- EPA. Report to Congress on Black Carbon, Department of the Interior, Environment, and Related Agencies Appropriations Act; EPA-450/R12-001 March 2012; US Environmental Protection Agency: Washington, DC, USA, 2010.
- Simpson, D.; Yttri, K.E.; Klimont, Z.; Kupiainen, K.; Caseiro, A.; Gelencsér, A.; Pio, C.; Puxbaum, H.; Legrand, M. Modeling carbonaceous aerosol over Europe: Analysis of the CARBOSOL and EMEP EC/OC campaigns. J. Geophys. Res. 2007, 112, 1–26. [Google Scholar] [CrossRef]
- Kanaya, Y.; Taketani, F.; Komazaki, Y.; Liu, X.; Kondo, Y.; Sahu, L.K.; Irie, H.; Takashima, H. Comparison of Black Carbon Mass Concentrations Observed by multi-angle absorption photometer (MAAP) and continuous soot-monitoring system (COSMOS) on Fukue Island and in Tokyo, Japan. Aerosol Sci. Technol. 2013, 47, 1–10. [Google Scholar] [CrossRef] [Green Version]
- Bauer, S.E.; Bausch, A.; Nazarenko, L.; Tsigardis, K.; Xu, B.; Edwards, R.; Bisiaux, M.; McConnell, J. Historical and future black carbon deposition on the three ice caps: Ice core measurements and model simulations from 1850 to 2100. J. Geophys. Res. Atmos. 2013, 118, 1–14. [Google Scholar] [CrossRef] [Green Version]
- Zanatta, M.; Gysel, M.; Bukowiecki, N.; Müller, T.; Weingartner, E.; Areskoug, H.; Fiebig, M.; Yttri, K.E.; Mihalopoulos, N.; Kouvarakis, G.; et al. A European aerosol phenomenology-5: Climatology of black carbon optical properties at 9 regional background sites across Europe. Atmos. Environ. 2016, 145, 346–364. [Google Scholar] [CrossRef]
- Cuesta-Morquera, A.; Močnik, G.; Drinovec, L.; Müller, T.; Pfeifer, S.; Minguillón, M.C.; Briel, B.; Buckley, P.; Dudoitis, V.; Fernández-García, J.; et al. Intercomparison and characterization of 23 Aethalometers under laboratory and ambient air conditions: Procedures and unit-to-unit variabilities. Atmos. Meas. Tech. 2021, 14, 3195–3216. [Google Scholar] [CrossRef]
- Ongeo, Geoportal Website. Available online: https://ongeo.pl/geoportal/zabrze/zanieczyszczenie-powietrza (accessed on 26 March 2021).
- Directive 2008/50/EC of the European Parliament and of the Council of 21 May 2008 on Ambient Air Quality and Cleaner Air for Europe. Available online: http://eur-lex.europa.eu/legal-content/en/ALL/?uri=CELEX:32008L0050 (accessed on 11 June 2008).
- Błaszczak, B.; Mathews, B. Characteristics of carbonaceous matter in aerosol from selected urban and rural areas of Southern Poland. Atmosphere 2020, 11, 687. [Google Scholar] [CrossRef]
- Jabłońska, M. Phase Composition of Atmospheric Dust in Selected Localities of the Upper Silesian Industrial District; Scientific papers of the University of Silesia in Katowice; Publishing House of the University of Silesia: Katowice, Poland, 2003. (In Polish) [Google Scholar]
- Annex to the Resolution No. LX/719/18 of the City Council of Zabrze of 17 September 2018 on Adopting the Update of the Assumptions to the Heat, Electricity and Gas Fuel Supply Plan in the Area of the City of Zabrze. Available online: https://miastozabrze.pl/ (accessed on 6 April 2021). (In Polish).
- Petzold, A.; Kramer, H.; Schönlinner, M. Continuous Measurement of atmospheric black carbon using a multi-angle absorption photometer. Environ. Sci. Pollut. Res. 2002, 4, 78–82. [Google Scholar]
- Reche, C.; Querol, X.; Alastuey, A.; Viana, M.; Pey, J.; Moreno, T.; Rodríguez, S.; González, Y.; Fernández-Camacho, R.; Sánchez de la Campa, A.M.; et al. New considerations for PM, Black Carbon and particle number concentration for air quality monitoring across different European cities. Atmos. Chem. Phys. 2011, 11, 6207–6227. [Google Scholar] [CrossRef] [Green Version]
- Hyvärinen, A.-P.; Vakkari, V.; Laakso, L.; Hooda, R.K.; Sharma, V.P.; Panawar, T.S.; Beukes, J.P.; van Zyl, P.G.; Josipovic, M.; Garland, R.M.; et al. Correction for a measurement artifact of the Multi-Angle Absorption Photometer (MAAP) at high black carbon mass concentration levels. Atmos. Meas. Tech. 2013, 6, 81–90. [Google Scholar] [CrossRef] [Green Version]
- Nordmann, S.; Birmili, W.; Weinhold, K.; Müller, K.; Spindler, G.; Wiedensohler, A. Measurements of the mass absorption cross section of atmospheric soot particles using Raman spectroscopy. J. Geophys. Res. Atmos. 2013, 118, 12075–12085. [Google Scholar] [CrossRef]
- Massling, A.; Nielsen, I.E.; Kristensen, D.; Christensen, J.H.; Sørensen, L.L.; Jensen, B.; Nguyen, Q.T.; Nøjgaard, J.K.; Glasius, M.; Skov, H. Atmospheric black carbon and sulfate concentrations in Northeast Greenland. Atmos. Chem. Phys. 2015, 15, 9681–9692. [Google Scholar] [CrossRef] [Green Version]
- Saturno, J.; Pöhlker, C.; Massabò, D.; Brito, J.; Carbone, S.; Cheng, Y.; Chi, X.; Ditas, F.; Hrabĕ de Angelis, I.; Moràn-Zuloaga, D. Comparison of different Aethalometer correction schemes and a reference multi-wavelength absorption technique for ambient aerosol data. Atmos. Meas. Tech. 2017, 10, 2837–2850. [Google Scholar] [CrossRef] [Green Version]
- MAAP Manual, 2009. Thermo Fisher Scientific Air Quality Instruments, Model 5012 Instruction Manual Multi Angle Absorption Photometer (MAAP) Software V1.32/1.33 Part Number 100076-00. Available online: https://tools.thermofisher.com/content/sfs/manuals/EPM-manual-Model%205012%20MAAP.pdf (accessed on 26 March 2021).
- Rattigan, O.V.; Civerolo, K.; Doraiswamy, P.; Felton, H.D.; Hopke, P.K. Long term black carbon measurements at two urban locations in New York. Aerosol Air Qual. Res. 2013, 13, 1181–1196. [Google Scholar] [CrossRef] [Green Version]
- Guo, B.; Wang, Y.; Zhang, X.; Che, H.; Ming, J.; Yi, Z. Long-Term variation of black carbon aerosol in China based on revised aethalometer monitoring data. Atmosphere 2020, 11, 684. [Google Scholar] [CrossRef]
- Seneviratne, M.S.; Waduge, V.A.; Hadagiripathira, L.; Sanjeewani, S.; Attanayake, T.; Jayaratne, N.; Hopke, P.K. Characterization and source apportionment of particulate pollution in Colombo, Sri Lanka. Atmos. Pollut. Res. 2011, 2, 207–212. [Google Scholar] [CrossRef] [Green Version]
- Srivastava, S.; Kumar, M.; Singh, R.S.; Rai, B.N.; Mall, R.K.; Banerjee, T. Long-term observation of black carbon aerosols at an urban location over the central Indo-Gangetic Plain, South Asia. Atmósfera 2019, 32, 95–113. [Google Scholar] [CrossRef] [Green Version]
- Helin, A.; Niemi, J.V.; Virkkula, A.; Pirjola, L.; Teinilä, K.; Backman, J.; Aurela, M.; Saarikoski, S.; Rönkkö, T.; Asmi, E.; et al. Characteristics and source apportionment of black carbon in the Helsinki metropolitan area, Finland. Atmos. Environ. 2018, 190, 87–98. [Google Scholar] [CrossRef]
- Becerril-Valle, M.; Coz, E.; Prévôt, A.S.H.; Močnik, G.; Pandis, S.N.; Sánchez de la Campa, A.M.; Alastuey, A.; Díaz, E.; Pérez, R.M.; Artíñano, B. Characterization of atmospheric black carbon and co-pollutants in urban and rural areas of Spain. Atmos. Environ. 2017, 169, 36–53. [Google Scholar] [CrossRef]
- Lyamani, H.; Olmo, F.J.; Foyo, I.; Alados-Arboledas, L. Black carbon aerosols over an urban area in south-eastern Spain: Changes detected after the 2008 economic crisis. Atmos. Environ. 2010, 45, 6423–6432. [Google Scholar] [CrossRef]
- Beekmann, M.; Prévôt, A.S.H.; Drewnick, F.; Sciare, J.; Pandis, S.N.; Denier van der Gon, H.A.C.; Crippa, M.; Freutel, F.; Poulain, L.; Ghersi, V.; et al. In Situ, satellite measurement and model evidence on the dominant regional contribution to fine particulate matter levels in the Paris megacity. Atmos. Chem. Phys. 2015, 15, 9577–9591. [Google Scholar] [CrossRef] [Green Version]
- Kutzner, R.D.; von Schneidemesser, E.; Kuik, F.; Quedenau, J.; Weatherhead, E.C.; Schmale, J. Long-term monitoring of black carbon across Germany. Atmos. Environ. 2018, 185, 41–52. [Google Scholar] [CrossRef]
- Kucbel, M.; Corsaro, A.; Švédová, B.; Raclavská, H.; Raclavský, K.; Juchelková, D. Temporal and seasonal variations of black carbon in a highly polluted European city: Apportionment of potential sources and the effect of meteorological conditions. J. Environ. Manag. 2017, 203, 1178–1189. [Google Scholar] [CrossRef]
- Krecl, P.; Johansson, C.; Targino, A.C.; Ström, J.; Burman, L. Trends in black carbon and size-resolved particle number concentrations and vehicle emissions factors under real-world conditions. Atmos. Environ. 2017, 165, 155–168. [Google Scholar] [CrossRef]
- Ježek, I.; Blond, N.; Skupinski, G.; Močnik, G. The traffic emission-dispersion model for a Central-European city agrees with measured black carbon apportioned to traffic. Atmos. Environ. 2018, 184, 177–190. [Google Scholar] [CrossRef]
- Maciejewska, K.; Juda-Rezler, K.; Reizer, M.; Klejnowski, K. Modelling of black carbon statistical distribution and return periods of extreme concentrations. Environ. Model. Softw. 2015, 74, 212–226. [Google Scholar] [CrossRef]
- Sun, J.; Hermann, M.; Yuan, Y.; Birmili, W.; Coen, M.C.; Weinhold, K.; Madueno, L.; Poulain, L.; Touch, T.; Ries, L.; et al. Long-term trends of black carbon and particle number concentration in the lower free troposphere in Central Europe. Environ. Sci. Eur. 2021, 33, 43. [Google Scholar] [CrossRef]
- Weller, R.; Minikin, A.; Petzold, A.; Wagenbach, D.; König-Langlo, G. Characterization of long-term and seasonal variations of black carbon (BC) concentrations at Neumayer, Antarctica. Atmos. Chem. Phys. 2013, 13, 1579–1590. [Google Scholar] [CrossRef] [Green Version]
- Dębski, B.; Olecka, A.; Bebkiewicz, K.; Chłopek, Z.; Kargulewicz, I.; Rutkowski, J.; Zasina, D.; Zimakowska-Laskowska, M.; Żaczek, M.; Waśniewska, S. The National Centre for Emissions Management. Poland’s Informative Inventory Report 2018. Submission under the UN ECE Convention on Long-range Transboundary Air Pollution and the DIRECTIVE (EU) 2016/2284; Warsaw, February 2018. Available online: https://www.kobize.pl/pl/fileCategory/list (accessed on 7 April 2021).
- Liu, Q.; Ma, T.; Olson, M.R.; Liu, Y.; Zhang, T.; Wu, Y.; Schauer, J.J. Temporal variations of black carbon during haze and non-haze days in Beijing. Sci. Rep. 2016, 6, 33331. [Google Scholar] [CrossRef]
- Xu, L.; Zhang, J.; Sun, X.; Xu, S.; Shan, M.; Yuan, Q.; Liu, L.; Du, Z.; Liu, D.; Xu, D.; et al. Variation in concentration and sources of black carbon in a megacity of China during the COVID-19 pandemic. Geophys. Res. Lett. 2020, 47, e2020GL090444. [Google Scholar] [CrossRef]
- Guha, A.; De, B.K.; Dhar, P.; Banik, T.; Chakraborty, M.; Roy, R.; Choudhury, A.; Gogoi, M.M.; Babu, S.S.; Moorthy, K.K. Seasonal characteristics of aerosol black carbon in relation to long range transport over Tripura in Northeast India. Aerosol Air Qual. Res. 2015, 15, 786–798. [Google Scholar] [CrossRef] [Green Version]
- Bibi, S.; Alam, K.; Chishtie, F.; Bibi, H.; Rahman, S. Temporal variation of Black Carbon concentration using Aethalometer observations and its relationships with meteorological variables in Karachi, Pakistan. J. Atmos. Sol. Terr. Phys 2017, 157–158, 67–77. [Google Scholar] [CrossRef]
- Sharma, S.; Lavoué, D.; Cachier, H.; Barrie, L.A.; Gong, S.L. Long-term trends of the black carbon concentrations in the Canadian Arctic. J. Geophys. Res. 2004, 109, D15203. [Google Scholar] [CrossRef]
- Zioła, N.; Słaby, K. The Content of Selected Heavy Metals and Polycyclic Aromatic Hydrocarbons (PAHs) in PM10 in Urban-Industrial Area. Sustainability 2020, 12, 5284. [Google Scholar] [CrossRef]
- Jhun, I.; Coull, B.; Schwartz, J.; Hubbell, B.; Koutrakis, P. The impact of weather changes on air quality and health in the United States in 1994–2012. Environ. Res. Lett. 2015, 10, 084009. [Google Scholar] [CrossRef] [Green Version]
- Błaszczak, B.; Zioła, N.; Mathews, B.; Klejnowski, K.; Słaby, K. The Role of PM2.5 chemical composition and meteorology during high pollution periods at a suburban background station in Southern Poland. Aerosol Air Qual. Res. 2020, 20, 2433–2447. [Google Scholar] [CrossRef]
- Safai, P.D.; Kewat, S.; Praveen, P.S.; Rao, P.S.P.; Momin, G.A.; Ali, K.; Devara, P.C.S. Seasonal variation of black carbon aerosols over a tropical urban city of Pune, India. Atmos. Environ. 2007, 41, 2699–2709. [Google Scholar] [CrossRef]
- Zhang, X.; Rao, R.; Huang, Y.; Mao, M.; Berg, M.J.; Sun, W. Black carbon aerosols in urban central China. J. Quant. Spectrosc. Radiat. Transf. 2015, 150, 3–11. [Google Scholar] [CrossRef]
- Rogula-Kozłowska, W.; Klejnowski, K.; Rogula-Kopiec, P.; Ośródka, L.; Krajny, E.; Błaszczak, B.; Mathews, B. Spatial and seasonal variability of the mass concentrations and chemical composition of PM2.5 in Poland. Air Qual. Atmos. Health 2014, 7, 41–58. [Google Scholar] [CrossRef] [Green Version]
- Kumar, R.; Barth, M.C.; Pfister, G.G.; Nair, V.S.; Ghude, S.D.; Ojha, N. What controls the seasonal cycle of black carbon aerosols in India? J. Geophys. Res. Atmos. 2015, 120, 7788–7812. [Google Scholar] [CrossRef] [Green Version]
- Kumar, M.; Raju, M.P.; Singh, R.K.; Singh, A.K.; Singh, R.S.; Banerjee, T. Wintertime characteristics of aerosols over middle Indo-Gangetic Plain: Vertical profile, transport and radiative forcing. Atmos. Res. 2017, 183, 268–282. [Google Scholar] [CrossRef]
- Galindo, N.; Varea, M.; Gil-Moltó, J.; Yubero, E.; Nicolás, J. The Influence of meteorology on particulate matter concentrations at an urban mediterranean location. Water Air Soil Pollut. 2011, 215, 365–372. [Google Scholar] [CrossRef]
- Järvi, L.; Junninen, H.; Karppinen, A.; Hillamo, R.; Virkkula, A.; Mäkelä, T.; Pakkanen, T.; Kulmala, M. Temporal variations in black carbon concentrations with different time scales in Helsinki during 1996–2005. Atmos. Chem. Phys. 2008, 8, 1017–1027. [Google Scholar] [CrossRef] [Green Version]
- Milesi, C.; Churkina, G. Measuring and Monitoring Urban Impacts on climate Change from Space. Remote Sens. 2020, 12, 3494. [Google Scholar] [CrossRef]
- Tiwari, S.; Srivastava, A.K.; Bisht, D.S.; Parmita, P.; Srivastava, M.K.; Attri, S.D. Diurnal and seasonal variations of black carbon and PM2.5 over New Delhi, India: Influence of meteorology. Atmos. Res. 2013, 125–126, 50–62. [Google Scholar] [CrossRef]
- Choi, Y.; Ghim, Y.S.; Zhang, Y.; Park, S.-M.; Song, I.-H. Estimation of Surface concentrations of black carbon from long-term measurements at aeronet sites over Korea. Remote Sens. 2020, 12, 3904. [Google Scholar] [CrossRef]
- Badarinath, K.V.S.; Kumar Kharol, S.; Kiran Chand, T.R.; Parvathi, Y.G.; Anasuya, T.; Jyothsna, A.N. Variations in black carbon aerosol, carbon monoxide and ozone over an urban area of Hyderabad, India, during the forest fire season. Atmos. Res. 2007, 85, 18–26. [Google Scholar] [CrossRef]
- Limon-Sanchez, M.T.; Carbajal-Romero, P.; Hernandez-Mena, L.; Saldarriaga-Norena, H.; Lopez-Lopez, A.; Cosio-Ramirez, R.; Arriaga-Colina, J.L.; Smith, W. Black carbon in PM2.5, data from two urban sites in Guadalajara, Mexico during 2008. Atmos. Pollut. Res. 2011, 2, 358–365. [Google Scholar] [CrossRef] [Green Version]
- United States Environmental Protection Agency. Latest Findings on National Air Quality; Status and trends through 2006; United States Environmental Protection Agency: Research Triangle Park, NC, USA, January 2008. Available online: https://nepis.epa.gov/Exe/ZyPDF.cgi/60000MXE.PDF?Dockey=60000MXE.PDF (accessed on 26 April 2021).
- Kassomenos, P.A.; Vardoulakis, S.; Chaloulakou, A.; Pschalidou, A.K.; Grivas, G.; Borge, R.; Lumbreras, J. Study of PM10 and PM2.5 levels in three European cities: Analysis of intra and inter urban variations. Atmos. Environ. 2014, 87, 153–163. [Google Scholar] [CrossRef] [Green Version]
- Dahiya, S.; Anhäuser, A.; Farrow, A.; Thieriot, H.; Kumar, A.; Myllyvirta, L. Global SO2 Emission Hotspot Database; Center for Research on Energy and Clean Air & Greenpeace India: Delhi, India, October 2020; p. 48. Available online: https://www.greenpeace.org/static/planet4-mena-stateless/a372e5fe-so2-report-english.pdf (accessed on 4 May 2021).
- World Health Organization. Health Effects of Particulate Matter. Policy Implications for Countries in Eastern Europe, Caucasus and central Asia; WHO Regional Office for Europe: Copenhagen, Denmark, 2013; ISBN 978-92-890-0001-7. [Google Scholar]
- Venkatachari, P.; Zhou, L.; Hopke, P.K.; Felton, D.; Rattigan, O.V.; Schwab, J.J.; Demerjian, K.L. Spatial and temporal variability of black carbon in New York City. J. Geophys. Res. Atmos. 2006, 111, 1–9. [Google Scholar] [CrossRef]
- Bystrzanowski, Ł.; Kubiczek, K.; Zastrzeżyńska, J. Environmental Protection Program for the City of Zabrze until 2024 with a Perspective until 2028; Annex to Resolution No. XVII/305/20 of the Zabrze City Council of 17 February 2020. Provincial Fund for Environmental Protection and Water Management in Katowice, 2019. Available online: https://bip.miastozabrze.pl/engine//bip/451/239?o=tp1&e=s|239 (accessed on 17 May 2021). (In Polish).
- The Website of Central Statistical Office—Local Data Bank. Available online: https://bdl.stat.gov.pl/BDL/start (accessed on 12 April 2021).
- Feliciano, M.; Gonçalves, A.; Cardoso, A.; Nunes, T.; Nunes, L.; Cortez, P.; Ribeiro, A.; Rodrigues, O.; Castro, J.; Martins, L. The role of green spaces on urban environmental quality. In Proceedings of the 2nd International Conference on Environmental Research and Assessment, Bucharest, Romania, 5–8 October 2006; Pătroescu, M., Matache, M.L., Eds.; University of Bucharest, Centre for Environmental Research and Impact Studies: Bucharest, Romania; pp. 233–249. [Google Scholar]
- Nero, B.F.; Callo-Concha, D.; Anning, A.; Denich, M. Urban green spaces enchance climate change mitigation in cities of the global south: The case of Kumasi, Ghana. Procedia Eng. 2017, 198, 69–83. [Google Scholar] [CrossRef]
- Hewitt, C.N.; Ashworth, K.; MacKenzie, A.R. Using green infrastructure to improve urban air quality (GI4AQ). Ambio 2020, 49, 62–73. [Google Scholar] [CrossRef] [Green Version]
- Schifman, L.A.; Prues, A.; Gilkey, K.; Shuster, W.D. Realizing the opportunities of black carbon in urban soils: Implications for water quality management with green infrastructure. Sci. Total Environ. 2018, 10, 1027–1035. [Google Scholar] [CrossRef]
Figure 1.
Location of the study area and surroundings of measurement station selected for research. [Source: Google Earth].
Figure 1.
Location of the study area and surroundings of measurement station selected for research. [Source: Google Earth].

Figure 2.
The chart of mean and non-outlier eBC concentrations at the urban background station in Zabrze (2010–2020 period).
Figure 2.
The chart of mean and non-outlier eBC concentrations at the urban background station in Zabrze (2010–2020 period).

Figure 3.
Trend of changes of annual average course of eBC concentrations (µg·m−3). (The Kendall robust line-fit method was used for the trend analysis).
Figure 3.
Trend of changes of annual average course of eBC concentrations (µg·m−3). (The Kendall robust line-fit method was used for the trend analysis).

Figure 4.
Time series of daily eBC concentration (µg·m−3) in individual years.

Figure 5.
Monthly course of eBC concentrations (µg·m−3) averaged over individual months.

Figure 6.
Seasonal course of eBC concentrations (µg·m−3) recorded for the heating and non-heating season.
Figure 6.
Seasonal course of eBC concentrations (µg·m−3) recorded for the heating and non-heating season.

Figure 7.
Seasonal course of eBC concentrations (µg·m−3) recorded for the heating and non-heating season (the actual eBC concentrations have been increased by 20 to improve the readability of the graph).
Figure 7.
Seasonal course of eBC concentrations (µg·m−3) recorded for the heating and non-heating season (the actual eBC concentrations have been increased by 20 to improve the readability of the graph).

Figure 8.
Average annual concentrations of eBC in Zabrze from 2010–2019, compared to the values of selected parameters collected in the Central Statistical Office database. The trend line is marked with a black dotted line. An incomplete filling in the eBC chart means that the required time coverage has not been achieved in a given year.


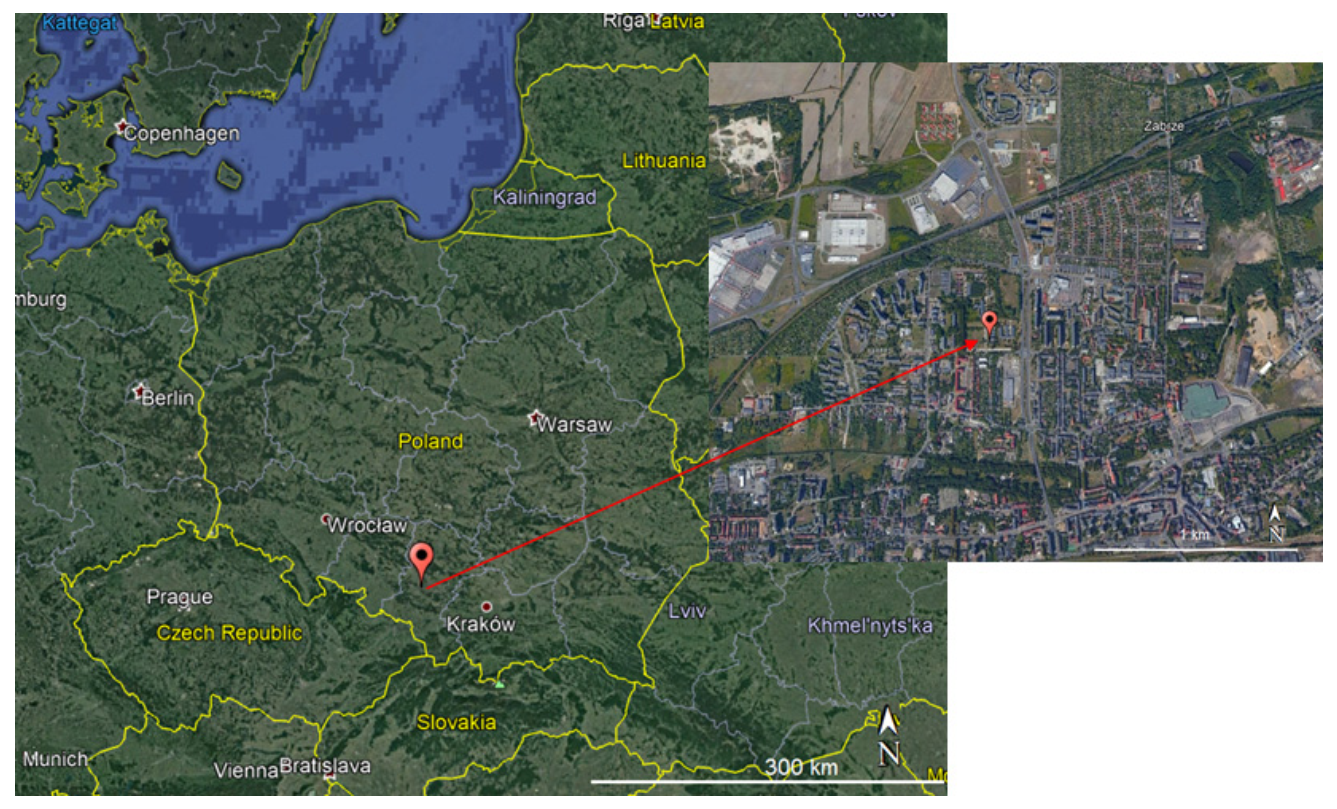
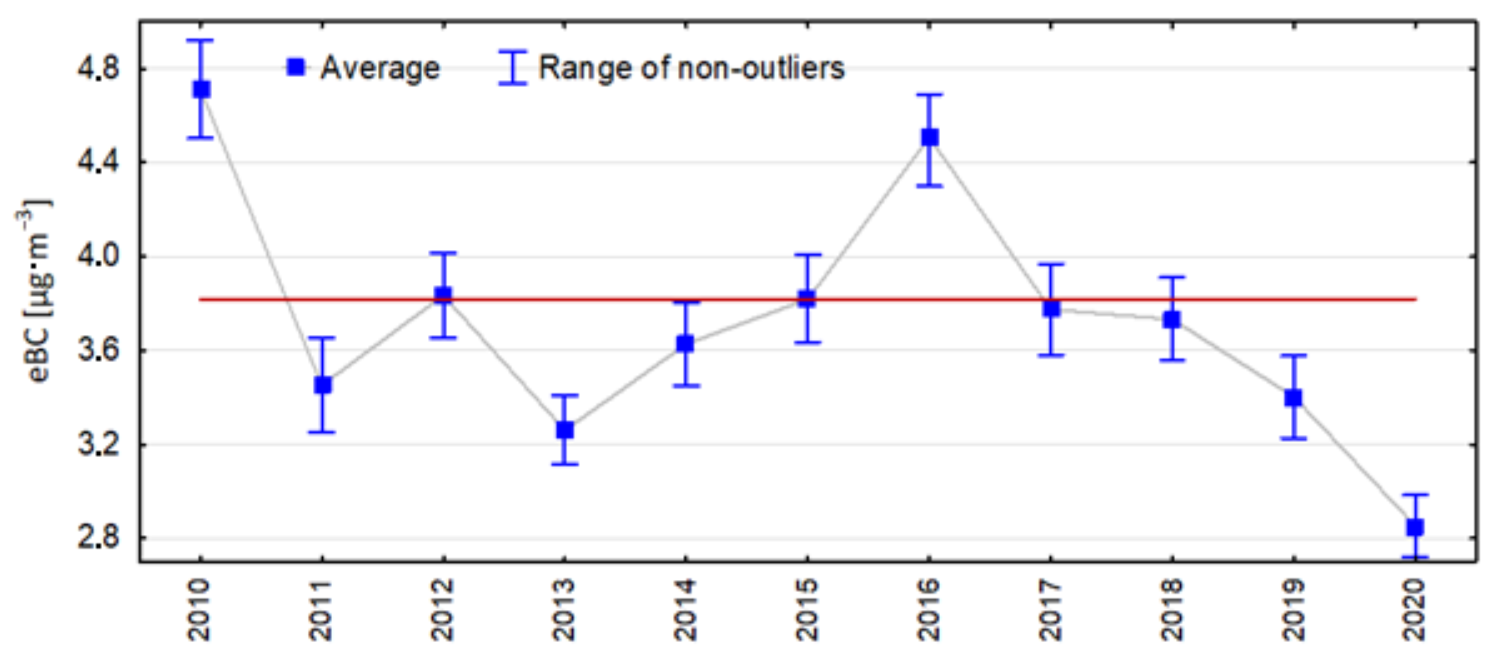
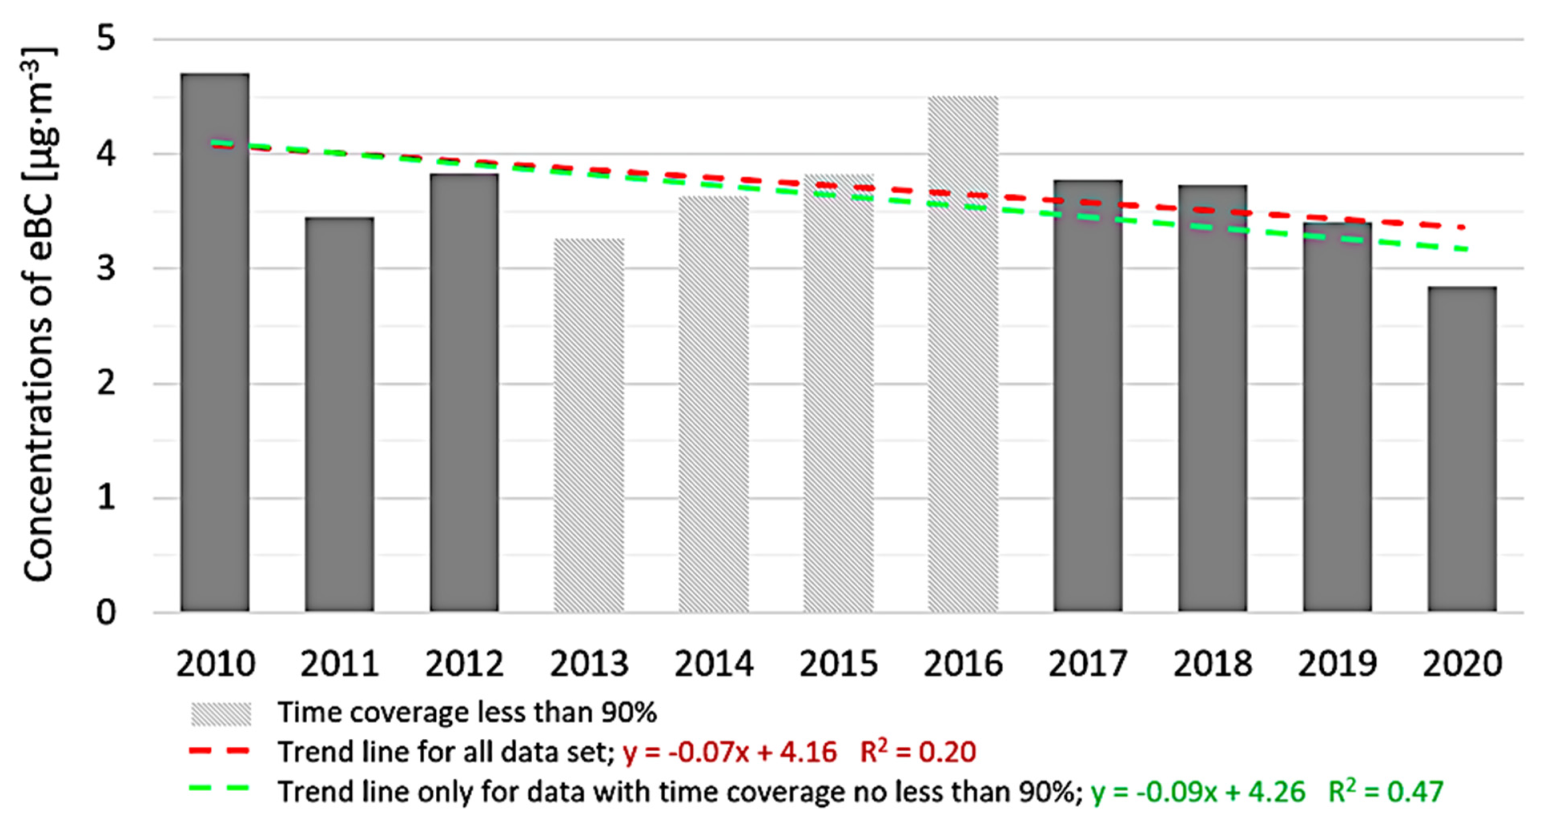
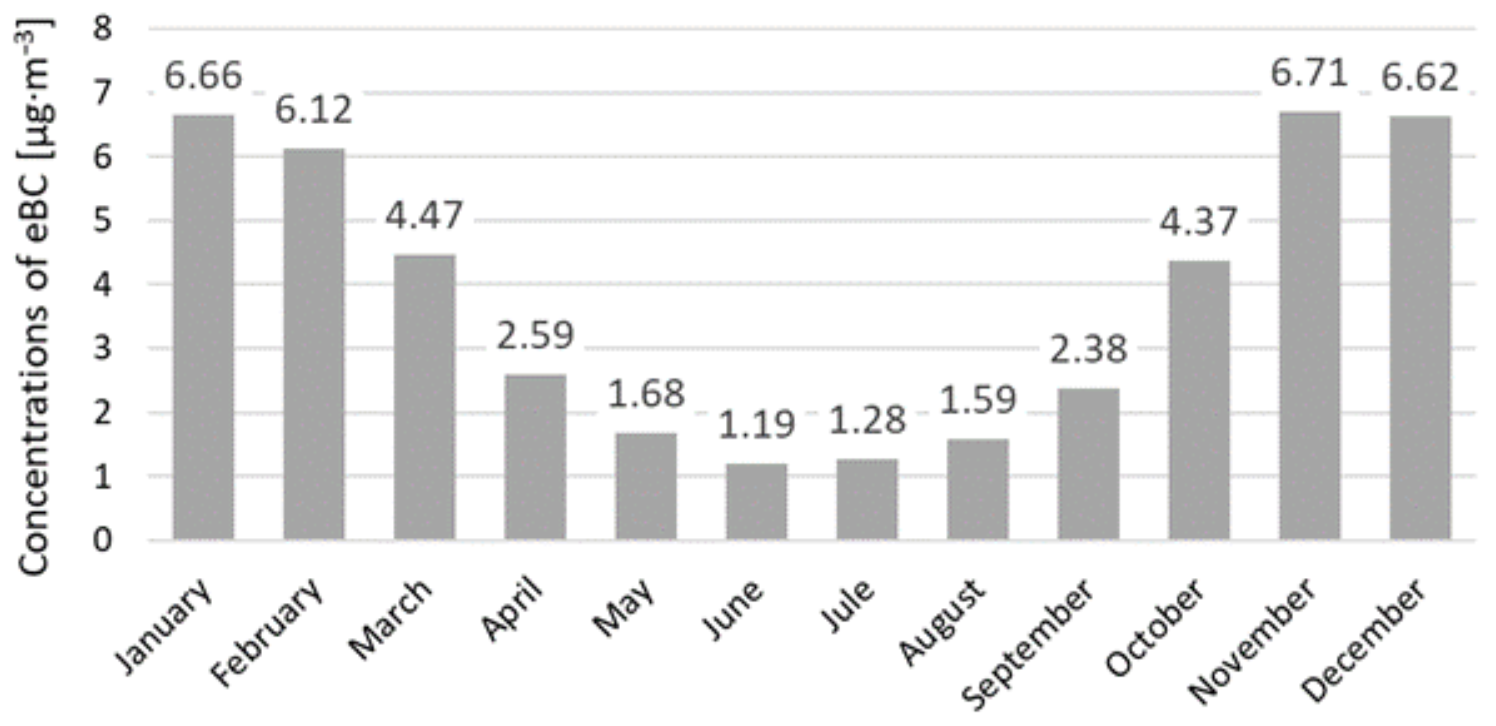
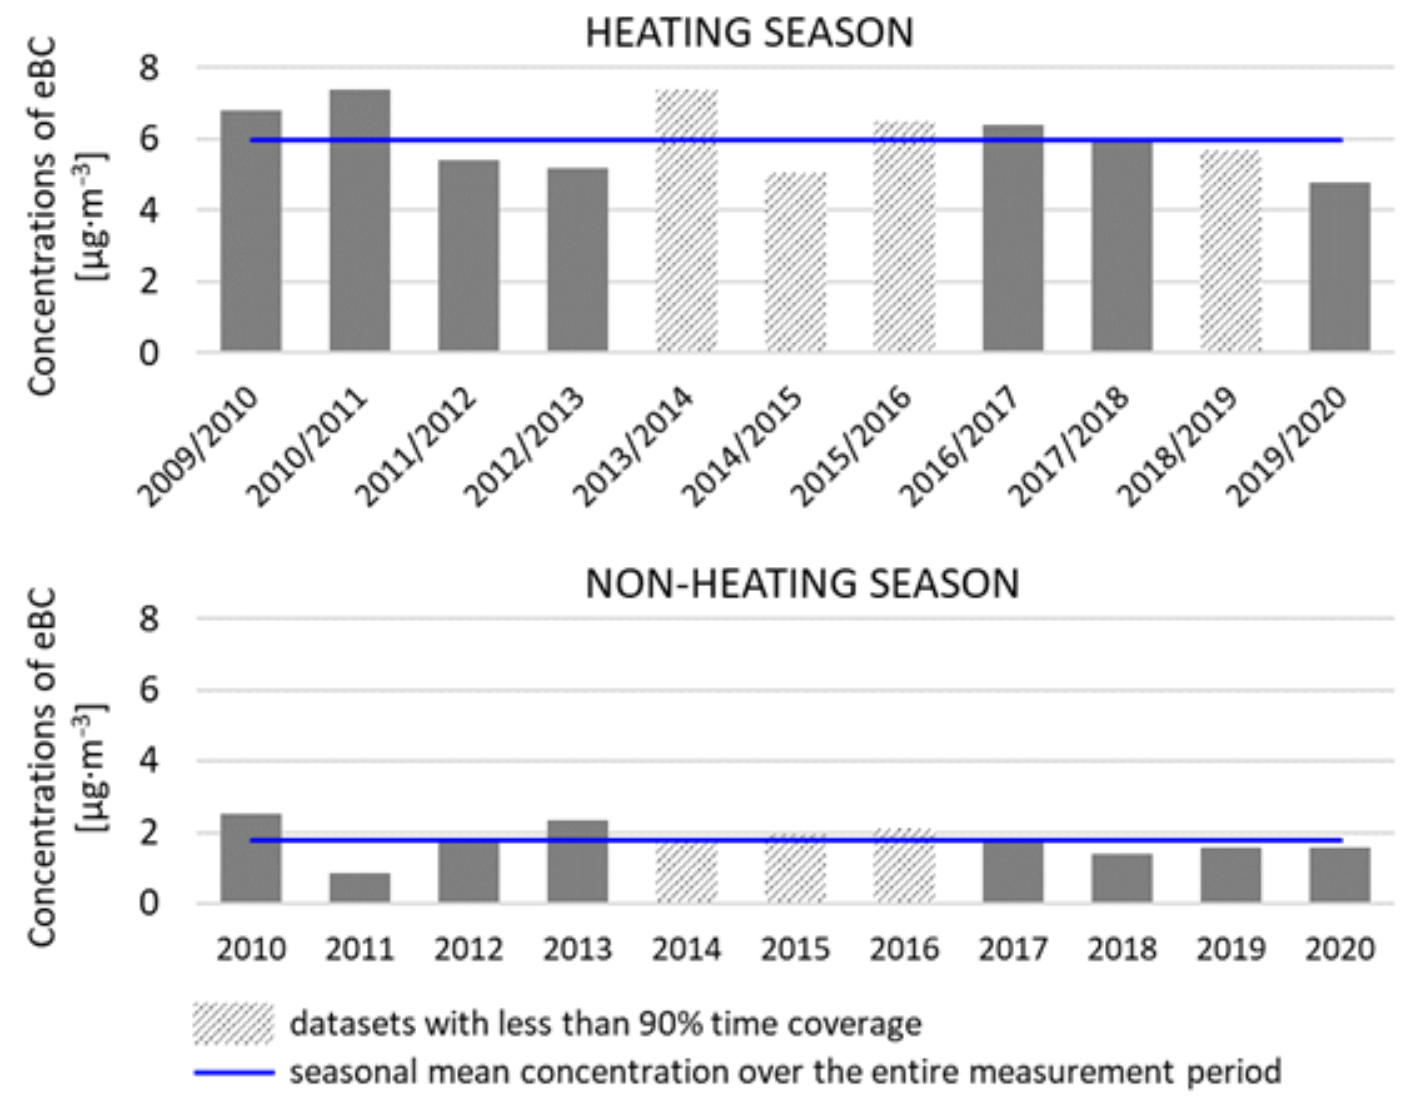
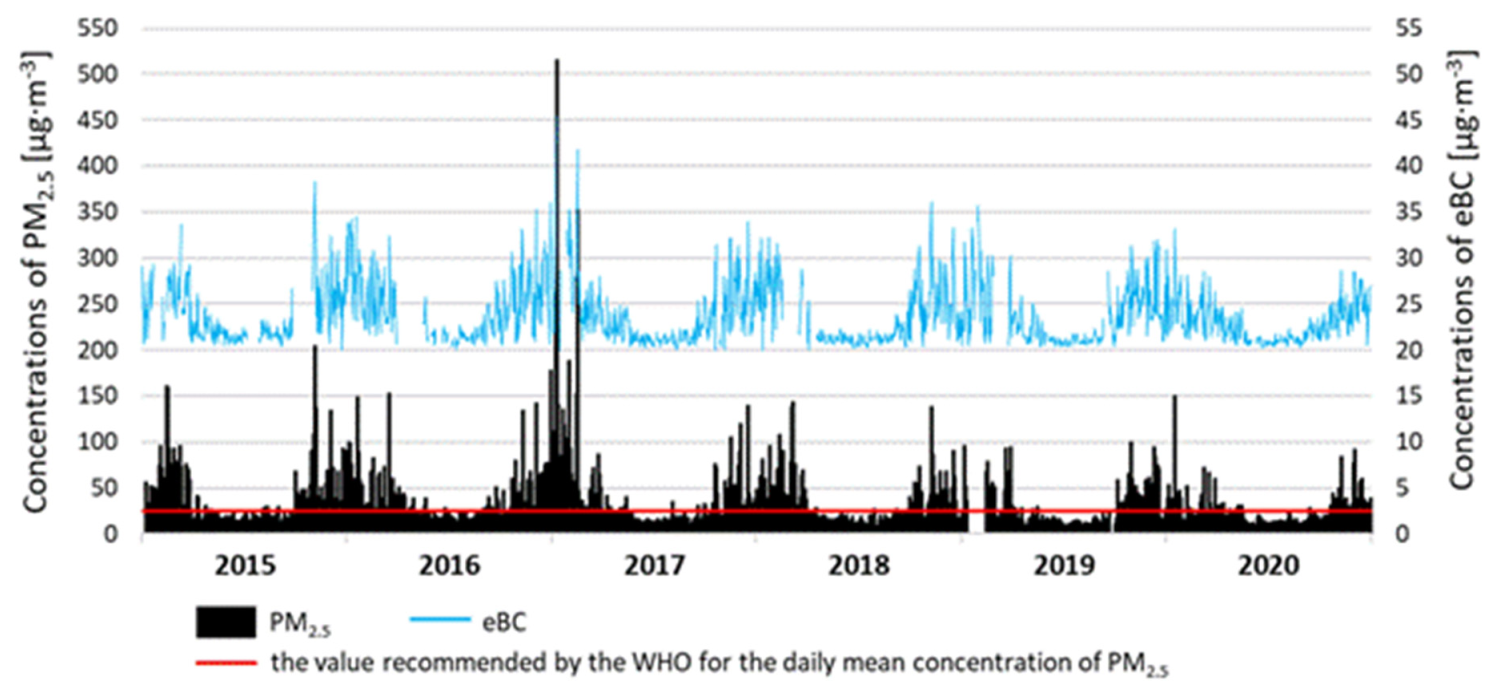
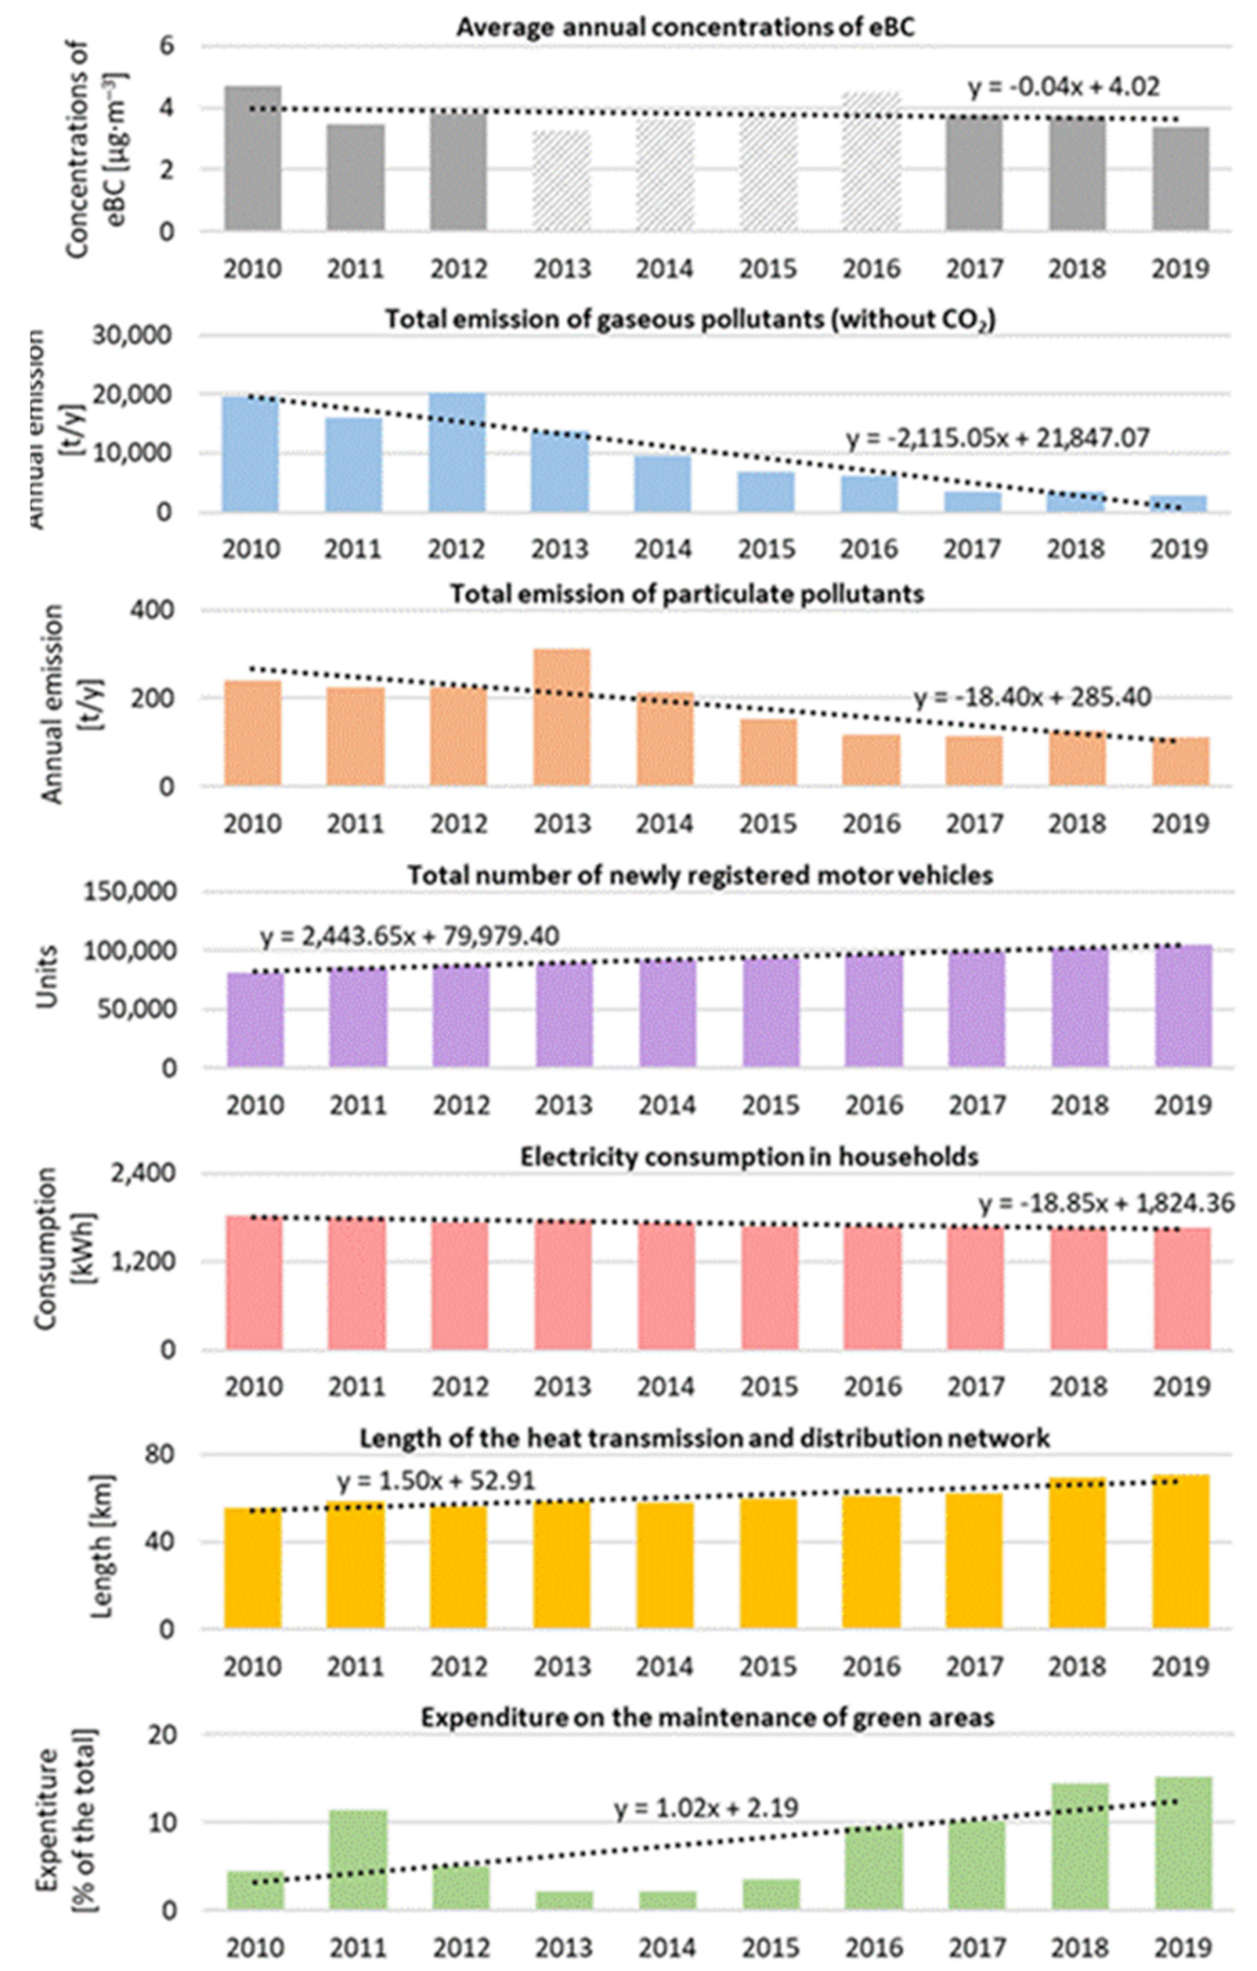
Table 1.
Descriptive statistics of the series of measurements of eBC concentrations (µg·m−3) over the entire measurement period and in individual years.
Table 1.
Descriptive statistics of the series of measurements of eBC concentrations (µg·m−3) over the entire measurement period and in individual years.
| Period | Time Coverage (%) | Ave | SD | Median | Min | Max | Variance | Coefficient of Change (%) |
|---|---|---|---|---|---|---|---|---|
| All period | 90 | 3.82 | 4.23 | 2.05 | 0.00 | 49.19 | 17.89 | 110.78 |
| 2010 | 99 | 4.71 | 4.89 | 2.75 | 0.00 | 37.86 | 23.87 | 103.66 |
| 2011 | 99 | 3.45 | 4.78 | 1.10 | 0.00 | 36.70 | 22.87 | 138.52 |
| 2012 | 100 | 3.83 | 4.25 | 1.99 | 0.00 | 31.50 | 18.04 | 110.75 |
| 2013 | 83 | 3.26 | 3.18 | 2.09 | 0.00 | 26.25 | 10.10 | 97.45 |
| 2014 | 78 | 3.63 | 3.69 | 2.11 | 0.00 | 26.75 | 13.61 | 101.72 |
| 2015 | 79 | 3.82 | 3.93 | 2.25 | 0.10 | 33.72 | 15.47 | 103.00 |
| 2016 | 82 | 4.51 | 4.42 | 2.76 | 0.09 | 28.74 | 19.52 | 98.05 |
| 2017 | 94 | 3.77 | 4.48 | 1.93 | 0.06 | 49.19 | 20.04 | 118.61 |
| 2018 | 93 | 3.73 | 4.02 | 1.96 | 0.00 | 27.32 | 16.18 | 107.77 |
| 2019 | 90 | 3.40 | 3.95 | 1.65 | 0.04 | 28.16 | 15.60 | 116.09 |
| 2020 | 98 | 2.85 | 3.10 | 1.68 | 0.04 | 31.81 | 9.62 | 108.75 |
Italics indicate that the time coverage requirement has not been met for the given years (min 90%).
Table 2.
Descriptive statistics of the series of eBC concentration divided into non-heating and heating seasons.
Table 2.
Descriptive statistics of the series of eBC concentration divided into non-heating and heating seasons.
| Period | Time Coverage (%) | Ave | SD | Median | Min | Max | Variance | Coefficient of Change (%) |
|---|---|---|---|---|---|---|---|---|
| 2009/2010 (H) | 93 | 6.78 | 5.09 | 5.90 | 0.04 | 33.40 | 25.95 | 75.08 |
| 2010 (NH) | 100 | 2.51 | 2.74 | 1.53 | 0.00 | 18.34 | 7.51 | 109.18 |
| 2010/2011 (H) | 99 | 7.37 | 5.58 | 6.47 | 0.17 | 37.86 | 31.15 | 75.74 |
| 2011 (NH) | 100 | 0.86 | 1.13 | 0.52 | 0.01 | 11.12 | 1.29 | 132.19 |
| 2011/2012 (H) | 98 | 5.40 | 5.44 | 3.74 | 0.00 | 36.70 | 29.55 | 100.64 |
| 2012 (NH) | 100 | 1.82 | 1.97 | 1.14 | 0.00 | 15.37 | 3.88 | 107.95 |
| 2012/2013 (H) | 100 | 5.20 | 4.41 | 3.71 | 0.03 | 29.56 | 19.41 | 84.68 |
| 2013 (NH) | 96 | 2.32 | 2.29 | 1.50 | 0.07 | 15.83 | 5.24 | 98.77 |
| 2013/2014 (H) | 51 | 7.40 | 4.42 | 7.34 | 0.00 | 26.75 | 19.55 | 59.76 |
| 2014 (NH) | 88 | 1.84 | 1.71 | 1.31 | 0.03 | 12.56 | 2.91 | 92.81 |
| 2014/2015 (H) | 74 | 5.05 | 3.74 | 4.15 | 0.00 | 21.05 | 14.02 | 74.13 |
| 2015 (NH) | 86 | 1.92 | 1.89 | 1.31 | 0.10 | 18.42 | 3.56 | 98.28 |
| 2015/2016 (H) | 81 | 6.47 | 4.95 | 5.48 | 0.10 | 33.72 | 24.55 | 76.63 |
| 2016 (NH) | 66 | 2.11 | 2.21 | 1.29 | 0.14 | 16.21 | 4.90 | 105.14 |
| 2016/2017 (H) | 93 | 6.42 | 5.46 | 5.15 | 0.09 | 49.19 | 29.80 | 85.04 |
| 2017 (NH) | 98 | 1.70 | 1.82 | 1.06 | 0.06 | 12.52 | 3.30 | 106.95 |
| 2017/2018 (H) | 90 | 5.88 | 4.33 | 4.99 | 0.00 | 26.45 | 18.77 | 73.66 |
| 2018 (NH) | 93 | 1.41 | 1.48 | 0.98 | 0.04 | 19.19 | 2.19 | 104.91 |
| 2018/2019 (H) | 81 | 5.70 | 4.79 | 4.40 | 0.08 | 28.16 | 22.93 | 84.02 |
| 2019 (NH) | 96 | 1.57 | 1.78 | 0.97 | 0.04 | 15.51 | 3.18 | 113.45 |
| 2019/2020 (H) | 99 | 4.77 | 4.06 | 3.50 | 0.06 | 31.81 | 16.52 | 85.23 |
| 2020 (NH) | 97 | 1.55 | 1.76 | 0.92 | 0.04 | 11.98 | 3.08 | 112.96 |
H—heating season; NH—non-heating season; Italics indicate that the time coverage requirement has not been met for the given seasons (min 90%).
Table 3.
The results of the Spearman correlation analysis between concentrations of eBC and selected meteorological parameters in 2015–2020.
Table 3.
The results of the Spearman correlation analysis between concentrations of eBC and selected meteorological parameters in 2015–2020.
| Parameter | Correlation Coefficient (r) | ||
|---|---|---|---|
| All Periods | Non-Heating Season | Heating Season | |
| Temperature | −0.63 | −0.49 | −0.27 |
| Relative humidity | 0.28 | 0.25 | −0.03 |
| Pressure | 0.13 | 0.13 | 0.10 |
| Wind speed | 0.00 | −0.09 | −0.62 |
| Precipitation | −0.16 | −0.18 | −0.20 |
Italic type indicates that the correlation is statistically significant (α = 0.05).
Table 4.
The results of the Spearman correlation analysis (α = 0.05) between concentrations of eBC and concentrations of gaseous and particulate pollutants in 2015–2020.
Table 4.
The results of the Spearman correlation analysis (α = 0.05) between concentrations of eBC and concentrations of gaseous and particulate pollutants in 2015–2020.
| Specification | PM10 | PM2.5 | SO2 | NO | NO2 | NOx | O3 | CO |
|---|---|---|---|---|---|---|---|---|
| All periods | 0.84 | 0.89 | 0.82 | 0.79 | 0.80 | 0.84 | −0.69 | 0.87 |
| Non-heating period | 0.90 | 0.89 | 0.84 | 0.79 | 0.82 | 0.86 | −0.55 | 0.86 |
| Heating period | 0.78 | 0.85 | 0.73 | 0.76 | 0.79 | 0.83 | −0.54 | 0.83 |
Italic type indicates that the correlation is statistically significant (α = 0.05).
Table 5.
The results of the Spearman correlation analysis (α = 0.05) between concentrations of eBC and CSO statistical parameters for the city of Zabrze.
Table 5.
The results of the Spearman correlation analysis (α = 0.05) between concentrations of eBC and CSO statistical parameters for the city of Zabrze.
| Specification | Correlation with BC | |
|---|---|---|
| Emission of gaseous pollutants (t/y) | total (without CO2) | 0.77 |
| SO2 | 0.83 | |
| Methane | 0.77 | |
| Emission of particulate pollutants (t/y) | Total | 0.60 |
| on 1 km2 of the area | 0.60 | |
| from fuel combustion | 0.77 | |
| Apartments equipped with central heating installations (% of total) | −0.66 | |
| Gas-heated households (units) | −0.66 | |
| Electricity consumption in households (kWh) | 0.54 | |
| Length of the heat transmission and distribution network (km) | −0.83 | |
| Total number of newly registered motor vehicles | −0.66 | |
| Expenditure on the maintenance of green areas (% of the total) | −0.94 | |
Italic type indicates that the correlation is statistically significant (α = 0.05).
Publisher’s Note: MDPI stays neutral with regard to jurisdictional claims in published maps and institutional affiliations. |
© 2021 by the authors. Licensee MDPI, Basel, Switzerland. This article is an open access article distributed under the terms and conditions of the Creative Commons Attribution (CC BY) license (https://creativecommons.org/licenses/by/4.0/).
Share and Cite
MDPI and ACS Style
Zioła, N.; Błaszczak, B.; Klejnowski, K. Long-Term eBC Measurements with the Use of MAAP in the Polluted Urban Atmosphere (Poland). Atmosphere 2021, 12, 808. https://0-doi-org.brum.beds.ac.uk/10.3390/atmos12070808
AMA Style
Zioła N, Błaszczak B, Klejnowski K. Long-Term eBC Measurements with the Use of MAAP in the Polluted Urban Atmosphere (Poland). Atmosphere. 2021; 12(7):808. https://0-doi-org.brum.beds.ac.uk/10.3390/atmos12070808
Chicago/Turabian StyleZioła, Natalia, Barbara Błaszczak, and Krzysztof Klejnowski. 2021. "Long-Term eBC Measurements with the Use of MAAP in the Polluted Urban Atmosphere (Poland)" Atmosphere 12, no. 7: 808. https://0-doi-org.brum.beds.ac.uk/10.3390/atmos12070808
Note that from the first issue of 2016, this journal uses article numbers instead of page numbers. See further details here.