
Cut-Off Lows and Extreme Precipitation in Eastern Spain: Current and Future Climate


Department of Geography, Planning and Environment, East Carolina University, Greenville, NC 27858, USA
Atmosphere 2021, 12(7), 835; https://0-doi-org.brum.beds.ac.uk/10.3390/atmos12070835
Submission received: 1 June 2021
/
Revised: 24 June 2021
/
Accepted: 27 June 2021
/
Published: 28 June 2021
(This article belongs to the Special Issue Extreme Weather and Climate Events: Global and Regional Aspects)
Abstract
:This study presents a seasonal synoptic climatology of cut-off lows (COLs) that produced extreme precipitation in the Valencia region of Spain during 1998–2018 and uses simulations with the Weather Research and Forecasting (WRF) model to study how extreme COL precipitation may change in a future warmer climate. COLs were shown to be the main producer of extreme precipitation in the Valencia region, especially during the transition seasons. The strongest raining COL events occurred during September–November. Six-day composites of thermodynamic and dynamic fields and precipitation show that COLs that produce extreme precipitation in this region remain stationary over Spain for 2–3 days and tend to produce precipitation over the Valencia region for at least two consecutive days. In the low levels these COLs are characterized by low pressure over the Mediterranean sea and winds with an easterly, onshore component thus fueling precipitation. Comparison of current and future climate ensembles of WRF simulations of 14 September–November extreme precipitation producing COL events suggest that in a warmer climate extreme COL precipitation may increase by as much as 88% in northeastern Spain and 61% in the adjoining Mediterranean Sea. These projected increases in extreme COL precipitation in the northeast of Spain present additional challenges to a region where COL flooding already has significant socio-economic impacts. Additionally, about half of the future climate COL event simulations showed increases in precipitation in the Valencian region of eastern Spain. These results provide important nuance to projections of a decreasing trend of total precipitation in the Iberian Peninsula as the climate warms.
1. Introduction
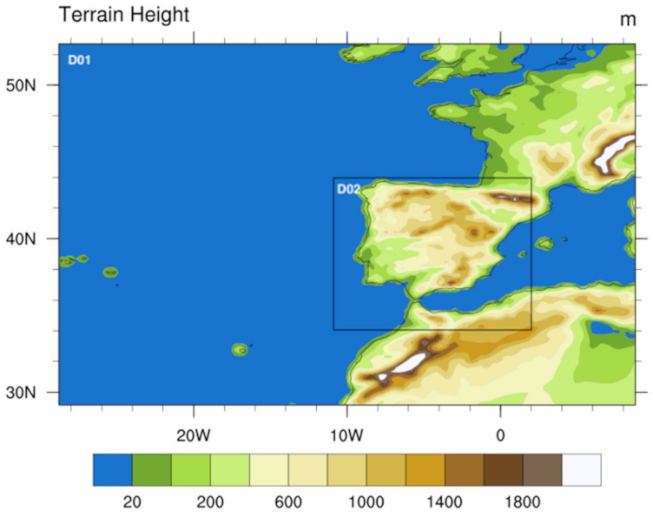
In the Iberian Peninsula (IP) complex orography (Figure 1) and the influences of Atlantic and Mediterranean climates contribute to a strong NW–SE precipitation gradient between the wet northwestern Cantabric coast and the dry Levante region along the Mediterranean Sea in the southeast [1,2,3]. The northwest Cantabric region receives 900–2500 mm of precipitation per year, mostly due to the regular passage of frontal systems. Conversely, precipitation in the Levante region is more episodic and extreme with a few precipitation events causing a large portion of the total annual precipitation of less than 700 mm year−1 [2]. A common scenario for the occurrence of precipitation extremes along the Levante region is the presence of an upper-tropospheric cut-off low (COL, or DANA, in its Spanish acronym), a phenomenon that is also locally known as ‘gota fría’ (or ‘cold drop’ [4]), referring to the presence of cold air within the cut-off low. At the surface, cut-off lows produce winds with an easterly component that blow inland from the warm Mediterranean sea pushing warm humid air upward along the intricate topography of eastern Spain [5]. Such events can bring large precipitation totals to locations along the coast producing flashflooding (locally known as ‘riadas’). The Mediterranean coast of Spain, and in particular the Valencia and Catalonia Regions are the most vulnerable to flooding and flashflooding [6], and about one third of the most catastrophic floods in the region have been shown to be associated with cut-off lows (COLs) [7]. More recently in September of 2019 a COL event flooded densely populated cities in the Valencia and Murcia regions, killing 6 people and forcing thousands to evacuate, an example of the devastating effects of these weather systems on local communities.
A recent study [5] used 10 years of warm season ERA Reanalysis to study COLs in the Mediterranean region. They found that deep cut-off lows tend to produce the most intense and widespread rain episodes, particularly to the south of the cut-off low center. Moreover, they showed that shallow COLs produce weak convective precipitation near their center, or no precipitation at all. Another study [8] used 41 years of data to show that an average of 2.3 COLs affect the IP each year. They found that most COLs occur in the boreal spring and summer, with the fewest COLs occurring in the wintertime when the jetstream is located further south and Spain is in the cyclonically sheared side of the jet, thus inhibiting the occurrence of upper-level thinning troughs [9] and the formation of COLs. The location of the COL center determines the distribution of precipitation in the IP. For instance, COL systems located in the western half of the Iberian Peninsula and adjacent Atlantic Ocean bring rainfall to a large portion of Spain, including the Valencia Region. COLs that are located in the southwestern quadrant of the IP bring the largest precipitation amounts to the Valencia region (30–40 mm), whereas COLs located in the northwestern quadrant of the IP and adjacent Atlantic bring less precipitation (20–30 mm). About a third of COLs that affect the IP produce no rain while a third produce generalized rain over the entire IP [8]. COLs are also observed in other parts of the world [10] including North America [11], South America ([12,13]), Australia [14], South Africa [15] and Southern Europe and the Mediterranean [5].
Previous studies have suggested that by the end of this century climate change will cause a decrease of up to 40% in IP total precipitation [3,16,17,18,19]. These projected downward precipitation trends are particularly problematic for the eastern side of the IP, where precipitation is already scarce and population pressure is on the rise [20,21]. On the other hand, climate model projections have suggested that by the end of this century the thermodynamic forcing from climate warming will cause an intensification of extreme precipitation, especially in mid-to-high latitude land regions of the globe [22,23]. In the subtropics however, including southern Spain, the projections are more nuanced with some climate models suggesting that dynamic forcing from climate change may instead work to decrease extreme precipitation in the future [17,22]. Such a downward trend in extreme precipitation has been shown to be already under way in southern Portugal [19] and in the interior of the Júcar river basin in eastern Spain [24], for example. However, no decrease in total precipitation has been observed along the Mediterranean coast of Spain over the past three decades [21,24]. Rather, the most marked change in precipitation along the Mediterranean coast of Spain has been an increase in the number and intensity of high precipitating events such as COLs [21], and an increase in the length and number of dry spells [21]. It is also expected that the observed ongoing increase of the sea surface temperatures (SSTs) in the Mediterranean [25] will tend to enhance extreme precipitation along the coast of Spain [21].
The question of how precipitation from COLs will change as the climate warms poses a significant challenge for the Mediterranean coast of Spain, an already water-stressed and heavily touristic region. In this study the Weather Research and Forecasting (WRF) model and the pseudo-global warming (PGW) downscaling approach are used to investigate how extreme precipitation associated with COLs might change under projected temperature increases from the most recent Intergovernmental Panel on Climate Change (IPCC) Coupled Model Intercomparison Project (CMIP6). Previous studies have demonstrated the use of WRF to study precipitation extremes and variability as well as the effects of climate change in the IP [3,26,27,28]. In particular, [3] used WRF to downscale future climate simulations finding that a large portion of the IP will experience a 20–40% decrease in precipitation by the end of this century, and that the intensity of precipitation will increase. In the present study the PGW downscaling approach is used to replicate the present-climate synoptic scale circulation of a given weather event within the warmer atmosphere of the future climate simulation. This means that under PGW the behavior of an individual present climate COL event can be directly compared to the same COL event if it were to occur in a future warmer climate. The PGW approach has been used to study the effects of climate change in regional climate [29,30,31], tropical cyclones [32,33], precipitation extremes [34,35], tornadic storms [36], dust emissions over Asia [37], urban heat island [37], and snowfall [38]. As the climate warms both atmospheric dynamics via moisture convergence and vertical motion, and changes in thermodynamics via increased temperature and saturation specific humidity are expected to affect precipitation [39]. While the PGW approach does not incorporate dynamical modifications such as possible changes in the structure or frequency of occurrence of COLs due to changes in the jet stream dynamics, it can help uncover possible changes in the precipitation amounts from COLs that are due to the expected warming of the atmosphere under climate change.
The objectives of this study are: (1) to create a seasonal synoptic climatology of COLs that produce extreme precipitation in the Mediterranean coast of Spain; and (2) to study how extreme precipitation from COLs may change in a future warmer climate. Section 2 presents the datasets and methodology. The COL climatology and WRF simulations are shown in Section 3. Finally Section 4 and Section 5 present a discussion of results and conclusions.
2. Datasets and Methodology
2.1. Synoptic Climatology of Cut-Off Lows (COLs)
The datasets used in this study are the high-resolution NASA TMPA (National Aeronautics and Space Administration’s Tropical Rainfall Measuring Mission’s Multi-Satellite Precipitation Analysis) precipitation and the NCEP (National Center for Environmental Prediction) reanalysis from 1998–2018. The TMPA-3B42 daily precipitation dataset provides homogeneous spatial and temporal precipitation coverage from 50° N to 50° S at 0.25° resolution (downloaded from https://disc2.gesdisc.eosdis.nasa.gov/data/TRMM_L3/TRMM_3B42_Daily.7/, accessed on 28 June 2021) [40]. The NCEP Reanalysis dataset is a global, daily 2.5° horizontal resolution blend of observations and model data. In this study the NCEP Reanalysis sea-level pressure, winds and geopotential anomalies, and the TMPA daily precipitation are used to construct composites of the lifecycle of COLs that produced extreme precipitation amounts over Valencia, Spain, similar to [41,42]. The Valencia region (38–40° N, 1° W–1° E, hereafter the Valencia Box) was selected as the basis region for this study because of its central location along the Mediterranean coast and because it has historically endured some of the heaviest flooding from COLs in Spain.
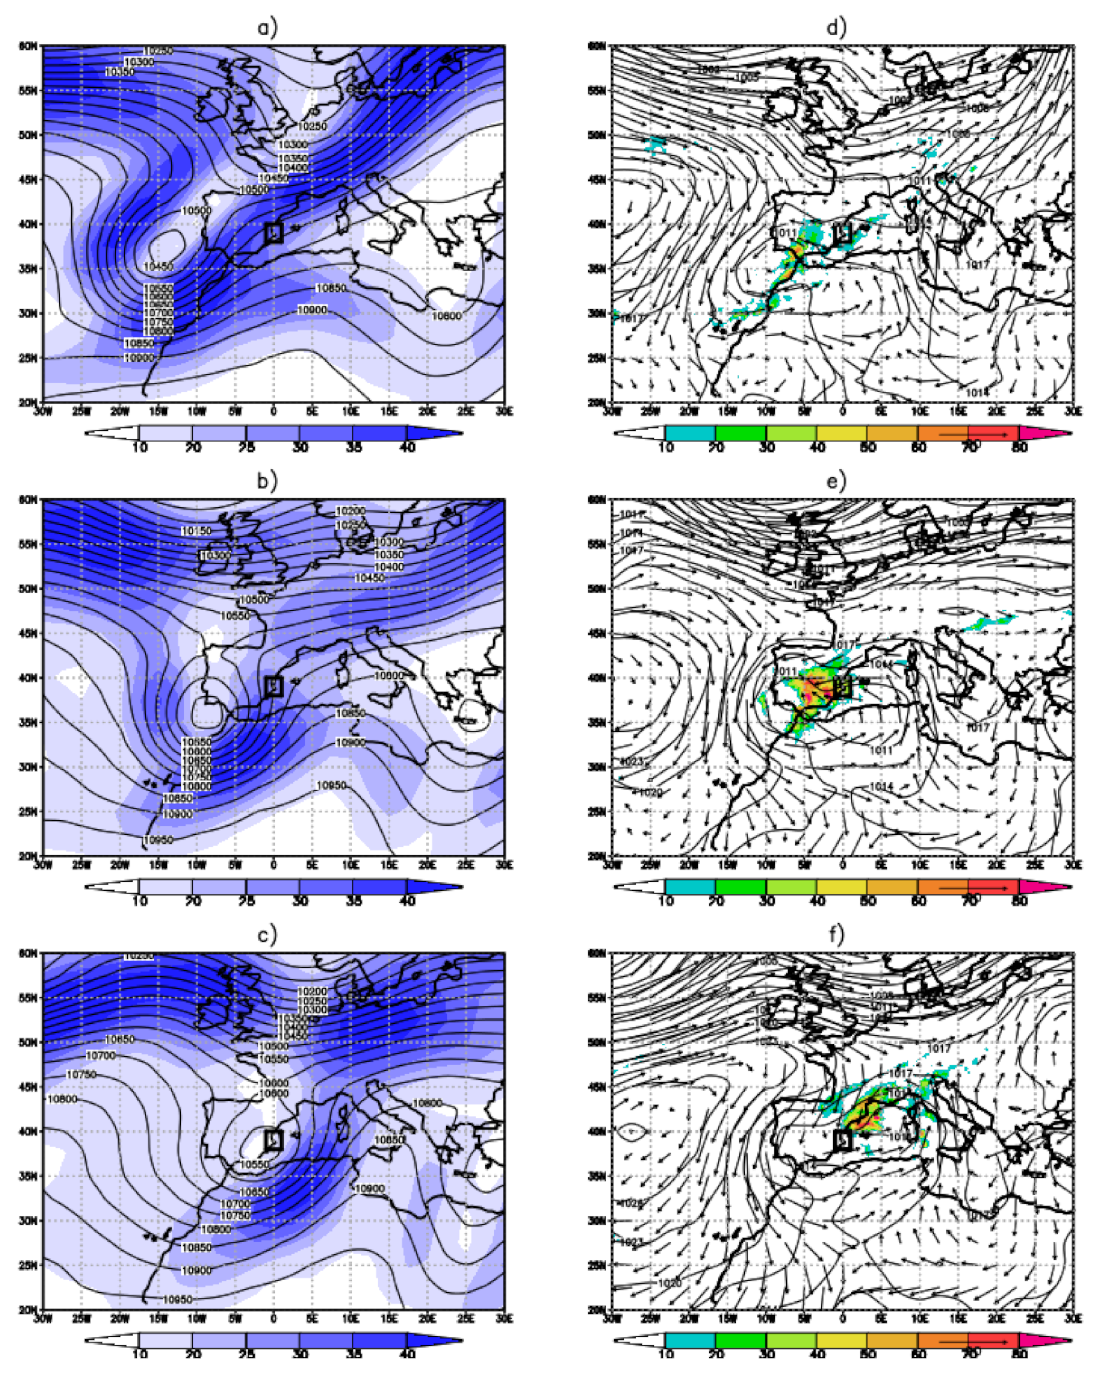
Daily TMPA rainfall values from 1998–2018 were averaged for the Valencia Box. For the purposes of this study an extreme event was defined as an event that produced more than 20 mm of precipitation in one day, a threshold that represents the top 1% of the distribution. For the days when the TMPA detected an extreme precipitation event, the daily NCEP Reanalysis upper-level winds and geopotential were used to subjectively determine if a COL was present. An example of a typical COL system evolution is presented in Figure 2 which shows the synoptic scale environment that lead to an extreme rain episode in the Valencia Box on 28 September 2012. A thinning trough that was travelling eastward over the northeast Atlantic on 26 September left behind an upper-level COL system over the Atlantic about 500 km to the west of the IP on 27 September (Figure 2a). On that day precipitation occurred in southern Spain and Morocco, coinciding with the eastern side of the COL (Figure 2d). As the COL continued to drift eastward on 28 September (Figure 2b) its associated surface low pressure center produced onshore winds along the Mediterranean coast of Spain, as well as a large area of extreme precipitation in the southeast quadrant of Spain (Figure 2e). Extreme precipitation was favored on the eastern side of the COL where ascent produced by the COL’s upper-level cyclonic vorticity advection was combined with low-level easterly winds (Figure 2e) that brought a plentiful supply of warm humid air from the Mediterranean. On 29 September the COL weakened (indicated by the shrinking of its core at 250 hPa, Figure 2c) as it propagated northeastward along the Mediterranean coast of Spain while bringing rain to the northeastern coast of Spain (Figure 2f). On 1 October (not shown) the COL became reabsorbed into the midlatitude flow over France/Switzerland. As in the event shown in Figure 2, all COL events included in the composites presented in this study had a closed cold low at 200 and 500 hPa on the day of extreme rainfall. Extreme rain events that were caused by frontal systems that propagated across the IP were not included in the composite analysis below. Moreover, COL events that produced extreme rain on multiple consecutive days were not double-counted.
Daily TMPA rainfall and NCEP Reanalysis were used to calculate six-day composites of precipitation, sea-level pressure (SLP), 925 hPa humidity and moisture flux convergence, as well as 200 hPa winds and geopotential for the COL events that produced extreme precipitation in the Valencia Box during March–May (MAM), September–November (SON), and December–February (DJF). The composites were calculated for the day of the extreme rainfall in the Valencia Box (day 0) and for the nth day prior to (day − n) and following (day + n) the occurrence of extreme rainfall in the Valencia Box.
2.2. Current and Future Climate Weather Research and Forecasting (WRF) Simulations of COLs
Current and future climate WRF simulations were produced for a sample of 14 boreal fall season COL events that produced extreme precipitation in the Valencia Box (Table 1). Each simulation included a 24 h spin-up period that was not included in the analysis, similarly to [31].
The simulations presented herein use the Advanced Research WRF (WRF-ARW) version 3.5.1 [43] with a 27 km parent domain (hereafter referred to by D01, see Figure 1) and one smaller 9 km nested domain over Spain (D02, Figure 1), and 27 vertical levels. Initial and boundary conditions for WRF are provided by the Global Forecast System (GFS) analysis, a global 1° resolution dataset available four times daily from 2 March 2004 to the most recent full month. Boundary conditions for the 27 km domain are provided by the GFS model. Boundary conditions for the 9 km nested domain are provided by the parent domain using one-way nesting. Since SSTs do not change significantly throughout the duration of the three-day simulations, WRF is run with static SSTs set at the initialization time. The choices of WRF model physics packages largely follow [31,35] for the southeast United States. This includes the Kain–Fritsch cumulus parameterization scheme [44], the WRF Single Moment microphysics [45], and the Yonsei boundary layer scheme [46]. Surface physics is handled by the Noah land-surface model [47] and radiation by the rapid radiative transfer method for general circulation models [48]. WRF output was created every 3 h for the 9 km domain.
The future climate WRF simulations were created using the PGW approach [31,35], a dynamic downscaling approach that preserves present-day synoptic weather patterns in the future climate simulations, allowing a direct comparison of a weather event in the present climate and future climate. In this study, the PGW approach provides a way to investigate how an individual present-day COL event would evolve if it occurred in a future warmer climate. Future climate conditions are simulated by adjusting the present-day GFS analysis initial and boundary condition temperature fields using multi-model mean surface and three-dimensional temperature anomalies from the IPCC CMIP6. In particular this study uses projected temperature anomalies the highest future emissions scenario in the Shared Socioeconomic Pathways Scenario (known as the SSP5-8.5), which represent the upper bound for current projections of future climate warming. The anomalies added to the GFS analysis consist of air and surface temperature anomalies for the 2090s averaged for four CMIP6 models that were shown to capture well the climatological patterns of land surface temperature in Europe [49]. These models are the CNRM-CM6-1 (France’s National Center of Meteorological Research), MRI-ESM2-0 (Japan’s Meteorological Institute), GFDL-ESM4 (Princeton’s Geophysical Fluid Dynamics Laboratory) and MPI-ESM-2-HR (Germany’s Max Planck Institute) earth system models. Multi-model temperature anomalies were created by subtracting the monthly mean temperature in each model’s historical run for 1990–2000 from the same model’s SSP5-8.5 monthly means for the 2090–2100 and then averaging the anomalies for the four models together. This was done for surface temperature and three-dimensional air temperature over the two WRF domains. Over land, SSP5-8.5 surface temperature anomalies in SSP5-8.5 reached 4–5 °C whereas over the ocean, because water has higher specific heat, surface temperature anomalies were comparatively more modest, at 3–4 °C in the Mediterranean and 1–2 °C in the Atlantic. Once the temperature anomalies were added to the GFS initial conditions the data were fed directly into the WRF pre-processing package where geopotential heights and moisture variables were adjusted accordingly. This methodology makes the common assumption that relative humidity in the future warmer remains unchanged from the present climate [50].
3. Results
3.1. Synoptic Climatology of COLs
The Valencia Box received a total of 10,370 mm of precipitation between 1998–2018, or about 494 ± 102 mm year−1. Extreme precipitation events contributed 2992 mm of precipitation, or about 29% of the total precipitation between 1998–2018. As shown in Table 2, a total of 90 extreme events, or about 4.1 ± 2.1 extreme events per year, occurred in the Valencia Box during the study period. Moreover, the majority of the extreme rain days occurred in the transition seasons (47% in SON and 28% in MAM) and only one extreme precipitation event occurred during the summer (Table 2).
During 1998–2018 COLs accounted for most of the extreme rainfall days in the Valencia Box (Table 2), and produced a total of 2416 mm of rain (Table 3). This means that during the study period COLs produced most (81%) of the total extreme rainfall, and about 23% of the total rainfall in the Valencia Box.
On average each heavy raining COL events brought 42 ± 31 mm day−1 of precipitation to the Valencia region. A single event in October 2000 brought 167 mm of rain over a two day period, which was about one-third of the typical total annual precipitation in the region. Eleven of the COL events produced extreme precipitation on 2–3 consecutive days.
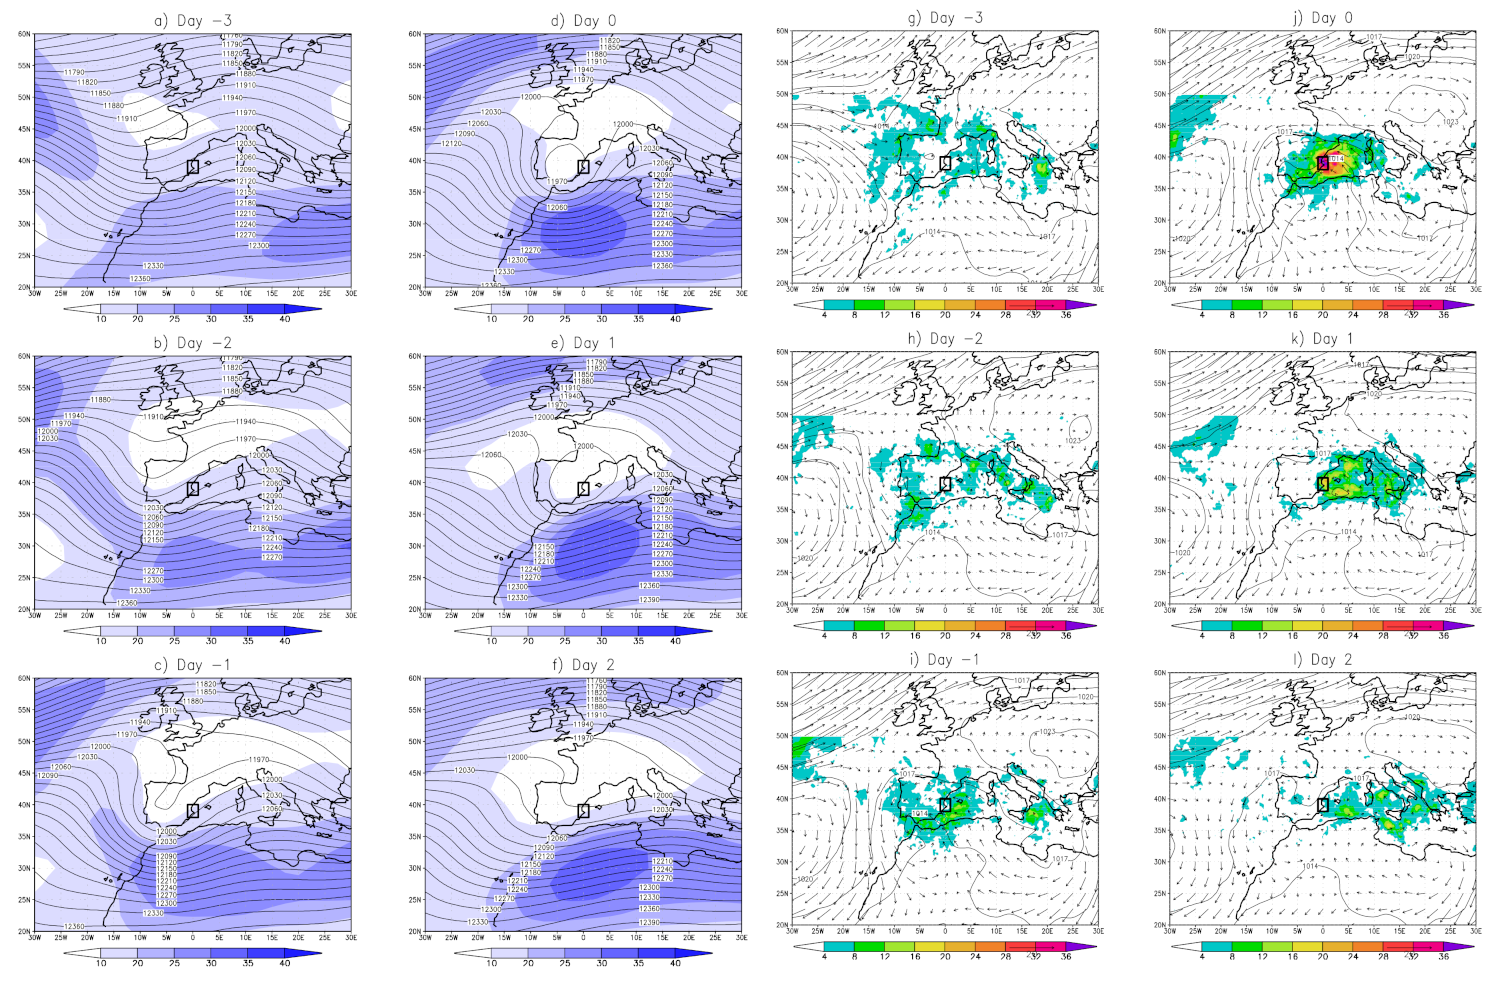
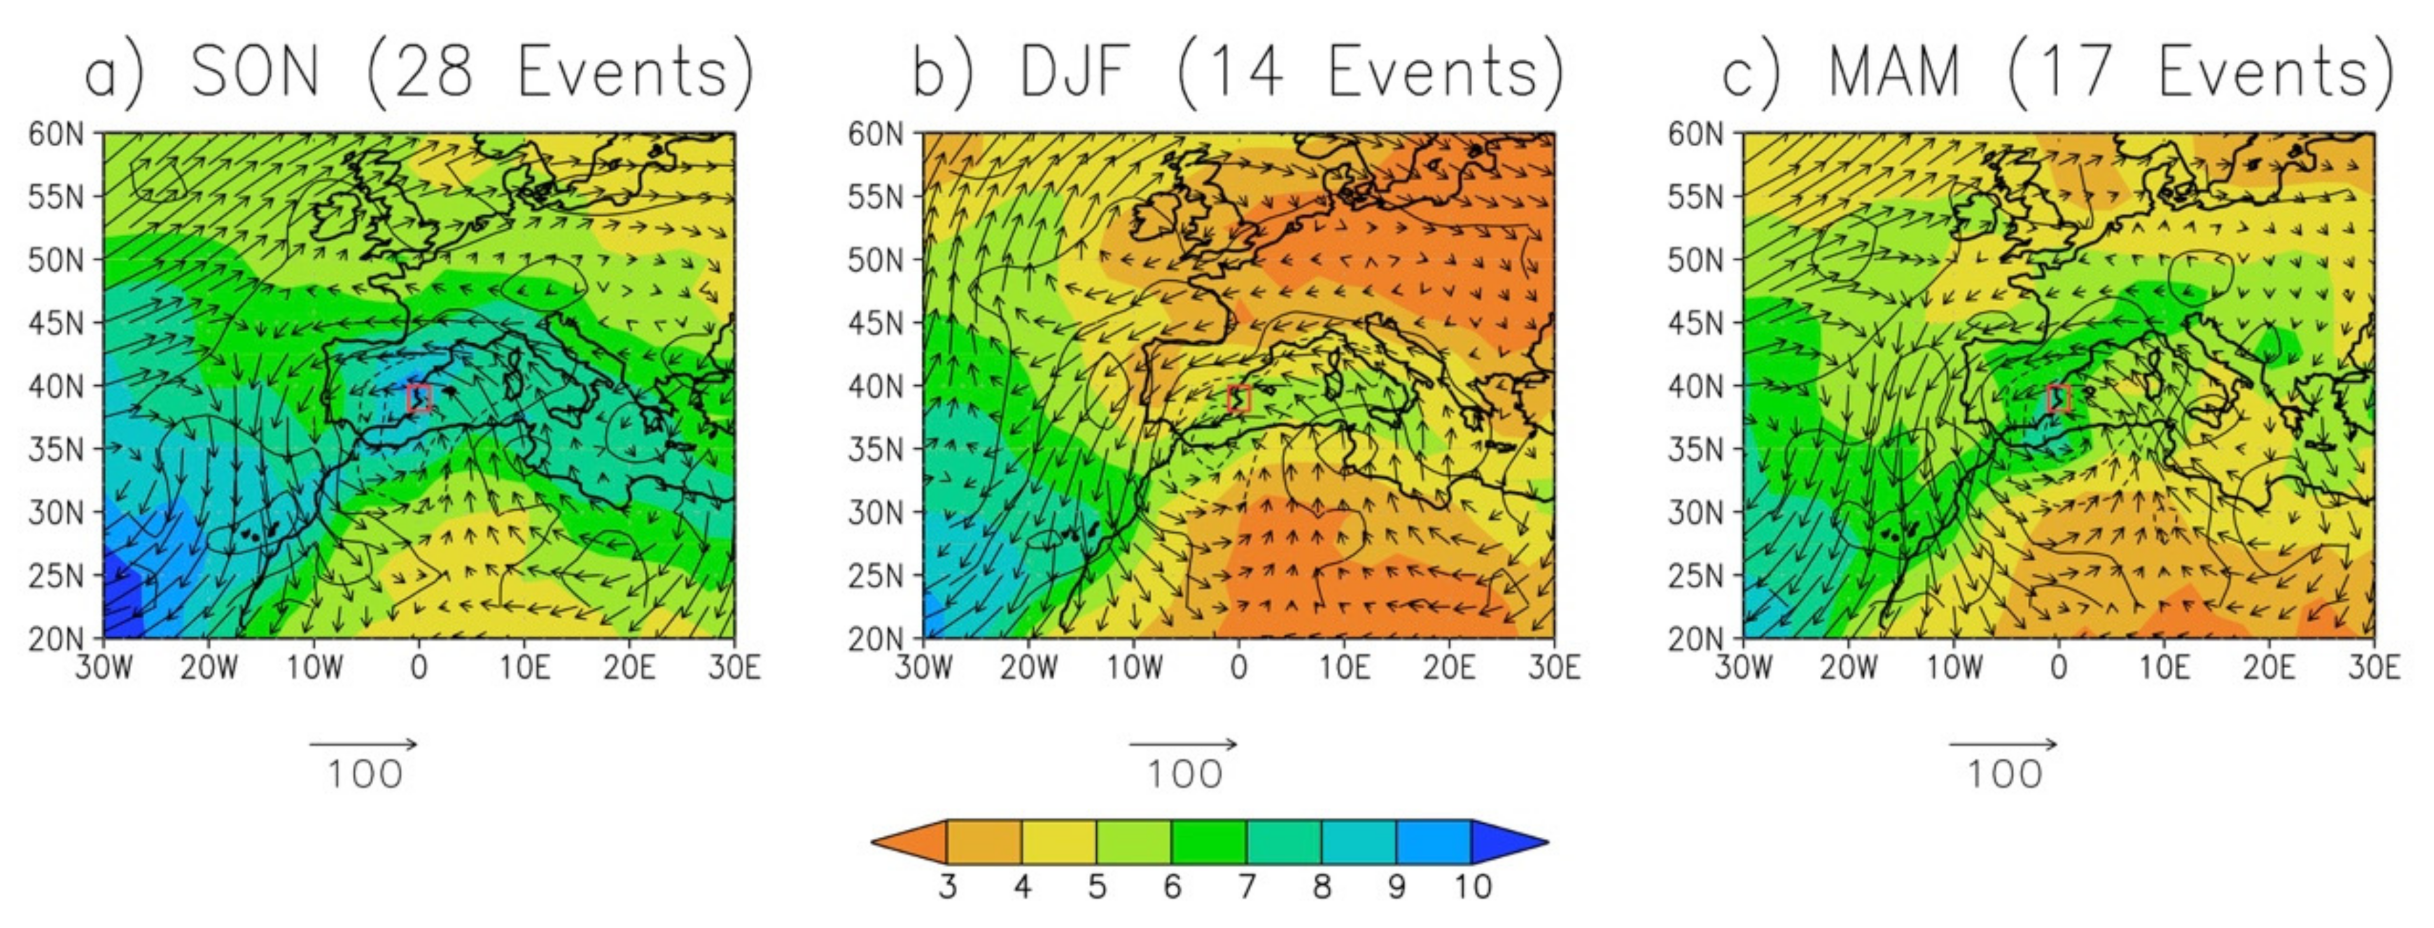
A synoptic climatology of COLs is presented below. The lower and upper tropospheric composites for the SON, MAM and DJF COL events that produced extreme precipitation in the Valencia Box during 1998–2014 were calculated. Figure 3 shows the 200 hPa wind speed and geopotential height composites for the 28 COL events that produced extreme rainfall in the Valencia Box during SON. While Table 3 lists 34 days with extreme precipitation from COL events in DJF. Six of those events produced extreme rain on 2–3 consecutive days, so they were added only once to the composite.
The upper-level composite (Figure 3a–f) shows that COLs formed when a shortwave trough occurred over Spain on day-2 to day-1, then became cut off from the midlatitude flow on day-0 and remained stationary until day + 1. In the composite, the COL occurred in a region of weak upper tropospheric winds and low meridional shear that was present between the subtropical and midlatitude jets. On day + 2 the composite COL was reabsorbed into the mid-latitude jet stream and then exited the Iberian Peninsula.
The composite TMPA precipitation, SLP and 925 hPa winds composite for the SON COLs are shown in Figure 3g–l. Precipitation occurred on the eastern side of the composite COL on day-1 (Figure 3i) to day + 1 (Figure 3k). The strongest precipitation fell on the Valencia Box on day 0 (Figure 3j). The composite SLP shows an inverted trough over northern Africa that extended northward and produced rainfall in southern Spain, northern Algeria and Morocco on day-1 (Figure 3i). As this low-level trough pushed northeastward, its associated pressure closed low at 925 mb produced northeasterly winds along the eastern coast of Spain from day-1 to day + 1 (Figure 3i–k). This onshore flow carried warm, moist Mediterranean air to fuel precipitation in the Valencia Box and adjacent sea. The composite COL produced rainfall in the Valencia Box from day-1 through day + 1 with the strongest precipitation on day 0 (Figure 3j). Offshore in the Mediterranean, precipitation associated with the COL persisted from day-1 to day + 2. On average, the Valencia Box received rainfall during the three-day period surrounding the COL event, that is from day-1 to day + 1. The MAM composites (not shown) are very similar to the SON composites described above.
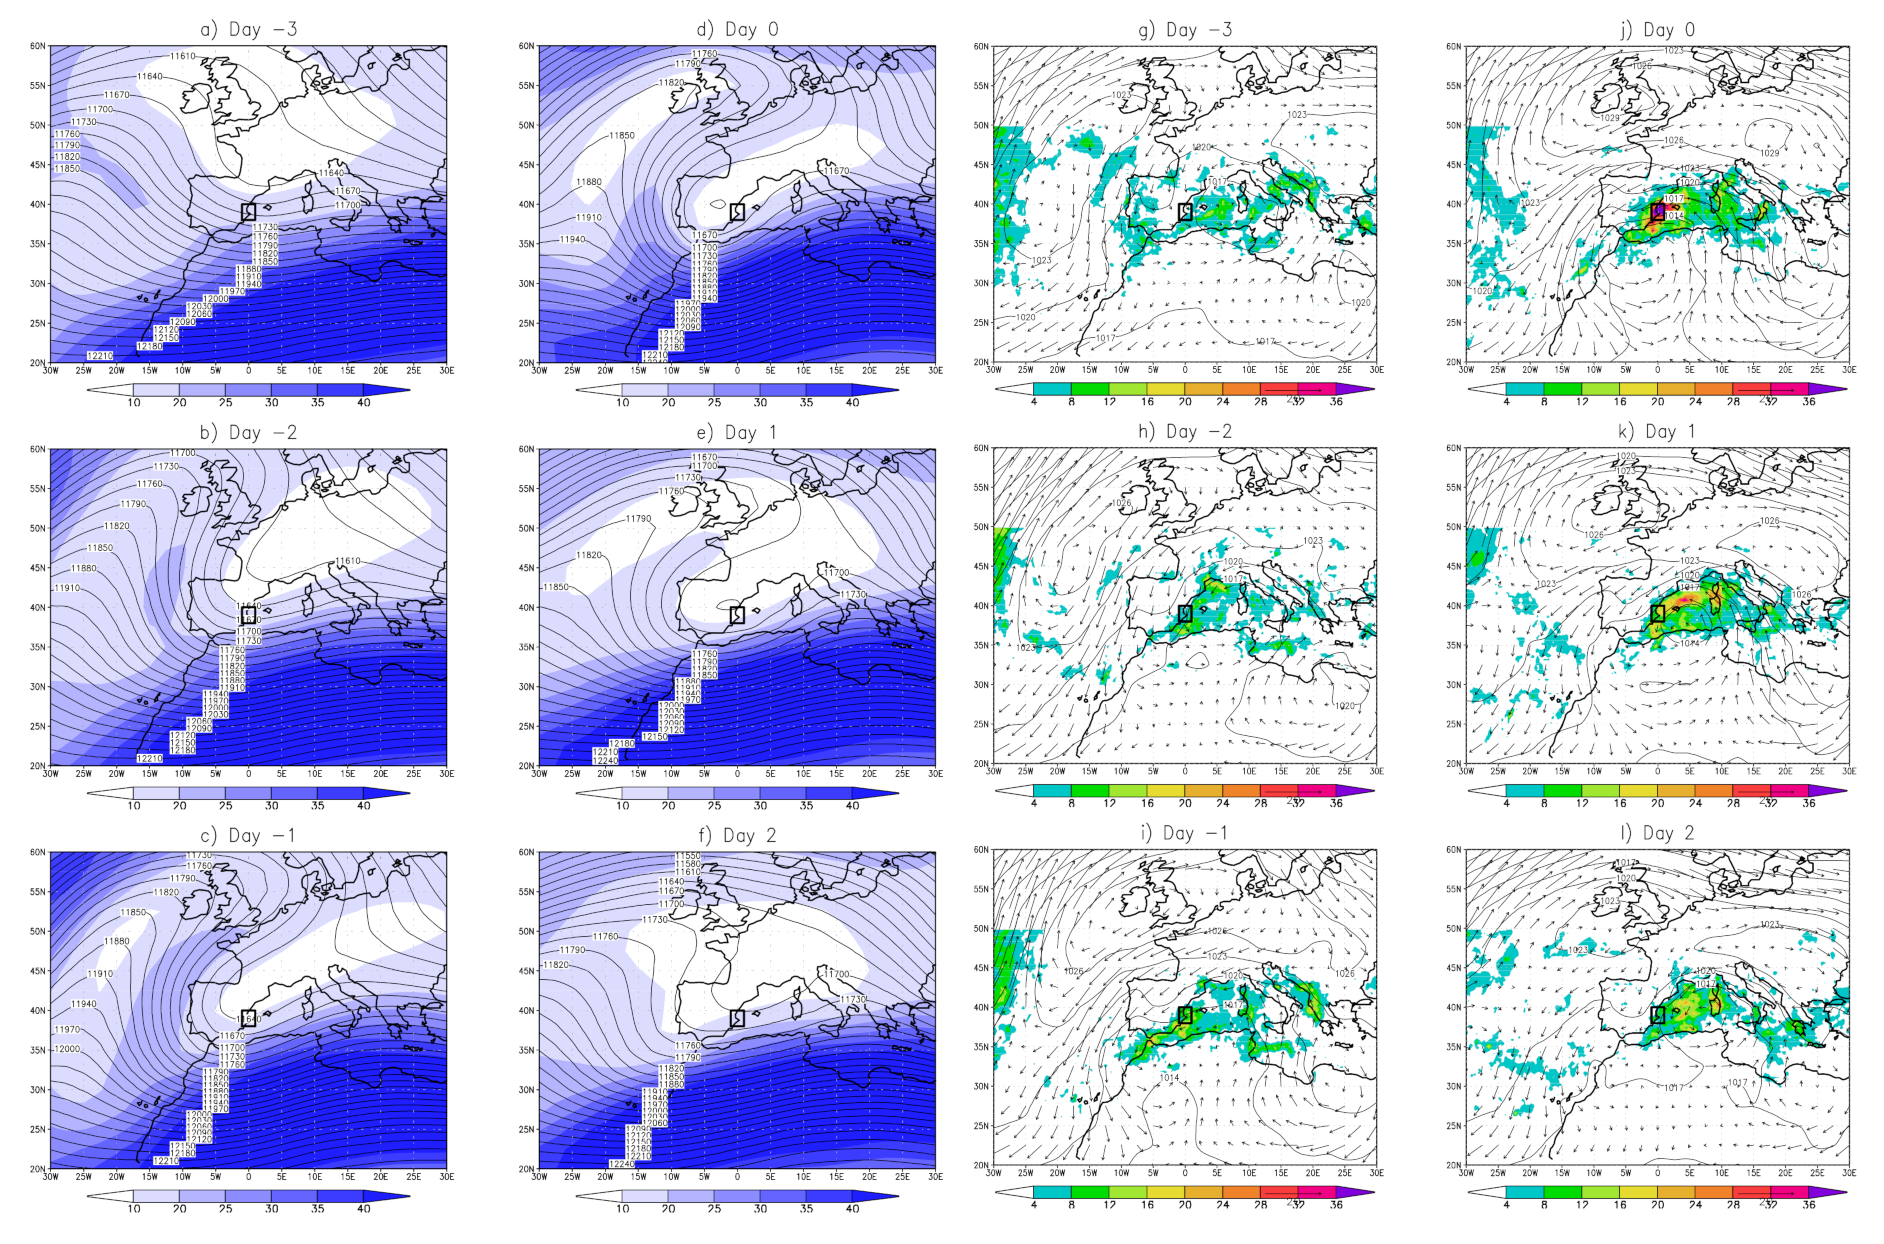
The composite for the COL events that produced extreme rainfall in the Valencia Box during DJF occurred shows a split-flow [51] or Rex blocking pattern at 200 hPa (Figure 4a–f) and 500 hPa between day-1 and day + 3. This suggests that wintertime COL events may lead to blocking, in agreement with the finding in [52] that nearly three-fourths of wintertime COL events in this region are associated with blocking events. Our results moreover suggest that wintertime COL events in this region are associated with a particular type of blocking event, the split-flow or Rex blocking.
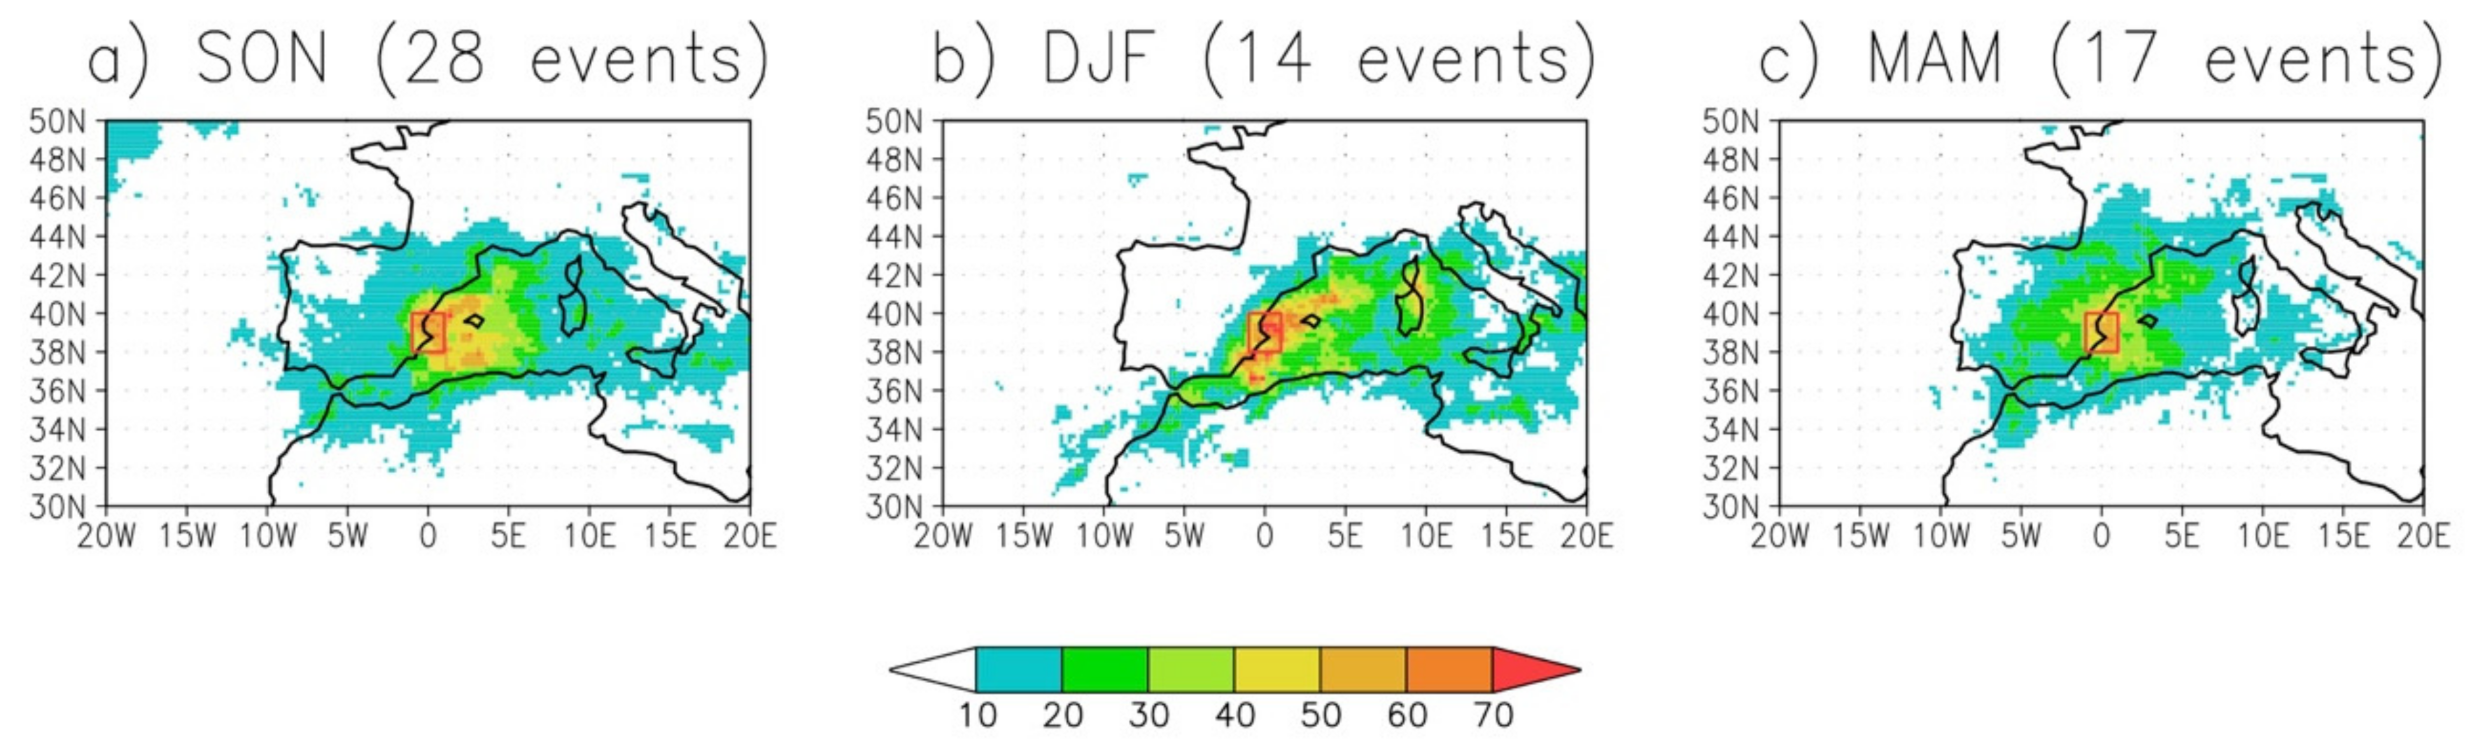
The accumulated TMPA precipitation for the composite COL events in each season are shown in Figure 5. On average, the Valencia Box received precipitation in excess of 50 mm during the three-day period surrounding the COL event, that is from day-1 to day + 1 (Figure 5). The largest COL related precipitation amounts occurred in DJF (Figure 5b) and SON (Figure 5a). Unlike the other seasons, DJF COLs had no precipitation in the central part of Spain over land. The COLs that occurred in MAM (Figure 5c) produced less precipitation.
Figure 6 shows the NCEP Reanalysis 925 mb specific humidity, moisture convergence and moisture fluxes for each composite on day-0. Moisture flux convergence maxima occurred in the Valencia Box in all composites. The specific humidity over the Mediterranean is largest in SON, likely reflecting the lingering warmer sea surface temperatures that follow the summer maximum. The moisture flux vectors suggest that moisture fluxes from the Mediterranean (Figure 6a–c) fuel COL precipitation in the Valencia Box in each season.
Given that COLs that produced extreme precipitation in the Valencia Box were most common in SON, the next section presents results from WRF simulations of a subset of the SON COL events included in the climatology above.
3.2. WRF Current and Future Climate Simulations
In this section current and future climate WRF model simulations are used to study how extreme precipitation from COL events that affect eastern Spain might change in a future warmer climate. Current and future climate WRF simulations using the PGW approach were performed for a subset of 14 SON COL events.
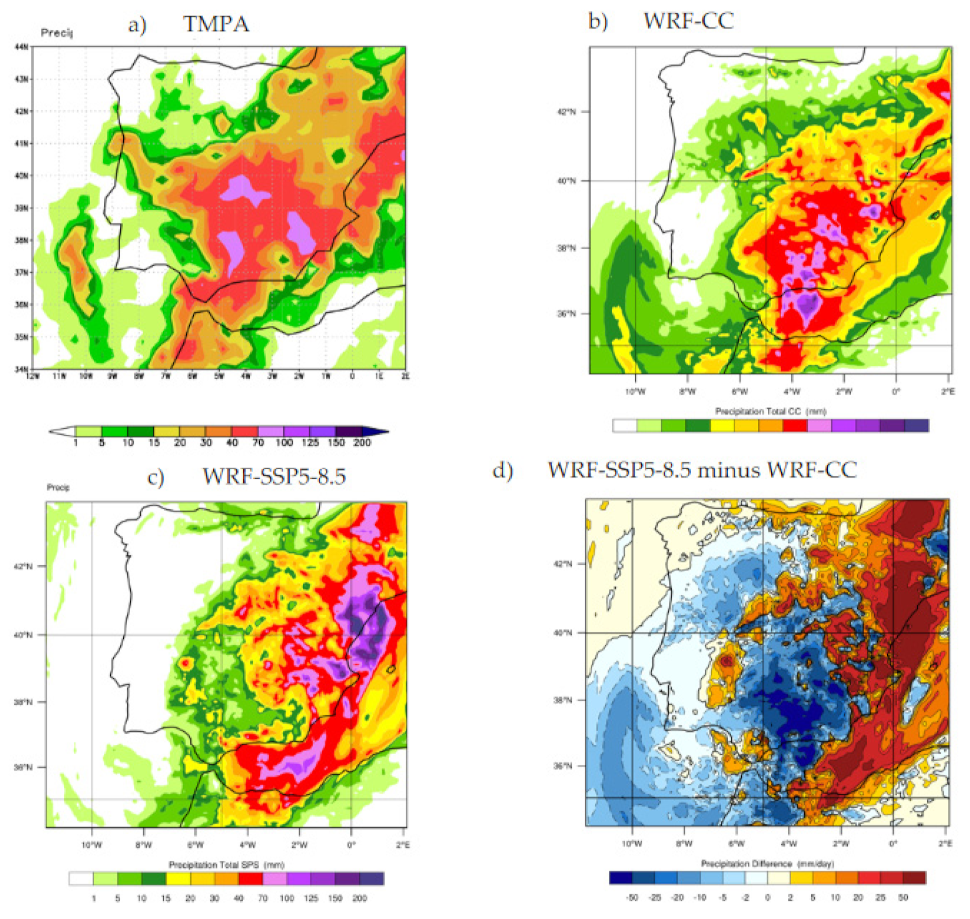
The current climate simulations capture well the observed distribution and intensity of rainfall for each COL event. As an example, the observed and current climate precipitation for the COL event that occurred on 28–29 September 2012 are shown in Figure 7. Comparison of the accumulated current climate precipitation (WRF-CC, Figure 7b) and the observed precipitation (Figure 7a) shows that the model captured well the overall precipitation pattern and precipitation totals produced by this COL event (Figure 7a), especially over the southern portion of the domain. Precipitation totals (Figure 7b) were weaker than observed (Figure 7a) in the Mediterranean sea and along the northeastern quadrant of Spain.
Given that the model captures well the overall observed precipitation pattern and totals for the current climate, the next step was to explore how precipitation might change if the same synoptic situation present in 28–29 September 2012 occurred in a warmer climate. This can be done by comparing the current and future climate PGW WRF simulations for this event using the difference field shown in Figure 7d. In the future climate simulation for 28–29 September 2012 precipitation increased over the Mediterranean and along northeastern Spain and the Pyrenees (Figure 7d). The future climate simulation was drier than the current climate simulation in much of the southern and western IP and the adjacent Atlantic Ocean south of 40°N. The location of the COL centers in both simulations (not shown) were similar to that of the observations (Figure 3c,e), as expected from the fact that both WRF simulations used GFS analysis boundary condition forcing. In both simulations the center of the COL propagated from the southern coast of Portugal on September 28 (Figure 2c) to the Valencia region on September 29 (Figure 2e). As the COL propagated eastward, precipitation fell on its eastern quadrant, where cyclonic vorticity advection forced low level convergence and rising air. In the future climate simulation precipitation increased above that of the current climate simulation on September 28, when the COL was located over southeastern Spain. This future climate COL location favored surface easterly winds and warm, moist air transport inland along the northeast coast of Spain to fuel convection.
The domain-averaged precipitation and rain rates—defined as the average of nonzero precipitation values across the domain—for the 28–29 September 2012 event show significant changes between the current and future climate simulations. The future climate for D02 predicts a 14% increase in domain-averaged accumulated precipitation and a 45% increase in rain rates when compared to the current climate simulation. In D01 rain rates increased by 39% and precipitation amounts increased by 27%. These changes were statistically significant to the 99th percentile according to Student’s t-test.
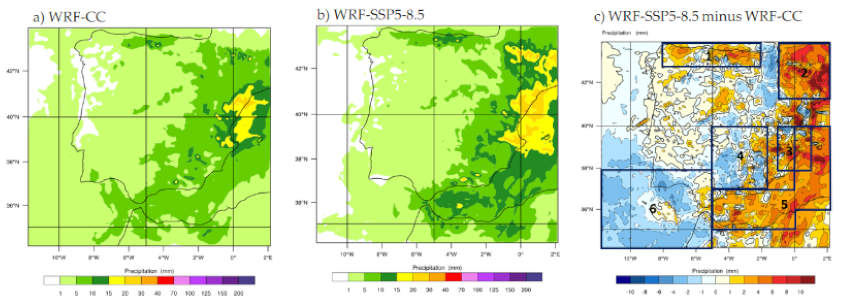
To further explore the future climate precipitation changes associated with COLs that affected the eastern IP a set of current and future climate simulations for an ensemble of 14 COL events in SON was performed. Results from these simulations are summarized in Figure 8. Similarly to the observations (Figure 5a), the WRF-CC COLs produced a precipitation maximum (Figure 8a) along the northeastern coast of Spain, near the Valencia Box. In the future climate (Figure 8b) this precipitation maximum strengthened, especially over the Mediterranean. Figure 8c shows the difference between the future and current climate simulations. Despite the relatively small sample size, some common patterns emerged. For example, the future climate simulation had enhanced precipitation over the Mediterranean sea along the coast of Spain (Figure 8c). This increase in precipitation in fact extended further eastward over the Mediterranean to near 10°E (D01, not shown). However, over most of the remainder of the IP, future climate precipitation anomalies in this ensemble were weaker and not consistent among the 14 events. For example, the negative precipitation anomalies in the Atlantic Ocean to the southwest of the IP were present in about half of the events. Northwestward from the IP the D01 (not shown) the future climate simulations had enhanced precipitation extending across much of the Atlantic Ocean. It is important to point out that since the PGW approach replicated the GFS synoptic scale flow from the current climate in the future climate simulations, the trajectories of simulated COL systems were nearly identical between current and future climate simulations. Because of this, the changes in precipitation in the future climate simulations were solely due to the imposed thermodynamic changes associated with the warmer future climate.
Table 4 further quantifies the differences between the current and future climate simulations. Large statistically significant increases in precipitation occurred in northeastern Spain (Box 2, an 88% increase) and in the Mediterranean (Box 5, a 61% increase) in the future climate simulations. Some of the other regions analyzed in Table 4, such as the Cantabric Coast (Box 1) and the Valencia Box (Box 3), also had large changes in precipitation in the future climate simulations but those changes were not statistically significant. The ensemble average precipitation in Boxes 4 and 6 had decreased precipitation in the future climate, but this result was also not statistically significant. Further simulations of COLs that affected this part of Spain are needed to better establish the robustness of these results.
The ensemble of future climate simulations showed a statistically significant increase in domain-averaged precipitation and rain rates for both domains, D01 and D02. When averaged over the 14 events simulated in this study, D01 future climate rain rates increased by 35% and precipitation increased by 29%. Those increases were similar to those in D01 for the 28–29 September 2012 simulation previously described. In D02 the future climate simulations had an average 21% increase in rain rates when compared to the current climate simulations. When averaged over the 14 events simulated here, future climate precipitation increased only by 8%. Again, these changes were statistically significant to the 99th percentile according to Student’s t-test.
4. Discussion
In the IP COLs bear some similarities with COLs in other parts of the world. For instance, [11] found that COLs produced about 33% of annual precipitation and 50% of extreme precipitation in portions of the United States Great Plains and interior western states during MAM and SON. For the Valencia region of Spain, the present study shows that COLs produce about 23% of the annual precipitation and 81% of the extreme precipitation. This means that COLs play an important role in supplying water for this arid region of Spain, as they do in semiarid regions of the western United States [11]. While previous studies [8] found that COLs are generally more common in spring and summer and least common in winter, in this study we found that COLs that produce extreme precipitation in the Valencia Box are most common in the fall. The discrepancy is due to the fact that summertime COLs, although common, do not produce extreme precipitation.
Because COLs contribute about one-fifth of the total precipitation and most of the extreme precipitation in the Valencia region, understanding how COL precipitation might change as the climate warms is very important for this water-stressed region of the world. As climate warms the IP is projected to become warmer and drier and precipitation extremes are predicted to intensify [5]. Regarding extreme events, previous studies have shown that thermodynamic forcing will act to enhance extreme precipitation around the globe, while dynamic effects may dampen extreme precipitation in subtropical regions, including southern Spain [22]. These competing effects make it difficult to project the effect of climate change on precipitation in the Mediterranean coast of Spain. The present study projects that the thermodynamic effects of climate change will cause COL systems that affect the Valencia region of Spain to produce an increase in precipitation in northeastern Spain and in the Mediterranean. However the present study does not include dynamic effects such as future climate change shifts in the location and strength of the midlatitude jet stream and Atlantic subtropical high. A recent study has shown that the annual frequency of cut-off lows trended upwards during 1960-2017 globally, but also locally in the European sector [10]. This upward trend is consistent with a weakening and poleward shift of the subtropical jets and an increase in blocking frequency associated with a warming climate. If this upward trend in the frequency of COLs continues and the amount of precipitation associated with COLs increases as shown in the WRF simulations presented herein, the Mediterranean coast of Spain may experience more frequent episodes of extreme precipitation in the future. Indeed, a recent study [3] that used WRF to downscale CMIP5 climate simulations including both dynamic and thermodynamics effects of climate change projected a general increase in annual precipitation intensity in the IP, including increases in the intensity of precipitation along the Mediterranean coast of Spain during MAM and SON. Indeed, an analysis of the observational record has shown that an increase in the intensity of heavy precipitation events is already under way in parts of the Mediterranean coast of Spain [21].
5. Conclusions
This study presents results from a seasonal synoptic climatology of COLs that produced extreme rainfall events in eastern Spain (Valencia Box) during 1998–2018, and explores how precipitation from these COL events might change in a future warmer climate.
The synoptic climatology of COLs used data from the TMPA satellite and NCEP Reanalysis data to produce 6-day composites of COL systems that brought extreme rainfall to the Valencia Box. In the Valencia region COLs play a particularly important role in producing extreme precipitation events. It was found that COLs produced 70 of the 90 extreme rainfall days detected in this study and 81% of the extreme rainfall in the Valencia Box. The rainiest COLs occurred in SON and DJF. COLs that produce extreme precipitation in the Valencia Box were most common during SON, when COLs carry moisture from the warm Mediterranean sea inland to fuel convection. No extreme rainfall events were detected during the summer. The mean annual rainfall over the Valencia Box was 400 mm/year, of which about 29% were produced by extreme events. The vast majority of the extreme rain events occurred in the transition seasons, namely 28% in MAM and 47% in SON, and no extreme precipitation event occurred during the summer. The upper-level composites clearly showed that COLs formed in a region of weak upper level winds between the subtropical and polar jets and that COLs lasted at least 2 days (3 days in MAM) in the 200 hPa geopotential field. At the surface the SON and MAM composites displayed an inverted trough over northern Africa that extended northward producing rainfall in Spain from day-2 to day + 1. According to the composites presented in this study a typical COL episode produced rain in the Valencia Box on day-1 through day + 1, with the strongest rain—by design—falling on day-0. Analysis of the moisture flux and its convergence in the Valencia Box shows that the moisture that fueled COL precipitation in the region originated in the Mediterranean, where specific humidity is large, especially during SON COL events.
This study also aimed to improve our understanding of how precipitation from COL events that affect the Valencia region of Spain will change as the climate warms. To address this question ensembles of present and future climate simulations of 14 COL events that affected the Valencia Box during SON were produced using WRF. The future climate simulations were performed using the PGW approach to downscale CMIP6 simulations in an implementation similar to [31,35]. As in previous studies [3,26,27,28] WRF represented well the amounts and distribution of precipitation in the current climate. Results from the future climate WRF simulations presented here suggest that in a warmer climate extreme precipitation associated with COL events may increase significantly in northeastern Spain (by 61%) and in the Mediterranean Sea (by 88%). This is in agreement with previous studies that have projected an increase in extreme precipitation in this part of the world [21]. The average precipitation in the Valencia Box also increased in the future climate COL ensemble, but not consistently across all simulated events. The WRF simulations presented here suggest that climate change has the potential to enhance extreme precipitation from COLs in northeastern Spain and in the Mediterranean Sea. The increases in precipitation in the future climate simulations presented in this study are due to the thermodynamic effect of the warmer atmosphere simulated with the PGW approach. However, in addition to the role of thermodynamics, the effect of climate change on COL precipitation also depends on changes in the frequency of COL formation in a warmer climate, which in turn depend on changes in the location and intensity of the jetstream and the Atlantic subtropical high. These important effects are beyond the scope of the PGW simulations in this study. Further studies of how the thermodynamic and dynamic effects of climate change will affect COL precipitation in the IP as a whole are needed to obtain a better picture of future COL flooding hazards to be expected in the region.
Funding
This study was funded in part by grants (AGS-1118141 and AGS-1660049) from the National Science Foundation’s Climate and Large-Scale Dynamics program and the Physical and Dynamic Meteorology program of the Division of Atmospheric and Geospatial Science.
Institutional Review Board Statement
Not applicable.
Informed Consent Statement
Not applicable.
Data Availability Statement
Not applicable.
Acknowledgments
The author thanks Antonio Gil Olcina, Antonio Rico Amorós and Jorge Olcina for the invitation to visit the Instituto Interuniversitário de Geografía at the University of Alicante, Spain where the original ideas for this study originated. The author also acknowledges Tom Rickenbach and three anonymous reviewers for their valuable feedback on an earlier version of this manuscript.
Conflicts of Interest
The author declares no conflict of interest.
References
- Cortesi, N.; Gonzalez-Hidalgo, J.; Trigo, R.M.; Ramos, A.M. Weather Types and Spatial Variability of Precipitation in the Iberian Peninsula. Int. J. Climatol. 2014, 34, 2661–2677. [Google Scholar] [CrossRef]
- Herrera, S.; Gutiérrez, J.M.; Ancell, R.; Pons, M.R.; Frías, M.D.; Fernández, J. Development and Analysis of a 50-Year High-Resolution Daily Gridded Precipitation Dataset Over Spain (Spain02). Int. J. Climatol. 2012, 32, 74–85. [Google Scholar] [CrossRef] [Green Version]
- Cardoso Pereira, S.; Marta-Almeida, M.; Carvalho, A.C.; Rocha, A. Extreme Precipitation Events Under Climate Change in the Iberian Peninsula. Int. J. Climatol. 2020, 40, 1255–1278. [Google Scholar] [CrossRef]
- Martín León, F. Las Gotas Frías/DANAs, Ideas Y Conceptos Básicos. Nota Técnica Serv. Técnicas Análisis Predicción STAP 2003, 38, 14. [Google Scholar]
- Porcù, F.; Carrassi, A.; Medaglia, C.M.; Prodi, F.; Mugnai, A. A Study on Cut-Off Low Vertical Structure and Precipitation in the Mediterranean Region. Meteorol. Atmos. Phys. 2007, 96, 121–140. [Google Scholar] [CrossRef]
- Observatorio de la Sostenibilidad. Población en Riesgo de Inundación en España en la Franja de los Primeros 10 Kilómetros de Costa. Available online: https://www.observatoriosostenibilidad.com/tag/inundaciones/ (accessed on 28 June 2021).
- Llasat, M.-C.; Martín, F.; Barrera, A. From the Concept of “Kaltlufttropfen” (Cold Air Pool) to the Cut-Off Low. the Case of September 1971 in Spain as an Example of their Role in Heavy Rainfalls. Meteorol. Atmos. Phys. 2007, 96, 43–60. [Google Scholar] [CrossRef]
- Nieto, R.; Gimeno, L.; Añel, J.; de la Torre, R.; Gallego, D.; Barriopedro, D.; Gallego, M.; Gordillo-Guerrero, A.; Redaño, A.; Delgado, G. Analysis of the Precipitation and Cloudiness Associated with COLs Occurrence in the Iberian Peninsula. Meteorol. Atmos. Phys. 2007, 96, 103–119. [Google Scholar] [CrossRef]
- Thorncroft, C.D.; Hoskins, B.J.; McIntyre, M.E. Two Paradigms of Baroclinic-Wave Life-Cycle Behaviour. Q. J. R. Meteorol. Soc. 1993, 119, 17–55. [Google Scholar] [CrossRef]
- Muñoz, C.; Schultz, D.; Vaughan, G. A Midlatitude Climatology and Interannual Variability of 200- and 500-hPa Cut-Off Lows. J. Clim. 2021, 33, 2201–2222. [Google Scholar] [CrossRef] [Green Version]
- Abatzoglou, J.T. Contribution of Cutoff Lows to Precipitation Across the United States. J. Appl. Meteor. Climatol. 2016, 55, 893–899. [Google Scholar] [CrossRef]
- Campetella, C.M.; Possia, N.E. Upper-Level Cut-Off Lows in Southern South America. Meteorol. Atmos. Phys. 2007, 96, 181–191. [Google Scholar] [CrossRef]
- Pinheiro, H.R.; Hodges, K.I.; Gan, M.A.; Ferreira, N.J. A New Perspective of the Climatological Features of Upper-Level Cut-Off Lows in the Southern Hemisphere. Clim. Dyn. 2017, 48, 541–559. [Google Scholar] [CrossRef] [Green Version]
- Griffiths, M.; Reeder, M.J.; Low, D.J.; Vincent, R.A. Observations of a Cut-Off Low Over Southern Australia. Q. J. R. Meteorol. Soc. 1998, 124, 1109–1132. [Google Scholar] [CrossRef]
- Singleton, A.T.; Reason, C.J.C. Variability in the Characteristics of Cut-Off Low Pressure Systems Over Subtropical Southern Africa. Int. J. Climatol. 2007, 27, 295–310. [Google Scholar] [CrossRef]
- Giorgi, F.; Lionello, P. Climate Change Projections for the Mediterranean Region. Global Planet. Chang. 2008, 63, 90–104. [Google Scholar] [CrossRef]
- Beniston, M.; Stephenson, D.B.; Christensen, O.B.; Ferro, C.A.T.; Frei, C.; Goyette, S.; Halsnaes, K.; Holt, T.; Jylhä, K.; Koffi, B.; et al. Future Extreme Events in European Climate: An Exploration of Regional Climate Model Projections. Clim. Chang. 2007, 81, 71–95. [Google Scholar] [CrossRef] [Green Version]
- IPCC. Annex I: Atlas of Global and Regional Climate Projections Supplementary Material RCP8.5. In Climate Change 2013: The Physical Science Basis. Contribution of Working Group I to the Fifth Assessment Report of the Intergovernmental Panel on Climate Change; Van Olden-Borgh, G.J., Collins, M., Arblaster, J., Christensen, J.H., Marotzke, J., Power, S.B., Rummukainen, M., Zhou, T., Eds.; IPCC: Geneva, Switzerland, 2013; Available online: Www.climatechange2013.Org; Www.Ipcc.Ch; (accessed on 28 June 2021). [Google Scholar]
- Costa, A.C.; Soares, A. Trends in Extreme Precipitation Indices Derived from a Daily Rainfall Database for the South of Portugal. Int. J. Climatol. 2009, 29, 1956–1975. [Google Scholar] [CrossRef]
- Rico-Amoros, A.M.; Olcina-Cantos, J.; Sauri, D. Tourist Land use Patterns and Water Demand: Evidence from the Western Mediterranean. Land Use Policy 2009, 26, 493–501. [Google Scholar] [CrossRef]
- Olcina, J. Clima, Cambio Climático Y Riesgos Climáticos En El Litoral Mediterráneo. Oportunidades Para La Geografía. Documents d’Anàlisi Geogràfica 2020, 66, 159–182. [Google Scholar] [CrossRef]
- Pfahl, S.; O’Gorman, P.A.; Fischer, E.M. Understanding the Regional Pattern of Projected Future Changes in Extreme Precipitation. Nat. Clim. Chang. 2017, 7, 423–427. [Google Scholar] [CrossRef]
- Bador, M.; Donat, M.G.; Geoffroy, O.; Alexander, L.V. Assessing the Robustness of Future Extreme Precipitation Intensification in the CMIP5 Ensemble. J. Clim. 2018, 31, 6505–6525. [Google Scholar] [CrossRef]
- Miró, J.J.; Estrela, M.J.; Caselles, V.; Gómez, I. Spatial and Temporal Rainfall Changes in the Júcar and Segura Basins (1955–2016): Fine-Scale Trends. Int. J. Climatol. 2018, 38, 4699–4722. [Google Scholar] [CrossRef]
- Pastor, F.; Valiente, J.A.; Khodayar, S. A Warming Mediterranean: 38 Years of Increasing Sea Surface Temperature. Remote Sens. 2020, 12, 2687. [Google Scholar] [CrossRef]
- Cardoso, R.M.; Soares, P.M.M.; Miranda, P.M.A.; Belo-Pereira, M. WRF High Resolution Simulation of Iberian Mean and Extreme Precipitation Climate. Int. J. Climatol. 2013, 33, 2591–2608. [Google Scholar] [CrossRef]
- Argüeso, D.; Hidalgo-Muñoz, J.M.; Gámiz-Fortis, S.R.; Esteban-Parra, M.J.; Castro-Díez, Y. Evaluation of WRF Mean and Extreme Precipitation Over Spain: Present Climate (1970–1999). J. Clim. 2012, 25, 4883–4897. [Google Scholar] [CrossRef]
- Argüeso, D.; Hidalgo-Muñoz, J.M.; Gámiz-Fortis, S.R.; Esteban-Parra, M.J.; Dudhia, J.; Castro-Díez, Y. Evaluation of WRF Parameterizations for Climate Studies Over Southern Spain using a Multistep Regionalization. J. Clim. 2011, 24, 5633–5651. [Google Scholar] [CrossRef]
- Frei, C.; Schär, C.; Lüthi, D.; Davies, H.C. Heavy Precipitation Processes in a Warmer Climate. Geophys. Res. Lett. 1998, 25, 1431–1434. [Google Scholar] [CrossRef] [Green Version]
- Sato, T.; Kimura, F.; Kitoh, A. Projection of Global Warming onto Regional Precipitation over Mongolia Using a Regional Climate Model. J. Hydrol. 2007, 333, 144–154. [Google Scholar] [CrossRef]
- Nieto Ferreira, R.; Nissenbaum, M.R.; Rickenbach, T.M. Climate Change Effects on Summertime Precipitation Organization in the Southeast United States. Atmos. Res. 2018, 214, 348–363. [Google Scholar] [CrossRef]
- Hill, K.A.; Lackmann, G.M. The Impact of Future Climate Change on TC Intensity and Structure: A Downscaling Approach. J. Clim. 2011, 24, 4644–4661. [Google Scholar] [CrossRef]
- Kanada, S.; Wada, A.; Sugi, M. Future Changes in Structures of Extremely Intense Tropical Cyclones using a 2-km Mesh Nonhydrostatic Model. J. Clim. 2013, 26, 9986–10005. [Google Scholar] [CrossRef]
- Manda, A.; Nakamura, H.; Asano, N.; Iizuka, S.; Miyama, T.; Moteki, Q.; Yoshioka, M.K.; Nishii, K.; Miyasaka, T. Impacts of a Warming Marginal Sea on Torrential Rainfall Organized Under the Asian Summer Monsoon. Sci. Rep. 2014, 4, 5741. [Google Scholar] [CrossRef] [Green Version]
- Lackmann, G.M. The South-Central US Flood of May 2010: Present and Future. J. Clim. 2013, 26, 4688–4709. [Google Scholar] [CrossRef]
- Trapp, R.J.; Hoogewind, K.A. The Realization of Extreme Tornadic Storm Events Under Future Anthropogenic Climate Change. J. Clim. 2016, 29, 5251–5265. [Google Scholar] [CrossRef]
- Tsunematsu, N.; Kuze, H.; Sato, T.; Hayasaki, M.; Cui, F.; Kondoh, A. Potential Impact of Spatial Patterns of Future Atmospheric Warming on Asian Dust Emission. Atmos. Environ. 2011, 45, 6682–6695. [Google Scholar] [CrossRef]
- Hara, M.; Yoshikane, T.; Kawase, H.; Kimura, F. Estimation of the Impact of Global Warming on Snow Depth in Japan by the Pseudo-Global-Warming Method. Hydrol. Res Lett. 2008, 2, 61–64. [Google Scholar] [CrossRef]
- O’Gorman, P.A. Precipitation Extremes Under Climate Change. Curr. Clim. Chang. Rep. 2015, 1, 49–59. [Google Scholar] [CrossRef] [PubMed] [Green Version]
- Huffman, G.J.; Bolvin, D.T.; Nelkin, E.J.; Wolff, D.B.; Adler, R.F.; Gu, G.; Hong, Y.; Bowman, K.P.; Stocker, E.F. The TRMM Multisatellite Precipitation Analysis (TMPA): Quasi-Global, Multiyear, Combined-Sensor Precipitation Estimates at Fine Scales. J. Hydrometeor. 2007, 8, 38–55. [Google Scholar] [CrossRef]
- Ferreira, R.N.; Hall, L.; Rickenbach, T.M. A Climatology of the Structure, Evolution, and Propagation of Midlatitude Cyclones in the Southeast United States. J. Clim. 2013, 26, 8406–8421. [Google Scholar] [CrossRef]
- Nieto Ferreira, R.; Earl Hall, L. Midlatitude Cyclones in the Southeastern United States: Frequency and Structure Differences by Cyclogenesis Region. Int. J. Climatol. 2015, 35, 3798–3811. [Google Scholar] [CrossRef]
- Skamarock, W.C.; Klemp, J.; Dudhia, J.; Gill, D.O.; Barker, D.M.; Duda, M.G.; Huang, X.-Y.; Powers, J.G. A Description of the Advanced Research WRF Version 3. Available online: https://opensky.ucar.edu/islandora/object/technotes:500 (accessed on 28 June 2021).
- Ma, L.; Tan, Z. Improving the Behavior of the Cumulus Parameterization for Tropical Cyclone Prediction: Convection Trigger. Atmos. Res. 2009, 92, 190–211. [Google Scholar] [CrossRef]
- Hong, S.; Dudhia, J.; Chen, S. A Revised Approach to Ice Microphysical Processes for the Bulk Parameterization of Clouds and Precipitation. Mon. Weather Rev. 2004, 132, 103–120. [Google Scholar] [CrossRef]
- Hong, S.; Noh, Y.; Dudhia, J. A New Vertical Diffusion Package with an Explicit Treatment of Entrainment Processes. Mon. Weather Rev. 2006, 134, 2318–2341. [Google Scholar] [CrossRef] [Green Version]
- Tewari, M.; Chen, F.; Wang, W.; Dudhia, J.; Lemone, M.A.; Mitchell, K. Implementation and Verification of the Unified Noah Land-Surface Model in the WRF Model. In Proceedings of the 20th Conference on Weather Analysis and Forecasting/16th Conference on Numerical Weather Prediction 2004, Seattle, WA, USA, 12–16 January 2004. [Google Scholar]
- Iacono, M.J.; Delamere, J.S.; Mlawer, E.J.; Shephard, M.W.; Clough, S.A.; Collins, W.D. Radiative Forcing by Long-Lived Greenhouse Gases: Calculations with the AER Radiative Transfer Models. J. Geophys. Res. 2008, 113. [Google Scholar] [CrossRef]
- Fan, X.; Duan, Q.; Shen, C.; Wu, Y.; Xing, C. Global Surface Air Temperatures in CMIP6: Historical Performance and Future Changes. Environ. Res. Lett. 2020, 15, 104056. [Google Scholar] [CrossRef]
- Allen, M.R.; Ingram, W.J. Constraints on Future Changes in Climate and the Hydrologic Cycle. Nature 2002, 419, 228–232. [Google Scholar] [CrossRef] [PubMed]
- Barriopedro, D.; García-Herrera, R.; Lupo, A.R.; Hernández, E. A Climatology of Northern Hemisphere Blocking. J. Clim. 2006, 19, 1042–1063. [Google Scholar] [CrossRef] [Green Version]
- Nieto, R.; Gimeno, L.; De la Torre, L.; Ribera, P.; Barriopedro, D.; García-Herrera, R.; Serrano, A.; Gordillo, A.; Redaño, A.; Lorente, J. Interannual Variability of Cut-Off Low Systems Over the European Sector: The Role of Blocking and the Northern Hemisphere Circulation Modes. Meteorol. Atmos. Phys. 2007, 96, 85–101. [Google Scholar] [CrossRef]
Figure 1.
Weather Research and Forecasting (WRF) model domains and topography (m). The parent domain (D01) has 27 km horizontal resolution and the nested domain (D02) has 9 km resolution and focuses on the Iberian Peninsula (IP).
Figure 1.
Weather Research and Forecasting (WRF) model domains and topography (m). The parent domain (D01) has 27 km horizontal resolution and the nested domain (D02) has 9 km resolution and focuses on the Iberian Peninsula (IP).

Figure 2.
COL event that produced extreme rainfall in the Valencia Box on 28 September 2012. Left column shows the NCEP (National Center for Environmental Prediction) Reanalysis 200 hPa geopotential height (m, contours) and wind speed (ms−1, shaded) and right column shows sea level pressure (hPa, contours), surface winds (m/s, vectors) and TMPA (Tropical Rainfall Measuring Mission’s Multi-Satellite Precipitation Analysis) rainfall (mm, shaded) on September 27 (top), 28 (middle) and 29 (bottom) September 2012. The Valencia Box is outlined by a black square.

Figure 3.
Six-day composites for the 28 COL events that occurred in SON. (a–f) NCEP Reanalysis 200 mb winds (shaded in blue) and geopotential heights (contours); (g–l) NCEP Reanalysis SLP (contours, mb) and 925 mb winds (vectors, m s−1), and TMPA rainfall (shaded, mm day−1).
Figure 3.
Six-day composites for the 28 COL events that occurred in SON. (a–f) NCEP Reanalysis 200 mb winds (shaded in blue) and geopotential heights (contours); (g–l) NCEP Reanalysis SLP (contours, mb) and 925 mb winds (vectors, m s−1), and TMPA rainfall (shaded, mm day−1).

Figure 4.
Same as Figure 3 but for the 14 COL events that occurred in DJF.
Figure 4.
Same as Figure 3 but for the 14 COL events that occurred in DJF.

Figure 5.
TMPA precipitation (in mm) accumulated for the day-1 to day + 1 COL composite days for (a) SON, (b) DJF, and (c) MAM.
Figure 5.
TMPA precipitation (in mm) accumulated for the day-1 to day + 1 COL composite days for (a) SON, (b) DJF, and (c) MAM.

Figure 6.
NCEP Reanalysis 925 mb specific humidity (shaded in g kg−1), moisture convergence (contours in g kg−1 m s−2, every 2 × 10⁻⁵) and moisture flux (vectors in g kg−1 m s−1) for Day-0 of the (a) SON, (b) DJF and (c) MAM COL composites.
Figure 6.
NCEP Reanalysis 925 mb specific humidity (shaded in g kg−1), moisture convergence (contours in g kg−1 m s−2, every 2 × 10⁻⁵) and moisture flux (vectors in g kg−1 m s−1) for Day-0 of the (a) SON, (b) DJF and (c) MAM COL composites.

Figure 7.
Accumulated precipitation (mm) during 28–29 September 2012 from (a) TMPA, and D01 (b) WRF-CC, (c) WRF-SSP5-8.5, and (d) WRF-SSP5-8.5 minus WRF-CC.
Figure 7.
Accumulated precipitation (mm) during 28–29 September 2012 from (a) TMPA, and D01 (b) WRF-CC, (c) WRF-SSP5-8.5, and (d) WRF-SSP5-8.5 minus WRF-CC.

Figure 8.
Average precipitation (mm day−1) in the 14 COL events simulated using WRF for (a) WRF-CC, (b) WRF-SSP5-8.5, and (c) WRF-SSP5-8.5 minus WRF-CC. Boxes mark the boxes where the averages in Table 3 are calculated.
Figure 8.
Average precipitation (mm day−1) in the 14 COL events simulated using WRF for (a) WRF-CC, (b) WRF-SSP5-8.5, and (c) WRF-SSP5-8.5 minus WRF-CC. Boxes mark the boxes where the averages in Table 3 are calculated.


Table 1.
Dates of Weather Research and Forecasting (WRF) cut-off low (COL) simulations (after discarding a spin-up period of 24 h). Asterisks mark the rainiest day of each COL event in the Valencia Box.
Table 1.
Dates of Weather Research and Forecasting (WRF) cut-off low (COL) simulations (after discarding a spin-up period of 24 h). Asterisks mark the rainiest day of each COL event in the Valencia Box.
| Simulation | Year/Month | Days | Simulation | Year/Month | Days |
|---|---|---|---|---|---|
| 1 | 2005/11 | 13, 14 * | 8 | 2009/09 | 26, 27 * |
| 2 | 2007/09 | 13, 14 * | 9 | 2009/09 | 28, 29 * |
| 3 | 2007/09 | 21, 22 * | 10 | 2011/11 | 21, 22 * |
| 5 | 2007/10 | 03, 04 * | 11 | 2012/09 | 28 *, 29 |
| 4 | 2007/10 | 11, 12 * | 12 | 2012/10 | 19, 20 * |
| 6 | 2007/10 | 16, 17 * | 13 | 2012/11 | 13,14 * |
| 7 | 2008/10 | 09, 10 * | 14 | 2015/11 | 1, 2 * |
Table 2.
Number of extreme rainfall days detected in the Valencia Box from 1998–2018 separated into those due COLs that produce extreme rainfall and other phenomena.
Table 2.
Number of extreme rainfall days detected in the Valencia Box from 1998–2018 separated into those due COLs that produce extreme rainfall and other phenomena.
| Season | COLs | Other |
|---|---|---|
| MAM | 21 | 4 |
| JJA | 0 | 1 |
| SON | 34 | 8 |
| DJF | 15 | 7 |
Table 3.
TMPA rainfall (mm) from COLs that produced extreme rainfall in the Valencia Box between 1998–2018.
Table 3.
TMPA rainfall (mm) from COLs that produced extreme rainfall in the Valencia Box between 1998–2018.
| Season | COL Rainfall (mm) |
|---|---|
| MAM | 700 |
| JJA | 0 |
| SON | 1217 |
| DJF | 499 |
| Total | 2416 |
Table 4.
Precipitation (mm day−1) averages for the 14 COL events simulated using WRF and for WRF-SSP5-8.5, WRF-CC and WRF-SSP5-8.5 minus WRF-CC. Averages are calculated in the boxes marked in Figure 8c. Bold italicized values show highlight differences that are statistically significant to the 95% level according to Student’s t-test.
| Box | WRF-SSP5-8.5 | WRF-CC | Difference |
|---|---|---|---|
| 1 | 12.3 | 8.7 | 3.6 |
| 2 | 17.8 | 9.5 | 8.4 |
| 3 | 33.5 | 25.8 | 7.8 |
| 4 | 12.6 | 12.3 | 0.3 |
| 5 | 23.9 | 14.9 | 9.1 |
| 6 | 3.9 | 7.8 | −3.8 |
Publisher’s Note: MDPI stays neutral with regard to jurisdictional claims in published maps and institutional affiliations. |
© 2021 by the author. Licensee MDPI, Basel, Switzerland. This article is an open access article distributed under the terms and conditions of the Creative Commons Attribution (CC BY) license (https://creativecommons.org/licenses/by/4.0/).
Share and Cite
MDPI and ACS Style
Ferreira, R.N. Cut-Off Lows and Extreme Precipitation in Eastern Spain: Current and Future Climate. Atmosphere 2021, 12, 835. https://0-doi-org.brum.beds.ac.uk/10.3390/atmos12070835
AMA Style
Ferreira RN. Cut-Off Lows and Extreme Precipitation in Eastern Spain: Current and Future Climate. Atmosphere. 2021; 12(7):835. https://0-doi-org.brum.beds.ac.uk/10.3390/atmos12070835
Chicago/Turabian StyleFerreira, Rosana Nieto. 2021. "Cut-Off Lows and Extreme Precipitation in Eastern Spain: Current and Future Climate" Atmosphere 12, no. 7: 835. https://0-doi-org.brum.beds.ac.uk/10.3390/atmos12070835
Note that from the first issue of 2016, this journal uses article numbers instead of page numbers. See further details here.