
Impact of Land Cover Composition and Structure on Air Temperature Based on the Local Climate Zone Scheme in Hangzhou, China

Abstract
:1. Introduction
2. Methodology
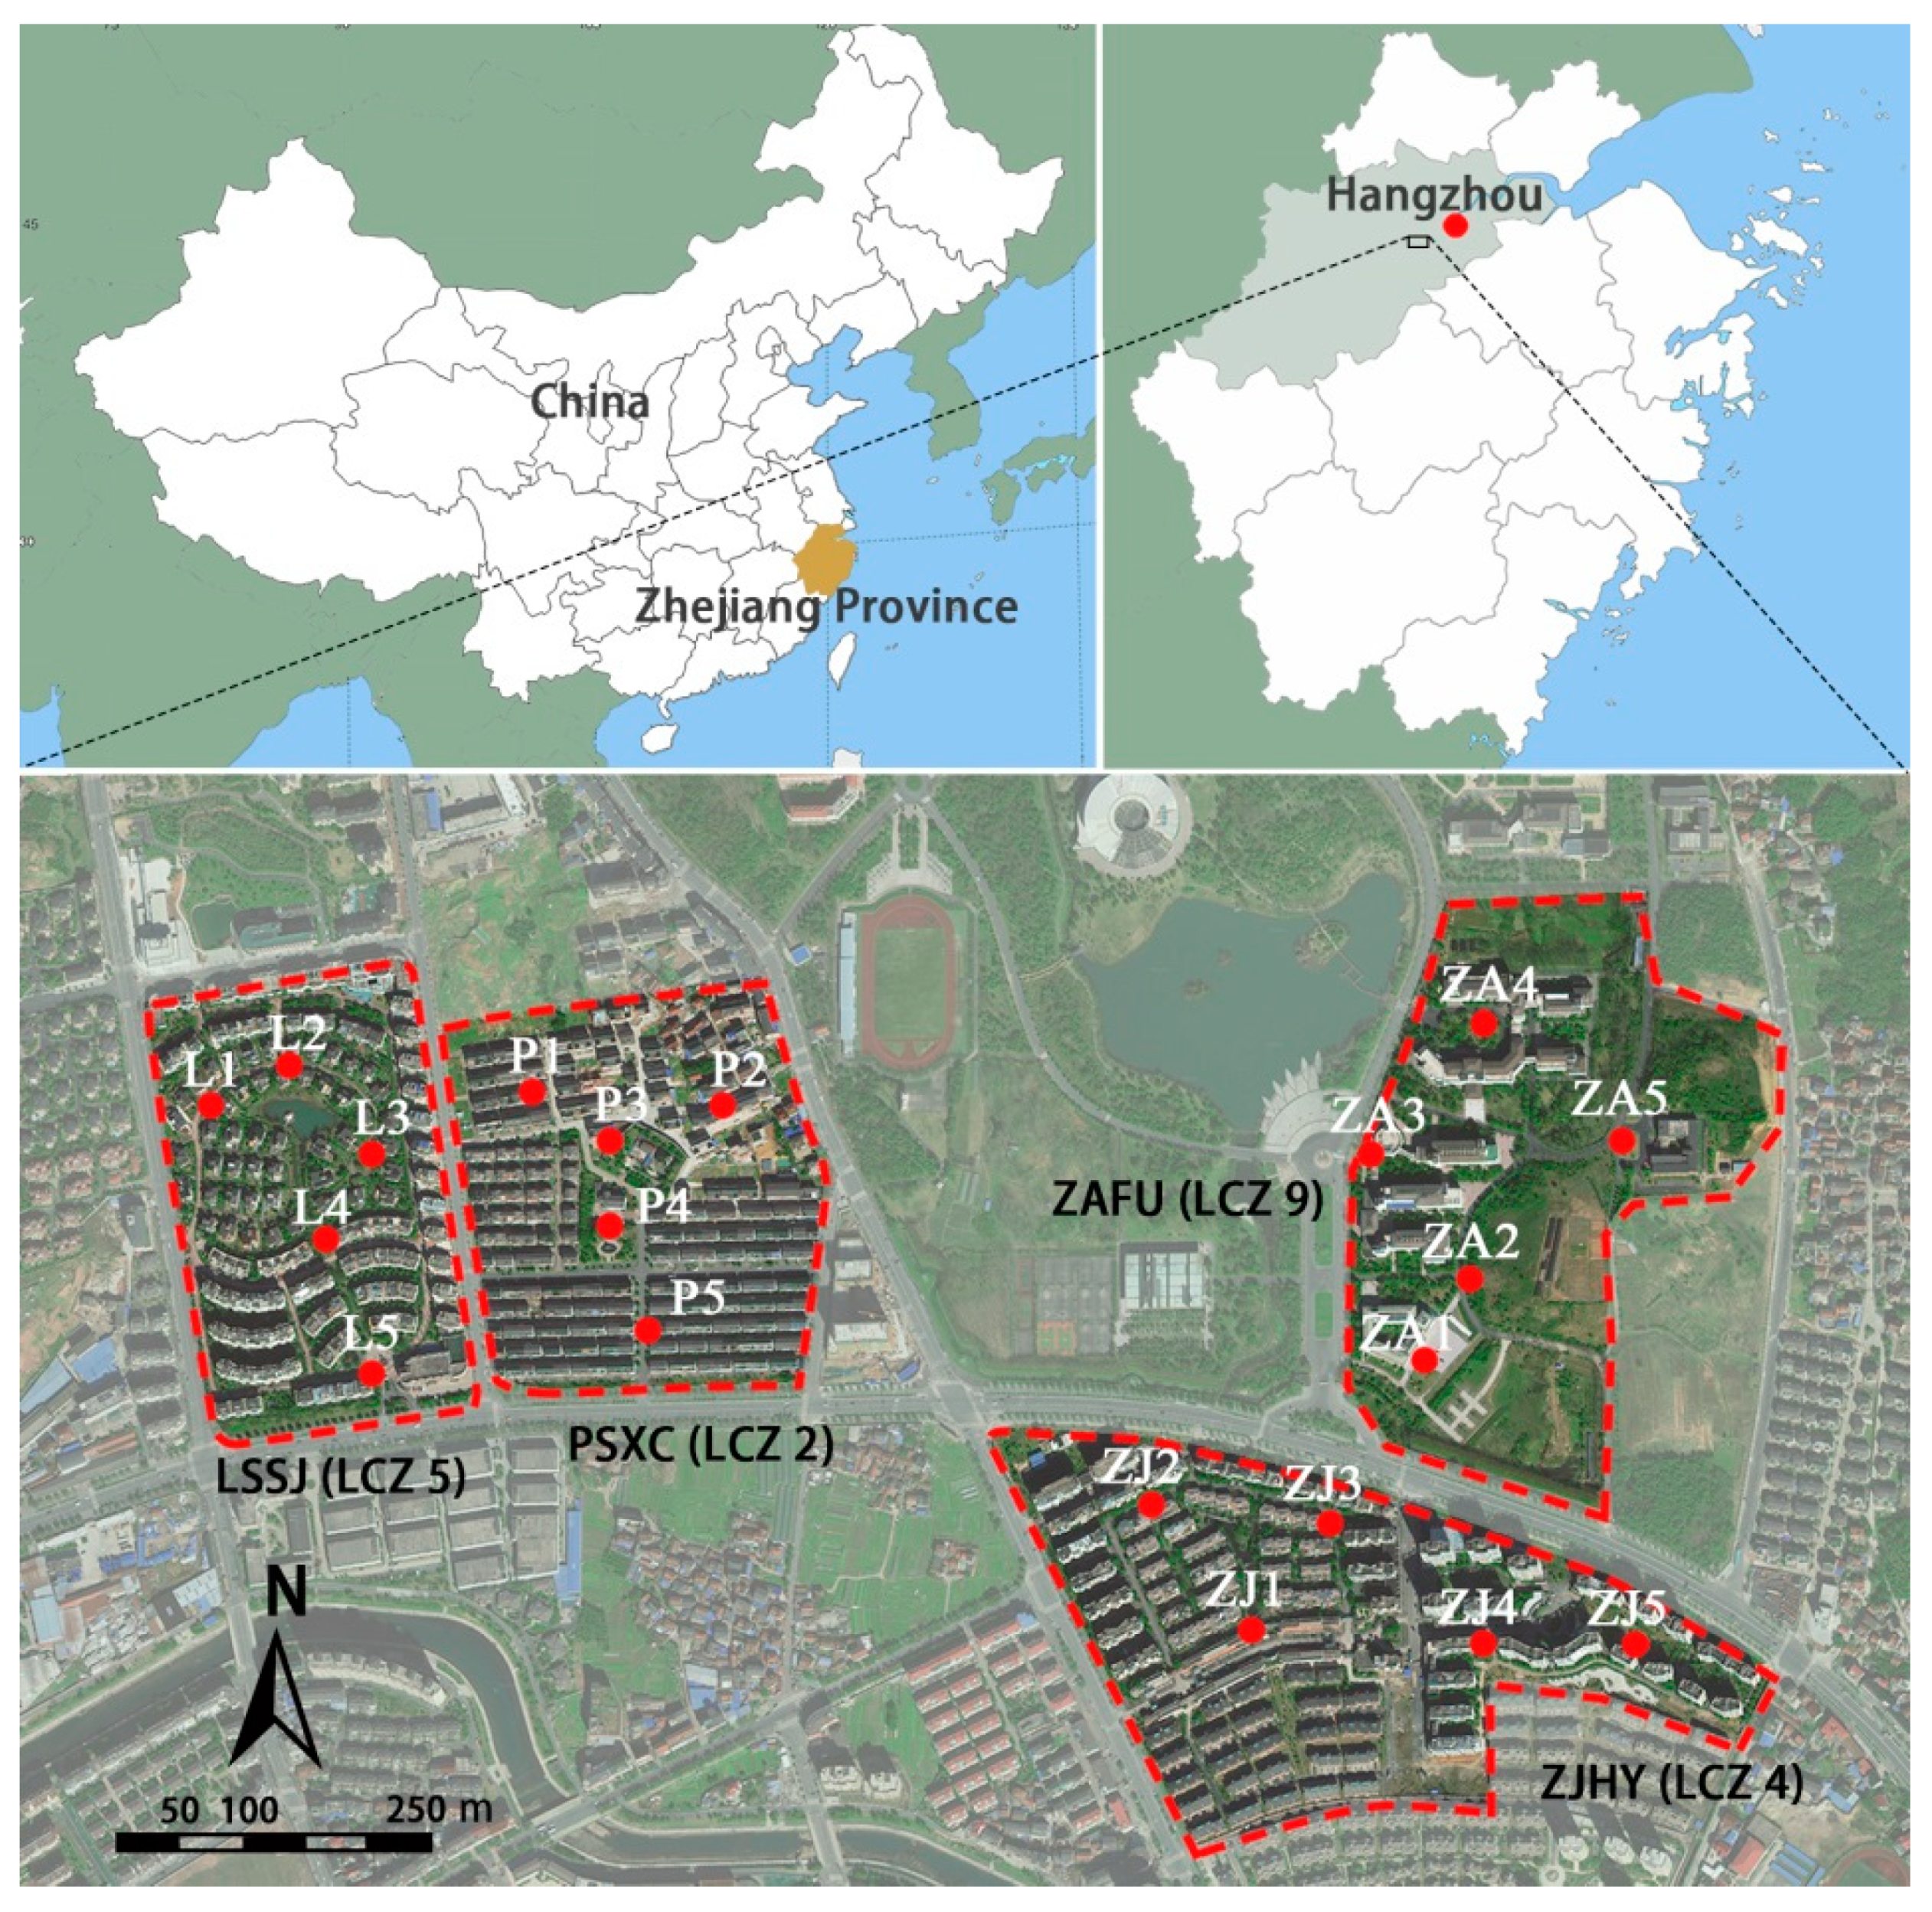
2.1. Study Area
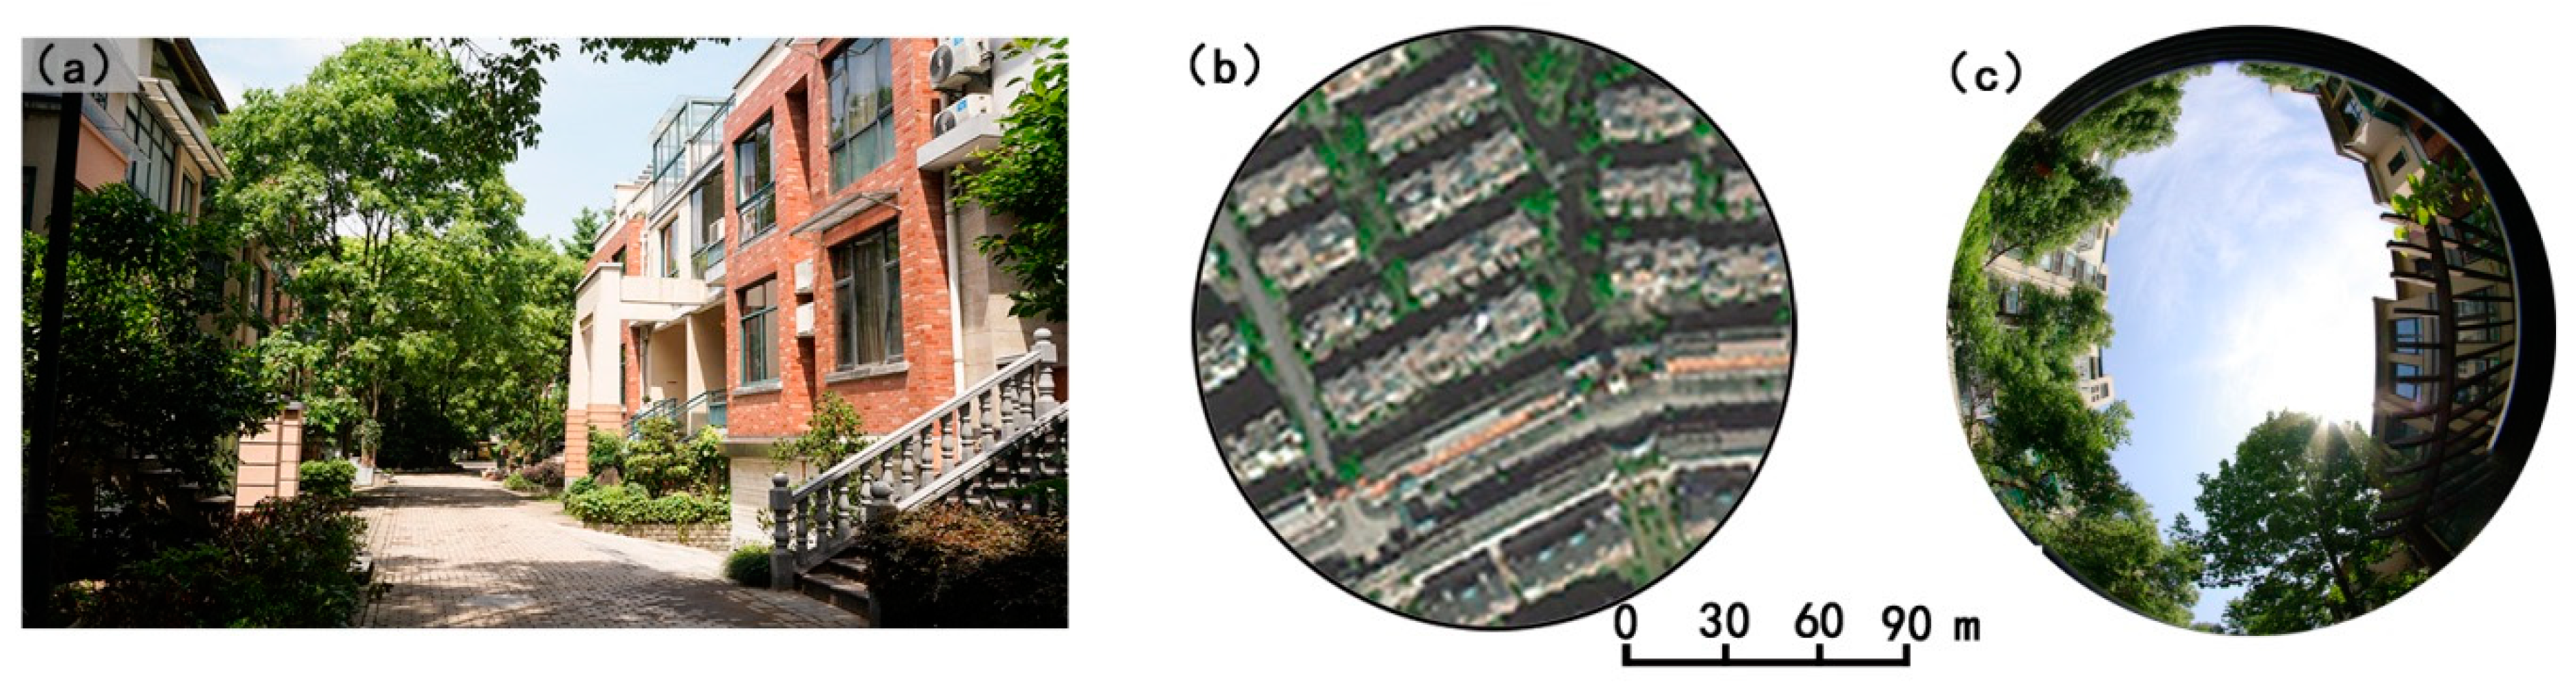
2.2. Field Measurements
2.3. Land Cover Parameters Measurement and Calculation
2.4. Data Analysis
3. Results
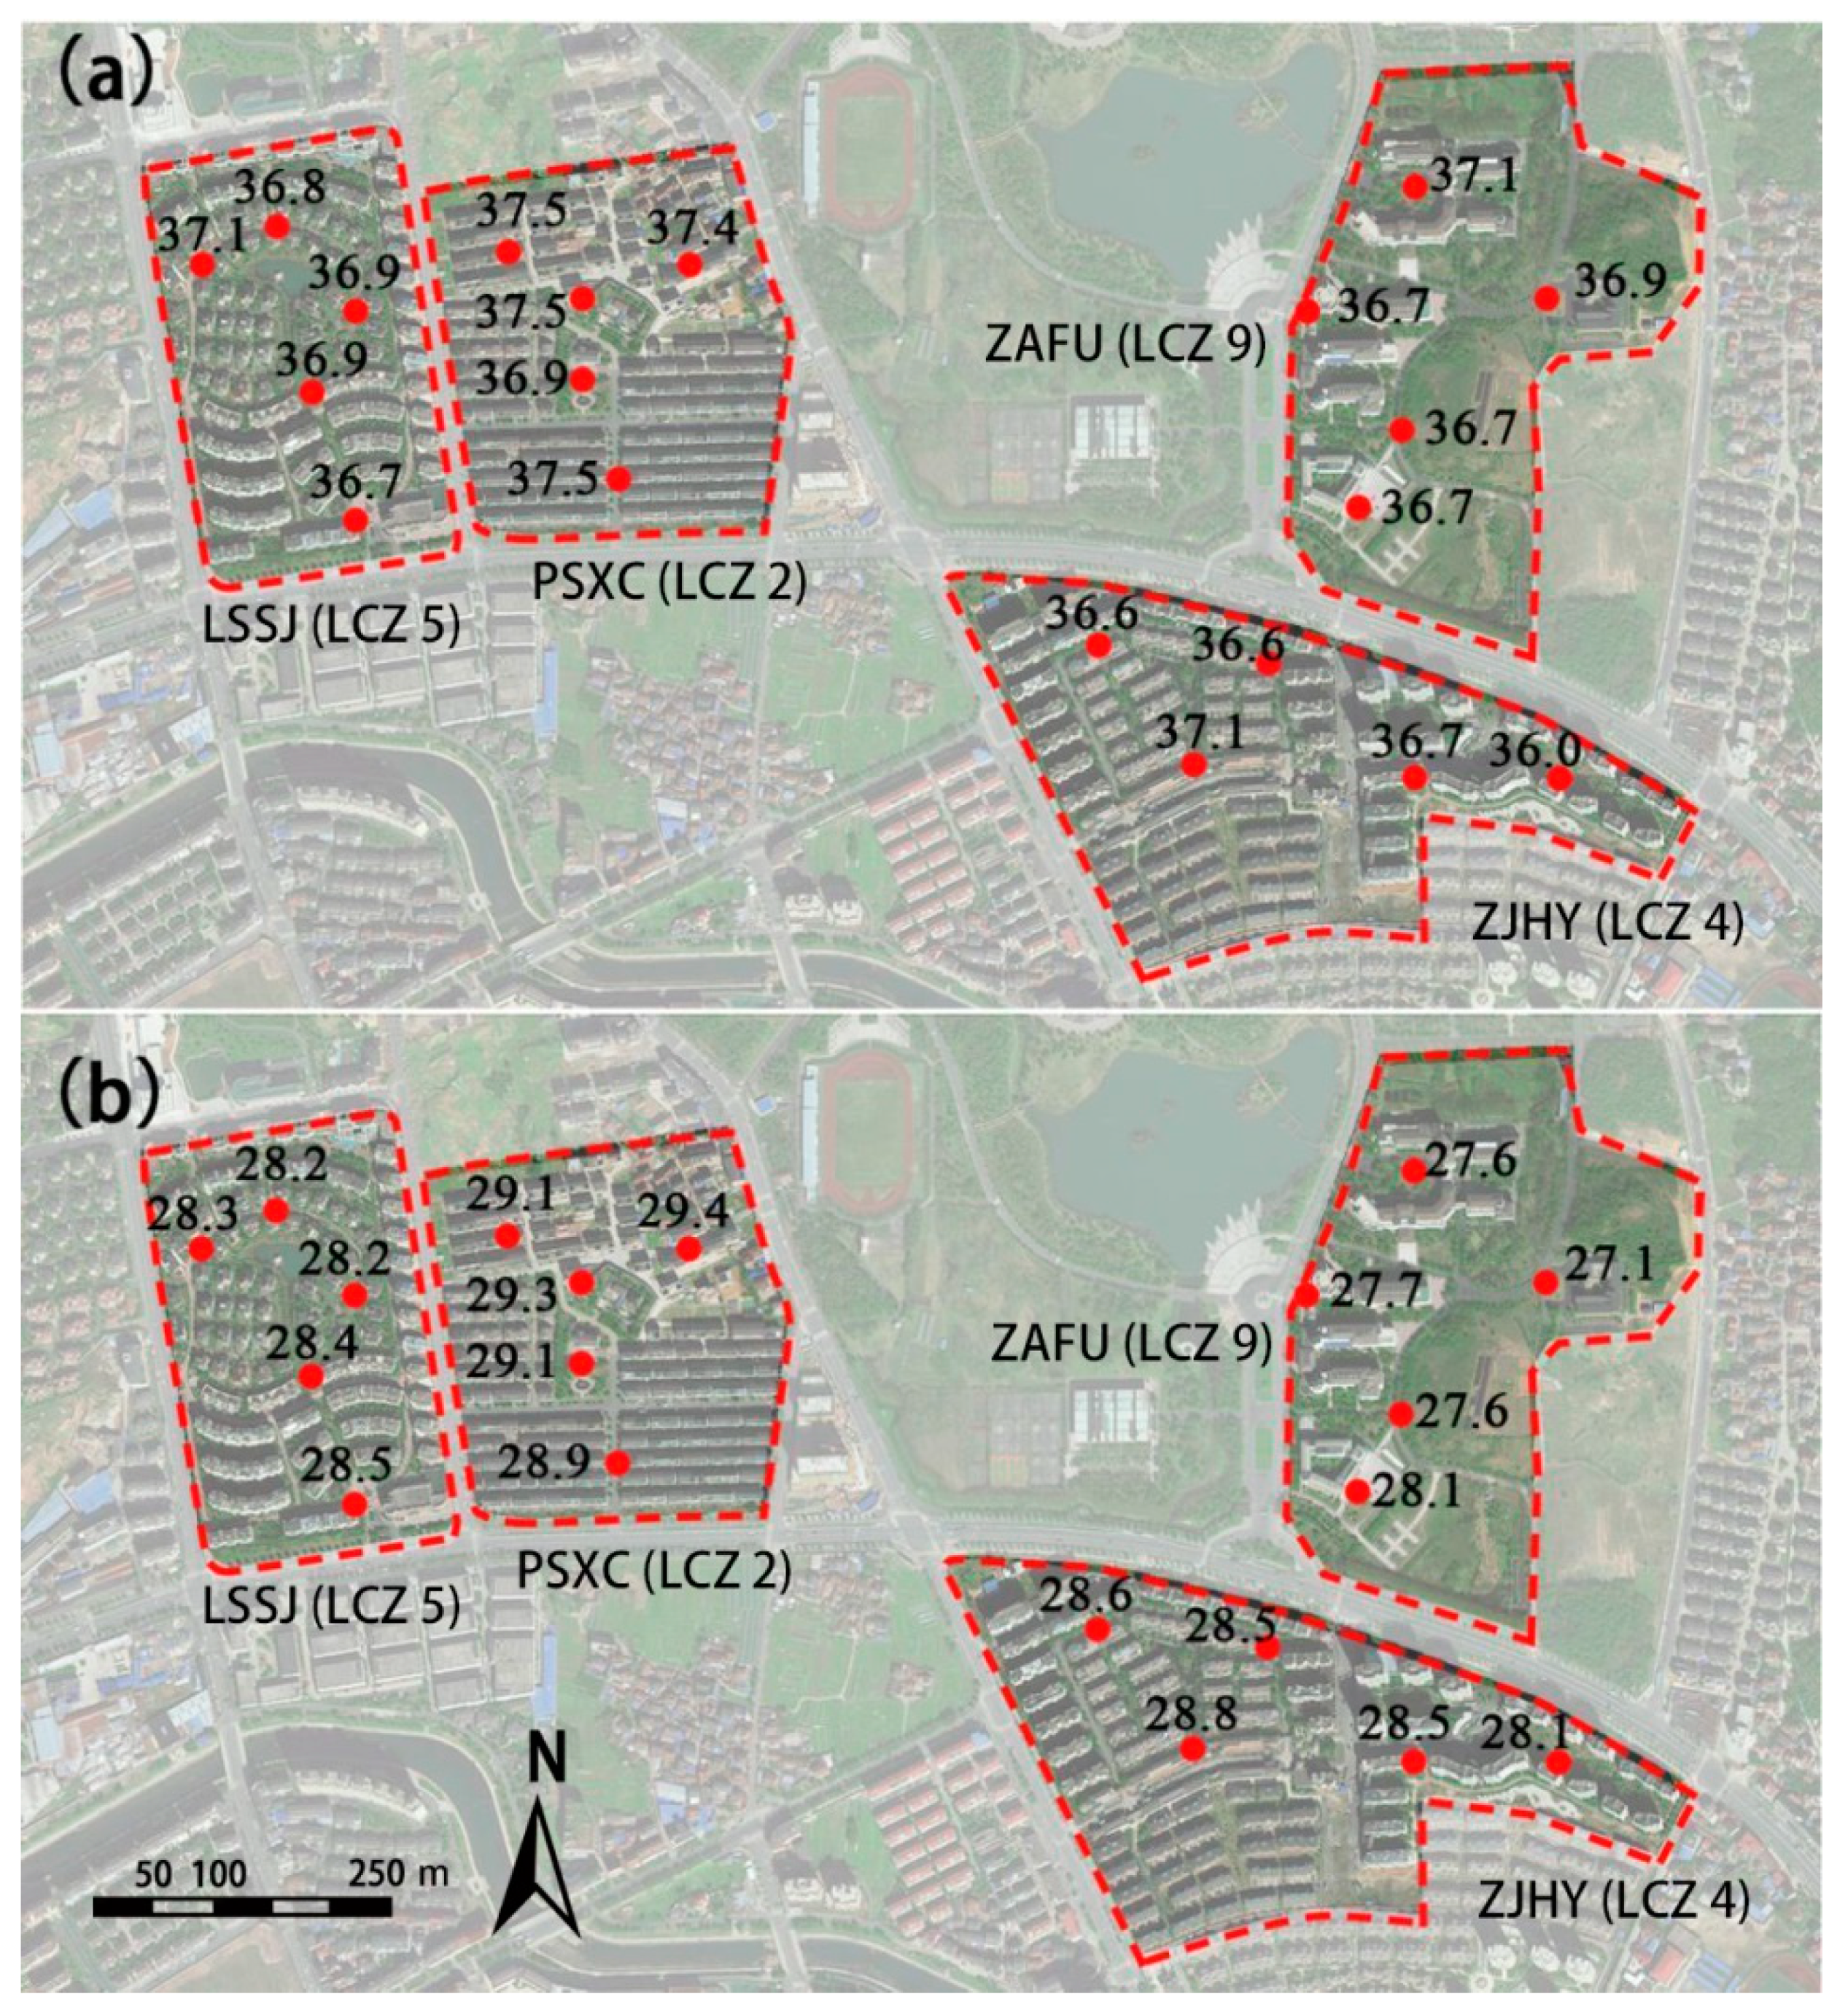
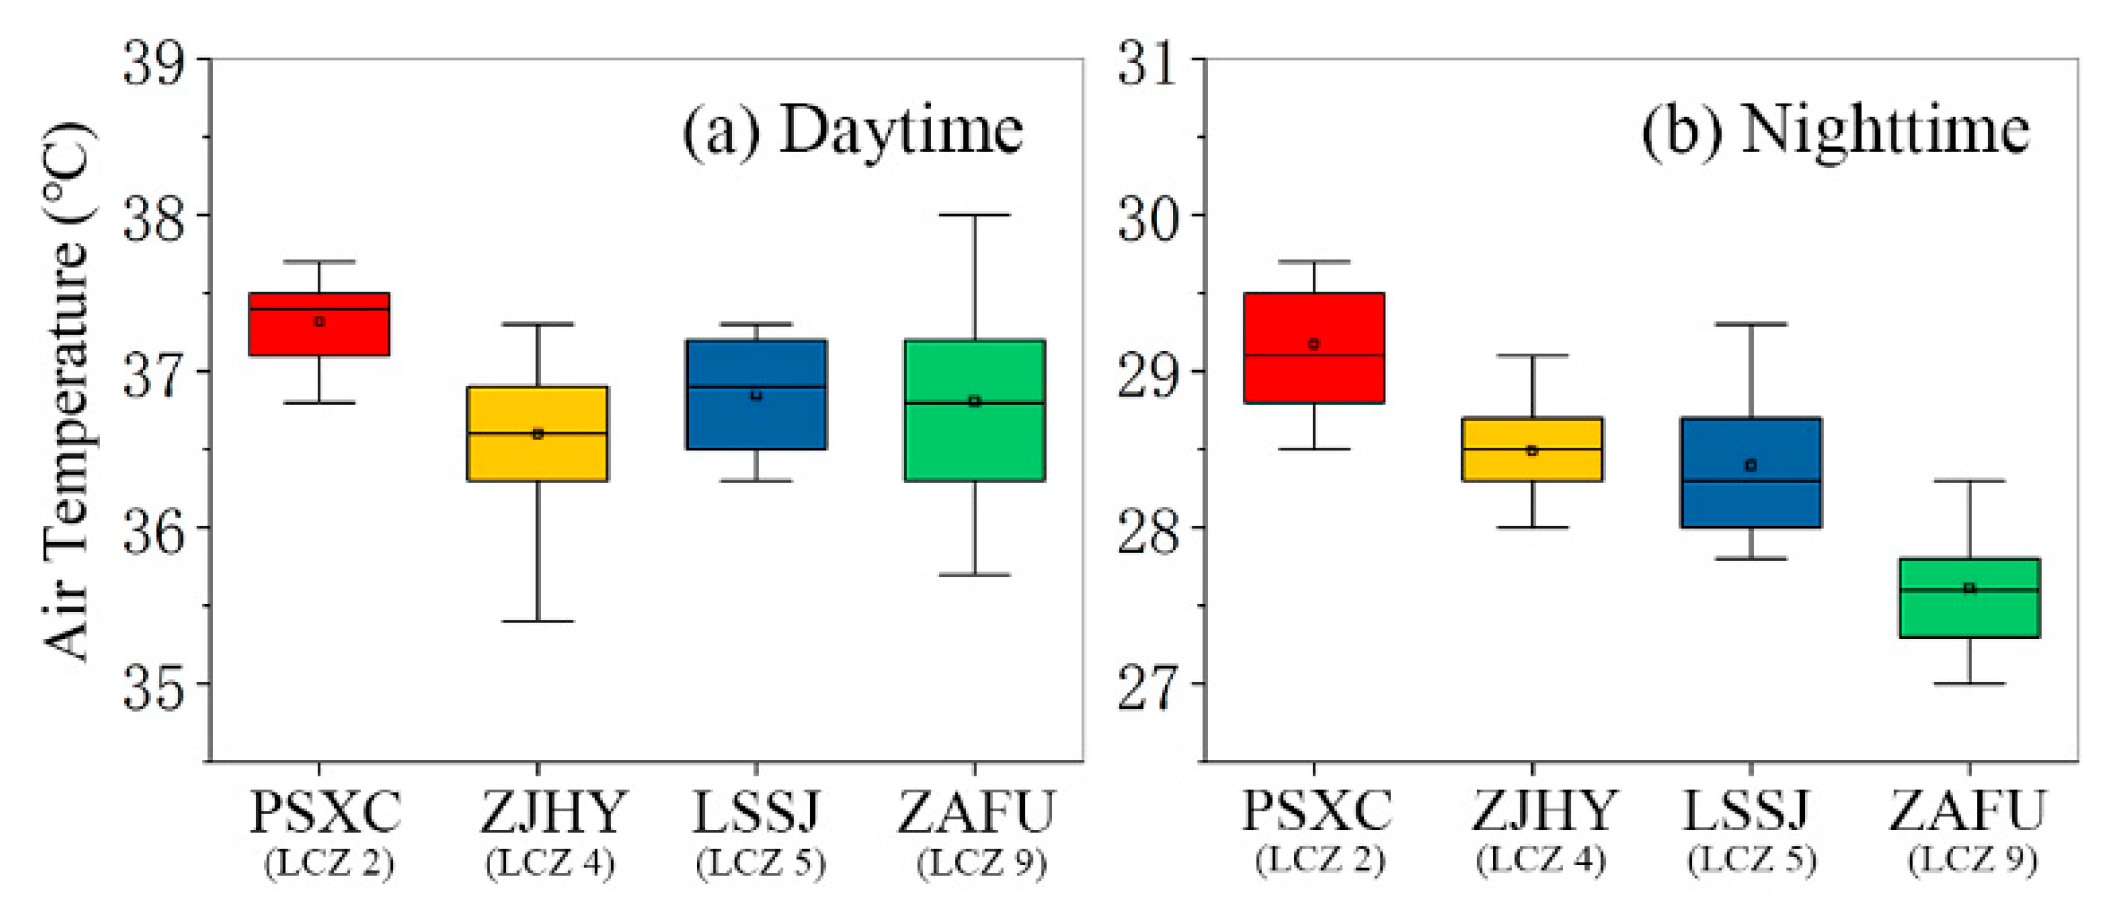
3.1. Thermal Performance within and between Different LCZs
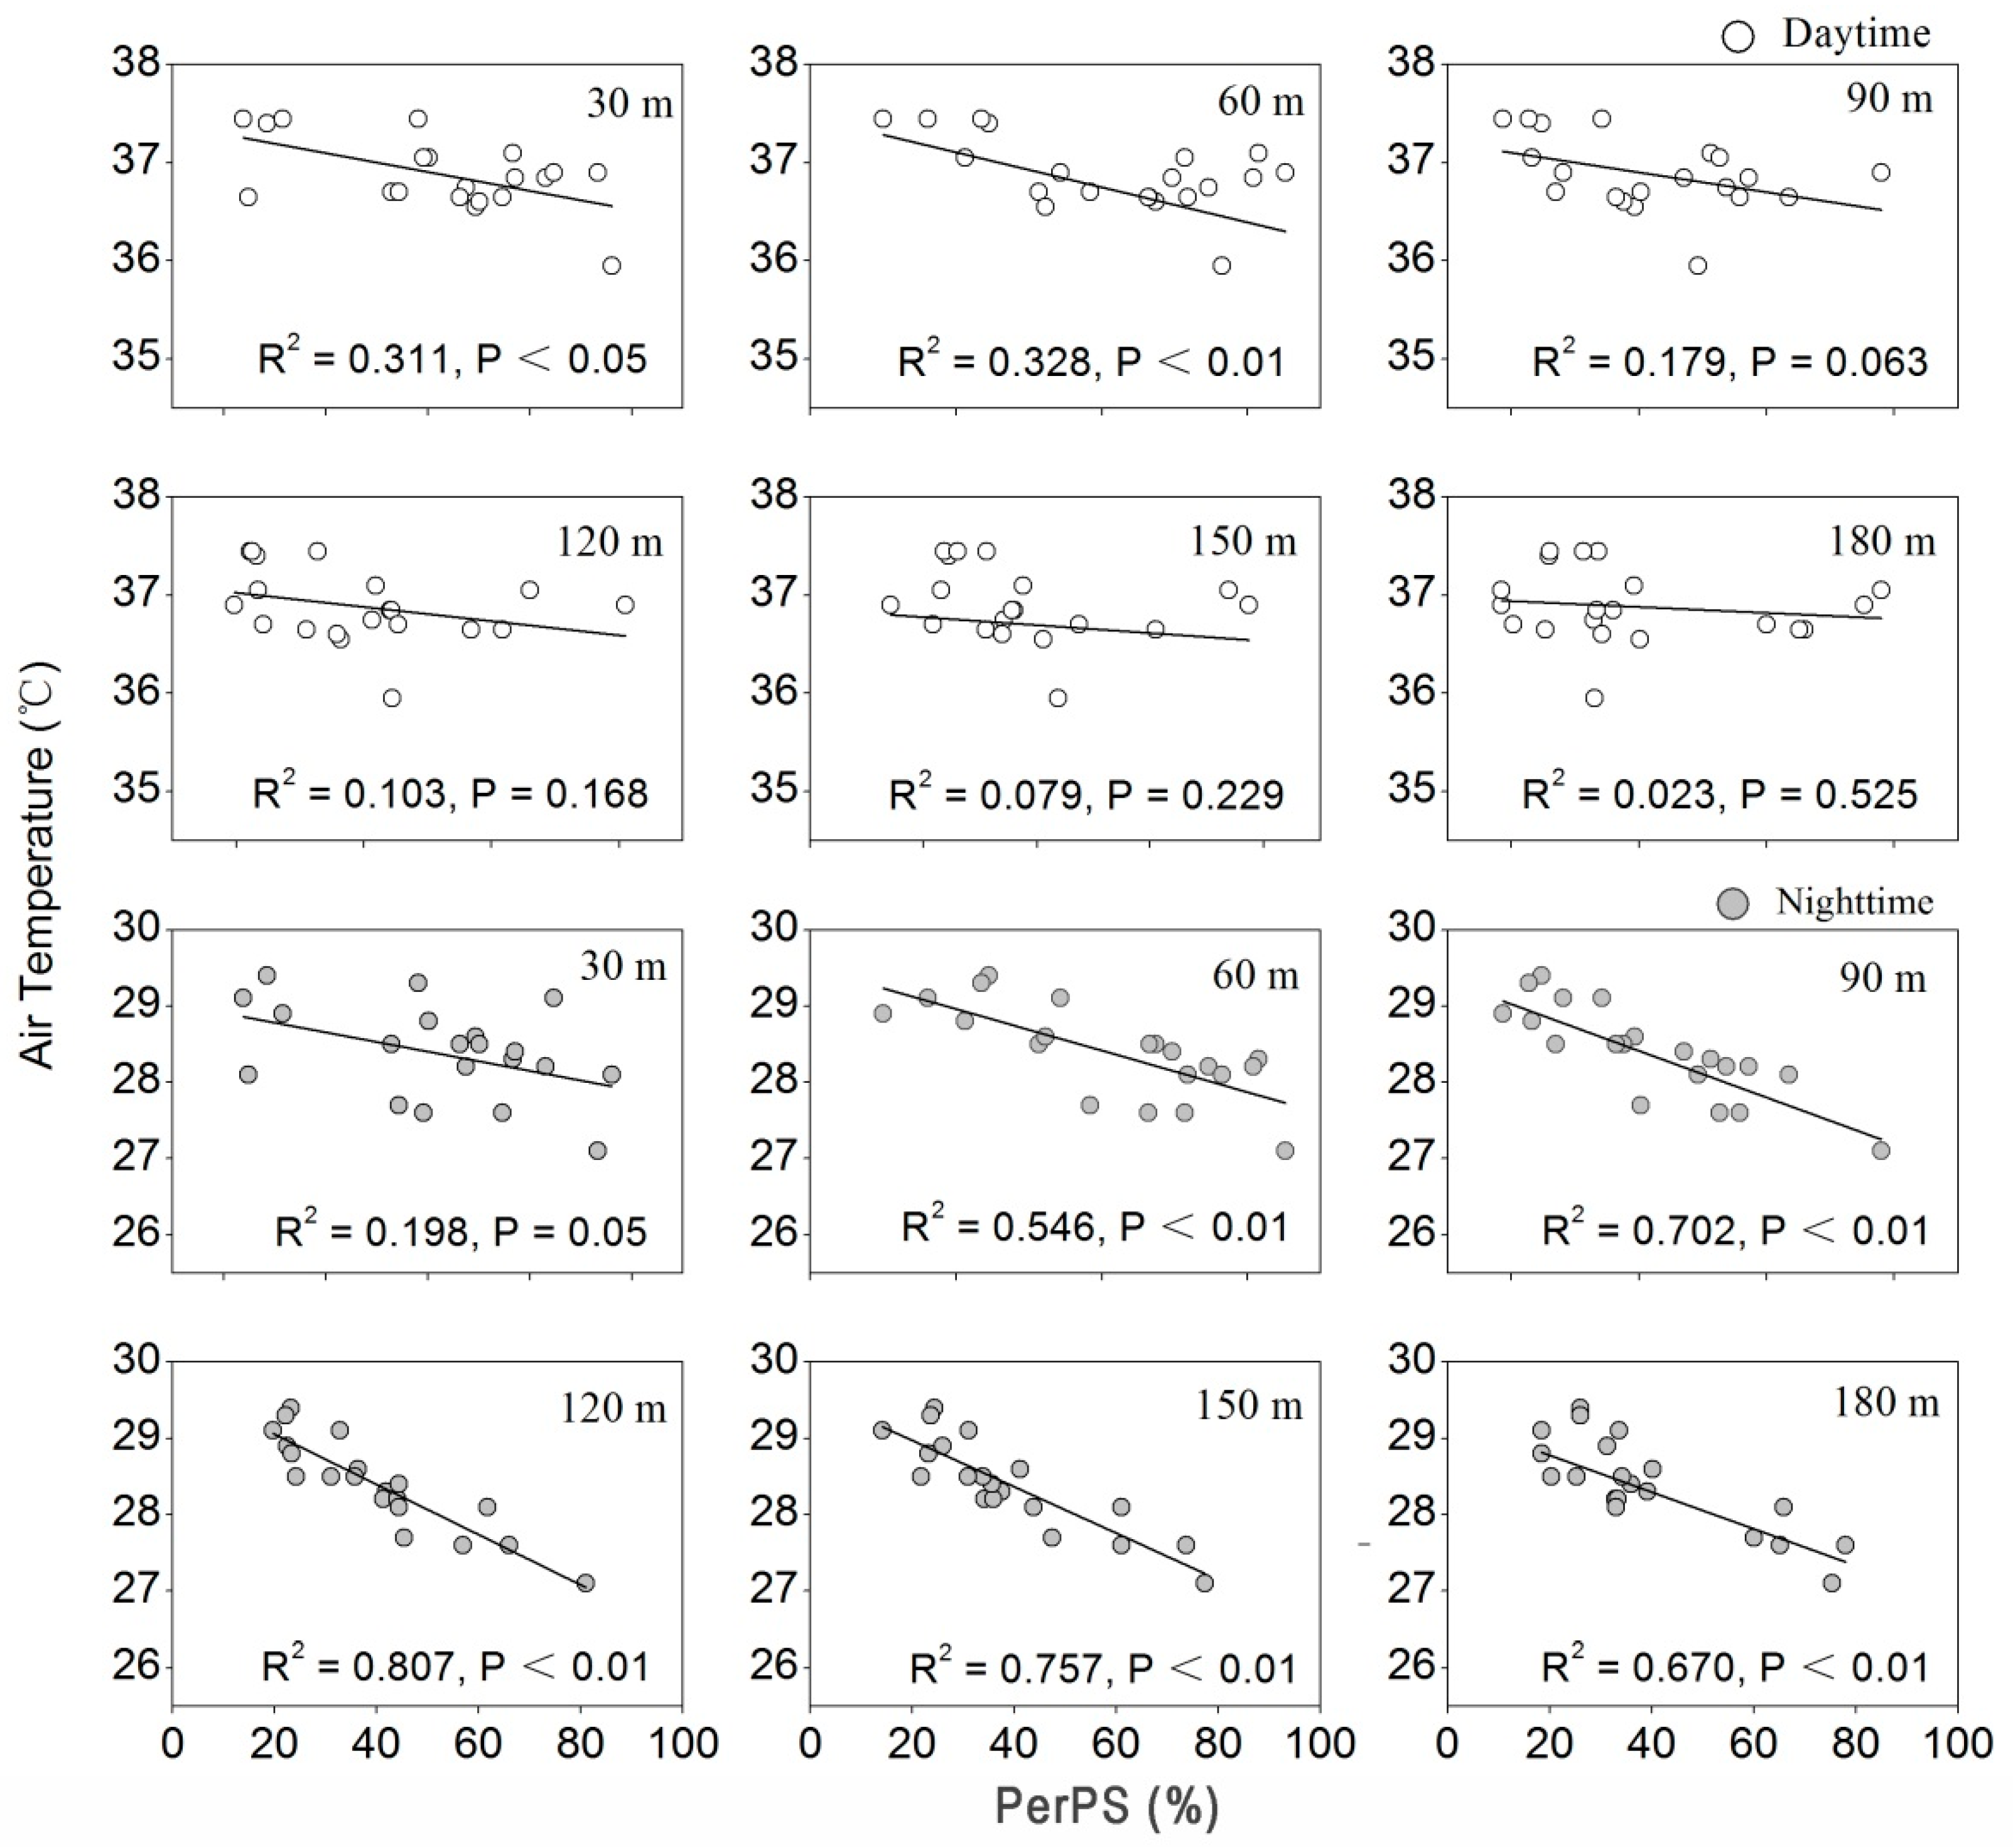
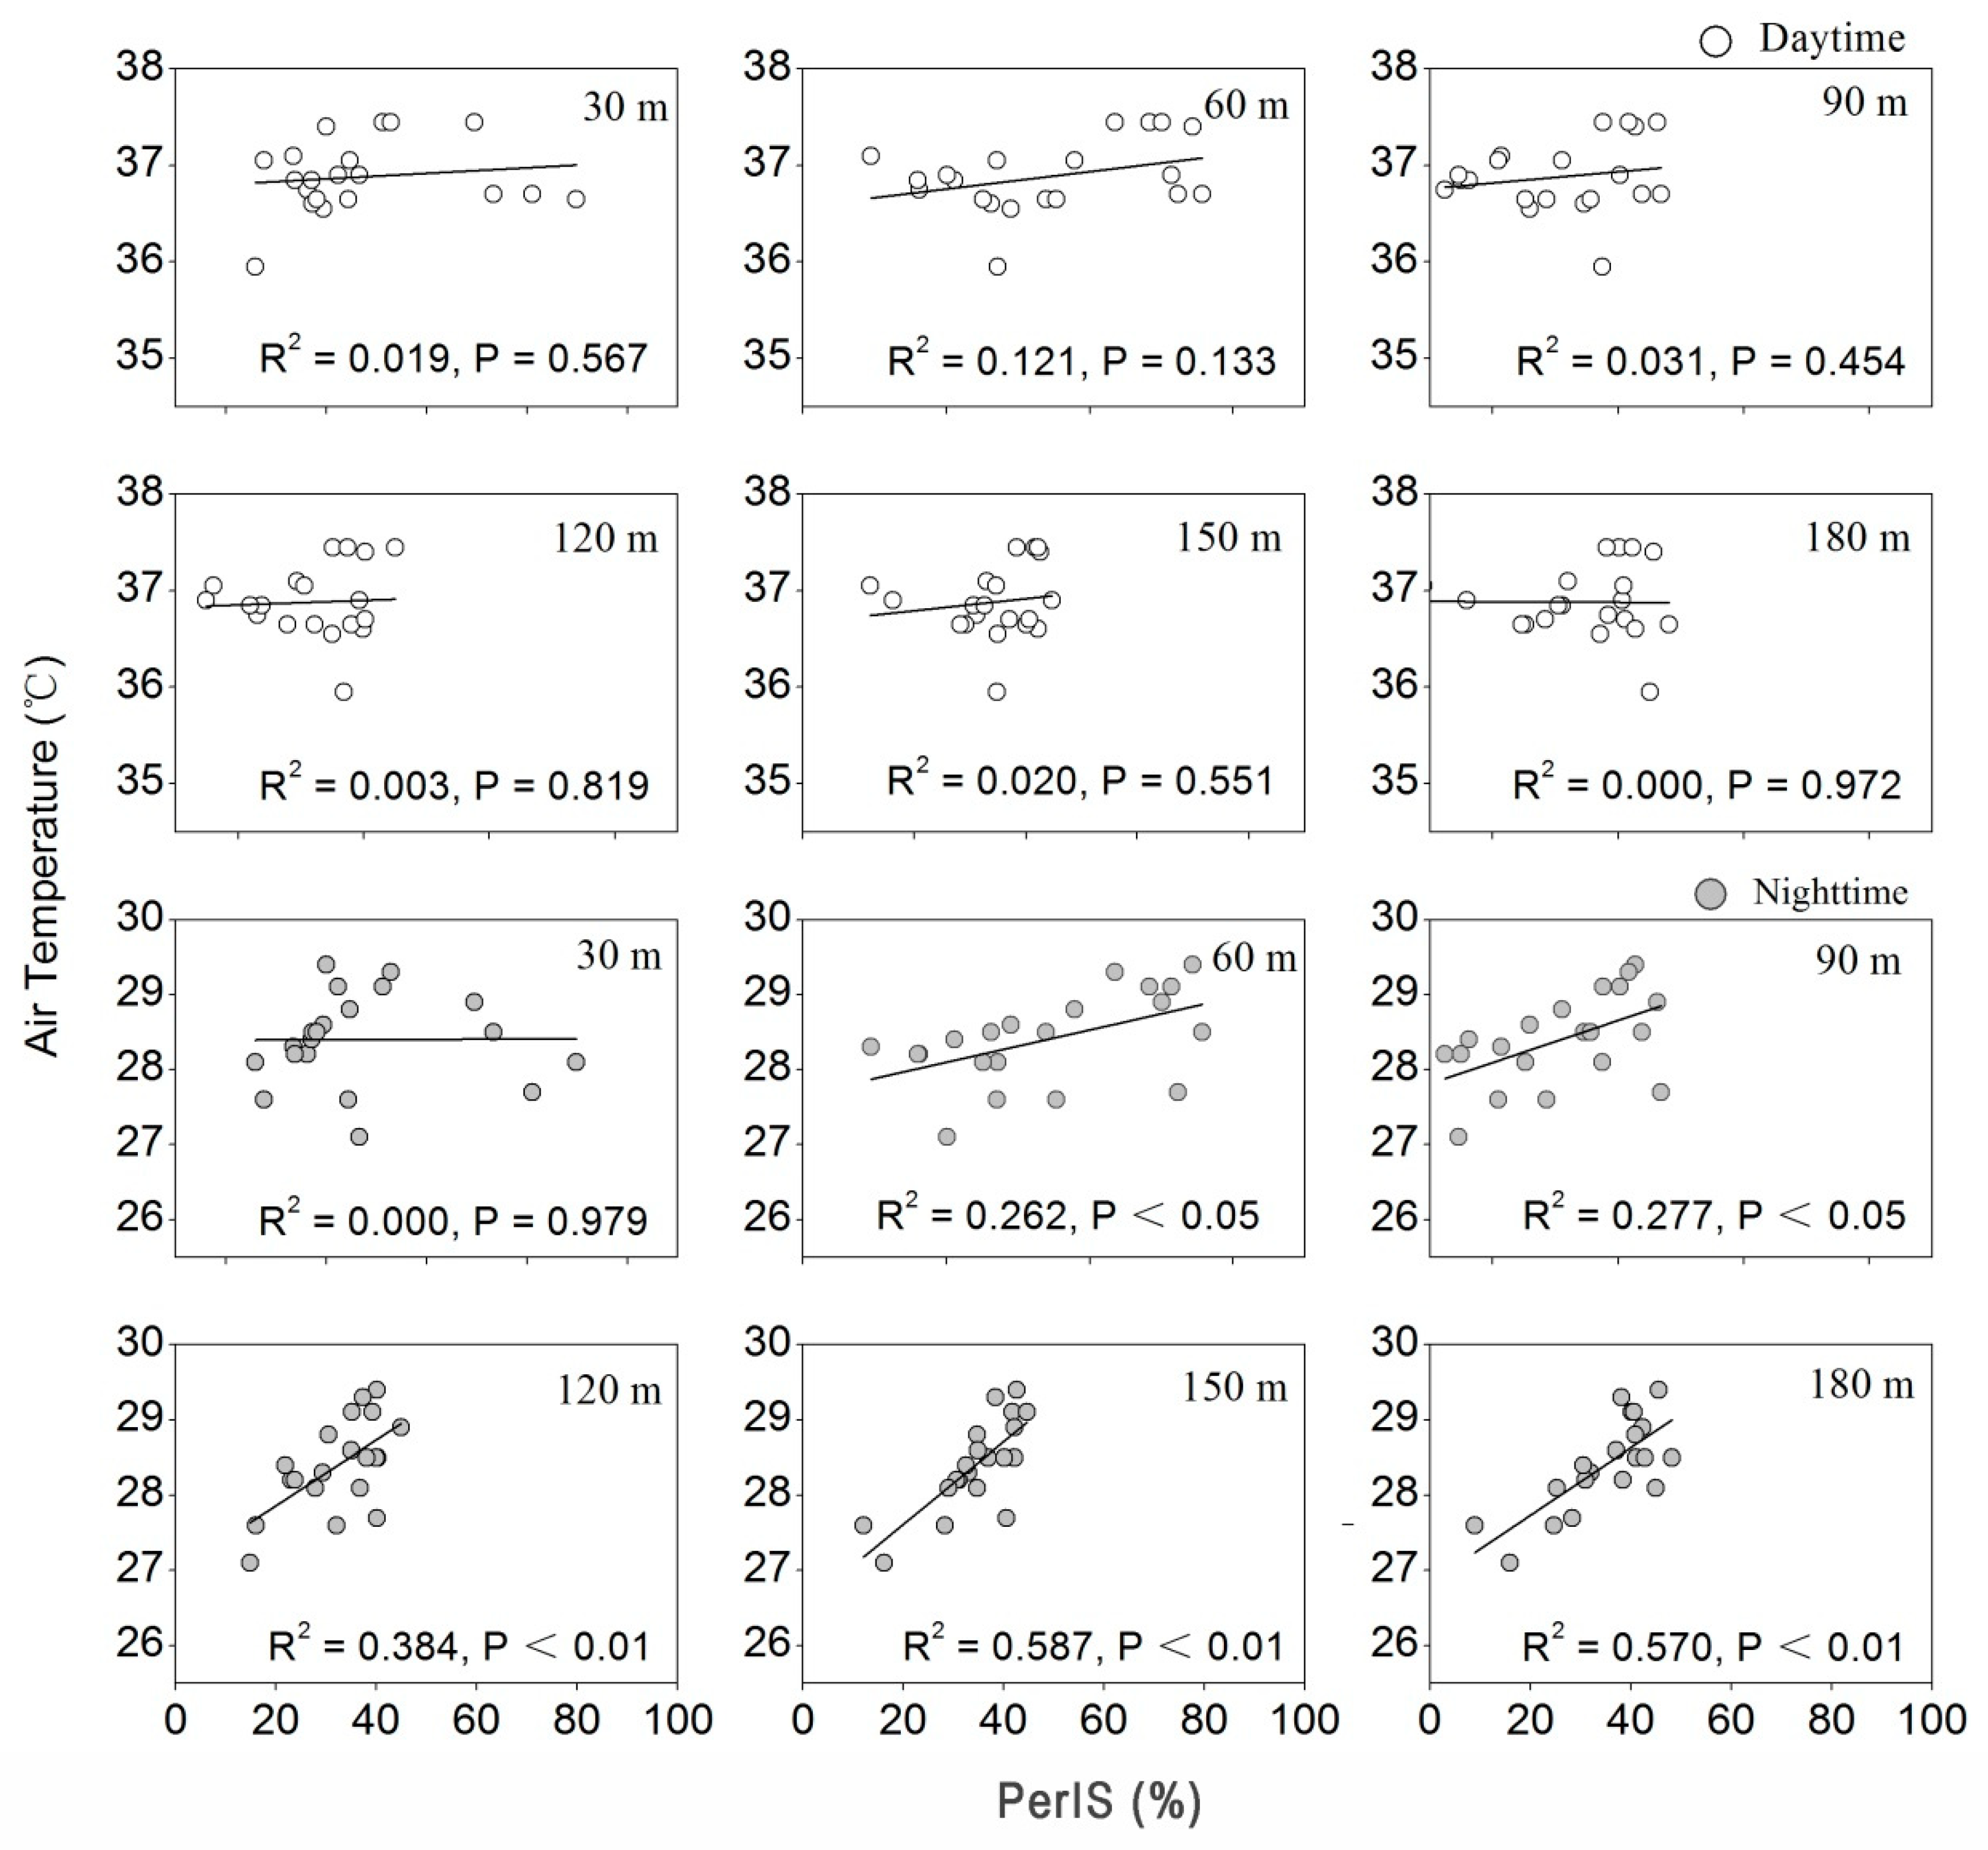
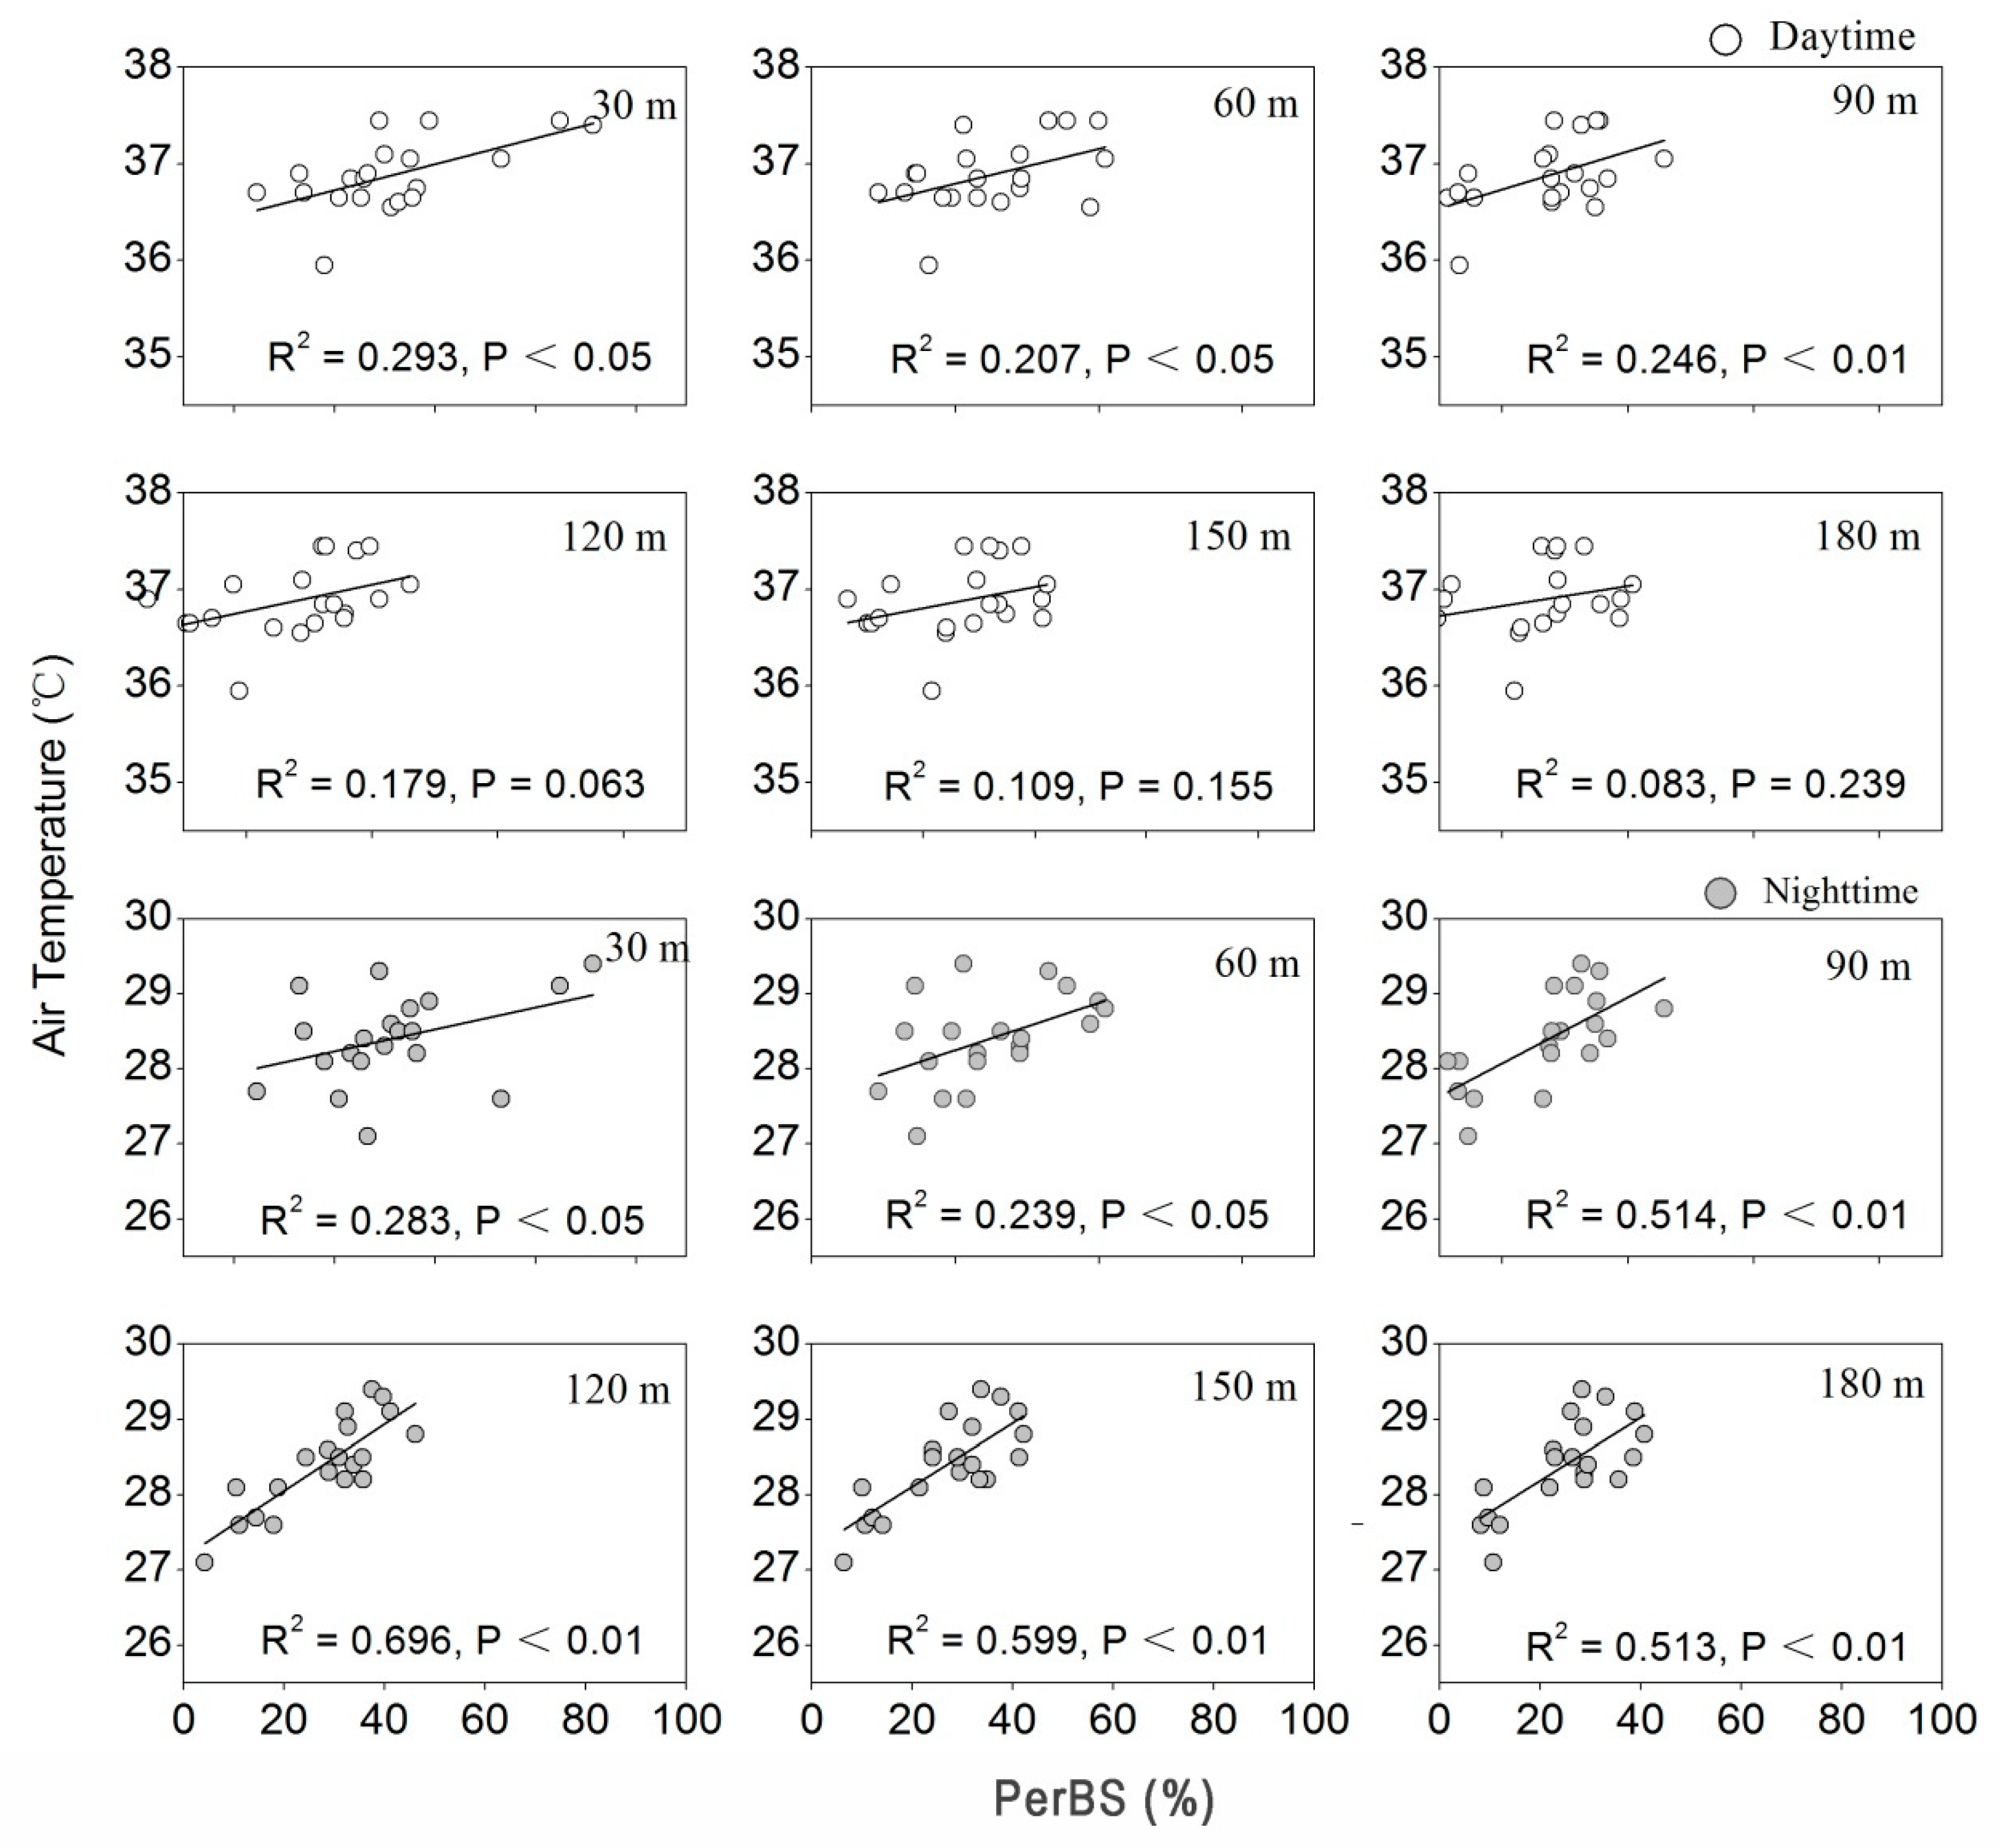
3.2. The Relationship between Air Temperature and Land Cover Composition
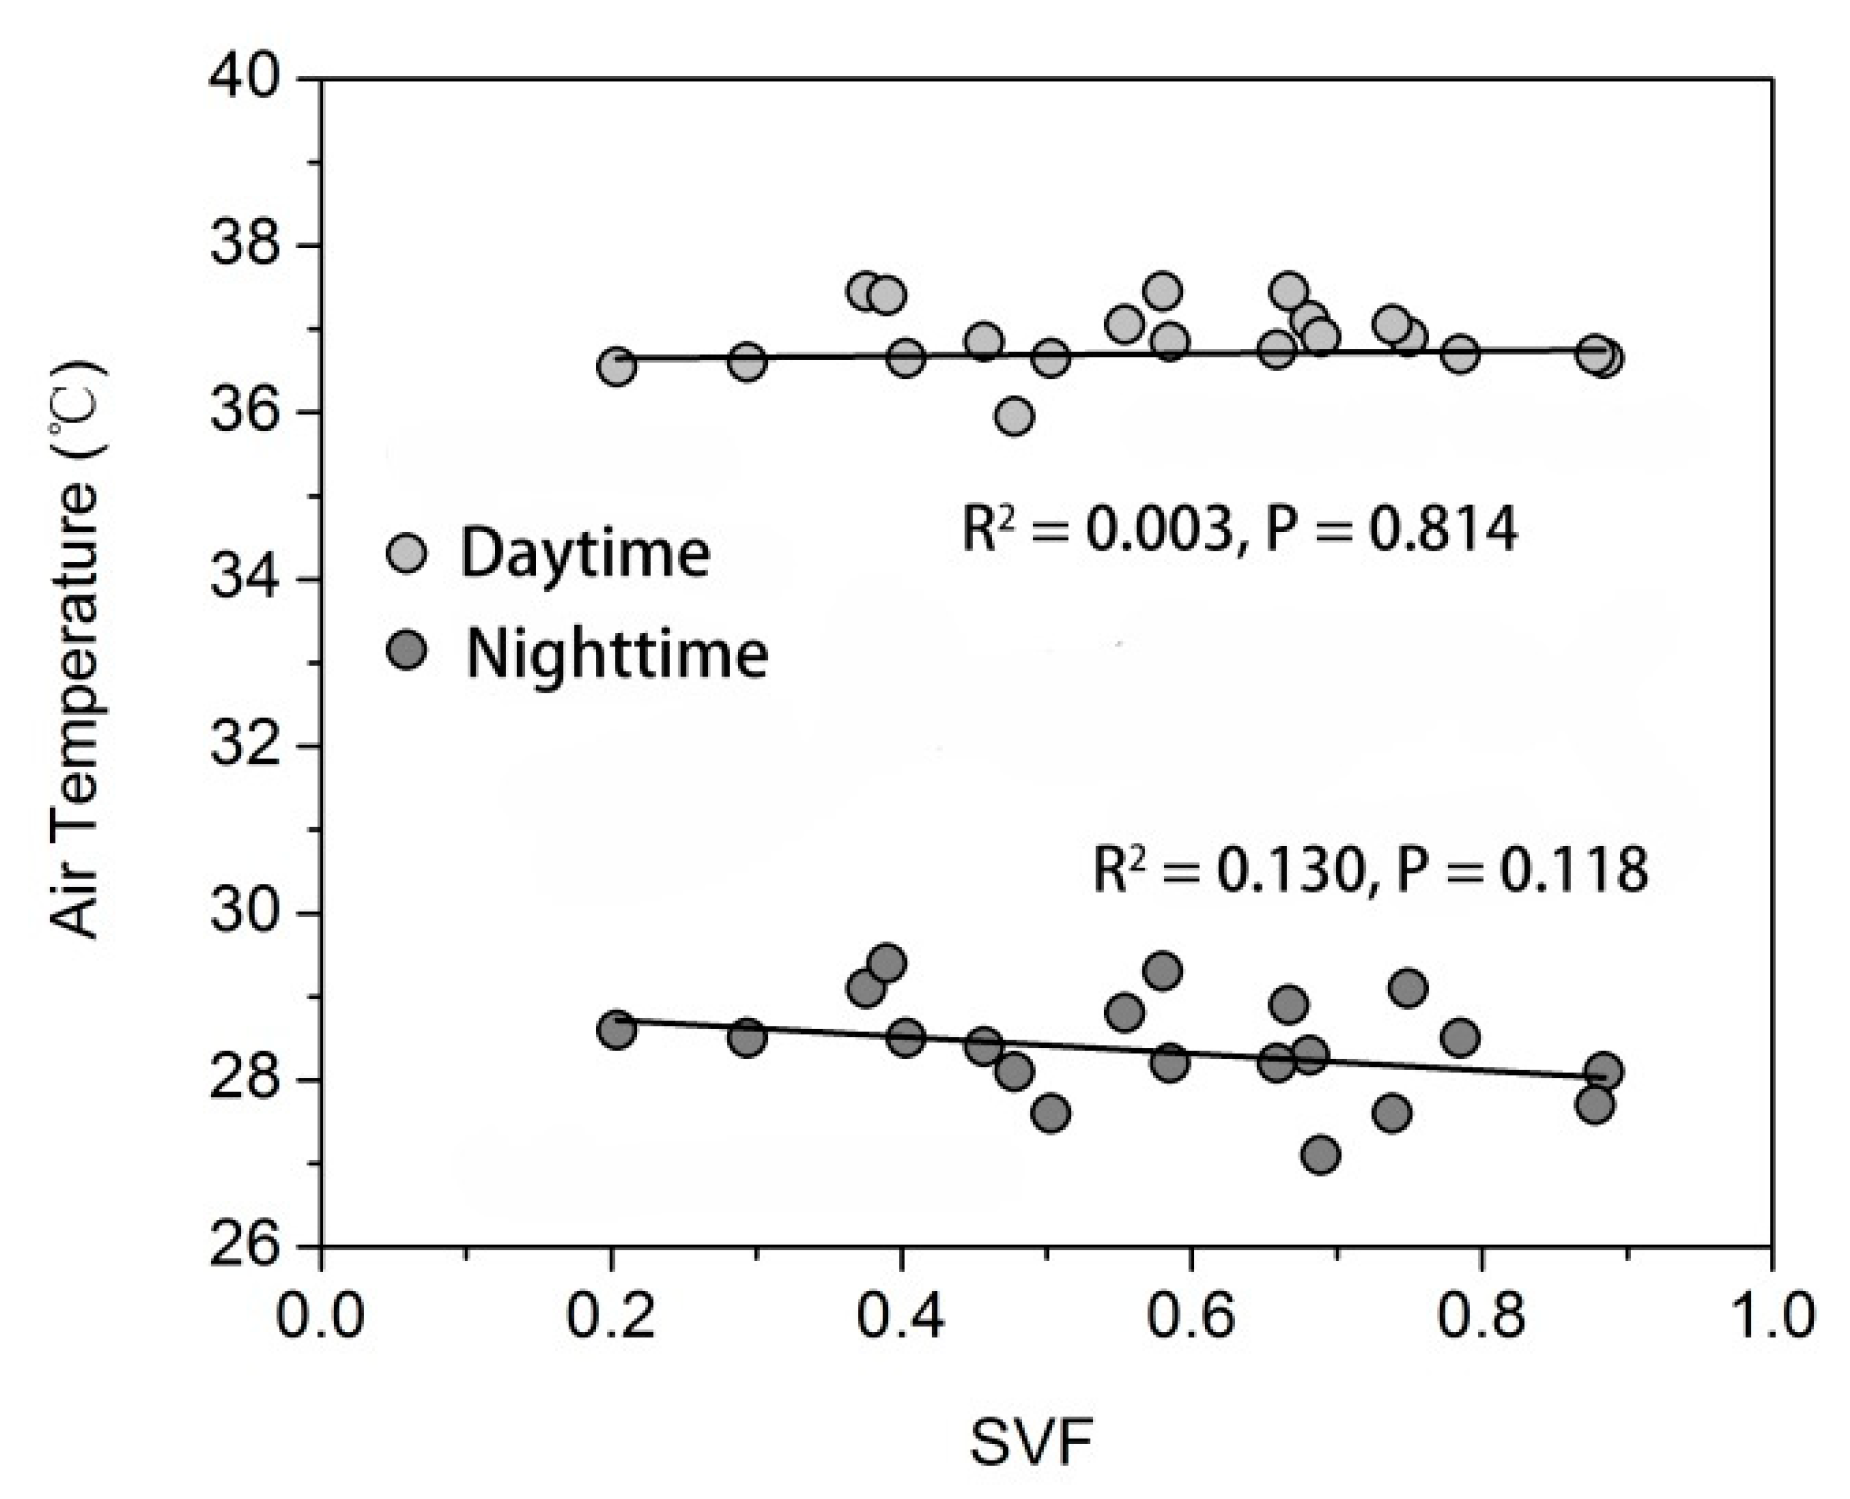
3.3. The Relationship between Air Temperature and Land Cover Structure
4. Discussion
4.1. Thermal Performance of Different LCZs
4.2. Effects of Land Cover Features on Outdoor Thermal Performance
5. Conclusions
Author Contributions
Funding
Institutional Review Board Statement
Informed Consent Statement
Data Availability Statement
Conflicts of Interest
References
- Voogt, J.A.; Oke, T.R. Thermal remote sensing of urban climates. Remote Sens. Environ. 2003, 86, 370–384. [Google Scholar] [CrossRef]
- Peng, S.; Piao, S.; Ciais, P.; Friedlingstein, P.; Ottle, C.; Bréon, F.-M.; Nan, H.; Zhou, L.; Myneni, R.B. Surface urban heat island across 419 global big cities. Environ. Sci. Technol. 2011, 46, 696–703. [Google Scholar] [CrossRef]
- Levermore, G.; Parkinson, J.; Lee, K.; Laycock, P.; Lindley, S. The increasing trend of the urban heat island intensity. Urban Clim. 2018, 24, 360–368. [Google Scholar] [CrossRef]
- Yadav, N.; Sharma, C. Spatial variations of intra-city urban heat island in megacity Delhi. Sustain. Cities Soc. 2018, 37, 298–306. [Google Scholar] [CrossRef]
- Tan, J.; Zheng, Y.; Tang, X.; Guo, C.; Li, L.; Song, G.; Zhen, X.; Yuan, D.; Kalkstein, A.J.; Li, F.; et al. The urban heat island and its impact on heat waves and human health in Shanghai. Int. J. Biometeorol. 2010, 54, 75–84. [Google Scholar] [CrossRef]
- Chen, F.; Yang, X.; Zhu, W. WRF simulations of urban heat island under hot-weather synoptic conditions: The case study of Hangzhou City, China. Atmos. Res. 2014, 138, 364–377. [Google Scholar] [CrossRef]
- Oleson, K.W.; Monaghan, A.; Wilhelmi, O.; Barlage, M.; Brunsell, N.; Feddema, J.; Hu, L.; Steinhoff, D.F. Interactions between urbanization, heat stress, and climate change. Clim. Chang. 2015, 129, 525–541. [Google Scholar] [CrossRef]
- Santamouris, M.; Cartalis, C.; Synnefa, A.; Kolokotsa, D. On the impact of urban heat island and global warming on the power demand and electricity consumption of buildings—A review. Energy Build. 2015, 98, 119–124. [Google Scholar] [CrossRef]
- Yang, J.; Yin, P.; Sun, J.; Wang, B.; Zhou, M.; Li, M.; Tong, S.; Meng, B.; Guo, Y.; Liu, Q. Heatwave and mortality in 31 major Chinese cities: Definition, vulnerability and implications. Sci. Total Environ. 2019, 649, 695–702. [Google Scholar] [CrossRef]
- Cao, Q.; Yu, D.; Georgescu, M.; Wu, J.; Wang, W. Impacts of future urban expansion on summer climate and heat-related human health in eastern China. Environ. Int. 2018, 112, 134–146. [Google Scholar] [CrossRef]
- Coseo, P.; Larsen, L. How factors of land use/land cover, building configuration, and adjacent heat sources and sinks explain Urban Heat Islands in Chicago. Landsc. Urban Plan. 2014, 125, 117–129. [Google Scholar] [CrossRef]
- Doick, K.J.; Peace, A.; Hutchings, T.R. The role of one large greenspace in mitigating London’s nocturnal urban heat island. Sci. Total Environ. 2014, 493, 662–671. [Google Scholar] [CrossRef] [PubMed]
- Coccolo, S.; Kämpf, J.; Mauree, D.; Scartezzini, J.-L. Cooling potential of greening in the urban environment, a step further towards practice. Sustain. Cities Soc. 2018, 38, 543–559. [Google Scholar] [CrossRef]
- Farhadi, H.; Faizi, M.; Sanaieian, H. Mitigating the urban heat island in a residential area in Tehran: Investigating the role of vegetation, materials, and orientation of buildings. Sustain. Cities Soc. 2019, 46. [Google Scholar] [CrossRef]
- Sun, S.; Xu, X.; Lao, Z.; Liu, W.; Li, Z.; Garcia, E.H.; He, L.; Zhu, J. Evaluating the impact of urban green space and landscape design parameters on thermal comfort in hot summer by numerical simulation. Build. Environ. 2017, 123, 277–288. [Google Scholar] [CrossRef]
- Quanz, J.; Ulrich, S.; Fenner, D.; Holtmann, A.; Eimermacher, J. Micro-scale variability of air temperature within a local climate zone in Berlin, Germany, during summer. Climate 2018, 6, 5. [Google Scholar] [CrossRef] [Green Version]
- Yan, H.; Fan, S.; Guo, C.; Hu, J.; Dong, L. Quantifying the impact of land cover composition on intra-urban air temperature variations at a mid-latitude city. PLoS ONE 2014, 9, e102124. [Google Scholar] [CrossRef]
- Xu, D.; Zhou, D.; Wang, Y.; Xu, W.; Yang, Y. Field measurement study on the impacts of urban spatial indicators on urban climate in a Chinese basin and static-wind city. Build. Environ. 2019, 147, 482–494. [Google Scholar] [CrossRef]
- Eliasson, I. Urban nocturnal temperatures, street geometry and land use. Atmos. Environ. 1996, 30, 379–392. [Google Scholar] [CrossRef]
- Vieira, H.; Vasconcelos, J. Urban morphology characterisation to include in a GIS for climatic purposes in Lisbon. Discussion of two different methods. In Proceedings of the 5th International Conference on Urban Climate, Łódź, Poland, 1–5 September 2003; Volume 2, pp. 417–420. [Google Scholar]
- Wu, Z.; Dou, P.; Chen, L. Comparative and combinative cooling effects of different spatial arrangements of buildings and trees on microclimate. Sustain. Cities Soc. 2019, 51. [Google Scholar] [CrossRef]
- Oke, T.R. Canyon geometry and the nocturnal urban heat island: Comparison of scale model and field observations. J. Clim. 1981, 1, 237–254. [Google Scholar] [CrossRef]
- Svensson, M.K. Sky view factor analysis—Implications for urban air temperature differences. Meteorol. Appl. 2004, 11, 201–211. [Google Scholar] [CrossRef]
- Unger, J. Intra-urban relationship between surface geometry and urban heat island: Review and new approach. Clim. Res. 2004, 27, 253–264. [Google Scholar] [CrossRef] [Green Version]
- Hart, M.A.; Sailor, D.J. Quantifying the influence of land-use and surface characteristics on spatial variability in the urban heat island. Theor. Appl. Climatol. 2009, 95, 397–406. [Google Scholar] [CrossRef]
- Stewart, I.D.; Oke, T.R. Local climate zones for urban temperature studies. Bull. Am. Meteorol. Soc. 2012, 93, 1879–1900. [Google Scholar] [CrossRef]
- Emmanuel, R.; Krüger, E. Urban heat island and its impact on climate change resilience in a shrinking city: The case of Glasgow, UK. Build. Environ. 2012, 53, 137–149. [Google Scholar] [CrossRef]
- Alexander, P.J.; Mills, G. Local climate classification and Dublin’s urban heat island. Atmosphere 2014, 5, 755–774. [Google Scholar] [CrossRef] [Green Version]
- Fenner, D.; Meier, F.; Scherer, D.; Polze, A. Spatial and temporal air temperature variability in Berlin, Germany, during the years 2001–2010. Urban Clim. 2014, 10, 308–331. [Google Scholar] [CrossRef]
- Thomas, G.; Sherin, A.P.; Ansar, S.; Zachariah, E.J. Analysis of urban heat island in Kochi, India, using a modified local climate zone classification. Procedia Environ. Sci. 2014, 21, 3–13. [Google Scholar] [CrossRef] [Green Version]
- Středová, H.; Středa, T.; Litschmann, T. Smart tools of urban climate evaluation for smart spatial planning. Morav. Geogr. Rep. 2015, 23, 47–57. [Google Scholar] [CrossRef] [Green Version]
- Geletič, J.; Lehnert, M.; Dobrovolný, P. Land surface temperature differences within local climate zones, based on two central European cities. Remote Sens. 2016, 8, 788. [Google Scholar] [CrossRef] [Green Version]
- Lehnert, M.; Geletič, J.; Dobrovolný, P.; Jurek, M. Temperature differences among local climate zones established by mobile measurements in two central European cities. Clim. Res. 2018, 75, 53–64. [Google Scholar] [CrossRef]
- Leconte, F.; Bouyer, J.; Claverie, R.; Pétrissans, M. Using Local Climate Zone scheme for UHI assessment: Evaluation of the method using mobile measurements. Build. Environ. 2015, 83, 39–49. [Google Scholar] [CrossRef]
- Geletič, J.; Lehnert, M.; Savić, S.; Milošević, D. Modelled spatiotemporal variability of outdoor thermal comfort in local climate zones of the city of Brno, Czech Republic. Sci. Total Environ. 2018, 624, 385–395. [Google Scholar] [CrossRef] [PubMed]
- Krüger, E.; Rossi, F.A. Effect of personal and microclimatic variables on observed thermal sensation from a field study in southern Brazil. Build. Environ. 2011, 46, 690–697. [Google Scholar] [CrossRef]
- Skarbit, N.; Gál, T.; Unger, J. Airborne surface temperature differences of the different Local Climate Zones in the urban area of a medium sized city. In Proceedings of the 2015 Joint Urban Remote Sensing Event (JURSE), Lausanne, Switzerland, 30 March–1 April 2015; pp. 1–4. [Google Scholar]
- Nassar, A.K.; Blackburn, G.A.; Whyatt, J.D. Dynamics and controls of urban heat sink and island phenomena in a desert city: Development of a local climate zone scheme using remotely-sensed inputs. Int. J. Appl. Earth Obs. Geoinf. 2016, 51, 76–90. [Google Scholar] [CrossRef] [Green Version]
- Kottek, M.; Grieser, J.; Beck, C.; Rudolf, B.; Rubel, F. World map of the Köppen-Geiger climate classification updated. Meteorol. Z. 2006, 15, 259–263. [Google Scholar] [CrossRef]
- Peel, M.C.; Finlayson, B.L.; McMahon, T.A. Updated world map of the Köppen-Geiger climate classification. Hydrol. Earth Sys. Sci. 2007, 4, 439–473. [Google Scholar]
- Kong, F.; Yin, H.; James, P.; Hutyra, L.R.; He, H.S. Effects of spatial pattern of greenspace on urban cooling in a large metropolitan area of eastern China. Landsc. Urban Plan. 2014, 128, 35–47. [Google Scholar] [CrossRef]
- Yan, H.; Fan, S.; Guo, C.; Wu, F.; Zhang, N.; Dong, L. Assessing the effects of landscape design parameters on intra-urban air temperature variability: The case of Beijing, China. Build. Environ. 2014, 76, 44–53. [Google Scholar] [CrossRef]
- Atkinson, B.W. Numerical modelling of urban heat-island intensity. Bound. Layer Meteorol. 2003, 109, 285–310. [Google Scholar] [CrossRef]
- Giridharan, R.; Lau, S.S.Y.; Ganesan, S.; Givoni, B. Urban design factors influencing heat island intensity in high-rise high-density environments of Hong Kong. Build. Environ. 2007, 42, 3669–3684. [Google Scholar] [CrossRef]
- Gulyás, Á.; Unger, J.; Matzarakis, A. Assessment of the microclimatic and human comfort conditions in a complex urban environment: Modelling and measurements. Build. Environ. 2006, 41, 1713–1722. [Google Scholar] [CrossRef]
- Yang, X.; Yao, L.; Jin, T.; Peng, L.L.; Jiang, Z.; Hu, Z.; Ye, Y. Assessing the thermal behavior of different local climate zones in the Nanjing metropolis, China. Build. Environ. 2018, 137, 171–184. [Google Scholar] [CrossRef]
- Fan, S.; Li, X.; Han, J.; Hao, P.; Dong, L. Assessing the effects of landscape characteristics on the thermal environment of open spaces in residential areas of Beijing, China. Landsc. Ecol. Eng. 2018, 14, 79–90. [Google Scholar] [CrossRef]
- Stewart, I.D.; Oke, T.R.; Krayenhoff, E.S. Evaluation of the ‘local climate zone’ scheme using temperature observations and model simulations. Int. J. Clim. 2014, 34, 1062–1080. [Google Scholar] [CrossRef]
- Gál, T.; Skarbit, N.; Unger, J. Urban heat island patterns and their dynamics based on an urban climate measurement network. Hung. Geogr. Bull. 2016, 65, 105–116. [Google Scholar] [CrossRef] [Green Version]
- Oke, T.R. The energetic basis of the urban heat island. Q. J. R. Meteorol. Soc. 1982, 108. [Google Scholar] [CrossRef]
- Herbel, I.; Croitoru, A.-E.; Rus, I.; Harpa, G.V.; Ciupertea, A.-F. Detection of atmospheric urban heat island through direct measurements in Cluj-Napoca city, Romania. Hung. Geogr. Bull. 2016, 65, 117–128. [Google Scholar] [CrossRef] [Green Version]
- Skarbit, N.; Stewart, I.D.; Unger, J.; Gál, T. Employing an urban meteorological network to monitor air temperature conditions in the ‘local climate zones’ of Szeged, Hungary. Int. J. Clim. 2017, 37, 582–596. [Google Scholar] [CrossRef]
- Lin, P.; Gou, Z.; Lau, S.; Qin, H. The impact of urban design descriptors on outdoor thermal environment: A literature review. Energies 2017, 10, 2151. [Google Scholar] [CrossRef] [Green Version]
- Oke, T.R. The urban energy balance. Prog. Phys. Geogr. Earth Environ. 1988, 12, 471–508. [Google Scholar] [CrossRef]
- Yokobori, T.; Ohta, S. Effect of land cover on air temperatures involved in the development of an intra-urban heat island. Clim. Res. 2009, 39, 61–73. [Google Scholar] [CrossRef]
- Gago, E.J.; Roldan, J.; Pacheco-Torres, R.; Ordonez, J. The city and urban heat islands: A review of strategies to mitigate adverse effects. Renew. Sustain. Energy Rev. 2013, 25, 749–758. [Google Scholar] [CrossRef]
- Srivanit, M.; Hokao, K. Evaluating the cooling effects of greening for improving the outdoor thermal environment at an institutional campus in the summer. Build. Environ. 2013, 66, 158–172. [Google Scholar] [CrossRef]
- Lin, T.-P.; Ho, Y.-F.; Huang, Y.-S. Seasonal effect of pavement on outdoor thermal environments in subtropical Taiwan. Build. Environ. 2007, 42, 4124–4131. [Google Scholar] [CrossRef]
- Oliveira, S.; Andrade, H.; Vaz, T. The cooling effect of green spaces as a contribution to the mitigation of urban heat: A case study in Lisbon. Build. Environ. 2011, 46, 2186–2194. [Google Scholar] [CrossRef]
- Qaid, A.; Bin Lamit, H.; Ossen, D.R.; Rasidi, M.H. Effect of the position of the visible sky in determining the sky view factor on micrometeorological and human thermal comfort conditions in urban street canyons. Theor. Appl. Clim. 2018, 131, 1083–1100. [Google Scholar] [CrossRef]


| Site | LCZ | Built Types | Area (ha2) | MBH (m) | Plant Species | Land Cover Composition (%) | ||
|---|---|---|---|---|---|---|---|---|
| PerPS | PerIS | PerBS | ||||||
| PSXC | LCZ 2 |  | 12.7 | 14 | Osmanthus fragrans Iris tectorum | 17.87 | 41.31 | 40.82 |
| ZJHY | LCZ 4 |  | 14.6 | 27 | Liriodendron chinense Ginkgo biloba Cinnamomum camphora | 38.52 | 33.76 | 27.72 |
| LSSJ | LCZ 5 |  | 10.9 | 15 | Magnolia grandiflora Ginkgo biloba Prunus mume | 42.14 | 27.32 | 30.54 |
| ZAFU | LCZ 9 |  | 16.0 | 12 | Ginkgo biloba Michelia chapensis Magnolia grandiflora | 60.29 | 26.89 | 12.82 |
Publisher’s Note: MDPI stays neutral with regard to jurisdictional claims in published maps and institutional affiliations. |
© 2021 by the authors. Licensee MDPI, Basel, Switzerland. This article is an open access article distributed under the terms and conditions of the Creative Commons Attribution (CC BY) license (https://creativecommons.org/licenses/by/4.0/).
Share and Cite
Yan, H.; Yang, S.; Guo, X.; Wu, F.; Wu, R.; Shao, F.; Bao, Z. Impact of Land Cover Composition and Structure on Air Temperature Based on the Local Climate Zone Scheme in Hangzhou, China. Atmosphere 2021, 12, 936. https://0-doi-org.brum.beds.ac.uk/10.3390/atmos12080936
Yan H, Yang S, Guo X, Wu F, Wu R, Shao F, Bao Z. Impact of Land Cover Composition and Structure on Air Temperature Based on the Local Climate Zone Scheme in Hangzhou, China. Atmosphere. 2021; 12(8):936. https://0-doi-org.brum.beds.ac.uk/10.3390/atmos12080936
Chicago/Turabian StyleYan, Hai, Shimin Yang, Xiaohui Guo, Fan Wu, Renwu Wu, Feng Shao, and Zhiyi Bao. 2021. "Impact of Land Cover Composition and Structure on Air Temperature Based on the Local Climate Zone Scheme in Hangzhou, China" Atmosphere 12, no. 8: 936. https://0-doi-org.brum.beds.ac.uk/10.3390/atmos12080936