
Comprehensive Air Quality Assessment of the Tobacco Heating System 2.2 under Simulated Indoor Environments

 ,
,
Abstract
:1. Introduction
2. Materials and Methods
2.1. Study Design
2.2. Test Products
2.3. Subjects
2.4. Environmentally Controlled Room
2.5. Determination of Indoor Air Constituents
2.5.1. Description of the Method for Quantification of Catechol and Hydroquinone
2.5.2. Description of the Method for Quantification of CO2
2.5.3. Description of the Method for Quantification of NH3
2.5.4. Description of the Method for Quantification of O3
2.5.5. Description of the Method for Determination of Ultrafine Particulate Matter
2.5.6. Targeted Analysis of Airborne Particulate Matter
2.6. MLE to Nicotine
2.7. Data Treatment
3. Results
3.1. Results for Offline Analytes

| Variable 1,2 | BKG | THS | BKG | THS | BKG | THS | BKG | THS | BKG | THS | |
|---|---|---|---|---|---|---|---|---|---|---|---|
| 2020 | 2020 | 2016 | 2016 | 2020 | 2020 | 2020 | 2020 | 2018 | 2018 | ||
| Residential Category III | Store | Restaurant | |||||||||
| Air changes/h | 0.5 | 0.5 | 0.5 | 0.5 | 2.4 | 2.4 | 4.3 | 4.3 | 4.3 | 4.3 | |
| Persons/users [N] | 4/3 | 4/3 | 3/2 | 3/2 | 4/3 | 4/3 | 4/3 | 4/3 | 4/3 | 4/3 | |
| Sticks [N] | 0 | 12 | 0 | 12 | 0 | 12 | 0 | 12 | 0 | 8 | |
| Replicate | 4 | 4 | 3 | 3 | 3 | 3 | 4 | 4 | 1 | 1 | |
| UVPM-THBP [µg/m3] | Mean SD | <LWRL na | <LWRL na | <LLOQ na | <LWRL na | nm na | nm na | <LWRL na | <LWRL na | nm nm | nm nm |
| FPM-scopoletin [µg/m3] | Mean SD | <LWRL na | <LWRL na | <LLOQ na | <LLOQ na | nm na | nm na | <LOD na | <LOD na | nm nm | nm nm |
| PM-solanesol [µg/m3] | Mean SD | <LOD na | <LWRL na | <LOD na | <LLOQ na | nm na | nm na | <LOD na | <LLOQ na | <LOD na | <LLOQ na |
| 3-Ethenylpyridine [µg/m3] | Mean SD | <LOD 3 na | <LOD 3 na | <LOD 3 na | <LOD 3 na | <LOD na | <LOD na | <LOD3 na | <LOD na | <LOD na | <LOD na |
| Nicotine [µg/m3] | Mean SD | 0.317 0.069 | 1.09 0.371 | 0.330 0.047 | 1.48 0.685 | <LLOQ na | 0.659 0.132 | <LLOQ na | 1.36 0.448 | 0.484 0.014 5 | 1.14 0.077 5 |
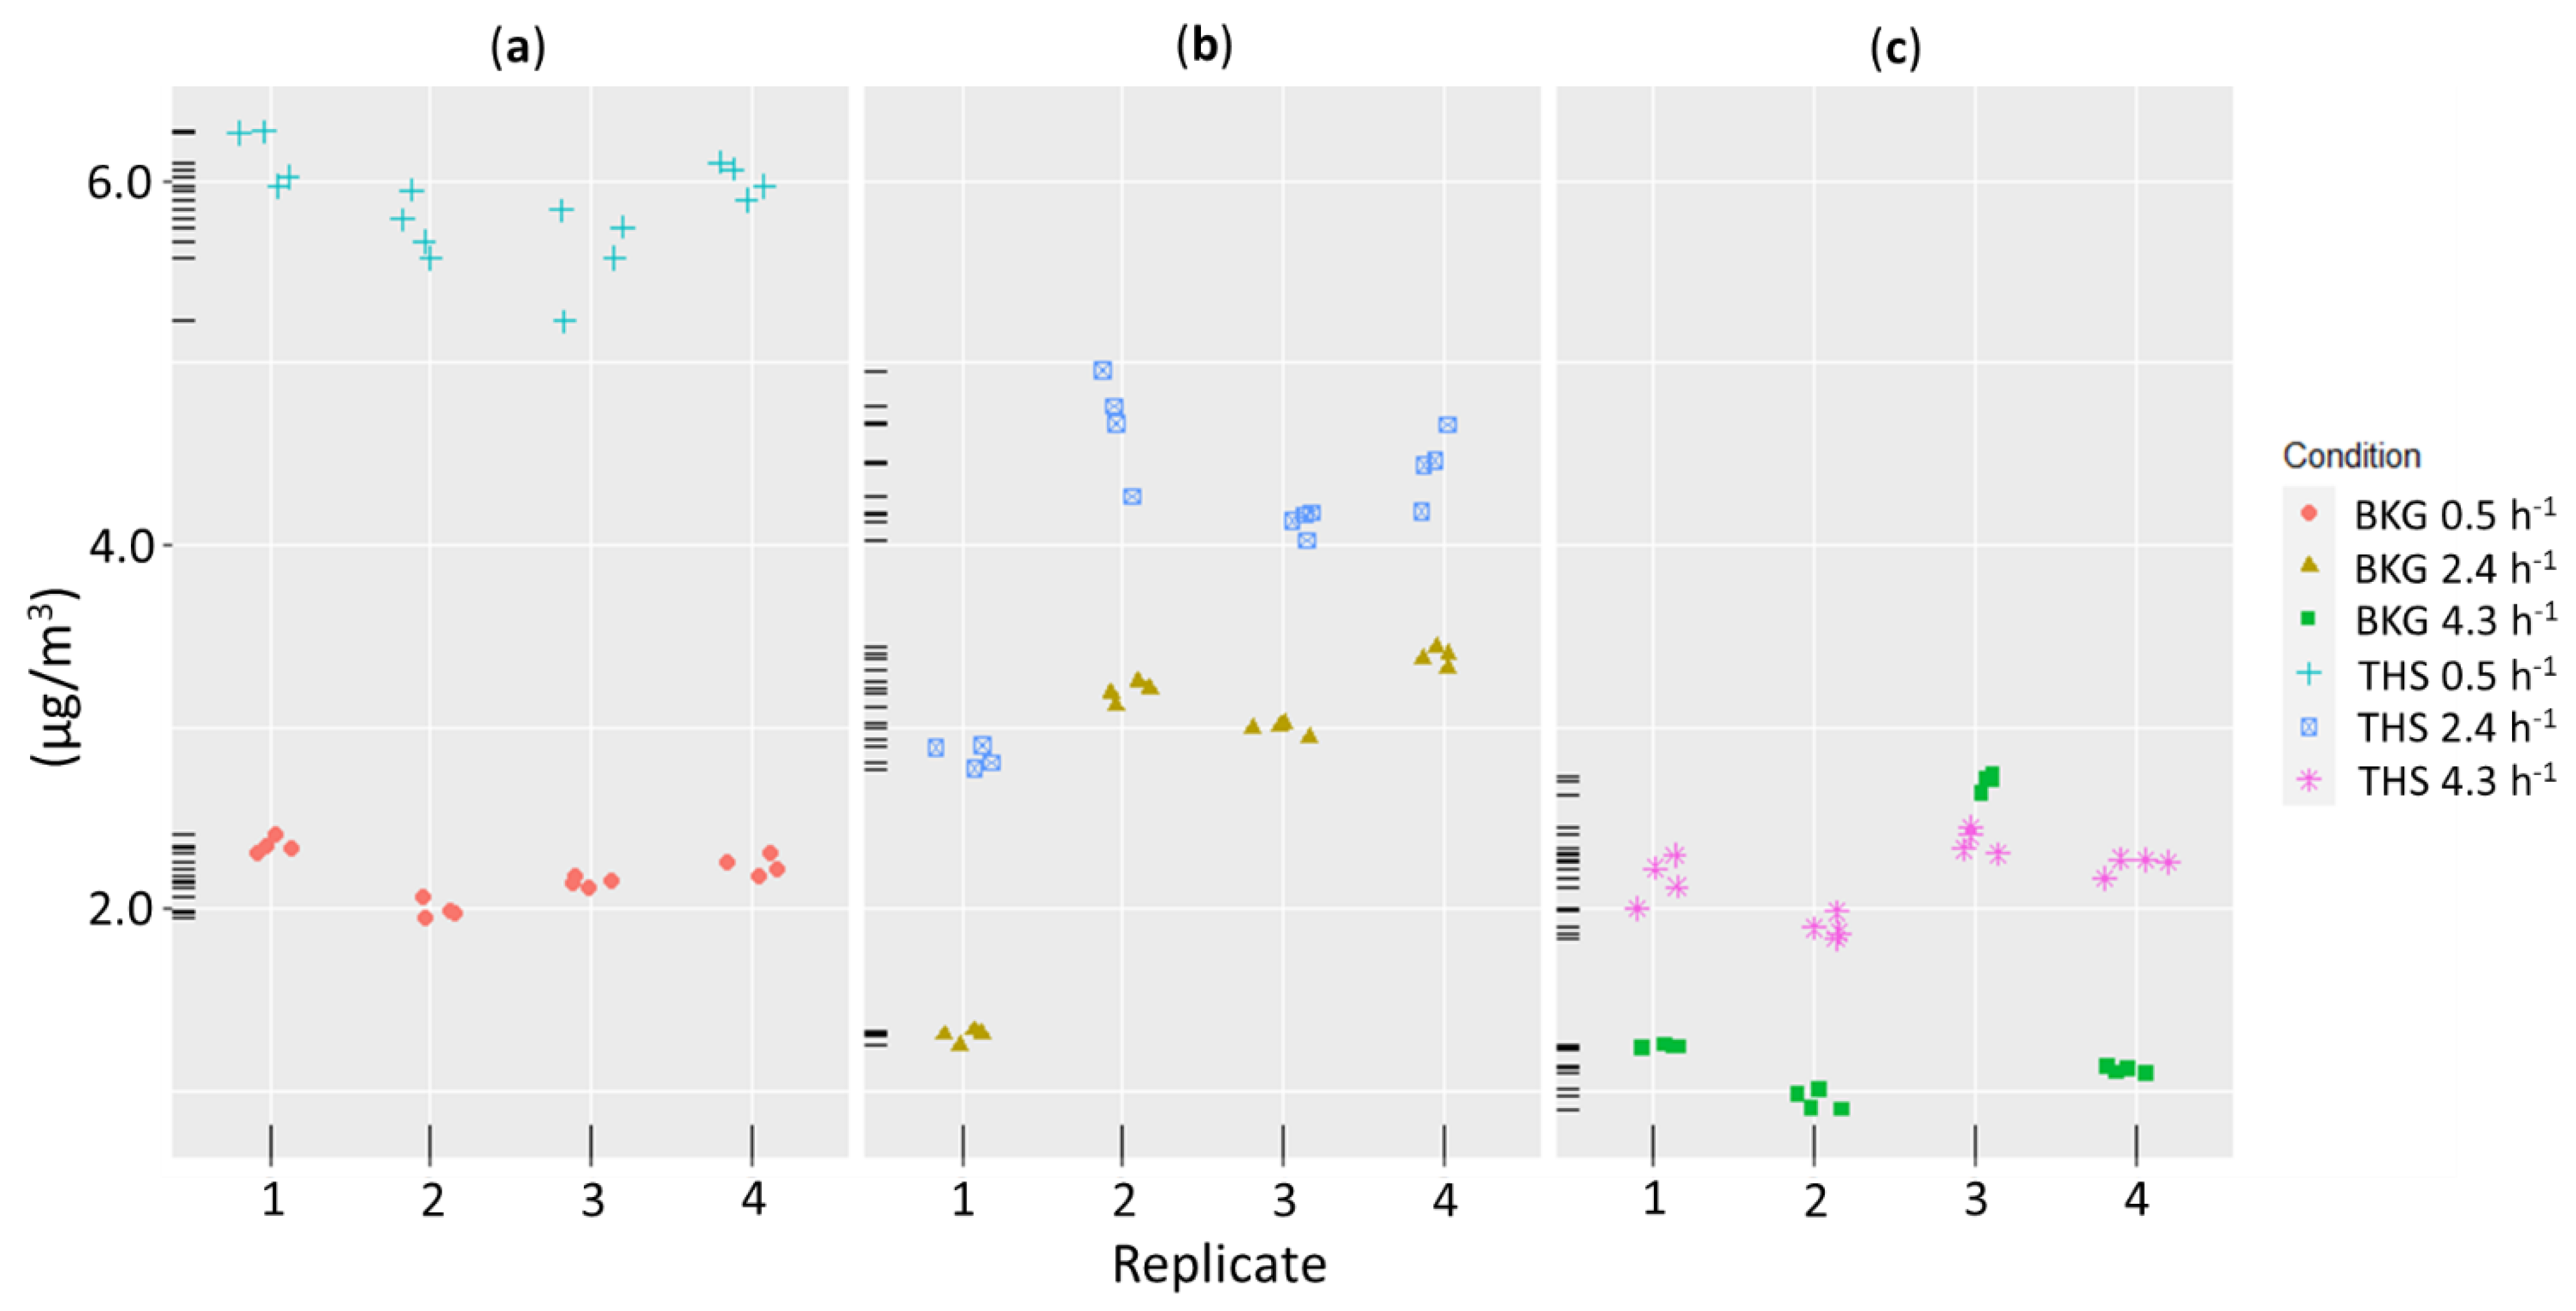
| Acetaldehyde [µg/m3] | Mean SD | 2.19 4 0.140 | 5.87 0.271 | 3.32 4 0.280 | 6.76 0.760 | 3.19 4 0.174 | 4.41 0.297 | 1.10 4,6 0.129 | 2.10 4,6 0.173 | 1.46 4 0.035 5 | 2.21 4 0.023 5 |
| Acrolein [µg/m3] | Mean SD | <LLOQ na | <LWRL na | <LLOQ na | <LWRL na | <LLOQ na | <LLOQ na | <LOD na | <LLOQ na | <LLOQ na | <LLOQ na |
| Crotonaldehyde [µg/m3] | Mean SD | <LLOQ na | <LLOQ na | <LLOQ na | <LLOQ na | <LLOQ na | <LLOQ na | <LLOQ na | <LLOQ na | <LLOQ na | <LLOQ na |
| Formaldehyde [µg/m3] | Mean SD | 10.5 1.19 | 10.2 1.27 | 13.0 2.24 | 10.8 1.05 | 7.49 4 0.273 | 7.55 4 0.633 | 3.33 4 0.240 | 3.32 4 0.203 | 4.76 4 0.036 5 | 4.94 4 0.118 5 |
| Acrylonitrile [µg/m3] | Mean SD | <LOD na | <LOD na | <LOD na | <LOD na | <LOD na | <LOD na | <LOD na | <LOD na | <LOD na | <LOD na |
| Benzene [µg/m3] | Mean SD | 0.628 0.101 | 0.639 0.101 | 1.00 0.127 | 0.943 0.119 | 0.361 0.044 | 0.315 0.049 | 0.384 0.065 | 0.364 0.072 | 0.171 4 0.008 5 | 0.182 4 0.014 5 |
| 1,3-Butadiene [µg/m3] | Mean SD | <LOD na | <LOD na | <LOD na | <LOD na | <LOD na | <LOD na | <LOD na | <LOD na | <LOD na | <LOD na |
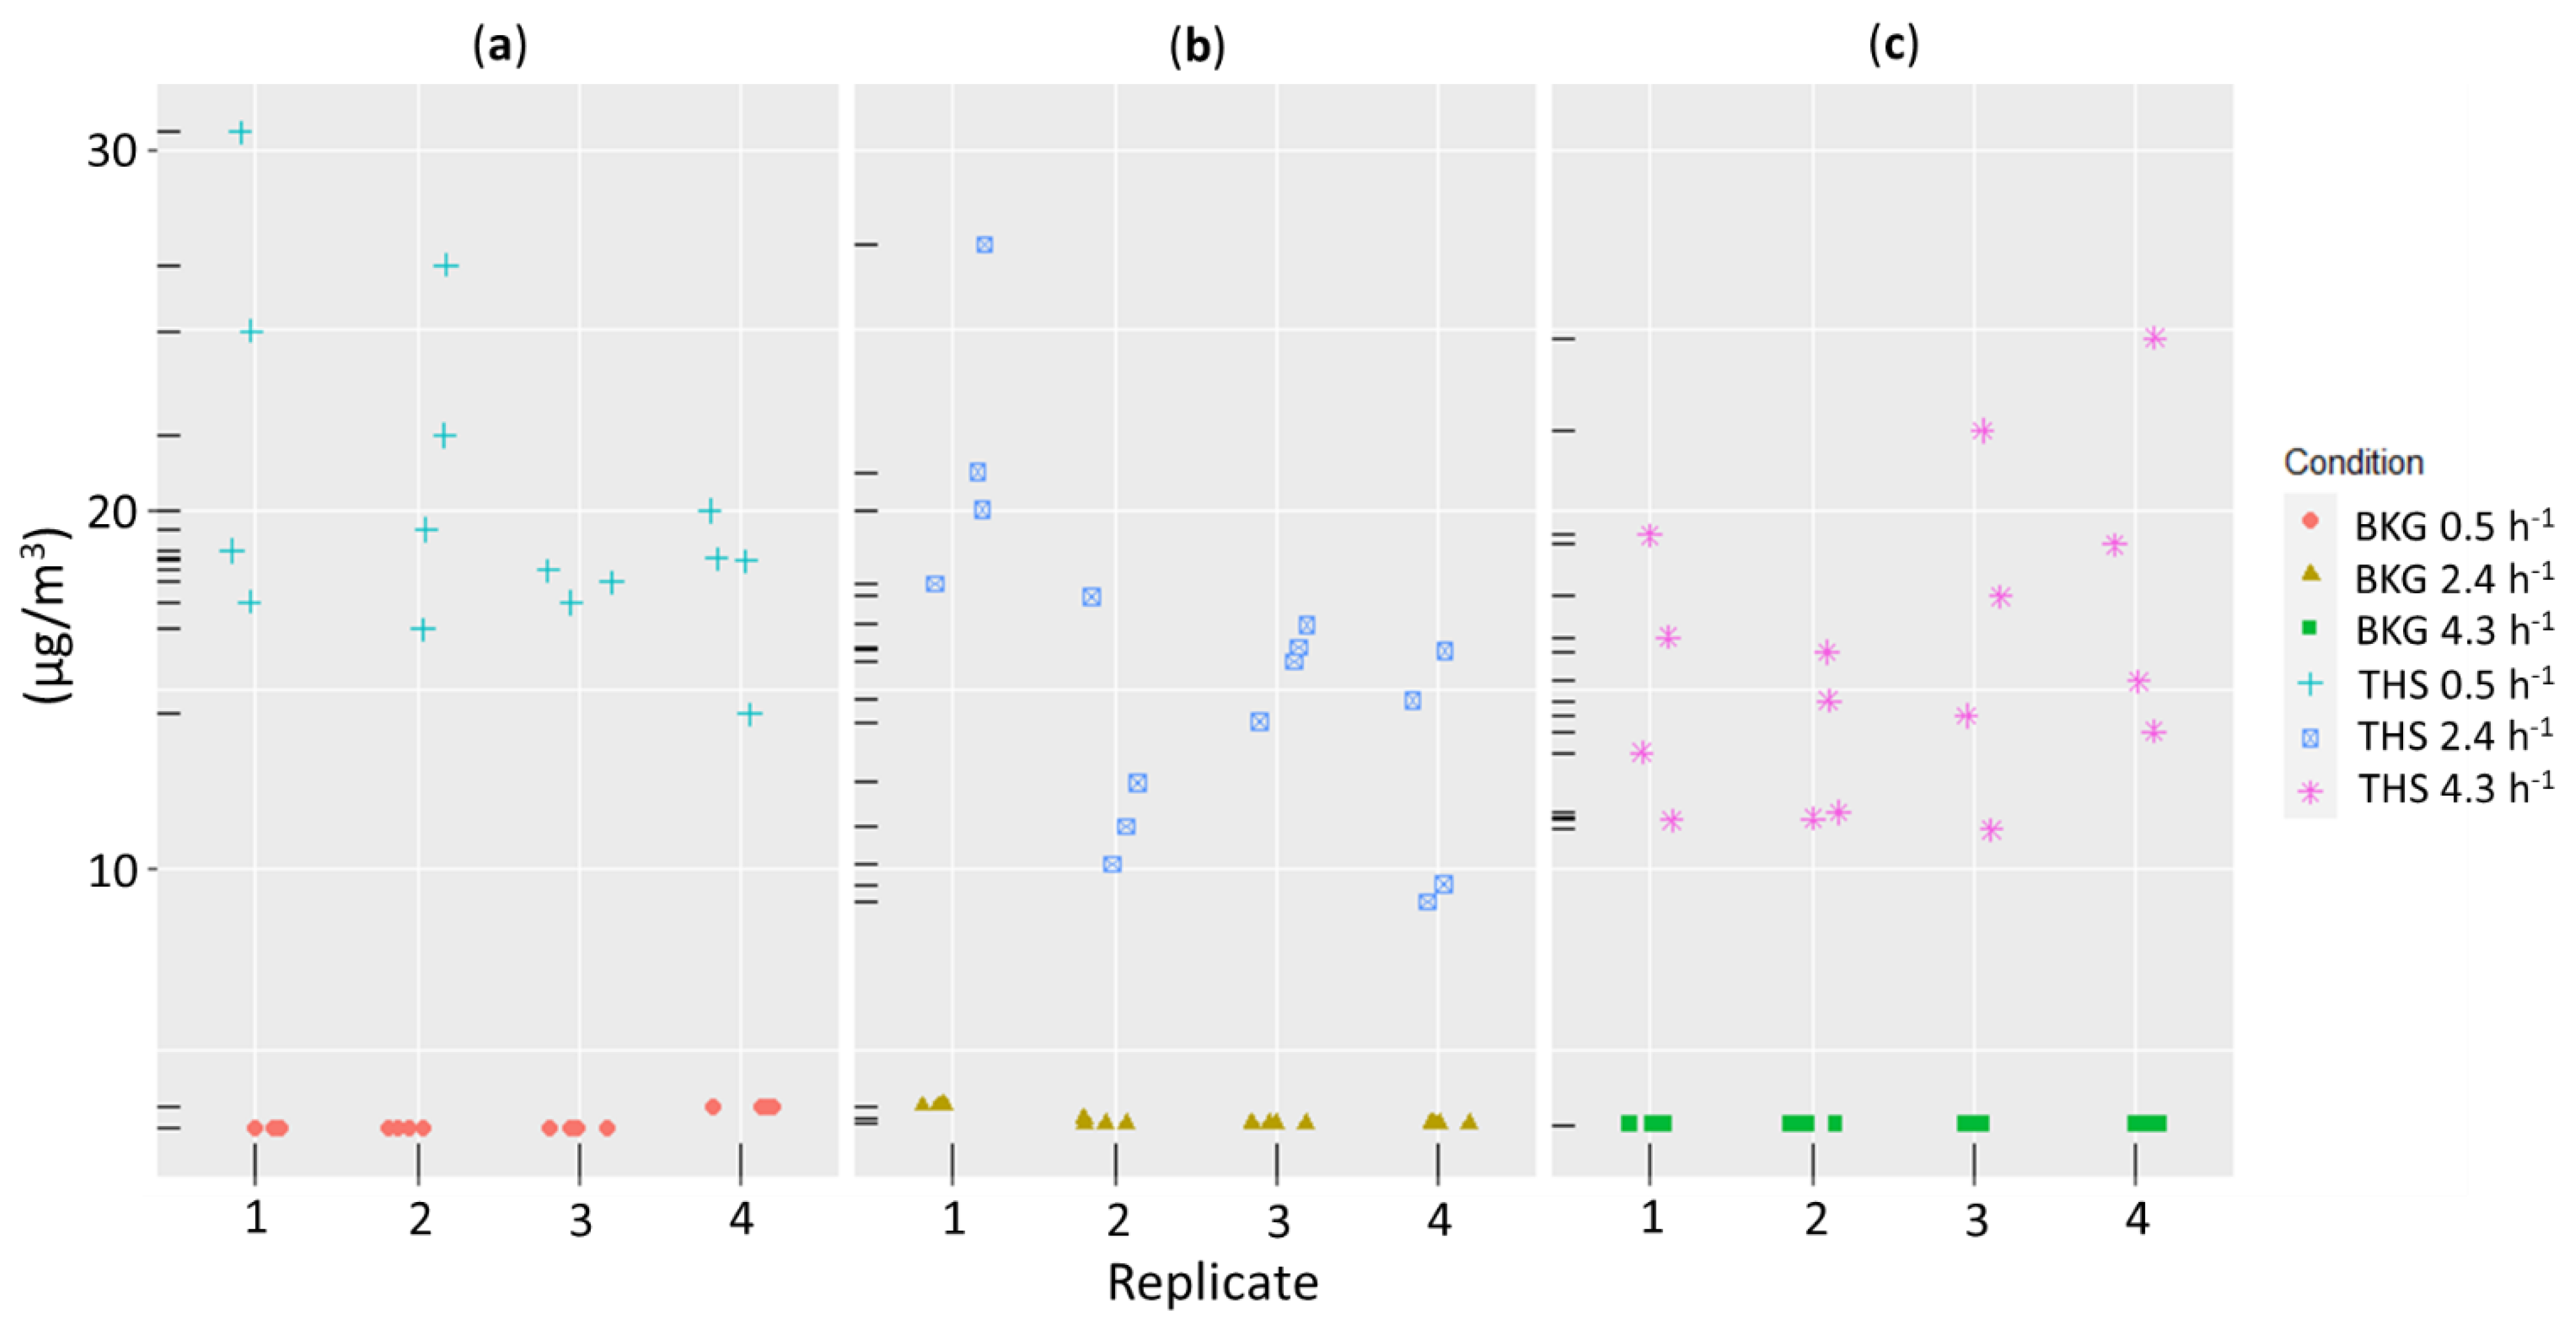
| Isoprene [µg/m3] | Mean SD | 9.16 0.766 | 10.6 1.11 | 8.65 0.614 | 9.85 1.32 | 4.26 0.433 | 4.54 0.578 | 2.23 0.161 | 2.48 0.224 | 2.22 0.154 5 | 2.31 0.133 5 |
| Toluene [µg/m3] | Mean SD | 1.11 4 0.226 | 1.03 4 0.165 | 2.68 0.280 | 2.32 0.306 | 1.48 4 0.105 | 1.36 4 0.394 | 0.718 4 0.152 | 0.701 4 0.181 | 0.658 4 0.027 5 | 0.659 4 0.049 5 |
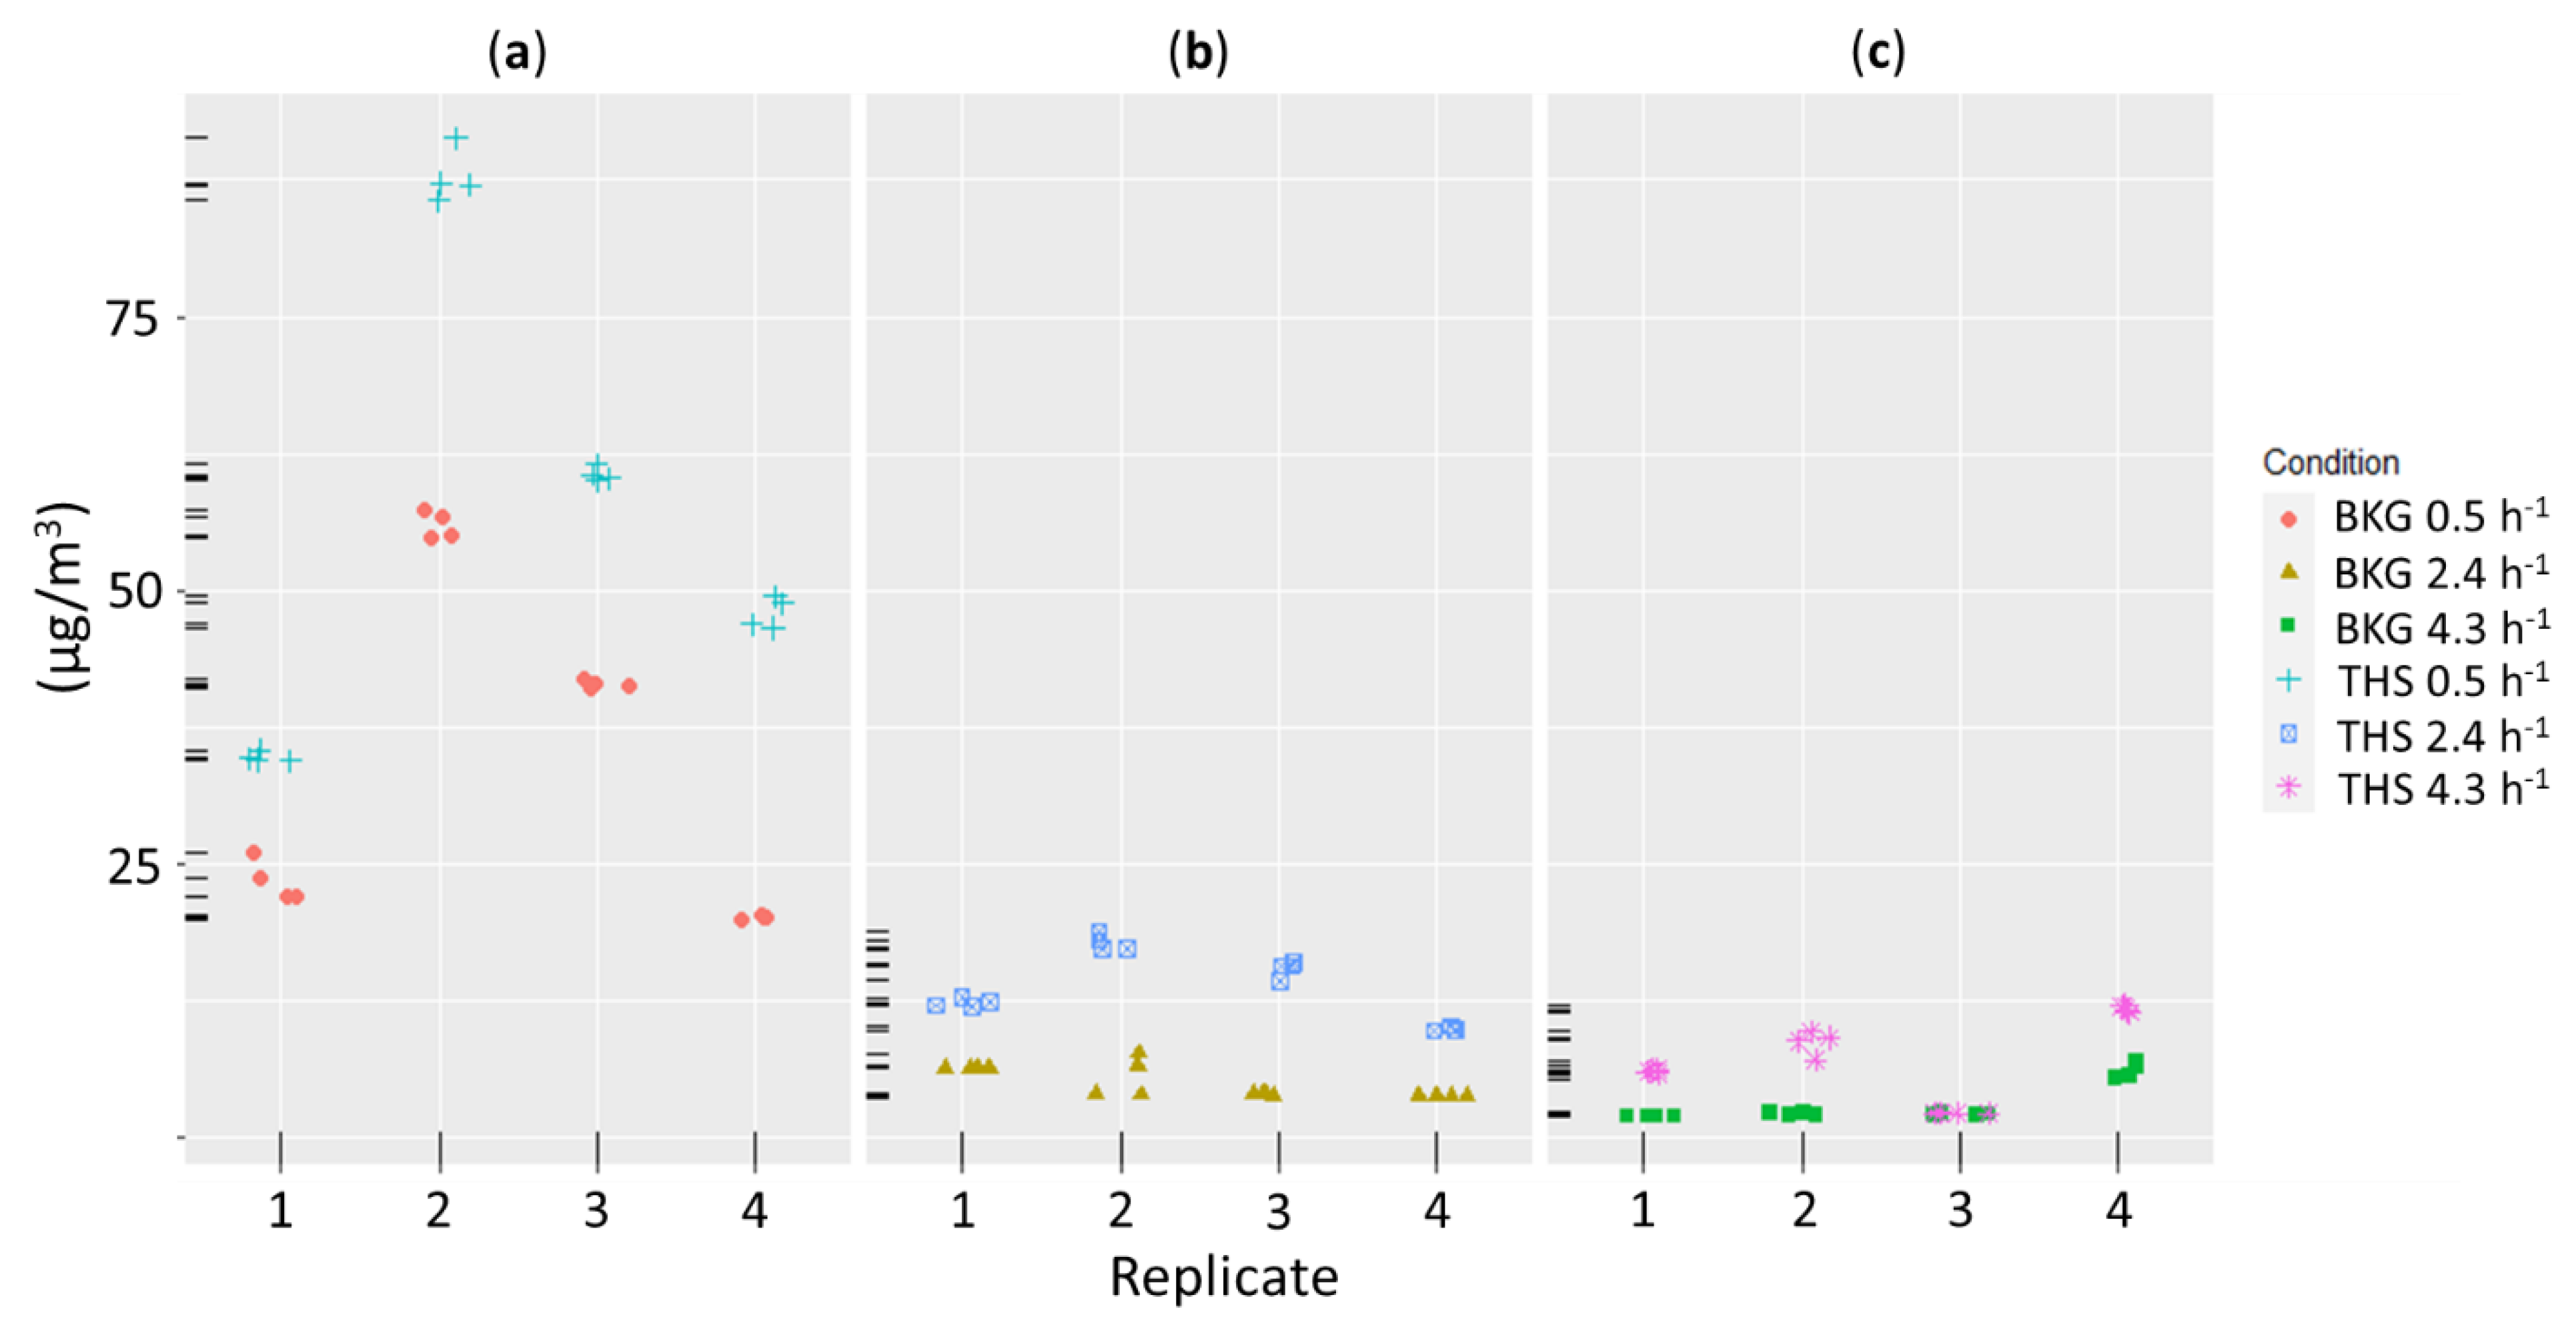
| TVOC [µg/m3] | Mean SD | 35.3 15.9 | 57.8 20.3 | 20.4 0.632 | 22.2 0.933 | 4.44 1.29 | 14.4 3.52 | 3.12 1.83 | 7.23 3.66 | 14.0 1.58 5 | 11.8 0.079 5 |
| TVOC w/t flavors [µg/m3] | Mean SD | 30.7 11.2 | 40.6 17.5 | na na | na na | 4.44 1.29 | 14.4 3.52 | 3.12 1.83 | 4.33 2.29 | nm nm | nm nm |
| Catechol [µg/m3] | Mean SD | <LLOQ na | <LLOQ na | nm na | nm na | nm na | nm na | <LLOQ na | <LLOQ na | nm nm | nm nm |
| Hydroquinone [µg/m3] | Mean SD | <LLOQ na | <LLOQ na | nm na | nm na | nm na | nm na | <LOD na | <LLOQ na | nm nm | nm nm |
| Glycerin [µg/m3] | Mean SD | <LLOQ na | 20.1 4.26 | <LLOQ na | 13.3 3.39 | <LLOQ na | 13.6 3.02 | <LLOQ na | 15.8 4.00 | <LLOQ na | 8.59 2.87 5 |
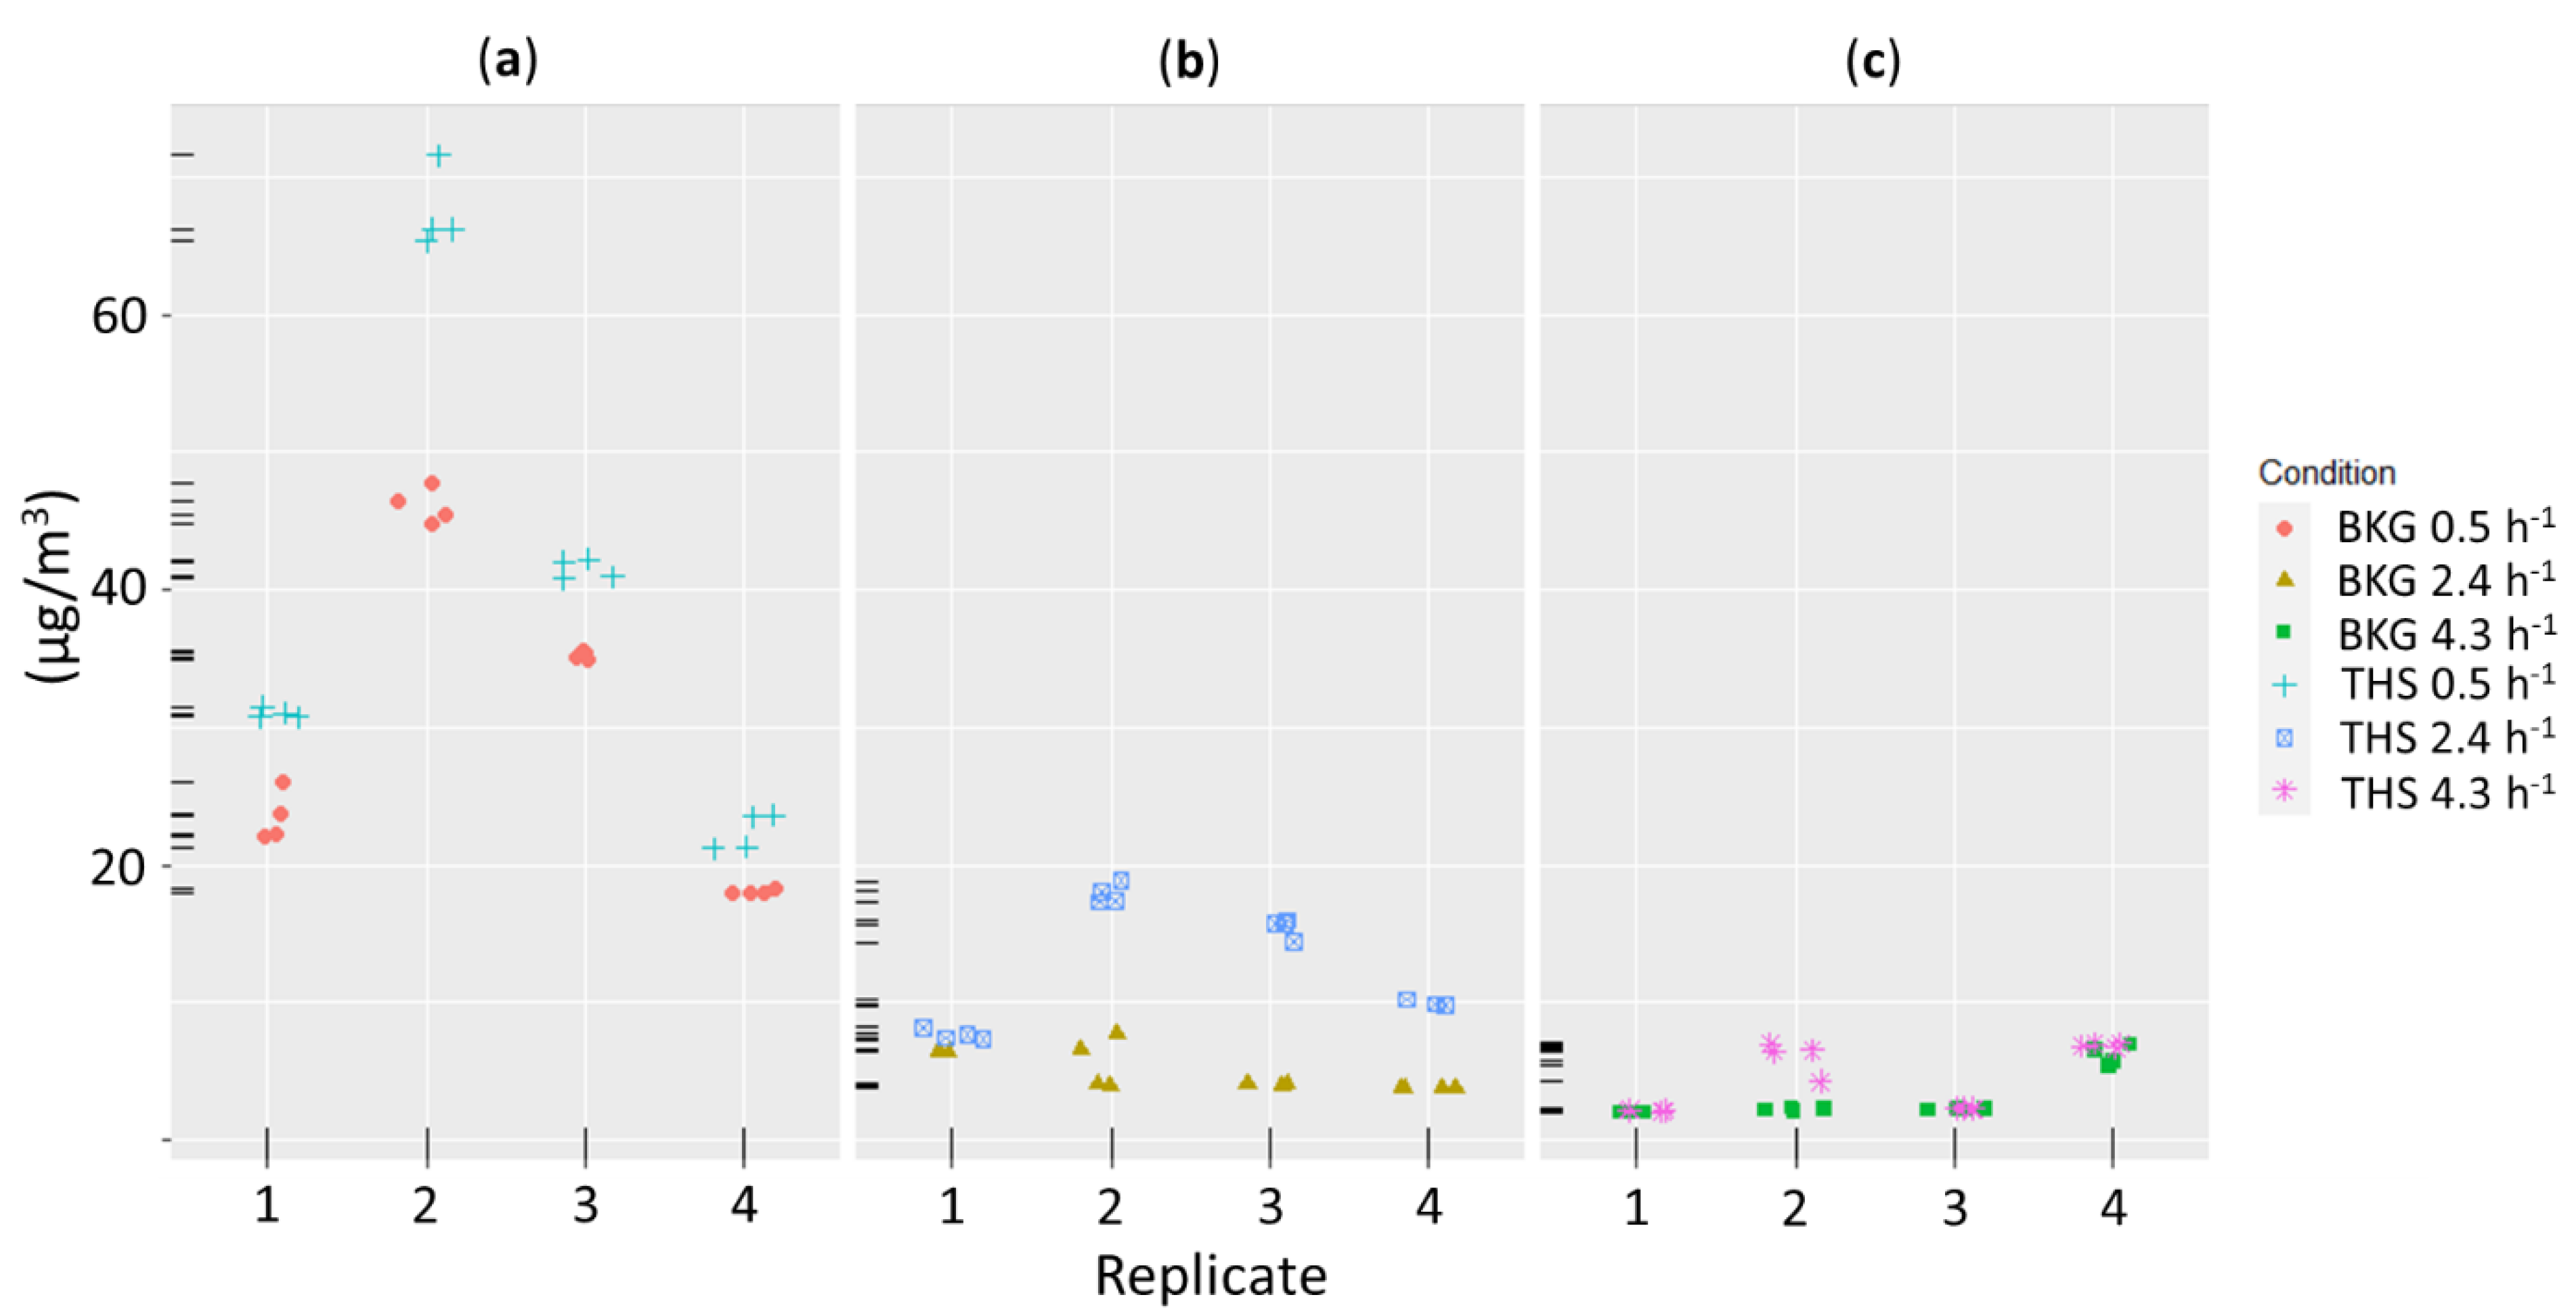
| Propylene glycol [µg/m3] | Mean SD | 27.6 16.7 | 38.8 34.2 | <LLOQ na | <LWRL na | <LLOQ na | <LLOQ na | <LLOQ na | <LLOQ na | <LLOQ na | <LLOQ na |
| NNK [µg/m3] | Mean SD | <LOD na | <LLOQ na | <LOD na | <LOD na | nm na | nm na | <LLOQ na | <LLOQ na | nm nm | nm nm |
| NNN [µg/m3] | Mean SD | <LOD na | <LLOQ na | <LOD na | <LLOQ na | nm na | nm na | <LLOQ na | <LLOQ na | nm nm | nm nm |
3.2. Results for Online Analytes
| Variable 1,2,3 | BKG | THS | BKG | THS | BKG | THS | BKG | THS | BKG | THS | |
|---|---|---|---|---|---|---|---|---|---|---|---|
| 2020 | 2020 | 2016 | 2016 | 2020 | 2020 | 2020 | 2020 | 2018 | 2018 | ||
| Residential Category III | Store | Restaurant | |||||||||
| Air changes/h | 0.5 | 0.5 | 0.5 | 0.5 | 2.4 | 2.4 | 4.3 | 4.3 | 4.3 | 4.3 | |
| Persons/users [N] | 4/3 | 4/3 | 3/2 | 3/2 | 4/3 | 4/3 | 4/3 | 4/3 | 4/3 | 4/3 | |
| Sticks [N] | 0 | 12 | 0 | 12 | 0 | 12 | 0 | 12 | 0 | 8 | |
| Replicate | 4 | 4 | 3 | 3 | 3 | 3 | 4 | 4 | 1 | 1 | |
| PM1 window [µg/m3] | Mean SD | <LOD na | <LLOQ na | <LOD na | <LOD na | <LOD na | <LOD na | <LOD na | <LOD na | <LOD na | <LOD na |
| PM1 door [µg/m3] | Mean SD | <LOD na | <LLOQ na | nm na | nm na | <LOD na | <LOD na | <LOD na | <LOD na | nm nm | nm nm |
| PM2.5 window [µg/m3] | Mean SD | <LOD na | <LLOQ na | <LOD na | <LOD na | <LOD na | <LOD na | <LOD na | <LOD na | <LOD na | <LOD na |
| PM2.5 door [µg/m3] | Mean SD | <LOD na | <LLOQ na | nm na | nm na | <LOD na | <LOD na | <LOD na | <LOD na | nm nm | nm nm |
| UFP window [count/cm3] | Mean SD | 316 158 | 14199 1101 | nm na | nm na | 120 10 | 6319 1498 | 79 14 | 6024 1125 | nm nm | nm nm |
| UFP door [count/cm3] | Mean SD | 320 194 | 17993 974 | nm na | nm na | 148 47 | 7773 1177 | 61 8 | 5156 3690 | nm nm | nm nm |
| UFP window [nm] | Mean SD | 9 14 | 113 9 | nm na | nm na | 7 3 | 107 9 | 0 0 | 100 9 | nm nm | nm nm |
| UFP door [nm] | Mean SD | 8 13 | 79 6 | nm na | nm na | 6 3 | 79 4 | 0 0 | 55 37 | nm nm | nm nm |
| CO [ppm] | Mean SD | 0.289 0.055 | 0.287 0.041 | 0.495 0.052 | 0.444 0.037 | 0.235 0.030 | 0.230 0.021 | 0.177 0.023 | 0.172 0.023 | 0.127 na | 0.138 na |
| CO2 [ppm] | Mean SD | 1318 52 | 1477 43 | nm na | nm na | 770 10 | 821 24 | 634 16 | 678 22 | nm nm | nm nm |
| NH3 [ppb] | Mean SD | 23.6 4.1 | 38.1 3.7 | nm na | nm na | 20.4 2.7 | 19.4 1.9 | 18.2 6.3 | 20.0 6.1 | 17.7 na | 16.1 na |
| NO [ppb] | Mean SD | 12.9 3.89 | 11.7 2.99 | 35.8 10.7 | 23.9 4.19 | 2.65 0.15 | 2.57 0.27 | 5.14 0.47 | 4.90 0.36 | 2.39 na | 2.30 na |
| NOx [ppb] | Mean SD | 17.8 3.90 | 15.8 3.28 | 42.2 11.4 | 30.0 5.00 | 5.53 0.43 | 5.18 0.35 | 7.74 0.57 | 7.43 0.43 | 2.78 na | 2.54 na |
| O3 4 [µg/m3] | Mean SD | <LOD na | <LOD na | nm na | nm na | <LOD na | <LOD na | <LOD na | <LOD na | nm nm | nm nm |
3.3. Results of Screening of the Gas–Vapor and Particulate Phases of THS 2.2 Environmental Aerosol
3.4. Results for MLE
4. Discussion
4.1. Simulated Environments
4.2. Characterization of the Environmental Aerosol of THS 2.2
4.3. Comparison of Environmental Emissions between THS 2.2 and Other Sources
5. Conclusions
Supplementary Materials
Author Contributions
Funding
Institutional Review Board Statement
Informed Consent Statement
Data Availability Statement
Acknowledgments
Conflicts of Interest
References
- Smith, M.; Peitsch, M.C.; Maeder, S. Electronic Nicotine Delivery Products. In Toxicological Evaluation of Electronic Nicotine Delivery Products; Peitsch, M.C., Hoeng, J., Eds.; Academic Press: Cambridge, MA, USA, 2021; pp. 17–22. [Google Scholar] [CrossRef]
- Ruprecht, A.A.; De Marco, C.; Saffari, A.; Pozzi, P.; Mazza, R.; Veronese, C.; Angellotti, G.; Munarini, E.; Ogliari, A.C.; Westerdahl, D.; et al. Environmental pollution and emission factors of electronic cigarettes, heat-not-burn tobacco products, and conventional cigarettes. Aerosol Sci. Technol. 2017, 51, 674–684. [Google Scholar] [CrossRef]
- Simonavicius, E.; McNeill, A.; Shahab, L.; Brose, L.S. Heat-not-burn tobacco products: A systematic literature review. Tobacco Control. 2019, 28, 582–594. [Google Scholar] [CrossRef] [PubMed]
- Meišutovič-Akhtarieva, M.; Prasauskas, T.; Čiužas, D.; Krugly, E.; Keraitytė, K.; Martuzevičius, D.; Kaunelienė, V. Impacts of exhaled aerosol from the usage of the tobacco heating system to indoor air quality: A chamber study. Chemosphere 2019, 223, 474–482. [Google Scholar] [CrossRef]
- Cancelada, L.; Sleiman, M.; Tang, X.; Russell, M.L.; Montesinos, V.N.; Litter, M.I.; Gundel, L.A.; Destaillats, H. Heated Tobacco Products: Volatile Emissions and Their Predicted Impact on Indoor Air Quality. Environ. Sci. Technol. 2019, 53, 7866–7876. [Google Scholar] [CrossRef] [PubMed]
- Savdie, J.; Canha, N.; Buitrago, N.; Almeida, S.M. Passive Exposure to Pollutants from a New Generation of Cigarettes in Real Life Scenarios. Int. J. Environ. Res. Public Health 2020, 17, 3455. [Google Scholar] [CrossRef]
- Prodanchuk, M.G.; Podrushnyak, A.E.; Malysheva, O.E.; Stroy, A.M.; Zaval’na, V.V.; Moroz, T.I.; Kruk, V.I.; Shutova, T.V. Potential risk assessment of the electrically heated tobacco system (EHTS) use. Probl. Artic. 2017, 1–2, 5–14. [Google Scholar]
- Meišutovič-Akhtarieva, M.; Prasauskas, T.; Čiužas, D.; Kaunelienė, V.; Martuzevičius, D. The Dynamics of Exhaled Aerosol Following the Usage of Heated Tobacco Product, Electronic Cigarette, and Conventional Cigarette. Aerosol Air Qual. Res. 2021, 21, 200653. [Google Scholar] [CrossRef]
- Ratajczak, A.; Jankowski, P.; Strus, P.; Feleszko, W. Heat Not Burn Tobacco Product—A New Global Trend: Impact of Heat-Not-Burn Tobacco Products on Public Health, a Systematic Review. Int. J. Environ. Res. Public Health 2020, 17, 409. [Google Scholar] [CrossRef] [PubMed] [Green Version]
- Hirano, T.; Shobayashi, T.; Takei, T.; Wakao, F. Exposure Assessment of Environmental Tobacco Aerosol from Heated Tobacco Products: Nicotine and PM Exposures under Two Limited Conditions. Int. J. Environ. Res. Public Health 2020, 17, 8536. [Google Scholar] [CrossRef] [PubMed]
- Protano, C.; Manigrasso, M.; Avino, P.; Sernia, S.; Vitali, M. Second-hand smoke exposure generated by new electronic devices (IQOS(R) and e-cigs) and traditional cigarettes: Submicron particle behaviour in human respiratory system. Ann. Ig 2016, 28, 109–112. [Google Scholar] [CrossRef] [PubMed]
- Protano, C.; Manigrasso, M.; Avino, P.; Vitali, M. Second-hand smoke generated by combustion and electronic smoking devices used in real scenarios: Ultrafine particle pollution and age-related dose assessment. Environ. Int. 2017, 107, 190–195. [Google Scholar] [CrossRef] [PubMed] [Green Version]
- Forster, M.; McAughey, J.; Prasad, K.; Mavropoulou, E.; Proctor, C. Assessment of tobacco heating product THP1.0. Part 4: Characterisation of indoor air quality and odour. Regul. Toxicol. Pharmacol. 2018, 93, 34–51. [Google Scholar] [CrossRef]
- Peruzzi, M.; Cavarretta, E.; Frati, G.; Carnevale, R.; Miraldi, F.; Biondi-Zoccai, G.; Sciarretta, S.; Versaci, F.; Cammalleri, V.; Avino, P.; et al. Comparative Indoor Pollution from Glo, Iqos, and Juul, Using Traditional Combustion Cigarettes as Benchmark: Evidence from the Randomized SUR-VAPES AIR Trial. Int. J. Environ. Res. Public Health 2020, 17, 6029. [Google Scholar] [CrossRef] [PubMed]
- Kauneliene, V.; Meisutovic-Akhtarieva, M.; Martuzevicius, D. A review of the impacts of tobacco heating system on indoor air quality versus conventional pollution sources. Chemosphere 2018, 206, 568–578. [Google Scholar] [CrossRef] [PubMed]
- Loupa, G.; Karali, D.; Rapsomanikis, S. The trace of airborne particulate matter from smoking e-cigarette, tobacco heating system, conventional and hand-rolled cigarettes in a residential environment. Air Qual. Atmos. Health 2019, 12, 1449–1457. [Google Scholar] [CrossRef]
- Goujon-Ginglinger, C.; Mitova, M.I. Environmental impact: Influence of ENDPs on Indoor Air Quality. In Toxicological Evaluation of Electronic Nicotine Delivery Products; Peitsch, M.C., Hoeng, J., Eds.; Academic Press: Cambridge, MA, USA, 2021; pp. 137–188. [Google Scholar] [CrossRef]
- Mitova, M.I.; Bielik, N.; Campelos, P.B.; Cluse, C.; Goujon-Ginglinger, C.G.; Jaquier, A.; Gomez Lueso, M.; Maeder, S.; Pitton, C.; Poget, L.; et al. Air quality assessment of the Tobacco Heating System 2.2 under simulated residential conditions. Air Qual. Atmos. Health 2019, 12, 807–823. [Google Scholar] [CrossRef] [Green Version]
- Mitova, M.I.; Campelos, P.B.; Goujon-Ginglinger, C.G.; Maeder, S.; Mottier, N.; Rouget, E.G.; Tharin, M.; Tricker, A.R. Comparison of the impact of the Tobacco Heating System 2.2 and a cigarette on indoor air quality. Regul. Toxicol. Pharmacol. 2016, 80, 91–101. [Google Scholar] [CrossRef] [Green Version]
- Smith, M.R.; Clark, B.; Ludicke, F.; Schaller, J.P.; Vanscheeuwijck, P.; Hoeng, J.; Peitsch, M.C. Evaluation of the Tobacco Heating System 2.2. Part 1: Description of the system and the scientific assessment program. Regul. Toxicol. Pharmacol. 2016, 81 (Suppl. 2), S17–S26. [Google Scholar] [CrossRef] [Green Version]
- Zaritskaya, E.V.; Yakubova, I.S.; Mikheeva, A.Y.; Alikbaeva, L.A. Hygienic assessment of chemical composition of pollutants generated in various ways of consumption nicotine-containing product. Hyg. Sanit. 2020, 99, 638–644. [Google Scholar] [CrossRef]
- Protano, C.; Manigrasso, M.; Cammalleri, V.; Biondi Zoccai, G.; Frati, G.; Avino, P.; Vitali, M. Impact of Electronic Alternatives to Tobacco Cigarettes on Indoor Air Particular Matter Levels. Int. J. Environ. Res. Public Health 2020, 17, 2947. [Google Scholar] [CrossRef]
- Kaunelienė, V.; Meišutovič-Akhtarieva, M.; Prasauskas, T.; Čiužas, D.; Krugly, E.; Keraitytė, K.; Martuzevičius, D. Impact of Using a Tobacco Heating System (THS) on Indoor Air Quality in a Nightclub. Aerosol Air Qual. Res. 2019, 19, 1961–1968. [Google Scholar] [CrossRef]
- Schober, W.; Fembacher, L.; Frenzen, A.; Fromme, H. Passive exposure to pollutants from conventional cigarettes and new electronic smoking devices (IQOS, e-cigarette) in passenger cars. Int. J. Hyg. Environ. Health 2019, 222, 486–493. [Google Scholar] [CrossRef] [PubMed]
- Baldauf, R.; Devlin, R.; Gehr, P.; Giannelli, R.; Hassett-Sipple, B.; Jung, H.; Martini, G.; McDonald, J.; Sacks, J.; Walker, K. Ultrafine Particle Metrics and Research Considerations: Review of the 2015 UFP Workshop. Int. J. Environ. Res. Public Health 2016, 13, 1054. [Google Scholar] [CrossRef] [PubMed]
- Cozzani, V.; Barontini, F.; McGrath, T.; Mahler, B.; Nordlund, M.; Smith, M.; Schaller, J.P.; Zuber, G. An experimental investigation into the operation of an electrically heated tobacco system. Thermochim. Acta 2020, 684, 178475. [Google Scholar] [CrossRef]
- Food and Drug Administration (FDA). Harmful and potentially harmful constituents in tobacco products and tobacco smoke; established list. In 77 FR 20034; Food and Drug Administration, Ed.; Food and Drug Administration: Silver Spring, MD, USA, 2012; pp. 20034–20037. [Google Scholar]
- FCTC. Framework Convention on Tobacco Control (FCTC). World Health Organization (WHO). Electronic Nicotine Delivery Systems. Report by WHO. Available online: https://apps.who.int/iris/handle/10665/147110 (accessed on 17 June 2021).
- European Committee for Standardization. European Standard EN 15251. In Indoor Environmental Input Parameters for Design and Assessment of Energy Performance of Buildings Addressing Indoor Air Quality, Thermal Environment, Lighting and Acoustics; European Committee for Standardization: Brussels, Belgium, 2007. [Google Scholar]
- American Society of Heating, Refrigerating and Air-Conditioning Engineers (ASHRAE). ANSI/ASHRAE Standard 62.1-2016. Ventilation for Acceptable Indoor Air Quality; American Society of Heating, Refrigerating and Air-Conditioning Engineers, Inc.: Atlanta, GA, USA, 2016. [Google Scholar]
- American Society of Heating, Refrigerating and Air-Conditioning Engineers (ASHRAE). ANSI/ASHRAE Standard 62.2-2016. Ventilation for Acceptable Indoor Air Quality in Residential Buildings; American Society of Heating, Refrigerating and Air-Conditioning Engineers Inc.: Atlanta, GA, USA, 2016. [Google Scholar]
- Poget, L.; Campelos, P.; Jeannet, C.; Maeder, S. Development of Models for the Estimation of Mouth Level Exposure to Aerosol Constituents from a Heat-Not-Burn Tobacco Product Using Mouthpiece Analysis. Contrib. Tob. Res. 2017, 27, 42–64. [Google Scholar] [CrossRef] [Green Version]
- Buratti, C.; Mariani, R.; Moretti, E. Mean age of air in a naturally ventilated office: Experimental data and simulations. Energy Build. 2011, 43, 2021–2027. [Google Scholar] [CrossRef]
- International Organization for Standardization (ISO). ISO 16000-8. Indoor Air-Part 8: Determination of Local Mean Ages of Air in Buildings for Characterizing Ventilation Conditions; International Organization for Standardization (ISO): Geneva, Switzerland, 2007. [Google Scholar]
- Health Canada. Tobacco Reporting Regulations. Available online: http://www.hc-sc.gc.ca/hc-ps/tobac-tabac/legislation/reg/indust/index-eng.php (accessed on 17 June 2021).
- Schaller, J.P.; Keller, D.; Poget, L.; Pratte, P.; Kaelin, E.; McHugh, D.; Cudazzo, G.; Smart, D.; Tricker, A.R.; Gautier, L.; et al. Evaluation of the Tobacco Heating System 2.2. Part 2: Chemical composition, genotoxicity, cytotoxicity, and physical properties of the aerosol. Regul. Toxicol. Pharmacol. 2016, 81 (Suppl. 2), S27–S47. [Google Scholar] [CrossRef] [Green Version]
- Schaller, J.P.; Pijnenburg, J.P.M.; Ajithkumar, A.; Tricker, A.R. Evaluation of the Tobacco Heating System 2.2. Part 3: Influence of the tobacco blend on the formation of harmful and potentially harmful constituents of the Tobacco Heating System 2.2 aerosol. Regul. Toxicol. Pharmacol. 2016, 81 (Suppl. 2), S48–S58. [Google Scholar] [CrossRef] [PubMed] [Green Version]
- Jaccard, G.; Tafin Djoko, D.; Moennikes, O.; Jeannet, C.; Kondylis, A.; Belushkin, M. Comparative assessment of HPHC yields in the Tobacco Heating System THS2.2 and commercial cigarettes. Regul. Toxicol. Pharmacol. 2017, 90, 1–8. [Google Scholar] [CrossRef]
- Mottier, N.; Tharin, M.; Cluse, C.; Crudo, J.R.; Lueso, M.G.; Goujon-Ginglinger, C.G.; Jaquier, A.; Mitova, M.I.; Rouget, E.G.R.; Schaller, M.; et al. Validation of selected analytical methods using accuracy profiles to assess the impact of a Tobacco Heating System on indoor air quality. Talanta 2016, 158, 165–178. [Google Scholar] [CrossRef] [Green Version]
- Mitova, M.I.; Cluse, C.; Goujon-Ginglinger, C.G.; Kleinhans, S.; Rotach, M.; Tharin, M. Human chemical signature: Investigation on the influence of human presence and selected activities on concentrations of airborne constituents. Environ. Pollut. 2019, 257, 113518. [Google Scholar] [CrossRef] [PubMed]
- Gómez Lueso, M.; Mitova, M.I.; Mottier, N.; Schaller, M.; Rotach, M.; Goujon-Ginglinger, C.G. Development and validation of a method for quantification of two tobacco-specific nitrosamines in indoor air. J. Chromatogr. A 2018, 1580, 90–99. [Google Scholar] [CrossRef] [PubMed]
- Susz, A.; Pratte, P.; Goujon-Ginglinger, C. Real-time Monitoring of Suspended Particulate Matter in Indoor Air: Validation and Application of a Light-scattering Sensor. Aerosol Air Qual. Res. 2020, 20, 2384–2395. [Google Scholar] [CrossRef]
- Analysis of Indoor Air Constituents: Carbon Monoxide (CO), Nitrogen Monoxide (NO) and Nitrogen Oxides (NOx) (PMI). Available online: https://www.intervals.science/protocols/#/pmi_iac-co_no_nox/version/2 (accessed on 19 July 2021).
- Analysis of Indoor Air Constituents: Carbonyls (PMI). Available online: https://www.intervals.science/protocols/#/pmi_iac-carbonyls/version/1 (accessed on 19 July 2021).
- Analysis of Indoor Air Constituents: Glycerin and Propylene Glycol (PMI). Available online: https://www.intervals.science/protocols/#/pmi-iac_glycerin_prop_glycol/version/1 (accessed on 19 July 2021).
- Analysis of Indoor Air Constituents: Nicotine and 3-ethenylpyridine (PMI). Available online: https://www.intervals.science/protocols/#/pmi_iac-nicotine_3-ethenylpyridine/version/2 (accessed on 19 July 2021).
- Analysis of Indoor Air Constituents: Real Time Monitoring of Aerosol Mass Concentration (PMI). Available online: https://www.intervals.science/protocols/#/pmi_iac_particulate_matter/version/1 (accessed on 19 July 2021).
- Analysis of Indoor Air Constituents: RSP, UVPM, FPM, and Solanesol (PMI). Available online: https://www.intervals.science/protocols/#/pmi_iac-rsp_-uvpm_-fpm_-solanesol/version/1 (accessed on 19 July 2021).
- Analysis of Indoor Air Constituents: Tobacco Specific Nitrosamines NNN and NNK (PMI). Available online: https://www.intervals.science/protocols/#/pmi_iac-nnn_nnk/version/1 (accessed on 19 July 2021).
- Analysis of Indoor Air Constituents: Total Volatile Organic Compounds (TVOC) (PMI). Available online: https://www.intervals.science/protocols/#/pmi_iac-tvoc/version/1 (accessed on 19 July 2021).
- Analysis of Indoor Air Constituents: Volatile Organic Compounds (VOCs, PMI). Available online: https://www.intervals.science/protocols/#/pmi_iac-vocs/version/1 (accessed on 19 July 2021).
- International Organization for Standardization (ISO). ISO 17025. General Requirements for the Competence of Testing and Calibration Laboratories; International Organization for Standardization: Geneva, Switzerland, 2017. [Google Scholar]
- Bentley, M.C.; Almstetter, M.; Arndt, D.; Knorr, A.; Martin, E.; Pospisil, P.; Maeder, S. Comprehensive chemical characterization of the aerosol generated by a heated tobacco product by untargeted screening. Anal. Bioanal. Chem. 2020, 412, 2675. [Google Scholar] [CrossRef] [Green Version]
- International Organization for Standardization (ISO). ISO 16000-6. Indoor Air Part 6: Determination of Volatile Organic Compounds in Indoor and Test Chamber Air by Active Sampling on Tenax TA Sorbent, Thermal Desorption and Gas Chromatography using MS or MS-FID; International Organization for Standardization (ISO): Geneva, Switzerland, 2011. [Google Scholar]
- Molhave, L.; Clausen, G.; Berglund, B.; Ceaurriz, J.; Kettrup, A.; Lindvall, T.; Maroni, M.; Pickering, A.C.; Risse, U.; Rothweiler, H.; et al. Total Volatile Organic Compounds (TVOC) in Indoor Air Quality Investigations. Indoor Air 1997, 7, 225–240. [Google Scholar] [CrossRef]
- Glantz, S.; Schick, S. Implications of ASHRAE’S guidance on ventilation for smoking-permitted areas. ASHRAE J. 2004, 46, 54–59. [Google Scholar]
- European Committee for Standardization. European Standard EN 16516. Construction Products: Assessment of Release of Dangerous Substances-Determination of Emissions into Indoor Air; European Committee for Standardization: Brussels, Belgium, 2017. [Google Scholar]
- Hall, E.T. The Hidden Dimension; Anchor: New York, NY, USA, 1966. [Google Scholar]
- Mostafa, M.Y.A.; Khalaf, H.N.B.; Zhukovsky, M. Attachment rate characteristics of different wide used aerosol sources in indoor air. J. Environ. Health Sci. Eng. 2021, 19, 867–879. [Google Scholar] [CrossRef]
- ISO 18562-1, 2017. Biocompatibility Evaluation of Breathing Gas Pathways in Healthcare Applications. Part 1. Evaluation and Testing within a Risk Management Process; ISO Copyright Office: Geneva, Swizterland, 2017; Volume ISO 18562-1:2017.
- Baltazar, P.; Hernández-Sánchez, N.; Diezma, B.; Lleó, L. Development of Rapid Extra Virgin Olive Oil Quality Assessment Procedures Based on Spectroscopic Techniques. Agronomy 2019, 10, 41. [Google Scholar] [CrossRef] [Green Version]
- Schulte-Ladbeck, R.; Lindahl, R.; Levin, J.O.; Karst, U. Characterization of chemical interferences in the determination of unsaturated aldehydes using aromatic hydrazine reagents and liquid chromatography. J. Environ. Monit. 2001, 3, 306–310. [Google Scholar] [CrossRef]
- California Office of Environmental Health Hazard Assessment (OEHHA). Acute, 8-h and Chronic Reference Exposure Level (REL) Summary. Available online: https://oehha.ca.gov/air/general-info/oehha-acute-8-hour-and-chronic-reference-exposure-level-rel-summary (accessed on 17 June 2021).
- US Occupational Safety and Health Administration (US OSHA). Permissible Exposure Limits (PEL). OSHA Annotated Table Z-1. Available online: https://www.osha.gov/dsg/annotated-pels/tablez-1.html (accessed on 17 June 2021).
- Federal Environmental Agency of Germany. Richtwerte für die Innenraumluft. Institut für Wasser-,Boden- und Lufthygiene des Umweltbundesamtes, Berlin. In Die Beurteilung der Innenraumluftqualität mit Hilfe der Summe der Flüchtigen Organischen Verbindungen (TVOC-Wert); Bundesgesundheitsbl-Gesundheitsforsch-Gesundheitsschutz: Berlin, Germany, 1999. [Google Scholar]
- American Conference of Governmental Industrial Hygienists (ACGIH). Threshold Limit value for Glycerin Mist; American Conference of Governmental Industrial Hygienists: Cincinnati, OH, USA, 2001. [Google Scholar]
- European Agency for Safety and Health at Work (EU OSHA). Directive 2006/15/EC-Indicative Occupational Exposure Limit Values. Available online: https://osha.europa.eu/en/legislation/directives/commission-directive-2006-15-ec (accessed on 17 June 2021).
- American Industrial Hygiene Association (AIHA). Workplace Environmental Exposure Level (WEEL) Values; AIHA Guidline Foundation: Falls Church, VA, USA, 2011. [Google Scholar]
- Die Richtwerte I und II für Stoffe der Innenraumluft. Federal Environment Agency of Germany (Umweltbundesamt), Indoor Guidelines Committee (Ausschuss für Innenraumrichtwerte (Vormals Ad-hoc-Arbeitsgruppe). Available online: https://www.umweltbundesamt.de/themen/gesundheit/kommissionen-arbeitsgruppen/ausschuss-fuer-innenraumrichtwerte-vormals-ad-hoc#ausschuss-fur-innenraumrichtwerte (accessed on 17 June 2021).
- Höllbacher, E.; Ters, T.; Rieder-Gradinger, C.; Srebotnik, E. Emissions of indoor air pollutants from six user scenarios in a model room. Atmos. Environ. 2017, 150, 389–394. [Google Scholar] [CrossRef]
- Destaillats, H.; Singer, B.; Salthammer, T. Does vaping affect indoor air quality? Indoor Air 2020, 30, 793–794. [Google Scholar] [CrossRef] [PubMed]
- Hirano, T.; Takei, T. Estimating the Carcinogenic Potency of Second-Hand Smoke and Aerosol from Cigarettes and Heated Tobacco Products. Int. J. Environ. Res. Public Health 2020, 17, 8319. [Google Scholar] [CrossRef] [PubMed]
- Picavet, P.; Haziza, C.; Goujon-Glinger, C.; Peitsch, M.C. Passive exposure to ENDP aerosols. In Toxicological Evaluation of Electronic Nicotine Delivery Products; Peitsch, M.C., Hoeng, J., Eds.; Academic Press: Cambridge, MA, USA, 2021; Volume 19, pp. 501–512. [Google Scholar]
- The Federal Assembly of the Swiss Confederation (Ed.) Federal Act on Research involving Human Beings (Human Research Act, HRA); Fedlex: Berna, Switzerland, 2011; Volume 810.30. [Google Scholar]
- The Human Research Act and the Ethics Committees for Research. Factsheet by the Coordination Office for Human Research (Kofam). Available online: https://www.kofam.ch/filemanager/downloads/gutachten_und_berichte/BAG_Faktenblatt_Ethik_A4_E_def.pdf (accessed on 19 July 2021).


| ACH 1 | Session | Mean | Session | Mean | Mean, BKG-Subtracted | Inert Airborne Nicotine Model | Loss | Loss, BKG-Corrected |
|---|---|---|---|---|---|---|---|---|
| (h−1) | (µg/m3) | (µg/m3) | (µg/m3) | (µg/m3) | (%) | (%) | ||
| 0.5 | Background Rep 1 | 0.426 | THS Rep 1 | 1.49 | 1.06 | 113.83 | 98.7 | 99.1 |
| 0.5 | Background Rep 2 | 0.303 | THS Rep 2 | 1.36 | 1.06 | 99.45 | 98.6 | 98.9 |
| 0.5 | Background Rep 3 | 0.291 | THS Rep 3 | 0.888 | 0.597 | 72.07 | 98.8 | 99.2 |
| 0.5 | Background Rep 4 | 0.249 | THS Rep 4 | 0.633 | 0.633 | 89.12 | 99.3 | 99.3 |
| 2.4 | Background Rep 1 | 0.249 | THS Rep 1 | 2.20 | 2.2 | 40.59 | 94.6 | 94.6 |
| 2.4 | Background Rep 2 | 0.243 | THS Rep 2 | 0.550 | 0.55 | 39.06 | 98.6 | 98.6 |
| 2.4 | Background Rep 3 | 0.243 | THS Rep 3 | 0.792 | 0.792 | 34.45 | 97.7 | 97.7 |
| 2.4 | Background Rep 4 | 0.243 | THS Rep 4 | 0.636 | 0.636 | 26.36 | 97.6 | 97.6 |
| 4.3 | Background Rep 1 | 0.249 | THS Rep 1 | 0.900 | 0.9 | 24.76 | 96.4 | 96.4 |
| 4.3 | Background Rep 2 | 0.249 | THS Rep 2 | 1.05 | 1.05 | 24.31 | 95.7 | 95.7 |
| 4.3 | Background Rep 3 | 0.249 | THS Rep 3 | 1.57 | 1.57 | 28.56 | 94.5 | 94.5 |
| 4.3 | Background Rep 4 | 0.249 | THS Rep 4 | 1.90 | 1.90 | 31.29 | 93.9 | 93.9 |
Publisher’s Note: MDPI stays neutral with regard to jurisdictional claims in published maps and institutional affiliations. |
© 2021 by the authors. Licensee MDPI, Basel, Switzerland. This article is an open access article distributed under the terms and conditions of the Creative Commons Attribution (CC BY) license (https://creativecommons.org/licenses/by/4.0/).
Share and Cite
Mitova, M.I.; Cluse, C.; Correia, D.; Goujon-Ginglinger, C.G.; Kleinhans, S.; Poget, L.; Sendyk, S.S. Comprehensive Air Quality Assessment of the Tobacco Heating System 2.2 under Simulated Indoor Environments. Atmosphere 2021, 12, 989. https://0-doi-org.brum.beds.ac.uk/10.3390/atmos12080989
Mitova MI, Cluse C, Correia D, Goujon-Ginglinger CG, Kleinhans S, Poget L, Sendyk SS. Comprehensive Air Quality Assessment of the Tobacco Heating System 2.2 under Simulated Indoor Environments. Atmosphere. 2021; 12(8):989. https://0-doi-org.brum.beds.ac.uk/10.3390/atmos12080989
Chicago/Turabian StyleMitova, Maya I., Camille Cluse, Daniela Correia, Catherine G. Goujon-Ginglinger, Samuel Kleinhans, Laurent Poget, and Sandra S. Sendyk. 2021. "Comprehensive Air Quality Assessment of the Tobacco Heating System 2.2 under Simulated Indoor Environments" Atmosphere 12, no. 8: 989. https://0-doi-org.brum.beds.ac.uk/10.3390/atmos12080989