
Quantifying the Effect of Building Shadowing and Cloudiness on Mean Radiant Temperature in Singapore


1
Singapore-MIT Alliance for Research and Technology, 1 Create Way #09-03, Singapore 138602, Singapore
2
Massachusetts Institute of Tecnology (MIT), 265 Massachusetts Ave, Cambridge, MA 02139, USA
*
Author to whom correspondence should be addressed.
Atmosphere 2021, 12(8), 1012; https://0-doi-org.brum.beds.ac.uk/10.3390/atmos12081012
Submission received: 23 June 2021
/
Revised: 3 August 2021
/
Accepted: 3 August 2021
/
Published: 6 August 2021
(This article belongs to the Special Issue Outdoor Thermal Comfort in Cities: Assessing and Developing Green, Blue and Grey Solutions for Healthy and Sustainable Urban Future)
Abstract
:Improving the quality of life in urban areas has become a major concern in the last few decades. With a constantly increasing urban population and in a climate change context, detailed knowledge of the impact of urban elements on the outdoor thermal environment is relevant. In this work, we present the results of several climatic campaigns carried out in Singapore aiming to evaluate local urban climate variables. Sensors were deployed simultaneously in different sites. The effect of building shadowing in the diurnal cycle of mean radiant temperature (Tmrt) is evaluated in different seasons. Although during the Inter-Monsoon season, mean Tmrt reduction due to building shadow is ≈19 °C, during clear skies days, it can be reduced by ≈30 °C. The Tmrt difference between sites is analyzed based on the weather conditions, the sky view factor (SVF), and the type of surrounding urban elements. Under building shadow conditions, higher SVF showed higher Tmrt values, although no correlation was found between Tmrt and diffuse solar radiation (measured above the urban canopy). The results suggest a relevant contribution of other radiation components (e.g., longwave radiation). The quantitative analysis of the Tmrt provided in this work is relevant for outdoor thermal comfort strategies in tropical areas such as Singapore.
1. Introduction
With the aim of improving outdoor thermal comfort (OTC) in urban areas, research and studies have been increasingly carried out during the last decades. One of the main drivers is the necessity of adapting urban areas to climate change where the population will continue to grow in the future [1]. Urban heat mitigation strategies can help minimize the increase of air temperature inside the urban fabric [2,3,4,5], but they do not in all cases improve OTC [6,7,8].
Outdoor thermal comfort in urban areas is highly governed by the urban morphology. Many studies have pointed to street orientation and street aspect ratio as the most relevant parameters to determine outdoor thermal comfort levels [9,10,11,12,13,14]. However, other urban characteristics can also play an important role. Urban materials [15,16], the presence of vegetation [17,18,19], and anthropogenic heat emissions [20,21] can modify significantly OTC levels inside the urban area.
Several meteorological parameters (air temperature, humidity, wind speed, and radiation) influence thermal comfort levels. Between these variables, radiation has a relevant impact in outdoor thermal comfort [22]. However, the heat exchange by radiation between the human being and the outdoor spaces is complex due to the existence of heterogeneous longwave and shortwave radiant flux densities [23], which are influenced by the surrounding landscape. Mean radiant temperature (Tmrt) is a measure of how human beings experience radiation. It is defined as “the uniform temperature of an imaginary enclosure in which the radiant heat transfer from the human body equals the radiant heat transfer in the actual non-uniform enclosure” [24]. Different studies have shown and quantified the influence of Tmrt in human thermal comfort in outdoor spaces [25,26,27,28]. While different methods to estimate outdoor Tmrt are available [27], a common and simple approach to measure Tmrt is the use of the globe thermometer [29,30].
Urban morphology has an important influence on Tmrt at the pedestrian level [31,32,33]. Tmrt spatial and temporal variations are highly conditioned by shortwave radiation variations, although the longwave radiation (particularly the lateral flux) contributes the majority of Tmrt magnitude at all times of the day and sites [22,34].
Similarly to Middel and Krayenhoff [34], in Arizona, Tan et al. [28] reported a correlation between sky view factor and Tmrt in Singapore. Higher SVF was associated to higher Tmrt values. For clear sunny days, differences in daily Tmrt peak between several urban spaces could reach 25 °C, with the highest Tmrt peak value reaching approximately 68 °C (SVF = 0.671 and solar irradiance slightly lower than 900 Watt/m2) [28]. Similar values were reported in Chandigarh (India) with maximum peak values of 69.3 °C on a clear sky day [23], and in Taiwan, 70.9 °C [35]. In Tempe (Arizona), maximum values reached 84.9 °C, and maximum differences between shaded and sun-exposed sites were close to 40 °C. Results highlighted the influence of urban forms, sky view factors, and solar radiation regimens on Tmrt [34,36].
In addition to the effect of urban morphology on Tmrt (e.g., by means of building shadowing), weather conditions also influence Tmrt at the pedestrian level. Specifically, cloud cover can reduce incoming solar radiation up to 80–90%. Generally, higher cloud cover will reduce the direct solar radiation while the diffuse solar radiation component will increase [37,38]. Additionally, solar elevation also influences the amount of diffuse solar radiation. Lower solar elevations will tend to increase the diffuse component due to the larger path of the radiation through the atmosphere [39,40]. Since the SVF influences the amount of direct and diffuse solar radiation components inside an urban canyon, the alteration of these radiation components (e.g., due to cloud cover) will further condition Tmrt levels [36].
This study seeks to analyze the influence of urban geometry and incoming solar radiation on mean radiant temperature to support climate-conscious urban planning and design in a hot and humid environment similar to Singapore. Both high-rise and low-rise urban developments are considered. Based on extensive measurement campaigns, the impact of building shadow and sky view factor on Tmrt is evaluated under different weather conditions and in different climatic seasons.
2. Regional Climate
Singapore is a highly populated island (712 km2) where 5.6 million people live [41]. It is located (1°18′52.79″ N and 103°50′43.47″ E) at the south of the Malayan Peninsula. Its climate is classified as tropical rainforest (Koppen climate classification Af) characterized by uniform high temperatures along the year (≈27.5 °C), high relative humidity, and significant precipitation ≈2190 mm [42].
Regional climate throughout the year is mostly governed by Asian monsoons. They influence cloudiness, surface wind speed, and wind direction [43]. The northeast (NE) monsoon season (December to March) presents higher precipitation levels (>250 mm/month) and surface wind speeds. In the southwest (SW) monsoon season, between June and September, lower precipitation occurs (≈150 mm/month) and surface winds are generally from south to southwest, mostly opposite to the NE-Monsoon. Between these two seasons, periods of low winds occur (close to calm situations, especially inland) with variable wind direction. These are the Inter-Monsoon season. The October and November period is called the wet Inter-Monsoon because higher precipitation occurs compared to the dry Inter-Monsoon (April and May). During these periods, sea breezes can develop and affect Singapore.
3. Materials and Methods
To evaluate the impact of urban planning and design on OTC in Singapore, several measurement campaigns were carried out in two areas during 2019 and 2020 [44]. In each area, 4–5 sites with different thermal characteristics were selected. In each site, a set of sensors were deployed to measure local climate variables. This paper is focused on the effect of building shadowing and SVF on mean radiant temperature (Tmrt) in different solar radiation conditions, so we will present only the measuring sites relevant for this purpose (Section 3.1). A complete description of the campaigns is presented in Acero et al. [44].
3.1. Measurement Campaigns
Two campaigns of several months were carried out in two different urban areas of Singapore. In each area, several sets of instruments were deployed to measure simultaneously the microclimate conditions at specific sites (see Section 3.2). Sensors operated continuously throughout the campaign. The following climate variables were measured: air temperature (Ta), relative humidity (RH), wind speed (WS), wind direction (WD), precipitation (Ra), and globe temperature (Tg). For the first five variables the Weather Transmitter WXT520 of Vaisala was used. Vapor pressure (e) was derived from Ta, RH, and the saturation vapor pressure of water [45]. Tg measurements were carried out with the black globe radiant temperature device (150 mm of diameter) of Scientific Campbell.
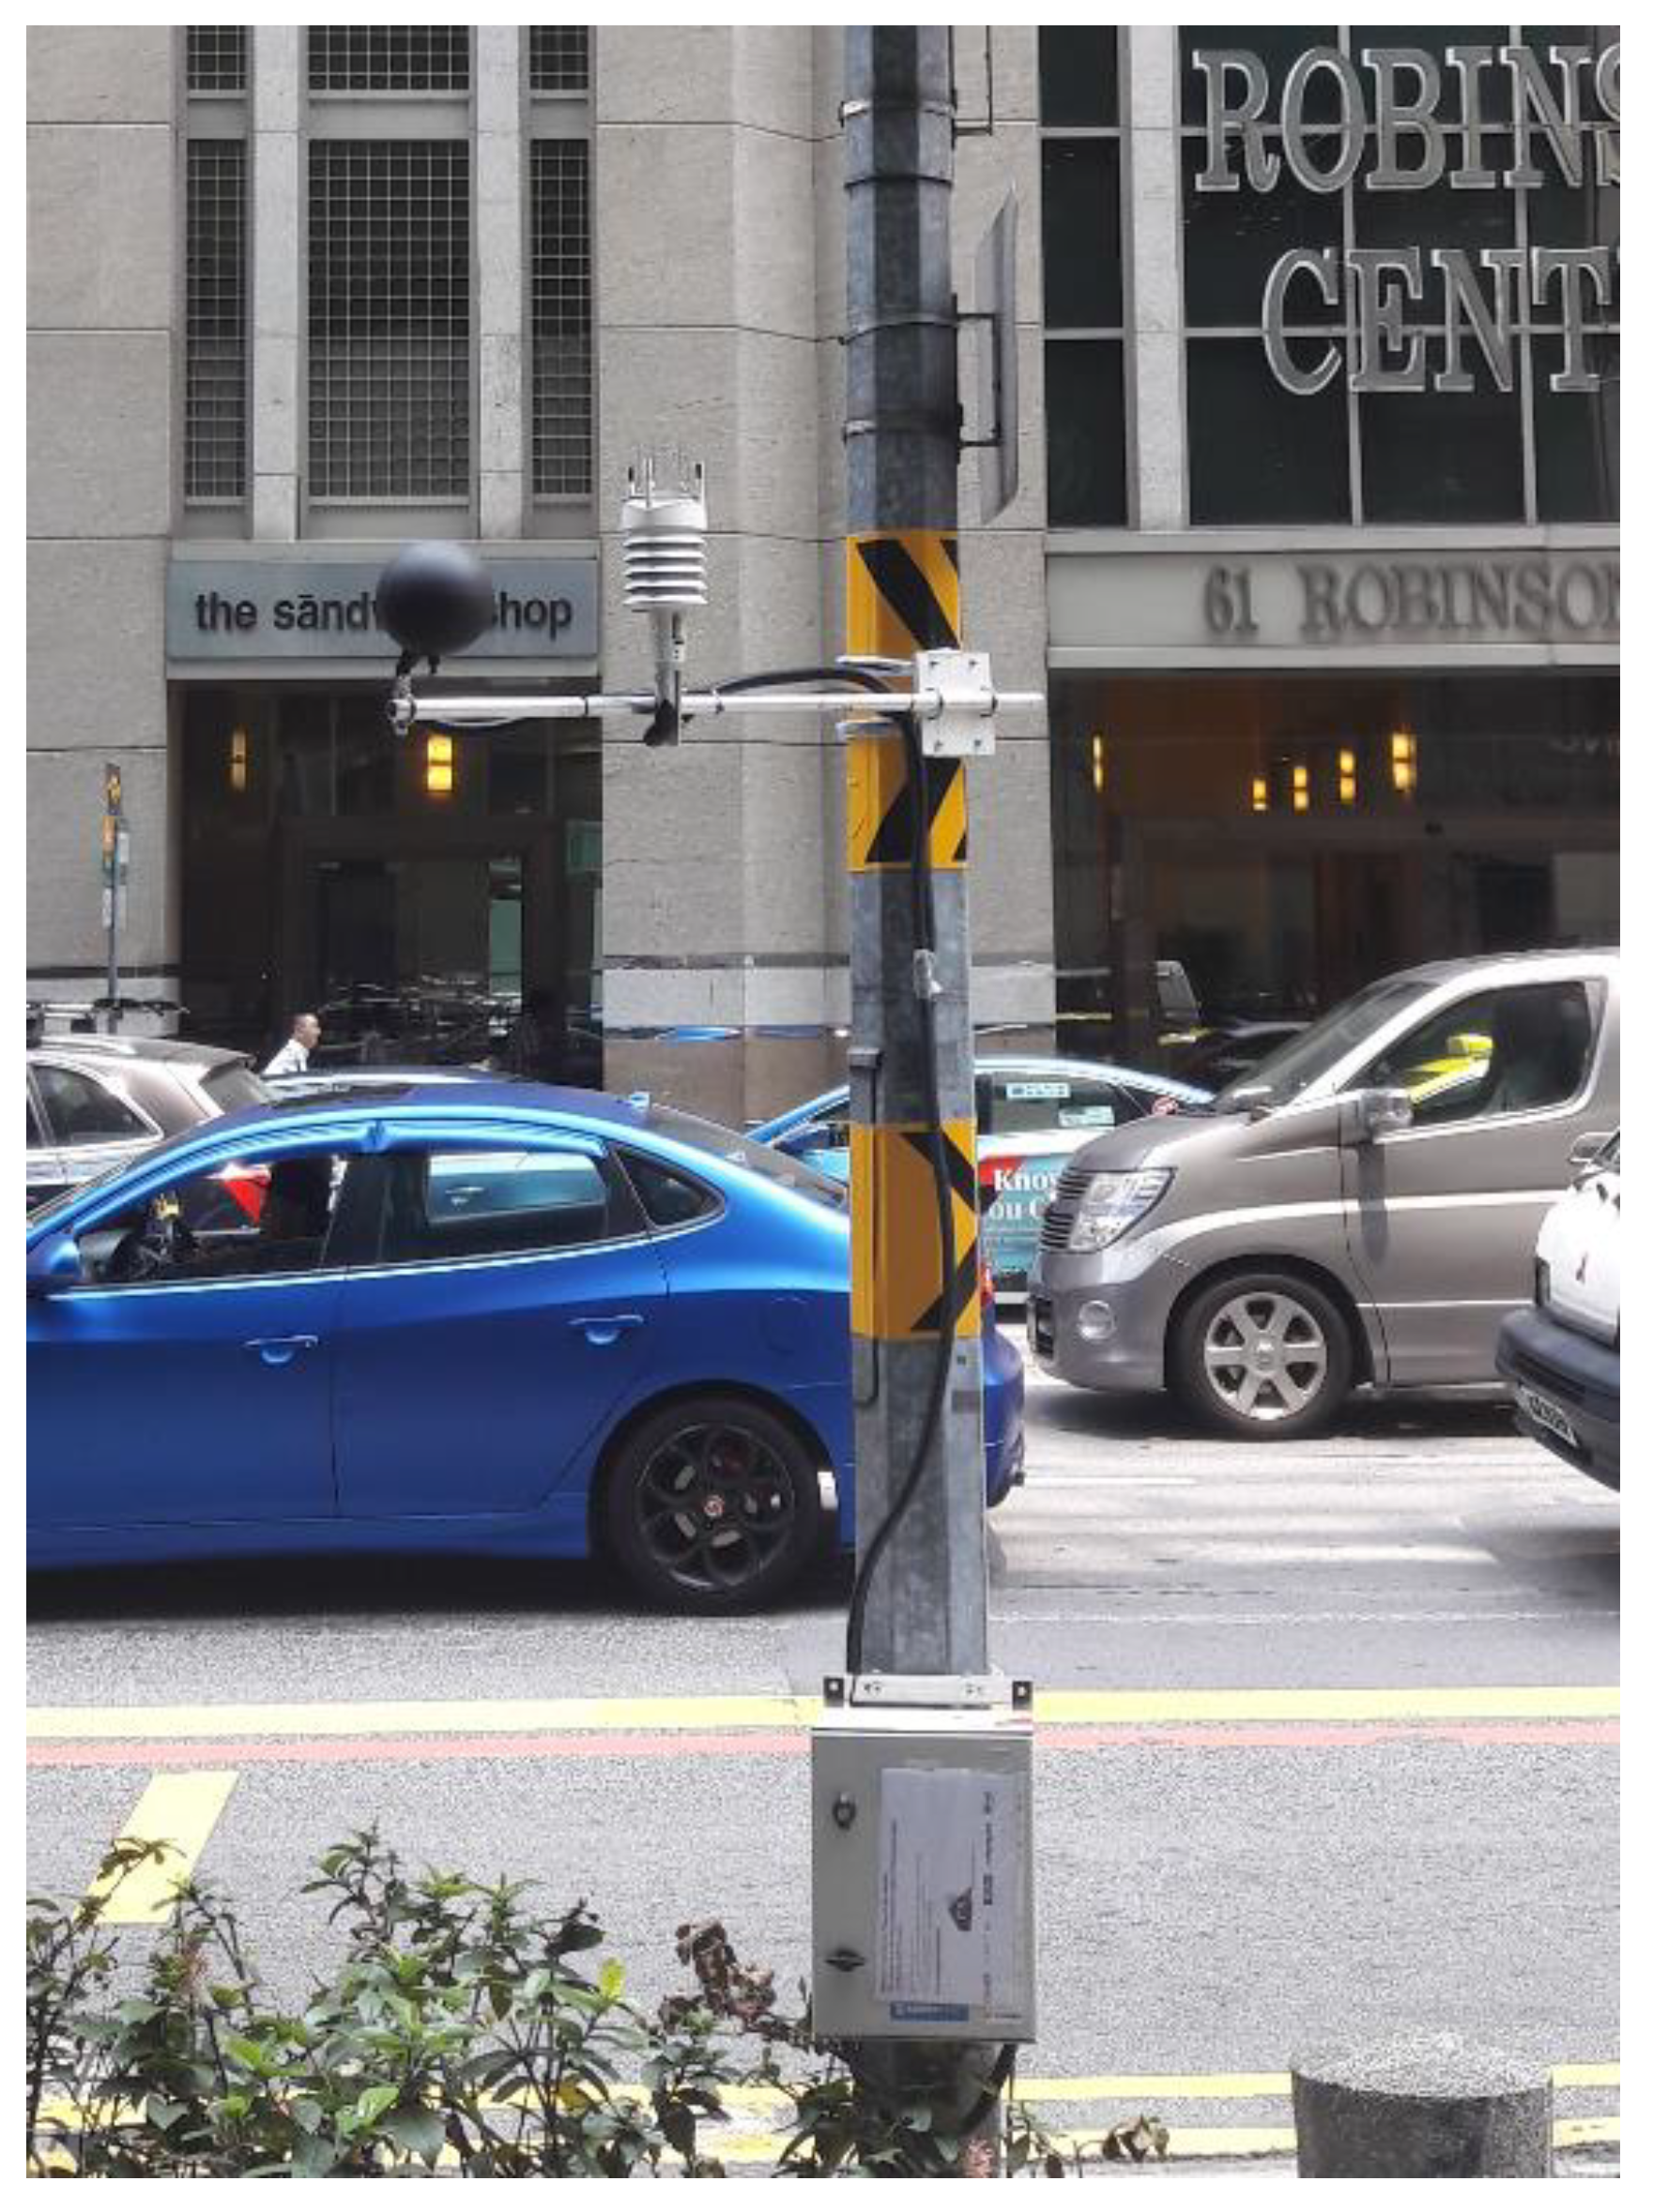
At each site, both sensors were mounted on a reinforced metallic arm and attached to a lamp post (Figure 1). The metallic arm extended around 1.2 m away from the lamp post to avoid wind obstructions. All sensors were between 2.2 and 2.4 m above the ground level to comply with governmental agencies’ requirements.
A data logger (Scientific Campbell CR300) was used to store 1-min average values recorded by the sensors. Together with the necessary battery (18 Amph at 12 V) to power all the instruments at each site, the data logger was secured in a waterproof enclosure attached to the same lamp post.
The sensors provided the following accuracy for the measurements: ±0.3 °C for Ta and Tg, ±3% for RH, ±3% for WS, ±3° for WD, and <5% for rainfall.
Tmrt was derived from measurements using Formula (1) where a mean convection coefficient [24] is specifically defined for Singapore [46]:
where Tg is the globe temperature (°C), WS is the wind speed (ms−1), Ta is the air temperature (°C), D is the globe diameter (m), and ϵ is the globe emissivity. In our case, ϵ = 0.95 (for black globe).
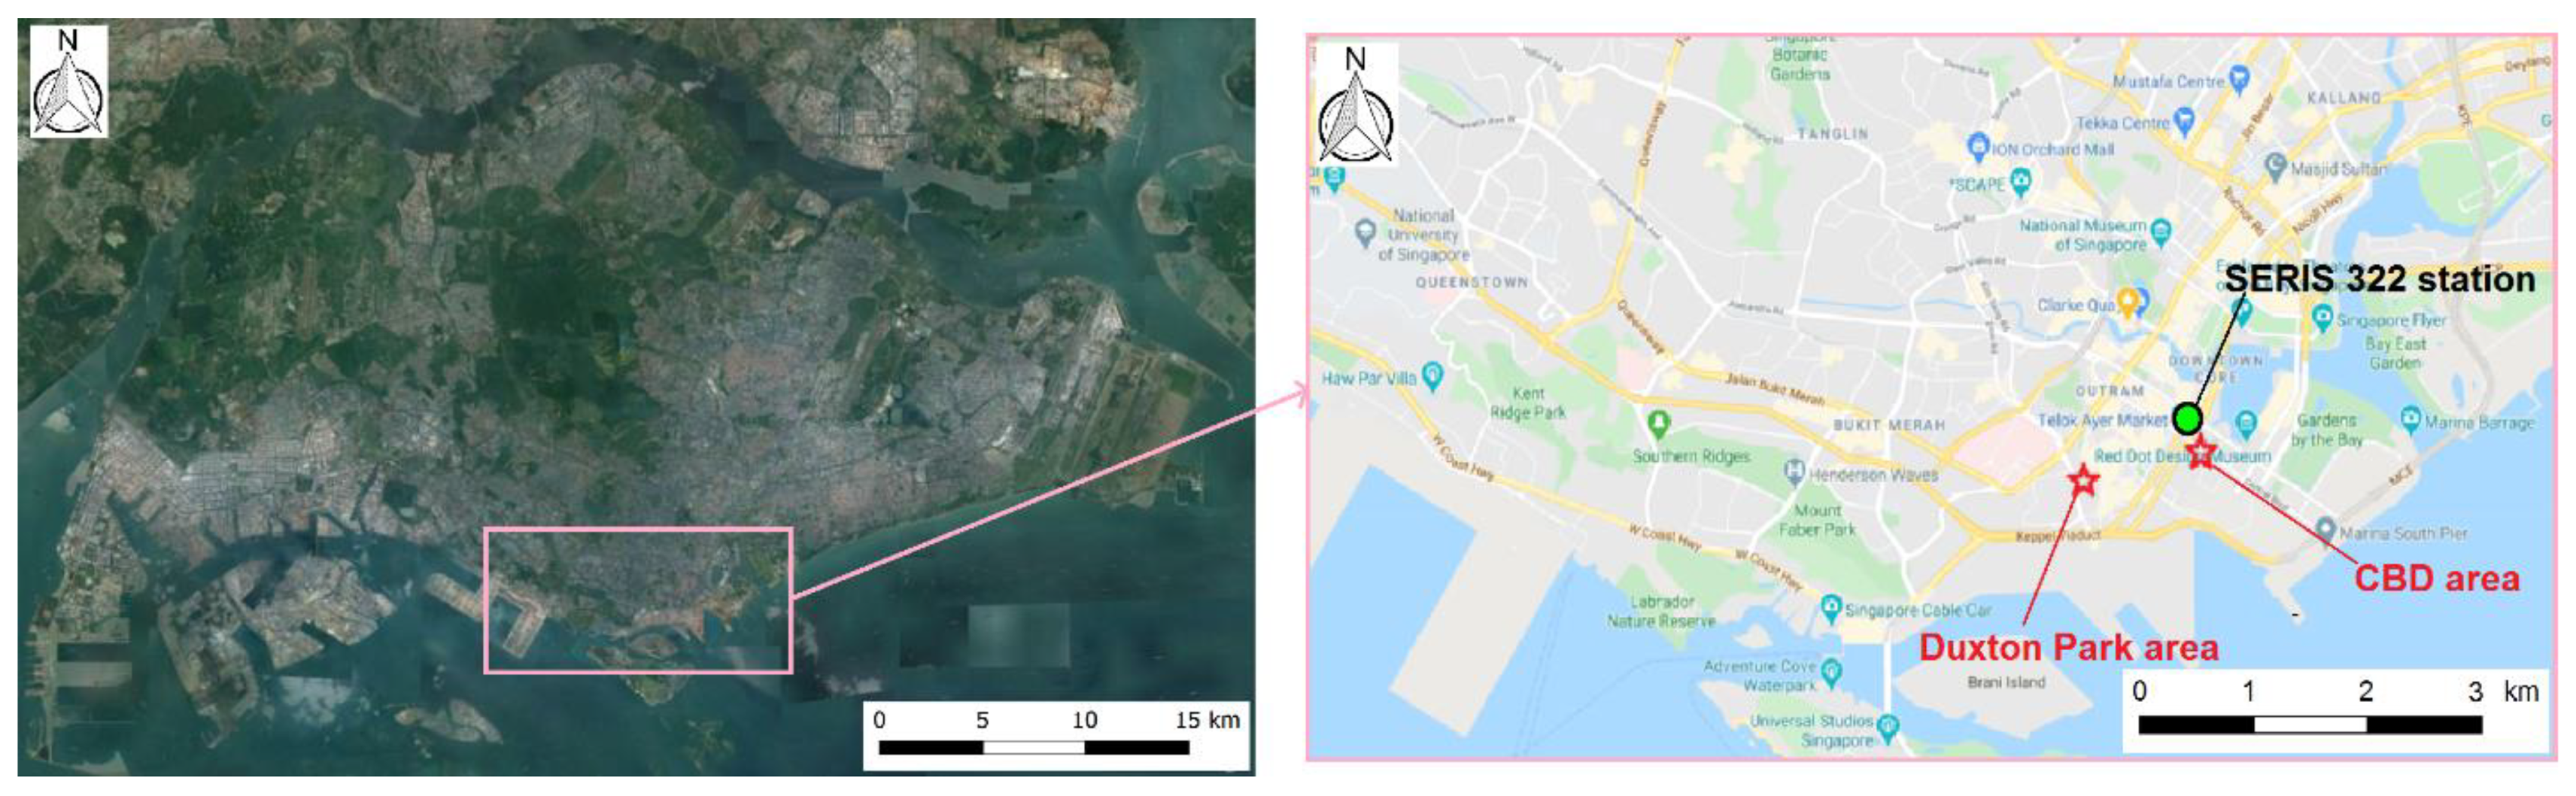
Additionally, 10-min values of global solar irradiance measured in station 322 of the Solar Energy Research Institute in Singapore (SERIS) were used to evaluate the level of cloudiness during the measurement campaign. This station is located on a roof (above the urban canopy) close to the two areas (Section 3.2) where sensors were deployed. Although cloudiness in Singapore can vary significantly in short distances, it is considered that the measured global and diffuse solar radiation in station 322 is representative of the areas of study. The uncertainty of the irradiance sensors is 5% [47].
3.2. Areas and Sites of Measurements
Two different areas of Singapore (Duxton Park and the Commercial and Business District (CBD)) were selected to deploy several sensors simultaneously (Figure 2). Specific measuring sites inside each area were selected to provide relevant and representative data to analyze the impact on Tmrt of building shadowing and cloudiness in different types of urban developments.
3.2.1. Duxton Park Area
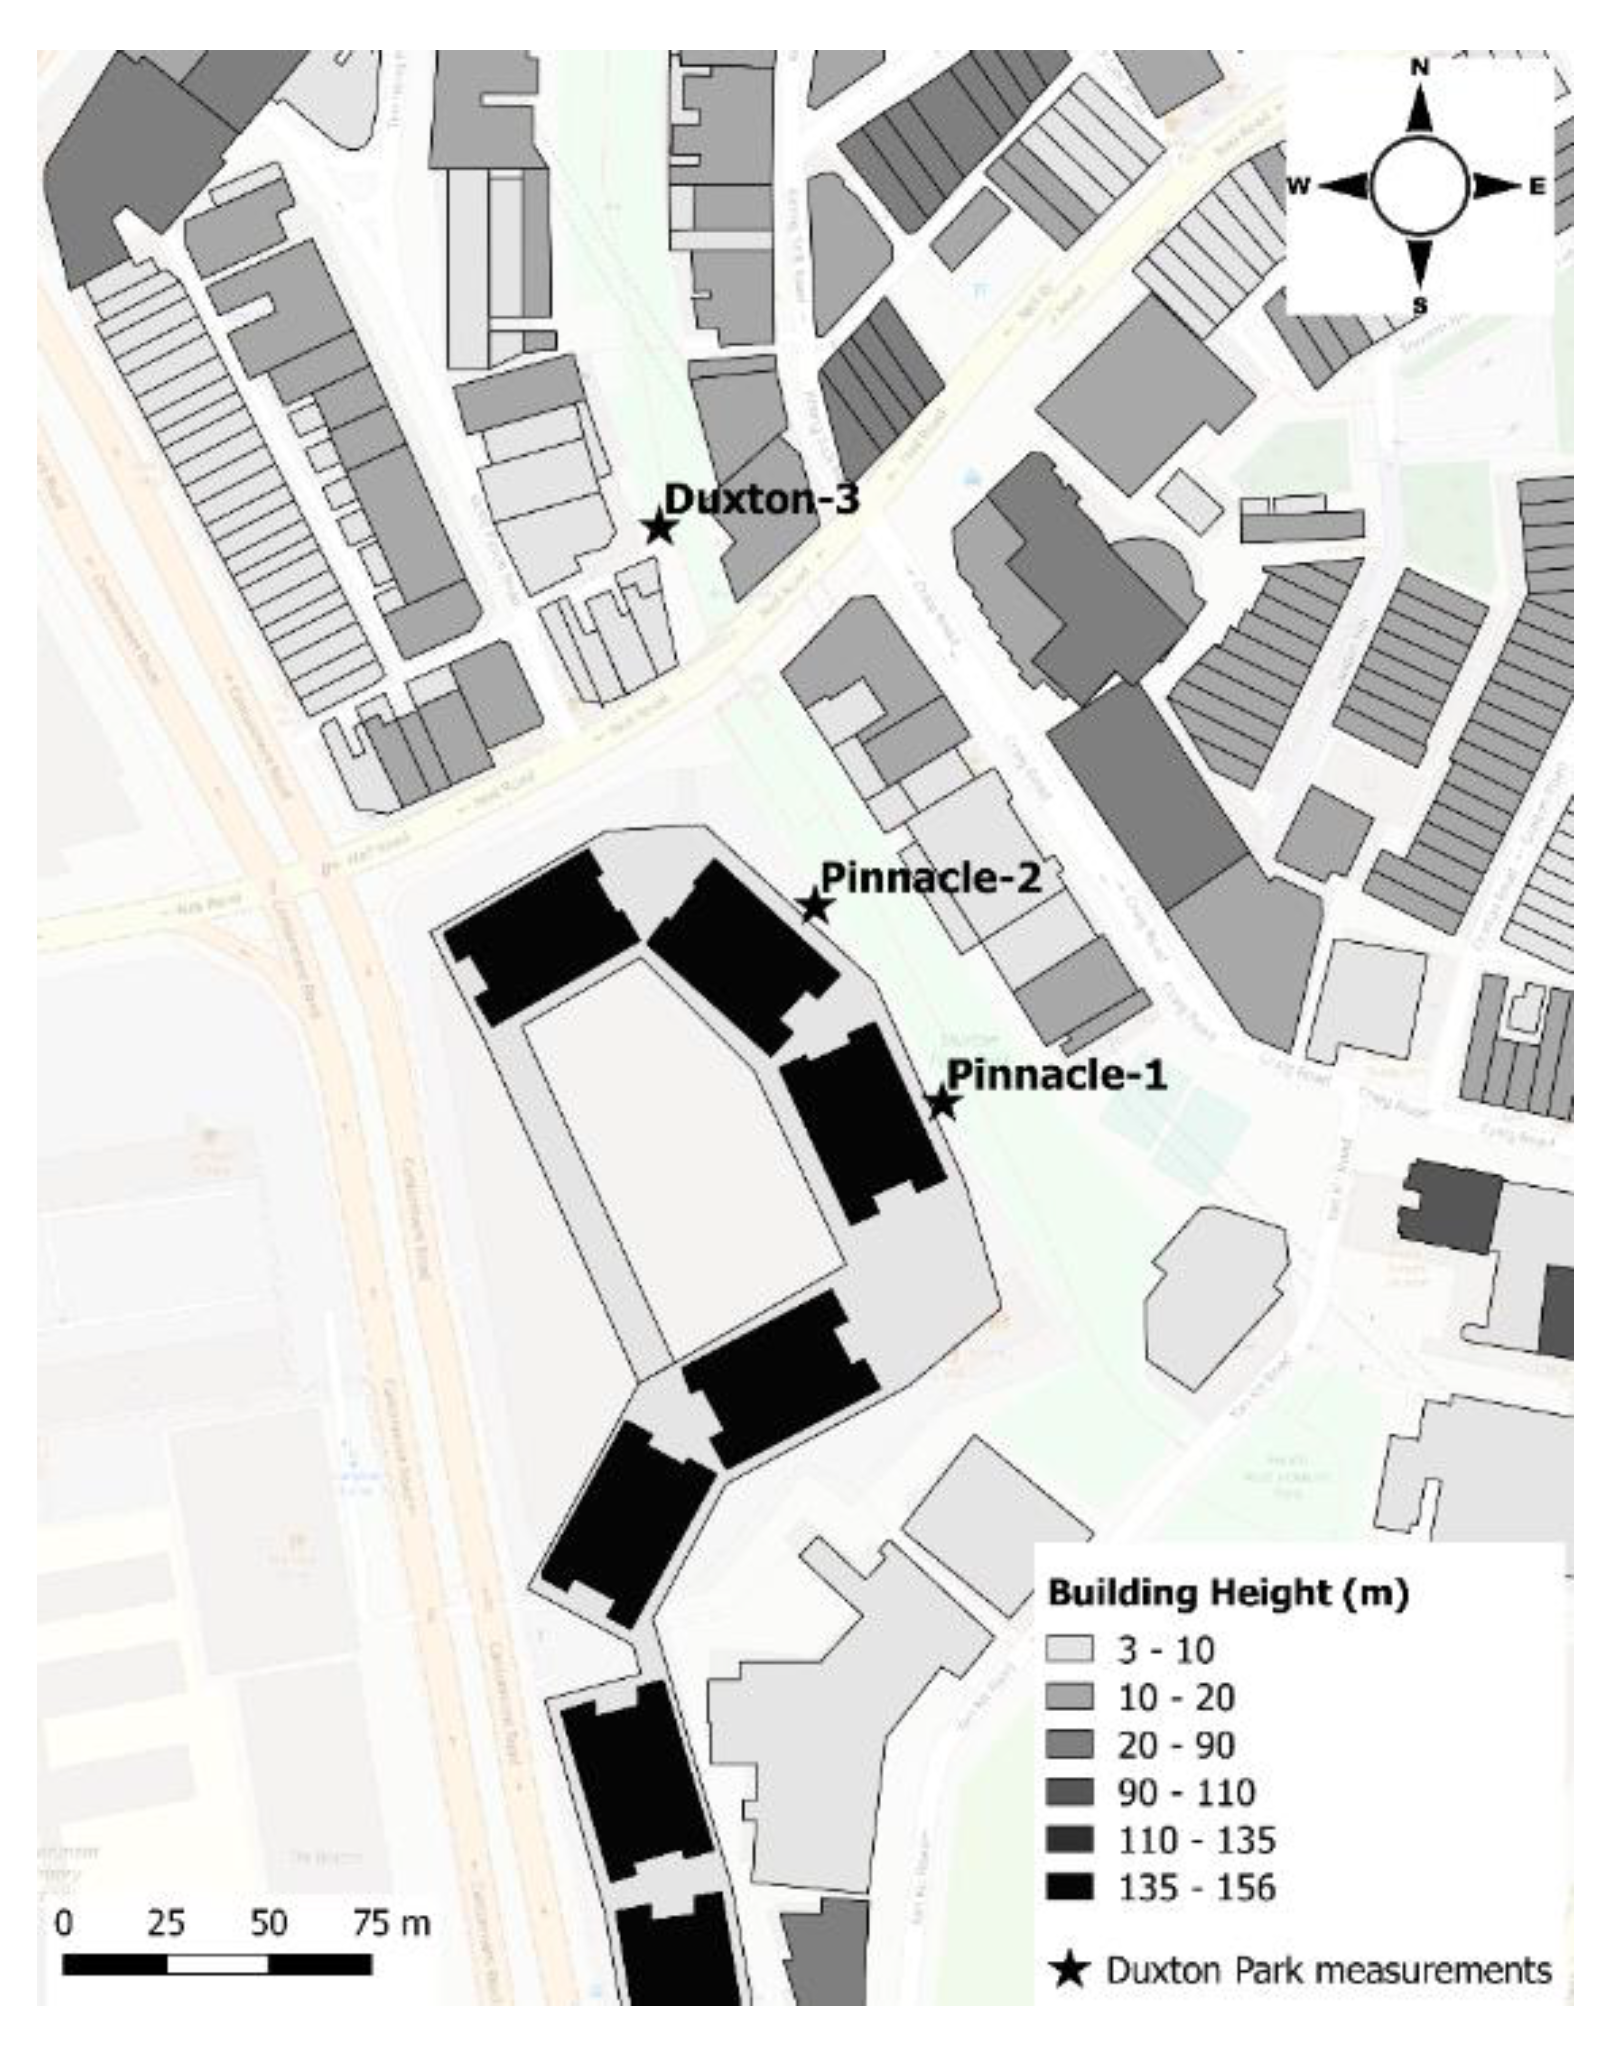
The Duxton Park area is of particular interest because of its location and nature. Located close to the CDB, the high-rise developed area of Singapore, it is mostly used by residents. It is a short, narrow, and green corridor that offers an alternative route compared to the more heavy trafficked nearby streets. In addition, the area combines different urban typologies (Figure 3). Different street canyon aspect ratios (the ratio between the street width and the aside averaged building height) and building height asymmetry (e.g., Pinnacle high-rise building versus low-rise shop-houses) can be found.
Three sites (Pinnacle1, Pinnacle2, and Duxton3) have been selected to analyse the impact of urban typologies, building shadowing and cloud cover on Tmrt. In these sites, simultaneous measurements were carried out between 4 July and 23 October 2019 (3.5 months), including the SW-Monsoon season and part of the wet Inter-Monsoon season (see Section 2). A description of the specific sites where the sensors were located is presented in Table 1.
3.2.2. CBD Area
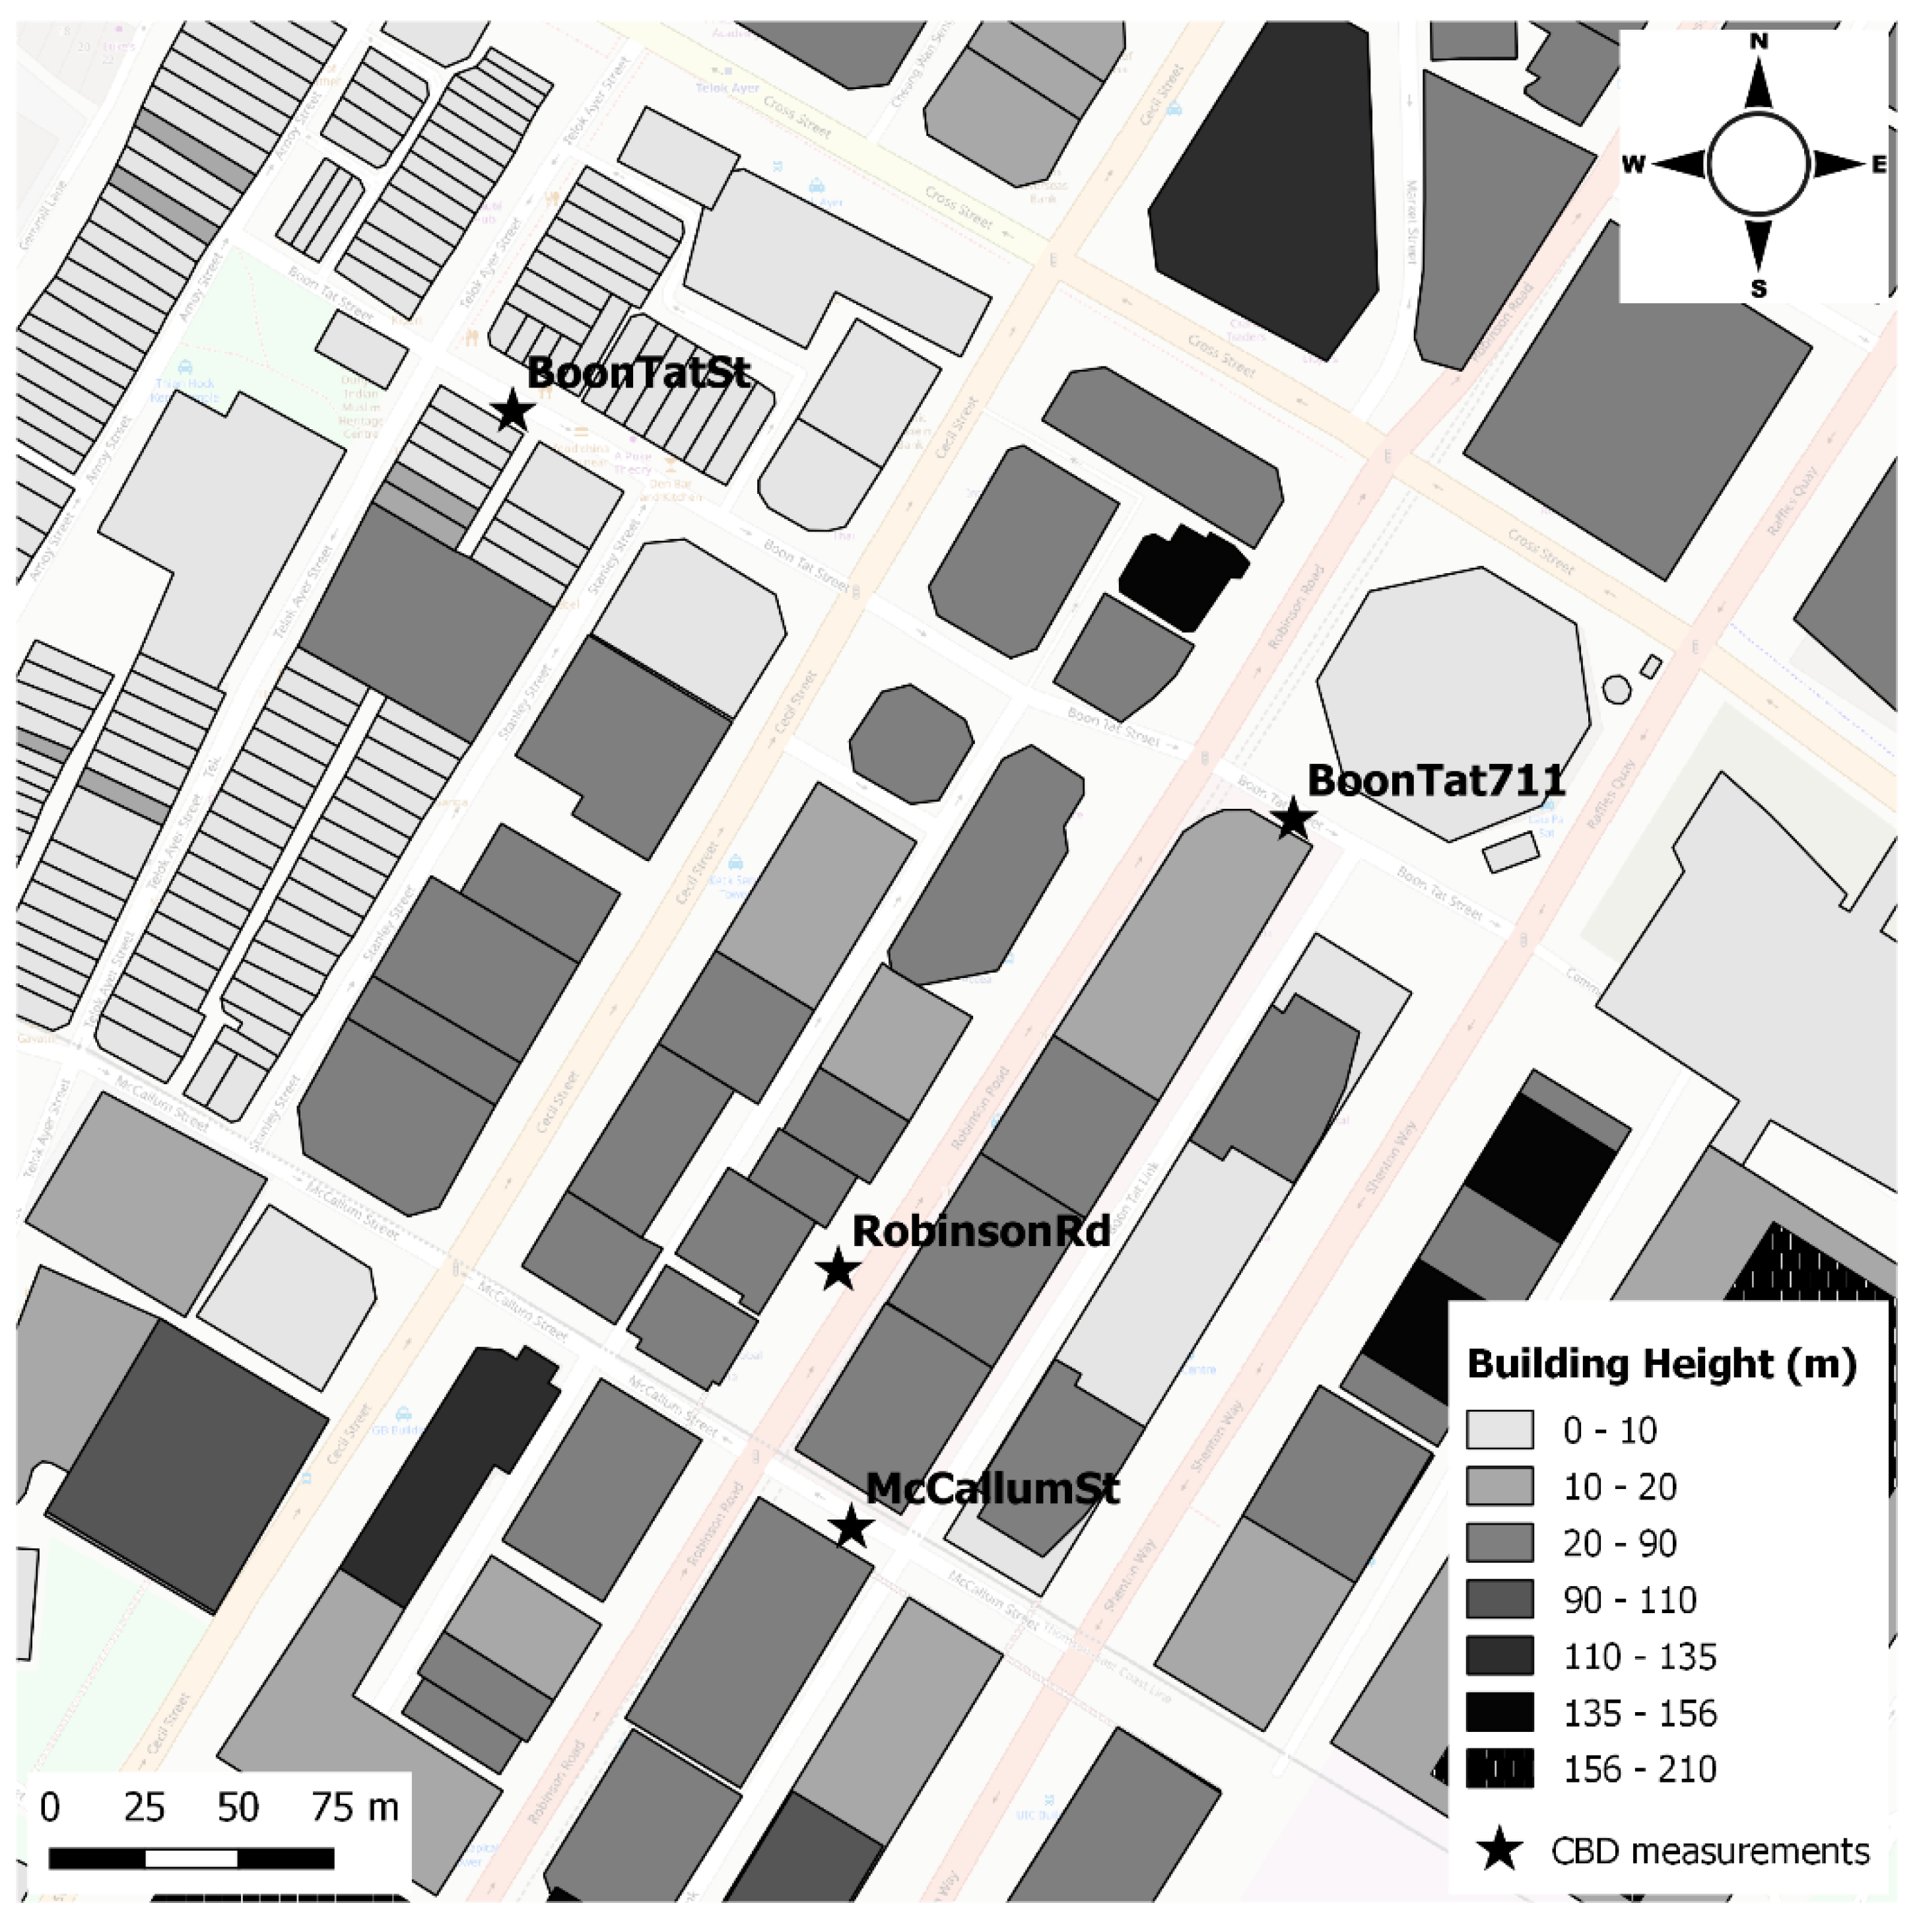
The high-rise CBD of Singapore is different to Duxton Park (Section 3.2.1) not only because of the type of urban development but also the activities carried out. It is the heart of Singapore’s financial activities and is currently mostly used by office worker commuters. The area where the sensors were deployed is less than 0.3 km2 (Figure 4), around Robinson Road, and between Boon Tat Street and McCallum Street. It includes streets with different aspect ratios, street orientations (NE-SW and NW-SE), and building height asymmetry (e.g., BoonTat711 site), as described in Table 2.
At four outdoor sites (BoonTat711, BoonTatSt, RobinsonRd, and McCallumSt), measurements were carried out simultaneously between 15 November 2019 and 13 January 2020 (2 months), which includes the last part of the wet Inter-Monsoon season and the wet NE-Monsoon season (see Section 2). A description of the specific sites is presented in Table 2.
3.3. Analysis of Climate Variables
At each site, 10-min mean climatic values were calculated from 1-min records stored in the data logger (see Section 3.1).
With the aim of analyzing the impact of high-rise buildings’ shadow and cloud cover on Tmrt, diurnal cycles for different time periods (e.g., climatic seasons) were calculated. In addition, average values during the midday/afternoon period (11:10 to 16:00) were extracted to compare the daily highest Tmrt values between different sites. The analysis was carried out for different climatic seasons as well as for specific days.
In Pinnacle1 and Pinnacle2 (Duxton Park area), two days (13 July and 11 October 2019) with clear skies were selected. At each site, WS, Ta and e mean afternoon values were similar during both days, although Pinnacle1 always registered higher WS and lower Ta values (Table 3). When building shadow started to affect both sites, global radiation was 720 Watt/m2 and 1002 Watt/m2 on 13 July and 11 October, respectively.
To analyze the influence of cloudiness and solar radiation in Tmrt, hourly values were evaluated against the clearness index defined as:
where GHI is the global horizontal irradiance and GHICS is the clear skies global horizontal irradiance.
Thus, Kt represents a dimensionless number between 0 and 1, which is defined as the surface global radiation divided by the surface global radiation when conditions of clear skies occur (i.e., maximum transmission of solar radiation through the atmosphere).
For Singapore, Dazhi et al. [50] defined the GHICS as:
where E0 is an eccentricity correction factor of Earth, Isc is the solar constant (1366.1 Watt/m2), and θz is the solar zenith angle.
Correlation analysis between Tmrt and Kt have been undertaken for August 2019 at 10:30 and 17:00 for different sites (shaded and non-shaded).
Additionally, the diurnal cycle of Tmrt was analyzed on a clear skies day and a cloudy day. Two days in the SW-Monsoon season (25 July and 1 August) were selected. These selected days were close to one another to avoid significant difference in the solar elevation (and the timing of Tmrt peak values). In addition, no precipitation occurred during these days. On 25 July, the sky was covered with clouds throughout the day, with different levels of incoming solar radiation. On the contrary, 1 August presented during most of the day clear skies (high solar radiation), although some periods of clouds occurred before midday. Table 4 shows the mean and maximum solar irradiance registered in the area during different periods of the day. The mean wind conditions were very similar throughout the day, but the temperature was higher on 1 August (clear sky day).
4. Results and Discussion
4.1. Impact of Building Shadow
In this section, the influence of the shadow of a high-rise building on Tmrt is presented. Results are analyzed at the pedestrian level. The analysis is presented for different climatic seasons (mean values) and for two clear skies days when the impact of building shadow on Tmrt is highest. Data registered both in Duxton Park and CBD (Section 3.2) are used to discuss the findings.
4.1.1. Differences between Climatic Seasons
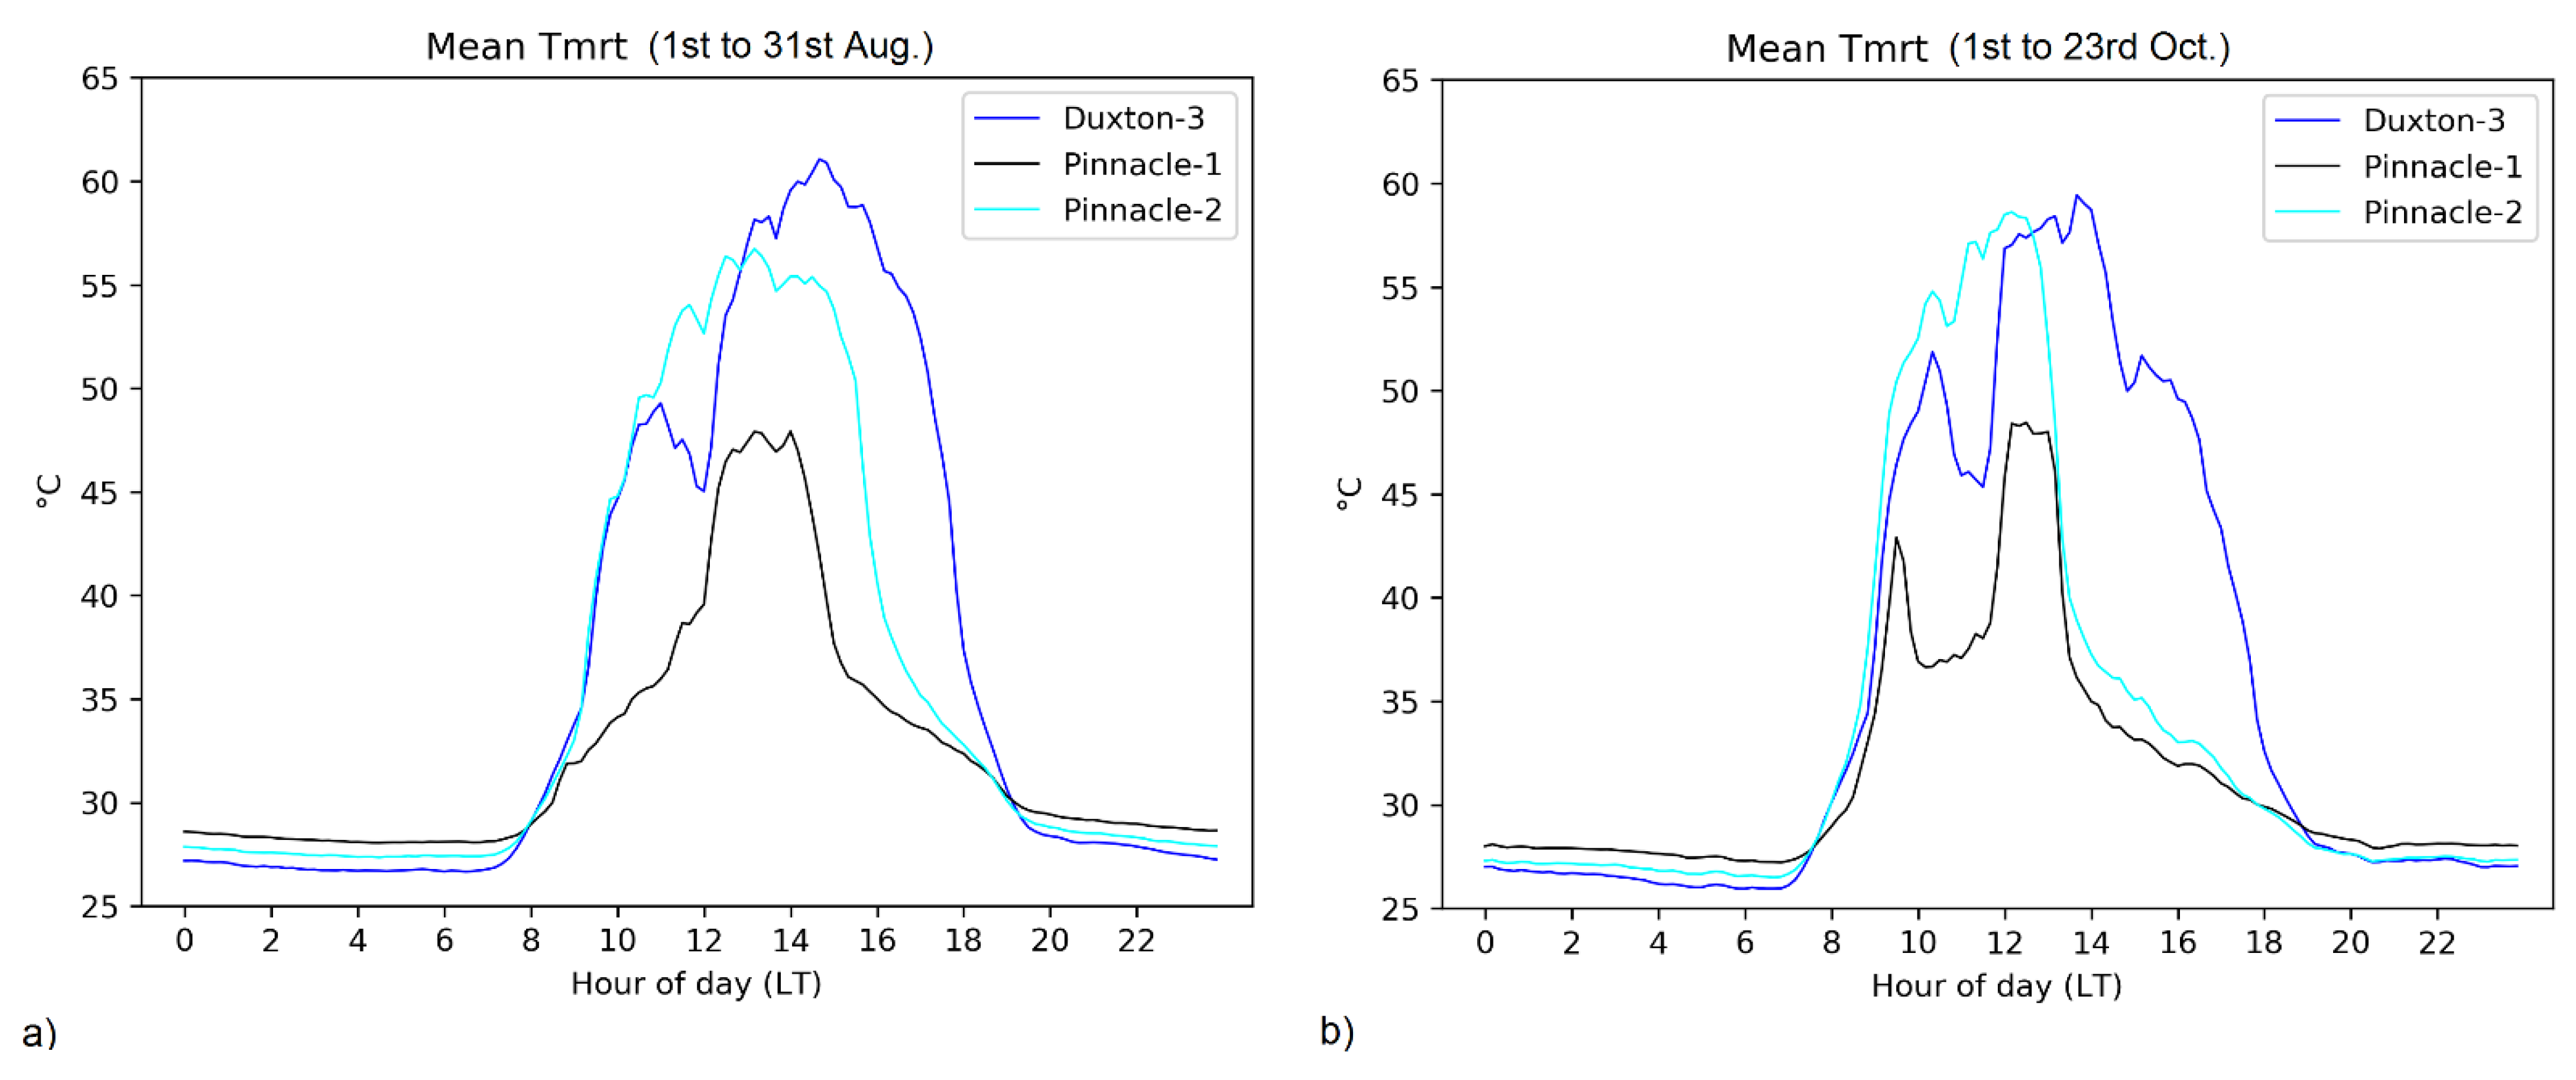
Figure 5 presents the mean diurnal profile in Pinnacle1, Pinnacle2, and Duxton3 (Duxton Park area) during the SW-Monsoon and the wet Inter-Monsoon seasons. In all sites, Tmrt peaks tend to occur later in time during the SW-Monsoon season. This can mostly be explained by the elevation of sun and the interference of the different urban elements/features with the incoming solar radiation. Although Duxton3 is not affected by building shadow, the influence on Tmrt of some tall palm trees at 11:30–12:00 is notable [44]. Maximum mean Tmrt values in Duxton3 reach 59.4 °C and 61.5 °C in the wet Inter-Monsoon and SW-Monsoon seasons, respectively.
The influence of the nearby high-rise buildings’ shadow (Figure 3) is clearly noticed in Pinnacle1 and Pinnacle2 in the afternoon. In the Inter-Monsoon season, Tmrt drops sharply at 12:40 in Pinnacle 2 and at 13:10 in Pinnacle1, with reductions mean Tmrt of ≈19 °C and ≈11 °C, respectively. Time differences between sites are attributed to different orientation (21°) of the buildings providing shadow. However, during the SW-Monsoon, the effect of building shadow is delayed ≈1.5 h with respect to the Inter-Monsoon in both sites due to the variation of the sun elevation and sun path between seasons.
The effect of building shadow (i.e., reduction of Tmrt) is much higher in Pinnacle2 than in Pinnacle1. Pinnacle2 drops ≈8 °C more than Pinnacle1 in the Inter-Monsoon season. The reason for this difference between sites is that the Pinnacle1 measuring site is already (before the shadow of the building) under the influence of trees that partly block solar radiation.
After the sharp drop in mean Tmrt, under the building shadow, Tmrt levels remain higher in Pinnacle2. This is best shown in the Inter-Monsoon season. During the afternoon (14:00 to 16:00), the difference between both sites can reach 2.5 °C. During this period of the day (both sites are under building shadow), the Tmrt difference is due to lower levels of radiation in Pinnacle1. As commented previously, the latter is partly covered by trees that limit the access of diffuse solar radiation but also the surrounding surfaces are colder (e.g., leaves), reducing longwave irradiance in Pinnacle1.
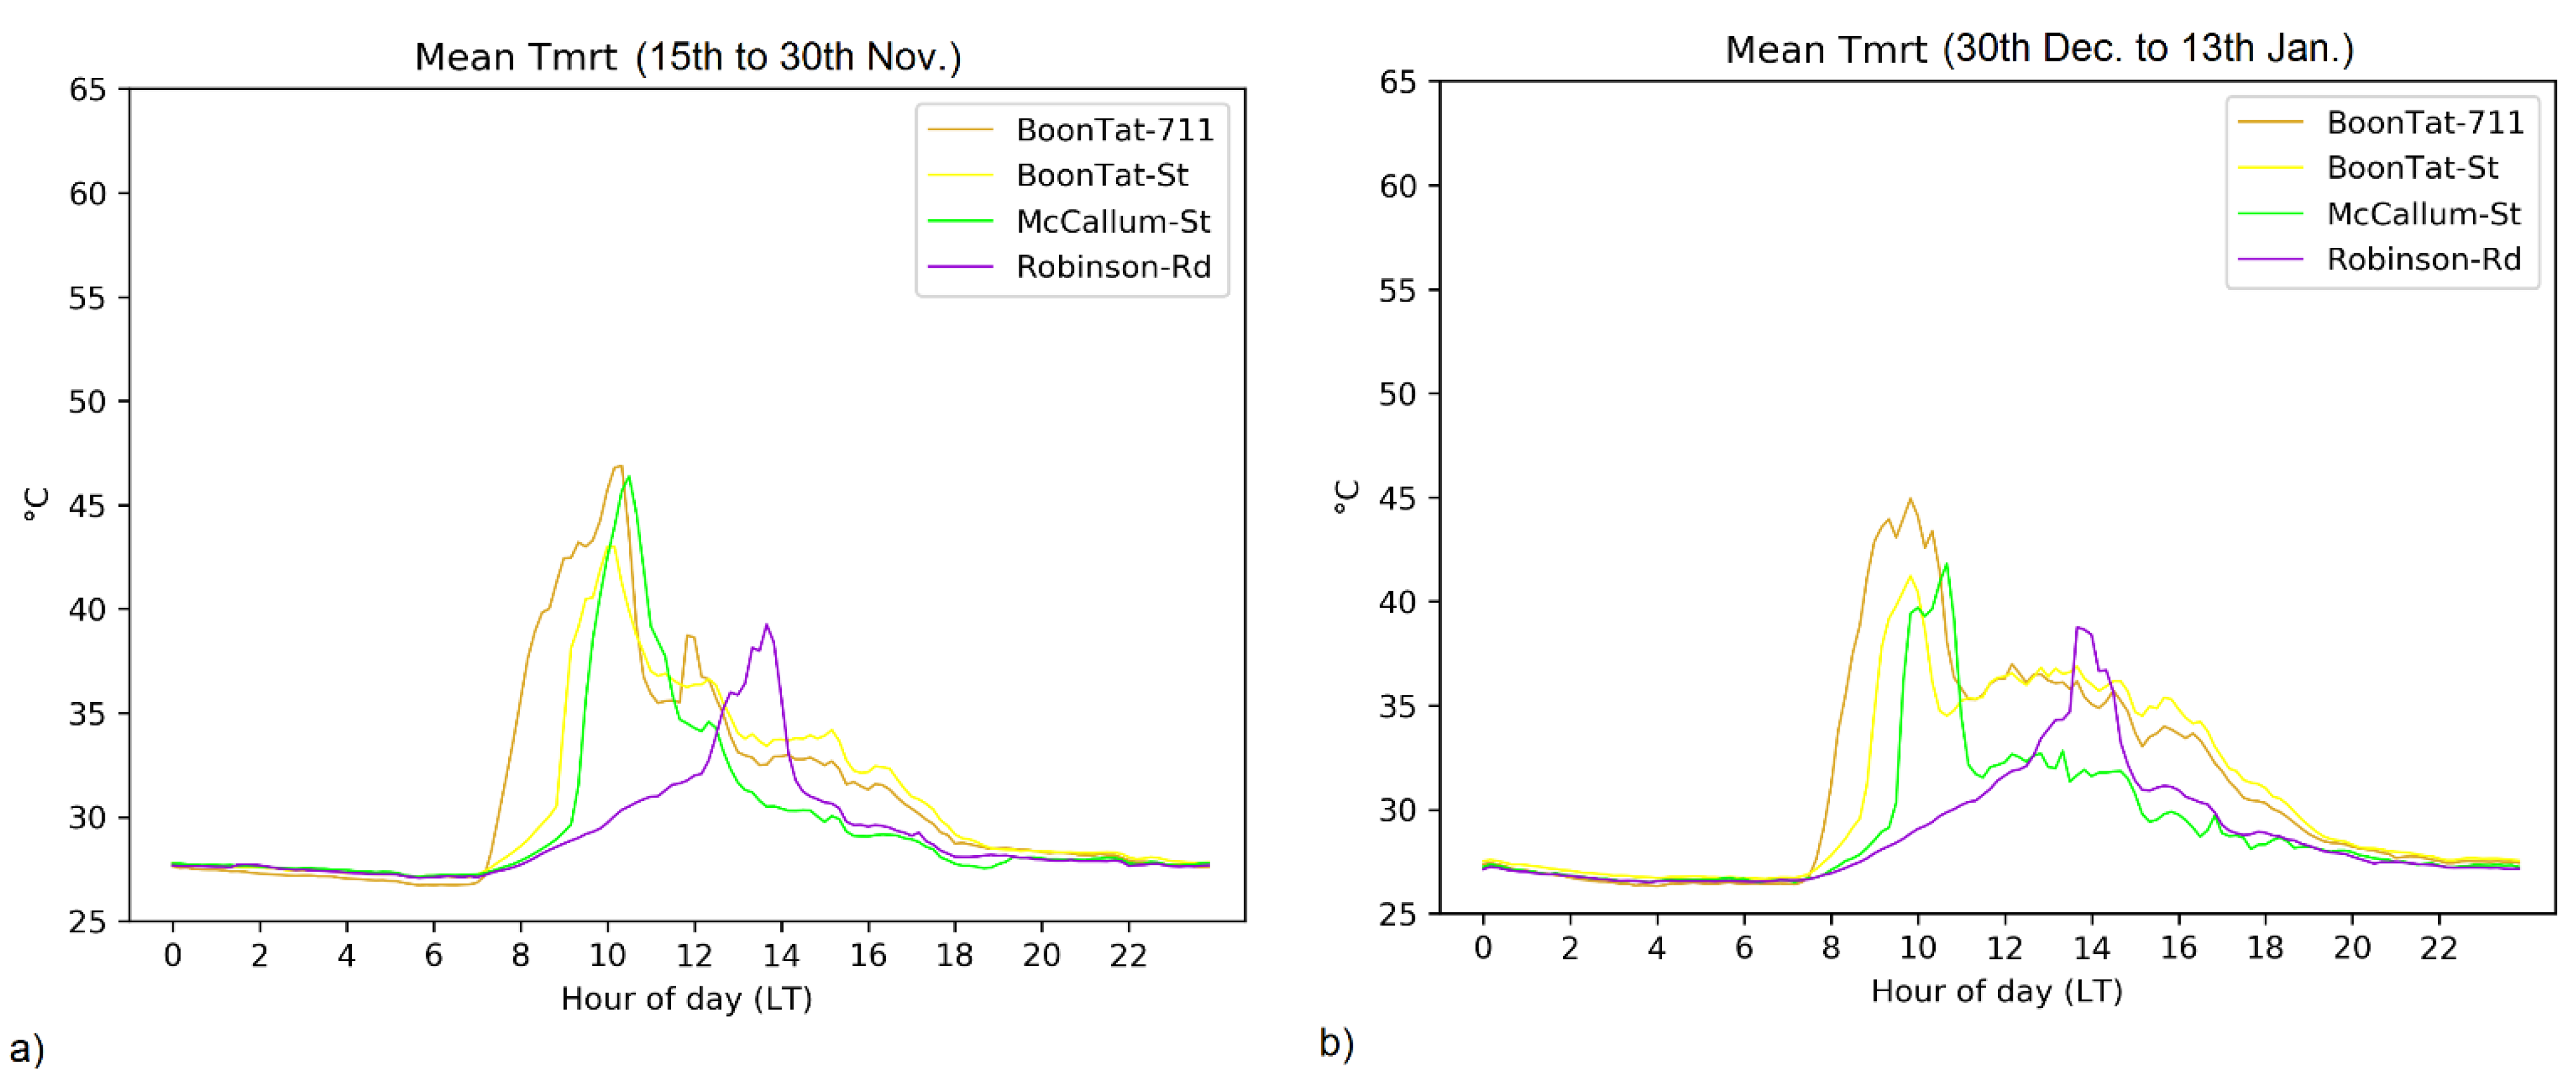
Similar effects are observed in McCallumSt, BoonTatSt, BoonTat711, and RobinsonRd (CBD area). Figure 6 shows the different mean Tmrt diurnal profile for a two-week period in the wet Inter-Monsoon (last half of November 2019) and in the wet NE-Monsoon (first half of January 2020). In this case, the timing of the peak values in each site is conditioned by the street orientation. McCallumSt, BoonTatSt, and BoonTat711 are all NW-oriented streets and have the peak at ≈10:10 in the Wet Inter-Monsoon season, while for RobinsonRd (a NE-oriented street), the peak happens 3.5 h later (at 13:40). In the wet NE-Monsoon period, the time lag between the two street orientations increases to 4 h due to the variation in the sun path (elevation and azimuth) with respect to the wet Inter-Monsoon.
Peak mean values in these two periods (wet Inter-Monsson and wet NE-Monsoon) are significantly lower than the ones measured in Duxton Park during the SW-Monsoon season, which was mainly due to a lower precipitation (less cloud cover) in the SW-monsoon season and especially in August 2019. In addition, RobinsonRd shows lower mean peak values than the other three sites in the CBD, which can be explained by higher cloud cover and showers during the afternoon that reduce solar incoming radiation at the time when Tmrt peak occurs.
4.1.2. Tmrt Evaluation on Clear Skies Conditions
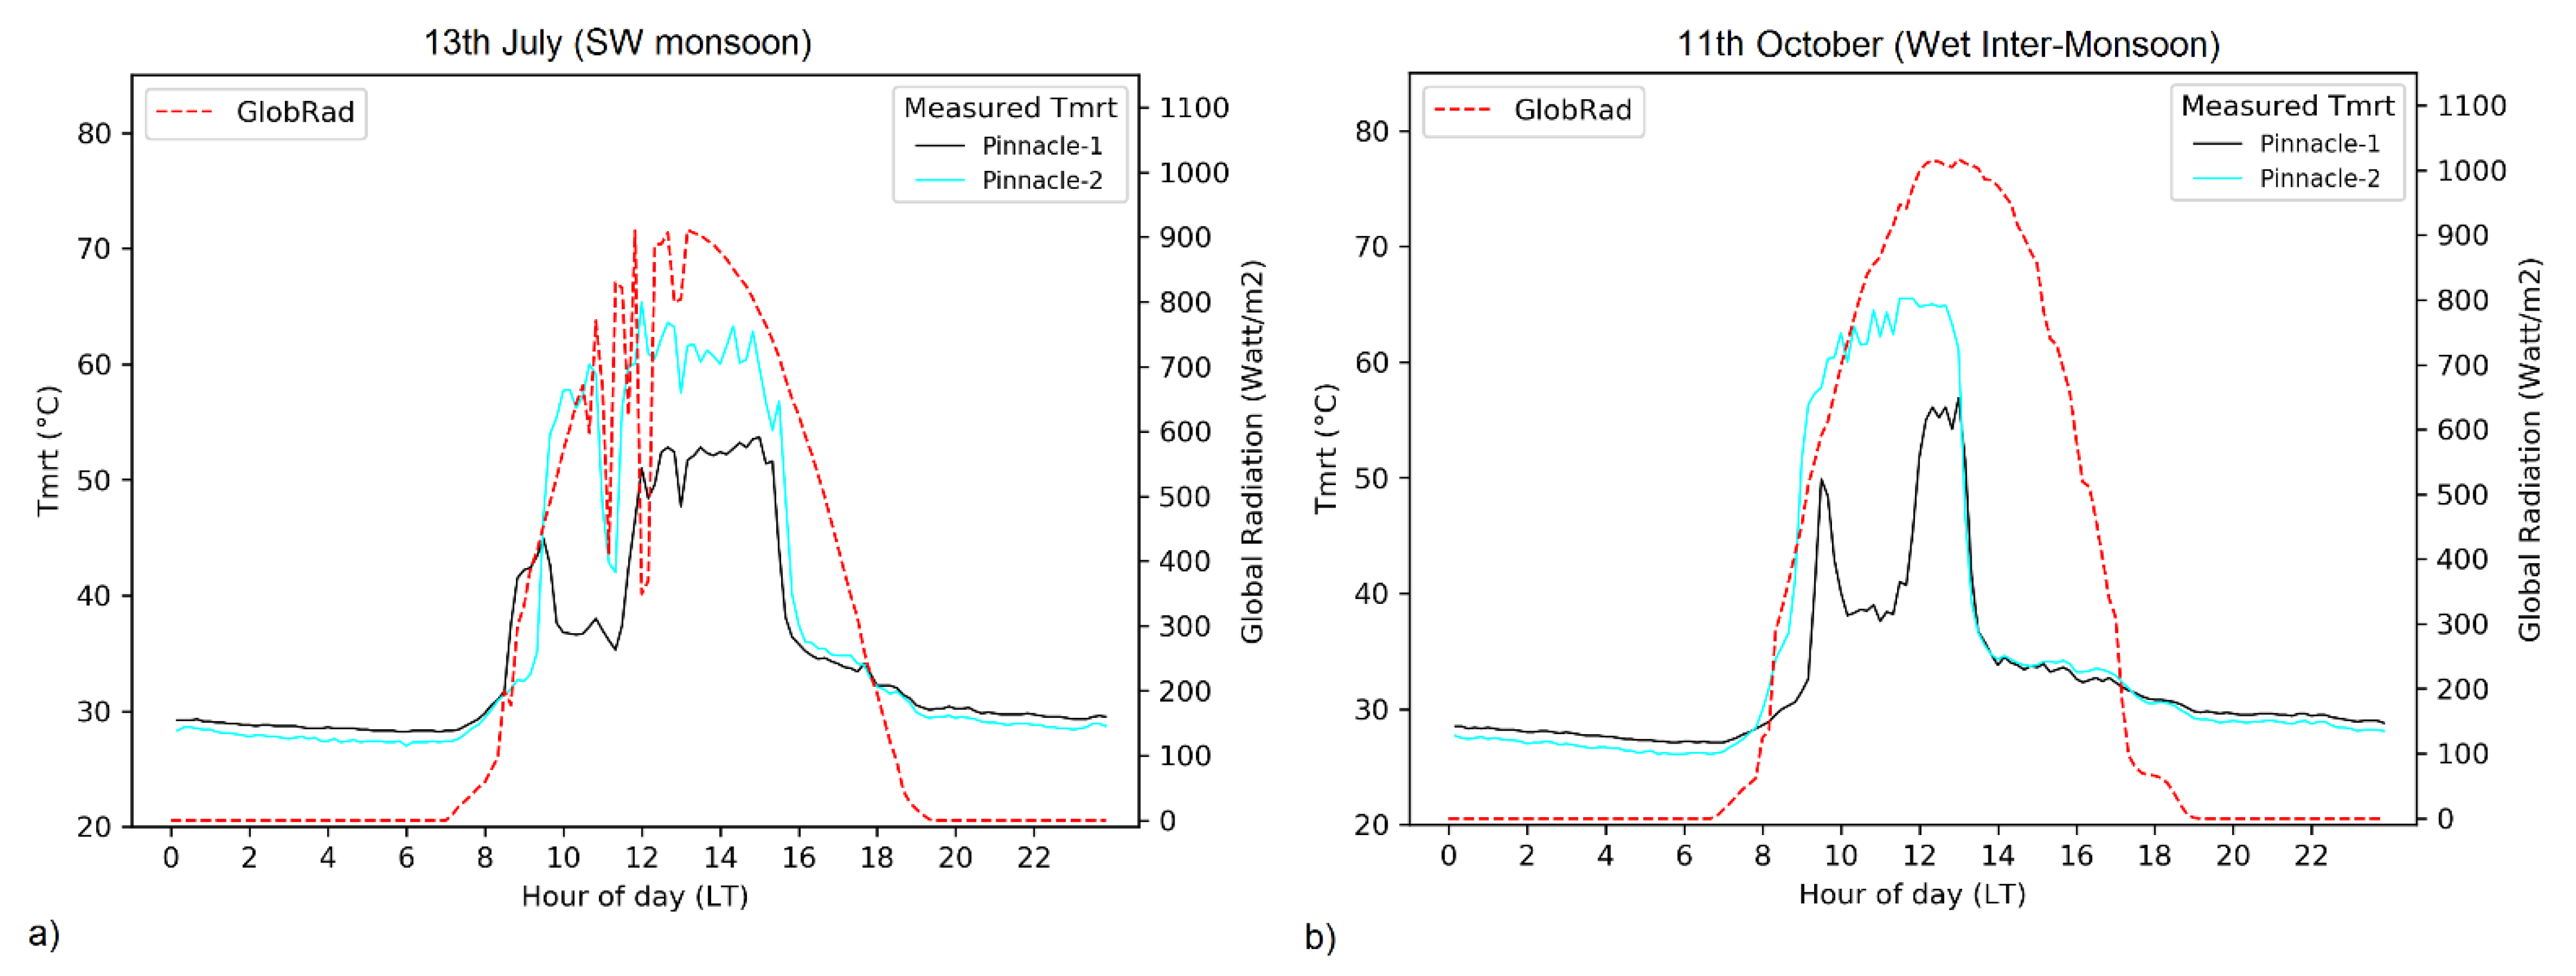
Two specific days were selected to quantify the impact of building shadow on clear skies days: 13 July and 11 October 2019 in the SW-Monsoon and Inter-Monsoon, respectively (Section 3.3). On 13 July, there are some clouds during the morning period, but in the afternoon, clear skies are present (Figure 7). In contrast, 11 October was a clear sky day for Singapore. Both days show similar Ta, WS, and e mean afternoon values (Table 3), but incoming solar radiation differs by 280 Watt/m2 (at the time of the building shadow), which is mostly due to the different time (due to the season) at which the building shadow reaches the sites.
On 11 October, the maximum Tmrt values reach 65.6 °C at 12:40. Similar values were reported by Tan et al. [28] in Singapore when Tmrt was estimated on a roof top from six individual measurements/directions of the shortwave radiation and longwave radiation fluxes on a clear sky day. Values were ≈69.5 °C when the shortwave radiation from the sky was 1150 Watt/m2.
Figure 7 shows the Tmrt diurnal profile for both days. A common result in both days is that the Tmrt drop due to building shadow is higher in Pinnacle2 since, as commented in Section 4.1.1, Pinnacle 1 is partly affected by tree shadowing before the building effect starts. While in Pinnacle2 Tmrt is reduced ≈25 °C, Pinnacle1′s drop is ≈16°C (for the case of 13 July). However, higher incoming solar radiation (as on 11 October) causes higher reductions on Tmrt due to building shadow: ≈30 °C and ≈20 °C for Pinnacle2 and Pinnacle1, respectively.
The solar trajectory again affects the time when the building shadow reaches each measuring site. A sharp reduction in Tmrt happens at ≈12:45 on 11 October (Inter-Monsoon) and at ≈15:15 h on 13 July (SW-Monsoon). This two-hour difference is 30 min more than the mean difference between August and October presented in Section 4.1.1.
These results are important to gain an understanding of the benefit of shadowing under clear skies conditions.
4.2. Effect of Cloudiness
4.2.1. Tmrt Versus the Clearness Index
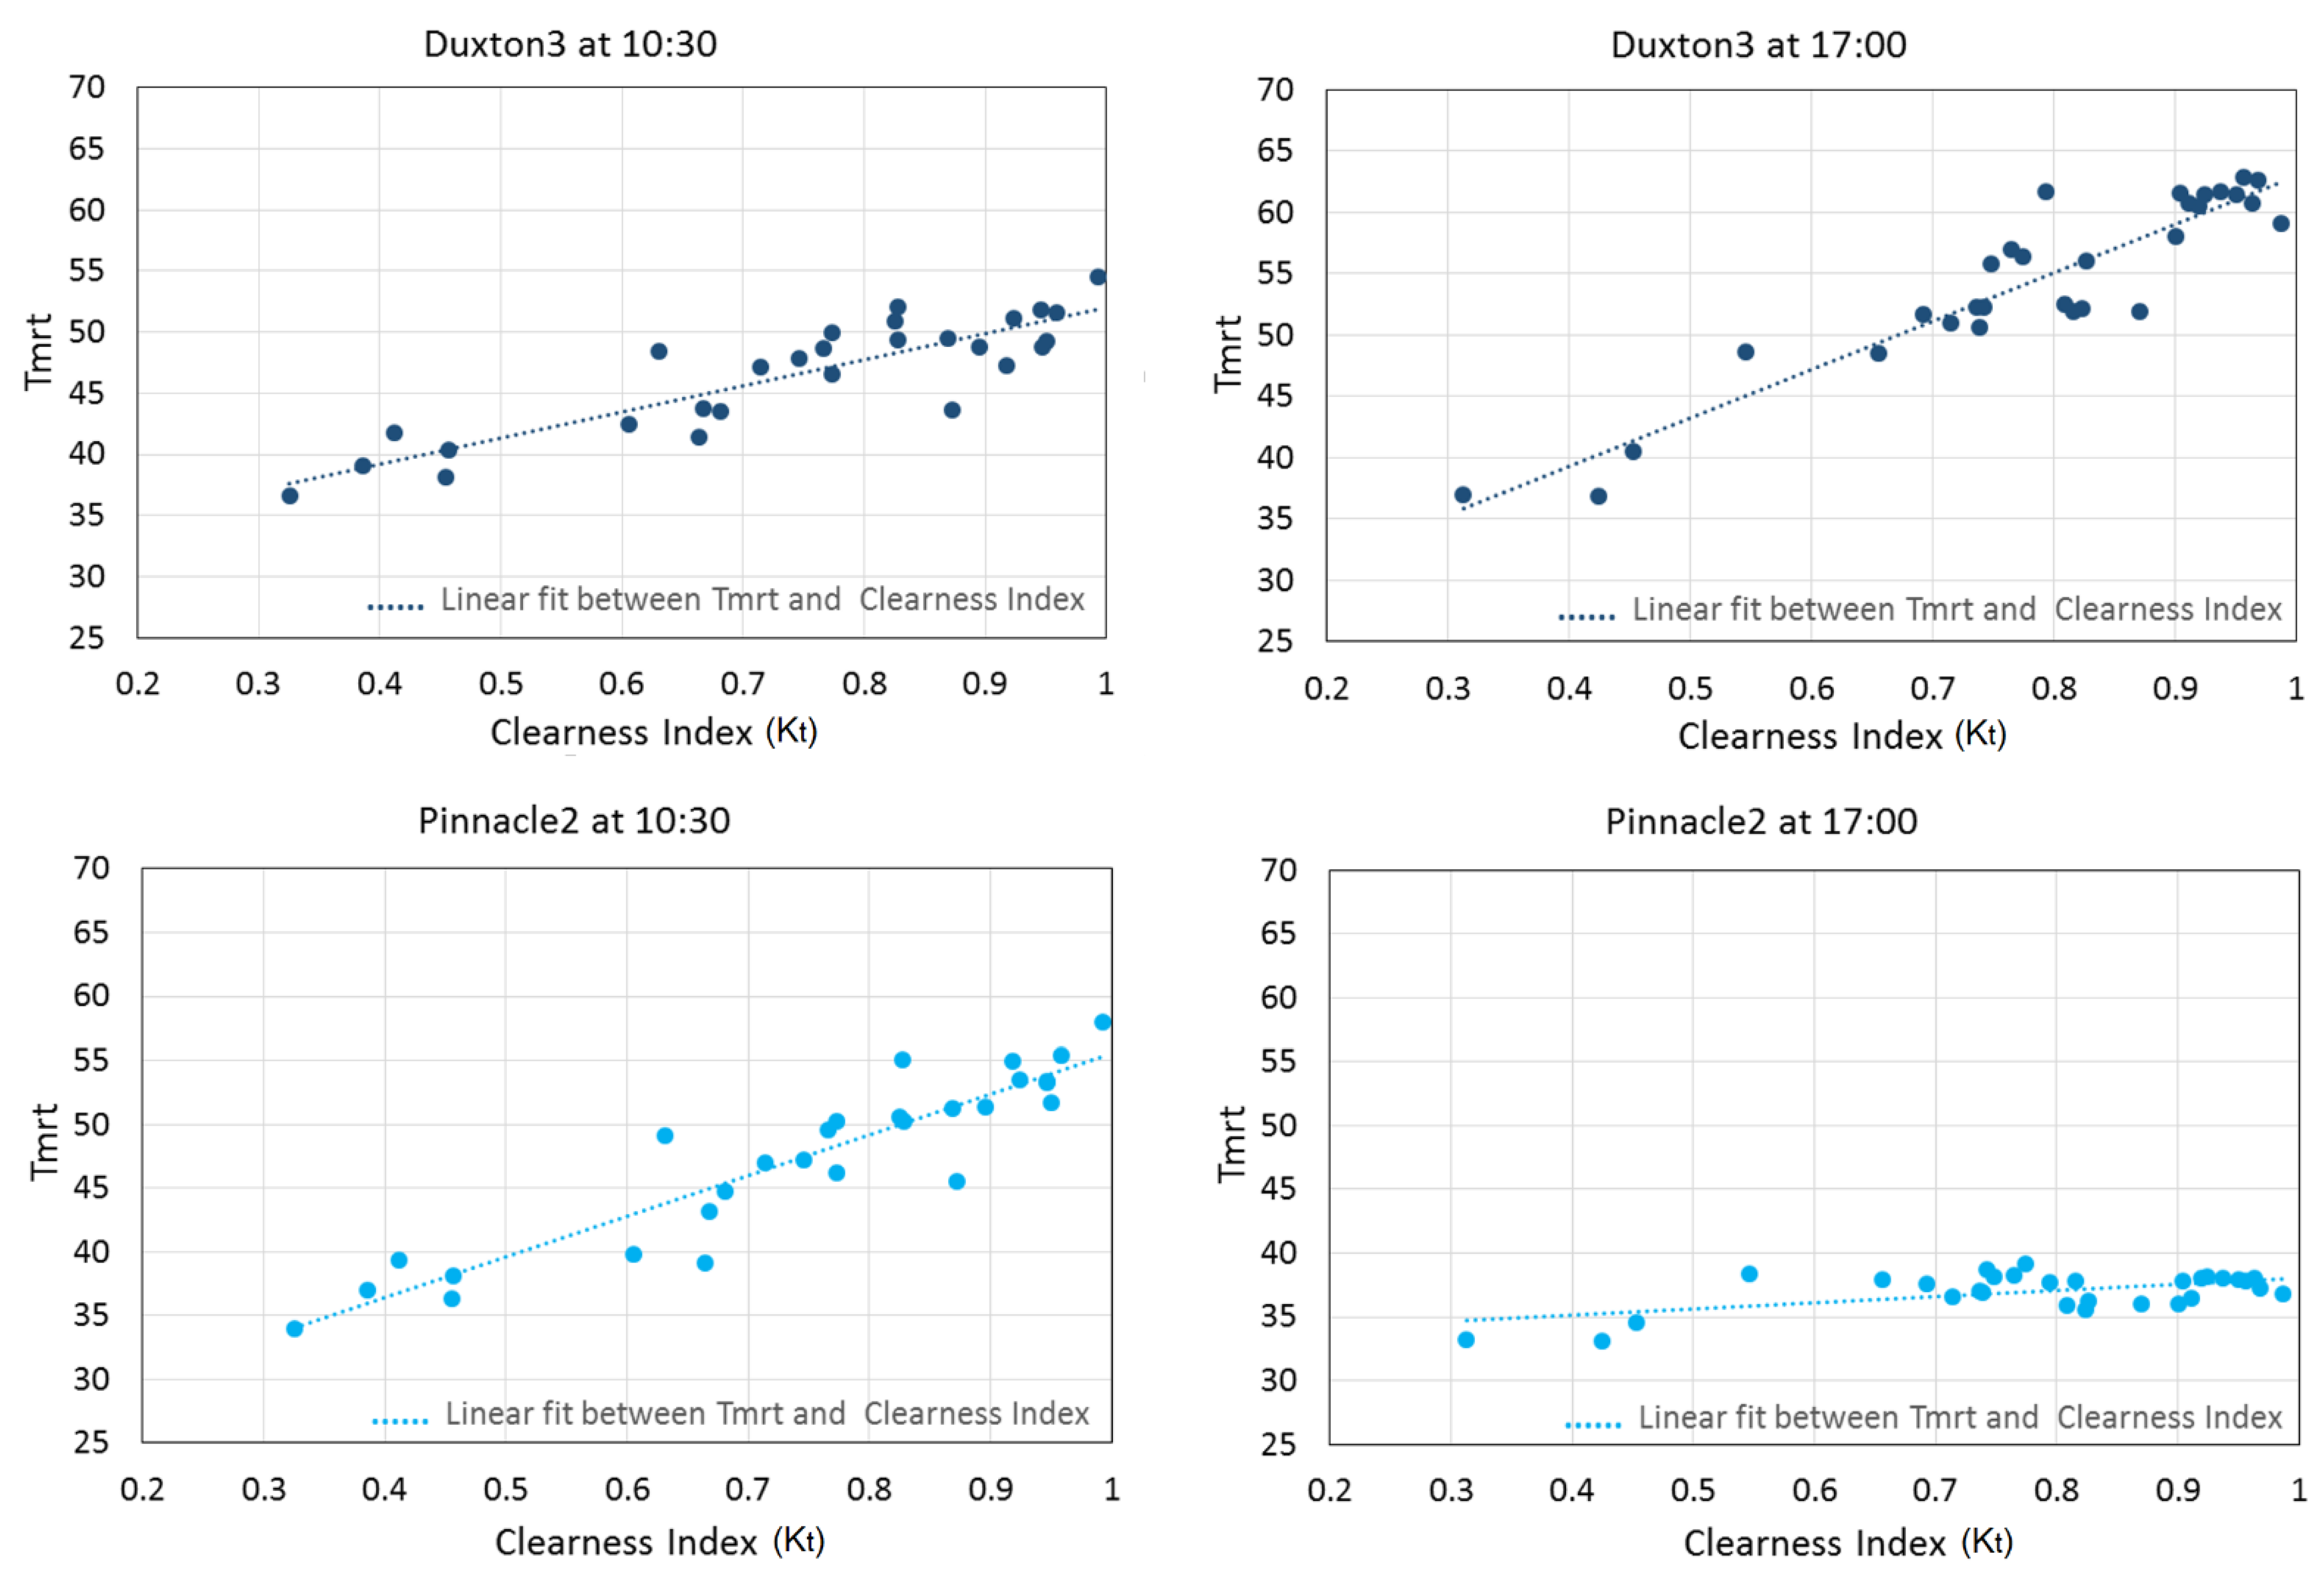
Tmrt values were analyzed based on the levels of cloudiness. Figure 8 shows the relation between the Tmrt and the clearness index (Kt) as defined in (2). Two different hours (10:30 and 17:00) are used to represent the morning and late afternoon period in Duxton3 and Pinnacle2. Duxton3 is non-shaded at both hours, while Pinnacle2 only at 10:30. At 17:00, Pinnacle2 is shaded by the near high-rise building (Figure 3).
Under non-shaded conditions, Tmrt and Kt show a good linear relationship (e.g., in Pinnacle2 at 10:30, r = 0.924 (p < 0.001)). The effect of cloudiness on Tmrt has been presented in other studies (Kántor et al., 2015; Thorsson et al., 2007). However, in the shaded site (17:00 in Pinnacle2), Kt and Tmrt have low correlation (r = 0.558 (p < 0.001)) (Figure 8), and thus, the level of cloudiness produces low variation in Tmrt values. In this sense, results highlight the importance of direct solar radiation to govern the variability of Tmrt levels in Singapore.
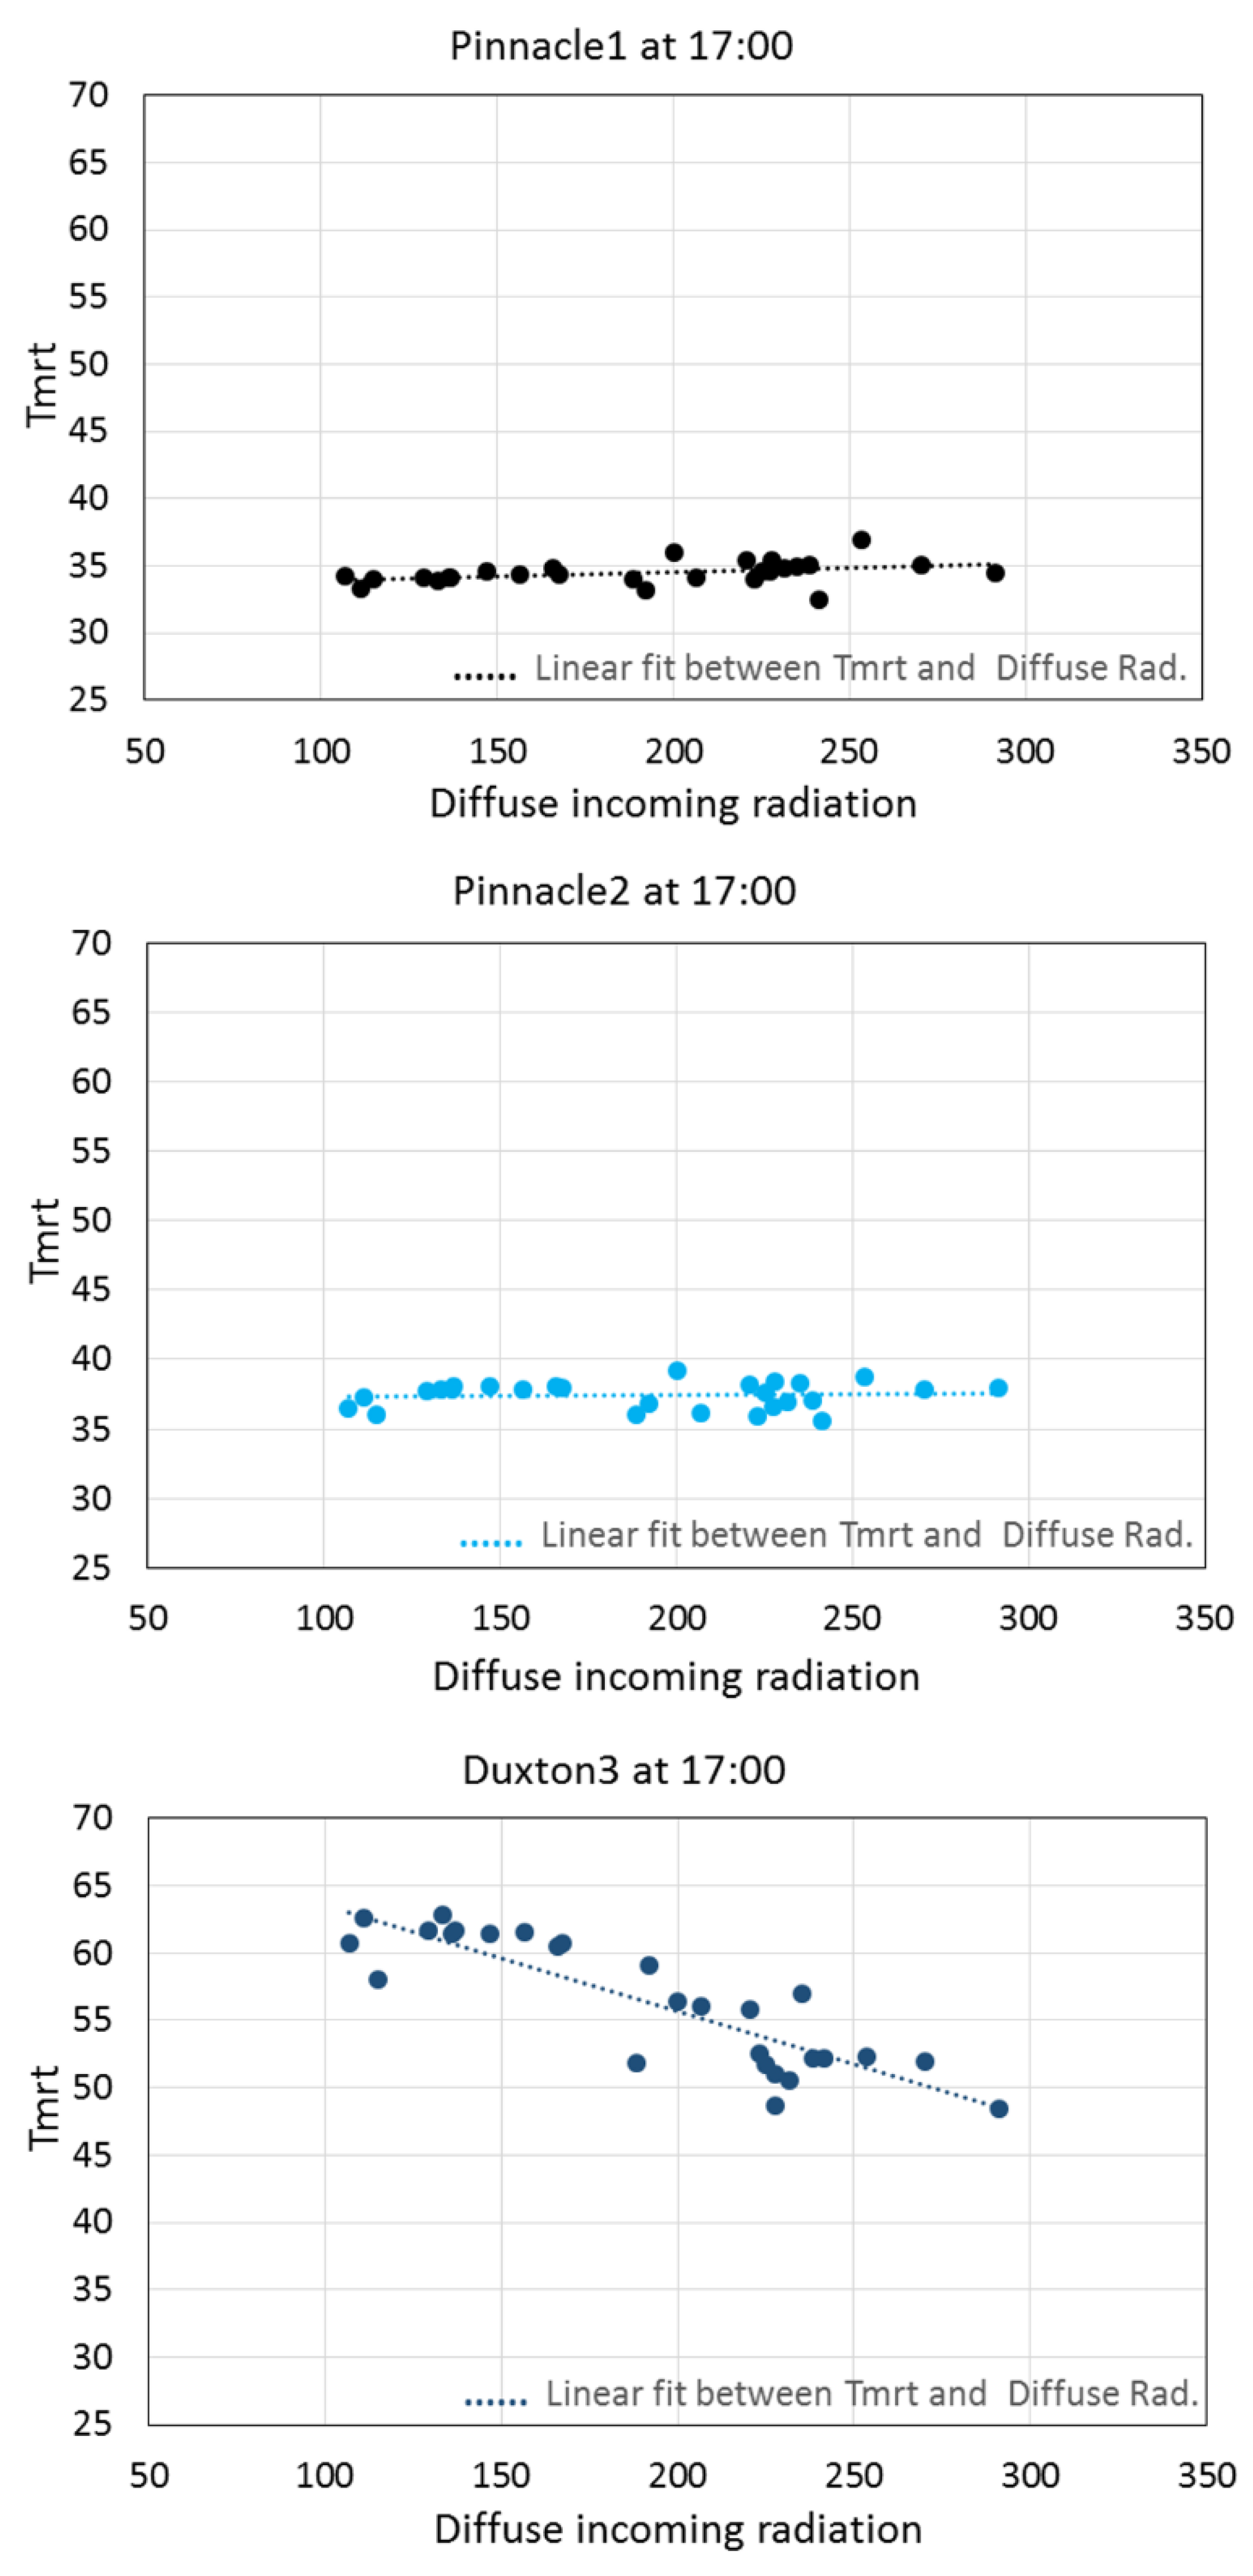
Further analysis on the influence of diffuse solar radiation on Tmrt shows a low relationship between these two variables in shaded sites (Pinnacle2 and Pinnacle1 at 17:00 have r = 0.041 (p < 0.001) and r = 0.297 (p < 0.001) respectively) (Figure 9), suggesting the contribution to Tmrt of other radiation components (i.e., longwave radiation). The importance of longwave radiation (especially lateral fluxes) to Tmrt has already been reported in the literature [22,34], which in shaded sites should be higher. On the contrary, in non-shaded sites (Duxton3) at the same hour, diffuse solar radiation and Tmrt show a negative correlation (r = −0.520 (p < 0.001)). Since higher diffuse radiation is associated with lower direct solar radiation, the results again highlight the role of direct solar radiation in the variability of Tmrt levels in non-shaded sites.
4.2.2. Difference between Cloudy and Clear Skies Days
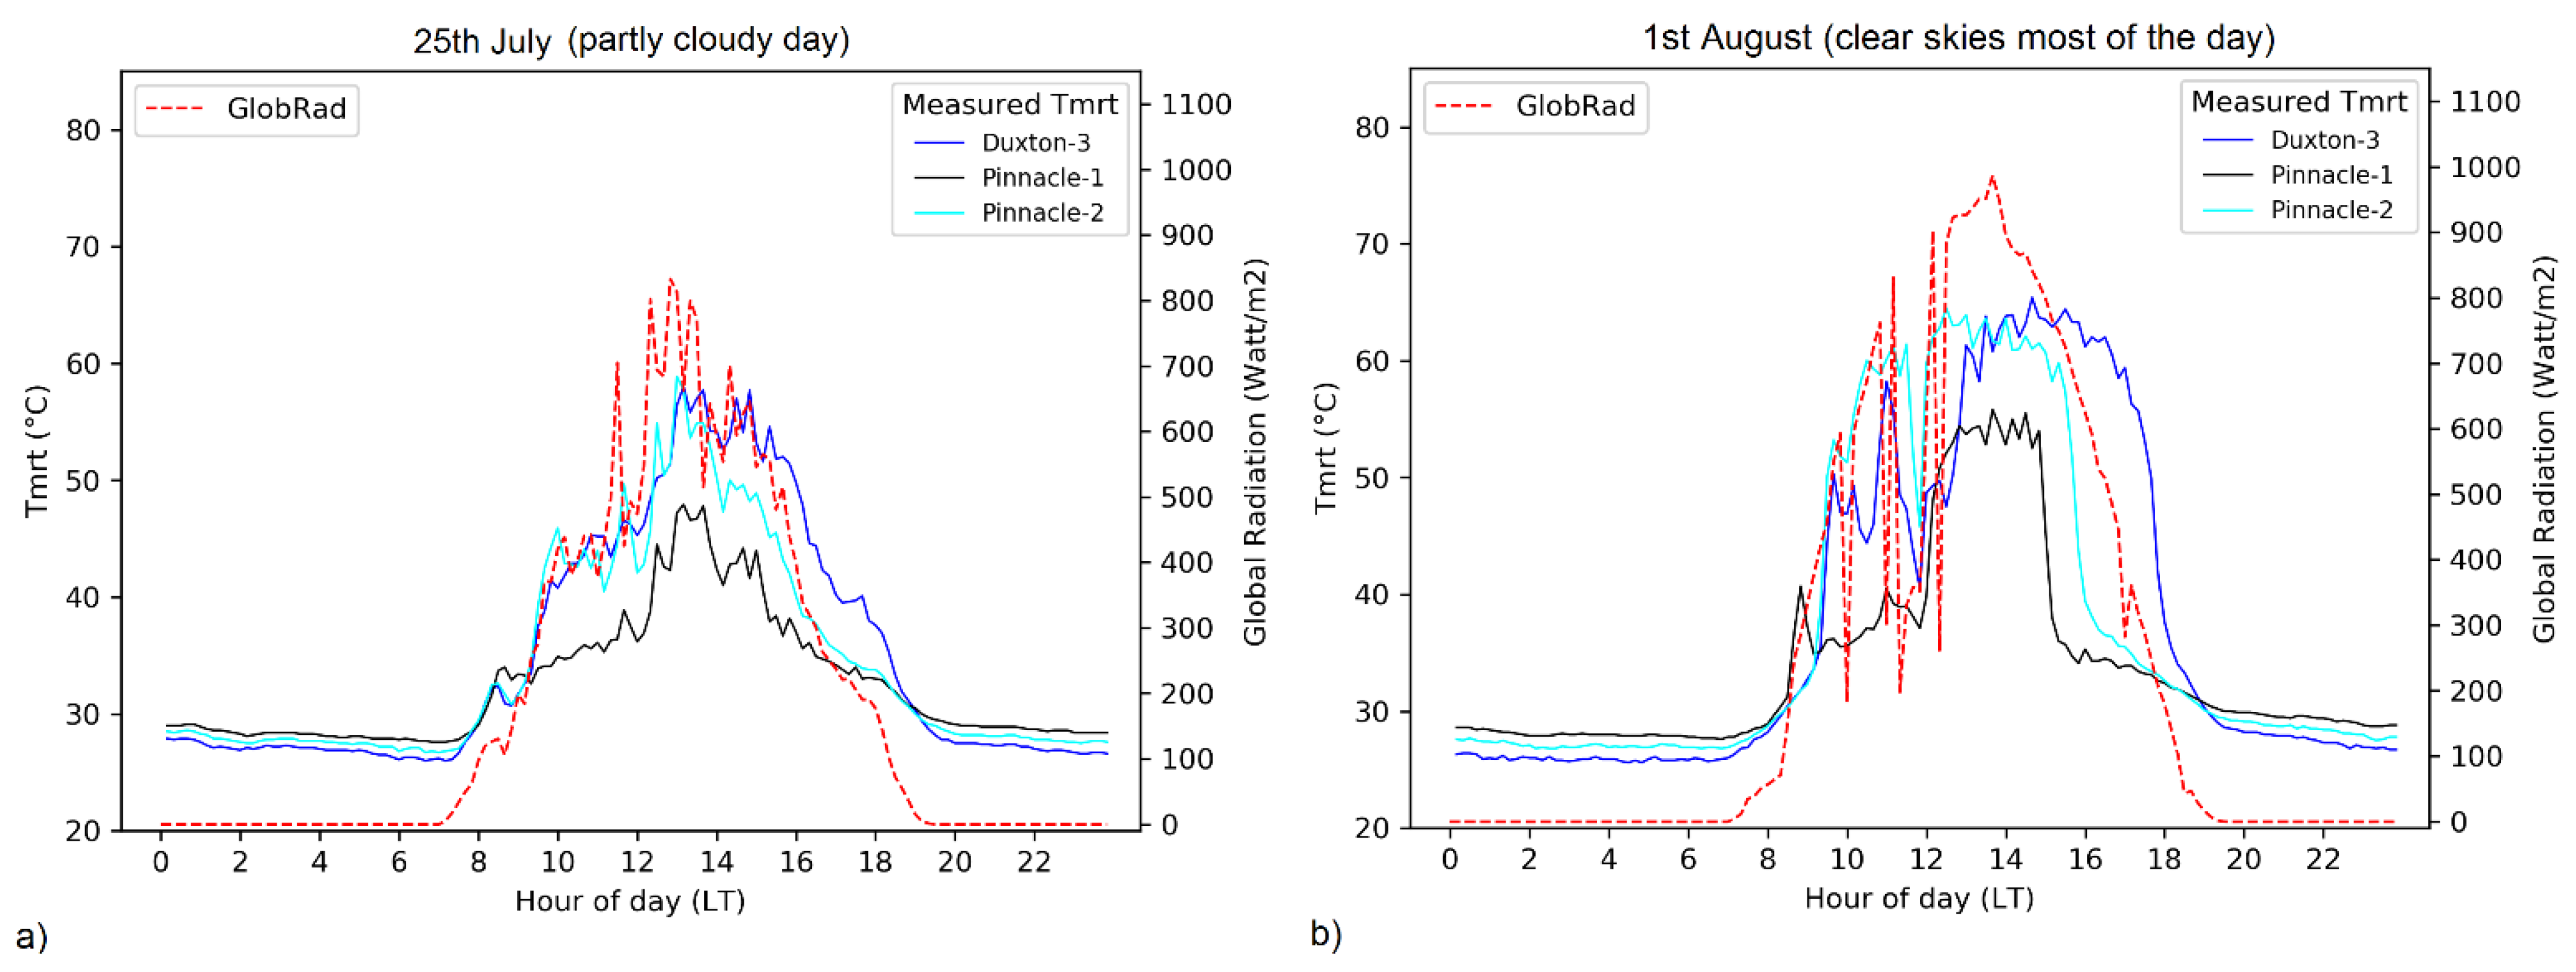
Analysis of two close non-rainy days in the SW-Monsoon season (25 July and 1 August) has shown the influence of solar radiation levels on Tmrt. On 1 August (clear skies day), Tmrt values in the three sites (Duxton3, Pinnacle1, and Pinnacle2) show a similar diurnal cycle (Figure 10) to the mean values presented for the SW-Monsoon season (Section 4.1.1), especially in the afternoon (high solar radiation conditions). The effect of building shadowing is clearly noticed in Pinnacle1 and Pinnacle2, starting at 14:50 and 15.20, respectively. However, on 25 July (cloudy day), this effect is not as relevant as on a clear skies day (1 August).
In general, clouds significantly change the Tmrt diurnal cycle. During the afternoon, cloud cover can reduce Tmrt values significantly in sites exposed to direct solar radiation. Between 25 July and 1 August, incoming solar radiation in the 30 min before the building shadow affected Pinnacle1 differed by 217 Watt/m2 (mean value). During this period (before the building shadow effect), Tmrt values were lower in the cloudy day (aligned with outcomes in Section 4.1). Tmrt differences between the two days (cloudy vs. clear day) were 7.8 °C, 11.1 °C, and 12.5 °C in Duxton3, Pinnacle 1, and Pinnacle2 respectively. The lower difference in Duxton3 is associated with a higher sky view factor of the site that allows a higher impact of diffuse radiation under cloudy days.
As expected, a higher decrease in incoming solar radiation causes a higher Tmrt reduction. In Pinnacle2, before noon (11:00), the Tmrt difference between the two days (cloudy vs. clear day) reaches 14.2 °C due to a 400 Watt/m2 difference in the incoming solar radiation.
4.2.3. Urban Development and Diffuse Radiation
As commented in the previous section, during cloudy conditions, sites with a higher sky view factor were associated with higher Tmrt values due to higher levels of solar diffuse radiation. This was the case in low-rise areas such as Duxton3.
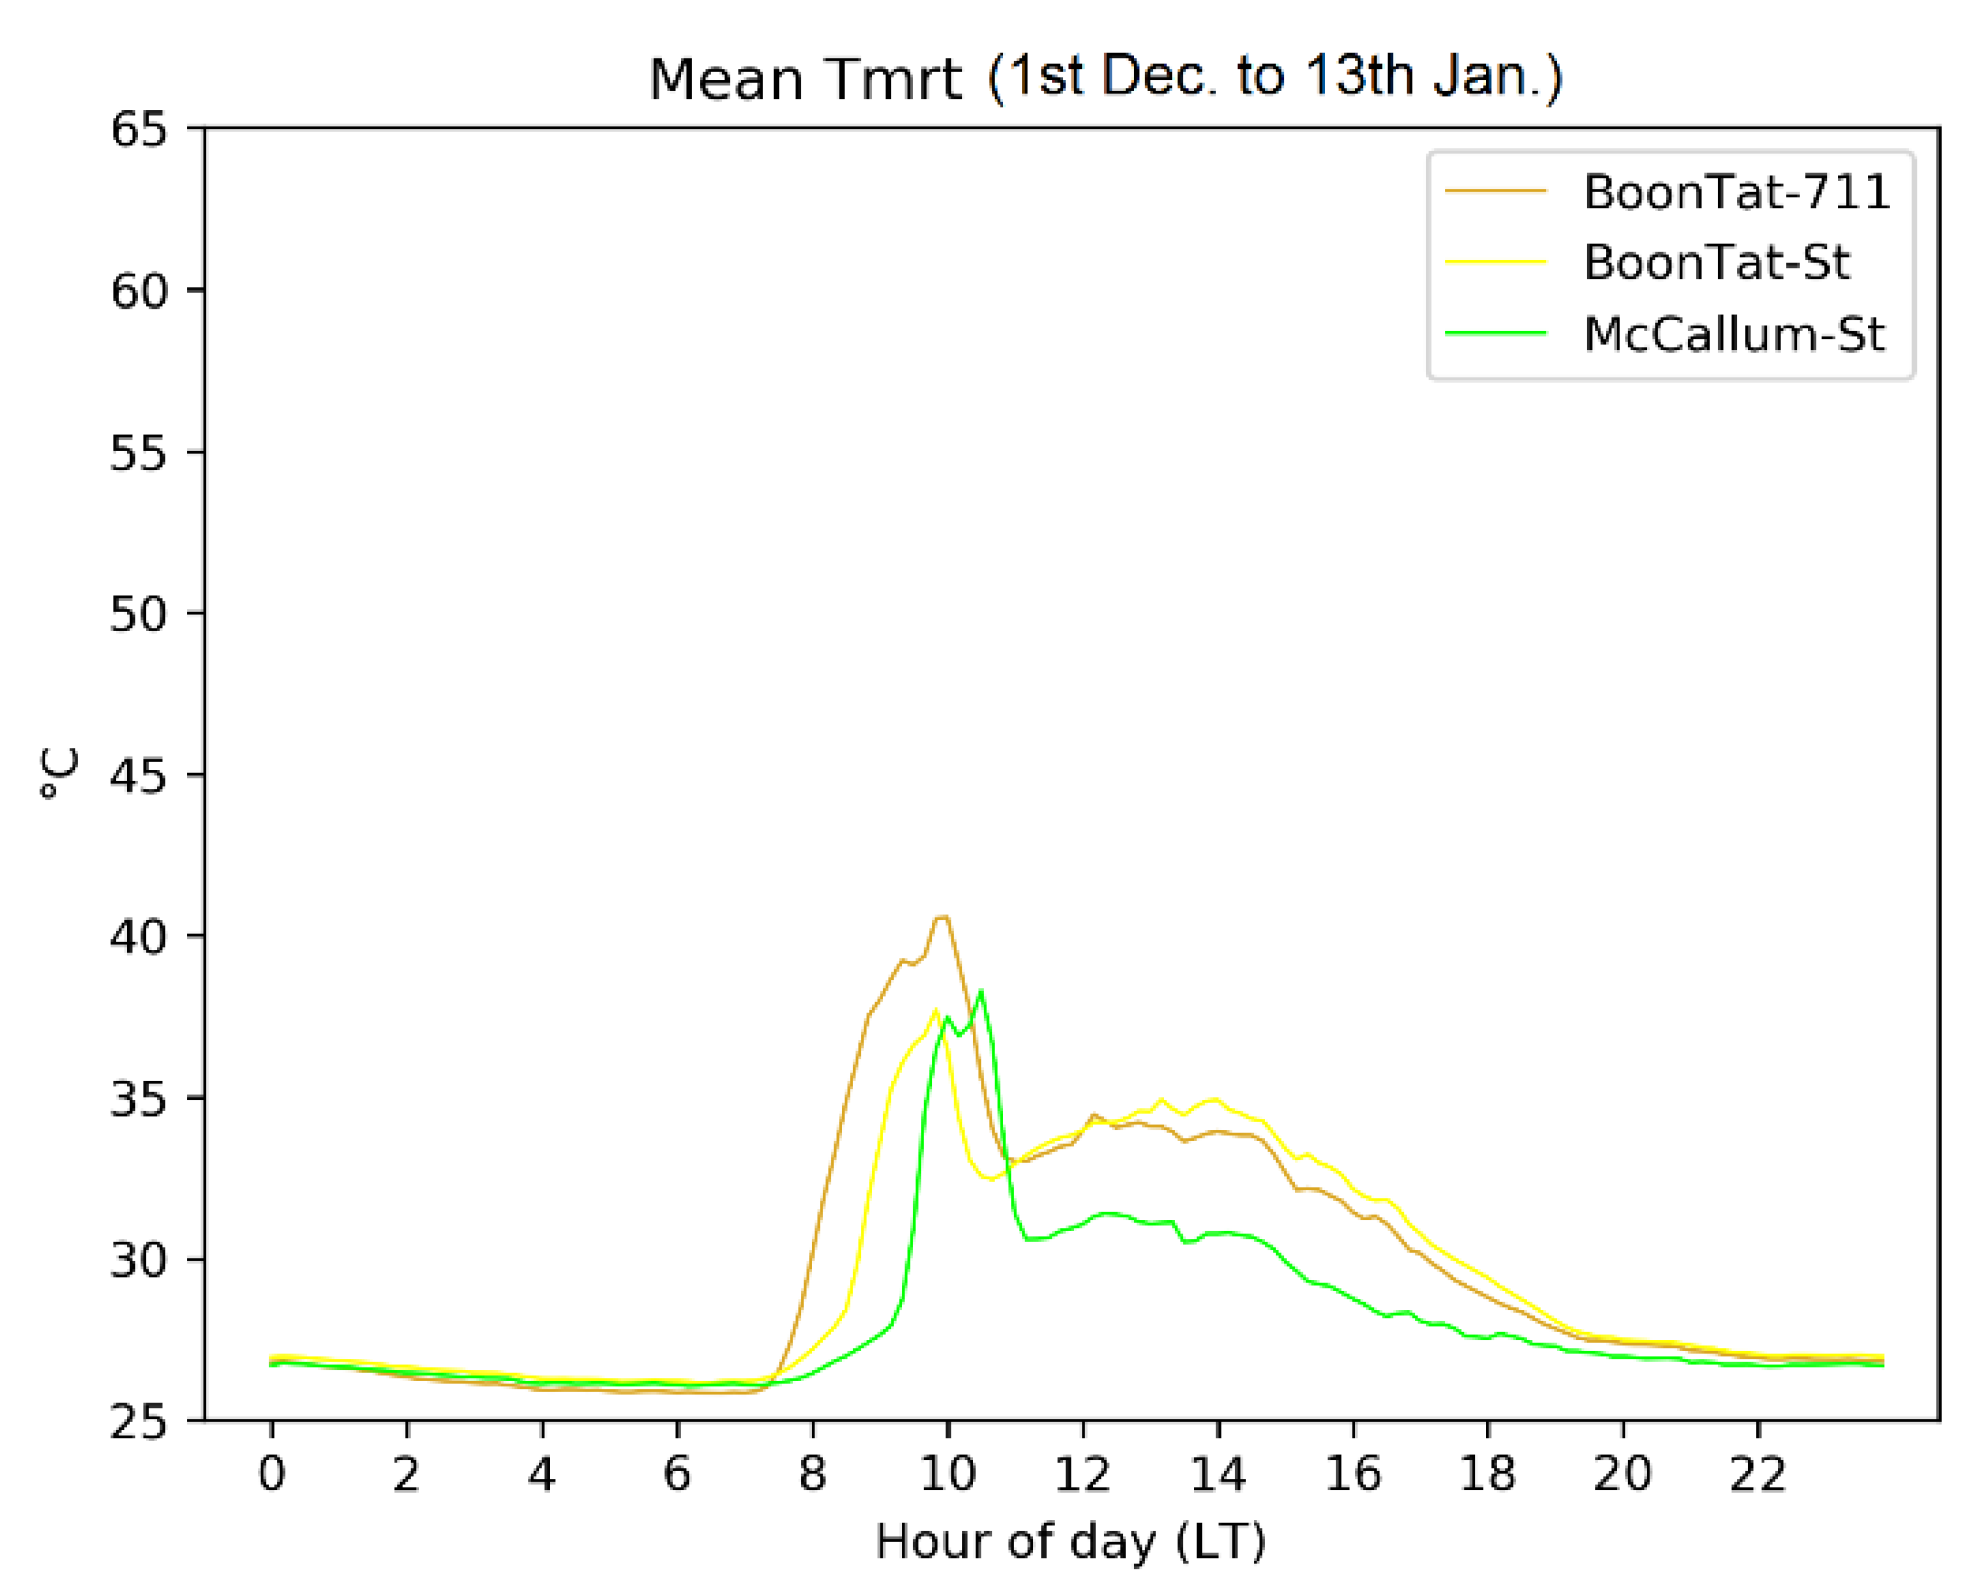
Figure 11 shows the mean Tmrt values during most of the wet NE-Monsoon season (1 December 2019 to 13 January 2020), when precipitation and cloudiness is highest in Singapore. All sites considered (BoonTatSt, BoonTat711, and McCallumSt) are in NW oriented streets, which causes maximum Tmrt values to occur at ≈10:00 am (see Section 4.1.1). During the morning period (until ≈9:30am), Tmrt values are highest in BoonTat711 (partly open urban area and asymmetrical aspect ratio) due to high exposure to solar radiation. At this time of the day, the lowest values are in McCallumSt due to lowest SVF (higher in BoonTat711 and BoonTatSt). After the morning peak (≈10:00am), Tmrt values in all three sites drop ≈8 °C. In the midday/afternoon period (11:00 to 16:00), without the direct solar radiation, BoonTatSt and BoonTat711 register similar results. The difference of these two sites with McCallumSt remains quite stable throughout the afternoon. Mean Tmrt values in McCallumSt are 3.4 °C and 2.9 °C lower than BoonTatSt and BoonTat711, respectively. These results are influenced by a lower SVF in McCallum that reduces solar radiation (at this time of the day, only reflected and diffuse radiation) reaching the site in comparison to BoonTatSt and BoonTat711 and are in agreement with previous studies that reported higher radiant fluxes inside street canyons with higher SVF. Du et al. [51] showed a positive correlation between SVF and both shortwave and longwave radiation in a severely cold region (Dwa climate type). In a hot and dry region, Middel and Krayenhoff [34] reported that access to solar radiation dominated on Tmrt together with a positive effect of impervious overheated surfaces on longwave contributions. Although a positive correlation between SVF and Tmrt during the daytime under direct solar radiation is expected to be found [22,28,52], on shaded sites and with clear skies, SVF can have a weak explanatory power for variations in shortwave fluxes, and Tmrt can show a negative correlation with SVF; i.e., higher SVF can facilitate a release of longwave radiation and thus decrease Tmrt in shaded sites [53]. This is not the case in our study area where under building shadow conditions, lower SVF showed lower Tmrt values. Differences with the study of Lai et al. [53] could be attributed to the frequent cloudy conditions in Singapore that increase the diffuse solar radiation component and thus the solar radiation fluxes in shaded areas. This interpretation is supported by a study from Chatzipoulka et al. [54] analyzing solar radiation in different façade orientations, which found a consistent strong relationship between the SVF and diffuse irradiance and that higher urban openness could increase average diffuse and reflected solar radiation.
During the evening, Tmrt difference between BoonTat sites and McCallum slowly reduces. By sunset (≈19:00), when incoming solar radiation is negligible, all three sites register similar Tmrt values.
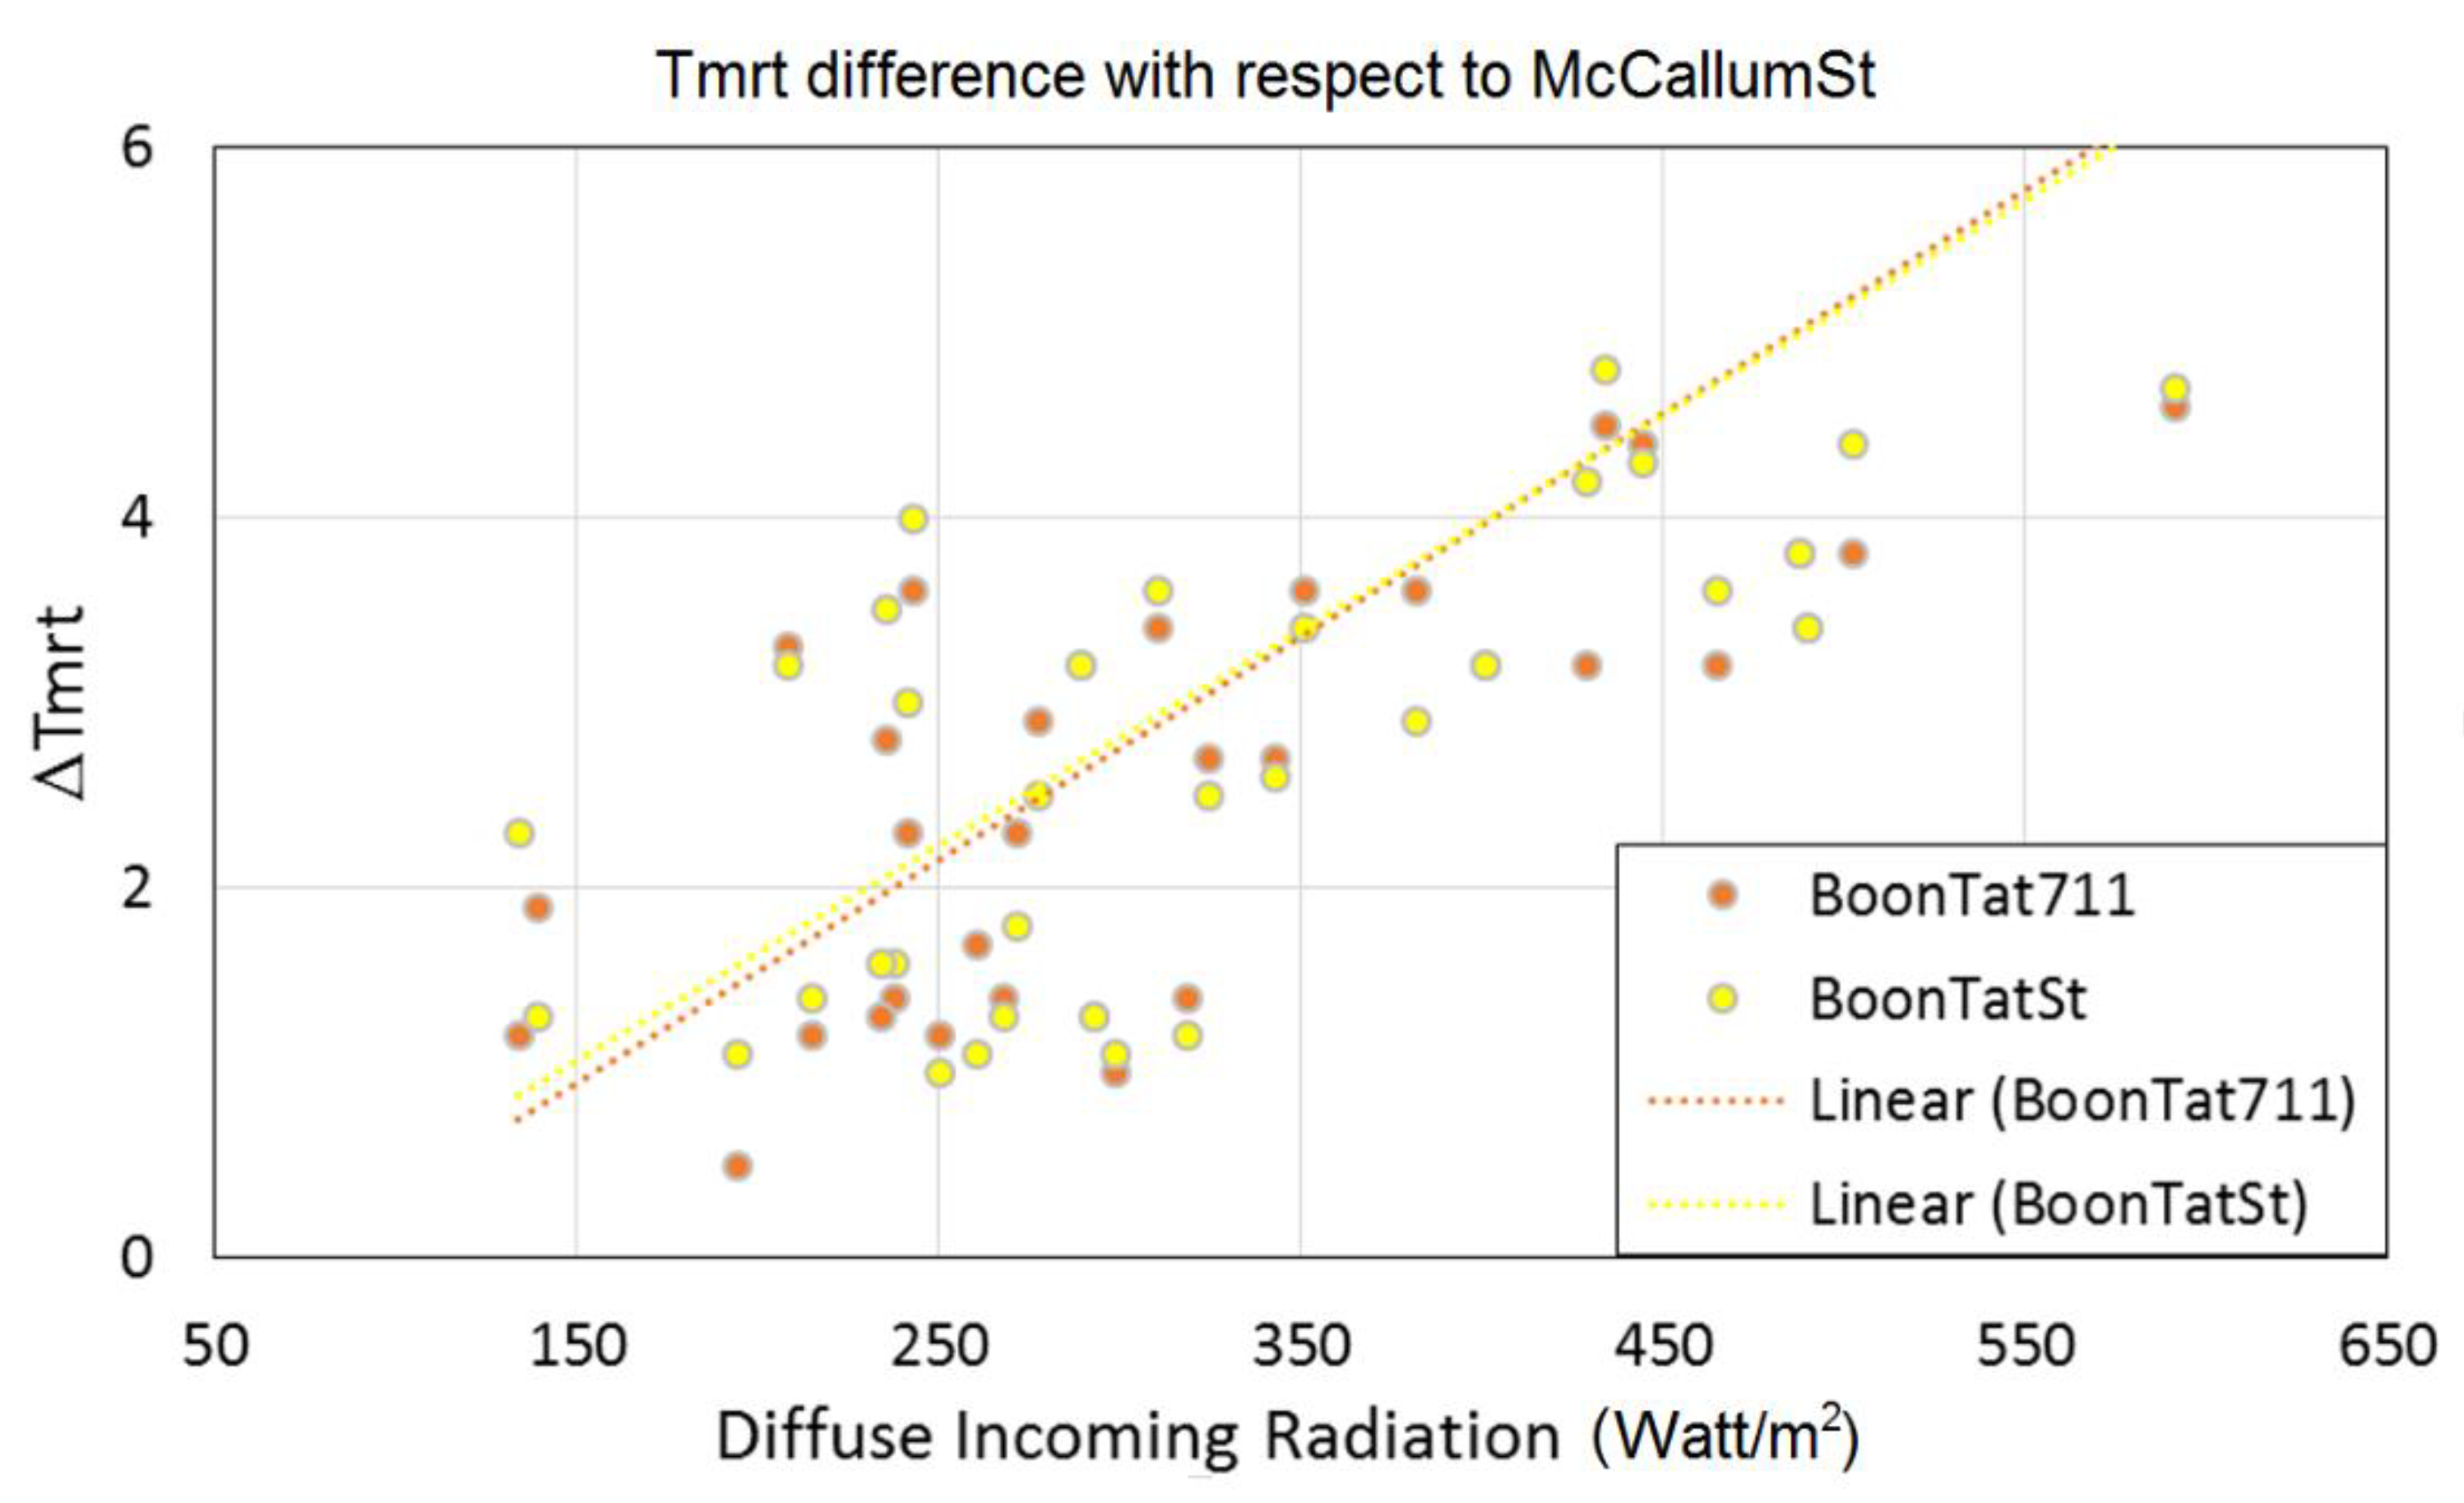
Figure 12 represents the effect of increasing the diffuse solar radiation (above the urban canopy) on the Tmrt difference between a high SVF site (BoonTatSt/BoonTat711) and a low SVF site (McCallumSt) in the absence of direct solar radiation. The diffuse solar radiation is measured at a nearby roof top. Results show that under higher incoming diffuse radiation, the Tmrt difference between a low SVF and a high SVF site also tends to increase, which is influenced by higher levels of diffuse radiation reaching the pedestrian level in the high SVF site. This outcome is aligned with the result presented in a previous paragraph showing that under shadow conditions, low SVF street canyons reduce radiative fluxes at the pedestrian level and thus show lower Tmrt.
5. Conclusions
In this study, we have analyzed the impact of the shadow of high-rise buildings on Tmrt as well as the effect of cloudiness and sky view factor in the hot and humid tropical city of Singapore.
Based on measurement campaigns with sensors deployed simultaneously in different sites, the results are presented for different seasons and for specific days (with different level of cloudiness), providing representative Tmrt values in the selected sites.
Street orientation and aspect ratio have shown an important impact on Tmrt due to their influence in solar access at pedestrian level. The street orientation conditions the time when Tmrt peak values occur (up to 4 h difference between a NE and a NW-oriented street in the wet NE-Monsoon). The street aspect ratio affects the width of Tmrt peak (i.e., period of time with highest Tmrt levels). Compared to high-rise developments, wider (in time) Tmrt peaks are expected in low-rise and partly open urban areas due to higher exposure to solar radiation. Additionally, Tmrt diurnal cycles at each site have shown a different pattern throughout the year. Not only can levels of cloudiness vary between seasons but also the change in solar elevation is responsible for Tmrt peaks occurring at different times and with different intensity throughout the year.
Under clear skies days, the effect of high-rise building shadow produced a Tmrt reduction of ≈25 °C and ≈30 °C in the SW-Monsoon and wet Inter-Monsoon seasons, respectively. Differences between seasons were conditioned by the solar elevation and thus the time when the building produced shadow on the analyzed site.
On the other hand, cloudiness has a clear effect on Tmrt in Singapore. On non-shaded sites (after midday), when incoming solar radiation (above the urban canopy) is reduced ≈217 Watt/m2, Tmrt levels can be reduced between 7.8 and 12.5 °C (depending on the sky view factor and surrounding elements).
On shaded sites, the level of diffuse solar radiation (above the urban canopy) does not show a relevant impact on Tmrt, suggesting the influence of longwave radiative fluxes. However, under shaded conditions, the influence of SVF can still be noticed in Tmrt values at the pedestrian level. In these conditions, a low sky view factor can reduce diffuse the solar radiation reaching the pedestrian level, and thus, Tmrt is expected to be lower than in sites with higher sky view factors. This effect is emphasized for high levels of diffuse solar radiation (above the urban canopy), which are frequent in Singapore. For the same street orientation and during the wet NE-Monsoon, mean afternoon Tmrt values were ≈3.4 °C higher in low-rise/partly open urban sites than in high-rise development sites.
We consider that these results bring relevant information on Tmrt values regarding the interaction of incoming radiative fluxes and urban development, and we justify the necessity of a detailed analysis and proper quantification of the effects that govern Tmrt in different climate contexts as well as the reduction that certain urban features can achieve. This is especially useful for urban planning due to the influence of Tmrt in outdoor thermal comfort levels.
The measurements presented in this work will serve as a reliable database to evaluate the performance of microscale models to estimate Tmrt. Further work should be focused on the analysis of the contribution of different radiative components (shortwave, longwave) on the Tmrt levels in different urban developments both on shaded and non-shaded sites. Integral radiation measurements at the pedestrian level would allow improving the radiation schemes of models and thus the estimations and detailed spatial distribution of Tmrt in the urban area.
Author Contributions
Conceptualization, J.A.A.; Data curation, E.J.Y.K. and Y.S.T.; Formal analysis, J.A.A.; Funding acquisition, L.K.N.; Investigation, J.A.A.; Methodology, J.A.A.; Software, E.J.Y.K. and Y.S.T.; Supervision, L.K.N.; Visualization, E.J.Y.K. and Y.S.T.; Writing—original draft, J.A.A.; Writing—review and editing, J.A.A. All authors have read and agreed to the published version of the manuscript.
Funding
This research was funded by National Research Foundation of Singapore under its Virtual Singapore programme (Grant number: NRF2019VSG-UCD-001).
Institutional Review Board Statement
Not applicable.
Informed Consent Statement
Not applicable.
Data Availability Statement
The data presented in this study are available on request from the corresponding author. The data are not publicly available due to an approval required from the funding organization.
Acknowledgments
The authors would like to thank researchers in CENSAM-SMART, National University of Singapore (NUS), Singapore ETH Center (SEC), and Technical University of Munich (TUM) for the fruitful discussions in the framework of the ‘Cooling Singapore’ project, and especially to Yuliya Dzyuban, Conrad Philipp Heinz, and Manon Kohler for their help in deploying the sensors. ‘Cooling Singapore’ is a collaborative project led by the Singapore-ETH Centre (SEC), with Singapore-MIT Alliance for Research and Technology (SMART), TUMCREATE (established by the Technical University of Munich), the National University of Singapore (NUS), the Singapore Management University (SMU), and the Agency for Science, Technology, and Research (A*STAR).
Conflicts of Interest
The authors declare no conflict of interest.
References
- United Nations. World Population Prospects: The 2017 Revision, Key Findings and Advanced Tables; Department of Economic and Social Affairs, Population Division: New York, NY, USA, 2017. [Google Scholar]
- Aflaki, A.; Mirnezhad, M.; Ghaffarianhoseini, A.; Ghaffarianhoseini, A.; Omrany, H.; Wang, Z.H.; Akbari, H. Urban heat island mitigation strategies: A state-of-the-art review on Kuala Lumpur, Singapore and Hong Kong. Cities 2016, 62, 131–145. [Google Scholar] [CrossRef] [Green Version]
- Akbari, H.; Kolokotsa, D. Three decades of urban heat islands and mitigation technologies research. Energy Build. 2016, 133, 834–852. [Google Scholar] [CrossRef]
- Rizwan, A.M.; Dennis, L.Y.C.; Liu, C. A review on the generation, determination and mitigation of Urban Heat Island. J. Environ. Sci. 2008, 20, 120–128. [Google Scholar] [CrossRef]
- Santamouris, M. Regulating the damaged thermostat of the cities—Status, impacts and mitigation challenges. Energy Build. 2015, 91, 43–56. [Google Scholar] [CrossRef]
- Martilli, A.; Krayenhoff, E.S.; Nazarian, N. Is the Urban Heat Island intensity relevant for heat mitigation studies? Urban Clim. 2020, 31, 100541. [Google Scholar] [CrossRef]
- Tong, S.; Wong, N.H.; Tan, C.L.; Jusuf, S.K.; Ignatius, M.; Tan, E. Impact of urban morphology on microclimate and thermal comfort in northern China. Sol. Energy 2017, 155, 212–223. [Google Scholar] [CrossRef]
- Yang, J.; Bou-Zeid, E. Should cities embrace their heat islands as shields from extreme cold? J. Appl. Meteorol. Climatol. 2018, 57, 1309–1320. [Google Scholar] [CrossRef]
- Ali-Toudert, F.; Mayer, H. Numerical study on the effects of aspect ratio and orientation of an urban street canyon on outdoor thermal comfort in hot and dry climate. Build. Environ. 2006, 41, 94–108. [Google Scholar] [CrossRef]
- Herrmann, J.; Matzarakis, A. Mean radiant temperature in idealised urban canyons-examples from Freiburg, Germany. Int. J. Biometeorol. 2012, 56, 199–203. [Google Scholar] [CrossRef] [PubMed]
- Yang, W.; Wong, N.H.; Li, C.-Q. Effect of Street Design on Outdoor Thermal Comfort in an Urban Street in Singapore. J. Urban Plan. Dev. 2016, 142, 05015003. [Google Scholar] [CrossRef]
- Urban Climate Challenges in the Tropics. In Rethinking Planning and Design Opportunities; Emmanuel, R. (Ed.) Imperial College Press: London, UK, 2016; ISBN 9781783268405. [Google Scholar]
- Bourbia, F.; Boucheriba, F. Impact of street design on urban microclimate for semi arid climate (Constantine). Renew. Energy 2010, 35, 343–347. [Google Scholar] [CrossRef]
- Chatzidimitriou, A.; Yannas, S. Street canyon design and improvement potential for urban open spaces; the influence of canyon aspect ratio and orientation on microclimate and outdoor comfort. Sustain. Cities Soc. 2017, 33, 85–101. [Google Scholar] [CrossRef]
- Djekic, J.; Djukic, A.; Vukmirovic, M.; Djekic, P.; Brankovic, M.D. Thermal comfort of pedestrian spaces and the influence of pavement materials on warming up during summer. Energy Build. 2018, 159, 474–485. [Google Scholar] [CrossRef] [Green Version]
- Doulos, L.; Santamouris, M.; Livada, I. Passive cooling of outdoor urban spaces. The role of materials. Sol. Energy 2004, 77, 231–249. [Google Scholar] [CrossRef]
- Alexandri, E.; Jones, P. Temperature decreases in an urban canyon due to green walls and green roofs in diverse climates. Build. Environ. 2008, 43, 480–493. [Google Scholar] [CrossRef]
- Ali-Toudert, F.; Mayer, H. Effects of asymmetry, galleries, overhanging façades and vegetation on thermal comfort in urban street canyons. Sol. Energy 2007, 81, 742–754. [Google Scholar] [CrossRef]
- Kong, L.; Lau, K.K.-L.; Yuan, C.; Chen, Y.; Xu, Y.; Ren, C.; Ng, E. Regulation of Outdoor Thermal Comfort by Trees in Hong Kong. Sustain. Cities Soc. 2017, 31, 12–25. [Google Scholar] [CrossRef]
- de Munck, C.; Pigeon, G.; Masson, V.; Meunier, F.; Bousquet, P.; Tréméac, B.; Merchat, M.; Poeuf, P.; Marchadier, C. How much can air conditioning increase air temperatures for a city like Paris, France? Int. J. Climatol. 2013, 33, 210–227. [Google Scholar] [CrossRef]
- Ohashi, Y.; Genchi, Y.; Kondo, H.; Kikegawa, Y.; Yoshikado, H.; Hirano, Y. Influence of Air-Conditioning Waste Heat on Air Temperature in Tokyo during Summer: Numerical Experiments Using an Urban Canopy Model Coupled with a Building Energy Model. J. Appl. Meteorol. Climatol. 2007, 46, 66–81. [Google Scholar] [CrossRef]
- Lee, H.; Mayer, H.; Schindler, D. Importance of 3-D radiant flux densities for outdoor human thermal comfort on clear-sky summer days in Freiburg, Southwest Germany. Meteorol. Z. 2014, 23, 315–330. [Google Scholar] [CrossRef]
- Manavvi, S.; Rajasekar, E. Estimating outdoor mean radiant temperature in a humid subtropical climate. Build. Environ. 2020, 171, 106658. [Google Scholar] [CrossRef]
- ISO7726. Ergonomics of the Thermal Environment—Instruments for Measuring Physical Quantities; International Standarization Organization: Geneva, Switzerland, 1998; ISBN 0-580-38651-1. [Google Scholar]
- Acero, J.A.; Herranz-Pascual, K. A comparison of thermal comfort conditions in four urban spaces by means of measurements and modelling techniques. Build. Environ. 2015, 93, 245–257. [Google Scholar] [CrossRef]
- Mayer, H.; Holst, J.; Dostal, P.; Imbery, F.; Schindler, D. Human thermal comfort in summer within an urban street canyon in Central Europe. Meteorol. Z. 2008, 17, 241–250. [Google Scholar] [CrossRef]
- Kántor, N.; Unger, J. The most problematic variable in the course of human-biometeorological comfort assessment—The mean radiant temperature. Cent. Eur. J. Geosci. 2011, 3, 90–100. [Google Scholar] [CrossRef] [Green Version]
- Tan, C.L.; Wong, N.H.; Jusuf, S.K. Outdoor mean radiant temperature estimation in the tropical urban environment. Build. Environ. 2013, 64, 118–129. [Google Scholar] [CrossRef]
- Kuehn, L.A.; Stubbs, R.A.; Weaver, R.S. Theory of the globe thermometer. J. Appl. Physiol. 1970, 29, 750–757. [Google Scholar] [CrossRef]
- De Dear, R. Ping-pong globe thermometers for mean radiant temperatures. H V Eng. 1987, 60, 10–11. [Google Scholar]
- Herrmann, J.; Matzarakis, A. Influence of mean radiant temperature on thermal comfort of humans in idealized urban environments. In Proceedings of the 7th Conference on Biometeorology, Freiburg, Germany, 12–14 April 2010; pp. 522–527. [Google Scholar]
- Lin, T.P.; Matzarakis, A.; Hwang, R.L. Shading effect on long-term outdoor thermal comfort. Build. Environ. 2010, 45, 213–221. [Google Scholar] [CrossRef]
- Chen, L.; Yu, B.; Yang, F.; Mayer, H. Intra-urban differences of mean radiant temperature in different urban settings in Shanghai and implications for heat stress under heat waves: A GIS-based approach. Energy Build. 2016, 130, 829–842. [Google Scholar] [CrossRef]
- Middel, A.; Krayenhoff, E.S. Micrometeorological determinants of pedestrian thermal exposure during record-breaking heat in Tempe, Arizona: Introducing the MaRTy observational platform. Sci. Total Environ. 2019, 687, 137–151. [Google Scholar] [CrossRef] [PubMed]
- Kántor, N.; Kovács, A.; Lin, T.-P. Looking for simple correction functions between the mean radiant temperature from the “standard black globe” and the “six-directional” techniques in Taiwan. Theor. Appl. Climatol. 2015, 121, 99–111. [Google Scholar] [CrossRef]
- Crank, P.J.; Middel, A.; Wagner, M.; Hoots, D.; Smith, M.; Brazel, A. Validation of seasonal mean radiant temperature simulations in hot arid urban climates. Sci. Total Environ. 2020, 749, 141392. [Google Scholar] [CrossRef]
- Monteith, J.L.; Unsworth, M.H. Principles of Environmental Physics, 2nd ed.; Edward Arnold: London, UK, 1990; p. 197. [Google Scholar]
- Oke, T.R. Boundary Layer Climates; Routledge: New York, NY, USA, 1987. [Google Scholar]
- McArthur, L.J.B.; Hay, J.E. A technique for mapping the distribution of diffuse solar radiation over the sky hemisphere. J. Appl. Meteorol. 1981, 20, 421–429. [Google Scholar] [CrossRef]
- Reindl, D.T.; Beckman, W.A.; Duffie, J.A. Diffuse fraction correlations. Sol. Energy 1990, 45, 1–7. [Google Scholar] [CrossRef]
- Singapore Department of Statistics. Population Trends 2016; Singapore Department of Statistics: Singapore, 2017; ISBN 1793-2424.
- Roth, M.; Chow, W.T.L. A historical review and assessment of urban heat island research in Singapore. Singap. J. Trop. Geogr. 2012, 33, 381–397. [Google Scholar] [CrossRef]
- Chow, W.T.L.; Roth, M. Temporal dynamics of the urban heat island o Singapore. Int. J. Climatol. 2006, 26, 2243–2260. [Google Scholar] [CrossRef]
- Acero, J.A.; Koh, E.J.Y.; Tan, Y.S. Analysis of Climatic Variables in Different Urban Sites of Singapore and Evaluation of Strategies to Improve the Outdoor Thermal Environment; Technical Report. ETH Collection 2020. [Google Scholar] [CrossRef]
- Tetens, O. Uber einige meteorologische Begriffe. Z. Geophys 1930, 6, 297–309. [Google Scholar]
- Acero, J.A.; Dissegna, M.A.; Tan, Y.S.; Tan, A.; Norford, L.K. Outdoor performance of the black globe temperature sensor on a hot and humid tropical region. Environ. Technol. 2021. Manuscript Submitted for Publication. [Google Scholar]
- Nobre, A.M.; Dazhi, Y.; Tan, A.L.; Thome, E.R.; Tan, J.; Tan, A.D. Large-area 2D mapping of PV system performace. In Proceedings of the 29th European Photovoltaic Solar Energy Conference, Amsterdam, The Netherlands, 22–26 September 2014. [Google Scholar]
- Matzarakis, A.; Rutz, F.; Mayer, H. Modelling radiation fluxes in simple and complex environments—Application of the RayMan model. Int. J. Biometeorol. 2007, 51, 323–334. [Google Scholar] [CrossRef]
- Matzarakis, A.; Rutz, F.; Mayer, H. Modelling radiation fluxes in simple and complex environments: Basics of the RayMan model. Int. J. Biometeorol. 2010, 54, 131–139. [Google Scholar] [CrossRef] [Green Version]
- Dazhi, Y.; Jirutitijaroen, P.; Walsh, W.M. The Estimation of Clear Sky Global Horizontal Irradiance at the Equator. Energy Procedia 2012, 25, 141–148. [Google Scholar] [CrossRef] [Green Version]
- Du, J.; Sun, C.; Xiao, Q.; Chen, X.; Liu, J. Field assessment of winter outdoor 3-D radiant environment and its impact on thermal comfort in a severely cold region. Sci. Total Environ. 2020, 709, 136175. [Google Scholar] [CrossRef]
- Krüger, E.L.; Minella, F.O.; Rasia, F. Impact of urban geometry on outdoor thermal comfort and air quality from field measurements in Curitiba, Brazil. Build. Environ. 2011, 46, 621–634. [Google Scholar] [CrossRef]
- Lai, A.; Maing, M.; Ng, E. Observational studies of mean radiant temperature across different outdoor spaces under shaded conditions in densely built environment. Build. Environ. 2017, 114, 397–409. [Google Scholar] [CrossRef]
- Chatzipoulka, C.; Compagnon, R.; Kaempf, J.; Nikolopoulou, M. Sky view factor as predictor of solar availability on building façades. Sol. Energy 2018, 170, 1026–1038. [Google Scholar] [CrossRef]
Figure 1.
Visual description of the sensors deployed in each site.

Figure 2.
Location of the areas of study in Singapore (Duxton Park area and CDB area) as well as station 322 of the Solar Energy Research Institute of Singapore (SERIS) where solar irradiance values were obtained.
Figure 2.
Location of the areas of study in Singapore (Duxton Park area and CDB area) as well as station 322 of the Solar Energy Research Institute of Singapore (SERIS) where solar irradiance values were obtained.

Figure 3.
Location of the selected sites for the measurement campaign in the Duxton Park area.

Figure 4.
Location of the selected sites for the measurement campaign in the CBD area.

Figure 5.
Mean Tmrt diurnal cycle (using 10-min averaged values) in Pinnacle1, Pinnacle2, and Duxton3 in Duxton Park in two different seasons: (a) SW-Monsoon (1 to 31 August 2019) and (b) Inter-Monsoon (1 to 23 October 2019).
Figure 5.
Mean Tmrt diurnal cycle (using 10-min averaged values) in Pinnacle1, Pinnacle2, and Duxton3 in Duxton Park in two different seasons: (a) SW-Monsoon (1 to 31 August 2019) and (b) Inter-Monsoon (1 to 23 October 2019).

Figure 6.
Mean Tmrt diurnal cycle (using 10-min averaged values) in BoonTat711, BoonTatSt, McCallumSt, and RobinsonRd in the CBD in two different periods: (a) wet Inter-Monsoon (15 to 30 November 2019) and (b) wet NE-Monsoon (30 December 2019 to 13 January 2020).
Figure 6.
Mean Tmrt diurnal cycle (using 10-min averaged values) in BoonTat711, BoonTatSt, McCallumSt, and RobinsonRd in the CBD in two different periods: (a) wet Inter-Monsoon (15 to 30 November 2019) and (b) wet NE-Monsoon (30 December 2019 to 13 January 2020).

Figure 7.
Diurnal cycle of Tmrt (using 10-min averaged values) and global incoming solar irradiance (using 10-min values) in Pinnacle1 and Pinnacle2 on (a) 13 July and (b) 11 October 2019.
Figure 7.
Diurnal cycle of Tmrt (using 10-min averaged values) and global incoming solar irradiance (using 10-min values) in Pinnacle1 and Pinnacle2 on (a) 13 July and (b) 11 October 2019.

Figure 8.
Relation between Tmrt and the Clearness Index in the shade and non-shaded sites in the morning and afternoon (Duxton3 and Pinnacle2) during August 2019.
Figure 8.
Relation between Tmrt and the Clearness Index in the shade and non-shaded sites in the morning and afternoon (Duxton3 and Pinnacle2) during August 2019.

Figure 9.
Relation between Tmrt (°C) and diffuse solar radiation (Watt/m2) in the shaded sites (Pinnacle1 and Pinnacle2) and non-shaded site (Duxton3) in the late afternoon during August 2019 (days with precipitation before 17:00 are not considered).
Figure 9.
Relation between Tmrt (°C) and diffuse solar radiation (Watt/m2) in the shaded sites (Pinnacle1 and Pinnacle2) and non-shaded site (Duxton3) in the late afternoon during August 2019 (days with precipitation before 17:00 are not considered).

Figure 10.
Diurnal cycle of Tmrt (using 10-min averaged data) and global incoming solar irradiance (using 10-min values) in Duxton3, Pinnacle1, and Pinnacle2 on (a) 1 August 2019 (clear skies during most of the day) and (b) 25 July 2019 (partly cloudy day).
Figure 10.
Diurnal cycle of Tmrt (using 10-min averaged data) and global incoming solar irradiance (using 10-min values) in Duxton3, Pinnacle1, and Pinnacle2 on (a) 1 August 2019 (clear skies during most of the day) and (b) 25 July 2019 (partly cloudy day).

Figure 11.
Mean Tmrt diurnal cycle (from 10-min averaged data) in BoonTat711, BoonTatSt, and McCallumSt in the CBD area during the wet NE-Monsoon season (1 December 2019 to 13 January 2020).
Figure 11.
Mean Tmrt diurnal cycle (from 10-min averaged data) in BoonTat711, BoonTatSt, and McCallumSt in the CBD area during the wet NE-Monsoon season (1 December 2019 to 13 January 2020).

Figure 12.
Relation between diffuse solar radiation (above the urban canopy) and the Tmrt difference (∆Tmrt in °C) between a low SVF site (BoonTatSt/BoonTat711) and a high SVF site (McCallumSt) in the period 12:00 to 13:00 during the wet NE-Monsoon season (1 December 2019 to 13 January 2020) and under dry conditions.


Table 1.
Description of the sites in the Duxton Park area where measurements were carried out.
| Site | Description | Picture | SVF (1) |
|---|---|---|---|
| Pinnacle1 | Asymmetrical street canyon (high-rise buildings on one side and low-rise development on the other). NW street orientation. Shadow of high-rise building in the afternoon and trees in the morning. |  |  |
| Pinnacle2 | Asymmetrical street canyon (high-rise towers on one side and low-rise development on the other). NW street orientation. Shadow of high-rise building in the afternoon. Influence of nearby low height trees and bushes. |  |  |
| Duxton3 | Low-rise development area. Buildings on both sides of the canyon are not higher than 10 m. Ground mostly covered with grass. NNW street orientation. Most relevant shadow provided by some tall palm trees (high transmissivity) before noon. Site with highest sky view factor. |  |  |
Table 2.
Description of the sites in the CBD area were measurements were carried out.
| Site | Description | Picture | SVF (1) |
|---|---|---|---|
| BoonTat711 | Asymmetrical street canyon (high-rise buildings on one side and Telok Ayer Market (low-rise development) on the other). Street with NW-SE orientation. Shadow in the afternoon due to high-rise building. Site with unusual high SVF due to openness and low-rise development in one side. |  |  |
| RobinsonRd | High-rise development with street aspect ratio ≈2.5 (low sky view factor) and NE-SW orientation. Only a short period (≈2 h) of direct solar radiation around midday/afternoon. |  |  |
| BoonTatSt | Low-rise development with street aspect ratio ≈1 (high sky view factor), and NW-SE orientation. Shadow during the afternoon. Farthest site from the shore line. |  |  |
| McCallumSt | High-rise development with street aspect ratio ≈2.5 (low sky view factor), and NW-SE orientation. Shadow of high-rise building in the afternoon. |  |  |
Table 3.
Mean midday/afternoon climatic values (11–16 h) registered in Pinnacle1 and Pinnacle2 on 13 July and 11 October 2019.
Table 3.
Mean midday/afternoon climatic values (11–16 h) registered in Pinnacle1 and Pinnacle2 on 13 July and 11 October 2019.
| Day | Site | WS (ms−1) | Ta (°C) | e (hPa) |
|---|---|---|---|---|
| 13 July | Pinnacle1 | 1.7 | 31.1 | 24.9 |
| Pinnacle2 | 1.0 | 32.2 | 25.3 | |
| 11 October | Pinnacle1 | 1.4 | 31.1 | 25.3 |
| Pinnacle2 | 0.8 | 31.6 | 25.4 |
Table 4.
Mean and maximum solar irradiance values (Watt/m2) registered in station 322 of SERIS (close to Duxton Park) during different periods of the day on 25 July and 1 August 2019.
Table 4.
Mean and maximum solar irradiance values (Watt/m2) registered in station 322 of SERIS (close to Duxton Park) during different periods of the day on 25 July and 1 August 2019.
| Date | Morning (7:00 to 10:00) | Midday/ Afternoon (11:00 to 16:00) | Evening (17:00 to 19:00) | |
|---|---|---|---|---|
| 25 July (cloudy day) | Mean | 141 | 599 | 155 |
| Max. | 371 | 833 | 238 | |
| 1 August (clear skies day) | Mean | 207 | 738 | 188 |
| Max. | 593 | 987 | 361 |
Publisher’s Note: MDPI stays neutral with regard to jurisdictional claims in published maps and institutional affiliations. |
© 2021 by the authors. Licensee MDPI, Basel, Switzerland. This article is an open access article distributed under the terms and conditions of the Creative Commons Attribution (CC BY) license (https://creativecommons.org/licenses/by/4.0/).
Share and Cite
MDPI and ACS Style
Acero, J.A.; Koh, E.J.Y.; Tan, Y.S.; Norford, L.K. Quantifying the Effect of Building Shadowing and Cloudiness on Mean Radiant Temperature in Singapore. Atmosphere 2021, 12, 1012. https://0-doi-org.brum.beds.ac.uk/10.3390/atmos12081012
AMA Style
Acero JA, Koh EJY, Tan YS, Norford LK. Quantifying the Effect of Building Shadowing and Cloudiness on Mean Radiant Temperature in Singapore. Atmosphere. 2021; 12(8):1012. https://0-doi-org.brum.beds.ac.uk/10.3390/atmos12081012
Chicago/Turabian StyleAcero, Juan A., Elliot J. Y. Koh, Yon Sun Tan, and Leslie K. Norford. 2021. "Quantifying the Effect of Building Shadowing and Cloudiness on Mean Radiant Temperature in Singapore" Atmosphere 12, no. 8: 1012. https://0-doi-org.brum.beds.ac.uk/10.3390/atmos12081012
Note that from the first issue of 2016, this journal uses article numbers instead of page numbers. See further details here.