
30 Years of Air Quality Trends in Japan


1
Japan Automobile Research Institute, 2530 Karima, Tsukuba 305-0822, Japan
2
Institute of Integrated Atmospheric Environment (IIAE), Emeritus of Ehime University, Matsuyama 790-8566, Japan
3
National Institute for Environmental Studies (NIES), 16 Onogawa, Tsukuba 305-8506, Japan
*
Author to whom correspondence should be addressed.
Atmosphere 2021, 12(8), 1072; https://0-doi-org.brum.beds.ac.uk/10.3390/atmos12081072
Submission received: 15 June 2021
/
Revised: 16 August 2021
/
Accepted: 16 August 2021
/
Published: 21 August 2021
(This article belongs to the Special Issue Air Pollution in Japan)
Abstract
:The aim of this paper is to obtain information that will contribute to measures and research needed to further improve the air quality in Japan. The trends and characteristics of air pollutant concentrations, especially PM2.5, ozone, and related substances, over the past 30 years, are analyzed, and the relationships between concentrations and emissions are discussed quantitatively. We found that PM2.5 mass concentrations have decreased, with the largest reduction in elemental carbon (EC) as the PM2.5 component. The concentrations of organic carbon (OC) have not changed significantly compared to other components, suggesting that especially VOC emissions as precursors need to be reduced. In addition, the analysis of the differences in PM2.5 concentrations between the ambient and the roadside showed that further research on non-exhaust particles is needed. For NOx and SO2, there is a linear relationship between domestic anthropogenic emissions and atmospheric concentrations, indicating that emission control measures are directly effective in the reduction in concentrations. Also, recent air pollution episodes and the effect of reduced economic activity, as a consequence of COVID-19, on air pollution concentrations are summarized.
1. Introduction
Air pollution is one of the major environmental risk factors affecting human health, climate change, and ecosystems. The World Health Organization (WHO) reported that air pollution was associated with seven million deaths in the world in 2016 [1]. Many air pollutants are emitted along with carbon dioxide (CO2), by combustion, and some of them have radiative forcing, which affects the global radiation balance [2]. In addition, air pollutants, such as ozone, affect the yield of crops [3], which may lead to a decrease in food supply in the future. In Japan, measures to control the air pollutant emissions from various stationary and mobile sources, have been applied since the 1950s. Wakamatsu et al. (2013) [4] discussed the relationship between air pollution trends throughout Japan and Tokyo from 1970 to 2012, and air pollution control measures. That study clarified that the concentration of air pollutants is steadily decreasing, due to the effects of various source measures. On the other hand, regarding particulate matter (e.g., PM2.5) and photochemical oxidants (e.g., ozone), which are mainly composed of secondary air pollutants, the compliance rate of air quality standards, which is defined as the ratio of the number of stations complying with air quality standards to the total number of stations, has not reached 100%, and further measures are required. Information on the compliance rate of air quality standards in Japan, the inter-comparison with the United States and Europe, and the WHO air quality guidelines, are summarized in Supplement (S1).
PM2.5 is defined as a particulate matter that has a diameter of less than 2.5 micrometers, and its concentration is associated with ischemic heart disease [5]. Photochemical oxidants are defined as ozone, peroxyacetyl nitrate, and other oxidizing substances that are produced by photochemical reactions (which liberate iodine from neutral potassium iodide solution, excluding nitrogen dioxide). Since photochemical oxidants are almost the same as tropospheric ozone, they are referred to as ‘ozone’ hereafter. Ozone, the precursors of which are nitrogen oxides and volatile organic compounds, is one of the short-lived climate pollutants. The concentration of ozone has been gradually increasing year-by-year, over a wide area of Japan, including rural areas (that are not directly affected by anthropogenic emission sources of air pollutants).
There are not many papers that summarize the relationship between emissions and the concentrations of air pollutants in Japan, over a long period of time. Wakamatsu et al. (2013) [4] analyzed the relationships between the introduction of regulations, mainly on automobiles, and air pollutant concentrations, up to 2012 in Japan, and the results showed that the introduction of stricter regulations led to a decrease in air pollutant concentrations. However, the relationship between emissions and concentrations of air pollutants was not quantitatively analyzed. Kannari et al. (2013) [6] summarized the relationships between vehicle emissions and air pollutant concentrations, from 1980 to 2010. In this paper, it was suggested that while air pollutants concentrations, such as NOx and CO, decrease in response to a decrease in vehicle emissions, there are substances for which the influence of non-vehicle sources and secondary generation processes is significant (e.g., NMHC, PM). However, emissions including stationary sources were not directly taken into account in this paper. In Japan, the transboundary transportation of high-concentration PM2.5 was widely reported in newspapers and news reports in 2013, and PM2.5 has been a major social concern since then. The air pollution in Japan has mainly been improved mainly the measures against vehicle emissions. However, in order to further improve air pollution, it is necessary to consider not only the impact of vehicle emissions, but also the impact of non-vehicle emission sources and transboundary transportation. Recently, as part of the measures to prevent the spread of the novel coronavirus (COVID-19), there have been changes in economic activities, and there has been a trend towards improvement in air pollution.
This paper analyzes the trends and characteristics of the concentrations of various air pollutants, mainly focusing on PM2.5, ozone, and related substances, as typical substances that do not comply with air quality standards, over the past 30 years, since the 1990s in Japan. Also, the relationship between the emissions and concentrations of air pollutants are quantitatively analyzed, in order to obtain information that will contribute to the measures and research needed to further improve air pollution in the future. The most recent air pollution episodes, such as wide-area high-concentration ozone and high-concentration PM2.5 from volcanic eruptions, as well as the impact of reduced economic activity, due to measures to prevent the spread of COVID-19 on air pollution concentrations, were also analyzed. Based on these results, the necessary countermeasures for each air pollutant are discussed.
2. Materials and Methods
Monitoring data of air pollutant concentrations, which are available to the public, were used for analysis in this study. An overview of the monitoring of air pollutants in Japan is given below.
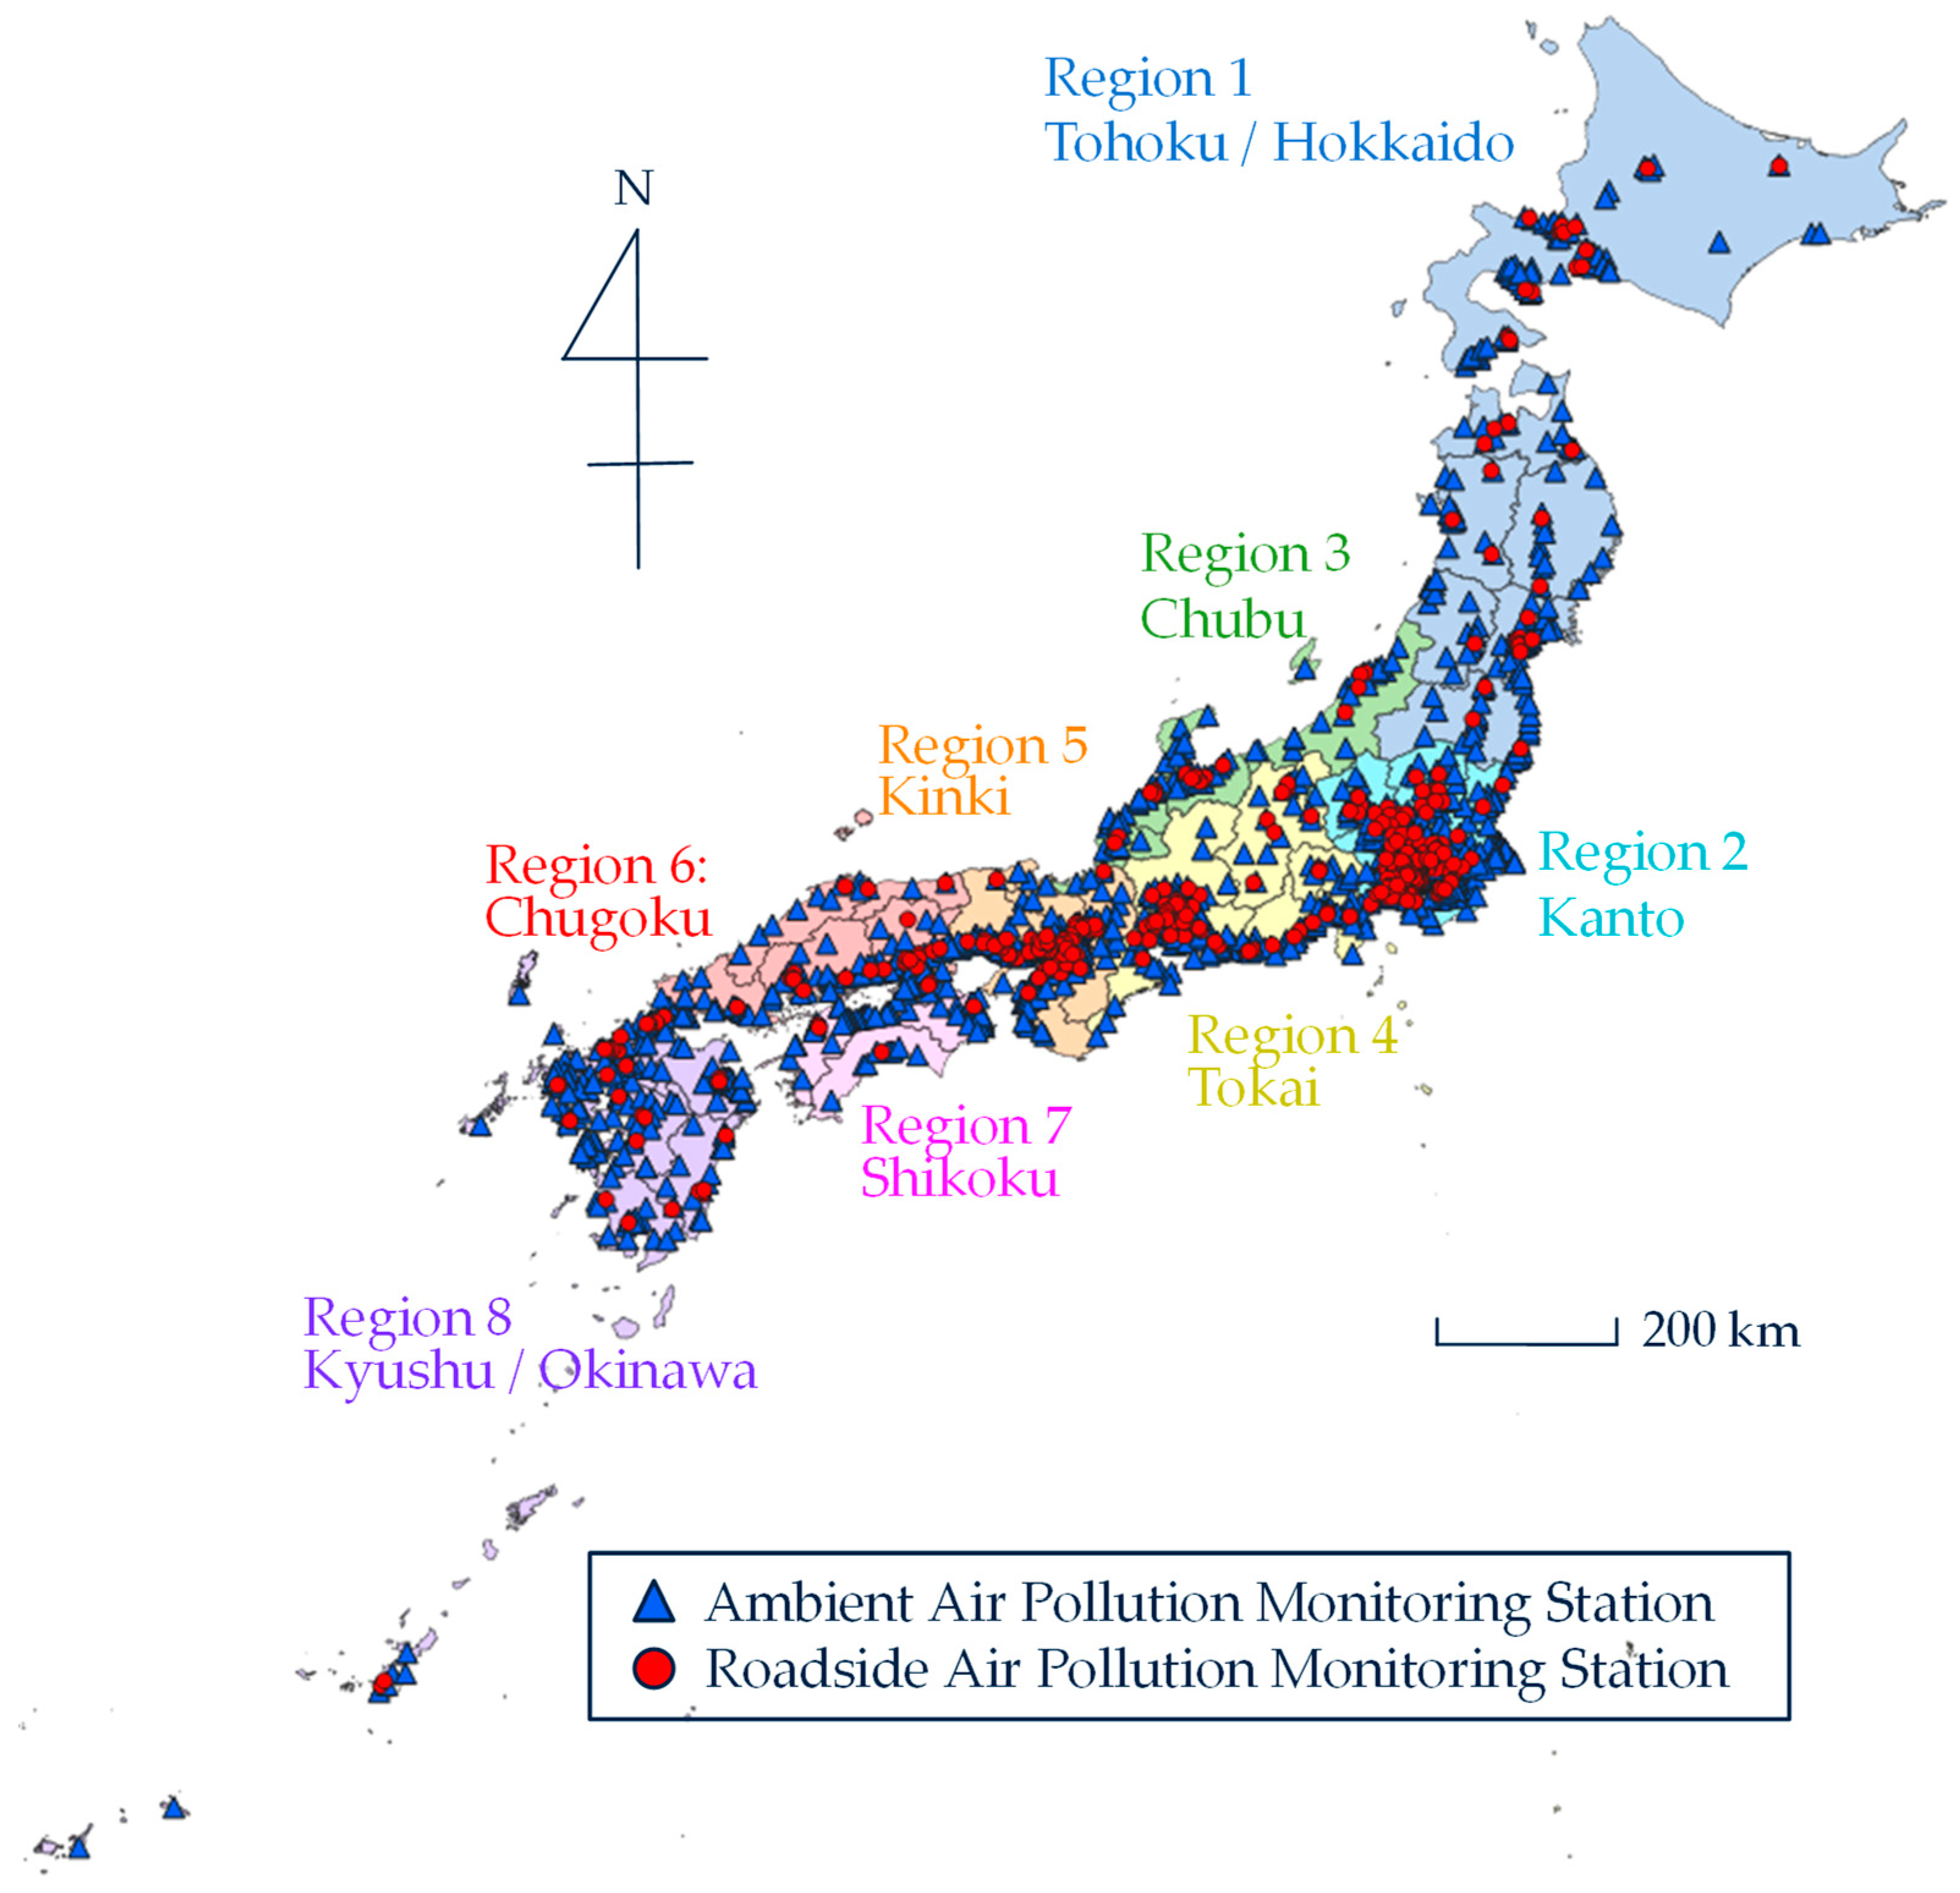
In Japan, continuous monitoring of air pollutant concentrations using automatic measurement instruments has been carried out since the early 1970s. Currently, there are about 1900 monitoring stations nationwide and they are roughly divided into two types depending on the installation location. One is ambient air quality monitoring stations (AAQMS, with 1468 monitoring stations as of 2018) installed in general environments such as residential areas, and the other is roadside air quality monitoring stations (RsAQMS, with 407 monitoring stations as of 2018) installed in places that are directly affected by automobile exhaust gas. Figure 1 shows a map of the distributions of an AAQMS and an RsAQMS. Figure 1 also shows the positional relationship from region 1 to region 8, considering the geographical commonality of Japan. Examples of AAQMS and RsAQMS photographs, and the characteristics of regions 1 to region 8, are shown in Supplement (S2).
Table 1 shows the main air pollutants that are continuously measured, the year when the measurements started, and the number of monitoring stations, as of 2018. The main air pollutants are particulate matter (PM2.5, SPM), ozone (O3), nitrogen oxides (NOx), non-methane hydrocarbon (NMHC), sulfur dioxide (SO2), carbon monoxide (CO), etc. SPM, which has been measured in Japan since the early 1970s, is similar to PM10, but the definition of the cutoff particle size is different. PM10 is defined as particulate matter with an aerodynamic diameter of 10 µm, collected with 50% efficiency [7]. SPM is defined as particles with a particle size of 10 µm or less, which means that the cutoff is an aerodynamic diameter of 7 µm, with 50% efficiency [4]. Methods for measuring these gaseous and particulate substances are available on the web of the Ministry of the Environment [8]. Detailed data handling, determination of measured values, and quality control methods, are described in a separate manual [9]. Concentration data (hourly, monthly, and annually) can be obtained from a website [10]. Since the start of the measurement, many monitoring stations have been set up, and now there are approximately 1900 stations. In addition to the above-mentioned continuous measurement, PM2.5 component concentrations are measured four times a year for two weeks, and are measured at 130 AAQMS, 33 RsAQMS, and 16 rural stations [11]. The main observation items for the PM2.5 component concentration are inorganic ions (e.g., sulfate, nitrate, ammonium ions), carbon components (e.g., elemental carbon (EC), organic carbon (OC)), metal components (e.g., Zn, Cu), and indicative organic tracers (e.g., levoglucosan, an indicator of cellulose combustion). The Ministry of the Environment started measuring PM2.5 components and metal components with high time resolutions, using an aerosol chemical speciation analyzer (ACSA, Kimoto Electric Co., Ltd. (Osaka, Japan)) and a continuous particulate monitor with X-ray fluorescence (PX-375, Horiba), at ten locations nationwide in 2017. These high time resolution PM2.5 component measurements can be found in the literature elsewhere [12].
3. Results and Discussion
3.1. General Characteristics of Air Quality in Japan
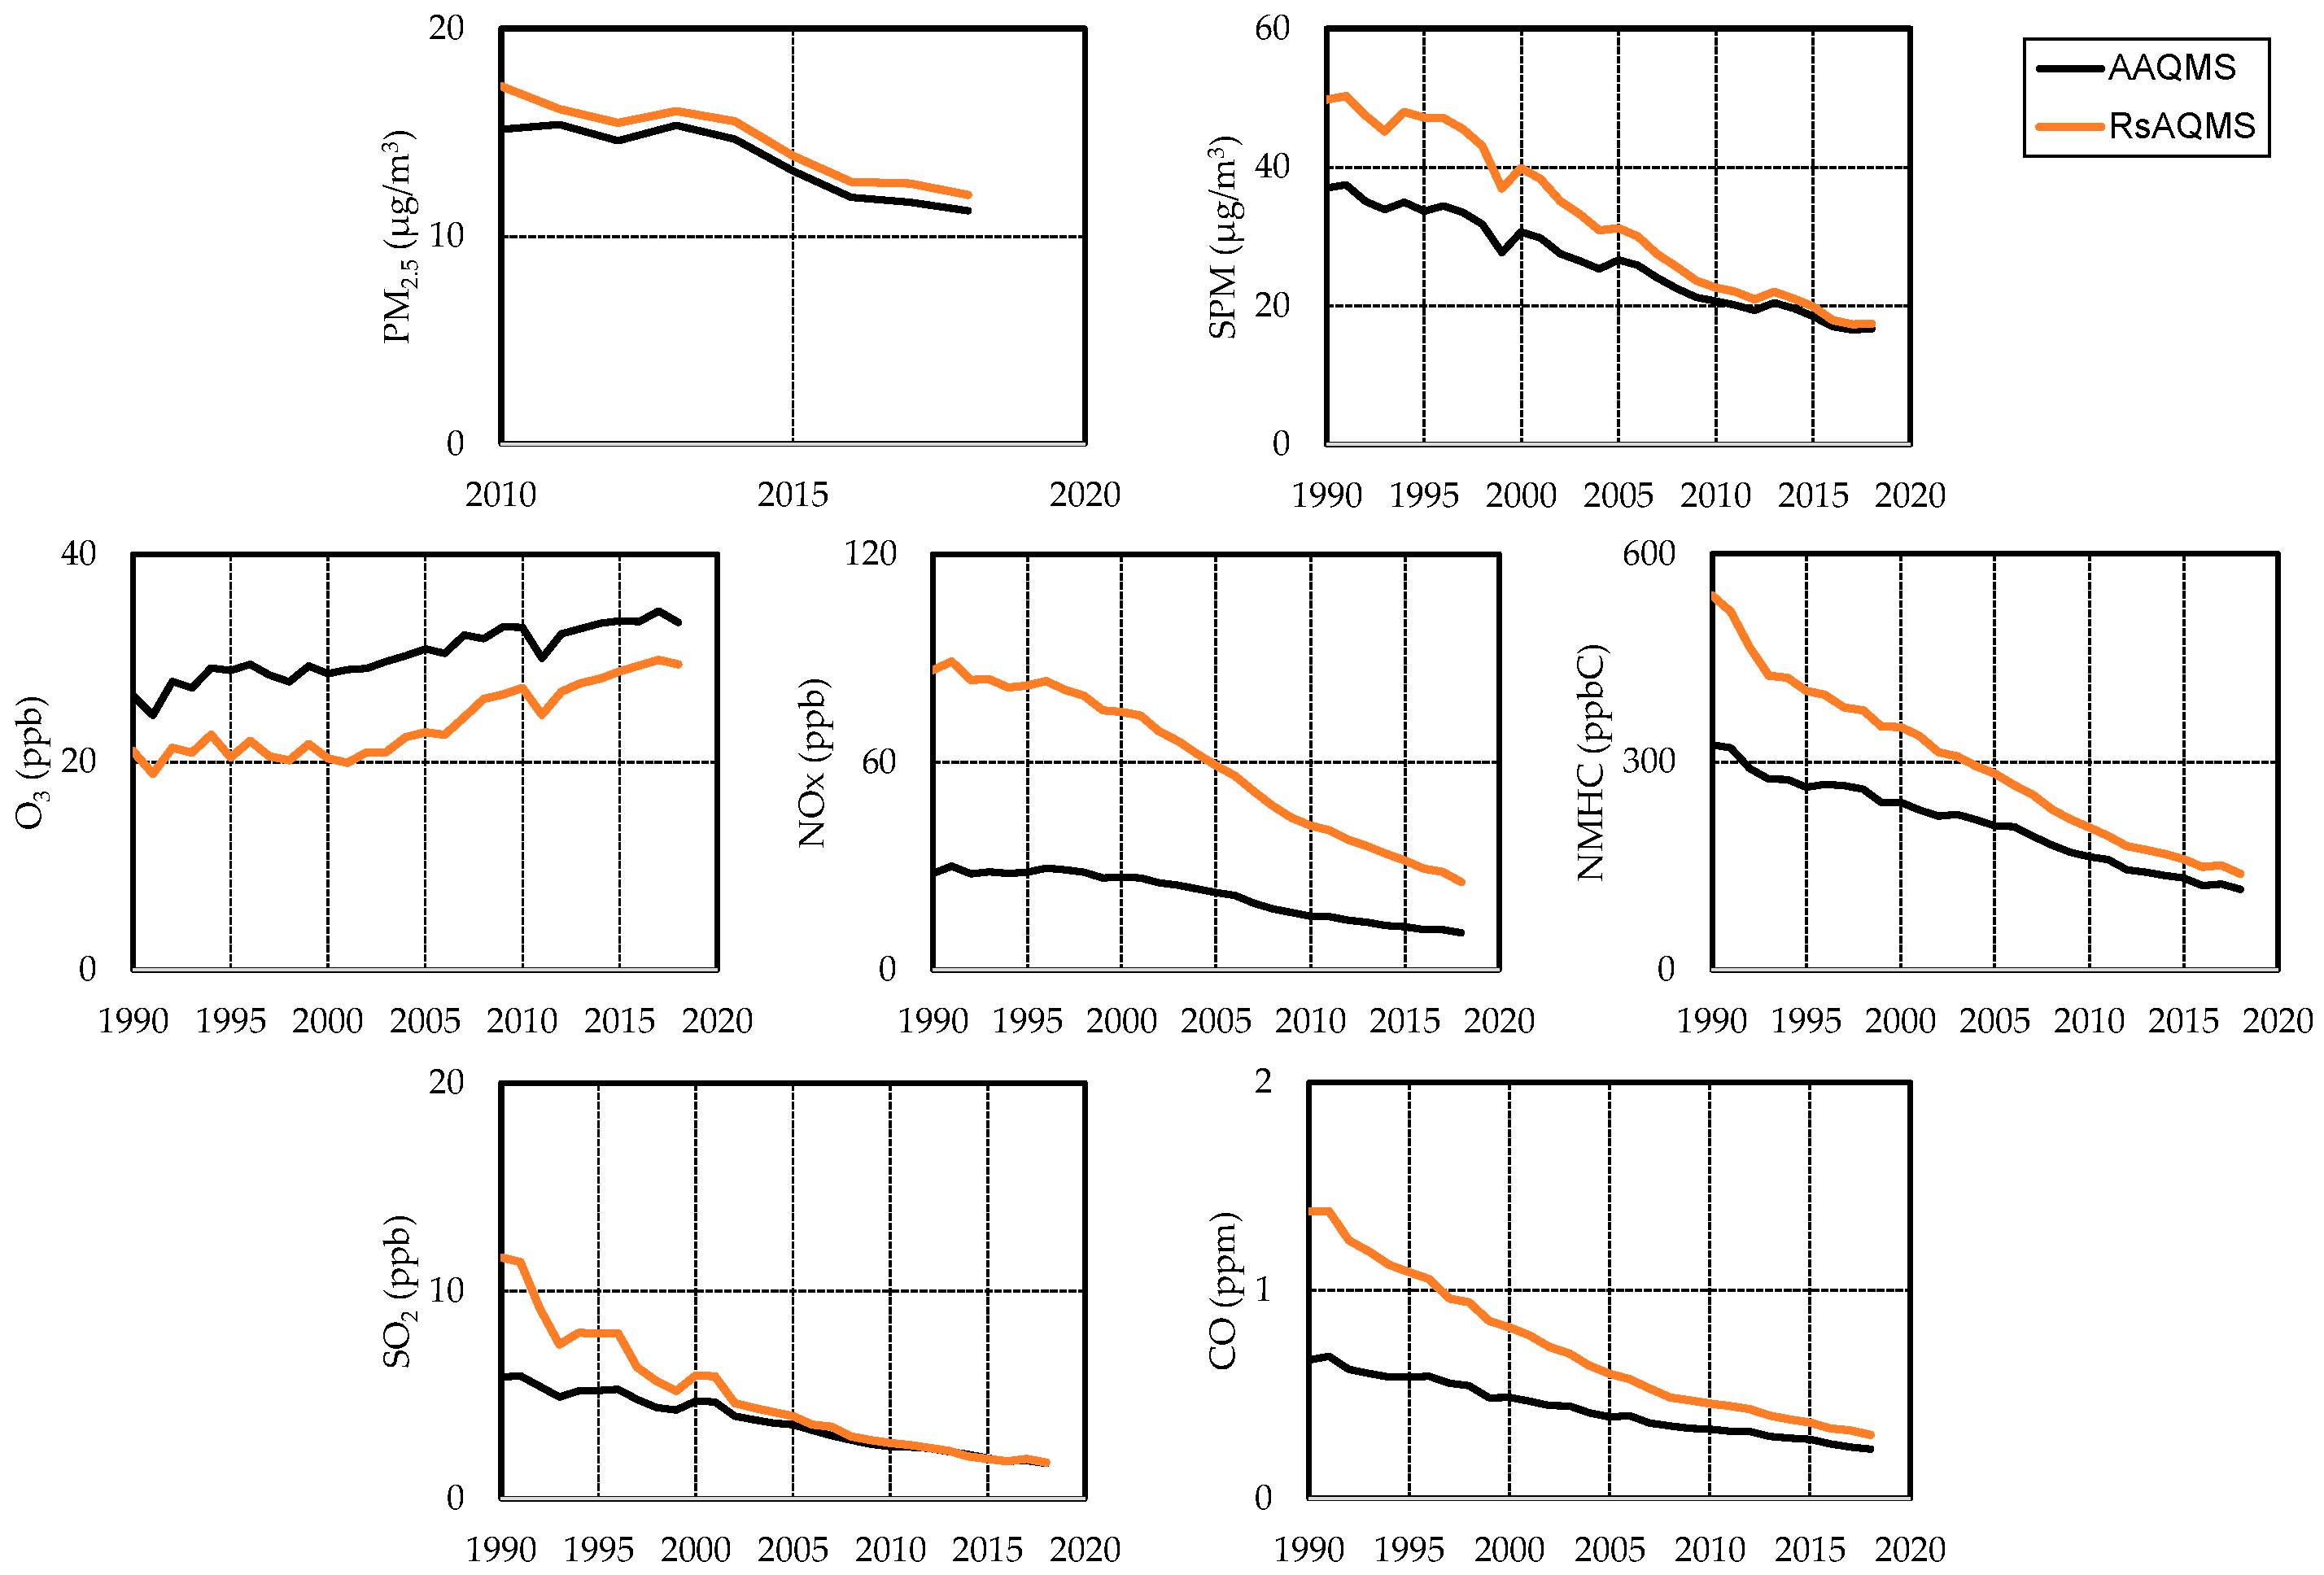
Figure 2 shows the secular changes in the annual average concentrations of air pollutants at AAQMS and RsAQMS in Japan, from 1990 to 2018. For PM2.5, the figure shows the change in concentration over time, since 2010, which was the year when the nationwide measurement started. The annual average concentration of O3 is calculated based on the data measured during the daytime (defined here as 5:00 to 20:00). These results show that air pollution concentrations are decreasing year-by-year, except for O3, and for some substances there is almost no difference in concentration between the AAQMS and RsAQMS, indicating the effect of reducing vehicle emissions through automobile exhaust measures.
3.1.1. Particulate Matter (PM2.5, Suspended Particulate Matter (SPM))
Table 2 shows the average concentrations of PM2.5 at AAQMS and RsAQMS nationwide, in each region in 2010 and 2018, and the concentration ratios between 2010 and 2018. The national average concentrations and standard deviation of PM2.5 at AAQMS and RsAQMS were 15.1 ± 2.8 μg/m3 and 17.1 ± 2.8 μg/m3 in 2010, and 11.2 ± 2.1 μg/m3 and 12.0 ± 2.0 μg/m3 in 2018, respectively. The concentrations of PM2.5 decreased by 26% (AAQMS) and 30% (RsAQMS) over this period. As the number of monitoring stations for PM2.5 has been gradually increasing since 2010, there are some regions where no observation was conducted in 2010, but the rate of decrease in PM2.5 concentration tends to be large in the western part of Japan (regions 4–8). The difference in concentration between the AAQMS and RsAQMS is 0.8 μg/m3, on average, nationwide (the range of difference by region is 0.3–1.6 μg/m3) in 2018, and the concentration at the RsAQMS is higher than that at the AAQMS in all the regions.
Figure S3 shows the PM2.5 concentrations (annual average concentrations) at three sites in South Korea and five sites in China, from 2010 to 2019 [13]. The ratio of PM2.5 concentration in 2019 to that in 2011 is 0.43 in Beijing, 0.69 in Shanghai, and 0.54 in Guangzhou, indicating that the PM2.5 concentrations have decreased significantly, which is likely due to an effect of the emission control measures in China. This indicates that the impact of transboundary PM2.5 on Japan is also decreasing, as pointed out by Uno et al. (2020) [14]. PM2.5 concentrations have also shown a decreasing trend since 2015, at the three sites in South Korea.
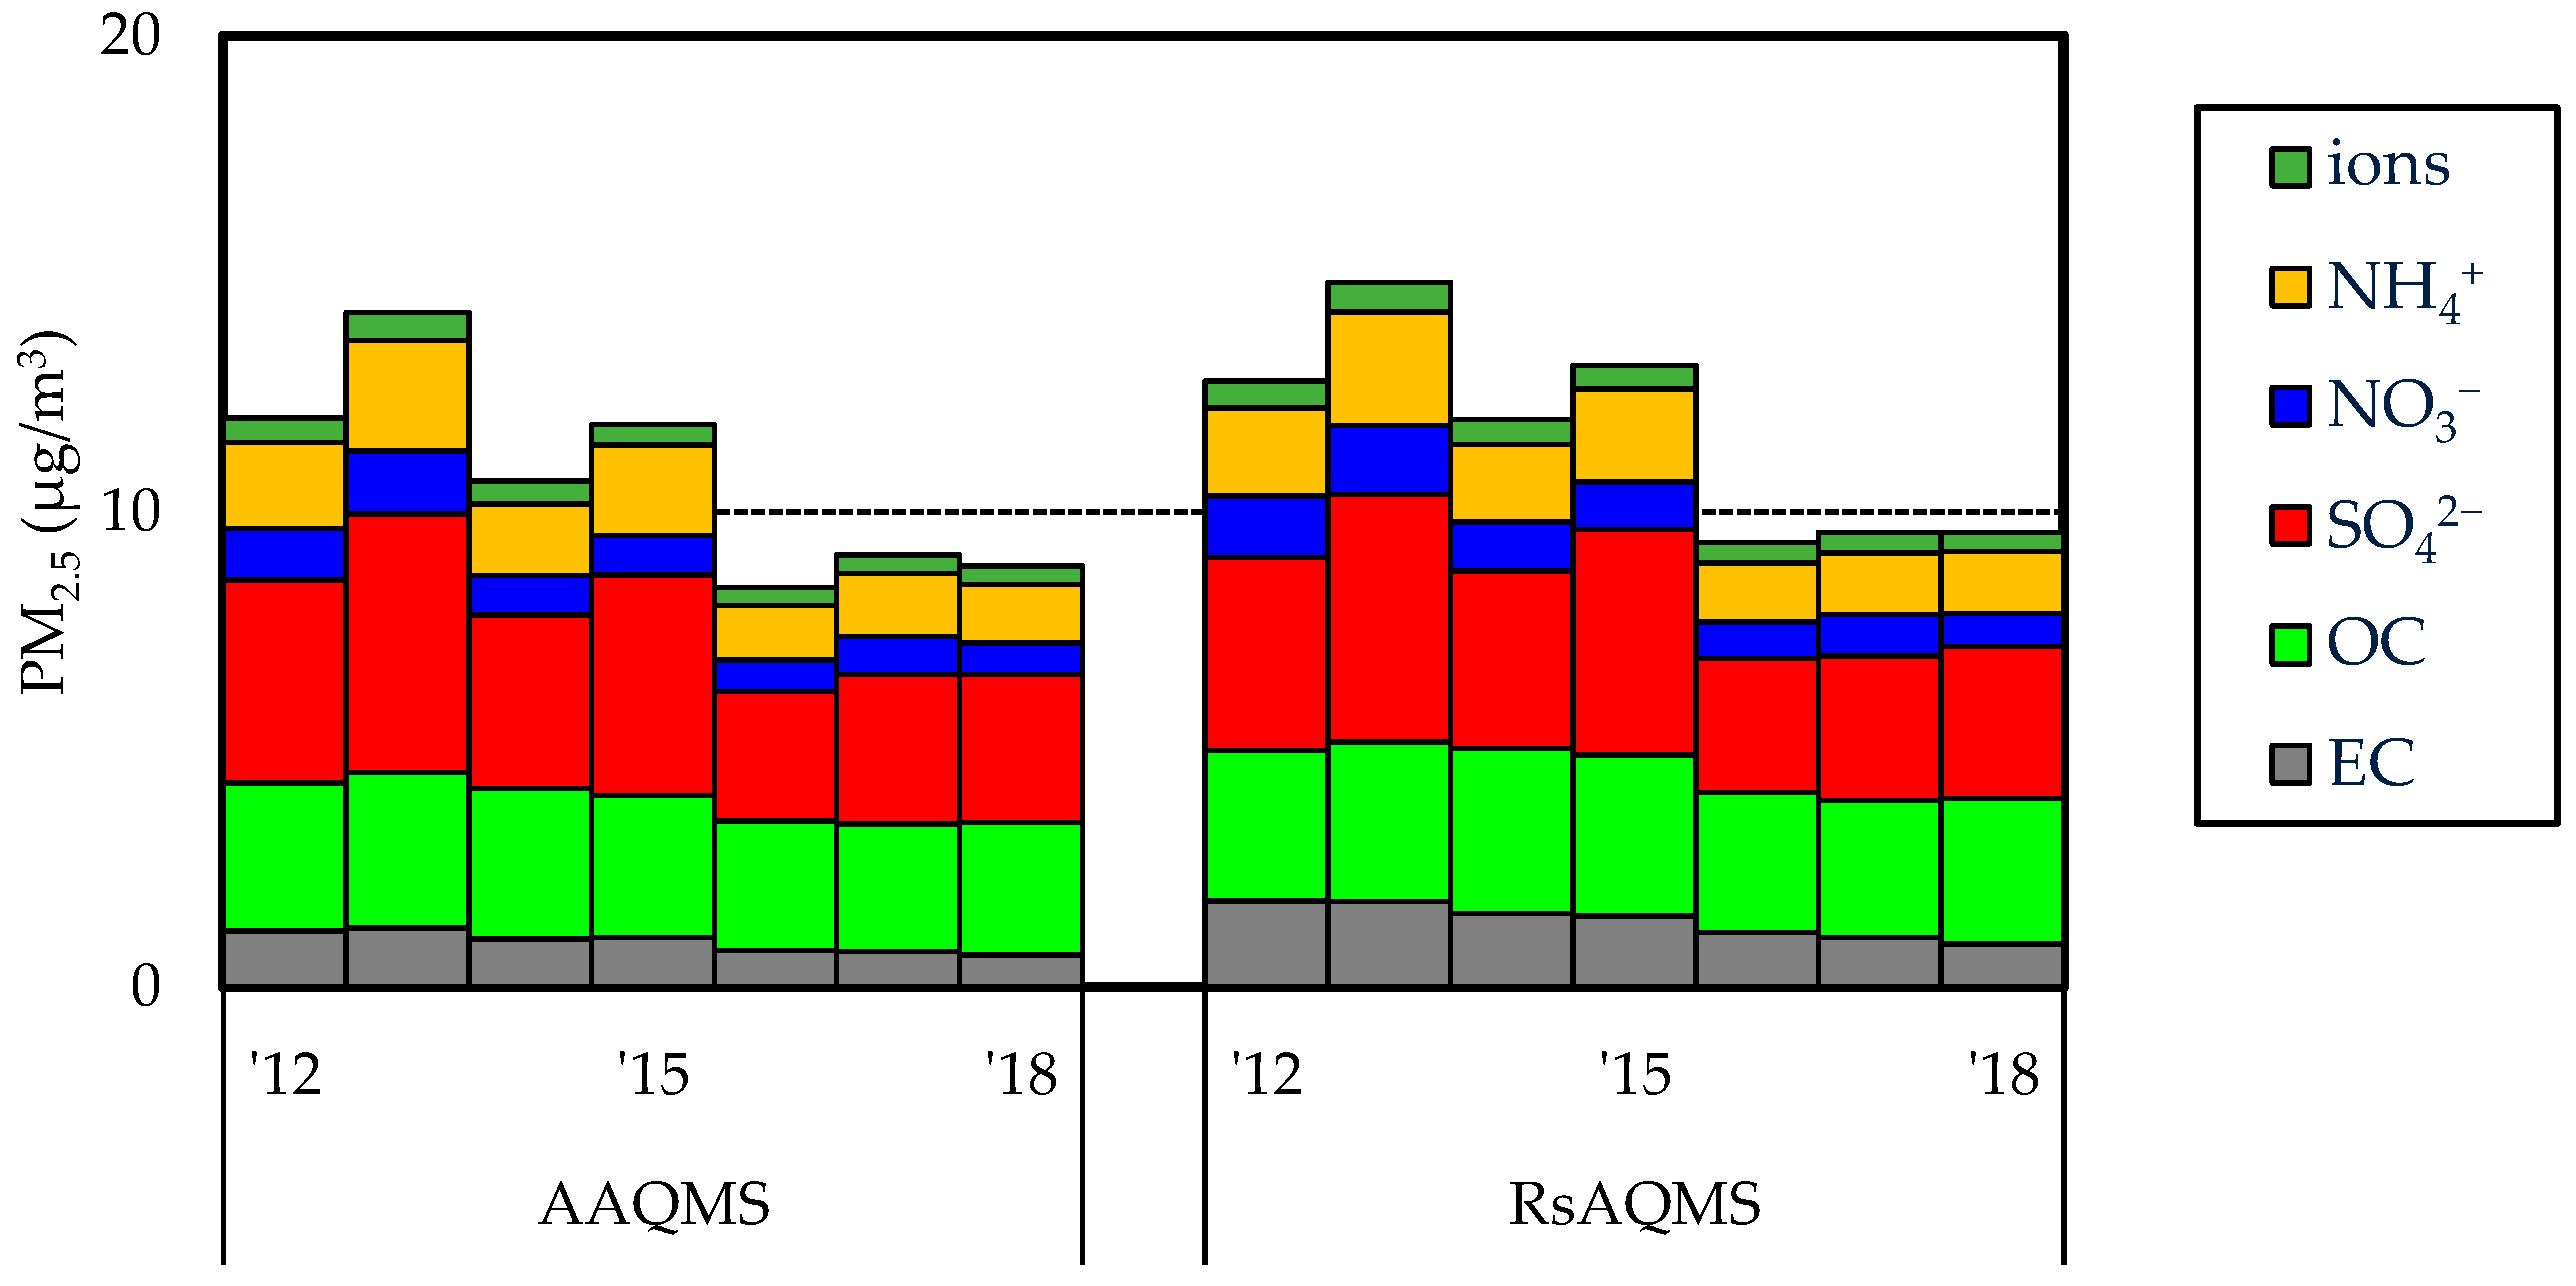
Figure 3 shows the average concentrations of the main components in PM2.5, from 2012 to 2018, at AAQMS and RsAQMS nationwide. Here, the main components of PM2.5 are elemental carbon (EC), organic carbon (OC), sulfate (SO42−), nitrate (NO3−), ammonium (NH4+), and the sum of other ions (Cl−, Na+, K+, Mg2+, and Ca2+). Table 3 extracts the values shown in Figure 3, for the years 2012, 2015, and 2018.
These results show that sulfate is the most common PM2.5 component at AAQMS and RsAQMS, followed by OC and ammonium. The total concentration of the main components of PM2.5 has decreased by approximately 25%, from 2012 to 2018. The component with the largest reduction in concentration was EC, with a 43% reduction at AAQMS, and a 50% reduction at RsAQMS. Nitrate is reduced by 39% at AAQMS and 46% at RsAQMS. The concentrations of sulfate and ammonium are also generally reduced by about 30%. On the other hand, the concentration of OC does not change significantly compared to the other components, as pointed out by Yamagami et al. (2021) [15]. Since OC is emitted directly from anthropogenic sources, as well as secondary generation from VOCs, it is suggested that OC source control and VOC control are important for further reduction in OC concentrations, and also for the reduction in PM2.5 concentrations.
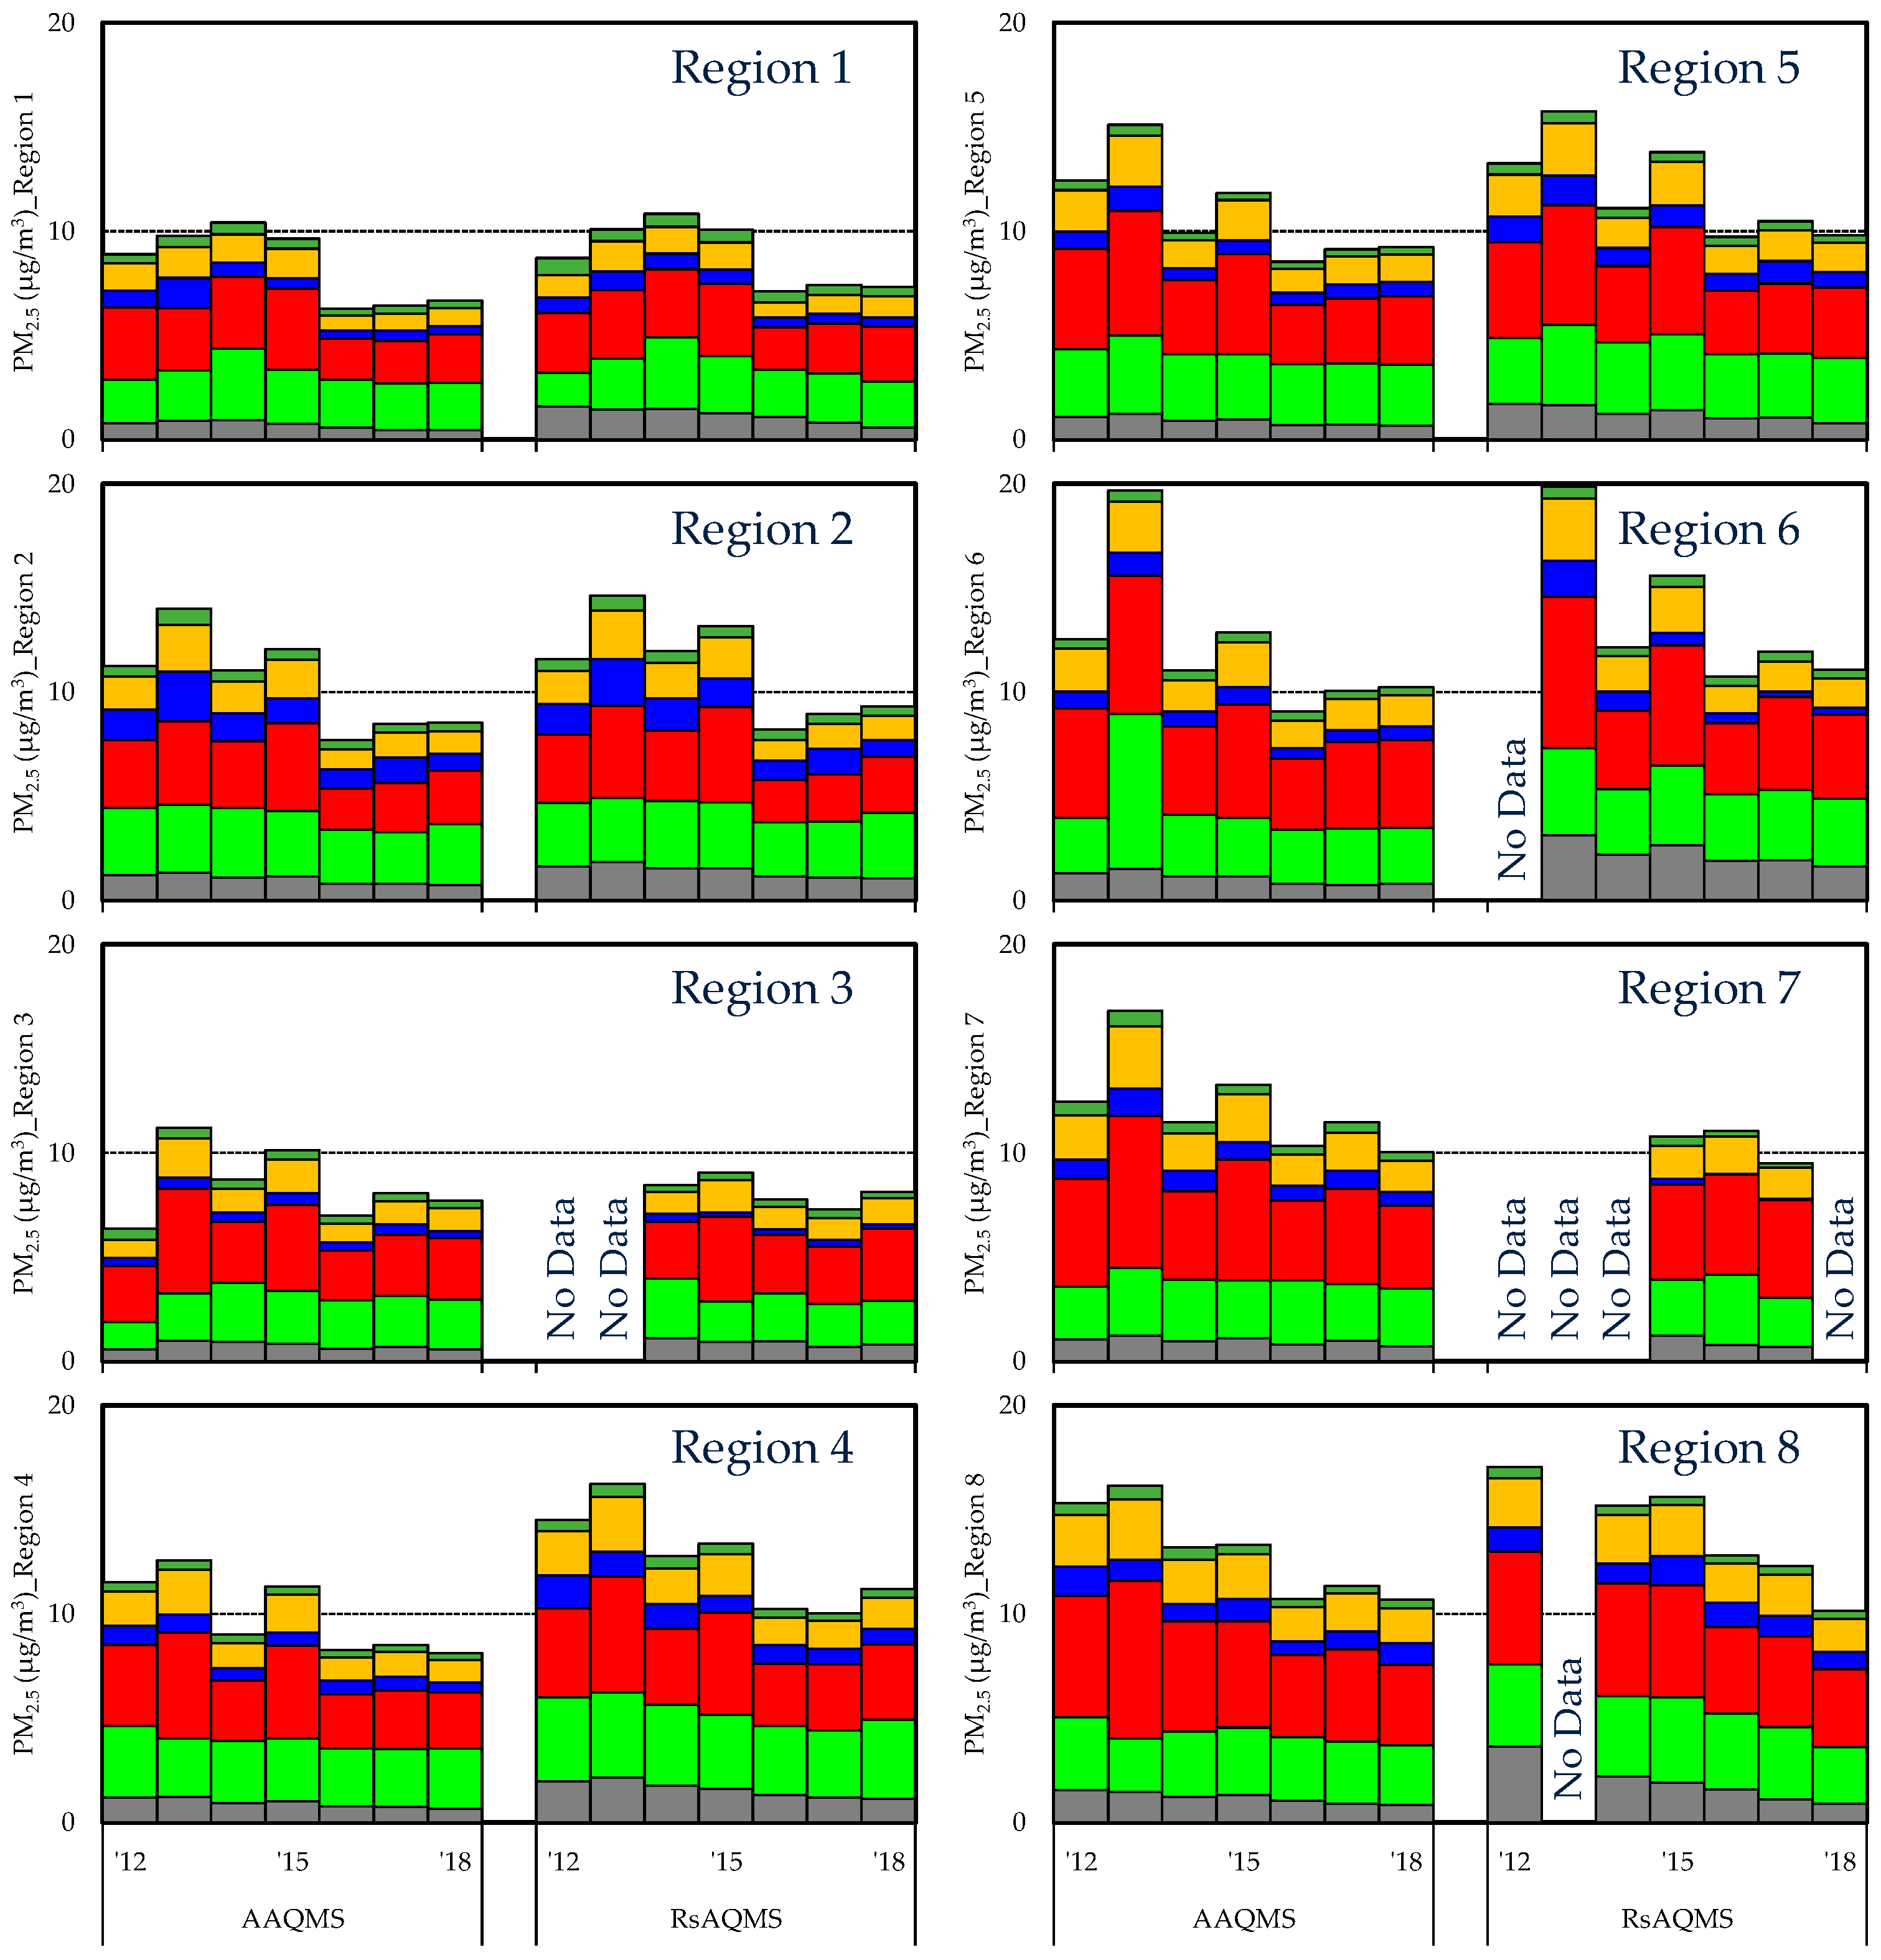
Figure 4 shows the trends of the average concentrations of major components in PM2.5, from 2012 to 2018, at the AAQMS and RsAQMS by region. In terms of PM2.5 concentrations by region, region 2 has a higher ratio of nitrate than other regions, and region 8 has a higher ratio of sulfate. It was also found that the characteristics outlined in Figure 3 were generally applicable to all the regions.
Table 4 shows the mean concentrations of SPMs at the AAQMS and RsAQMS, for the nation and each region in 1990, 2000, 2010, and 2018, and the concentration ratios for 2018 relative to 1990.
The national average SPM concentrations of 37 µg/m3 (AAQMS) and 50 µg/m3 (RsAQMS) in 1990, were 17 µg/m3 for both AAQMS and RsAQMS in 2018. During this period, the SPM concentrations of AAQMS and RsAQMS were reduced by 55% and 65%, respectively, and the concentrations of AAQMS and RsAQMS were almost the same (0–1 µg/m3 difference). In all the regions, the reduction rate of RsAQMS is larger than that of AAQMS, especially in region 2 (0.30), region 4 (0.36), and region 5 (0.34). These regions include major metropolitan areas, and regulations were introduced in the areas in 2003, to prohibit diesel vehicles that were registered under old regulations from entering these areas, which may have led to the improvement in air quality.
We focus on the difference in concentration between RsAQMS and AAQMS for PM2.5 mass, and component concentration and SPM concentration. As shown in Table 2, the difference in concentration between RsAQMS and AAQMS, for PM2.5 mass concentration, is approximately 0.8 μg/m3. As shown in Table 3, the difference in concentration between RsAQMS and AAQMS, in PM2.5 component concentration, was also about 0.8 μg/m3. As for SPM, the difference in concentration between RsAQMS and AAQMS was 1 µg/m3, which is almost the same amount as that of PM2.5. These results indicate that the difference in the concentration of particulate matter between the RsAQMS and the AAQMS is approximately 1 µg/m3, which can mainly be explained by the difference in the concentration of the major components of PM2.5, although they do not match exactly because of the differences in locations, measurement periods, and measurement methods.
With the decline in PM emissions from automobile tailpipes, the relative increase in emissions of non-exhaust particles, such as brakes, tires, and re-suspended dust, has been noted, and the need for countermeasures against these particles has been discussed [16]. According to these reports, future estimates, using emission inventories, show that the share of non-exhaust particles in vehicle emissions will reach up to 94% (PM10) and 90% (PM2.5) in 2030. The component of these non-exhaust particles may be metallic elements, such as barium (Ba), copper (Cu), iron (Fe), and zinc (Zn) [17], and soil-derived components (aluminum (Al), calcium (Ca), Fe, and magnesium (Mg)) [18].
From the results of the analysis of PM2.5 component concentrations above, it is suggested that the influence of non-exhaust particles on RsAQMS is limited, because the difference in concentrations between RsAQMS and AAQMS can be explained by the major PM2.5 components, which include little non-exhaust particles. Therefore, the current emission inventories may overestimate the effect of non-exhaust particles. It may be necessary to review these inventories, as well as to understand the actual situation. The density of non-exhaust particles is considered to be higher than that of other PM2.5 components, because they contain more metal components. Therefore, it is important to understand the actual situation in roadside environments, because non-exhaust particles that are emitted from the source may be deposited near the roadside and may not be transported over long distances.
3.1.2. Ozone and Related Substances (Nitrogen Oxides, Non-Methane Hydrocarbons)
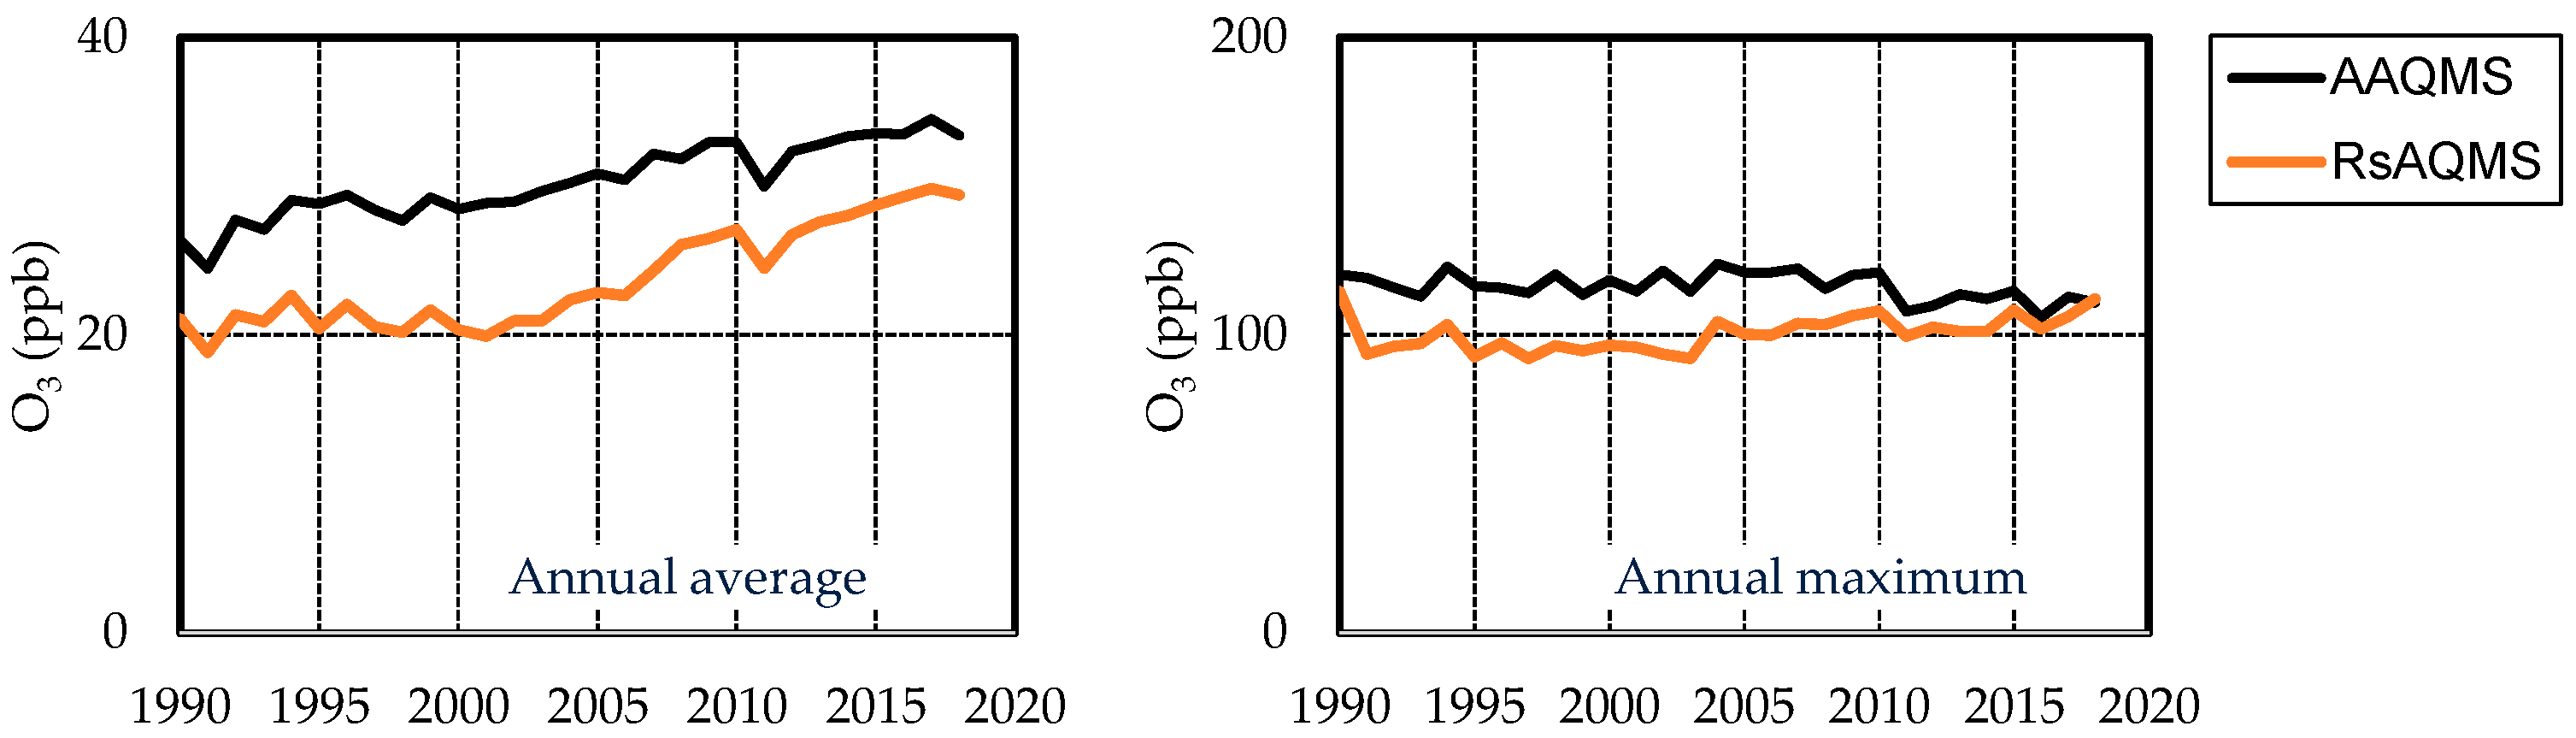
Figure 5 shows the secular changes in the annual mean one-hour daytime concentrations and annual maximum concentrations of ozone at the national AAQMS and RsAQMS, for the years 1990–2018. Figures S4-1 and S4-2 also shows the secular changes of the annual mean and maximum concentrations at regional AAQMS and RsAQMS. Tables S4-1 and S4-2 extract the annual mean and maximum ozone concentrations, averaged for the three years 1990–1992 and 2016–2018, at the AAQMS. Daytime is defined as 5:00 to 20:00. These results show that the annual average ozone concentrations at AAQMS show a trend of increasing over time, regardless of the region. The ozone concentrations at RsAQMS are generally lower than those at AAQMS, in all the regions, which is due to the titration effect of nitric oxide, emitted mainly from automobiles. The average concentration at RsAQMS fluctuates greatly, which is due to the fact that the number of RsAQMS is small and the measuring stations are being discontinued. Therefore, RsAQMS are not included in Tables S4-1 and S4-2. The rate of increase in the concentration in region 7 (1.40) and region 8 (1.37) is the largest, followed by regions 2, 4, and 5, which are metropolitan areas. On the other hand, the annual maximum concentrations have remained almost constant over the years. As shown in Tables S4-1 and S4-2, the concentrations in regions 2, 4, and 5, which are metropolitan areas, tend to decrease slightly over time.
These results indicate that the average concentrations of ozone increased over time, in all the regions of Japan. However, the highest ozone concentrations in the metropolitan areas (regions 2, 4, and 5) decreased over time, unlike the other regions, suggesting the effect of the reduction in precursors in the metropolitan areas. In regions 7 and 8, both the mean and maximum concentrations increased significantly, suggesting the influence of transboundary transport from the continent. The difference in the direction of increase and decrease in the concentrations over time, between the average and maximum ozone concentrations, indicates the importance of setting an averaged time when evaluating the ozone concentration.
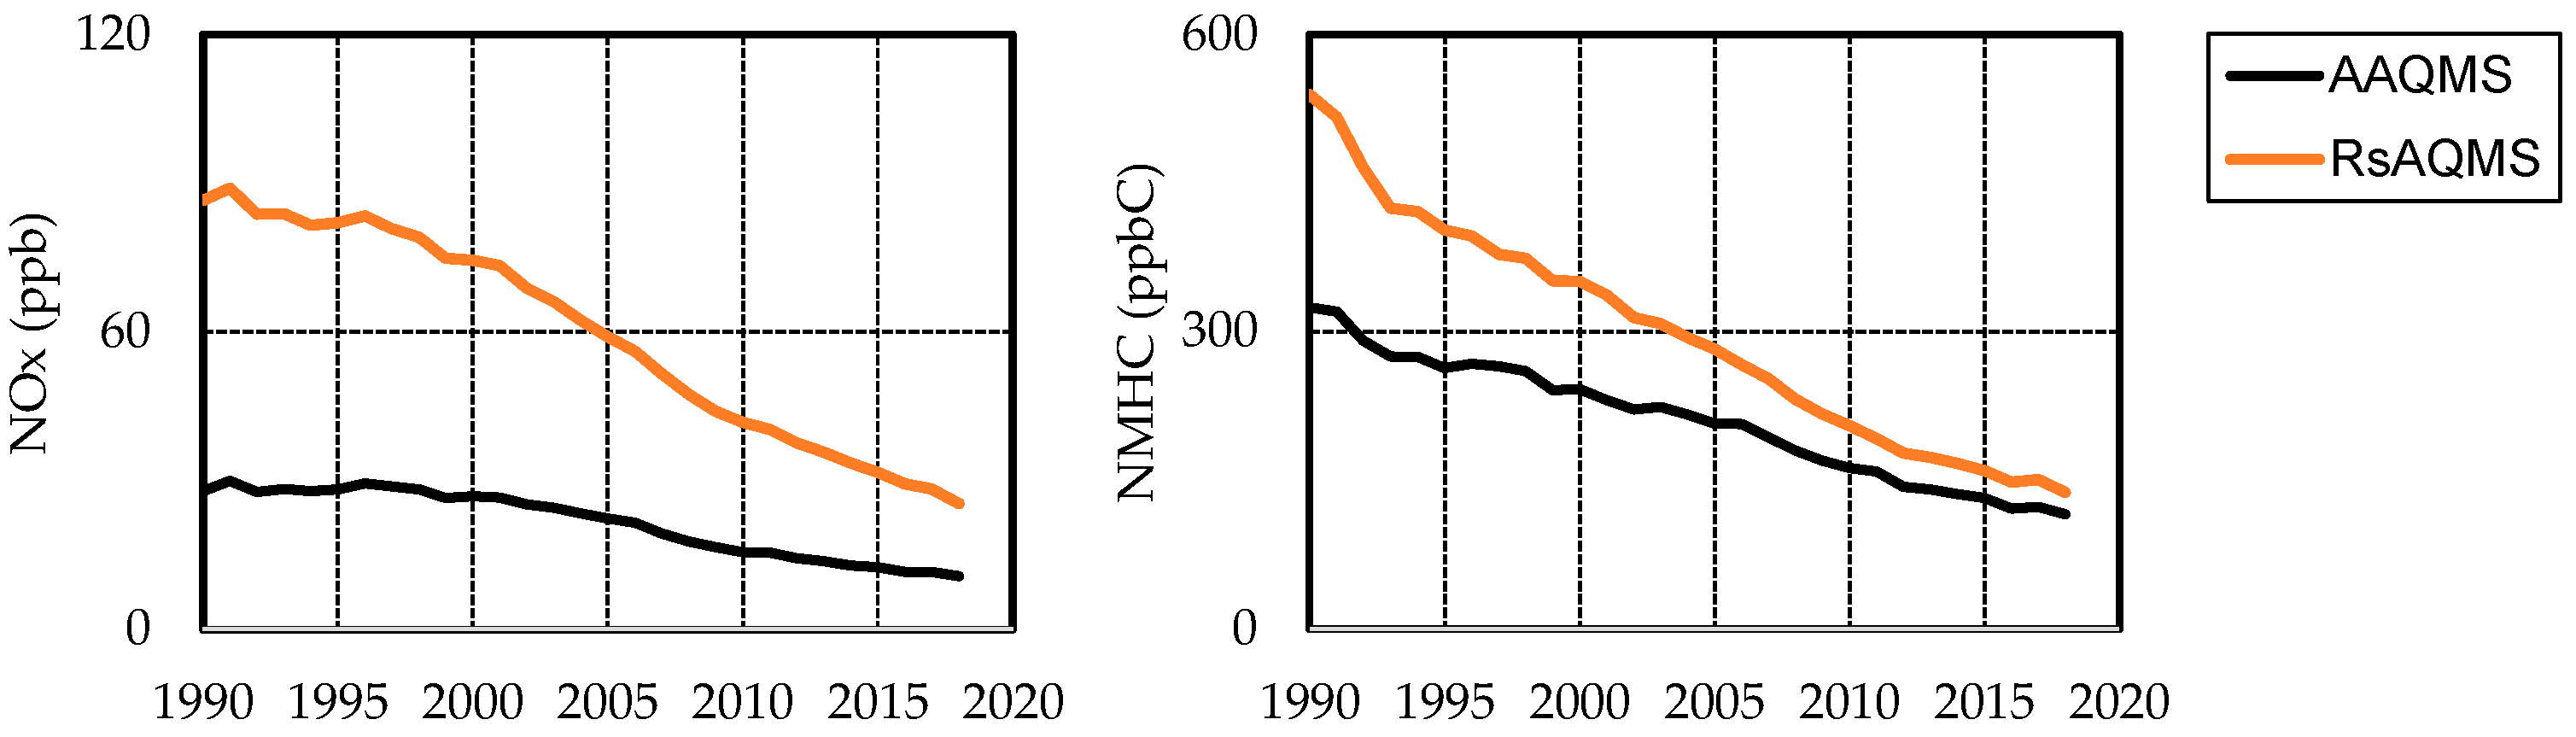
Figure 6 shows the secular changes of the annual mean NOx and NMHC concentrations at the national AAQMS and RsAQMS, from 1990 to 2018. Figures S4-3 and S4-4 also show the secular changes of the annual mean NOx and NMHC concentrations at regional AAQMS and RsAQMS. Tables S4-3 and S4-4 extract the annual mean NOx and NMHC concentrations in 1990, 2000, 2010, and 2018. The NOx concentrations decreased significantly in all the regions, between 1990 and 2018, with a 62% decrease at the AAQMS (55% to 65% by region) and a 71% decrease at the RsAQMS (67% to 76% by region) in 2018 compared to 1990. The NMHC concentrations decreased significantly in all the regions, from 1990 to 2018, with a 64% decrease at the AAQMS (55% to 68% by region) and a 74% decrease at the RsAQMS (64% to 76% by region) in 2018 compared to 1990. Although both the NOx and NMHC concentrations have decreased significantly, the O3 concentration has not been reduced, which is an issue for the future.
3.1.3. Other Pollutants (SO2, CO)
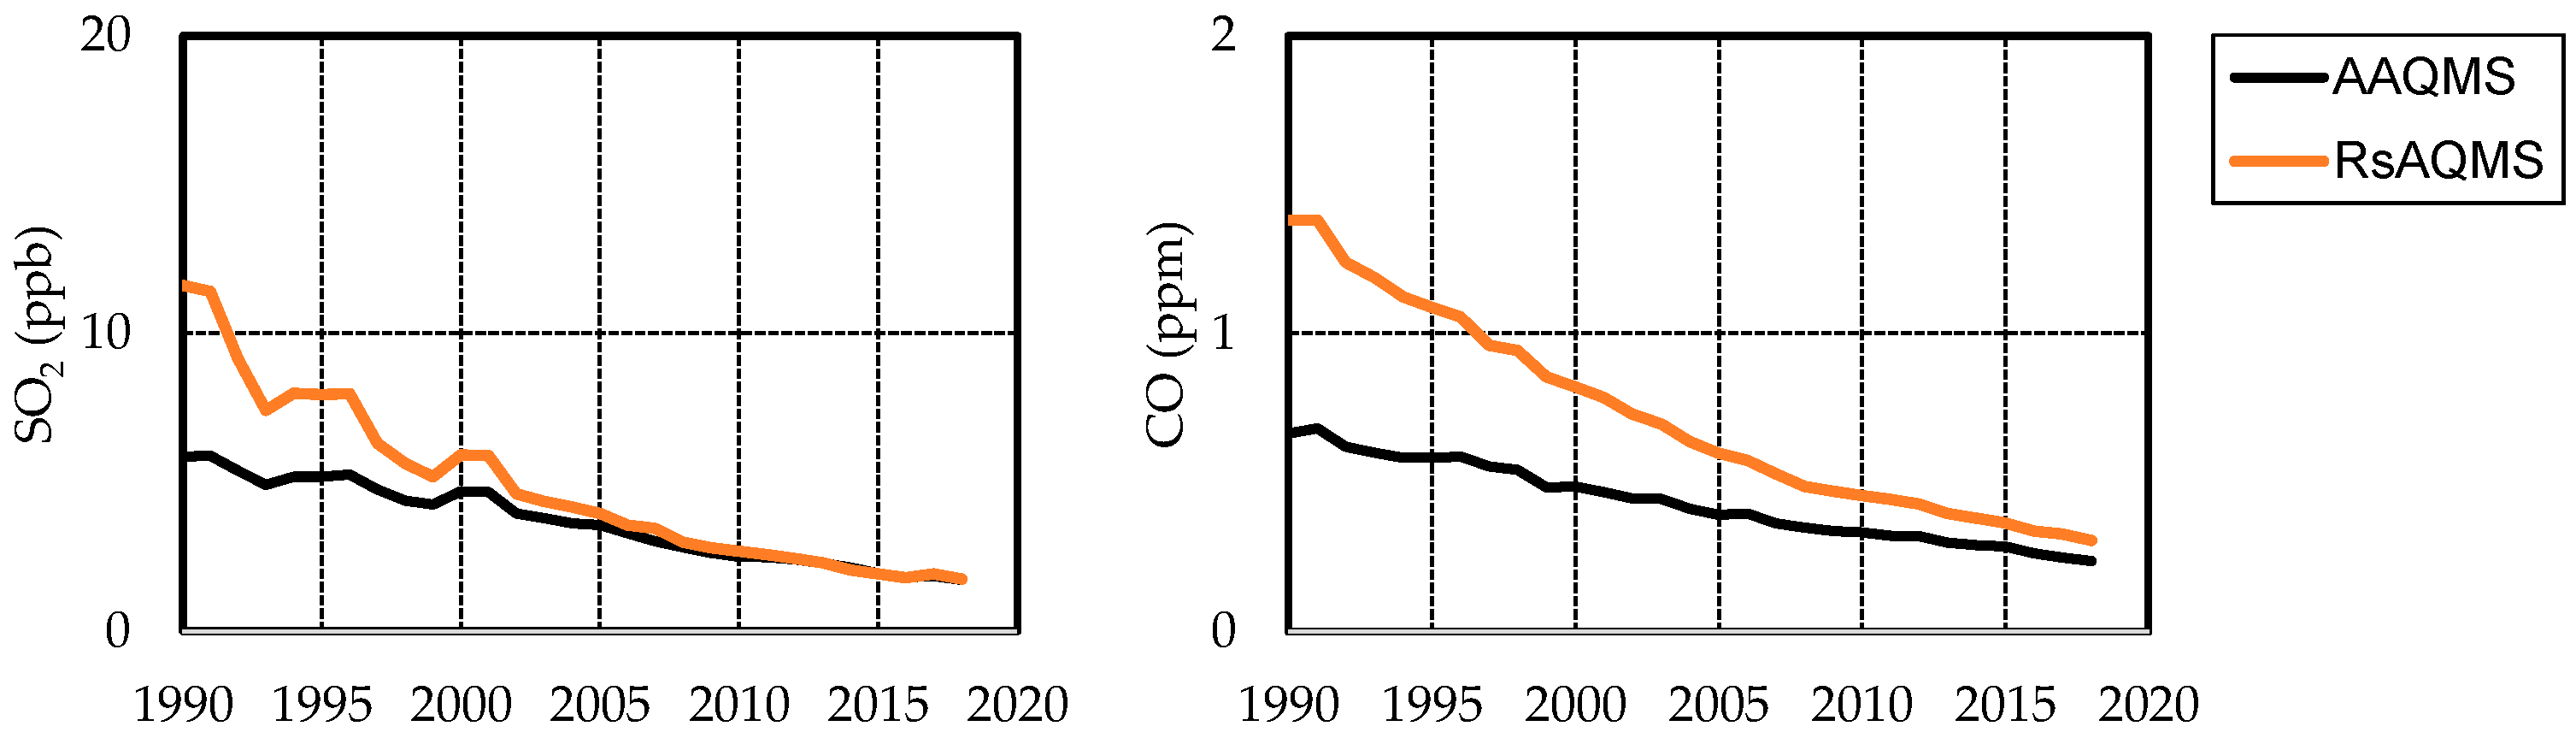
Figure 7 shows the secular changes of the annual mean SO2 and CO concentrations at the national AAQMS and RsAQMS, from 1990 to 2018. Figure S4-5 also shows the secular changes of the annual mean SO2 and CO concentrations at regional AAQMS and RsAQMS. Table S4-5 shows the SO2 concentrations in 1990, 2000, 2010, and 2018. The SO2 concentrations decreased significantly in all the regions, between 1990 and 2018, with a 71% decrease at the AAQMS (59% to 85% by region) and an 85% decrease at the RsAQMS (60% to 91% by region) in 2018 compared to 1990. In the case of the RsAQMS, the SO2 concentration was clearly higher in 1990 than at those of the AAQMS. However, in the 2000s, the difference in concentrations between RsAQMS and AAQMS almost disappeared, although there were some regional differences. In Japan, the distribution of sulfur-free diesel fuel and sulfur-free gasoline started in 2005, and the reduction in SO2 concentration is considered to be largely due to this effect.
CO emissions from automobiles (especially gasoline vehicles) are relatively high, but the use of three-way catalysts and advanced combustion control in recent vehicles has resulted in lower emissions and lower concentrations.
3.2. Intercomparison of Anthropogenic Emission Data and Air Quality
Figure 8 shows plots of domestic anthropogenic emission data and annual average concentrations at the AAQMS, for SO2, NOx, and PM. Here, the emission data, up to FY 2010, are from Kannari et al. [6], and the data after FY 2010 are updated using the aggregated values from an emission intensity survey and MAP survey. This figure shows that the actual atmospheric concentrations of SO2 and NOx have been decreasing along with the decrease in anthropogenic emissions. On the other hand, for PM, although anthropogenic emissions have decreased, the atmospheric concentration has not decreased as much. In addition to the primary particles that are emitted directly from the source, the contribution of secondary particles, which are formed when gaseous materials are converted into particles, by chemical reactions in the atmosphere, is also significant. Therefore, the difference in the trends of emissions and atmospheric concentrations can be attributed mainly to the contribution of secondary particles.
From these results, it was confirmed that measures to control the emissions of anthropogenic air pollutants are directly related to the reduction in atmospheric concentrations. However, the trend of decreasing PM emissions and atmospheric concentration is not consistent, which may be due to the influence of secondary particles. Therefore, it is necessary to reduce the emission of precursors of secondary particles, in order to further decrease the PM concentration. The amount of reduction in OC over time is smaller than that of other components of PM2.5 shown in Table 3. This suggests that the reduction in VOCs, which are precursors of secondary particles of OCs, is particularly necessary for the reduction in PM concentrations.
3.3. Air Quality Issues in Japan after 2019
Although the analysis results of air pollution concentration data up to 2018 were presented above, various air pollution episodes have occurred in Japan since 2019. Here, we summarize the case of the widespread high ozone concentrations that occurred in May 2019, and the widespread high PM2.5 concentrations that were associated with a volcanic eruption in August 2020. In addition, there have been changes in economic activities from March 2020 to the present (summer of 2021), due to various restrictions aimed at preventing the spread of COVID-19, which have resulted in improved air quality. This air quality improvement was evaluated using monthly average concentrations from 2016 to 2020.
3.3.1. Widespread High Concentrations of Ozone (May 2019)
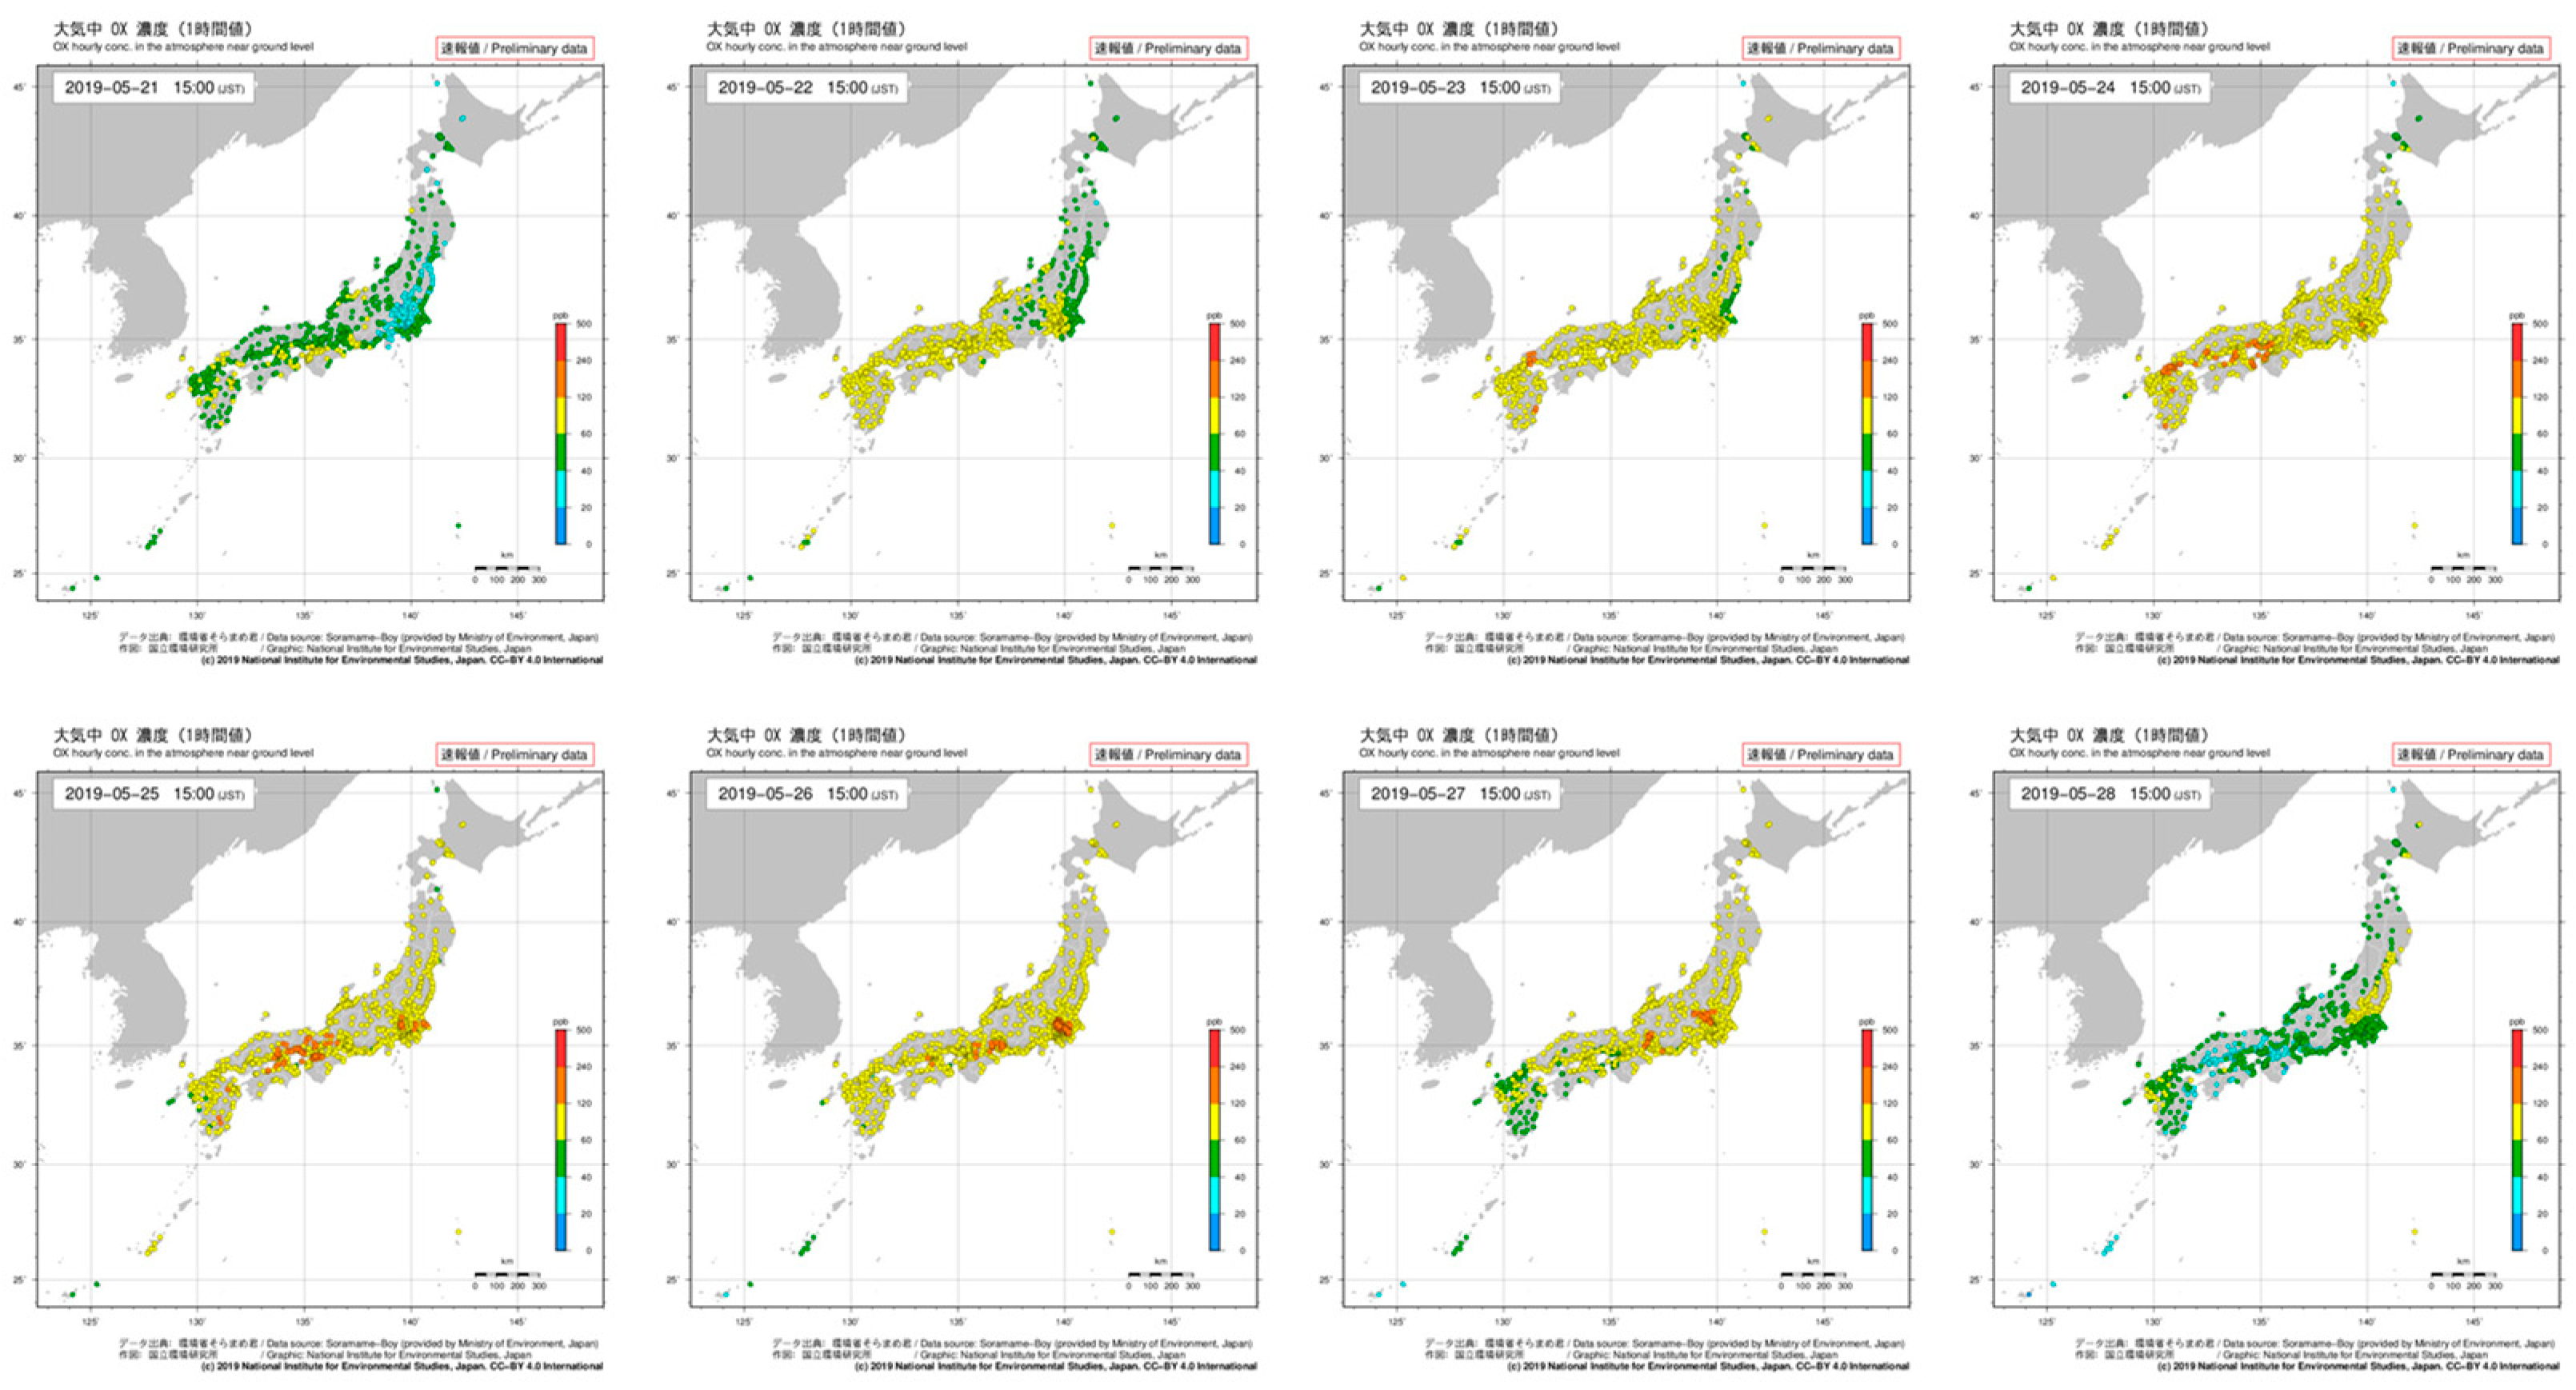
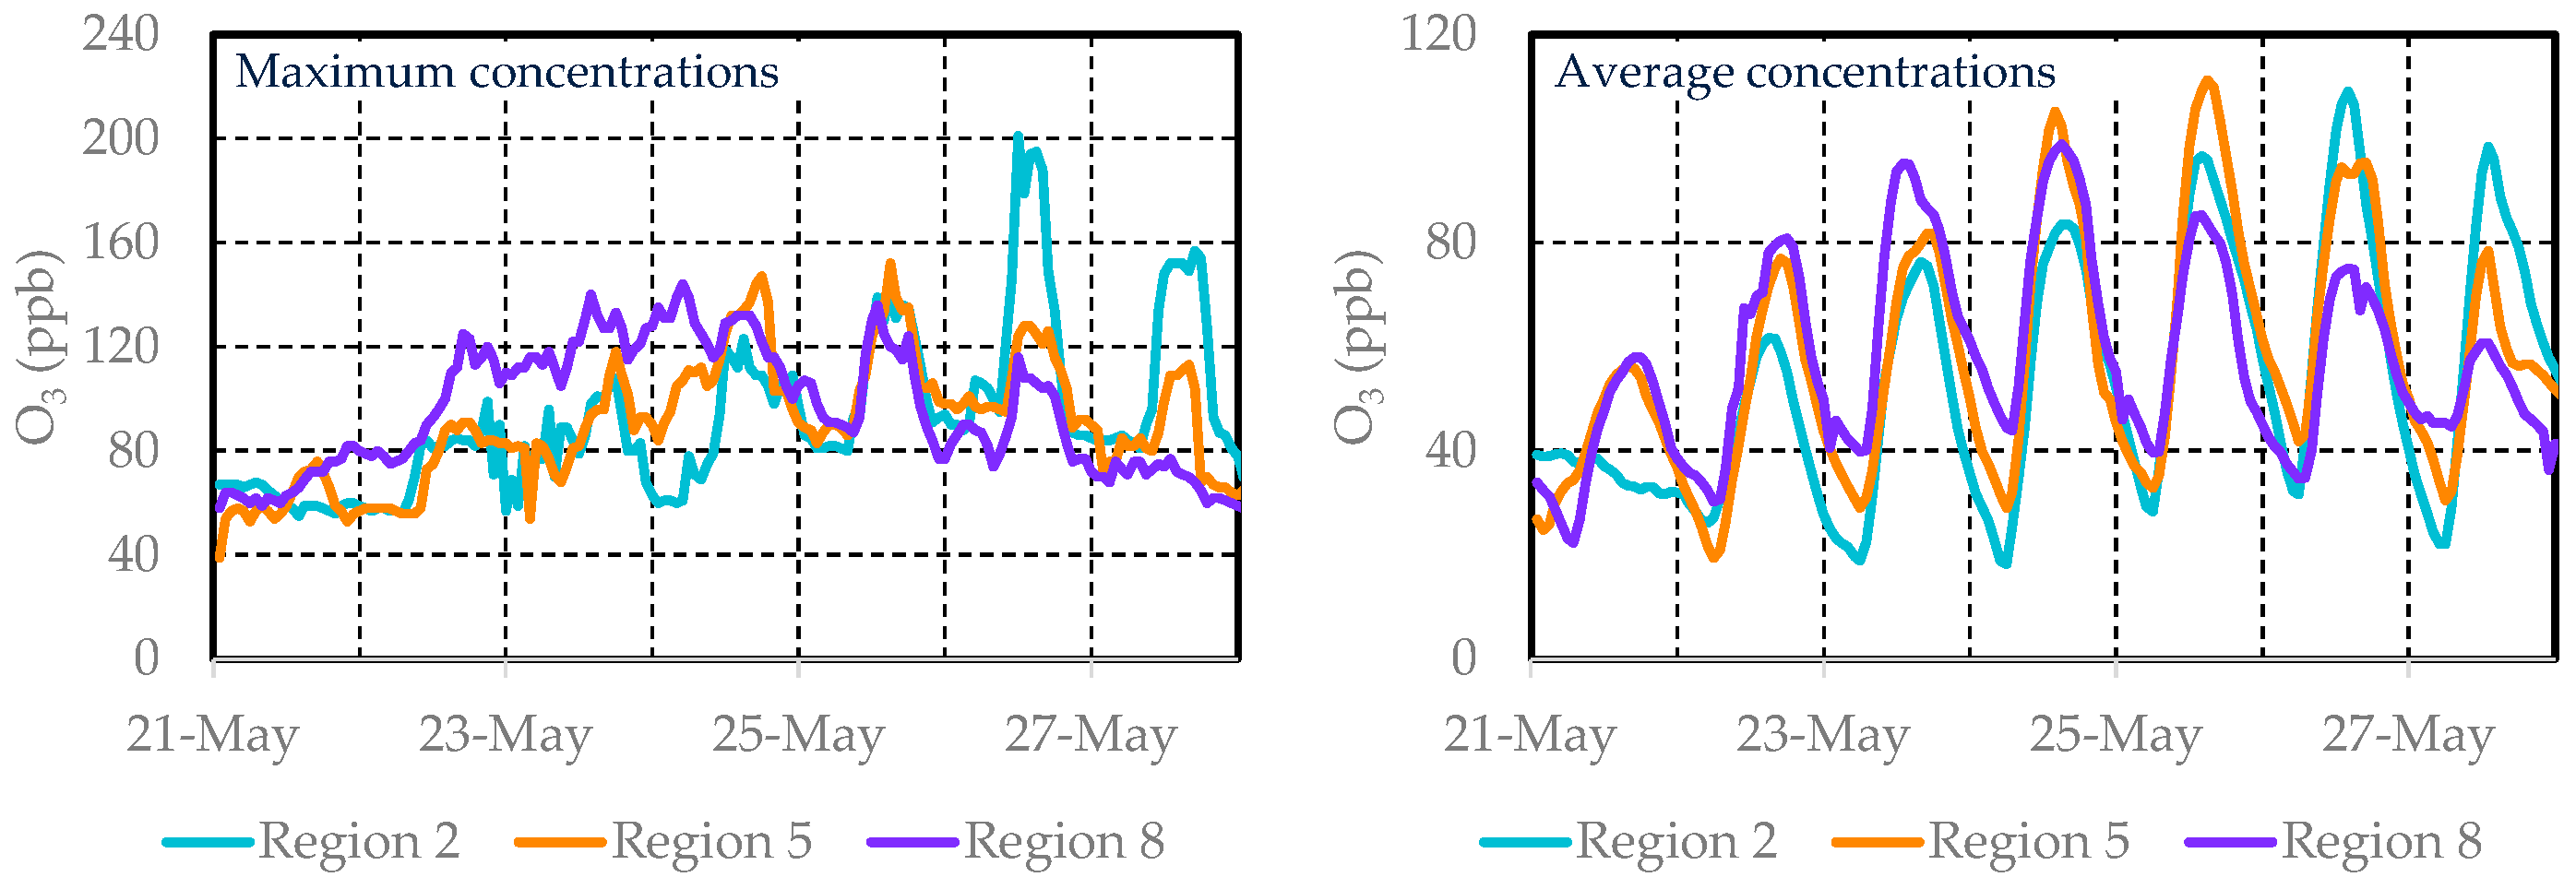
High ozone concentrations were observed over a wide area in Japan in May 2019 [19]. Figure 9 shows the observed ozone concentration at 15:00 from May 21 to May 28, 2019 [20]. The high ozone concentrations appeared in a belt-like pattern in regions 5 to 8 on May 24, and high concentrations were observed mainly in region 5 on May 25. On May 26 to 27, the high-concentration area moved to region 2. The weather conditions during this period were as follows: from May 23, the weather was clear nationwide, and the maximum daytime temperature exceeded 30 °C in many places, until May 26; on May 27, rain began to fall, starting from the west of Japan; and on May 28, the weather was rainy nationwide. Figure 10 shows the time series of the maximum and average ozone concentrations in AAQMS in regions 2, 5, and 8, from May 21 to May 28. The number of AAQMS included in each region for these dates is 303, 161, and 157, respectively. The maximum and average ozone concentrations in the regions show that the high concentrations start from the west (region 8) and then move to the east (region 5 and region 2). The pattern of high concentrations in region 8 at first, followed by high concentrations in region 5 and region 2, was observed in both the maximum and average ozone concentrations, indicating that this high-concentration phenomenon occurs over a wide area and is not a localized high concentration. The highest maximum ozone concentration among the three regions was found in region 2, with a concentration of about 200 ppb, suggesting that local sources in region 2 have a significant influence on high ozone concentrations, since region 2 is the most leeward of the three regions. Kubo et al. also conducted an analysis of the same high concentration episode, using observations and an air quality model [21]. They suggest that the conditions were favorable for high ozone concentrations, due to clear skies and higher temperatures, and that a migrating anticyclone brought ozone and precursors with it as it moved eastward. Therefore, monitoring and countermeasures (international cooperation and domestic countermeasures) are necessary in the future.
3.3.2. Transport of Sulfuric Acid Particles Due to a Volcanic Eruption (August 2020)
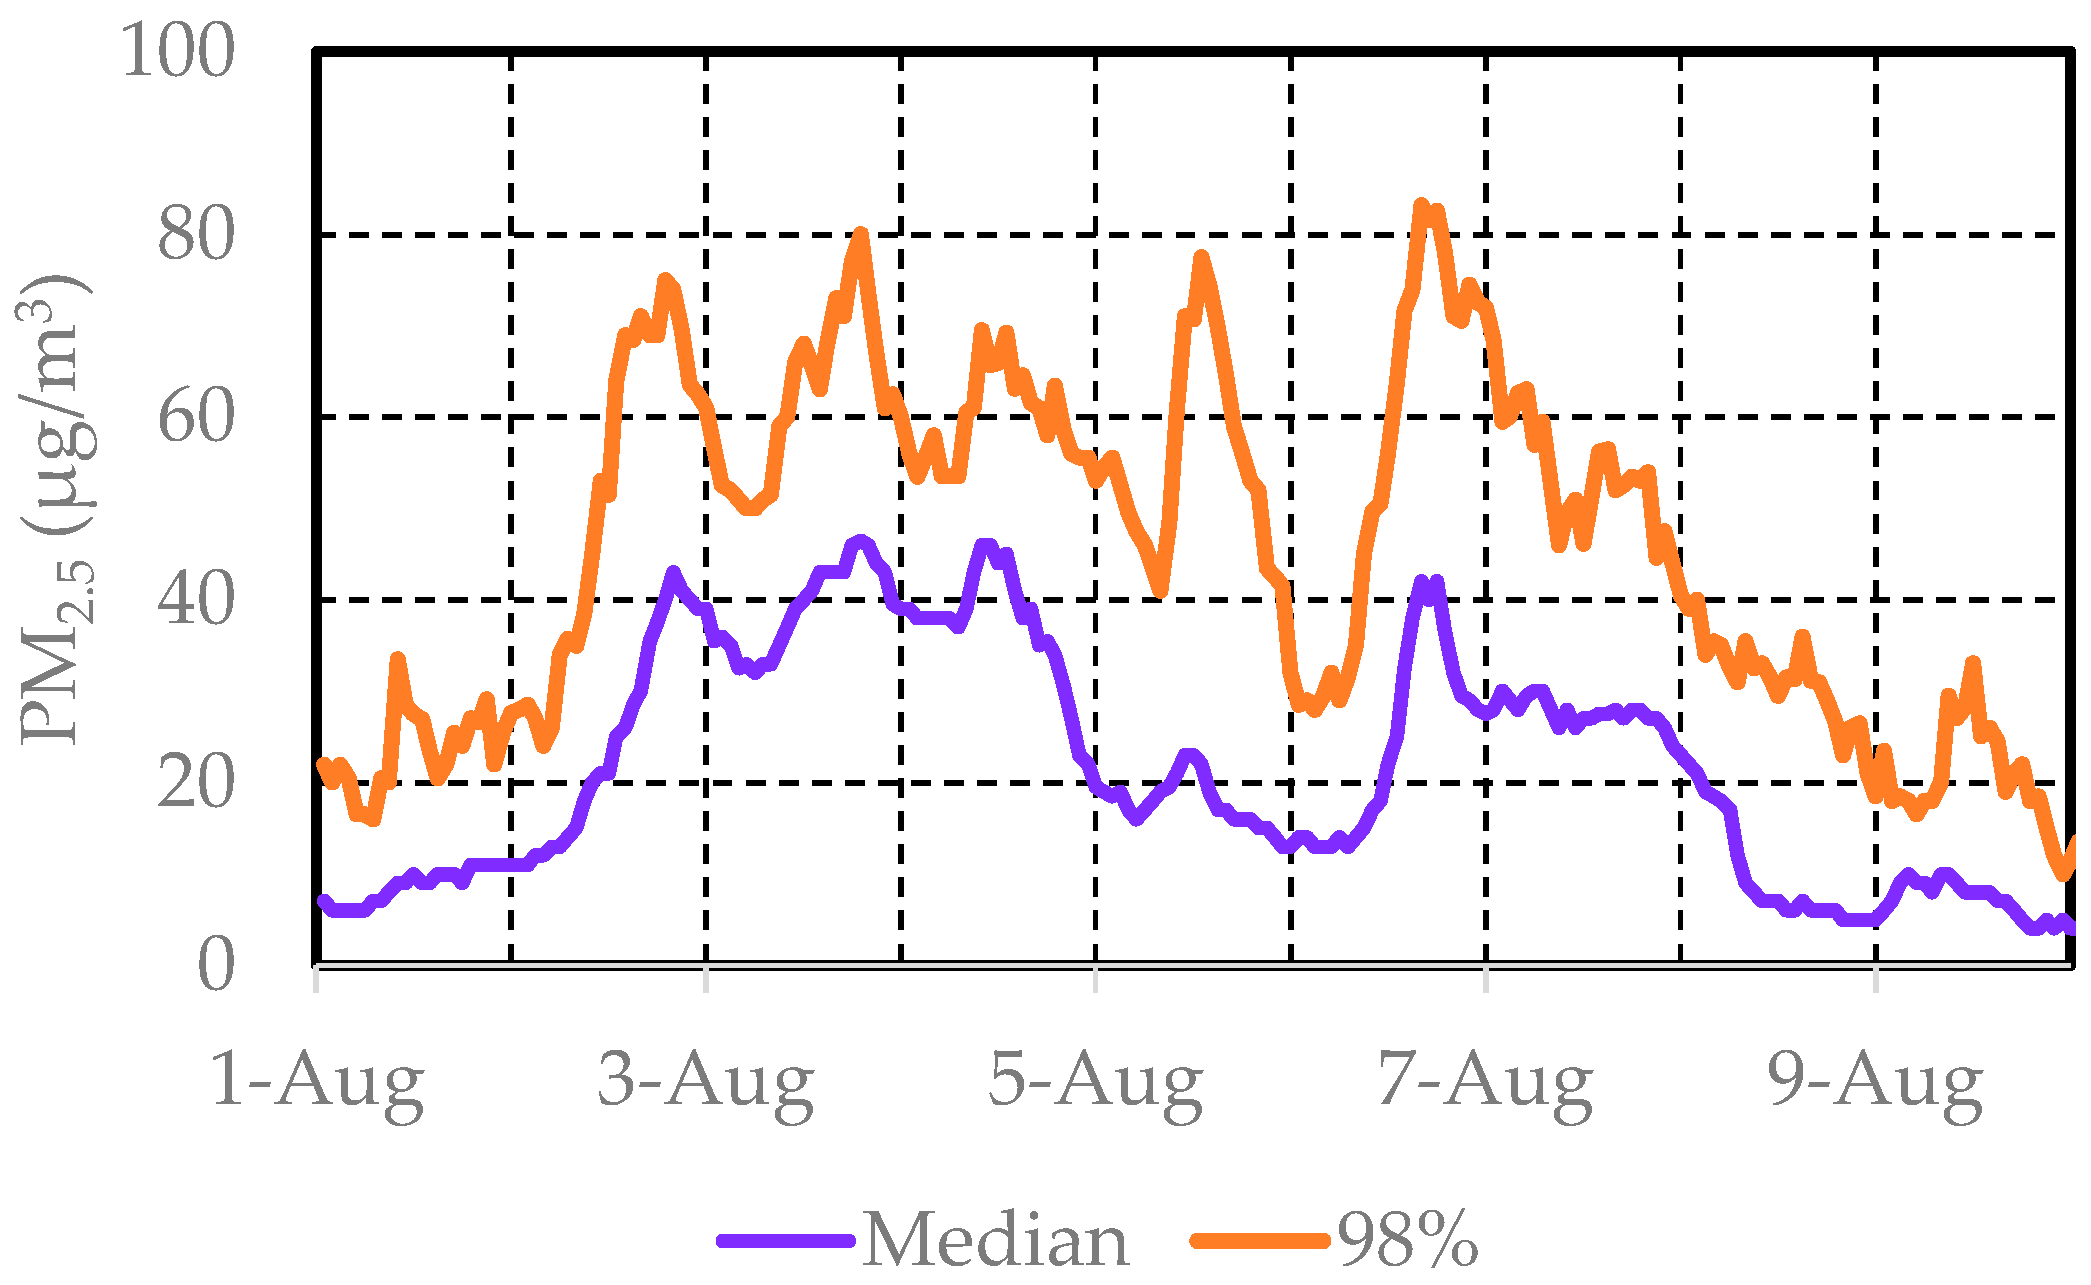
Nishinoshima Island (27.2° N, 140.9° E) is a volcanic island that is located approximately 800 km south of the Japanese archipelago. The island has been erupting intermittently and a large-scale eruption occurred in July 2020. Normally, volcanic ash and volcanic gases that are emitted from Nishinoshima are mostly transported to the east side of the Japanese archipelago. However, in August 2020, the emitted volcanic ash and gases reached the northern part of region 8, on a westward airflow, and widespread high PM2.5 concentrations were observed. Figure 11 shows the distribution of PM2.5 concentrations at 18:00 on 2 August through to 4 August 2020. Figure 12 shows the time series of the median PM2.5 concentration and the 98% concentration in region 8, from 1 August to 10 August 2020. From this figure, it can be observed that, from August 2 to 6, an air mass of about 40 μg/m3 on average and about 80 μg/m3, at a 98% concentration, reached region 8. Nakayama et al. [22] suggest that both the volcanic ash itself and the secondary-produced particles originating from the volcanic gases, contributed to the increase in PM2.5 concentration during this episode.
3.3.3. Air Impact of Measures to Prevent the Spread of COVID19 (March 2020)
The first outbreak of the novel coronavirus (COVID-19) was reported in December 2019, and as the virus subsequently spread to Europe, the United States, and other regions, measures were taken to prevent a pandemic, including urban lockdowns, and other measures to control human movement and economic activity. As a result of travel restrictions and a reduction in economic activity, many cities reported a general improvement in the concentrations of PM2.5, NO2, and SO2 in their air quality during this period [23]. However, during this time, ozone is reported to have increased.
In Japan, a state of emergency was declared from 7 April to 25 May 2020. Under the emergency, people were requested to refrain from going out, but no lockdown was enforced.
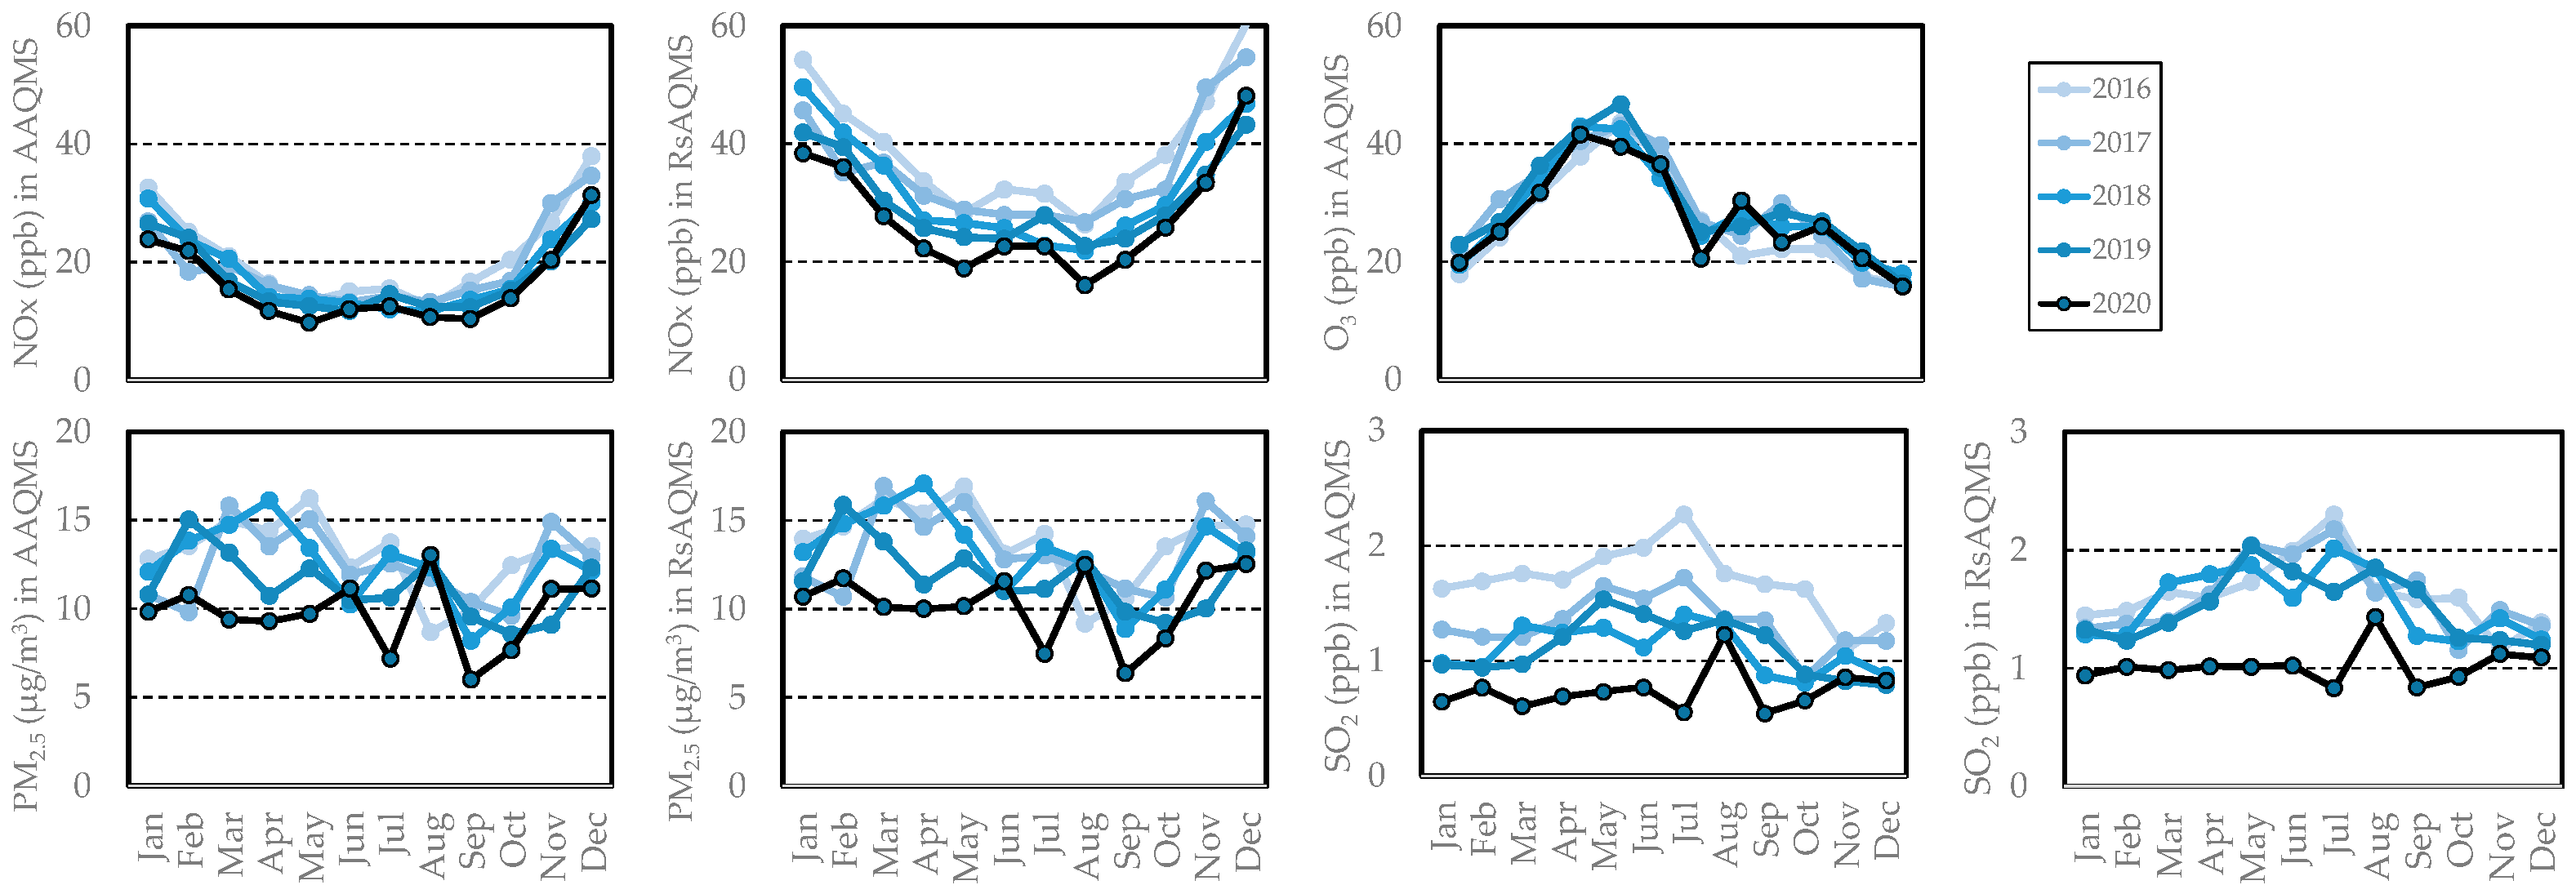
Figure 13 shows the monthly averages of NOx, O3, PM2.5, and SO2 concentrations at the AAQMS and RsAQMS in Tokyo, from 2016 to 2020. Note that the ozone concentrations at the RsAQMS in Tokyo have not been measured, so the ozone concentrations at the RsAQMS are not shown in Figure 13.
NOx concentrations have been decreasing over time, especially at the RsAQMS, indicating that a reduction in vehicle emissions has resulted in a decrease in NOx concentrations. NOx concentrations in 2020 were the lowest in those five years, especially in April and May, under the declaration of the state of emergency. This indicates that the reduction in vehicle emissions over time and the temporary decrease in vehicle activity, resulted in lower NOx concentrations in April and May of 2020. Similarly, for PM2.5, the concentrations are lower from March to May 2020. Since there is almost no difference in the concentrations between AAQMS and RsAQMS, it is considered that the lower concentrations are due to a decrease in vehicle emissions and stationary sources emissions, caused by the overall decline in economic activity. As for O3 concentrations, although there are reports of increased concentrations, due to the effects of lockdown in other countries, there does not seem to be any significant change from previous years, in April and May, under the declaration of the state of emergency in Tokyo. This might be due to differences in the concentrations and/or concentration ratios of precursors between Japan and other countries. Further detailed analysis may help us to find effective measures to reduce the ozone concentration, which is difficult to reduce.
As for SO2 concentrations, the concentrations of both AAQMS and RsAQMS have decreased in all months of 2020, regardless of the date of the emergency declaration. In January 2020, the International Maritime Organization (IMO) introduced a regulation on marine fuels (lower sulfur), and this regulation is thought to have reduced SO2 concentrations in the atmosphere.
4. Conclusions
This paper shows the trends and causes of air pollution in Japan over the past 30 years, since the 1990s, focusing mainly on PM2.5, ozone, and related substances, as typical substances that do not comply with air quality standards.
The concentration of PM2.5 has been decreasing over time in China, Korea, and Japan. In terms of the components of PM2.5, the component with the largest decrease rate between 2012 and 2018 is elemental carbon (EC), while the decrease rate of organic carbon (OC) is small. Since OC accounts for a large percentage of PM2.5, OC source control and VOC control, which are precursors of secondary particles of OCs, are important for further reduction in OC concentrations. The analysis of PM2.5 mass concentration, the concentration of the major components of PM2.5, and SPM concentration, focused on the concentration difference between RsAQMS and AAQMS, and the results showed that the concentration differences were all about the same amount, approximately 1 µg/m3. It is suggested that the influence of non-exhaust particles on RsAQMS is limited, because the difference in concentrations between RsAQMS and AAQMS can be explained by the major PM2.5 components, which include little non-exhaust particles. Therefore, further research is needed to understand the accuracy of the current emission inventories and the behavior of non-exhaust particles in roadside air.
For NOx and SO2, there is a relationship between domestic anthropogenic emissions and annual average atmospheric concentrations, indicating that anthropogenic emission control measures are directly effective in the reduction in concentrations. The reduction in NOx may be the result of stricter vehicle emission regulations, and the reduction in SO2 may be the result of the widespread use of low-sulfur fuels. The trend of a decrease in PM emission and atmospheric concentration did not necessarily coincide, due to secondary particles, suggesting that especially VOC emissions as precursors need to be reduced.
Air pollution episodes since 2019, including large-scale transboundary transport and the effects of volcanic eruptions, are summarized. Such high-concentration episodes may occur in the future. Due to the effect of reduced economic activity, as a consequence of COVID-19, the concentrations of NOx and PM2.5 decreased, due to the decrease in emissions under the state of emergency declaration, but the concentration of ozone did not increase, unlike other countries. Further detailed analysis of the differences between Japan and other countries may help us to find effective measures to reduce the ozone concentration. The concentration of SO2 decreased significantly in 2020, regardless of whether the state of emergency was declared or not, due to the effect of the reduction in emissions, caused by the introduction of regulations on marine fuels.
Recently, there has been an acceleration of efforts by countries to reduce carbon dioxide (CO2) emissions and “carbon neutral”. Since air pollutants are often emitted together with CO2 from combustion, carbon neutral efforts may have a positive effect on air pollutants, and, in some cases, a negative effect. It is necessary to continue to monitor this issue, to ensure that there are positive effects on both carbon neutral and air pollutants.
Supplementary Materials
The following are available online at https://0-www-mdpi-com.brum.beds.ac.uk/article/10.3390/atmos12081072/s1, Table S1-1: Limit values and notification dates of air quality standards in Japan and the number of stations complying with the standards in 2018, Table S1-2: Comparison of air quality standards (particulate matter and gaseous component) among Japan, the United States, Europe, and WHO guidelines, Figure S1: Conversion of air quality standards for O3 (left figure) and NO2 (right figure) (horizontal axis: Japanese air quality standards, vertical axis: European and U. S. air quality standards and WHO air quality guidelines), Figure S2: Photographs of an ambient air quality monitoring station (AAQMS) and a roadside air quality monitoring station (RsAQMS), Figure S3: Annual average PM2.5 concentration in cities in South Korea and China, Figure S4-1:Annual average of 1-hour daytime ozone concentrations at the AAQMS and RsAQMS of the nation and each region from 1990 to 2018, Table S4-1: Annual average of 1-hour daytime ozone concentrations at the AAQMS for 1990–1992 and 2016–2018, averaged by region, and their ratios, Figure S4-2: Annual maximum 1-hour daytime ozone concentrations at the AAQMS and RsAQMS averaged by region from 1990 to 2018, Table S4-2: Annual maximum daytime 1-hour ozone concentrations at the AAQMS for 1990–1992 and 2016–2018, averaged by region, and their ratios, Figure S4-3: Annual average NOx concentrations at the AAQMS and RsAQMS of the nation and each region from 1990 to 2018, Table S4-3: Annual average NOx concentrations at the AAQMS and RsAQMS of the nation and each region in 1990, 2000, 2010 and 2018, and the ratio of concentrations in 2018 to 1990, Figure S4-4: Annual average NMHC concentrations at the AAQMS and RsAQMS of the nation and each region from 1990 to 2018, Table S4-4: Annual average concentration of NMHC at the AAQMS and RsAQMS of the nation and each region in 1990, 2000, 2010 and 2018, and the ratio of concentrations in 2018 to 1990 and 2010 to 2000, Figure S4-5: Annual average SO2 concentrations at the AAQMS and RsAQMS of the nation and each region from 1990 to 2018, Table S4-5: Annual average concentration of SO2 at the AAQMS and RsAQMS of the nation and each region in 1990, 2000, 2010 and 2018, and the ratio of concentrations in 2018 to 1990.
Author Contributions
Conceptualization, A.I., S.W. and T.M.; methodology, A.I., S.W., T.M. and S.K.; software, A.I.; validation, S.W. and T.M.; formal analysis, A.I., T.M. and S.K.; investigation, A.I., T.M. and S.K.; resources, A.I., S.W., T.M. and S.K.; data curation, A.I. and T.M.; writing—original draft preparation, A.I. and T.M.; writing—review and editing, A.I., S.W., T.M. and S.K.; visualization, A.I. and T.M.; supervision, A.I. and S.W.; project administration, A.I. and S.W. All authors have read and agreed to the published version of the manuscript.
Funding
This research received no external funding.
Institutional Review Board Statement
Not applicable.
Informed Consent Statement
Not applicable.
Data Availability Statement
Not applicable.
Conflicts of Interest
The authors declare no conflict of interest.
References
- World Health Organization. World Health Statistics 2020: Monitoring Health for the SDGs, Sustainable Development Goals. Available online: https://apps.who.int/iris/handle/10665/332070 (accessed on 10 June 2021).
- IPCC. Climate Change 2014: Synthesis Report. Contribution of Working Groups I, II and III to the Fifth Assessment Report of the Intergovernmental Panel on Climate Change; Pachauri, R.K., Meyer, L.A., Eds.; IPCC: Geneva, Switzerland, 2014; 151p. [Google Scholar]
- Feng, Z.; Kobayashi, K.; Li, P.; Xu, Y.; Tang, H.; Guo, A.; Paoletti, E.; Calatayud, V. Impacts of current ozone pollution on wheat yield in China as estimated with observed ozone, meteorology and day of flowering. Atmos. Environ. 2019, 217, 116945. [Google Scholar] [CrossRef]
- Wakamatsu, S.; Morikawa, T.; Ito, A. Air Pollution Trends in Japan between 1970 and 2012 and Impact of Urban Air Pollution Countermeasures. Asian J. Atmos. Environ. 2013, 7, 177–190. [Google Scholar] [CrossRef] [Green Version]
- Dockery, D.W.; Pope, C.A., 3rd; Xu, X.; Spengler, J.D.; Ware, J.H.; Fay, M.E.; Ferris, B.G., Jr.; Speizer, F.E. An association between air pollution and mortality in six U.S. cities. N. Engl. J. Med. 1993, 329, 1753–1759. [Google Scholar] [CrossRef] [PubMed] [Green Version]
- Kannari, A.; Kokuryo, K. Thirty-year histories of atmospheric emissions from road vehicles in Japan. J. Jpn. Soc. Atmos. Environ. 2013, 48, 20–34. (In Japanese) [Google Scholar]
- CFR 40 Part 50, Appendix J, Reference Method for the Determination of Particulate Matter as PM10 in the Atmosphere, Office of the Federal Register, July 2012. Available online: https://www.law.cornell.edu/cfr/text/40/appendix-J_to_part_50 (accessed on 22 July 2021).
- Environmental Quality Standards in Japan—Air Quality (Ministry of the Environment). Available online: https://www.env.go.jp/en/air/aq/aq.html (accessed on 22 July 2021).
- Manual for Continuous Environmental Air Quality Monitoring, 6th Edition (Ministry of the Environment). Available online: http://www.env.go.jp/air/osen/manual_6th/index.html (accessed on 22 July 2021).
- Environmental Numerical Database (National Institute for Environmental Studies). Available online: https://www.nies.go.jp/igreen/ (accessed on 1 March 2021).
- Mass Concentrations and Component Measurement (Manual Analysis) Results of PM2.5 (Ministry of the Environment). Available online: https://www.env.go.jp/air/osen/pm/monitoring.html (accessed on 1 March 2021).
- Chatani, S.; Itahashi, S.; Yamaji, K. Advantages of Continuous Monitoring of Hourly PM2.5 Component Concentrations in Japan for Model Validation and Source Sensitivity Analyses. Asian J. Atmos. Environ. 2021, 15, 1–29. [Google Scholar] [CrossRef]
- Atmospheric Environmental Regional Observation System: AEROS (Ministry of the Environment). Available online: https://soramame.env.go.jp/ (accessed on 10 June 2021).
- Uno, I.; Wang, Z.; Itahashi, S.; Yumimoto, K.; Yamamura, Y.; Yoshino, A.; Takami, A.; Hayasaki, M.; Kim, B.G. Paradigm shift in aerosol chemical composition over regions downwind of China. Sci. Rep. 2020, 10, 6450. [Google Scholar] [CrossRef] [PubMed] [Green Version]
- Yamagami, M.; Ikemori, F.; Nakashima, H.; Hisatsune, K.; Ueda, K.; Wakamatsu, S.; Osada, K. Trends in PM2.5 Concentration in Nagoya, Japan, from 2003 to 2018 and Impacts of PM2.5 Countermeasures. Atmosphere 2021, 12, 590. [Google Scholar] [CrossRef]
- Air Quality Expert Group. Non-Exhaust Emissions from Road Traffic. 2019. Available online: https://uk-air.defra.gov.uk/library/reports?report_id=992 (accessed on 10 June 2021).
- Koutrakis, P.; Greenbaum, D. Enhancing near-road exposure assessment. J. Air Waste Manag. Assoc. 2021, 71, 115–117. [Google Scholar] [CrossRef] [PubMed]
- Kreider, M.L.; Panko, J.M.; McAtee, B.L.; Sweet, L.I.; Finley, B.L. Physical and chemical characterization of tire-related particles: Comparison of particles generated using different methodologies. Sci. Total Environ. 2010, 408, 652–659. [Google Scholar] [CrossRef] [PubMed]
- Fukunaga, A.; Sato, T.; Fujita, K.; Yamada, D.; Ishida, S.; Wakamatsu, S. Relationship between Changes over Time in Factors, Including the Impact of Meteorology on Photochemical Oxidant Concentration and Causative Atmospheric Pollutants in Kawasaki. Atmosphere 2021, 12, 446. [Google Scholar] [CrossRef]
- Sora Mame Kun Gallery (National Institute for Environmental Studies). Available online: https://tenbou.nies.go.jp/gis/realtime/soramame.html (accessed on 10 June 2021).
- Kubo, T.; Iino, H.; Yamamoto, K.; Nakatsubo, R.; Takimoto, M.; Takaishi, Y. Analysis of severe ozone pollution during 24–26 May 2019 over Hyogo Prefecture. Bull. Hyogo Prefect. Inst. Environ. Sci. 2019. Available online: http://www.eco-hyogo.jp/files/9015/8496/1726/041218.pdf (accessed on 10 June 2021). (In Japanese).
- Nakayama, T. High Concentration of PM2.5 Derived from Volcanic Activity Observed in Nagasaki and Okinawa. Available online: https://www.nagasaki-u.ac.jp/ja/science/science209.html (accessed on 10 June 2021). (In Japanese).
- Center for Research on Energy and Clean Air (CREA). BRIEFING: China’s Air Pollution Overshoots Pre-Crisis Levels for the First Time. Available online: https://energyandcleanair.org/china-air-pollution-rebound-briefing/ (accessed on 10 June 2021).
Figure 1.
Distribution of ambient air quality monitoring stations (AAQMS) and roadside air quality monitoring stations (RsAQMS) in Japan and the eight regions (region 1 to 8) defined in this study.
Figure 1.
Distribution of ambient air quality monitoring stations (AAQMS) and roadside air quality monitoring stations (RsAQMS) in Japan and the eight regions (region 1 to 8) defined in this study.

Figure 2.
Annual average concentrations of air pollutants at AAQMS and RsAQMS in Japan from 1990 to 2018 (top: PM2.5 and SPM, middle: O3, NOx and NMHC, bottom: SO2 and CO).
Figure 2.
Annual average concentrations of air pollutants at AAQMS and RsAQMS in Japan from 1990 to 2018 (top: PM2.5 and SPM, middle: O3, NOx and NMHC, bottom: SO2 and CO).

Figure 3.
Annual average concentration of main components in PM2.5 (AAQMS, RsAQMS) for 2012–2018.

Figure 4.
Annual mean concentrations of PM2.5 components at AAQMS and RsAQMS by region (left: region 1 to 4 from the top, right: region 5 to 8 from the top).
Figure 4.
Annual mean concentrations of PM2.5 components at AAQMS and RsAQMS by region (left: region 1 to 4 from the top, right: region 5 to 8 from the top).

Figure 5.
Annual average of 1-h daytime and annual maximum ozone concentrations at the AAQMS and RsAQMS of the nation and each region from 1990 to 2018.
Figure 5.
Annual average of 1-h daytime and annual maximum ozone concentrations at the AAQMS and RsAQMS of the nation and each region from 1990 to 2018.

Figure 6.
Annual average NOx and NMHC concentrations at the AAQMS and RsAQMS of the nation from 1990 to 2018.
Figure 6.
Annual average NOx and NMHC concentrations at the AAQMS and RsAQMS of the nation from 1990 to 2018.

Figure 7.
Annual average SO2 and CO concentrations at the AAQMS and RsAQMS of the nation from 1990 to 2018.
Figure 7.
Annual average SO2 and CO concentrations at the AAQMS and RsAQMS of the nation from 1990 to 2018.

Figure 8.
Anthropogenic emission data and annual average concentrations at the AAQMS for SO2, NOx, and PM.
Figure 8.
Anthropogenic emission data and annual average concentrations at the AAQMS for SO2, NOx, and PM.

Figure 9.
Distribution of ozone concentration at 15:00 (local time) from 21 May to 28 May 2019 [20].
Figure 9.
Distribution of ozone concentration at 15:00 (local time) from 21 May to 28 May 2019 [20].

Figure 10.
Time series of ozone concentrations in regions 2, 5 and 8 (left: maximum ozone concentration in the regions, right: average ozone concentration in the regions).
Figure 10.
Time series of ozone concentrations in regions 2, 5 and 8 (left: maximum ozone concentration in the regions, right: average ozone concentration in the regions).

Figure 11.
Distribution of PM2.5 concentrations at 18:00 on August 2 through to 4 August 2020.

Figure 12.
Median and 98% concentrations of PM2.5 in region 8 from 1 August to 10 August 2020.

Figure 13.
Monthly average concentrations of NOx, O3, PM2.5 and SO2 at AAQMS and RsAQMS in the Tokyo metropolitan area from 2016 to 2020.
Figure 13.
Monthly average concentrations of NOx, O3, PM2.5 and SO2 at AAQMS and RsAQMS in the Tokyo metropolitan area from 2016 to 2020.


Table 1.
Air pollutants, start year of the measurements and the number of stations as of 2018.
| Species | Abbreviation | Start Year | No. of Monitoring Stations (1) | Remarks | ||
|---|---|---|---|---|---|---|
| AAQMS | RsAQMS | |||||
| PM2.5 | PM2.5 | 2010 | 1088 | 849 | 239 | |
| Suspended Particulate Matter | SPM | 1970 | 1703 | 1314 | 389 | (2) |
| Ozone | O3 | 1970 | 1193 | 1165 | 28 | |
| Nitrogen Oxides, Nitrogen Dioxide | NOx, NO2 | 1970 | 1658 | 1260 | 398 | |
| Non-Methane HydroCarbon | NMHC | 1970 | 482 | 333 | 149 | |
| Sulfur Dioxide | SO2 | 1970 | 1010 | 960 | 50 | |
| Carbon Monoxide | CO | 1970 | 293 | 60 | 233 | |
Note: (1) as of 2018, AAQMS: Ambient Air Quality Monitoring Station, RsAQMS: Roadside Air Quality Monitoring Station. (2) Suspended particulate matter (SPM) is defined as particles with a particle size of 10 μm or less.
Table 2.
National and regional PM2.5 mass concentrations (2010, 2018) and their concentration ratios.
Table 2.
National and regional PM2.5 mass concentrations (2010, 2018) and their concentration ratios.
| PM2.5 | Concentration (μg/m3) | C2018/C2010 | ||
|---|---|---|---|---|
| 2010 | 2018 | |||
| Whole Japan | AAQMS | 15.1 | 11.2 | 0.74 |
| RsAQMS | 17.2 | 12.0 | 0.70 | |
| Region 1 | AAQMS | 13.1 | 8.9 | 0.68 |
| RsAQMS | n. d. | 9.3 | n. d. | |
| Region 2 | AAQMS | 14.6 | 11.2 | 0.77 |
| RsAQMS | 18.1 | 12.5 | 0.69 | |
| Region 3 | AAQMS | 13.2 | 9.5 | 0.72 |
| RsAQMS | 13.8 | 10.9 | 0.79 | |
| Region 4 | AAQMS | 12.8 | 10.4 | 0.81 |
| RsAQMS | 17.7 | 10.7 | 0.61 | |
| Region 5 | AAQMS | 16.6 | 11.5 | 0.69 |
| RsAQMS | 17.2 | 12.2 | 0.71 | |
| Region 6 | AAQMS | 19.8 | 12.2 | 0.62 |
| RsAQMS | n. d. | 13.5 | n. d. | |
| Region 7 | AAQMS | 16.3 | 12.0 | 0.74 |
| RsAQMS | n. d. | 13.6 | n. d. | |
| Region 8 | AAQMS | 17.9 | 12.9 | 0.72 |
| RsAQMS | 16.7 | 13.8 | 0.83 | |
Table 3.
Annual average concentration of main components in PM2.5 (AAQMS, RsAQMS) for 2012, 2015 and 2018, and the concentration ratios in 2018 relative to 2012.
Table 3.
Annual average concentration of main components in PM2.5 (AAQMS, RsAQMS) for 2012, 2015 and 2018, and the concentration ratios in 2018 relative to 2012.
| PM2.5 Species | Concentration (µg/m3) | C2018/C2012 | |||
|---|---|---|---|---|---|
| 2012 | 2015 | 2018 | |||
| PM2.5 | AAQMS | 12.0 | 11.8 | 8.8 | 0.74 |
| main component | RsAQMS | 12.7 | 13.1 | 9.6 | 0.75 |
| EC | AAQMS | 1.18 | 1.04 | 0.68 | 0.57 |
| RsAQMS | 1.81 | 1.50 | 0.91 | 0.50 | |
| OC | AAQMS | 3.11 | 2.98 | 2.78 | 0.89 |
| RsAQMS | 3.17 | 3.38 | 3.06 | 0.97 | |
| SO42− | AAQMS | 4.27 | 4.64 | 3.12 | 0.73 |
| RsAQMS | 4.06 | 4.75 | 3.19 | 0.78 | |
| NO3− | AAQMS | 1.07 | 0.84 | 0.66 | 0.61 |
| RsAQMS | 1.29 | 1.00 | 0.70 | 0.54 | |
| NH4+ | AAQMS | 1.83 | 1.89 | 1.24 | 0.68 |
| RsAQMS | 1.85 | 1.96 | 1.30 | 0.70 | |
| ions * | AAQMS | 0.50 | 0.44 | 0.38 | 0.75 |
| RsAQMS | 0.57 | 0.50 | 0.41 | 0.72 | |
* sum of Cl−, Na+, K+, Mg2+ and Ca2+.
Table 4.
Annual average concentration of SPM at the AAQMS and RsAQMS of the nation and each region in 1990, 2000, 2010 and 2018, and the ratio of concentrations in 2018 to 1990.
Table 4.
Annual average concentration of SPM at the AAQMS and RsAQMS of the nation and each region in 1990, 2000, 2010 and 2018, and the ratio of concentrations in 2018 to 1990.
| SPM | Concentration (µg/m3) | C2018/C1990 | ||||
|---|---|---|---|---|---|---|
| 1990 | 2000 | 2010 | 2018 | |||
| Whole Japan | AAQMS | 37 | 31 | 21 | 17 | 0.45 |
| RsAQMS | 50 | 40 | 23 | 17 | 0.35 | |
| Region 1 | AAQMS | 24 | 20 | 16 | 13 | 0.55 |
| RsAQMS | 34 | 24 | 17 | 13 | 0.40 | |
| Region 2 | AAQMS | 45 | 36 | 22 | 17 | 0.38 |
| RsAQMS | 60 | 46 | 24 | 18 | 0.30 | |
| Region 3 | AAQMS | 30 | 26 | 18 | 14 | 0.46 |
| RsAQMS | 33 | 29 | 21 | 15 | 0.45 | |
| Region 4 | AAQMS | 39 | 35 | 21 | 16 | 0.42 |
| RsAQMS | 47 | 39 | 21 | 17 | 0.36 | |
| Region 5 | AAQMS | 38 | 31 | 21 | 17 | 0.45 |
| RsAQMS | 52 | 40 | 23 | 17 | 0.34 | |
| Region 6 | AAQMS | 37 | 32 | 22 | 18 | 0.48 |
| RsAQMS | 40 | 38 | 24 | 18 | 0.46 | |
| Region 7 | AAQMS | 38 | 32 | 23 | 19 | 0.49 |
| RsAQMS | 44 | 35 | 21 | 19 | 0.44 | |
| Region 8 | AAQMS | 32 | 28 | 22 | 19 | 0.60 |
| RsAQMS | 39 | 37 | 26 | 20 | 0.52 | |
Publisher’s Note: MDPI stays neutral with regard to jurisdictional claims in published maps and institutional affiliations. |
© 2021 by the authors. Licensee MDPI, Basel, Switzerland. This article is an open access article distributed under the terms and conditions of the Creative Commons Attribution (CC BY) license (https://creativecommons.org/licenses/by/4.0/).
Share and Cite
MDPI and ACS Style
Ito, A.; Wakamatsu, S.; Morikawa, T.; Kobayashi, S. 30 Years of Air Quality Trends in Japan. Atmosphere 2021, 12, 1072. https://0-doi-org.brum.beds.ac.uk/10.3390/atmos12081072
AMA Style
Ito A, Wakamatsu S, Morikawa T, Kobayashi S. 30 Years of Air Quality Trends in Japan. Atmosphere. 2021; 12(8):1072. https://0-doi-org.brum.beds.ac.uk/10.3390/atmos12081072
Chicago/Turabian StyleIto, Akiyoshi, Shinji Wakamatsu, Tazuko Morikawa, and Shinji Kobayashi. 2021. "30 Years of Air Quality Trends in Japan" Atmosphere 12, no. 8: 1072. https://0-doi-org.brum.beds.ac.uk/10.3390/atmos12081072
Note that from the first issue of 2016, this journal uses article numbers instead of page numbers. See further details here.