Article

Warm Island Effect in the Lake Region of the Tengger Desert Based on MODIS and Meteorological Station Data

Center for Glacier and Desert Research, College of Earth and Environmental Sciences, Lanzhou University, Lanzhou 730000, China
*
Author to whom correspondence should be addressed.
Submission received: 10 August 2021 / Revised: 2 September 2021 / Accepted: 6 September 2021 / Published: 8 September 2021
(This article belongs to the Topic Climate Change and Environmental Sustainability)

Abstract

:
The northeastern part of the Tengger Desert accommodates several lakes. The effect of these lakes on local temperatures is unclear. In this study, the effects of the lakes were investigated using land surface temperature (LST) from MODIS (Moderate Resolution Imaging Spectroradiometer) data from 2003 to 2018 and air temperatures from meteorological stations in 2017. LST and air temperatures are compared between the lake-group region and an area without lakes to the north using statistical methods. Our results show that the lake-group region is found to exhibit a warm island effect in winter on an annual scale and at night on a daily scale. The warm island effect is caused by the differing properties of the land and other surfaces. Groundwater may also be an important heat source. The results of this study will help in understanding the causative factors of warm island effects and other properties of lakes.

1. Introduction

Deserts account for approximately 1/4 of the global land area [1]. Owing to the extreme arid climate and other special conditions, desert areas have considerably different surface radiation budgets and energy distribution processes than other ecosystems, with unique energy, water, and material circulation processes. These unique exchanges of heat, water, and momentum influence ecosystems at the local, regional, and global scales, consequently exerting strong direct and indirect influences on the global climate [2,3].
One of the most studied phenomena of a city’s climate is the urban heat island (UHI) [4]. The UHI means the phenomenon that the urban air temperature is higher than that in the surrounding natural environment. Factors that contribute to the formation of the UHI are the properties of the underlying surface and changes in city pattern [5]. Previous research has shown that due to non-uniform solar heating of oases or lakes in arid areas like the Gobi Desert that are colder than the surrounding environment, a “cold island effect” is formed, different to the UHI [6,7,8]. However, in the southeastern part of the Badain Jaran Desert (BJD), over 110 perennial lakes are spread among the mega-dunes, referred to as the BJD lake-group region. Zhang et al. (2015) have shown that the winter surface temperature of the lake-group region in the hinterland of the BJD was significantly higher than that of other regions (i.e., a “warm island effect”) according to MODIS (Moderate Resolution Imaging Spectroradiometer) data, and its formation mechanism might be related to the underlying surface that the lakes are characterized by, with an elevated heat capacity and thermal inertia, and a small roughness length and albedo but also related to the remote groundwater recharge lakes; the heat is mainly carried by the deep groundwater during the process of recharging lakes [9]. Several subsequent studies have also demonstrated the presence of the warm island effect in the BJD lake-group region. For example, a study of Landsat satellite remote sensing data by Deng et al. (2018) found that the surface temperature in the lake-group region is higher than that of the non-lake area in the northern part of the desert [10]. Liang et al. (2016, 2020) indicated that the annual and seasonal average temperatures in the lake-group region were higher than those of the surrounding area, and believed that the mechanism of the warm island effect was related to two aspects: First, heat is carried by the groundwater recharge to the desert lake groups. Second, due to the sparse vegetation and arid surface of the desert hinterland, most of the net radiation is transferred to the atmosphere through sensible heat flux. Meteorological observations found that accumulated temperatures of ≥0 °C and ≥10 °C and phenological observations also proved the existence of a warm island effect in the lake-group region [11,12,13]. Zhao et al. (2021) found that the lake region has a warm island effect in winter, and is more intense at night [14]. Like the UHI, the ‘’warm island effect’’ is a meteorological phenomenon in the atmospheric boundary layer, but their formations are different [14].
The Tengger Desert is located in the southeastern part of arid northwestern China, adjacent to the Badain Jaran Desert. It has an extremely continental climate and is sensitive to climate change [15]. As in the BJD, there is a region covered with numerous lakes of varying sizes and shapes in the northeastern part of the Tengger Desert hinterland. Previous studies have focused on the seasonal changes of the lakes, lake water balance, and lake supply sources [16,17]. There has been little research on the climatic effects of these lakes. Thus, the aim of this paper is to investigate lake effects on temperatures in the Tengger Desert. For this purpose, we used remote sensing data and field observations to compare the land surface temperature (LST) and air temperatures of the lake-group region and the non-lake area located to the north. The results from this study will provide information about the formation and evolution of lake areas and provide a scientific basis for the prevention of desertification and environmental protection.
The remainder of this paper is organized as follows: Section 2 describes the data and methods, including the study area, detailed data processing methods, and research methods. The results are presented in Section 3, including the LST distribution and air temperature differences in the lake and non-lake areas. Section 4 contains a discussion of the results. Section 5 summarizes the major conclusions of this work and plans for future work.

2. Materials and Methods

2.1. Study Area

The Tengger Desert (37°27′–40°00′ N, 102°15′–105°14′ E) is located in the southeastern region of the Alxa Plateau. With an area of 4.27 × 10⁴ km2, it is the fourth largest desert in China, and is bordered by the Helan Mountains to the east, the Yabulai Mountains to the northwest, and the Qilian Mountains to the southwest. The average altitude is 1200–1400 m [18,19]. The local weather is controlled by westerly circulation. The desert has a typical continental climate and is sensitive to climate change. The average annual temperature is 7.0–9.7 °C, and the average annual precipitation is 100–200 mm. Approximately 80% of the total precipitation occurs from June to September. The average annual wind speed is 2.9–3.7 m/s and is prevalently northwesterly year-round [20]. There are more than 400 lake basins in the desert, approximately 250 of which currently contain water. The lake basins in the northeast are relatively small (generally below 3 km2) and shallow; Most are located in the inter-hill depressions between the northeast—southwest compound sand dune chains, arranged in a repeated landform pattern [21].

2.2. Data Sources and Processing

2.2.1. LST Data

The LST data were obtained from the 8-day synthetic product (MOD11A2) of the MODIS surface temperature data, available from the USGS website. The product includes daytime and nighttime surface temperatures. The time period of the data was from January 2003 to December 2018, and the data were mosaiced and projected through the MRT (MODIS Reprojection Tool) software, then cropped using the vector boundary map of the Tengger Desert. Clouds can negatively impact the acquisition of remote sensing images; thus, to ensure the accuracy and reliability of the research results, quality control software (Quality Control) was used to perform data preprocessing to remove areas affected by clouds [22]. The satellite provided images at 11:00 and 22:00 local solar time, which represented day and night surface temperatures, respectively, in the area for 1 d. More information about the data processing can be found in Zhang [9].

2.2.2. Meteorological Data

The air temperature data were extracted from the MAWS301 automatic weather station (Vaisala, Finland). The installation height of the station is 3 m above ground, and the data collection interval is 10 min. The selected time period was from 1 January 2017 to 1 January 2018. Barunjilang Station (38°40′ N, 104°31′ E, H = 1344.0 m) is located in the lake area in the northeastern area of the desert hinterland, and Baxinggaole Station (39°58′ N, 104°10′ E, H = 1215.0 m) is located in the non-lake area to the north of the desert (see Figure 1). The observation field is relatively empty and the surface is bare sand. Data processing conformed to the regulations of the ground meteorological observation standards and has strict uniformity and accuracy after quality control.

2.2.3. ASTER GDEM Data

Advanced Spaceborne Thermal Emission and Reflection Radiometers (ASTERs) onboard Terra have a unique combination of wide spectral coverage and high spatial resolution in the visible near-infrared, through shortwave infrared, to thermal infrared regions. Japan’s Ministry of Economy, Trade and Industry (METI) and NASA announced the release of the ASTER Global Digital Elevation Model (GDEM) on 29 June 2009. ASTER data contributes to a wide array of global change-related application areas including geology and soils, vegetation and ecosystem dynamics, and land cover change. The horizontal resolution of this GDEM is arcsecond (approximately 30 m resolution) and has Z accuracies generally between 10 m and 25 m root mean square error (RMSE) [23]. The ASTER GDEM data was derived from the geospatial data cloud website (http://www.gscloud.cn/, accessed on 4 January 2021).

2.3. Methods

There are many lakes of various sizes and shapes in the Tengger Desert. In addition to freshwater lakes, there are also many saltwater lakes with high total dissolved solids and a certain number of dry alkali-salt lake basins. According to its distribution characteristics, the Tengger Desert can be roughly divided into the following three types of area: (1) In the middle and south of the desert, there are lake basins arranged in a regular north—south direction; most of them may be residual lakes formed when ancient lakes dried up and retreated in the Late Quaternary [24]; (2) Irregularly distributed lake basins in the west and south of the desert; (3) In the northeastern part of the desert, lakes are located in inter-dune depressions between the northeast—southwest trending compound dune chain. This distribution comprises a regular arrangement of small lake basins [21]. The lakes are relatively concentrated and typical in the north-eastern part of the desert. Thus, this is regarded as the study area in the lake area, and the lake area is defined with a 10 km buffer zone from the lakes. Furthermore, the lake area is a blend of surfaces (both water and land) [9,12]. The northern part of the desert has fewer lakes than other areas [25]; Thus, the non-lake area is defined as the northern desert area adjacent to the lake-group region (Figure 1). We computed the mean LST per pixel by aggregating the available 8-day mean in different regions. The seasonal average LST in the daytime and nighttime were compared separately. The geographic parameters of longitude, latitude, and altitude can influence temperature distributions. However, the difference in longitude between the two stations is small, so this study only corrected for the latitudes and altitudes of the two stations. Temperature is assumed to decrease by 0.0065 °C/m for altitude, so that temperatures at different altitudes can be corrected to a consistent altitude [26]; The latitude correction considers one degree of latitude to have the same effect as 100 m of elevation [27]. January, April, July, and October were chosen to represent winter, spring, summer, and autumn, respectively. Remote sensing combined with data from the meteorological stations were used to compare the differences in LST and air temperatures on annual, seasonal, and daily time scales.

3. Results

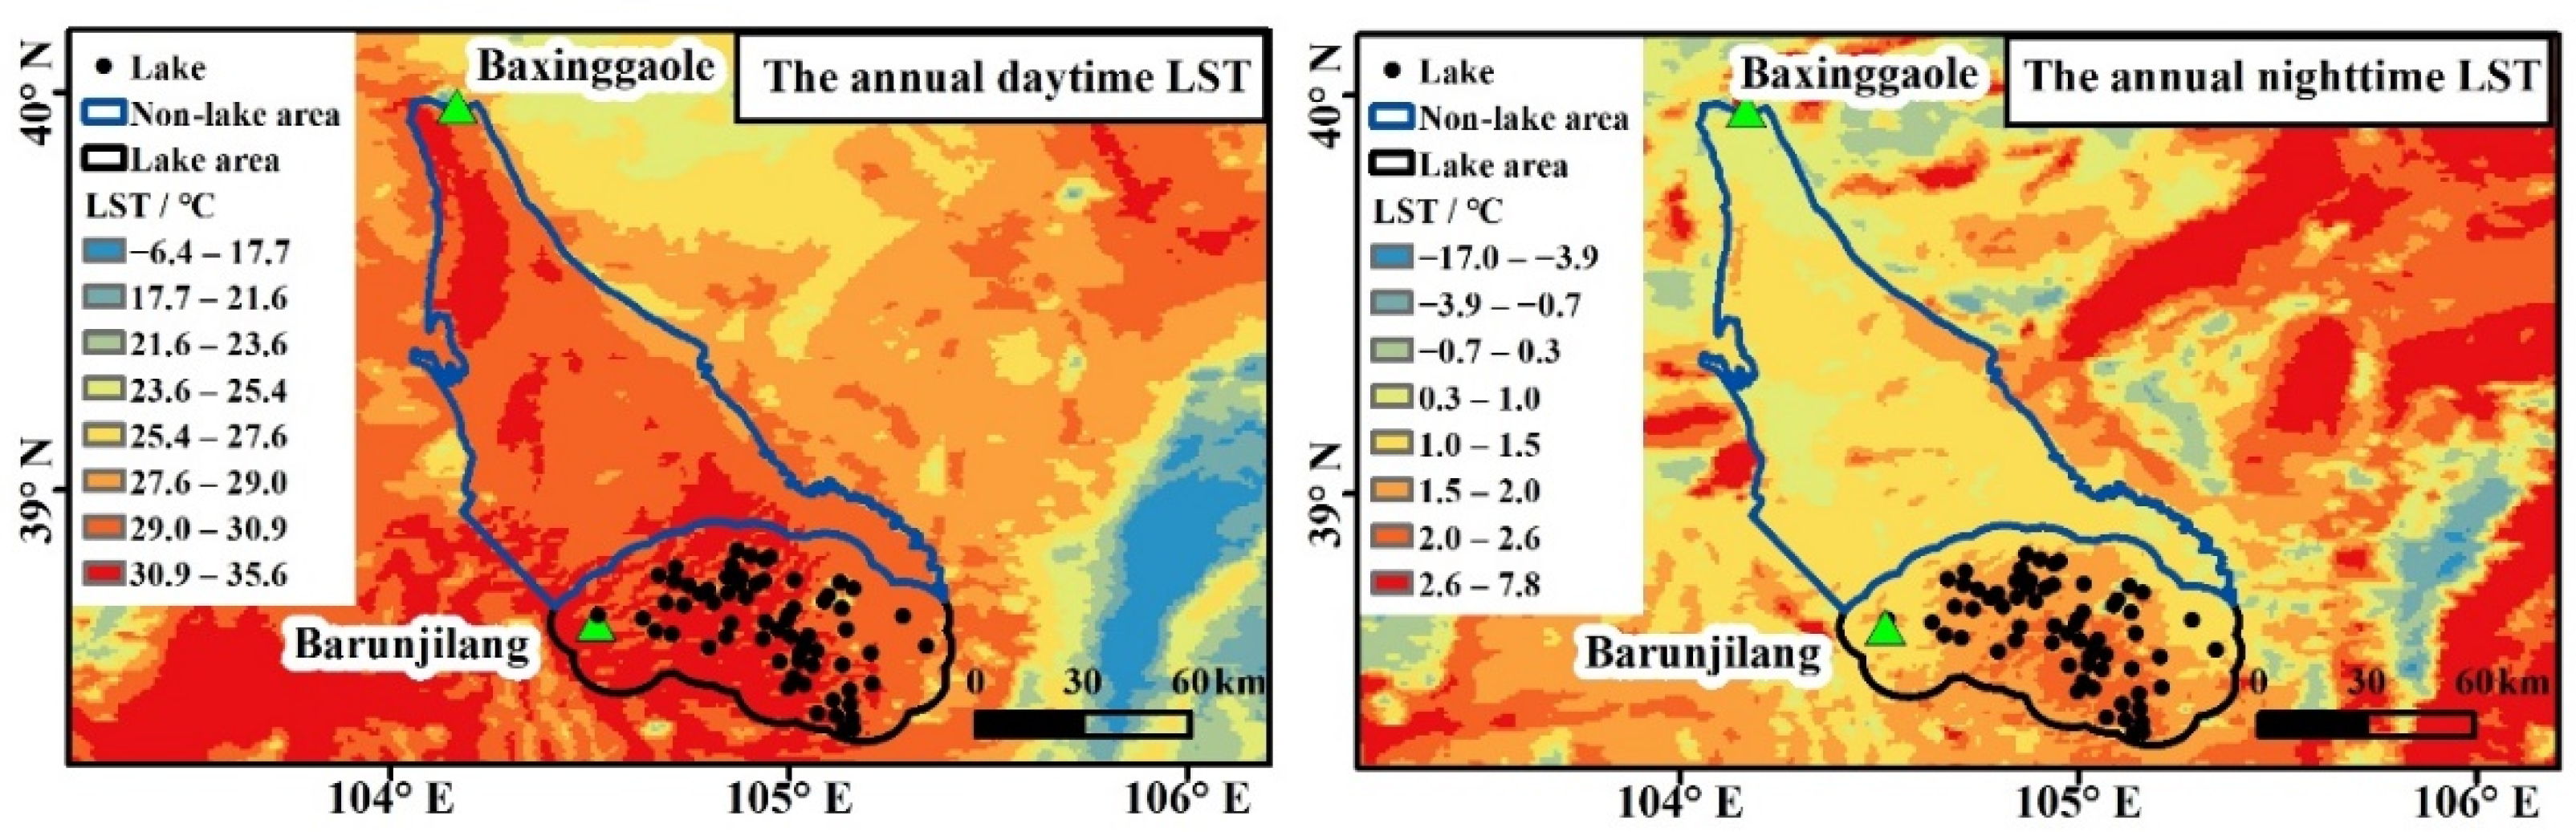
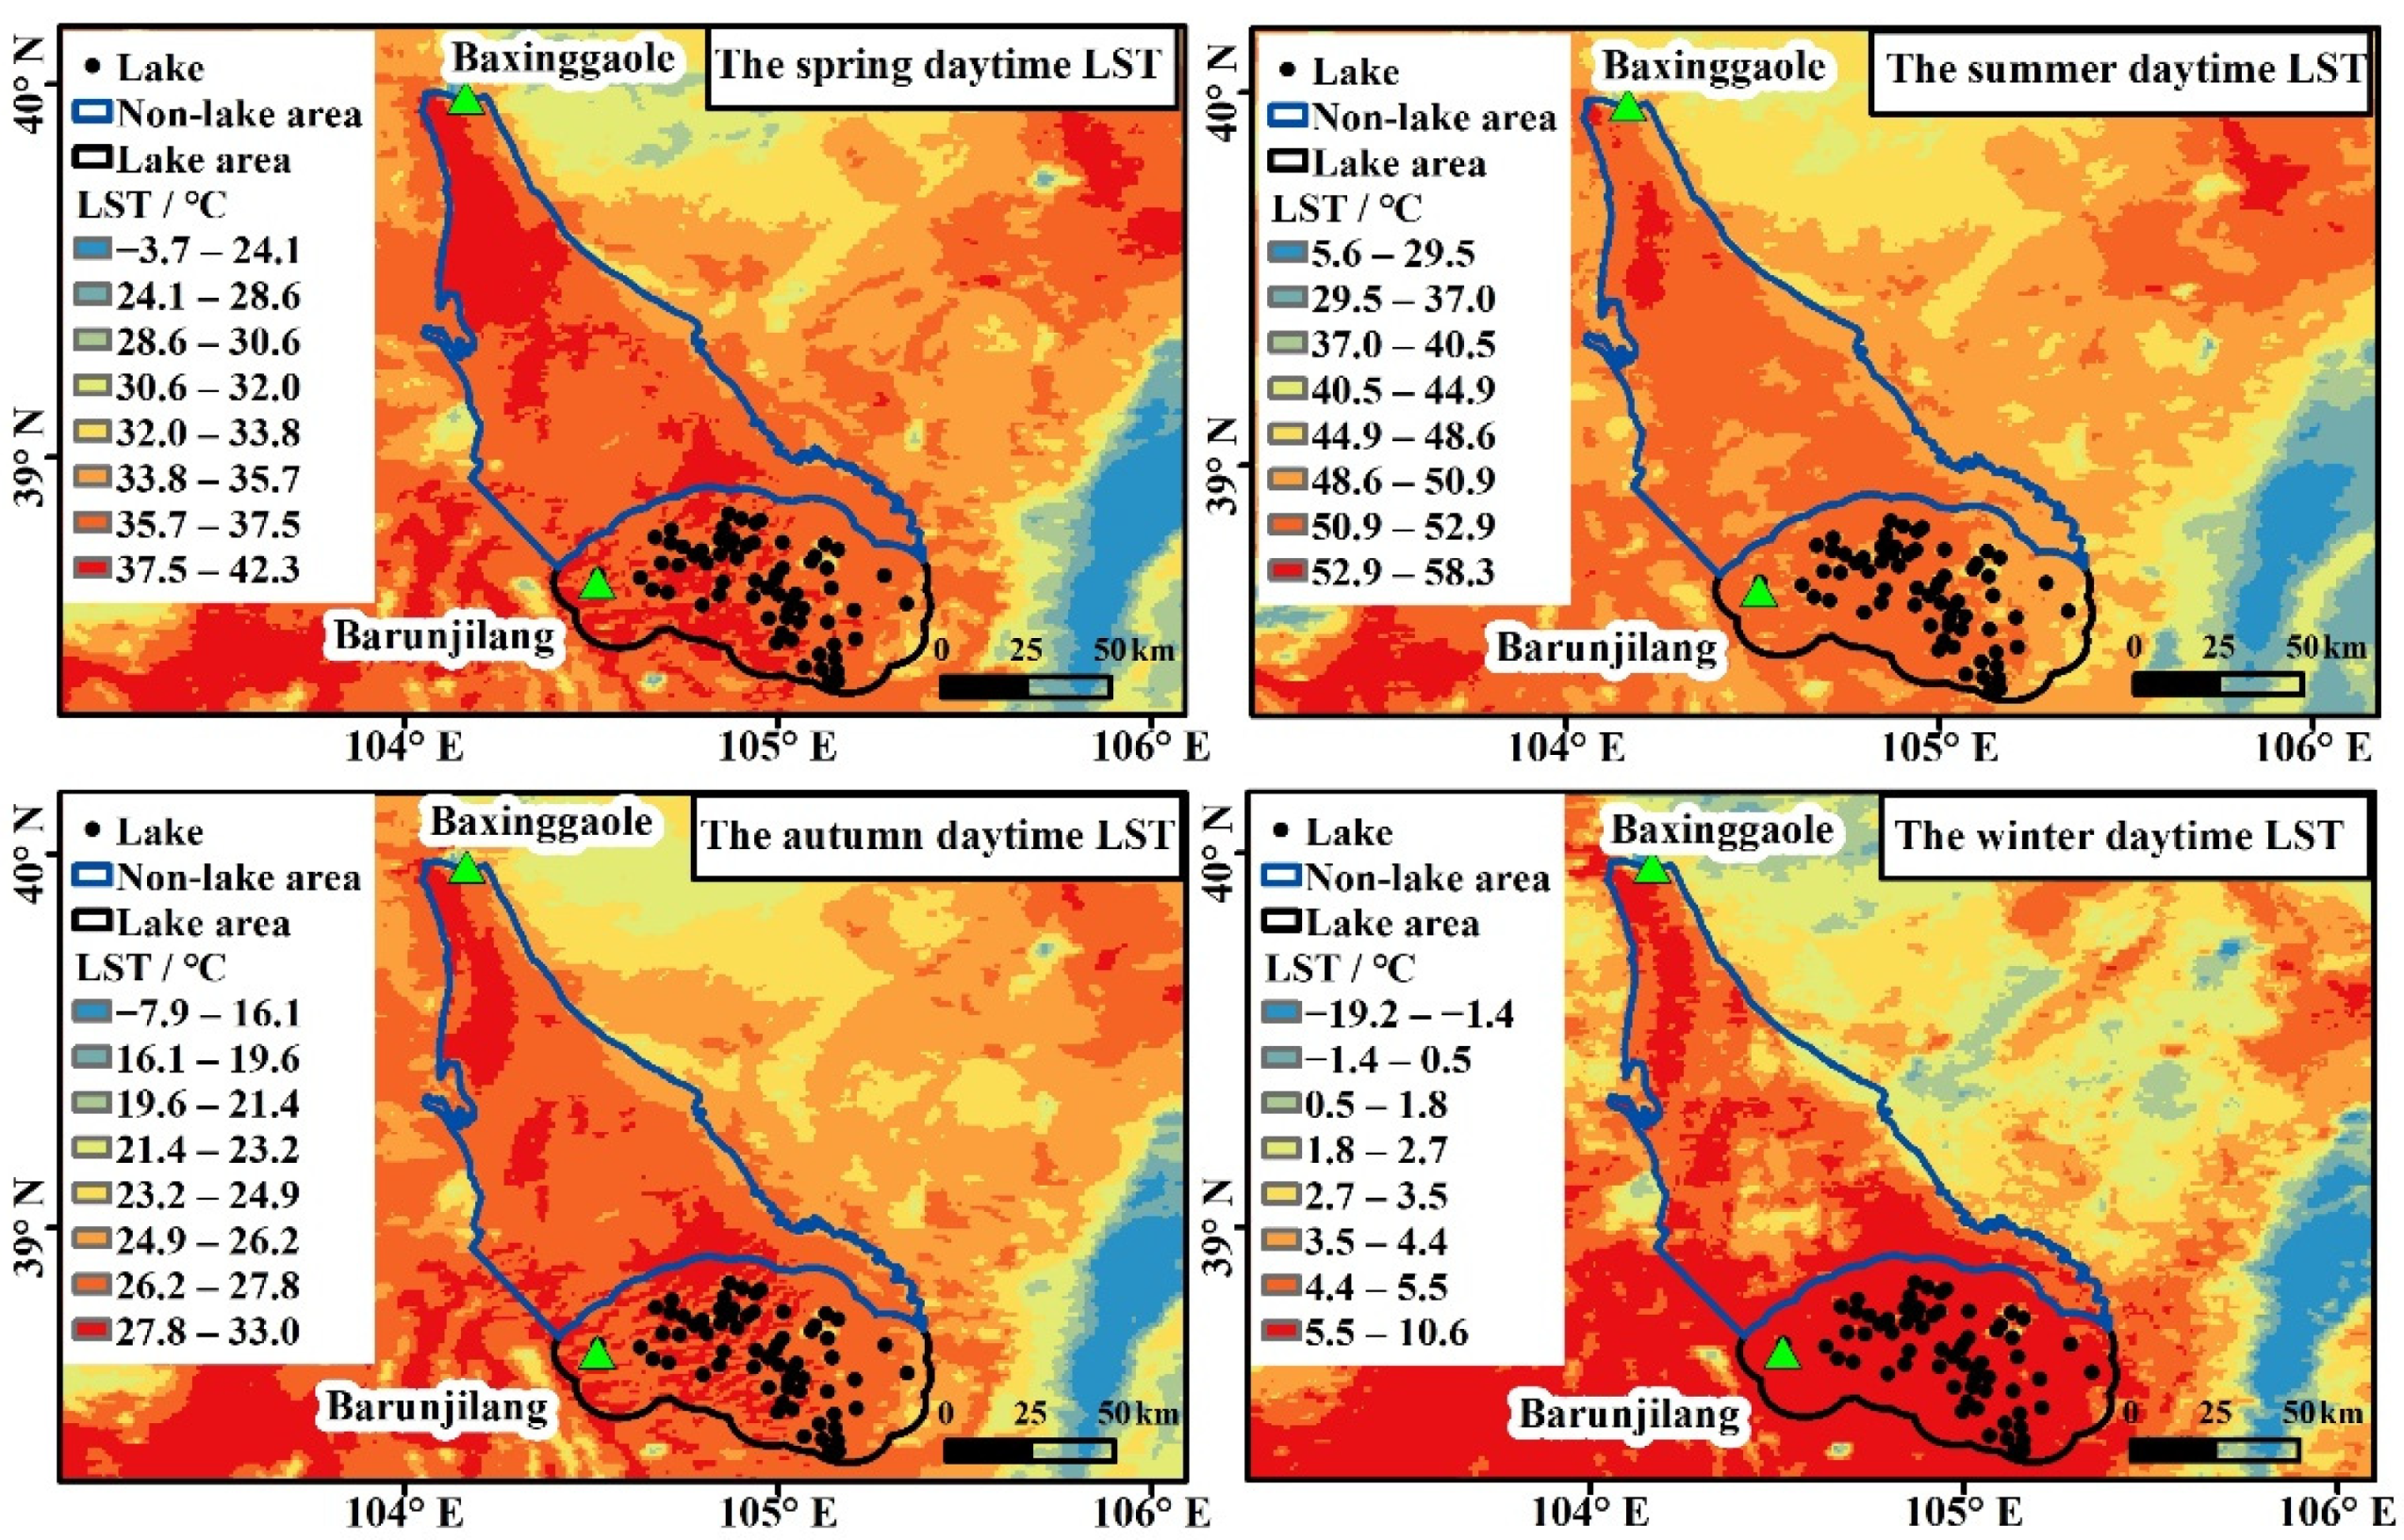
3.1. Surface Temperature Differences

The average LST distributions of the lake and non-lake areas during the daytime and nighttime from 2003 to 2018 are shown in Figure 2. The figure shows that the average LST during the day and night exhibit different characteristics. LST distributions during the daytime and nighttime in different seasons are shown in Figure 3 and Figure 4. These distributions show that different LST patterns exist in different seasons. This is likely due to seasonal changes in the intensity of solar radiation. The results show that the LST of the lake area was significantly higher than that of the non-lake area in winter on an annual scale and at night on a daily scale. In order to obtain a more reliable conclusion, the average LST of the two regions was calculated as mentioned below.
The basis of LST represents the effects of stable factors such as topography, latitude, and longtime energy balance on the land surface. The study concludes that in any study related with spatial distribution of LST over a large area, the effect of changes in elevation at different locations shall also be considered, and LSTs at different locations shall be rationalized on the basis of their comparative elevations [28,29]. The average LST of the two regions was corrected by elevation and latitude. Figure 5a shows the digital elevation model of the area produced from ASTER data.
When the elevation and latitude of LST in the lake and non-lake areas are revised, both LST and elevation shall be at the same spatial resolution. The MODIS and ASTER products have different spatial resolutions; therefore, the elevation data and LST data were resampled to a resolution of 1000 m using the nearest-neighbor sampling approach in ArcMap 10.5 software. Once registered to the same projection system with the same spatial resolution, it is possible to retrieve corresponding values of both LST and elevation for each pixel. Figure 5b shows the resampled ASTER image of the area. After resampling, the highest elevation reduced to 4708 m from 4861 m, and lowest elevation increased to 991 m from 956 m due to averaging of neighborhood pixels.
Table 1 shows the average LST and differences (ΔT) between the two regions after correction. The average LST of the lake area was higher than the non-lake area during the winter and nighttime. Thus, the lake region was found to exhibit a warm island effect in winter and at night. Due to the limited area of the lake, it cannot affect the large-scale surface thermal field.

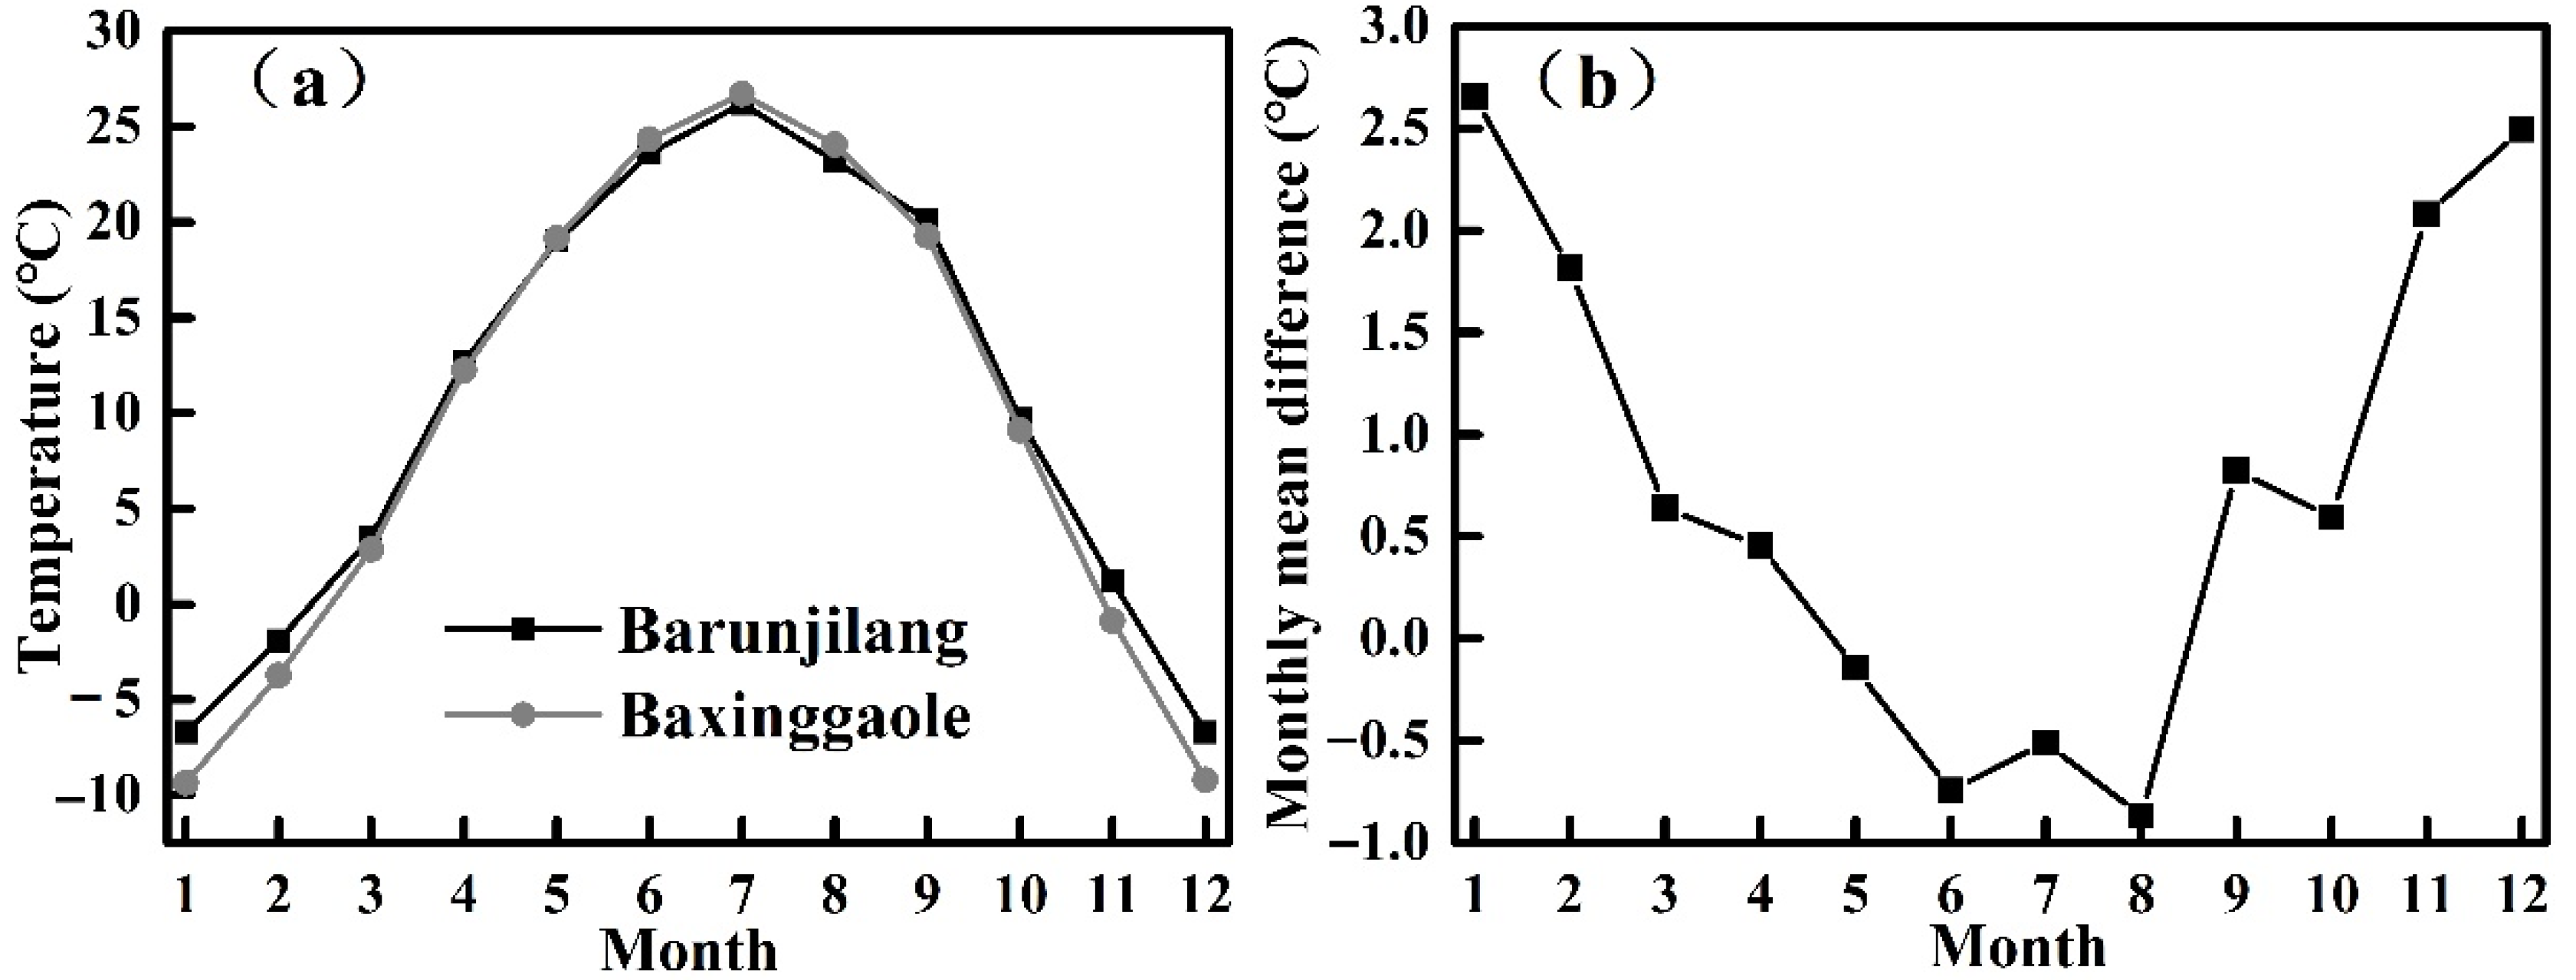
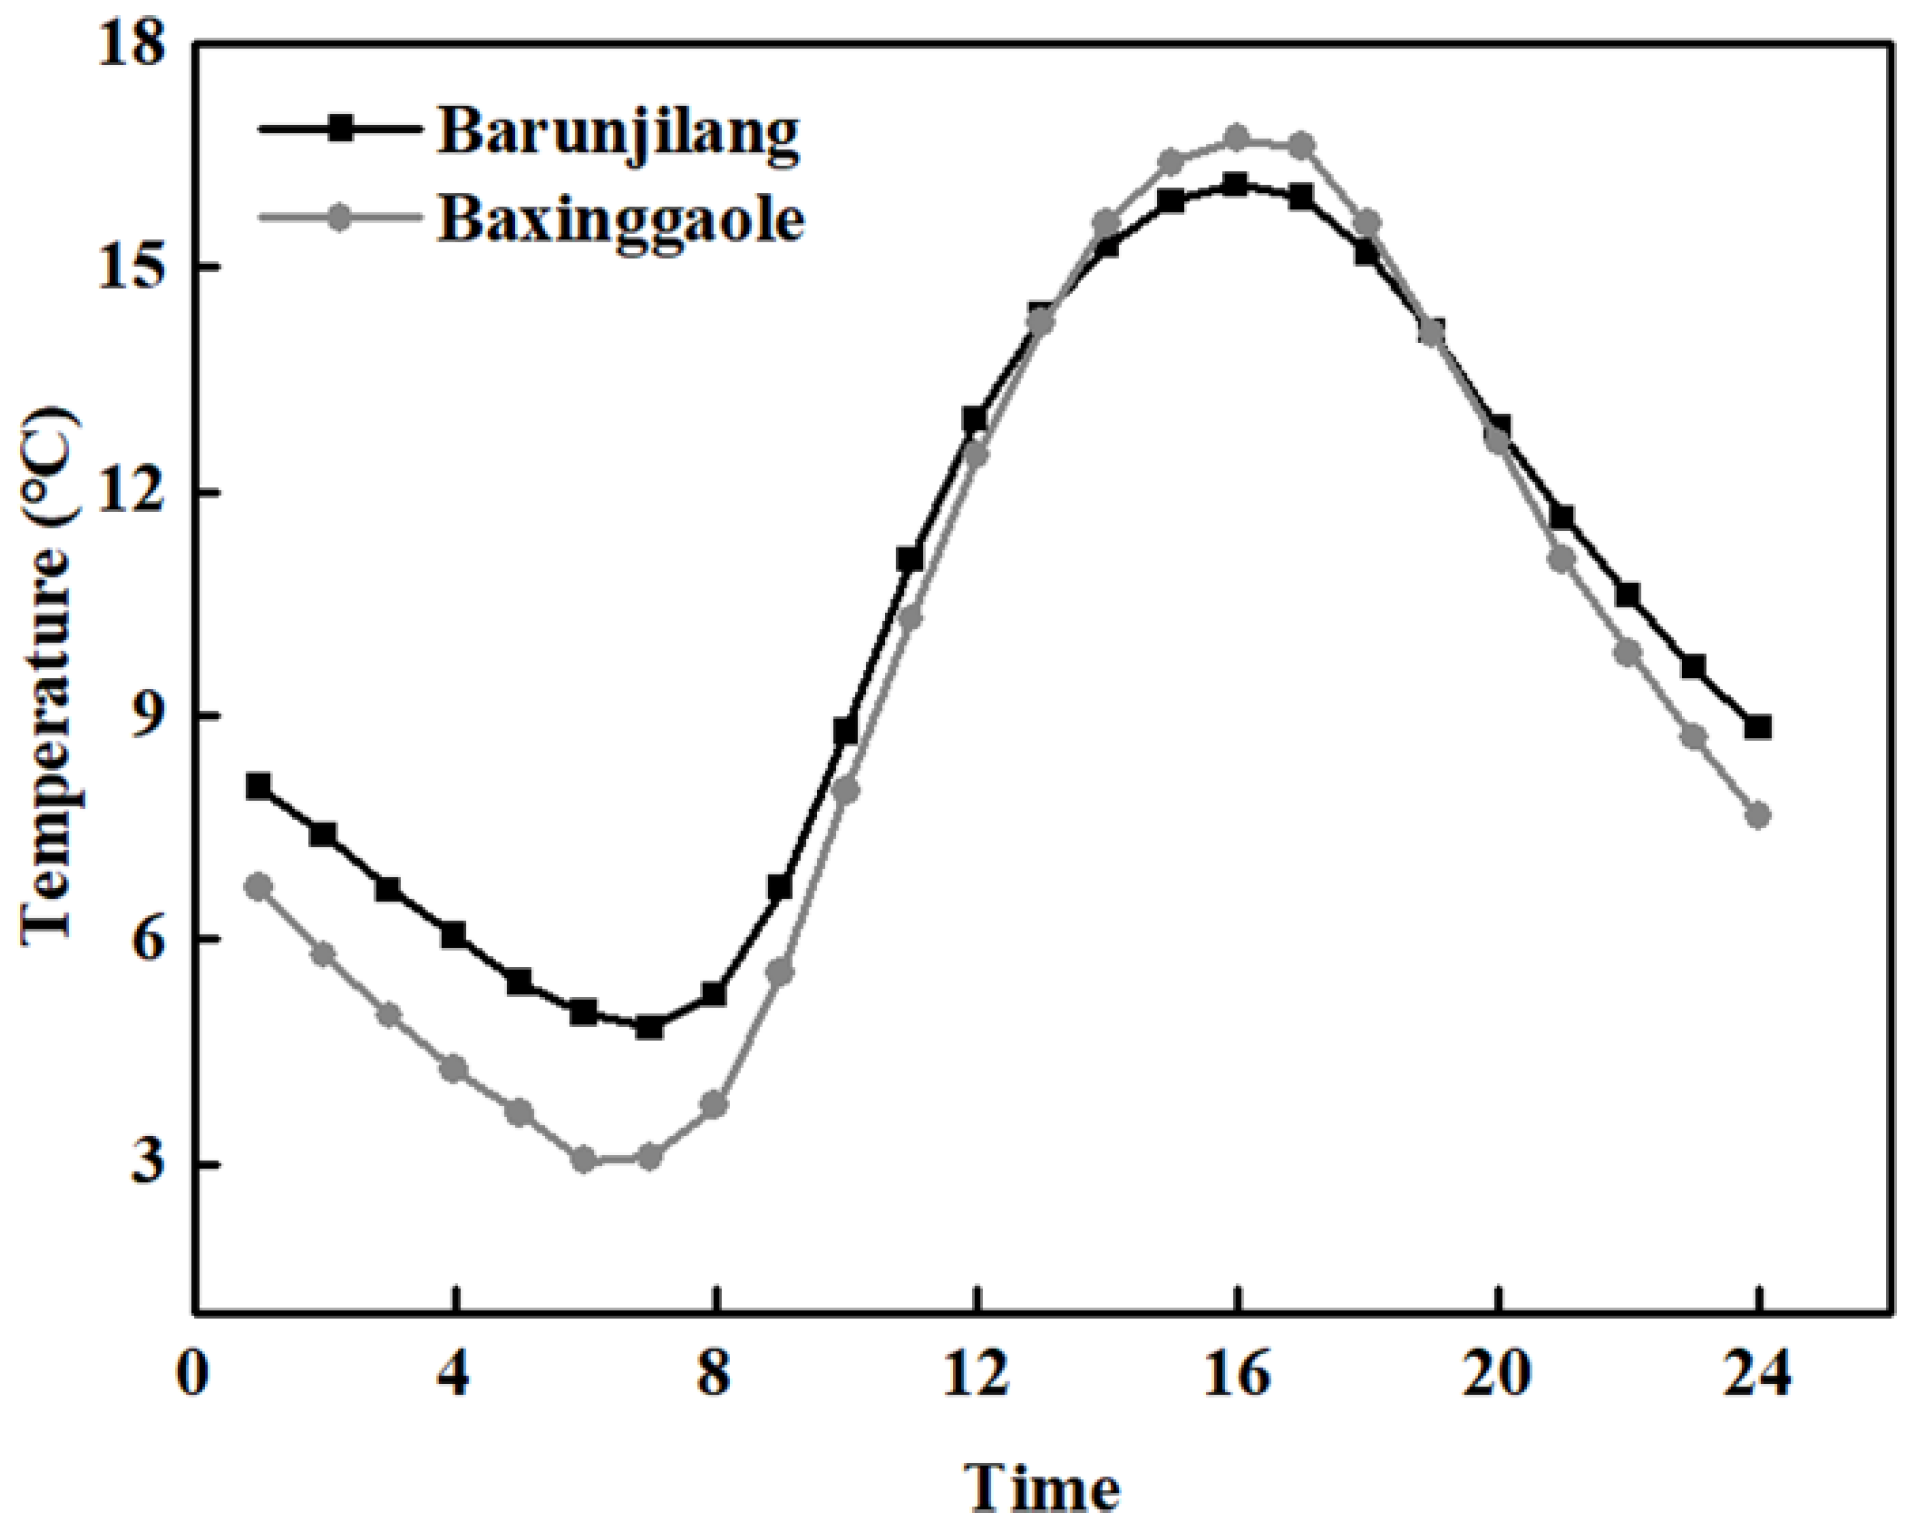
3.2. Air Temperature Differences

The Barunjilang station is approximately 1.9 km away from the nearest lake. In addition, the LST change at this station was consistent with the lake group from the above LST distribution, and Baxinggaole station is approximately 135.9 km away from the lake area. Therefore, the temperature characteristics of the Barunjilang weather station can be studied to represent the lake area, and the Baxinggaole station can represent the non-lake area. Figure 6a shows the annual temperature changes collected by the two stations; the annual temperature trends of the two stations were consistent. The standard deviation of the temperatures calculated at the Barunjilang station (11.7) was smaller than the standard deviation of the temperatures calculated at the Baxinggaole station (12.8); thus, the annual temperature variation at the Barunjilang station was smaller than at the Baxinggaole station. Summer temperatures were cooler and winter temperatures warmer in the lake area than in the non-lake area. Figure 6b illustrates that the temperature difference between the two stations was relatively small during the spring and summer, and large during the autumn and winter. Table 2 shows air temperature differences between the lake area and non-lake area. Average air temperatures in the lake area were higher than those of the non-lake area during the spring, autumn, and winter on an annual scale. Lakes generally moderate daily maximum and minimum temperatures. The data show that the average minimum temperature and the daily minimum temperature in the lake group area were both higher than those of the non-lake area; however, the average maximum temperature and the extreme maximum temperature were both lower than those of the non-lake areas, as observed by another study [30]. Additionally, the daily and annual air temperature ranges at Barunjilang station werereduced due to the presence of lakes.
The diurnal air temperature variations at the two weather stations are listed in Figure 7; the daily temperature trends at the two stations are consistent. The daily minimum temperature at the Barunjilang station in the lake area occurred slightly later than at Baxinggaole in the non-lake area. The standard deviation of the temperature at Barunjilang Station (3.9) was smaller than the standard deviation of the temperature at Baxinggaole Station (4.7). Thus, the diurnal temperature variations in the lake-group region were smaller than those in the non-lake area. This is typical diurnal behavior that results from the lake effect.
Table 3 compares the annual and seasonal air temperatures during the daytime and nighttime. The results demonstrate that, in terms of the annual averages, the daytime and nighttime temperatures at Barunjilang Station were higher than those at Baxinggaole Station. The difference between the two stations was largest at night, indicating that the warm island effect was strongest at night. Seasonally, there is a clear warm island effect in the winter. The differences between the air temperature and surface temperature results were related to the distance of the station from the central lake area, the wind direction, and the local environment around the station [31].

4. Discussion

4.1. Temperature Effects of the Lake-Group Region

The average LST and air temperature in the lake-group region were lower than those in the non-lake area, which is a cold island effect. The warm island effect is defined as higher temperatures occurring in a region with lakes than in a region without lakes. The evidence for the occurrence of the warm island effect in the study area is as follows: (1) On a seasonal scale, the average LST and air temperature in the lake-group region were higher than those in the non-lake area in winter; (2) On a daily scale, the average LST and air temperature in the lake-group region were higher than those in the non-lake area during the nighttime; (3) In the lake area, the average minimum temperature and daily minimum temperature during the coldest month were higher, though the average maximum and daily maximum temperatures of the hottest month were lower. The following discussion will focus on the warm island effect.

4.2. Reasons for the Warm Island Effect

The difference in microclimates between the lake and the surrounding land is the result of different underlying surfaces. Lakes have very different radiative and thermal properties than soil [31,32,33]. The lake surface reflectance is smaller than that of the land surface; the radiation absorbed by the water surface is more than the net radiation absorbed by the land surface which is confirmed. Liang et al. (2020) analysed the annual variation characteristics of monthly net radiation from both land and lake stations in the hinterland of the BJD (Figure 8); they found that the net radiation at the lake station (E1) was much higher than that of the land station (E2). The total annual net radiation of the E1 station (2937.5 MJ/m2) was more than twice that of the E2 station (1340.3 MJ/m2); the difference was larger in summer and smaller in winter [11]. The Tengger Desert is adjacent to the BJD; thus, its radiation status should be similar. The absolute value of the radiation difference must be supplemented with field observations in future studies. During the warmer seasons, lakes absorb more net radiation than the land. However, due to the greater depth of solar radiation penetrating into the water, the strong turbulent-mixing effect of the water body makes the heat spread more widely throughout the water, and the water has a large heat storage capacity due to its elevated heat capacity. In addition, lake evaporation consumes a lot of heat energy, so lake surfaces warm more slowly than land surfaces–whereas in the cooler seasons, the heat energy is released from the water. Lake surfaces cool more slowly than land surfaces [30]; the lakes act as heat sinks that absorb and accumulate heat flux from the atmosphere during warm seasons, then act as heat sources that release heat through underwater turbulent exchange and heat exchange between the lake surface and the atmosphere during cold seasons. This leads to cooler summer and warmer winter temperatures in the areas around lakes [34]. In addition, the daily and annual temperature range is reduced; the maximum temperature is reduced and the minimum temperature is increased.
The warm island effect is not only produced by surface effects, but also may be related to the heat source contribution of deep groundwater. Travertine can be formed by groundwater; Dong et al. (2011) found that extensively distributed travertine deposits were found near a large number of ascending springs, on the shores of lakes, and even at the bottom of some lakes in the southeastern lake area of the BJD [16]. Hu et al. (2015) and Ma et al. (2015) found that the net radiation was less than the sum of the sensible heat flux and latent heat flux on the lake surface in the hinterland of the BJD [3,35]. This implies that other energy supplies to the lake cannot be ignored. Zhang et al. (2016) found that the spring water temperature of the BJD in January 2014 was much higher than the soil and atmospheric temperatures [9]. Groundwater has a warming effect on lakes. The Tengger Desert and BJD are located adjacent to each other in the arid desert area of northwestern China and are only separated by the Yabulai Mountains. As in the BJD, most lakes in the northeastern Tengger Desert are supplied by spring water [17,21,25,36]. Furthermore, Dong et al. (2011) also found widely distributed travertine in the Tengger Desert, the appearance and texture of which are very similar to those of the travertine observed in the BJD [16]. Thus, groundwater recharge of the lakes could import heat from groundwater, substantially contributing to the warm island effect in the Tengger Desert. Owing to a lack of data, the influence of groundwater in this region should to be investigated in future studies.

4.3. Universality and Particularity of the Warm Island Effect

The thermal effect of lakes does not only exist in arid regions. For example, the Great Lakes provide a significant source of warmth to the atmosphere during colder seasons [37,38,39]. Saaroni et al. (2000) also showed that a water body preserves heat in the winter and at night, and reduces the temperature in hot seasons and during the daytime [4]. Zhao et al. (2010) used a non-hydrostatic mesoscale model (RAMS) to show that a warm island effect occurs at the Jiefangcun reservoir [40]. Near lakes, the daily and annual ranges of near-surface air temperatures are reduced [38,41]. Lakes generally reduce the maximum temperature and increase the minimum temperature throughout the year [42,43]. Thus, the thermal effect of lakes exists globally, caused by the universal nature of the material properties of lake surfaces. For the lake area in the Tengger Desert, the warm island effect is not only affected by the lake surfaces, but also may exhibit large heat contributions from the groundwater. This provides a scientific basis for studying the sources of lakes in this desert area.

4.4. Difference between the Warm Island Effects of the Two Deserts

The temperature difference between the lake-group region and the non-lake area is known as the intensity of the warm island effect. The intensity of the warm island effect varies with the areal extents, depths, and shapes of the lakes. In addition, the velocity and direction of the winds, whether winter ice forms on the lakes, the surrounding topography, and the regional climate of the lakes potentially affect the intensity of the warm island effect. Studies have shown that the larger the lake surface and the deeper the lake water, the stronger the heating effect and range of influence [44,45]. Lakes in the Tengger Desert and the BJD differ greatly in area, water depth, and morphological characteristics. The Tengger Desert contains mostly irregularly shaped, shallow, grassy lakes with no or small areas of water accumulation, while the lakes in the BJD are wider, deeper, and have more regular shapes [17]. Thus, the two desert lakes regions have different heat storage capacities. In addition, studies have shown that the topography around the lake affects wind circulation through thermal and dynamic effects, which in turn affects the temperature [46]. The BJD lake area is surrounded by tall compound sand hills with relative heights of 200–300 m—the highest of which exceeds 430 m [47]—while the height of the tall compound sand dune chain around the Tengger desert lake area is only 50–100 m, which is much lower [21]. Thus the intensity of the warm island effect differs between the two deserts’ lake areas.

4.5. Implications

The Tengger Desert has a unique landscape that contains hundreds of lakes and sand dunes. In the past several decades, the formation of the lake group has received continuous attention from many researchers. An explanation for the source of the water in this desert is still controversial, and the origin and flow of groundwater are unclear. Current hypotheses regarding the source of lake water in this region include: (1) residual paleowater, i.e., residual water from precipitation and snowmelt in past humid periods (e.g., the mid-Holocene or the late Pleistocene) [48,49]; (2) percolation of local precipitation, i.e., the mega-dunes can collect sufficient rainfall to fill the lakes in the depressions [20]; (3) subsurface runoff from precipitation in nearby mountains, e.g., the Yabulai and Beida Mountains [50,51]; (4) faults and igneous rock outcrops may contain a large amount of deep groundwater that is free-flowing and becomes the main source of recharge for lakes and shallow groundwater [16].
The warm island effect provides a scientific basis for determining the mechanisms controlling groundwater-recharged lakes. Investigating the source of this water is of importance, as it aids in understanding the hydrologic cycle in the Tengger Desert and in the rational allocation of these water resources. Further investigation of the warm island effect is necessary in order to understand the water sources that sustain the aquifer and the lakes in the Tengger Desert.

5. Conclusions

In this study, we used remote sensing and conventional meteorological data to investigate the effect of lakes on temperature in the northeastern region of the Tengger Desert. The spatial contrasts in land surface temperatures in the lake-group region and the non-lake area located to the north, as well as the seasonal and diurnal variations in air temperature were analysed. The following conclusions were drawn: (1) On a seasonal scale, the warm island effect occurs during the winter; on a daily scale, the warm island effect occurs during the nighttime; (2) The mechanism of the warm island effect may be related to the properties of the lake surfaces, as well as heat contributions from groundwater; (3) There is a difference in the intensities of the warm island effect between the Tengger Desert and the BJD lake areas, which is closely related to lake size, depth, shape, and the terrain surrounding the lake area.
This study has important implications for the water source that recharges the lakes. However, the air temperature study period was only one year. Due to a lack of data, the magnitude of the effect of groundwater on the warm island effect is unclear. Further hydrometeorological observations should be conducted to investigate the effect of groundwater on the warm island effect, and to understand the water cycle and recharge mechanisms of the lake groups in the Tengger Desert.

Author Contributions

N.W. proposed the idea and designed the study. L.Z. contributed to the field work. Z.N. and X.L. implemented the methods. N.M. analyzed the results and wrote the main manuscript text. X.Y., P.W. and X.S. helped analyze the results. All authors have read and agreed to the published version of the manuscript.

Funding

This research was funded by the Project of National Natural Sciences Foundation of China (Grant No. 41871021) and Fundamental Research Funds for the Central Universities (Grant No. lzujbky-2021-sp16).

Institutional Review Board Statement

Not applicable.

Informed Consent Statement

Not applicable.

Data Availability Statement

Not applicable.

Conflicts of Interest

The authors declare no conflict of interest.

References

  1. Huo, W.; Zhi, X.F.; Yang, L.M.; Ali, M.; Zhou, C.L.; Yang, F.; Yang, X.H.; Meng, L.; He, Q. Research progress on several problems of desert meteorology. Trans. Atmos. Sci. 2019, 42, 469–480. [Google Scholar]
  2. Labraga, J.C.; Villalba, R. Climate in the monte desert: Past trends, present conditions, and future projections. J. Arid Environ. 2009, 73, 154–163. [Google Scholar] [CrossRef]
  3. Ma, L.; Wang, N.A.; Huang, Y.Z.; Li, H.Y.; Lu, J.W. Characteristics of Radiation Budget and Energy Partitioning on Land and Lake Surface under Different Summer Weather Conditions in the Hinterland of Badain Jaran Desert. J. Nat. Res. 2015, 30, 796–809. [Google Scholar]
  4. Saaroni, H.; Ben-Dor, E.; Bitan, A.; Potchter, O. Spatial distribution and microscale characteristics of the urban heat island in Tel-Aviv, Israel. Landsc. Urban Plan. 2000, 48, 1–18. [Google Scholar] [CrossRef]
  5. Memon, R.A.; Leung, D.; Liu, C. A review on the generation, determination and mitigation of urban heat island. J. Environ. Sci. 2008, 20, 120–128. [Google Scholar]
  6. Su, C.X.; Hu, Y.Q.; Zhang, Y.F.; Wei, G.A. The microclimate character and “cold island effect” over the oasis in Hexi region. Chin. J. Atmos. Sci. 1987, 11, 390–396. [Google Scholar]
  7. Su, C.X.; Hu, Y.Q. Cold island effect over oasis and lake. Chin. Sci. Bull. 1987, 33, 1023–1026. [Google Scholar]
  8. Hu, Y.Q.; Su, C.X.; Zhang, Y.F. Research on the microclimate characteristics and cold island effect over a reservoir in the Hexi Region. Adv. Atmos. Sci. 1988, 5, 117–126. [Google Scholar] [CrossRef]
  9. Zhang, X.H.; Wang, N.A.; Li, Z.L.; Wu, Y.; Liang, X.Y. Spatial distribution of winter warm islands in Badain Jaran Desert based on MODIS data. J. Lanzhou Univ. (Nat. Sci.) 2015, 51, 180–185. [Google Scholar]
  10. Deng, X.B. Spatiotemporal Changes of Warm Island in Badain Jaran Desert and Its Influencing Factors; Lan Zhou University: Lanzhou, China, 2018; pp. 21–35. [Google Scholar]
  11. Liang, X.Y. Research on Warm Island Effect in Badain Jaran Desert Based on Observation Data; Lan Zhou University: Lanzhou, China, 2016; pp. 13–21. [Google Scholar]
  12. Liang, X.Y.; Zhao, L.Q.; Niu, Z.M.; Meng, N.; Wang, N.A. Warm Island Effect in the Badain Jaran Desert Lake Group Region Inferred from the Accumulated Temperature. Atmosphere 2020, 11, 153. [Google Scholar] [CrossRef] [Green Version]
  13. Liang, X.Y.; Zhao, L.Q.; Xu, X.B.; Niu, Z.M.; Wang, N.A. Plant phenological responses to the warm island effect in the lake group region of the Badain Jaran Desert, northwestern China. Ecol. Inform. 2020, 57, 101066. [Google Scholar] [CrossRef]
  14. Zhao, L.Q.; Yu, X.R.; Zhang, W.J.; Liang, X.Y.; Wang, N.A.; Cai, W.J. Warm island effect observed in lake areas of the Badain Jaran Desert, China. Weather 2021, in press. [Google Scholar]
  15. Zhang, H.C.; Ma, Y.Z.; Li, J.J.; Cao, J.X. Ancient lake and environment in Tengger Desert, 42–18 ka ago. Chin. Sci. Bull. 2002, 47, 1847–1857. [Google Scholar]
  16. Dong, C.Y. Observation Experiment of the Water Cycle and Lake Water Balance in Alxa Desert; Lan Zhou University: Lanzhou, China, 2011; pp. 46–52. [Google Scholar]
  17. Lai, T.T.; Wang, N.N.; Huang, Y.Z.; Zhang, J.M.; Zhao, L.Q. Seasonal changes of lakes in Tengger Desert of 2002. J. Lake Sci. 2012, 24, 957–964. [Google Scholar]
  18. Dong, Z.B.; Zhang, Z.C.; Zhao, G.A. Characteristics of wind velocity, Temperature and Humidity Profiles of Near-surface Layer in Tengger Desert. J. Desert. Res. 2009, 29, 977–981. [Google Scholar]
  19. Zhang, Z.C.; Dong, Z.B.; Wen, Q.; Jiang, C.W. Wind regimes and aeolian geomorphology in the western and southwestern Tengger Desert, NW China. Geol. J. 2015, 50, 707–719. [Google Scholar] [CrossRef]
  20. Zhao, J.B.; Yu, K.K.; Shao, T.J. A Preliminary Study on the Water Status in Sand Layers and Its Sources in the Tengger Desert. Resour. Sci. 2011, 33, 259–264. [Google Scholar]
  21. Wu, Z. Desert and Its Control in China; Science Press: Beijing, China, 2009; pp. 562–568. [Google Scholar]
  22. Wan, Z. New refinements and validation of the collection-6 modis land-surface temperature/emissivity product. Remote Sens. Environ. 2014, 140, 36–45. [Google Scholar] [CrossRef]
  23. Wang, W.C.; Yang, X.X.; Yao, T.D. Evaluation of ASTER GDEM and SRTM and their suitability in hydraulic modelling of a glacial lake outburst flood in southeast Tibet. Hydrol. Process. 2012, 26, 213–225. [Google Scholar] [CrossRef]
  24. Wang, N.A.; Li, Z.L.; Cheng, H.Y.; Li, Y.; Huang, Y.Z. Re-discussion on the Late Quaternary High Lake Surface and Great Lake Period of the Alxa Plateau. Chinese. Sci. Bull. 2011, 56, 1367–1377. [Google Scholar]
  25. Yan, C.Z.; Li, S.; Lu, J.F. Lake number and area in the Tengger Desert during 1975–2015. J. Desert Res. 2020, 40, 183–189. [Google Scholar]
  26. Li, M.; Wang, X.L.; Ding, Y.Y. Comparison of several daily temperature interpolation methods. J. Anhui Agric. Sci. 2014, 42, 8670–8674. [Google Scholar]
  27. Fu, B.P. Mountain Climate; Science Press: Beijing, China, 1983; p. 1. [Google Scholar]
  28. Khandelwal, S.; Goyal, R.; Kaul, N.; Mathew, A. Assessment of land surface temperature variation due to change in elevation of area surrounding Jaipur, India. Egypt. J. Remote Sens. 2017, 21, 87–94. [Google Scholar]
  29. Thanh, P.; Martin, K.; Trong, T. Land surface temperature variation due to changes in elevation in northwest Vietnam. Climate 2018, 6, 28. [Google Scholar]
  30. Bonan, G.B. Sensitivity of a GCM Simulation to Inclusion of Inland Water Surfaces. J. Chem. Ecol. 1995, 8, 2691–2704. [Google Scholar] [CrossRef]
  31. Anyah, R.O.; Semazzi, F. Idealized simulation of hydrodynamic characteristics of Lake Victoria that potentially modulate regional climate. Int. J. Climatol. 2009, 29, 971–981. [Google Scholar] [CrossRef]
  32. Mackay, M.D.; Neale, P.J.; Arp, C.D.; Domis, L.N.D.S.; Fang, X.; Gal, G. Modeling lakes and reservoirs in the climate system. Limnol. Oceanogr. 2009, 54, 2315–2329. [Google Scholar] [CrossRef] [Green Version]
  33. Sharma, A.; Hamlet, A.F.; Fernando, F. Lessons from Inter-Comparison of Decadal Climate Simulations and Observations for the Midwest U.S. and Great Lakes Region. Atmosphere 2019, 10, 266. [Google Scholar] [CrossRef] [Green Version]
  34. Long, Z.; Perrie, W.; Gyakum, J.; Caya, D.; Laprise, R. Northern Lake Impacts on Local Seasonal Climate. J. Hydrometeorol. 2007, 8, 881–896. [Google Scholar] [CrossRef] [Green Version]
  35. Hu, W.F. Research on Water-Heat Exchange between Land and Air in Badain Jaran Desert Based on Observation; LanZhou University: LanZhou, China, 2015; pp. 79–83. [Google Scholar]
  36. Zhang, W.W.; Cheng, G.E.; Gao, Y. Characteristics of desert lakes and their protection in Inner Mongolia. J. Inner Mong. Agric. Univ. 2006, 27, 11–14. [Google Scholar]
  37. Scott, R.W.; Huff, F.A. Lake Effects on Climatic Conditions in the Great Lakes Basin; Illinois State Water Survey: Champaign, IL, USA, 1997; p. 73. [Google Scholar]
  38. Notaro, M.; Holman, K.D.; Zarrin, A.; Vavrus, V.; Fluck, E. Influence of the Laurentian Great Lakes on Regional Climate. J. Clim. 2013, 26, 789–804. [Google Scholar] [CrossRef] [Green Version]
  39. Dobson, K.C.; Beaty, L.E.; Rutter, M.A.; Hed, B.; Campbell, M.A. The influence of Lake Erie on changes in temperature and frost dates. Int. J. Climatol. 2020, 40, 5590–5598. [Google Scholar] [CrossRef]
  40. Zhao, L.; Chen, Y.C.; Lv, S.F.; Meng, X.H.; Li, W.L.; Li, J.L. Simulation of Hydrometeorological Effect of Jiefangcun Reservoir in Jinta Oasis Summer. Plateau Meteorol. 2010, 29, 1414–1422. [Google Scholar]
  41. Nikoo, E.; Susanne, G.C.; Hagen, K.; Reik, D.; Jan, V. Effects of the Lak Sobradinho Reservoir (Northeastern Brazil) on the Regional Climate. Climate 2017, 5, 50. [Google Scholar]
  42. Bates, G.T.; Giorgi, F.; Hostetler, S.W. Toward the Simulation of the Effects of the Great Lakes on Regional Climate. Mon. Weather Rev. 1993, 121, 1373–1387. [Google Scholar] [CrossRef]
  43. Wen, L.J.; Lv, S.; Li, Z.G.; Zhao, L.; Nagabhatla, N. Impacts of the Two Biggest Lakes on Local Temperature and Precipitation in the Yellow River Source Region of the Tibetan Plateau. Adv. Meteorol. 2015, 2015, 248031. [Google Scholar] [CrossRef] [Green Version]
  44. Momii, K.; Ito, Y. Heat budget estimates for Lake Ikeda, Japan. J. Hydrol. 2008, 361, 362–370. [Google Scholar] [CrossRef]
  45. Dutra, E.; Stepanenko, V.A.; Balsamo, G.; Viterbo, P.; Miranda, P.M.A.; Mironov, D. An offline study of the impact of lakes on the performance of the ECMWF surface scheme. Boreal Environ. Res. 2010, 15, 100–112. [Google Scholar]
  46. Stivari, S.M.S.; Oliveira, A.P.; Karam, H.A.; Soares, J. Patterns of local circulation in the Itaipu Lake area: Numerical simulations of lake breeze. J. Appl. Meteorol. 2003, 42, 3750. [Google Scholar] [CrossRef]
  47. Shao, T.J.; Zhao, J.B.; Dong, Z.B. Water Chemistry of the Lakes and Groundwater in the Badain Jaran Desert. Acta Geogr. Sin. 2011, 66, 662–672. [Google Scholar]
  48. Edmunds, W.; Ma, J.; Aeschbachhertig, W.; Kipfer, R.; Darbyshire, D. Groundwater recharge history and hydrogeochemical evolution in the minqin basin, north west china. Appl. Geochem. 2006, 21, 2148–2170. [Google Scholar] [CrossRef]
  49. Ding, Z.; Ma, J.Z.; Zhao, W.; Jiang, Y.; Love, A.J. Profiles of geochemical and isotopic signatures from the Helan Mountains to the eastern Tengger Desert, northwestern China. J. Arid Environ. 2013, 90, 77–87. [Google Scholar] [CrossRef]
  50. Ma, J.Z.; Wang, X.S.; Edmunds, W.M. The characteristics of ground-water resources and their changes under the impacts of human activity in the arid Northwest China—A case study of the Shiyang River Basin. J. Arid Environ. 2005, 61, 277–295. [Google Scholar] [CrossRef]
  51. Gates, J.B.; Edmunds, W.M.; Ma, J.; Scanlon, B.R. Estimating groundwater recharge in a cold desert environment in northern China using chloride. Hydrogeol. J. 2008, 16, 893–910. [Google Scholar] [CrossRef]
Figure 1. (a) Study area and distribution of meteorological stations in Tengger Desert and (b) lake-group region located in the northeastern region.
Atmosphere 12 01157 g001
Figure 2. Distribution of average LST during the daytime and nighttime in the lake and non-lake areas from 2003 to 2018.
Atmosphere 12 01157 g002
Figure 3. Distributions of average LST during the daytime in the lake and non-lake areas.
Atmosphere 12 01157 g003
Figure 4. Distributions of average LST during the nighttime in the lake and non-lake areas.
Atmosphere 12 01157 g004
Figure 5. Elevation of the area as derived from ASTER data (a), resampled ASTER image of area (b).
Atmosphere 12 01157 g005
Figure 6. Annual temperature changes (a), monthly mean differences (b) in the lake and non-lake regions.
Atmosphere 12 01157 g006
Figure 7. Daily temperature changes in the lake and non-lake areas.
Atmosphere 12 01157 g007
Figure 8. Seasonal net radiation of E1and E2 stations in BJD (Liang et al. 2020).
Atmosphere 12 01157 g008
Table 1. Comparison of average LST of the lake and non-lake areas (unit: °C).
RegionAnnualSpringSummerAutumnWinter
DayNightDayNightDayNightDayNightDayNight
Lake area33.14.339.46.253.322.129.94.19.2−14.7
Non-area lake33.04.039.96.054.122.030.23.67.9−15.1
ΔT0.10.3−0.50.2−0.80.1−0.30.51.30.4
Table 2. Comparison of temperature characteristics between lake and non-lake areas (unit: °C).
SiteTaveTmin (January)Tmax (July)Annual Temperature RangeDiurnal Temperature Range
JanuaryAprilJulyOctoberAnnualAverage Daily AverageDaily
Barunjilang−6.712.526.29.710.4−13.9−21.632.141.032.913.2
Baxinggaole−9.412.226.79.19.6−17.6−25.132.942.236.115.8
ΔT2.70.3−0.50.60.83.73.5−0.8−1.2−3.2−2.6
Table 3. Comparison of day and night temperatures in the year and in winter between lake and non-lake areas (unit: °C).
SiteAnnualSpringSummerAutumnWinter
DayNightDayNightDayNightDayNightDayNight
Barunjilang12.97.815.410.328.723.611.77.5−4.3−9.1
Baxinggaole12.86.515.79.129.424.011.86.0−6.3−12.4
ΔT0.11.3−0.31.2−0.7−0.4−0.11.52.03.3
Publisher’s Note: MDPI stays neutral with regard to jurisdictional claims in published maps and institutional affiliations.

