
Review of User-Friendly Models to Improve the Urban Micro-Climate


1
Independent Researcher, 38106 Braunschweig, Germany
2
Climatology and Hydrology Research Centre, Faculty of Sciences, University of Novi Sad, Trg Dositeja Obradovića 3, 21000 Novi Sad, Serbia
3
Department of Architecture and Planning, Indian Institute of Technology, Roorkee 247667, India
*
Author to whom correspondence should be addressed.
Atmosphere 2021, 12(10), 1291; https://0-doi-org.brum.beds.ac.uk/10.3390/atmos12101291
Submission received: 3 September 2021
/
Revised: 27 September 2021
/
Accepted: 28 September 2021
/
Published: 3 October 2021
(This article belongs to the Special Issue Outdoor Thermal Comfort in Cities: Assessing and Developing Green, Blue and Grey Solutions for Healthy and Sustainable Urban Future)
Abstract
:Various micro-scale models for comparing alternative design concepts have been developed in recent decades. The objective of this study is to provide an overview of current user-friendly micro-climate models. In the results, a vast majority of models identified were excluded from the review because the models were not micro-scale, lacking a user-interface, or were not available. In total, eight models met the seven-point inclusion criteria. These models were ADMS Temperature and Humidity model, advanced SkyHelios model, ANSYS FLUENT, ENVI-met, RayMan, SOLWEIG, TownScope, and UMEP. These models differ in their complexity and their widespread use in the scientific community, ranging from very few to thousands of citations. Most of these models simulate air temperature, global radiation, and mean radiant temperature, which helps to evaluate outdoor thermal comfort in cities. All of these models offer a linkage to CAD or GIS software and user support systems at various levels, which facilitates a smooth integration to planning and design. We detected that all models have been evaluated against observations. A wider model comparison, however, has only been performed for fewer models. With this review, we aim to support the finding of a reliable tool, which is fit for the specific purpose.
1. Introduction
With global climate change, making cities climate-proof has become increasingly critical. The form and design of cities effect the outdoor thermal micro-climate, by influencing the micrometeorological variables—air temperature, humidity, solar radiation, and wind speed and direction [1]. Different factors, such as urban morphology [2,3], amount of vegetation, and water bodies (e.g., [4,5]), surface materials (e.g., [6,7]), and ventilation (e.g., [8]), are decisive in determining outdoor thermal comfort. An understanding of the micro-scale is therefore imperative to facilitate climate-sensitive city planning and design.
A substantial body of knowledge focusing on methods to optimize the outdoor thermal climate in cities has been developed in recent decades [4,9]. A huge gap, however, continues to exist between scientific knowledge on climate-sensitive city design and its implementation in practice [10,11]. A wider practical implementation of urban climate knowledge is limited to only a few cities [1,11].
Numerical models are essential tools for analyzing urban climate for engineers, architects, urban planners, and policymakers. This is because climate-sensitive urban planning needs to be predictive to account for different urban forms and climates [12]. Numerical models enable built environment professionals to compare different urban design alternatives [13]. Also, numerical models have the potential to simulate the study areas under varying meteorological conditions. The development of simulation models can thus provide suitable urban planning measures based on the knowledge of urban human biometeorology [14].
Recent years have witnessed an increased research interest in urban climate at varied spatial scales [15]. Numerical models can be broadly categorized into three categories on the basis of spatial scale [16];
- Building-scale models focus on isolated buildings, thermal comfort, indoor air quality, etc. These Building Energy Models (BEM) (e.g., EUReCA [17]) are based on energy balance applied to the building volume;
- Micro-scale models focus on the neighborhood scale and are mostly used in thermal comfort studies. The interaction between the building and its surroundings is the basis of the development of microclimate models. Different model types ranging from simple geometrical models to complex Computational Fluid Dynamic (CFD) and Large Eddy Simulation (LES) models can be categorized to micro-scale models. These models are mostly utilized by scientists and architects; and
- City-scale models are much coarser in resolution and are used to evaluate urban scale policies to mitigate heat island effects. For parameterization of various urban features, such as vegetation and building density at the meso-scale, single- and multi-layer urban canopy models are often applied [18].
This article focuses on the urban micro-scale models that simulate outdoor thermal comfort. Depending on the scope, these models usually investigate the effect of different parameters, such as building orientation, street canyon aspect ratio, surface materials, vegetation, and tree planting on the calculation of surface convection, pedestrian comfort, or urban ventilation [16].
Among many other reasons, the lack of user-friendly models for evaluating the effect of different urban design decisions impedes the incorporation of urban climate knowledge in the design process [19]. Many models are too complicated to be used by related research in built environment studies. More simplified tools are required for local city administration and outside of academia [19]. Moreover, obtaining an overview of current models usable in urban planning has been cumbersome because the information is spread across numerous individual and highly specialized articles.
While the authors are not aware of a review study about the user-friendly micro-climate models, review studies have been published for other related research questions regarding micro-scale models for climate design: ref. [16] reviewed studies that simulate various aspects of urban heat island using building energy, micro-climate or meso-scale models. Ref. [11] provided summarized information on urban climate models from city to building scale that can be used to support the implementation of urban climate knowledge into practice. They focused on different types of models and simulations, such as CFD or statistical models rather than on a complete list of examples. Ref. [20] reviewed different indices and software to assess human outdoor comfort and heat stress. They focused on the different ways to assess human thermal comfort using different types of indices. Software to calculate outdoor human comfort was just a smaller part of the review. A review about CFD models in urban micro-climate has been done by [13]. Ref. [21] reviewed the capabilities of available tools for evaluating the interrelations between microclimate, outdoor comfort, energy demand, and systems in urban areas.
These reviews provide an overview and partly critical assessment of the available models. Many of the reviewed models, however, are too complicated and require programming skills or large computational resources. This impedes the much-needed transfer from science to practice and the related field of science. In order to facilitate the usage of micro-climate models also by experts from practice in business or administration additional features, i.e., linkage to Computer Aided Design (CAD) or Geographic Information System (GIS) software is needed.
The objective of this study is to fill this gap and provide an overview of the current models for micro-climate in cities that are user-friendly and usable without extensive computational resources and advanced programming skills. This paper helps to find suitable and easy-to-use models for applied urban climate studies. Therefore, firstly, we identified urban climate models that are easy to use (provide a user interface), can predict the effects of design decisions (e.g., different options for buildings and/or surfaces), and cover the thermal aspects of urban climate.
Secondly, we reviewed the models based on general features and simulated variables, supported data formats, linkage to GIS and CAD software, evaluation studies available and the number of publications using the model. Furthermore, we present an overview about the availability of support and evaluation studies. Additionally, this review also identified the possible drawbacks of micro-climate models based on wider application and provided basic information that can give potential users a quick start in finding a suitable tool.
2. Materials and Methods
We conducted a literature review in order to identify user-friendly micro-climate models based on four steps: 1. identification, 2. pre-screening, 3. Eligibility-screening, and 4. full-review (Figure 1)
2.1. Identification and Pre-Screening
To identify relevant models, we searched the databases Web of Science and Science Direct for relevant peer-reviewed articles using the keywords ((MODEL OR TOOL) AND (“URBAN CLIMATE” OR MICROCLIMATE OR MICRO-CLIMATE)). The search was additionally supplemented with a search on Google Scholar in order to enhance our search for models. The main research was conducted in the year 2020.
In total, 6335 studies were identified in Web of Science and Science Direct using the above-mentioned keywords (Figure 1). Identified articles were thereafter pre-screened based on abstract and title. Each of the three co-authors conducted the pre-screening for a third of the articles and attributed possible eligible models to be included in the eligibility screening process independently. In the pre-screening, we identified 54 models mentioned in the papers that could be potentially eligible.
2.2. Eligibility-Screening
For the eligibility screening, we checked if the models identified by the pre-screening fulfill the identified seven-point criteria. The eligibility criteria consisted of focuses on user friendliness; urban micro and local scale and usability in further studies. The seven-point criteria defined for model inclusion in this study encompasses the following key aspects:
- Peer-reviewed: The included models are published and introduced in peer-reviewed literature focusing on thermal or ventilation aspects of the micro-climate or urban climate listed in Web of Science and/or Science Direct. Models described comprehensively only in conference papers were not included. Also, models whose application is presented in peer-reviewed literature without description pertaining to the underlying basics such as formulae and concepts were excluded. This criterion also serves as proxy for the quality and reliability of the model.
- Urban Climate: The included models simulate and account for built-up and urban environments. Models that only simulate natural components were not considered.
- Micro-scale: Only models that simulate the micro-scale and resolve buildings explicitly (not parameterized) are considered.
- Worldwide application: The models included needed to have the ability to be used in different cities and across different climatic contexts globally. They should not be specifically tailored to one city, region, or country.
- Simulate outdoor thermal comfort: The included models simulate or estimate the outdoor bioclimate in terms of at least one of the following variables: air temperature (Ta), surface temperature (Ts), mean radiant temperature (Tmrt), or thermal comfort indices (e.g., PET, UTCI).
- User-friendly: The eligible models are user-friendly, i.e., provide a user interface and can be used on regular Windows PC without extensive computational resources.
- Availability: The models are currently available to download, purchase, and subscribe to. The models that are not supported or not provided any longer were excluded.
The definition of these criteria enabled targeting models applicable in varied fields of urban climatology worldwide.
The 54 recognized models were thereafter divided into three groups and thus reviewed by the three authors separately. Representative papers (e.g., intro papers) for these models were assessed in detail in order to check the fulfillment of the above-mentioned seven-point inclusion criteria. During the pre-screening process, if one criterion was not fulfilled, the eligibility screening was aborted and the model (and associated papers) was excluded from full review. Continuous deliberation and validation between the co-authors brought forth comparable review results. On the basis of the review results, the authors found that 46 models did not fulfill the seven-point eligibility criteria (Table 1) indicated above.
It is crucial to note that the seven-point criteria applied do not present a valuation or assessment of the models. Models that are excluded on the basis of the criteria defined might still be valuable for various other approaches (see Appendix A). They are, however, beyond the scope of this paper.
2.3. Full Review
In the following full review, research and review articles as well as technical reports, companies and research institutes’ web pages were also reviewed. This facilitated gathering of additional information related to availability and support. The results have been discussed and double-checked by all the co-authors.
For the full review, we considered the whole model development and not only the newest version of the respective model. Only for the model SkyHelios the newest version, called “Advanced SkyHelios”, was differentiated, because the former version was not found to be eligible according to the review criteria.
3. Results and Discussion
3.1. Results of the Pre-Screening
A vast majority of models identified in the pre-screening process did not fulfill the above-defined seven-point inclusion criteria, i.e., 46 models were thus excluded from further analysis. The prime reasons for model exclusion pertained to the model not being a micro- or local scale model; lacking a user interface or not being available for download (see Table 1 for more details). The authors, however, concur that some of the excluded models might still be interesting for the target users. A brief description of some of the most relevant excluded models is offered in Appendix A.
Unfortunately, many interesting models, such as QUIC EnvSim [54], SUNTool [65], SPOTE [62], or Umsim [73], that seem to fall in the scope of this review were not available any longer and the authors were not able to get access to the codes. This was probably due to research projects with only short-term funding.
3.2. Results of the Full Review
In total, the eight models that met the seven-point inclusion criteria are discussed in further detail. Table 2 gives an overview of the models.
The models have different features as the different simulated variables and bioclimatic indices indicate. The models used different data formats that can be considered as common such as .txt, .shp, or ones specific to this software. Remarkable was the huge variety between the citations of the models ranging from very few into thousands, which might show how widely the models are known in the scientific community.
Most of the models included in this review have been developed in Europe: ADMS (Great Britain), advanced SkyHelios, ENVI-met, RayMan (Germany), SOLWEIG (Sweden), TownScope (Belgium), and UMEP (Sweden, Great Britain). Only the very general model ANSYS FLUENT originates from the USA. A short description of the included models is given in the following paragraphs.
3.2.1. ADMS Temperature and Humidity Model (ADMS-TH)
The ADMS Temperature and Humidity (ADMS-TH) Model is a supplement to the ADMS-Urban, which is a version of the Atmospheric Dispersion Modelling System (ADMS) designed with a focus to simulate dispersion in simple and complex urban scenarios. The ADMS model is based on the Monin–Obukhov similarity theory for boundary layer processes [76]. The ADMS-TH model calculates local heat flux and temperature perturbations based on the upwind temperature due to spatial variability of land use parameters in urban area [22,76]. It is developed and published by the Cambridge Environmental Research Consultants (CERC). The ADMS-Urban model is mainly used for assessing and modeling air quality [84,85], which is not the focus here.
The ADMS-TH was developed and described in detail by [22]. The model was used to study neighborhood air temperature and humidity patterns within the LUCID project [52,86,87]. ADMS-TH is able to run at the street and building-resolving scale of a few meters, but can also be applied to simulate complete cities, such as London, as in LUCID Project [52]. ADMS-TH is also able to simulate the cooling effects of vegetation and albedo changes, as studied for different scenarios of green and cool roofs in London by [87]. Benefits of the ADMS modeling system is wide field of possible applications and research questions. This, however, goes along with the requirements of the extensive and detailed input data and more complexity.
3.2.2. Advanced SkyHelios Model
The advanced SkyHelios model is a simple and user-friendly diagnostic model that simulates Tmrt, PT, PET, and UTCI in complex urban environments [23]. The advanced SkyHelios model has been developed by adding new features to SkyHelios and can be seen as an advancement on the RayMan model [23]. SkyHelios uses graphic processors which can be integrated into simulation, e.g., visualization of Sky View Factor (SVF) or radiation estimation [23]. Since Tmrt and wind speed are difficult to measure in urban areas, a three-dimensional diagnostic model has been integrated into SkyHelios [88]. The model comprises of updated parameterization in terms of upwind wind cavity and improved street canyon vortices after [89]. The wind model can thus be used to predict spatially resolved wind speed and direction. By combining information pertaining to radiation and wind, SkyHelios can estimate thermal indices such as PT, UTCI, and PET at a spatially resolved high resolution [88].
While large model areas are possible, the main calculation is done for small areas of interest. SkyHelios is characterized by the following positives, which include short computing time and low costs due to the use of open-source frameworks.
3.2.3. Ansys Fluent
ANSYS FLUENT is a commercial CFD model that has been used to model flow, turbulence, and heat transfer for various tasks for decades [25]. Ansys offers the Ansys Solar Load Model that accounts for isotropic diffuse radiation [79]. Ansys FLUENT can be used on Linux or Windows PC, but cloud computing options are also offered by the company [90]. ANSYS FLUENT is very often used in other fields of research such as thermal and chemical engineering, where the overwhelming number of publications lies (based on the Science Direct research in Table 2). ANSYS FLUENT offers a user interface with many options for adapting and adjusting simulations, but can also be used as a batch and with command lines [90].
Among others, ANSYS FLUENT has been used to study UHI mitigation measures and design decisions [77,91], dispersion of air pollution [92], and in combination with other simulation tools, e.g., to simulate multi-scale urban wind flows by coupling with the mesoscale model WRF [93] or to simulate the park cool island effect by coupling with a thermal model [94]. ANSYS is one of few CFD-models with a user-interface that has been applied to micro-climate studies. Despite its user-interface, ANSYS is, like all CFD-models, sophisticated and users require at least a fundamental understanding of the modelling system.
3.2.4. ENVI-Met
ENVI-met is recognized as the most often used model for micro-climate studies in this review (see Table 2). It has been developed by [39] and several new versions have been released since then. ENVI-met is a three-dimensional, prognostic model designed to simulate the surface–vegetation–air–interactions in the urban environment. It consists of the following sub models: 1D boundary model, 3D atmospheric model, soil model, and vegetation model. ENVI-met is used for various research questions regarding the effects of vegetation, water, albedo, position, material, shading, transpiration, and pollutant dispersion in urban design decisions (e.g., [95]).
Despite its user-friendly interface, ENVI-met is a sophisticated full climate model with the necessary underlying complexity. To successfully apply ENVI-met, at least basic knowledge about computational modeling and atmospheric processes is required. Without the knowledge, the model might become unstable or produce unreasonable results. Due to the complexity, simulations can be very time-consuming. Running a 24 h simulation for an area of 250 × 250 × 30 grid cell can easily take up to one week or more processing time on an up-to-date PC [96].
While many of the known limitations of the models have been overcome, [78] still mentioned several weak points in version v4.0. Among others, there were calculations of radiation fluxes, tendency to over-estimate the turbulent production in high acceleration areas, static cloud, and wind conditions during the simulation period.
3.2.5. RayMan
RayMan calculates the radiation fluxes and biometerological indices and takes complex structures into account [55,79]. It follows a diagnostic approach to be time-independent and requires limited meteorological inputs. The model has been developed in accordance with the German VDI-Guidelines 3789 and VDI-3787 [79]. For the simulation of the short- and long-wave radiant flux densities, RayMan divides the three-dimensional environment into an upper and a lower half space with a parting plane at the human–bio meteorological reference height of 1.1 m [14].
The model requires data pertaining to air temperature, humidity, wind speed, and short- and long-wave radiation fluxes as well as activity and clothing data for computing PET. RayMan allows users the opportunity of free drawing of urban structures (buildings, deciduous and coniferous trees).
RayMan provides diverse opportunities in applied climatology for research and education. With the available climate or meteorological data, thermal indices for simple and complex environments can be estimated. RayMan is a very simple and easy-to-use model. RayMan, however, only enables spot-related simulation of radiant flux densities and thermo-physiological assessment indices.
3.2.6. SOLWEIG
SOLWEIG is a radiation model capable of simulating spatial variations of 3D radiation fluxes and Tmrt in complex urban settings. The model requires a limited number of inputs: direct, diffuse, and global short-wave radiation, Ta, RH, urban geometry, and geographical information (e.g., latitude, longitude, and elevation). The model was developed by [61]. In 2011, a new vegetation scheme was included in SOLWEIG [97].
One of the advantages of this model is that the software copes well with the low sun elevation angles when calculating Tmrt. The model was used in different cities and approaches. Ref. [98] assessed the potential changes in outdoor thermal comfort in Göteborg due to climate change and the influence of urban geometry on the intra-urban differences in outdoor thermal comfort using this model. Ref. [80] analyzed Tmrt variations in the high-density subtropical urban environment of Hong Kong. Ref. [99] analyzed the effect of variations in land cover on Tmrt through a simple scheme developed in SOLWEIG. SOLWEIG was also used to analyze the influence of increasing tree cover on Tmrt in Adelaide [100], and in Vancouver, Canada [101,102]. Furthermore, [81] analyzed the influence of woody vegetation and facade orientation on Tmrt in Szeged, Hungary, by applying radiation measurements.
3.2.7. TownScope
TownScope focuses on the interactions in urban open areas based on solar computations that consider the spaces and their surrounding buildings as well as the actual 3D site where the project is positioned [67]. TownScope combines visual instruments with numerical evaluators within an urban information management system. Different solar evaluation methods are implemented in a unified model. A clear distinction between the built in 3D geometrical objects and urban entities that can be user defined is provided. The whole software has been developed with an object-oriented language—CLOS (Common Lisp Object System), to improve modularity and portability [103]). Data encoding has been limited to the minimum by utilizing [104] theoretical method for determining available hourly radiation values at an unobstructed site [67]. Spherical projections have been utilized intensively for both visualization as well as evaluation purposes [67].
TownScope provides two different data acquisition modes for 3D objects: Data import and export between TownScope and solid modelers as well as the use of direct data acquisition tools. Triangulation algorithms allow for a convenient and easy way to define ground and irregular surfaces through points or level curves [67].
Unlike other software, TownScope focuses on the urban design detail level [67]. It supports solar access decision-making in keeping with a sustainable urban design perspective. The software comprises tools that facilitate analysis pertaining to solar access, thermal comfort, sky opening, and visibility analysis. TownScope considers thermal comfort by simulating sweat rate, sweat evaporation, and skin wetness [105]. The software also facilitates direct comparison on different scenes. Lastly, another interesting application of the tool is that it can be used to determine the potential for a neighborhood’s solar heating and photovoltaic electricity production (e.g., [106]). Different studies have utilized TownScope (e.g., [67,82,83]). An advantage of TownScope is that it provides a visual and analysis tool that supports the urban design decision-making process [67]. The evaluation of solar access can be performed at any geographical location for any day of the year. The native functions for evaluating solar potential, however, are usually non-editable, which might prevent the further use of results [107].
3.2.8. UMEP
Ref. [71] introduced the Urban Multi-scale Environmental Predictor (UMEP) to the scientific community as an integrated tool for urban climate and climate-sensitive planning applications. This integrated tool for city-based climate services can be used for the analysis of outdoor thermal comfort, wind, urban energy consumption, and climate change mitigation [71]. UMEP is a coupled modeling system that is open source and can be applied for the analysis performed from the street canyon to city-scale. It consists of the following main models: the SOLWEIG model (SOlar and LongWave Environmental Irradiance Geometry model), the SUEWS model (Surface Urban Energy and Water Balance Scheme), the BLUEWS model (Boundary Layer Urban Energy Water Scheme), and the LUCY model (Large scale Urban Consumption of energY model). The tool enables users to input atmospheric and surface data, characterize the urban environment, perform simulations and use scenarios, and visualize and compare different combinations of climate indicators [71]. Advantages of an integrated system, such as UMEP, is that various research questions related to climate-sensitive urban design can be addressed with various straightforward tools within one environment, from the street canyon to city scale.
3.3. Evaluation against Observations
All of the models included in this review have been evaluated in at least one published study (Table 2). Hence, one can assume a certain quality from the simulations for the standard output variables such as Ta.
Different variables simulated by AMDS-TH have been evaluated for the Lecce, Italy, against observation with good agreement by [76].
The advanced SkyHelios model has been evaluated by the developers in Freiburg, Germany, with good results [23]. The authors did not find another peer-reviewed evaluation study of the advanced Sky Helios model. Since the model is viewed as an advancement on the popular and well-evaluated RayMan model, this absence might not be an issue. Nevertheless, additional evaluations of the model will contribute to its visibility and further development.
ANSYS FLUENT has been used for evaluation of the field of urban climate against observations by [77] focusing on air and surface temperature and wind speed in relation to albedo and building compactness.
ENVI-met has been evaluated frequently and in many regions, and [78] performed a meta-analysis of the 52 evaluation studies. Most evaluations were done regarding air temperature with RMSE between 0.52 and 4.30 K. Also, for Tmrt, some evaluation has been performed with a median RMSE of 6.50 °C and a tendency of over-estimation. Wind, however, has rarely been evaluated [78]. Nevertheless, a study [108] evaluated the performance of ENVI-met model in diurnal cycles for different meteorological conditions and obtained good agreement of measured and modelled values of Ta and RH, while this is not the case for Tmrt and wind speed.
For RayMan also various evaluations studies have been conducted (Table 2). RayMan is capable of simulating Tmrt satisfactorily under relatively homogeneous site conditions only [14]. Additionally, RayMan 1.2 software simulates Tmrt well at high sun elevations but under-estimates it considerably at low sun elevations [109]. Furthermore, RayMan model enables spot specific thermal comfort assessment. Sky Helios on the other hand is more suitable for spatial analysis at a higher spatial resolution, e.g., 1 m [110].
SOLWEIG was firstly evaluated in Göteborg, Sweden, by [61,97]. The evaluation results from Göteborg showed good agreement between modeled and measured Tmrt at two sites with different building geometries, i.e., a large square and a small courtyard [61]. In Freiburg, Germany, Ref. [111] compared Tmrt obtained from field experiments and from modeling by SOLWEIG. In Shanghai, China, Ref. [112] investigated the spatial variation of Tmrt in different urban settings of the city. Tmrt was obtained by SOLWEIG and tested against six directional radiant flux density measurements, and, generally, good performances were noticed [112]. The results from this study showed that the developed scheme could simulate the outgoing fluxes well (especially during sunny conditions), while they were under-estimated at night and in shadowed locations.
For TownScope one evaluation study was identified that compared the simulation with results from previous studies that simulated solar radiation at facades in similar urban contexts and climate zones (hot–arid and hot–humid) [82].
UMEP’s model components, such as SOLWEIG and SUEWS, have been evaluated individually (e.g., [61,71,97,113]).
A detailed overview about the robustness of the validation of each model is beyond the scope of this review and should be carefully checked before the usage of a micro-climate model.
3.4. Combination and Inter-Comparison of Models
While all reviewed models have been evaluated against observations, at least for certain variables and situations, model comparisons are not available for all of these models. In the following paragraphs, we present an overview study that compared at least two of the models recognized in this study as eligible user-friendly micro-climate models in a quantitative manner (Table 3).
Most of the comparisons have been performed between the models ENVI-met, RayMan, and SOLWEIG (see Table 3). Due to different study regions and model domains, the studies arrived at different results:
- Ref. [110] compared Envi-met, SOLWEIG, and RayMan with observations of Tmrt in Freiburg, Germany. They detected that RayMan performed with fine time resolution better than the other models.
- Ref. [114] compared the three models with observations for Berlin, Germany. The authors of this study concluded that the SOLWEIG simulated Tmrt closest to the observation, however, it over-estimated the amplitude of short-wave upward radiation.
- Ref. [81] also applied the models Envi-met, SOLWEIG, and RayMan and evaluated the simulation of Tmrt against observations in Szeged, Hungary. They evaluated the models for different survey points and revealed that models performing varies between the different sites.
- The study [115] for Szeged, Hungary, pointed out that the models RayMan Pro, SOLWEIG, and ENVI-met under-estimate night-time Tmrt. Overall SOLWEIG showed the lowest deviations from observations.
- Ref. [116] validated seasonal Tmrt obtained via RayMan and ENVI-met in Tempe, Arizona. This study reported that both models produce large simulation errors, thus exceeding a suggested Tmrt accuracy of ± 5 °C for heat-stress studies. Accordingly, both models were not able to accurately simulate Tmrt for hot conditions.
- The study [117] observed that ENVI-met has the lowest margin of error while RayMan has the highest and SOLWEIG is in the middle. RayMan however works best at higher solar altitudes on clear summer days, unlike ENVI-met that works well in cloudy and cloudless scenarios.
Comparison between other model constellations were rare: [118,119] compared SVF estimated by Envi-met and RayMan with fish-eye-observations. Ref. [76] compared Ta simulated by ADMS-TH model with ENVI-met in a case study in south Italy. In this study it was found that the ADMS temperature and humidity model performs better than ENVI-met overall. For the other models AnsysFluent, TownScope, and UMEP no comparison studies could be identified.
Other studies applied two or more models in combination without comparing the model results with each other against observations.
Ref. [120] applied SkyHelios, RayMan, and Envi-met in combination. Refs. [88,121,122] applied SkyHelios and RayMan models together. Various studies applied Envi-met and RayMan in combination [123,124,125,126,127,128,129]. In these studies, RayMan was often just applied to calculate the biometeorological variables, such as PET or UTCI.
Based on these results, it can be concluded that there is a substantial gap in the comparison between the models that requires further scientific research. This will be a complex future endeavor as it will require collaboration across different scientific fields and between researchers skilled in different models for a comprehensive assessment.
3.5. Links the GIS and CAD Software
To expand the applicability of the micro-climate models, it is important to connect them to other software, such as GIS and CAD. GIS are widely used in various scientific and applied fields including urban climate and urban planning [10]. CAD software is mainly used by architects and building engineers. CAD data, however, are often not geo-referenced which impedes their automated usage in modeling. Hence, GIS and CAD can serve to bridge the knowledge between science and practice. We have assessed if the user-friendly micro-climate models are connected to this software (Table 2):
- ADMS offers a visualization package and is linkable to meso-scale models such as WRF as well as to GIS software (ADMS-GIS extension). ADMS has links to GIS such as ArcGIS and offers its own GIS application called ADMS-Mapper. With these linkages model input can be generated and model output data can be visualized in GIS [130].
- The Advanced Skyhelios model can support typical spatial formats (e.g., shape, tif, ascii, and City GML) that can be generated and used in CAD or GIS in addition to special formats used by other models (RayMan obstacle files and ENVI-met area input files) [131].
- ANSYS FLUENT is targeted towards engineers since the simulating objects can be imported from various CAD and 3D visualization software.
- ENVI-met offers with Monde an additional editor to generate input data and the model domain from GIS data. Also, a Rhino/Grasshopper plugin is available to generate input data from CAD files [96].
- For RayMan a QGIS (free and opensource GIS software) plugin “SHP to OBS” provides the capability of creating input files for RayMan [132]. The plugin requires two ESRI®-shape files (or three, if vegetation is included) as input to create RayMan obstacle files. The plugin is available free for download.
- TownScope works well with CAD. The software can import data from main CAD systems and calculate solar gain, thermal comfort, and perceptive properties of urban open spaces. The software additionally allows for generation of terrain from 3D points [133]. TownScope can import data from main CAD systems and calculate solar gain, thermal comfort, and perceptive properties of urban open spaces. This produces results rapidly and can be applied to GIS formats [134].
- UMEP [71] is developed with the idea to enable users to interact with spatial information and to edit, map, and visualize inputs and results. Accordingly, it is written as a plug-in to QGIS, which is a cross-platform, free, and open-source desktop GIS application (https://qgis.org/en/site/, accessed on 2 October 2021). With a linkage to GIS also the creation of urban climate maps is supported [11]. As part of UMEP, SOLWEIG can be used in QGIS.
Interestingly, each of the user-friendly models offers some sort of linkage either to GIS or to CAD software as described later in this manuscript. This can be interpreted as a special feature due to the applied scope of the models or as a new development. Ten years ago, only a few models were available that could be used in GIS or be easily linked to GIS [10]. In general, GRID and NCDF are more frequently used data formats in the atmospheric science community. These formats, however, are not directly supported by GIS tools. Also, different software types are used by the atmospheric science community [45]. Hence, it makes the transfer of technology easier if different, as well as GIS-compatible formats are provided as in- and output data.
3.6. Availability of Support
Most of the micro-climate models offer various and also interactive support for the models (Table 3). This is helpful and needed in order to create an active user community.
ADMS-Urban offers yearly user meetings, a user’s guide and additional documents to get started with. The Advanced SkyHelios and RayMan have a documentation and a community forum. ANSYS FLUENT offers various support options as a commercial and in other fields of research, a widely-used model. It offers forum, videos, tutorials, individual support, and various training courses, which mainly come with an additional fee. ENVI-met offers detailed documentation, videos, and support via the websites. UMEP and SOLWEIG offer detailed manuals and training materials. Furthermore, it is possible to take part in their development, i.e., participate in coding or adding new features, submit comments or report issues, get updates, news and help from other users. TownScope offers documentation, an active FAQ, and training sessions.
3.7. Limitations
This review paper has very specific focus on user-friendly micro-climate models. This means that there are many other micro-climate models available that do not offer a user-interface and are not usable on a private PC. Furthermore, since we only included peer-reviewed models, we might not have captured the newest developments that might just have been introduced at conferences or have user-interface currently under construction. Also, studies on models were included only if they were written in English language and presented as an original research paper.
Another limitation of this review paper is that it must be seen as a snapshot and starting point for one’s own search for the newest model developments. As mentioned earlier, many models identified in the pre-screening were not available anymore, i.e., websites given in studies were inoperable and contact information outdated. Some of the models might be updated in future, e.g., with another founding project.
4. Conclusions
With this review, we demonstrated that eight user-friendly micro-climate models are already available that can be used to improve the design and development of outdoor spaces in cities. All of these models offer a linkage to CAD or GIS software and support systems at various levels, which promote a smooth integration to planning and design software. We have also detected that all models have been evaluated against observations, which is evidence for simulation quality.
A wider model comparison, however, has only been performed for some models. Hence, comparative analyses between the models were very limited. Moreover, models eligible for this review were developed only in Europe and USA. Some of the models are in use all over the world, others only in several countries. When applying the models to new climate zones, special attentions need to be given to the simulation’s quality.
Since we detected that many models identified at the stage of eligibility screening were not available and supported anymore, we argue that more effort need to be taken to secure financing and hosting of the model websites to avoid the loss of models and gained experience.
Upcoming models often focus on multi-scale approaches that integrate or combine different urban climate models to address processes at various spatial levels, which was not within the scope of this review. Multi-scale has the advantage to bridge between the meso- and the microscale and are able to produce spatially consistent results. Examples for multi-scale and integrated approaches besides the included UMEP [71], are the Integrated Multi-scale Environmental Urban Model (IMEUM) [135] or studies that coupled micro- and meso-scale climate models, e.g., [136] or [137] or even micro- and meso-scale models with a building energy model [138].
Another future research direction that is also needed for climate-sensitive urban development and design is the integration or coupling of models for bio-climate sensitive designs with models for other aspects of climate-proofing, such as building energy models. Ref. [21] noted that many models often address only one or two of the above-mentioned urban planning aspects, nonetheless there are numerous links between them. Moreover, in many city administrations, the environmental planning departments need to deal with a wide range of issues related to climate, such as reducing outdoor heat stress, reducing energy consumption, optimizing the use of solar energy on buildings, and adapting to increasing flood risk. Hence, tools and workflows that let planners deal with these different issues easily are also desirable.
The approach of performance-based urban planning addresses the impact of new land uses across the entire urban system and has a much larger scope than just climate issues [138]. Several model approaches aim to quantify new plans based on different cumulative effects on mobility, green infrastructure, energy, e.g., [139] to optimize the overall performance in the urban system. This could be a follow-up approach after considering the aspects of climate. Related to the increasingly complex modeling methods is the need for more detailed data sources to describe the city. There is a growing need for high-quality urban experimental datasets for validating models. Secondly, high-resolution geometric details and properties of the urban fabric are needed for model validation.
Beside the need for more integrated models, also the models for climate-sensitive urban planning need to increase their focus on the target group of applied scientists and practitioners. Therefore, the idea of “Research through design” stated for microclimate in [140] is highly interesting, but is seldom used for designing microclimates.
Author Contributions
Conceptualization, B.J., D.M., and S.M.; methodology, B.J. and D.M.; software, D.M.; validation, B.J., D.M., and S.M.; data curation, B.J., D.M., and S.M.; writing, B.J., D.M., and S.M.; visualization, B.J. All authors have read and agreed to the published version of the manuscript.
Funding
This research received no external funding.
Institutional Review Board Statement
Not applicable.
Informed Consent Statement
Not applicable.
Acknowledgments
The authors would like to acknowledge that this manuscript was advanced during the 3rd Students and New Professionals (SNP) Workshop of the International Society of Biometeorology in Enschede, The Netherlands, in 2019. Funding for this workshop was provided to the SNP group from a grant provided by the International Society of Biometeorology and the S.W. Tromp Foundation.
Conflicts of Interest
The authors declare no conflict of interest. The funders had no role in the design of the study; in the collection, analyses, or interpretation of data; in the writing of the manuscript; or in the decision to publish the results.
Appendix A
Brief description of excluded user-friendly models. (Here only selected models are described that were found to be valuable within the scope of this article and that are currently available).
CBE Thermal Comfort Tool is a free cross-platform web application that provides visual and highly interactive options for indoor thermal comfort visualization and calculation according to ASHRAE Standard 55-2013. It was developed by the Center for the Built Environment (CBE) of the University of California Berkeley (USA) and is freely available at http://cbe.berkeley.edu/comforttool, accessed on 2 October 2021. The user can select the comfort model to be used (PMV and Adaptive Comfort) and specify input parameters affecting thermal comfort. Accordingly, this tool can be interesting for designers, HVAC engineers, and building science students to analyze existing building performance, verify its compliance with the defined comfort requirements, and elaborate different thermal control strategies (e.g., natural ventilation, elevated air speed, radiant systems, and daily zone temperature reset) [28].
City Comfort+ has been developed to aid urban planning and landscape architectural practice by simulating Tmrt in urban areas of varying densities [31]. Simple data inputs, including weather data and 3-D urban geometries in vector format, are needed for the model. DIVA-for-Rhino 2.0 plug-in [141] is used to process 3-D urban geometries. The model outputs Tmrt and mean surface temperature with high spatial and temporal resolution. Evaluation of the model was performed in varying meteorological conditions for Boston and good agreement between predicted and measured Tmrt and surface temperature was obtained [30]. This model, however, does not offer a user interface at the moment of writing.
CTTC Model was developed by [142] and further improved by [143]. The model incorporates a cluster thermal time constant (CTTC) to predict air temperature in the urban canopy layer. The original CTTC model was further developed to include the impacts of artificial heat [144], trees [41], and the intra-urban air temperature variations [145]. The developers suggest that CTTC and GREEN CTTC models are of great benefit for architects in evaluating the micrometeorological conditions at early urban design stages. As analytical models, they apply mathematical equations to make a specific design decision and do not have a user interface as is the case in computer models.
The GRIHA LD online calculator was developed in order to assess the impact of site planning, building layout, and distribution of green on the ambient outdoor temperature. Both the STEVE model and ENVI-met were tested for incorporation in the calculator. STEVE model was found to be more accurate in comparison to ENVI-met and was therefore incorporated into the calculator [42]. The use of the calculator is limited to assessing the relative impact of the site planning in terms of new developments only.
INKAS can be helpful for a very first estimation of the impacts of urban design decisions or for users with limited knowledge about urban climate: INKAS assesses the effect of different adaptation measures without spatial variations [43].
The Mitigation Impact Screening Tool (MIST) is a web-based software that has been developed to assess the potential of urban heat island mitigation strategies in influencing urban climate, air quality, and energy consumption in cities [48]. The tool was developed as a cost-effective and quick means of estimating the potential of mitigation strategies worldwide. City-wide changes in surface albedos and vegetation cover can be specified by the user. Data required to conduct the analysis is only available for 240 cities in the US. MIST extrapolates the impacts of mitigation strategies from the existing database of results from modeled cities and summarizes the results [47]. MIST is, however, not capable of differentiating the spatial variation in the application of the mitigation strategies.
Screening Tool for Estate Environment Evaluation (STEVE) was specifically developed to bridge the gap between urban climate research findings with urban planning and design efforts and is based on GIS and CAD applications [10]. So far, however, it is limited in its use to only Singapore.
Urban Modelling Interface (umi) is a Rhinoceros-3D-based urban modeling design tool that allows users to perform operational building energy use, sustainable transportation choices, daylighting, and outdoor comfort analyses at the neighborhood and city level [72]. For this purpose, the underlying simulation engines used are Energy Plus, Radiance/Daysim, and a series of Grasshopper and Python scripts. The tool allows users to access meaningful information for design interventions at the neighborhood, street, and building scale. To consider the UHI effect, umi users are pointed towards the Urban Weather Generator (UWG). Up to now, umi was mainly used for the analysis of urban form influences on energy efficiency [146].
The Urban Weather Generator simulates the effect of the urban heat island based on rural weather stations for one point [74]. This can be very helpful as boundary information for building energy modeling and for areas where urban air temperature observations are missing [74].
Ref. [147] introduced version 6.0 of the PALM model system. It is a Fortran-based code and has been applied for studying a variety of atmospheric and oceanic boundary layers for about 20 years. The model is optimized for use on massively parallel computer architectures. The PALM model system is freely available from http://palm-model.org, accessed on 2 October 2021, and distributed under the GNU General Public License v3. Furthermore, a model documentation, a detailed user manual, as well as an online tutorial are available on the Trac server and are constantly kept up to date by the PALM developers. The PALM model system 6.0 consists of the PALM model core, several embedded modules, and PALM-4U (short for PALM for urban applications) components which have been specifically developed for modelling of the urban environment [148,149].
References
- Webb, B. The Use of Urban Climatology in Local Climate Change Strategies: A Comparative Perspective. Int. Plan. Stud. 2016, 22, 68–84. [Google Scholar] [CrossRef] [Green Version]
- Bajšanski, I.V.; Milošević, D.D.; Savić, S.M. Evaluation and improvement of outdoor thermal comfort in urban areas on extreme temperature days: Applications of automatic algorithms. Build. Environ. 2015, 94, 632–643. [Google Scholar] [CrossRef]
- Jamei, E.; Seyedmahmoudian, M.; Horan, B.; Stojcevski, A. Verification of a bioclimatic modeling system in a growing suburb in Melbourne. Sci. Total Environ. 2019, 689, 883–898. [Google Scholar] [CrossRef] [PubMed]
- Lai, D.; Liu, W.; Gan, T.; Liu, K.; Chen, Q. A review of mitigating strategies to improve the thermal environment and thermal comfort in urban outdoor spaces. Sci. Total Environ. 2019, 661, 337–353. [Google Scholar] [CrossRef] [PubMed]
- Milošević, D.D.; Bajšanski, I.V.; Savić, S.M. Influence of changing trees locations on thermal comfort on street parking lot and footways. Urban For. Urban Green. 2017, 23, 113–124. [Google Scholar] [CrossRef]
- Santamouris, M.; Synnefa, A.; Karlessi, T. Using advanced cool materials in the urban built environment to mitigate heat islands and improve thermal comfort conditions. Sol. Energy 2011, 85, 3085–3102. [Google Scholar] [CrossRef]
- Manavvi, S.; Rajasekar, E. Evaluating outdoor thermal comfort in “Haats”—The open air markets in a humid subtropical region. Build. Environ. 2021, 190, 107527. [Google Scholar] [CrossRef]
- Tablada, A.; De Troyer, F.; Blocken, B.; Carmeliet, J.; Verschure, H. On natural ventilation and thermal comfort in compact urban environments—The Old Havana case. Build. Environ. 2009, 44, 1943–1958. [Google Scholar] [CrossRef]
- Taleghani, M. Outdoor Thermal Comfort by Different Heat Mitigation Strategies—A Review. Renew. Sustain. Energ. Rev. 2018, 81, 2011–2018. [Google Scholar] [CrossRef]
- Wong, N.H.; Jusuf, S.K.; Tan, C.L. Integrated Urban Microclimate Assessment Method as a Sustainable Urban Development and Urban Design Tool. Landsc. Urban Plan. 2011, 100, 386–389. [Google Scholar] [CrossRef]
- Parsaee, M.; Joybari, M.M.; Mirzaei, P.A.; Haghighat, F. Urban Heat Island, Urban Climate Maps and Urban Development Policies and Action Plans. Environ. Technol. Innov. 2019, 14, 100341. [Google Scholar] [CrossRef]
- Erell, E. The Application of Urban Climate. Research in the Design of Cities. Adv. Build. Energy Res. 2008, 2, 95–121. [Google Scholar] [CrossRef]
- Toparlar, Y.; Blocken, B.; Maiheu, B.; van Heijst, G.J.F. A Review on the CFD Analysis of Urban Microclimate. Renew. Sustain. Energy Rev. 2017, 80, 1613–1640. [Google Scholar] [CrossRef]
- Lee, H.; Mayer, H. Validation of the Mean Radiant Temperature Simulated by the RayMan Software in Urban Environments. Int. J. Biomet. 2016, 60, 1775–1785. [Google Scholar] [CrossRef]
- Lauzet, N.; Rodler, A.; Musy, M.; Azam, M.-H.; Guernouti, S.; Mauree, D.; Colinart, T. How Building Energy Models Take the Local Climate into Account in an Urban Context A Review. Renew. Sustain. Energy Rev. 2019, 116, 109390. [Google Scholar] [CrossRef]
- Mirzaei, P.A. Recent Challenges in Modeling of Urban Heat Island. Sustain. Cities Soc. 2015, 19, 200–206. [Google Scholar] [CrossRef] [Green Version]
- Prataviera, E.; Romano, P.; Carnieletto, L.; Pirotti, F.; Vivian, J.; Zarrella, A. EUReCA: An open-source urban building energy modelling tool for the efficient evaluation of cities energy demand. Renew. Energy 2021, 173, 544–560. [Google Scholar] [CrossRef]
- Kwok, Y.T.; Ng, E.Y.Y. Trends, topics, and lessons learnt from real case studies using mesoscale atmospheric models for urban climate applications in 2000–2019. Urban Clim. 2021, 36, 100785. [Google Scholar] [CrossRef]
- Bherwani, H.; Singh, A.; Kumar, R. Assessment Methods of Urban Microclimate and Its Parameters: A Critical Review to Take the Research from Lab to Land. Urban Clim. 2020, 34, 100690. [Google Scholar] [CrossRef]
- Coccolo, S.; Kämpf, J.; Scartezzini, J.-L.; Pearlmutter, D. Outdoor Human Comfort and Thermal Stress: A Comprehensive Review on Models and Standards. Urban Clim. 2016, 18, 33–57. [Google Scholar] [CrossRef]
- Mauree, D.; Naboni, E.; Coccolo, S.; Perera, A.T.D.; Nik, V.M.; Scartezzini, J.-L. A Review of Assessment Methods for the Urban Environment and Its Energy Sustainability to Guarantee Climate Adaptation of Future Cities. Renew. Sustain. Energ. Rev. 2019, 112, 733–746. [Google Scholar] [CrossRef]
- Carruthers, D.J.; Holroyd, R.J.; Hunt, J.C.R.; Weng, W.S.; Robins, A.G.; Apsley, D.D.; Thompson, D.J.; Smith, F.B. UK-ADMS: A New Approach to Modelling Dispersion in the Earths Atmospheric Boundary Layer. J. Wind Eng. Ind. Aerodyn. 1994, 52, 139–153. [Google Scholar] [CrossRef]
- Fröhlich, D.; Matzarakis, A. Spatial Estimation of Thermal Indices in Urban Areas—Basics of the SkyHelios Model. Atmosphere 2018, 9, 209. [Google Scholar] [CrossRef] [Green Version]
- Huang, J.; Hao, T.; Hou, S.S.; Jones, P. Simulation-Informed Urban Design: Improving Urban Microclimate in Real-World Practice in a High Density City. IOP Conf. Ser. Earth Environ. Sci. 2019, 329, 012047. [Google Scholar] [CrossRef] [Green Version]
- Poole, E.L.; Heroux, M.A.; Vaidya, P.; Joshi, A. Performance of Iterative Methods in ANSYS on Cray Parallel/Vector Supercomputers. Comput. Syst. Eng. 1995, 6, 251–259. [Google Scholar] [CrossRef]
- Tanimoto, J.; Hagishima, A.; Chinklai, P. Development of an advanced computer tool. AUSSM-Tool for a coupling simulation with building thermal system and urban climatology. In Proceedings of the Eighth International IBPSA Conference, Eindhoven, The Netherlands, 11–14 August 2003. [Google Scholar]
- Kim, K.R.; Yi, C.; Lee, J.S.; Meier, F.; Jänicke, B.; Fehrenbach, U.; Scherer, D. BioCAS: Biometeorological Climate impact Assessment System for building-scale impact assessment of heat-stress related mortality. DIE ERDE J. Geographic. Soc. 2014, 145, 62–79. [Google Scholar] [CrossRef]
- Schiavon, S.; Hoyt, T.; Piccioli, T.A. Web Application for Thermal Comfort Visualization and Calculation According to ASHRAE Standard 55. Build. Sim. 2014, 7, 321–334. [Google Scholar] [CrossRef]
- Fonseca, J.A.; Nguyen, T.A.; Schlueter, A.; Marechal, F. City Energy Analyst (CEA): Integrated Framework for Analysis and Optimization of Building Energy Systems in Neighborhoods and City Districts. Energy Build. 2016, 113, 202–226. [Google Scholar] [CrossRef]
- Chen, Y.; Hong, T.; Piette, M.A. Automatic generation and simulation of urban building energy models based on city datasets for city-scale building retrofit analysis. Appl. Energy 2017, 205, 323–335. [Google Scholar] [CrossRef] [Green Version]
- Huang, J.; Cedeño-Laurent, J.G.; Spengler, J.D. CityComfort+: A Simulation-Based Method for Predicting Mean Radiant Temperature in Dense Urban Areas. Build. Environ. 2014, 80, 84–95. [Google Scholar] [CrossRef] [Green Version]
- Gallinelli, P.; Camponovo, R.; Guillot, V. CityFeel-micro climate monitoring for climate mitigation and urban design. Energy Procedia 2017, 122, 391–396. [Google Scholar] [CrossRef]
- Longcore, T.; Li, C.; Wilson, J.P. Applicability of citygreen urban ecosystem analysis software to a densely built urban neighborhood. Urban Geogr. 2004, 25, 173–186. [Google Scholar] [CrossRef] [Green Version]
- Robinson, D.; Haldi, F.; Leroux, P.; Perez, D.; Rasheed, A.; Wilke, U. CitySim: Comprehensive micro-simulation of resource flows for sustainable urban planning. In Proceedings of the Eleventh International IBPSA Conference, Glasgow, Scotland, 27–30 July 2009; pp. 1083–1090. [Google Scholar]
- Matuschek, O.; Matzarakis, A. A mapping tool for climatological applications. Meteorol Appl. 2011, 18, 230–237. [Google Scholar] [CrossRef]
- Brown, R.D.; Krys, S.A.; Gillespie, T.J. A model for estimating radiation received by a person in the landscape. Lands. Res. 1990, 15, 33–36. [Google Scholar] [CrossRef]
- Fava, D.; Guaragno, G.; Dall’Olio, C. Decision Support Systems for Urban Planning. In Counteracting Urban Heat Island Effects in a Global Climate Change Scenario; Springer International Publishing: Berlin/Heidelberg, Germany, 2016; pp. 109–127. [Google Scholar] [CrossRef] [Green Version]
- Yang, L.; He, B.J.; Ye, M. Application research of ECOTECT in residential estate planning. Energy Build. 2014, 72, 95–202. [Google Scholar] [CrossRef]
- Bruse, M.; Fleer, H. Simulating surface–plant–air interactions inside urban environments with a three dimensional numerical model. Environ. Modelling Softw. 1998, 13, 373–384. [Google Scholar] [CrossRef]
- Gross, G. Some effects of deforestation on nocturnal drainage flow and local climate—A numerical study. Bound. Layer Meteorol. 1987, 38, 315–337. [Google Scholar] [CrossRef]
- Shashua-Bar, L.; Hoffman, M.E. The Green CTTC Model for Predicting the Air Temperature in Small Urban Wooded Sites. Build. Environ. 2002, 37, 1279–1288. [Google Scholar] [CrossRef]
- Devs, K.K.; Singh, M.; Vij, A. Online calculation for evaluation for site planning impacts—Experience of developing heat island tool for GRIHA LD. In Proceedings of the BS2015: 14th Conference of International Building Performance Simulation Association, Hyderabad, India, 7–9 December 2015. [Google Scholar]
- Buchholz, S.; Kossmann, M.; Roos, M. INKAS: A Guidance Tool to Assess the Impact of Adaptation Measures against Urban Heat. Meteorol. Z. 2016, 25, 281–289. [Google Scholar] [CrossRef]
- Allen, L.; Lindberg, F.; Grimmond, C.S.B. Global to city scale urban anthropogenic heat flux: Model and variability. Int. J. Climatol. 2001, 31, 1990–2005. [Google Scholar] [CrossRef]
- Wang, Y.Q. MeteoInfo: GIS Software for Meteorological Data Visualization and Analysis. Meteorol. Appl. 2012, 21, 360–368. [Google Scholar] [CrossRef]
- Ehrhard, J.; Khatib, I.A.; Winkler, C.; Kunz, R.; Moussiopoulos, N.; Ernst, G. The microscale model MIMO: Development and assessment. J. Wind Eng. Ind. Aerodyn. 2000, 85, 163–176. [Google Scholar] [CrossRef]
- Sailor, D.J.; Dietsch, N. The Urban Heat Island Mitigation Impact Screening Tool (MIST). Environ. Model Softw. 2007, 22, 1529–1541. [Google Scholar] [CrossRef] [Green Version]
- Sievers, U.; Zdunkowkski, A. microscale urban climate model. Beitr. Phys. Atmosph. 1986, 59, 13–40. [Google Scholar]
- Sievers, U. Das Kleinskalige Strömungsmodell MUKLIMO. Teil 1: Theoretische Grundlagen, PC-Basisversion und Validierung. Available online: https://refubium.fu-berlin.de/handle/fub188/19051 (accessed on 1 October 2021).
- Piroozmand, P.; Mussetti, G.; Allegrini, J.; Haji, M.; Ehsan, M.; Carmeliet, J. Coupled CFD framework with mesoscale urban climate model: Application to microscale urban flows with weak synoptic forcing. J. Wind Eng. Ind. Aerodyn. 2020, 197, 104059. [Google Scholar] [CrossRef]
- Comfable Inc. OTC Model™. Available online: https://comfable.com/otc-model-1-4-0/ (accessed on 7 January 2020).
- Mavrogianni, A.; Davies, M.; Batty, M.; Belcher, S.E.; Bohnenstengel, S.I.; Carruthers, D.; Chalabi, Z. The Comfort Energy and Health Implications of London’s Urban Heat Island. Build. Serv. Eng. Res. Technol. 2011, 32, 35–52. [Google Scholar] [CrossRef]
- Maronga, B.; Gryschka, M.; Heinze, R.; Hoffmann, F.; Kanani-Sühring, F.; Keck, M.; Ketelsen, K.; Letzel, M.O.; Sühring, M.; Raasch, S. The Parallelized Large-Eddy Simulation Model (PALM) version 4.0 for atmospheric and oceanic flows: Model formulation, recent developments, and future perspectives. Geosci. Model Dev. 2015, 8, 2515–2551. [Google Scholar] [CrossRef] [Green Version]
- Overby, M.; Willemsen, P.; Bailey, B.N.; Halverson, S.; Pardyjak, E.R. A Rapid and Scalable Radiation Transfer Model for Complex Urban Domains. Urban Clim. 2016, 15, 25–44. [Google Scholar] [CrossRef] [Green Version]
- Matzarakis, A.; Rutz, F.; Mayer, H. Modelling radiation fluxes in simple and complex environments—Application of the RayMan model. Int. J. Biometeorol. 2007, 51, 323–334. [Google Scholar] [CrossRef]
- Smith, C.; Lindley, S. Sustainable Cities: Options for Responding to Climate Change Impacts and Outcomes. WP3 Workshop Report Draft 1. In Proceedings of the SCORCHIO Stakeholder Workshop, Manchester, UK, 13 March 2008. [Google Scholar]
- Hoffmann, P.; Fischereit, J.; Heitmann, S.; Schlünzen, H.; Gasser, I. Modeling Exposure to Heat Stress with a Simple Urban Model. Urban Sci. 2018, 2, 9. [Google Scholar] [CrossRef] [Green Version]
- Nouvel, R.; Brassel, K.H.; Bruse, M.; Duminil, E.; Coors, V.; Eicker, U.; Robinson, D. SimStadt, a new workflow-driven urban energy simulation platform for CityGML city models. In Proceedings of the International Conference 2015 Future Buildings and Districts Sustainability from Nano to Urban Scale, Lausanne, Switzerland, 9–11 September 2015; pp. 889–894. [Google Scholar]
- Asawa, T.; Hoyano, A.; Nakaohkubo, K. Thermal design tool for outdoor spaces based on heat balance simulation using a 3D-CAD system. Build. Environ. 2008, 43, 2112–2123. [Google Scholar] [CrossRef]
- Morille, B.; Lauzet, N.; Musy, M. SOLENE-microclimate: A tool to evaluate envelopes efficiency on energy consumption at district scale. Energy Proc. 2015, 78, 1165–1170. [Google Scholar] [CrossRef] [Green Version]
- Lindberg, F.; Holmer, B.; Thorsson, S. SOLWEIG 1.0 Modelling Spatial Variations of 3D Radiant Fluxes and Mean Radiant Temperature in Complex Urban Settings. Int. J. Biomet. 2008, 52, 697–713. [Google Scholar] [CrossRef] [PubMed]
- Lin, B.; Li, X.; Zhu, Y.; Qin, Y.; Zhu, Y.; Qin, Y. Numerical Simulation Studies of the Different Vegetation Patterns’ Effects on Outdoor Pedestrian Thermal Comfort. J. Wind Eng. Ind. Aerodyn. 2008, 96, 1707–1718. [Google Scholar] [CrossRef]
- Cavan, G.; Butlin, T.; Gill, S.; Kingston, R.; Lindley, S. Web-GIS Tools for Climate Change Adaptation Planning in Cities. In Handbook of Climate Change Adaptation; Leal Filho, W., Ed.; Springer: Berlin/Heidelberg, Germany, 2014. [Google Scholar]
- Järvi, L.; Grimmond, C.S.B.; Christen, A. The Surface Urban Energy and Water Balance Scheme (SUEWS): Evaluation in Los Angeles and Vancouver. J. Hydrol. 2011, 411, 219–237. [Google Scholar] [CrossRef]
- Robinson, D.; Campbell, N.; Gaiser, W.; Kabel, K.; Le-Mouel, A.; Morel, N.; Page, J.; Stankovic, S.; Stone, A. SUNtool A New Modelling Paradigm for Simulating and Optimising Urban Sustainability. Sol. Energy 2007, 81, 1196–1211. [Google Scholar] [CrossRef]
- Gál, T.; Unger, J. A new software tool for SVF calculations using building and tree-crown databases. Urban Clim. 2014, 10, 594–606. [Google Scholar] [CrossRef] [Green Version]
- Teller, J.; Azar., S. Townscope IIA Computer System to Support Solar Access Decision-Making. Sol. Energy 2001, 70, 187–200. [Google Scholar] [CrossRef] [Green Version]
- Krayenhoff, E.S.; Voogt., J.A. A Microscale Three-Dimensional Urban Energy Balance Model for Studying Surface Temperatures. Bound. Layer Meteorol. 2007, 123, 433–461. [Google Scholar] [CrossRef]
- Friedrich, M.; Grätz, A.; Jendritzky, G. Further development of the urban bioclimate model UBIKLIM, taking local wind systems into account. Meteorol. Z. 2001, 10, 267–272. [Google Scholar] [CrossRef]
- Komac, B.; Ciglič, R. Urban heat island atlas: A web tool for the determination and mitigation of the urban heat island effect. Geogr. Pol. 2014, 87, 587–591. [Google Scholar]
- Lindberg, F.; Grimmond, C.S.B.; Gabey, A.; Huang, B.; Kent, C.W.; Sun, T.; Theeuwes, N.E. Urban Multi-Scale Environmental Predictor (UMEP): An Integrated Tool for City-Based Climate Services. Environ. Model Softw. 2018, 99, 70–87. [Google Scholar] [CrossRef]
- Reinhart, C.; Dogan, T.; Jakubiec, J.A.; Rakha, T.; Sang, A. Umi-an urban simulation environment for building energy use, daylighting and walkability. In Proceedings of the 13th Conference of International Building Performance Simulation Association, Chambery, France, 26–28 August 2013. [Google Scholar]
- Yao, R.; Luo, Q.; Luo, Z.; Jiang, L.; Yang, Y. An Integrated Study of Urban Microclimates in Chongqing China: Historical Weather Data, Transverse Measurement and Numerical Simulation. Sustain. Cities Soc. 2015, 14, 187–199. [Google Scholar] [CrossRef] [Green Version]
- Bueno, B.; Norford, L.; Hidalgo, J.; Pigeon, G. The Urban Weather Generator. J. Build. Perform. Simul. 2013, 6, 269–281. [Google Scholar] [CrossRef]
- Kusaka, H.; Chen, F.; Tewari, M.; Dudhia, J.; Gill, D.O.; Duda, M.G.; Wang, W.; Miya, Y. Numerical simulation of urban heat island effect by the WRF model with 4-km Grid increment: An inter-comparison study between the urban canopy model and slab model. J. Meteorol. Soc. Jpn. 2012, 90, 33–45. [Google Scholar] [CrossRef] [Green Version]
- Maggiotto, G.; Buccolieri, R.; Santo, M.A.; Leo, L.S.; Di Sabatino, S. Validation of Temperature-Perturbation and CFD-Based Modelling for the Prediction of the Thermal Urban Environment: The Lecce (IT) Case Study. Environ. Model. Softw. 2014, 60, 69–83. [Google Scholar] [CrossRef]
- Nazarian, N.; Kleissl, J. CFD Simulation of an Idealized Urban Environment: Thermal Effects of Geometrical Characteristics and Surface Materials. Urban Clim. 2015, 12, 141–159. [Google Scholar] [CrossRef]
- Tsoka, S.; Tsikaloudaki, A.; Theodosiou, T. Analyzing the ENVI-Met Microclimate Model’s Performance and Assessing Cool Materials and Urban Vegetation Applications. A Review. Sustain. Cities Soc. 2018, 43, 55–76. [Google Scholar] [CrossRef]
- Matzarakis, A.; Rutz, F.; Mayer, H. Modelling radiation fluxes in simple and complex environments: Basics of the RayMan model. Int. J. Biometeorol. 2010, 54, 131–139. [Google Scholar] [CrossRef] [Green Version]
- Lau, K.K.-L.; Ren, C.; Ho, J.; Ng, E. Numerical Modelling of Mean Radiant Temperature in High-Density Sub-Tropical Urban Environment. Energy Build. 2016, 114, 80–86. [Google Scholar] [CrossRef]
- Kántor, N.; Gál, C.V.; Gulyás, A.; Unger, J. The Impact of FaçAde Orientation and Woody Vegetation on Summertime Heat Stress Patterns in a Central European Square: Comparison of Radiation Measurements and Simulations. Adv. Meteorol. 2018, 2018, 2650642. [Google Scholar] [CrossRef]
- Bahgat, R.; Reffat, R.M.; Elkady, S.L. Analyzing the impact of design configurations of urban features on reducing solar radiation. J. Build. Eng. 2020, 32, 101664. [Google Scholar] [CrossRef]
- Al-Maiyah, S.; Elkadi, H. The role of daylight in preserving identities in heritage context. Renew. Sustain. Energy Rev. 2007, 11, 1544–1557. [Google Scholar] [CrossRef]
- Righi, S.; Lucialli, P.; Pollini, E. Statistical and Diagnostic Evaluation of the ADMS-Urban Model Compared with an Urban Air Quality Monitoring Network. Atmos. Environ. 2009, 43, 3850–3857. [Google Scholar] [CrossRef]
- Mallet, V.; Tilloy, A.; Poulet, D.; Girard, S.; Brocheton, F. Meta-Modeling of ADMS-Urban by Dimension Reduction and Emulation. Atmos. Environ. 2018, 184, 37–46. [Google Scholar] [CrossRef]
- Hamilton, I.; Stocker, J.; Evans, S.; Davies, M.; Carruthers, D. The Impact of the London Olympic Parkland on the Urban Heat Island. J. Build. Perform. Simul. 2013, 7, 119–132. [Google Scholar] [CrossRef] [Green Version]
- Virk, G.; Jansz, A.; Mavrogianni, A.; Mylona, A.; Stocker, J.; Davies, M. Microclimatic Effects of Green and Cool Roofs in London and Their Impacts on Energy Use for a Typical Office Building. Energy Build. 2015, 88, 214–228. [Google Scholar] [CrossRef]
- Fröhlich, D.; Gangwisch, M.; Matzarakis, A. Effect of Radiation and Wind on Thermal Comfort in Urban Environments—Application of the RayMan and SkyHelios Model. Urban Clim. 2019, 27, 1–7. [Google Scholar] [CrossRef]
- Singh, B.; Hansen, B.S.; Brown, M.J.; Pardyjak, E.R. Evaluation of the QUIC-URB Fast Response Urban Wind Model for a Cubical Building Array and Wide Building Street Canyon. Environ. Fluid Mech. 2008, 8, 281–312. [Google Scholar] [CrossRef]
- ANSYS Inc. ANSYS FLUENT 12.0/12.1 Documentation. 2020. Available online: https://www.afs.enea.it/project/neptunius/docs/fluent/index.htm (accessed on 18 March 2020).
- Saneinejad, S.; Moonen, P.; Carmeliet, J. Comparative Assessment of Various Heat Island Mitigation Measures. Build. Environ. 2014, 73, 162–170. [Google Scholar] [CrossRef]
- Garcia, J.; Cerdeira, R.; Tavares, N.; Coelho, L.M.R.; Kumar, K.; Carvalho, M.G. Influence of Virtual Changes in Building Configurations of a Real Street Canyon on the Dispersion of PM10. Urban Clim. 2013, 5, 68–81. [Google Scholar] [CrossRef] [Green Version]
- Wang, X.; Li, Y. Predicting Urban Heat Island Circulation Using CFD. Build Environ. 2016, 99, 82–97. [Google Scholar] [CrossRef]
- Vidrih, B.; Medved, S. Multiparametric model of urban park cooling island. Urban For. Urban Green. 2013, 12, 220–229. [Google Scholar] [CrossRef]
- Simon, H.; Lindén, J.; Hoffmann, D.; Braun, P.; Bruse, M.; Esper, J. Modeling Transpiration and Leaf Temperature of Urban Trees A Case Study Evaluating the Microclimate Model ENVI-Met against Measurement Data. Landsc. Urban Plan. 2018, 174, 33–40. [Google Scholar] [CrossRef]
- Envi-met GmbH 2020 Technical Model Webpage. Available online: https://Envi-Met.info (accessed on 15 March 2020).
- Lindberg, F.; Grimmond, C.S.B. The Influence of Vegetation and Building Morphology on Shadow Patterns and Mean Radiant Temperatures in Urban Areas: Model Development and Evaluation. Theor. Appl. Climatol. 2011, 105, 311–323. [Google Scholar] [CrossRef]
- Thorsson, S.; Lindberg, F.; Björklund, J.; Holmer, B.; Rayner, D. Potential Changes in Outdoor Thermal Comfort Conditions in Gothenburg Sweden Due to Climate Change: The Influence of Urban Geometry. Int. J. Climatol. 2010, 31, 324–335. [Google Scholar] [CrossRef]
- Lindberg, F.; Onomura, S.; Grimmond, C.S.B. Influence of Ground Surface Characteristics on the Mean Radiant Temperature in Urban Areas. Int. J. Biomet. 2016, 60, 1439–1452. [Google Scholar] [CrossRef] [Green Version]
- Thom, J.K.; Coutts, A.M.; Broadbent, A.M.; Tapper, N.J. The Influence of Increasing Tree Cover on Mean Radiant Temperature across a Mixed Development Suburb in Adelaide Australia. Urban For. Urban Green. 2016, 20, 233–242. [Google Scholar] [CrossRef]
- Aminipouri, M.; Knudby, A.J.; Krayenhoff, E.S.; Zickfeld, K.; Middel., A. Modelling the Impact of Increased Street Tree Cover on Mean Radiant Temperature across Vancouver’s Local Climate Zones. Urban For. Urban Green. 2019, 39, 9–17. [Google Scholar] [CrossRef]
- Aminipouri, M.; Rayner, D.; Lindberg, F.; Thorsson, S.; Knudby, A.J.; Zickfeld, K.; Middel, A.; Krayenhoff, E.S. Urban Tree Planting to Maintain Outdoor Thermal Comfort under Climate Change: The Case of Vancouvers Local Climate Zones. Build. Environ. 2019, 158, 226–236. [Google Scholar] [CrossRef]
- Keene, S.E. Object-Oriented Programming in Common Lisp; a Programmer’s Guide to Clos; Symbolics Inc.: Cambridge, MA, USA, 1989. [Google Scholar]
- Dogniaux, R. Eclairement energetique solaire, direct, diffus et global du surfaces orientees et inclinees. IRM Misc. Ser. B 1994, 59, 46. [Google Scholar]
- Balany, F.; Ng, A.W.; Muttil, N.; Muthukumaran, S.; Wong, M.S. Green Infrastructure as an Urban Heat Island Mitigation Strategy—A Review. Water 2020, 12, 3577. [Google Scholar] [CrossRef]
- Marique, A.-F.; Reiter, S. A Simplified Framework to Assess the Feasibility of Zero-Energy at the Neighbourhood/Community Scale. Energy Build. 2014, 82, 114–122. [Google Scholar] [CrossRef] [Green Version]
- Brito, M.C.; Redweik, P.; Catita, C.; Freitas, S.; Santos, M. 3D solar potential in the urban environment: A case study in Lisbon. Energies 2019, 12, 3457. [Google Scholar] [CrossRef] [Green Version]
- Acero, J.A.; Arrizabalaga, J. Evaluating the performance of ENVI-met model in diurnal cycles for different meteorological conditions. Theoretic. Appl. Cimatol. 2018, 131, 455–469. [Google Scholar] [CrossRef]
- Thorsson, S.; Lindberg, F.; Eliasson, I.; Holmer, B. Different Methods for Estimating the Mean Radiant Temperature in an Outdoor Urban Setting. Int. J. Climatol. 2007, 27, 1983–1993. [Google Scholar] [CrossRef]
- Matzarakis, A.; Gangwisch, M.; Fröhlich, D. RayMan and SkyHelios Model. Urban Microclimate Modelling for Comfort and Energy Studies; Springer: Cham, Switzerland, 2021; pp. 339–361. [Google Scholar]
- Chen, Y.-C.; Lin, T.-P.; Matzarakis, A. Comparison of Mean Radiant Temperature from Field Experiment and Modelling: A Case Study in Freiburg Germany. Theor. Appl. Climatol. 2014, 118, 535–551. [Google Scholar] [CrossRef]
- Chen, L.; Yu, B.; Yang, F.; Mayer, H. Intra-Urban Differences of Mean Radiant Temperature in Different Urban Settings in Shanghai and Implications for Heat Stress under Heat Waves: A GIS-Based Approach. Energy Build. 2016, 130, 829–842. [Google Scholar] [CrossRef]
- Ao, X.; Grimmond, C.S.B.; Ward, H.C.; Gabey, A.M.; Tan, J.; Yang, X.-Q.; Liu, D.; Zhi, X.; Liu, H.; Zhang, N. Evaluation of the Surface Urban Energy and Water Balance Scheme (SUEWS) at a Dense Urban Site in Shanghai: Sensitivity to Anthropogenic Heat and Irrigation. J. Hydrometeorol. 2018, 19, 1983–2005. [Google Scholar] [CrossRef]
- Jänicke, B.; Meier, F.; Hoelscher, M.-T.; Scherer, D. Evaluating the Effects of Façade Greening on Human Bioclimate in a Complex Urban Environment. Adv. Meteorol. 2015, 2015, 747259. [Google Scholar] [CrossRef]
- Gál, C.V.; Kántor, N. Modeling Mean Radiant Temperature in Outdoor Spaces, A Comparative Numerical Simulation and Validation Study. Urban Clim. 2020, 32, 100571. [Google Scholar] [CrossRef]
- Crank, P.J.; Middel, A.; Wagner, M.; Hoots, D.; Smith, M.; Brazel, A. Validation of Seasonal Mean Radiant Temperature Simulations in Hot Arid Urban Climates. Sci. Total Environ. 2020, 749, 141392. [Google Scholar] [CrossRef] [PubMed]
- Liu, D.; Hu, S.; Liu, J. Contrasting the Performance Capabilities of Urban Radiation Field between Three Microclimate Simulation Tools. Build. Environ. 2020, 175, 106789. [Google Scholar] [CrossRef]
- Hämmerle, M.; Gál, T.; Unger, J.; Matzarakis, A. Comparison of Models Calculating the Sky View Factor Used for Urban Climate Investigations. Theor. Appl. Climatol. 2011, 105, 521–527. [Google Scholar] [CrossRef]
- Park, S.; Tuller, S.E. Advanced view factor analysis method for radiation exchange. Int. J. Biometeorol. 2014, 58, 161–178. [Google Scholar] [CrossRef] [PubMed]
- Fröhlich, D.; Matzarakis, A. Modeling of changes in thermal bioclimate: Examples based on urban spaces in Freiburg, Germany. Theor. Appl. Climatol. 2013, 111, 547–558. [Google Scholar] [CrossRef]
- Santos Nouri, A.; Fröhlich, D.; Matos Silva, M.; Matzarakis, A. The Impact of Tipuana tipu Species on Local Human Thermal Comfort Thresholds in Different Urban Canyon Cases in Mediterranean Climates: Lisbon, Portugal. Atmosphere 2018, 9, 12. [Google Scholar] [CrossRef] [Green Version]
- Fröhlich, D.; Matzarakis, A. Calculating human thermal comfort and thermal stress in the PALM model system 6.0. Geoscie. Model Dev. 2020, 13, 3055–3065. [Google Scholar] [CrossRef]
- Ketterer, C.; Matzarakis, A. Human-biometeorological assessment of heat stress reduction by replanning measures in Stuttgart, Germany. Landsc. Urban Plan. 2014, 122, 78–88. [Google Scholar] [CrossRef]
- Ketterer, C.; Matzarakis, A. Comparison of different methods for the assessment of the urban heat island in Stuttgart, Germany. Int. J. Biometeorol. 2015, 59, 1299–1309. [Google Scholar] [CrossRef]
- Huang, K.T.; Yang, S.R.; Matzarakis, A.; Lin, T.P. Identifying outdoor thermal risk areas and evaluation of future thermal comfort concerning shading orientation in a traditional settlement. Sci. Total Environ. 2018, 626, 567–580. [Google Scholar] [CrossRef]
- Peng, L.L.H.; Jim, C.Y. Green-Roof Effects on Neighborhood Microclimate and Human Thermal Sensation. Energies 2013, 6, 598–618. [Google Scholar] [CrossRef] [Green Version]
- Sodoudi, S.; Zhang, H.; Chi, X.; Müller, F.; Li, H. The influence of spatial configuration of green areas on microclimate and thermal comfort. Urban For. Urban Green. 2018, 34, 85–96. [Google Scholar] [CrossRef]
- Battisti, A. Bioclimatic Architecture and Urban Morphology. Studies on Intermediate Urban Open Spaces. Energies 2020, 13, 5819. [Google Scholar] [CrossRef]
- Goldberg, V.; Kurbjuhn, C.; Bernhofer, C. How relevant is urban planning for the thermal comfort of pedestrians? Numerical case studies in two districts of the City of Dresden (Saxony/Germany). Meteorol. Z. 2013, 22, 739–751. [Google Scholar] [CrossRef]
- CERC, Cambridge Environmental Research Consultants Ltd. 2020: Environmental Software. Available online: https://www.cerc.co.uk/environmental-software.html (accessed on 18 March 2020).
- Matzarakis, A.; Fröhlich, D. SkyHelios. Available online: https://www.urbanclimate.net/skyhelios/ (accessed on 20 March 2020).
- Hämmerle, M.; Gál, T.; Unger, J.; Matzarakis, A. Different aspects in the quantification of the Sky View Factor in complex environments. Acta Climatol. Chorol. 2014, 47, 53–62. [Google Scholar]
- Azar, S. TownScope. Available online: http://www.townscope.com (accessed on 10 March 2020).
- Oh, M.; Park, H.-D. A New Algorithm Using a Pyramid Dataset for Calculating Shadowing in Solar Potential Mapping. Renew. Energy 2018, 126, 465–474. [Google Scholar] [CrossRef]
- Lim, T.K.; Ignatius, M.; Miguel, M.; Wong, N.H.; Juang, H.-M.H. Multi-Scale Urban System Modeling for Sustainable Planning and Design. Energy Build. 2017, 157, 78–91. [Google Scholar] [CrossRef]
- McRae, I.; Freedman, F.; Rivera, A.; Li, X.; Dou, J.; Cruz, I.; Ren, C.; Dronova, I.; Fraker, H.; Bornstein, R. Integration of the WUDAPT WRF and ENVI-Met Models to Simulate Extreme Daytime Temperature Mitigation Strategies in San Jose California. Build. Environ. 2020, 184, 107180. [Google Scholar] [CrossRef]
- Jänicke, B.; Meier, F.; Lindberg, F.; Schubert, S.; Scherer, D. Towards City-Wide Building-Resolving Analysis of Mean Radiant Temperature. Urban Clim. 2016, 15, 83–98. [Google Scholar] [CrossRef]
- Wong, N.H.; He, Y.; Nguyen, N.G.; Raghavan, S.V.; Martin, M.; Hii, D.J.C.H.; Yu, Z.; Deng, J. An Integrated Multiscale Urban Microclimate Model for the Urban Thermal Environment. Urban Clim. 2021, 35, 100730. [Google Scholar] [CrossRef]
- Pelorosso, R. Modeling and Urban Planning: A Systematic Review of Performance-Based Approaches. Sustain. Cities Soc. 2020, 52, 101867. [Google Scholar] [CrossRef]
- Lenzholzer, S.; Brown, R.D. Post-Positivist Microclimatic Urban Design Research: A Review. Landsc. Urban Plan. 2016, 153, 111–121. [Google Scholar] [CrossRef]
- Jakubiec, J.A.; Reinhart, C. DIVA-FOR-RHINO 2.0: Environmental parametric modeling in rhinoceros/grasshopper using RADIANCE, Daysim and EnergyPlus. In Proceedings of the Conference Proceedings of Building Simulation, Sydney, Australia, 14–16 November 2011. [Google Scholar]
- Sharlin, N.; Hoffman, M.E. The Urban Complex as a Factor in the Air-Temperature Pattern in a Mediterranean Coastal Region. Energy Build. 1984, 7, 149–158. [Google Scholar] [CrossRef]
- Swaid, H.; Hoffman, M.E. Prediction of Urban Air Temperature Variations Using the Analytical CTTC Model. Energy Build. 1990, 14, 313–324. [Google Scholar] [CrossRef]
- Swaid, H.; Hoffman, M.E. Thermal Effects of Artificial Heat Sources and Shaded Ground Areas in the Urban Canopy Layer. Energy Build. 1990, 15, 253–261. [Google Scholar] [CrossRef]
- Elnahas, M.M.; Williamson, T.J. An Improvement of the CTTC Model for Predicting Urban Air Temperatures. Energy Build. 1997, 25, 41–49. [Google Scholar] [CrossRef]
- Gholami, M.; Shemirani, M.M.; Fayaz, R. A Modelling Methodology for a Solar Energy-Efficient Neighbourhood. SASBE 2018, 7, 117–132. [Google Scholar] [CrossRef]
- Maronga, B.; Banzhaf, S.; Burmeister, C.; Esch, T.; Forkel, R.; Fröhlich, D.; Fuka, V.; Gehrke, K.F.; Geletič, J.; Giersch, S.; et al. Overview of the PALM model system 6.0. Geosci. Model Dev. 2020, 13, 1335–1372. [Google Scholar] [CrossRef]
- Resler, J.; Eben, K.; Geletič, J.; Krč, P.; Rosecký, M.; Sühring, M.; Belda, M.; Fuka, V.; Halenka, T.; Huszár, P.; et al. Validation of the PALM model system 6.0 in a real urban environment: A case study in Dejvice, Prague, the Czech Republic. Geosci. Model Dev. 2021, 14, 4797–4842. [Google Scholar] [CrossRef]
- Belda, M.; Resler, J.; Geletič, J.; Krč, P.; Maronga, B.; Sühring, M.; Kurppa, M.; Kanani-Sühring, F.; Fuka, V.; Eben, K.; et al. Sensitivity analysis of the PALM model system 6.0 in the urban environment. Geosci. Model Dev. 2021, 14, 4443–4464. [Google Scholar] [CrossRef]
Figure 1.
Flow chart of the methods used to identify, assess the eligibility of models and their inclu-sion/exclusion from full review.
Figure 1.
Flow chart of the methods used to identify, assess the eligibility of models and their inclu-sion/exclusion from full review.


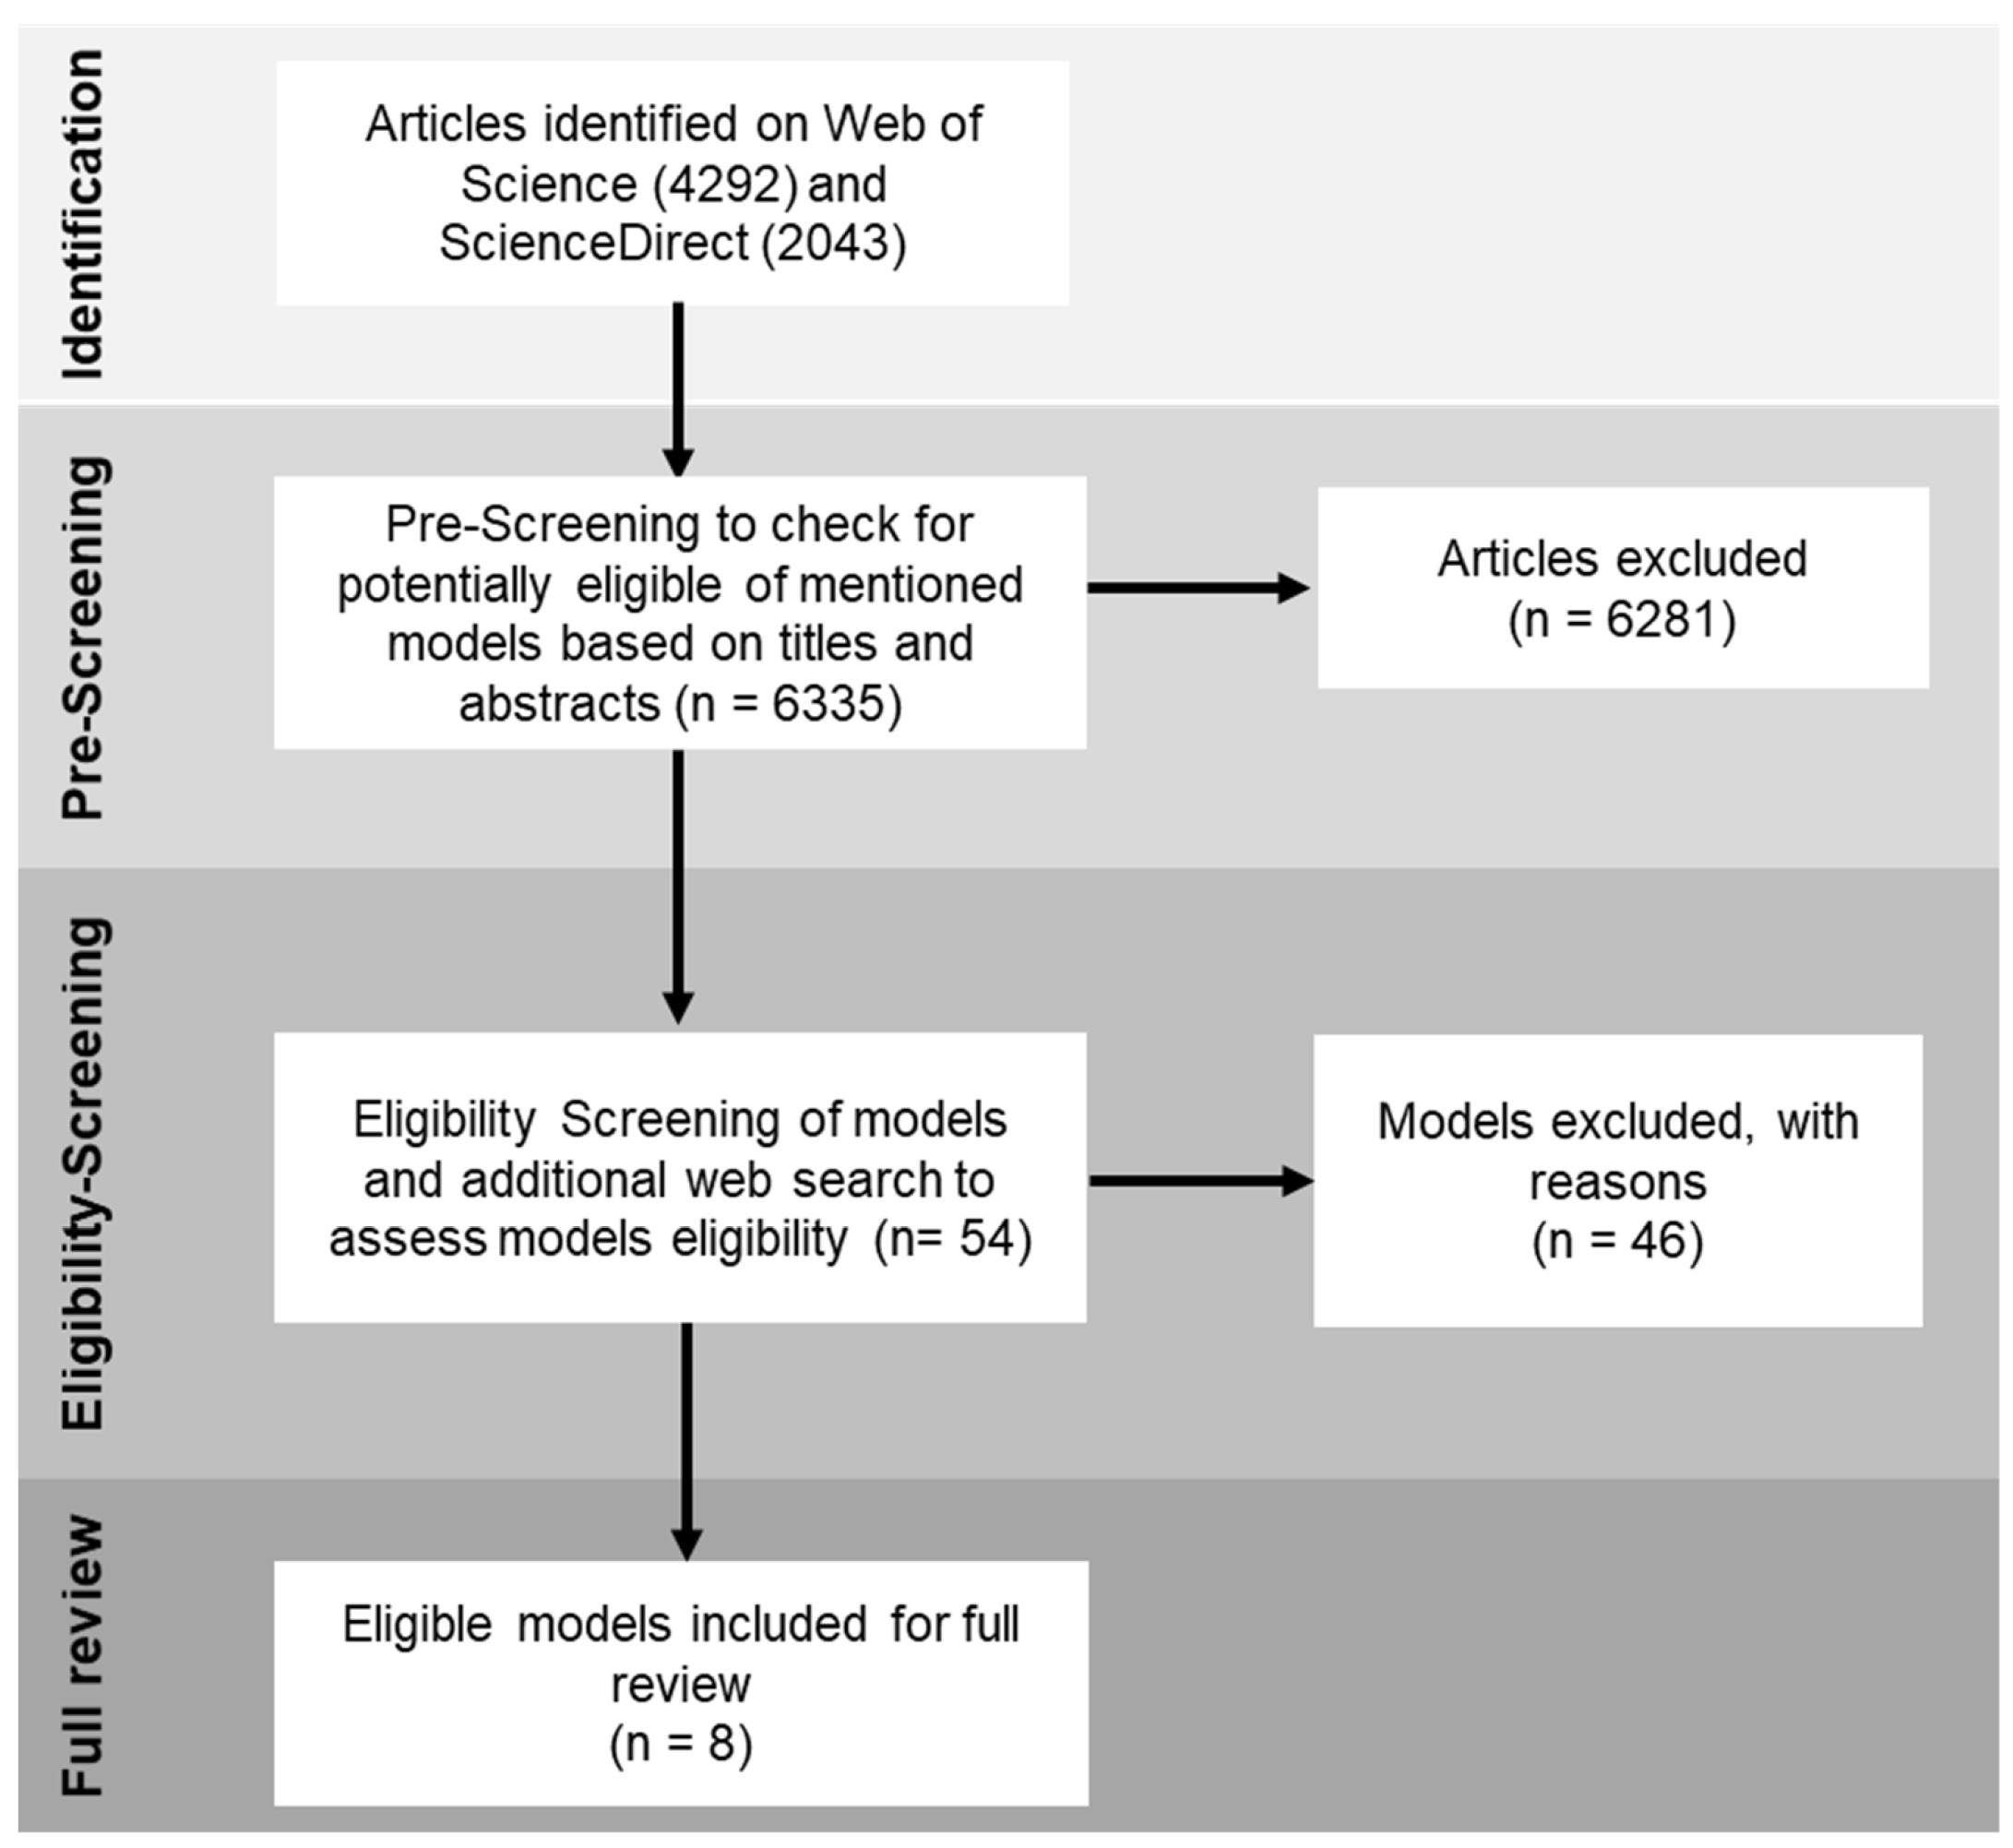
Table 1.
Flow chart of the methods used to identify, assess the eligibility of models and their inclu-sion/exclusion from full review.
Table 1.
Flow chart of the methods used to identify, assess the eligibility of models and their inclu-sion/exclusion from full review.
| No. | Name | Reference | Inclusion (Y/N) | Exclusion Reason(s) |
|---|---|---|---|---|
| 1 | ADMS Temperature and Humidity model | [22] | Y | None |
| 2 | (Advanced) SkyHelios model | [23] | Y | None |
| 3 | AKL FlowDesigner | [24] | N | 1 |
| 4 | ANSYS FLUENT | [25] | Y | None |
| 5 | AUSSSM-Tool | [26] | N | 3 |
| 6 | BioCAS | [27] | N | 4, 7 |
| 7 | CBE Thermal Comfort Tool | [28] | N | 2, 3 |
| 8 | City Energy Analyst (CEA) | [29] | N | 5 |
| 9 | CityBES | [30] | N | 3 |
| 10 | CityComfort+ | [31] | N | 6 |
| 11 | CityFeel | [32] | N | 3, 6, 7 |
| 12 | CITYgreen | [33] | N | 2, 5, 6, 7 |
| 13 | CitySim | [34] | N | 1, 7 |
| 14 | Climate Mapping Tool | [35] | N | 2, 3 |
| 15 | COMFA model | [36] | N | 2, 3, 6 |
| 16 | Decision Support System (DSS) | [37] | N | 3 |
| 17 | Ecotect Win-Air | [38] | N | 1, 7 |
| 18 | ENVI-met | [39] | Y | None |
| 19 | FITNAH | [40] | N | 3, 6, 7 |
| 20 | Green CTTC Model/CTTC model | [41] | N | 6, 7 |
| 21 | Griha LD online model | [42] | N | 1.7 |
| 22 | INKAS | [43] | N | 3, 4 |
| 23 | Lucy model | [44] | N | 3,,5 |
| 24 | MeteoInfo | [45] | N | 3 |
| 25 | MIMO | [46] | N | 6, 7 |
| 26 | Mitigation Impact Screening Tool (MIST) | [47] | N | 3 |
| 27 | MUKLIMO-3 Basis/Thermodynamic version | [48,49] | N | 5, 6, 7 |
| 28 | OpenFOAM mircoscale model | [50] | N | 6 |
| 29 | OTC Model | [51] | N | 7 |
| 30 | OutdoorROOM | [52] | N | 7 |
| 31 | PALM | [53] | N | 6 |
| 32 | QUIC EnvSim | [54] | N | 7 |
| 33 | RayMan | [55] | Y | None |
| 34 | SCORCHIO tool | [56] | N | 4, 7 |
| 35 | Simple Urban Radiation Model (SURM) | [57] | N | 3, 6 |
| 36 | SimStadt | [58] | N | 1, 5 |
| 37 | ThermoRender | [59] | Y | 7 |
| 38 | SOLENE Microclimate | [60] | N | 7 |
| 39 | SOLWEIG | [61] | Y | None |
| 40 | SPOTE | [62] | N | 7 |
| 41 | The Surface Temperature And Runoff (STAR) Tools | [63] | N | 4 |
| 42 | STEVE | [10] | N | 4 |
| 43 | SUEWS | [64] | N | 5 |
| 44 | SUNtool | [65] | N | 7 |
| 45 | SVF mapping tool | [66] | N | 5 |
| 46 | TownScope | [67] | Y | None |
| 47 | TUF-3D | [68] | N | 5 |
| 48 | UBIKLIM | [69] | N | 3 |
| 49 | UHI Atlas | [70] | N | 3, 4 |
| 50 | UMEP | [71] | Y | None |
| 51 | UMI | [72] | N | 5 |
| 52 | Umsim | [73] | N | 7 |
| 53 | Urban Weather Generator | [74] | N | 1, 3 |
| 54 | WRF-UCM | [75] | N | 3 |
Table 2.
Review matrix of user-friendly models included in this review.
| No. | Name | Reference | Simulated Variables | Bioclimatic Indices/Variables | Ventilation Aspects | Plants | Supported Data Formats | Linkage (to GIS/CAD) | Pay-/Free-Ware | Example(s) of Evaluation Studies | Number of Publications in Science Direct (Web of Science) | |
|---|---|---|---|---|---|---|---|---|---|---|---|---|
| Mentioning Model Name | Mentioning Model Name and Urban Climate or Micro-Climate | |||||||||||
| 1 | ADMS Temperature and Humidity model | [22] | Ts, Ta, Q, Tmrt | - | X | X | .csv, specifc | GIS | Pay | [76] | 72 (41) | 0 (1) |
| 2 | advanced SkyHelios model | [23] | Ws, Wd, Q, Tmrt | PT, UTCI, PET | X | X | grid/vector | GIS/CAD | Free | [23] | 0 (1) | 1 (5) |
| 3 | ANSYS FLUENT | [25] | Ta, Ts, Q, Ws, Wd, others | - | X | X | specific formats | CAD | Pay | [77] | 1503 (2954) | 5 (8) |
| 4 | ENVI-met | [39] | Ta, Ts, Q, Ws, Wd, others | PMV, UTCI, PET, SET | X | X | specific formats, Net-CDF-Output possible | CAD/GIS | Pay | Numerous studies (see review by [78]) | 264 (389) | 179 (281) |
| 5 | RayMan | [79] | Q, Tmrt, Ts | PET, SET, PMV, mPET, UTCI, PT | X | X | .txt, specific formats | GIS | Free | [14,55] | 49 (122) | 25 (53) |
| 6 | SOLWEIG | [61] | Q, Tmrt | - | X | .shp, .txt, .tif | GIS | Free | [61,80,81] | 12 (29) | 5 (11) | |
| 7 | TownScope | [67] | Q | Sweat rate, sweatevaporation, skin wetness | X | X | specific formats | CAD | Pay | [82,83] | 3 (3) | 0 (0) |
| 8 | Urban Multi-scale Environmental Predictor (UMEP) | [71] | Ta, Q, Tmrt, T | - | X | .shp, .txt, .tif | GIS | Free | see examples for SOLWEIG | 2 (2) | 1 (1) | |
The abbreviations for simulated variables are Ts: surface temperature, Ta: air temperature, Q: long- and short-wave radiation, Tmrt: mean radiant temperature, Ws: wind speed, and Wd: wind direction. For the bioclimatic indices PT: Perceived Temperature, UTCI: Universal Thermal Climate Index, PET: Physiological Equivalent Temperature, mPET: modified Physiological Equivalent Temperature, SET: Standard Effective Temperature, and PMV: Predicted Mean Vote.
Table 3.
Overview of available support and training material for the user-friendly models. X indicated that the information is available.
Table 3.
Overview of available support and training material for the user-friendly models. X indicated that the information is available.
| Name | Man-ual/ | For-um/Support | Tutorials, Videos | Training Courses | Website/ |
|---|---|---|---|---|---|
| ADMS-TH | x | x | https://www.cerc.co.uk/environmental-software/ADMS-Urban-model.html (accessed on 2 October 2021) | ||
| advanced SkyHelios model | x | x | https://www.urbanclimate.net/skyhelios/ (accessed on 2 October 2021) | ||
| ANSYS FLUENT | x | x | x | x | https://www.ansys.com/training-center/ (accessed on 2 October 2021) |
| ENVI-met | x | x | x | https://www.envi-met.com (accessed on 2 October 2021) | |
| RayMan | x | x | x | x | https://www.urbanclimate.net/rayman/ (accessed on 2 October 2021) |
| SOLWEIG | x | x | x | x | https://umep-docs.readthedocs.io/projects/tutorial/en/latest/Tutorials/IntroductionToSolweig.html (accessed on 2 October 2021) |
| TownScope | x | x | x | x | www.townscope.com (accessed on 2 October 2021) |
| UMEP | x | x | x | x | https://umep-docs.readthedocs.io/en/latest/ (accessed on 2 October 2021) |
Publisher’s Note: MDPI stays neutral with regard to jurisdictional claims in published maps and institutional affiliations. |
© 2021 by the authors. Licensee MDPI, Basel, Switzerland. This article is an open access article distributed under the terms and conditions of the Creative Commons Attribution (CC BY) license (https://creativecommons.org/licenses/by/4.0/).
Share and Cite
MDPI and ACS Style
Jänicke, B.; Milošević, D.; Manavvi, S. Review of User-Friendly Models to Improve the Urban Micro-Climate. Atmosphere 2021, 12, 1291. https://0-doi-org.brum.beds.ac.uk/10.3390/atmos12101291
AMA Style
Jänicke B, Milošević D, Manavvi S. Review of User-Friendly Models to Improve the Urban Micro-Climate. Atmosphere. 2021; 12(10):1291. https://0-doi-org.brum.beds.ac.uk/10.3390/atmos12101291
Chicago/Turabian StyleJänicke, Britta, Dragan Milošević, and Suneja Manavvi. 2021. "Review of User-Friendly Models to Improve the Urban Micro-Climate" Atmosphere 12, no. 10: 1291. https://0-doi-org.brum.beds.ac.uk/10.3390/atmos12101291
Note that from the first issue of 2016, this journal uses article numbers instead of page numbers. See further details here.