
Tracers from Biomass Burning Emissions and Identification of Biomass Burning
by
 ,
,
Wenjing Li
1,2, 
Pengxiang Ge
2,
Mindong Chen
2,*,
Jiajie Tang
3,
Maoyu Cao
2,
Yan Cui
2,
Kun Hu
2 and
Dongyang Nie
4 1
Institute of Meteorological Development and Planning, China Meteorological Administration, Beijing 100081, China
2
School of Environmental Science and Engineering, Nanjing University of Information Science and Technology, Nanjing 210044, China
3
School of Atmospheric Sciences, Lanzhou University, Lanzhou 730000, China
4
School of Atmospheric Sciences, Nanjing University, Nanjing 210023, China
*
Author to whom correspondence should be addressed.
Atmosphere 2021, 12(11), 1401; https://0-doi-org.brum.beds.ac.uk/10.3390/atmos12111401
Submission received: 30 August 2021
/
Revised: 11 October 2021
/
Accepted: 18 October 2021
/
Published: 26 October 2021
(This article belongs to the Special Issue Emissions from Biomass Burning)
Abstract
:The major organic compositions from biomass burning emissions are monosaccharide derivatives from the breakdown of cellulose, generally accompanied by small amounts of straight-chain, aliphatic, oxygenated compounds, and terpenoids from vegetation waxes, resins/gums, and other biopolymers. Levoglucosan from cellulose can be utilized as a specific or general indicator for biomass combustion emissions in aerosol samples. There are other important compounds, such as dehydroabietic acid, syringaldehyde, syringic acid, vanillic acid, vanillin, homovanillic acid, 4-hydroxybenzoic acid, and p-coumaric acid, which are additional key indicators of biomass burning. In this review, we will address these tracers from different types of biomass burning and the methods used to identify the sources in ambient aerosols. First, the methods of inferring biomass burning types by the ratio method are summarized, including levoglucosan/mannose, syringic acid/vanillic acid, levolgucosan/K+, vanillic acid/4-hydroxybenzoic acid, levoglucosan/OC, and levoglucosan/EC to infer the sources of biomass burning, such as crop residual burning, wheat burning, leaf burning, peatland fire, and forest fire in Asia. Second, we present the source tracer ratio methods that determine the biomass combustion types and their contributions. Finally, we introduce the PCA (Principal component analysis) and PMF (Positive matrix factor) methods to identify the type of biomass burning and its contributions according to emission factors of different species in various plants such as softwood, hardwood, and grass.
Highlights
- Key tracers from different biomass burning emissions are introduced in this review.
- Methods applied to identify biomass burning types are introduced, and their advantages and disadvantages are also concluded.
- The details of PMF to infer biomass burning types and source contributions are also included.
1. Introduction
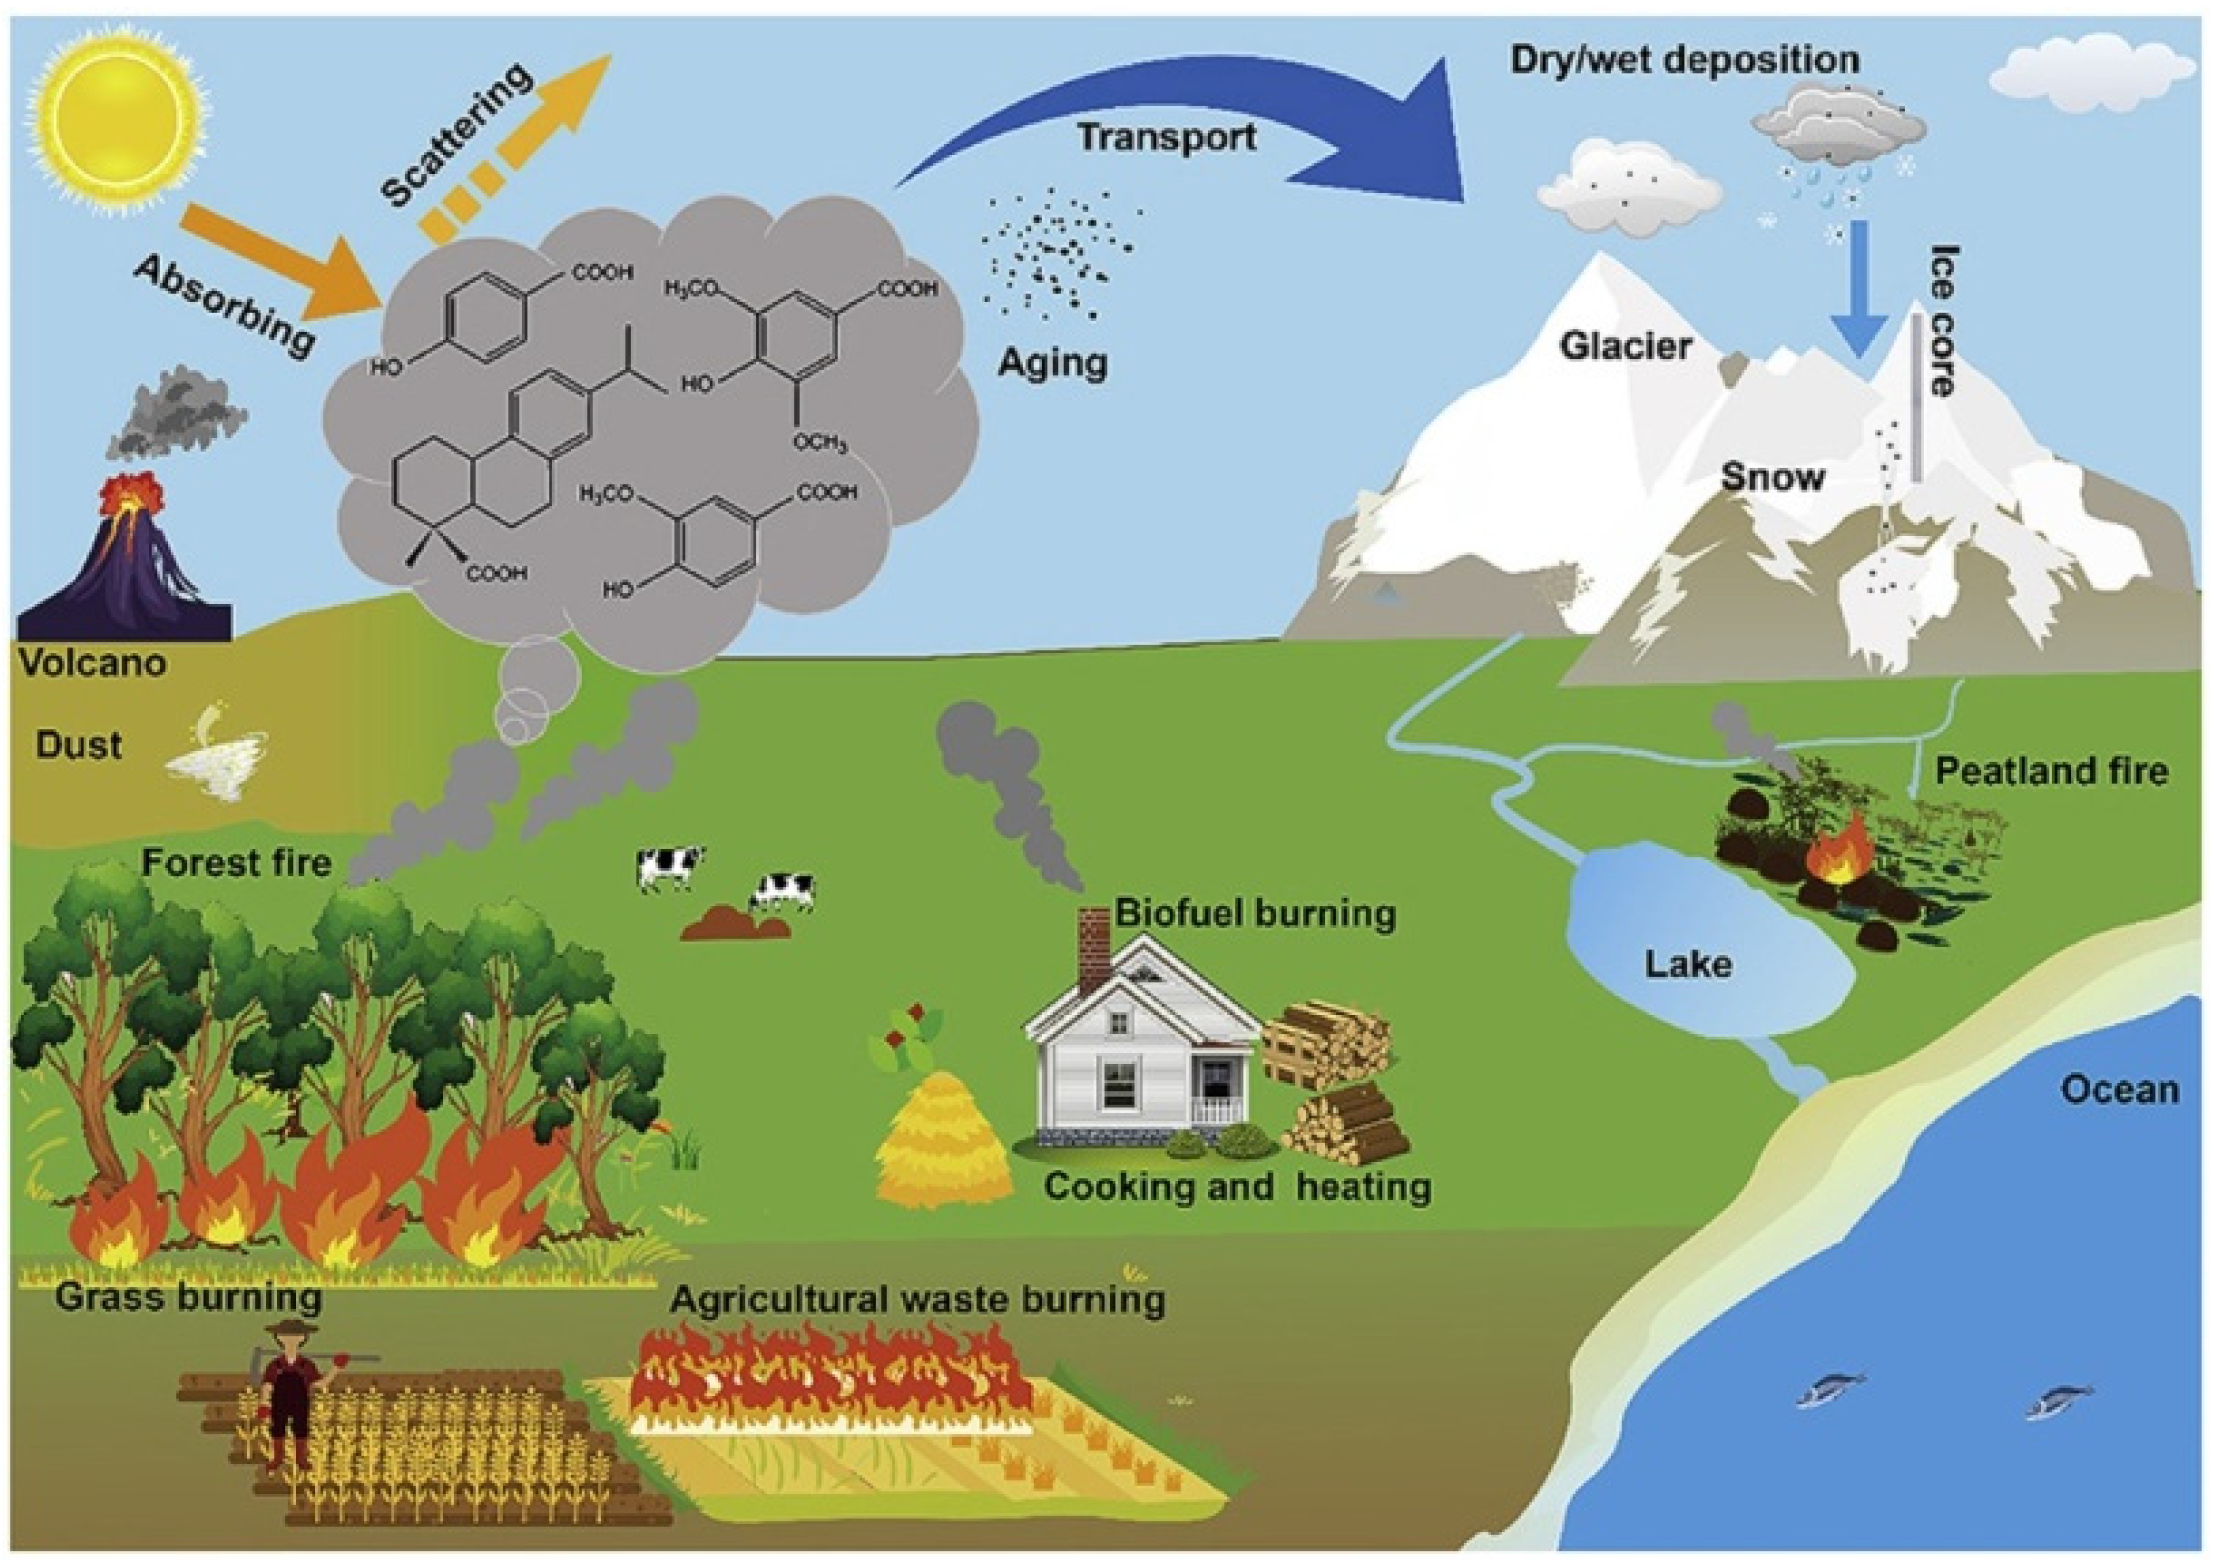
Biomass burning such as wildfire, agricultural open-burning, residential biofuel combustion, forest fire, grass burning, and peatland fire can produce and release substantial amounts of pollutants into the atmosphere [1,2]. Aerosols released from biomass burning have a serious influence on climate change, the ecosystem, regional/global air quality, visibility, and human health, which had drawn global concern all over the world [3,4]. Biomass burning contributes much greater carbonaceous aerosol emissions in regions with intense fires [5,6]. These emissions can be transported over long distances and affect areas far away from the source region [7,8,9,10]. Previous assessments of biomass burning emissions using combustion by-products as tracers have studied the following: (1) pollutants containing volatile, gaseous carbonaceous compounds such as CO, CO2, CH4, C2H4, HCN, HCO2H, CH3CO2H, CH3CN, and aerosols, especially organic carbon and black carbon; (2) macromolecular smoke particles in the form of soot or charcoal; (3) solvent-soluble organic compounds isolated from smoke particulate matter such as polynuclear aromatic hydrocarbons (PAH); and (4) the source of biomass burning in aerosols based on different methods such as the ratio of tracers [11,12,13]. Thus far, there is a lack of relative complete information about biomass burning emissions, especially using unique tracers to identify the source. In order to better understand biomass burning, comprehensive information about biomass tracers of different combustions and methods to infer burning types are illustrated in this review. For example, Figure 1 showed that the biomass burning sources, transport and deposition in environment and atmosphere. Furthermore, our future work is also displayed.
1.1. Biomass Burning Process
The process of biomass burning is briefly described as follows. When biomass fuels are heated, with the increase of temperature, the compositions gradually begin to hydrolyze, oxidize, dehydrate, and pyrolyze, forming combustible volatile products, tarry substances, and highly active carbonaceous char [15]. At the ignition temperature of the tarry substances and volatiles, combustion reactions begin. As for complete combustion, carbon continues to be formed until no solid fuel remains in the ash and no combustion gas in the smoke. For incomplete combustion, there is still residual fuel in the smoke. The emissions produced by the combustion of fuels are directly dependent on the chemical composition of the fuel and the combustion conditions.
1.2. Organic Compounds from Biomass Burning
Due to the unique signatures of organic molecular tracers in the atmosphere, they play an important role in identifying biomass fuel combustion [16,17]. Cellulose, hemicellulose, lignin, sporopollenin, and suberin are important units of biomass fuels, and their pyrolysis products are widely used as unique tracers of biomass burning in the atmosphere [18,19]. Simoneit et al. identified a series of tracers in aerosols that are influenced by biomass burning, including alkane homologs, polycyclic aromatic hydrocarbons, pineic acids, sugars in cellulose, and methoxyphenols in lignin by Gas chromatography-mass spectrometry/mass spectrometry (GC-MS/MS) as shown in Figure 2 [14,16,17,19,20].
1.2.1. Lignin Products
Lignin is an essential biopolymer of wood, which is derived primarily from three aromatic alcohols, which are named sinapyl, coniferyl, and p-coumaryl alcohols. The degradation products produced by lignin burning were mainly three kinds of compounds [14,21]. The proportions of these molecular markers vary greatly among different plant species. For example, lignins of hardwoods (angiosperms) are abundant products of sinapyl alcohol, whereas lignins of softwoods (gymnosperms) have a relatively high proportion of products from coniferyl alcohol, with a lesser composition from sinapyl alcohol; whereas grass products are dominantly from p-coumaryl alcohol [12,22]. The lignin combustion usually produces phenols, aldehydes, ketones, acids, and alcohols, which retain the components on the original benzene ring, such as hydroxyl and methoxy. During combustion, both softwood and hardwood can produce guaiacol derivatives such as 2-methodyphenol, but hardwood also can produce high levels of sryingol derivatives like 1,3-dimethoxyphenol [23,24]. Hawthorne et al. identified that guaiacol derivatives are potential tracers of wood-burning, while syringyl derivatives are indicators for hardwood burning [23,24]. Most woody plants are abundant in lignans, which are critical dimers of sinapyl, p-coumaryl, and coniferyl alcohols [25,26]. They provide supportive fillers, toxins, and other uses for plants [26].
Softwood Lignin
Methoxyphenol is the main compound produced by softwood lignin decomposition. Vanillic acid is derived from coniferyl alcohol, which is the main aromatic alcohol monomer unit in gymnosperm lignin and is a specific tracer of conifers [21]. For example, pine wood burning releases mainly vanillic acid and vanillin and lesser amounts of other pyrolysis compounds, syringic acid, syringaldehyde, and p-anisic acid. The diterpenoid dehydroabietic acid is determined in all samples and is the main product of resin acids, which are source-specific [21,27].
Hardwood Lignin
A series of methoxyphenols are also produced from the burning of hardwood lignin. These compounds are derived from syringyl alcohol, which is enriched in hardwood lignin and primarily includes syringyl acetone, acetosyringone, syringic acid, and the dimer species of disyringyl. Angiosperm lignin contains high levels of the coniferyl and sinapyl alcohol subunits, which are the precursors of oxidation and pyrolysis products of syringol and methoxyphenol [28]. For example, hardwoods, such as oak, have rich quantities of syringic acid and syringaldehyde in their smoke. There are different amounts of sinapine-type and other pyrolysis products, which are consistent with angiosperm lignin as the source, as well as a small amount of vanillin-type products. Hawthorne et al. and Simoneit et al. concluded that the syringyl molecular markers are indicators in smoke produced by angiosperm fuels burning [21,29,30]. The molecular biomarkers, including ursana-2, 12-dien-18-oicacids, oleana-2, and 12-dien18-oic are the thermal degradation products from ursolic acids and oleanolic, respectively, and the major triterpenoids in angiosperm mucilages and gums [31,32].
Grass Lignin
In order to have a good knowledge of organic tracers released from grass burning, previous studies collected aerosol samples from the smoke of mixed ryegrasses consisting dominantly of n-alkanoic acids, levoglucosan, and phenolic compounds, including syringyl acetone, catechol, guaiacyl acetone, dimethoxyphenol, syringic acid, vanillyl acetic acid, and vanillic acid [17]. However, other studies have found that the burning of grass mainly releases p-anisic acid, p-anisaldehyde, and minor amounts of other p-coumaryl, vanillyl, and syringyl-type lignin pyrolysis products such as p-coumaric acid, 4-hydroxybenzoic acid, and syringic acid [12,17]. The grasses include all kinds of phenolic moieties of lignin precursor alcohols. Therefore, the thermal decomposition products are not representative tracers for grass burning, except for p-coumaric acid and 4-hydroxybenzoic acid, which are not prevalent in hardwood and softwood [12,33]. Therefore, the relative proportion of these compounds can also be used to identify grass burning.
1.2.2. Cellulose
The combustion process of cellulose and hemicellulose has been studied extensively in the past [15,34,35,36]. Cellulose decomposes via two alternative pathways when heated or exposed to an ignition source. At first, it is decomposed at 300 °C and then begins to bond, cleave, undergo fission and disproportionation, and produce tar anhydrous sugars and volatile products by transglycosylation. The second pathway produces molecular tracers from a specific source such as levoglucosan, the furanose isomer, and dianhydride. It is reported that L-glucan is present as fine particles from the burning of residential wood [37,38]; it is very stable in the atmosphere and has no chemical reaction after being exposed to sunlight and environmental conditions for 8 h [39,40,41,42]. Furthermore, L-glucan can have large-scale impacts on the chemical composition of atmospheric aerosols on a regional to global scale. Due to its water-solubility, levoglucosan contributes to water-soluble organic carbon in aerosols and significantly enhances the hygroscopic properties of atmospheric aerosols [43]. In addition, it is reported that levoglucosan exists in pyrolysis products of peat wood and lignocellulose burnings [44,45]. Mannosan and galactosan, isomers of levoglucosan, are produced by pyrolysis of cellulose and hemicellulose and can also be regarded as biomass burning tracers [17,46].
1.3. LC-MS/MS
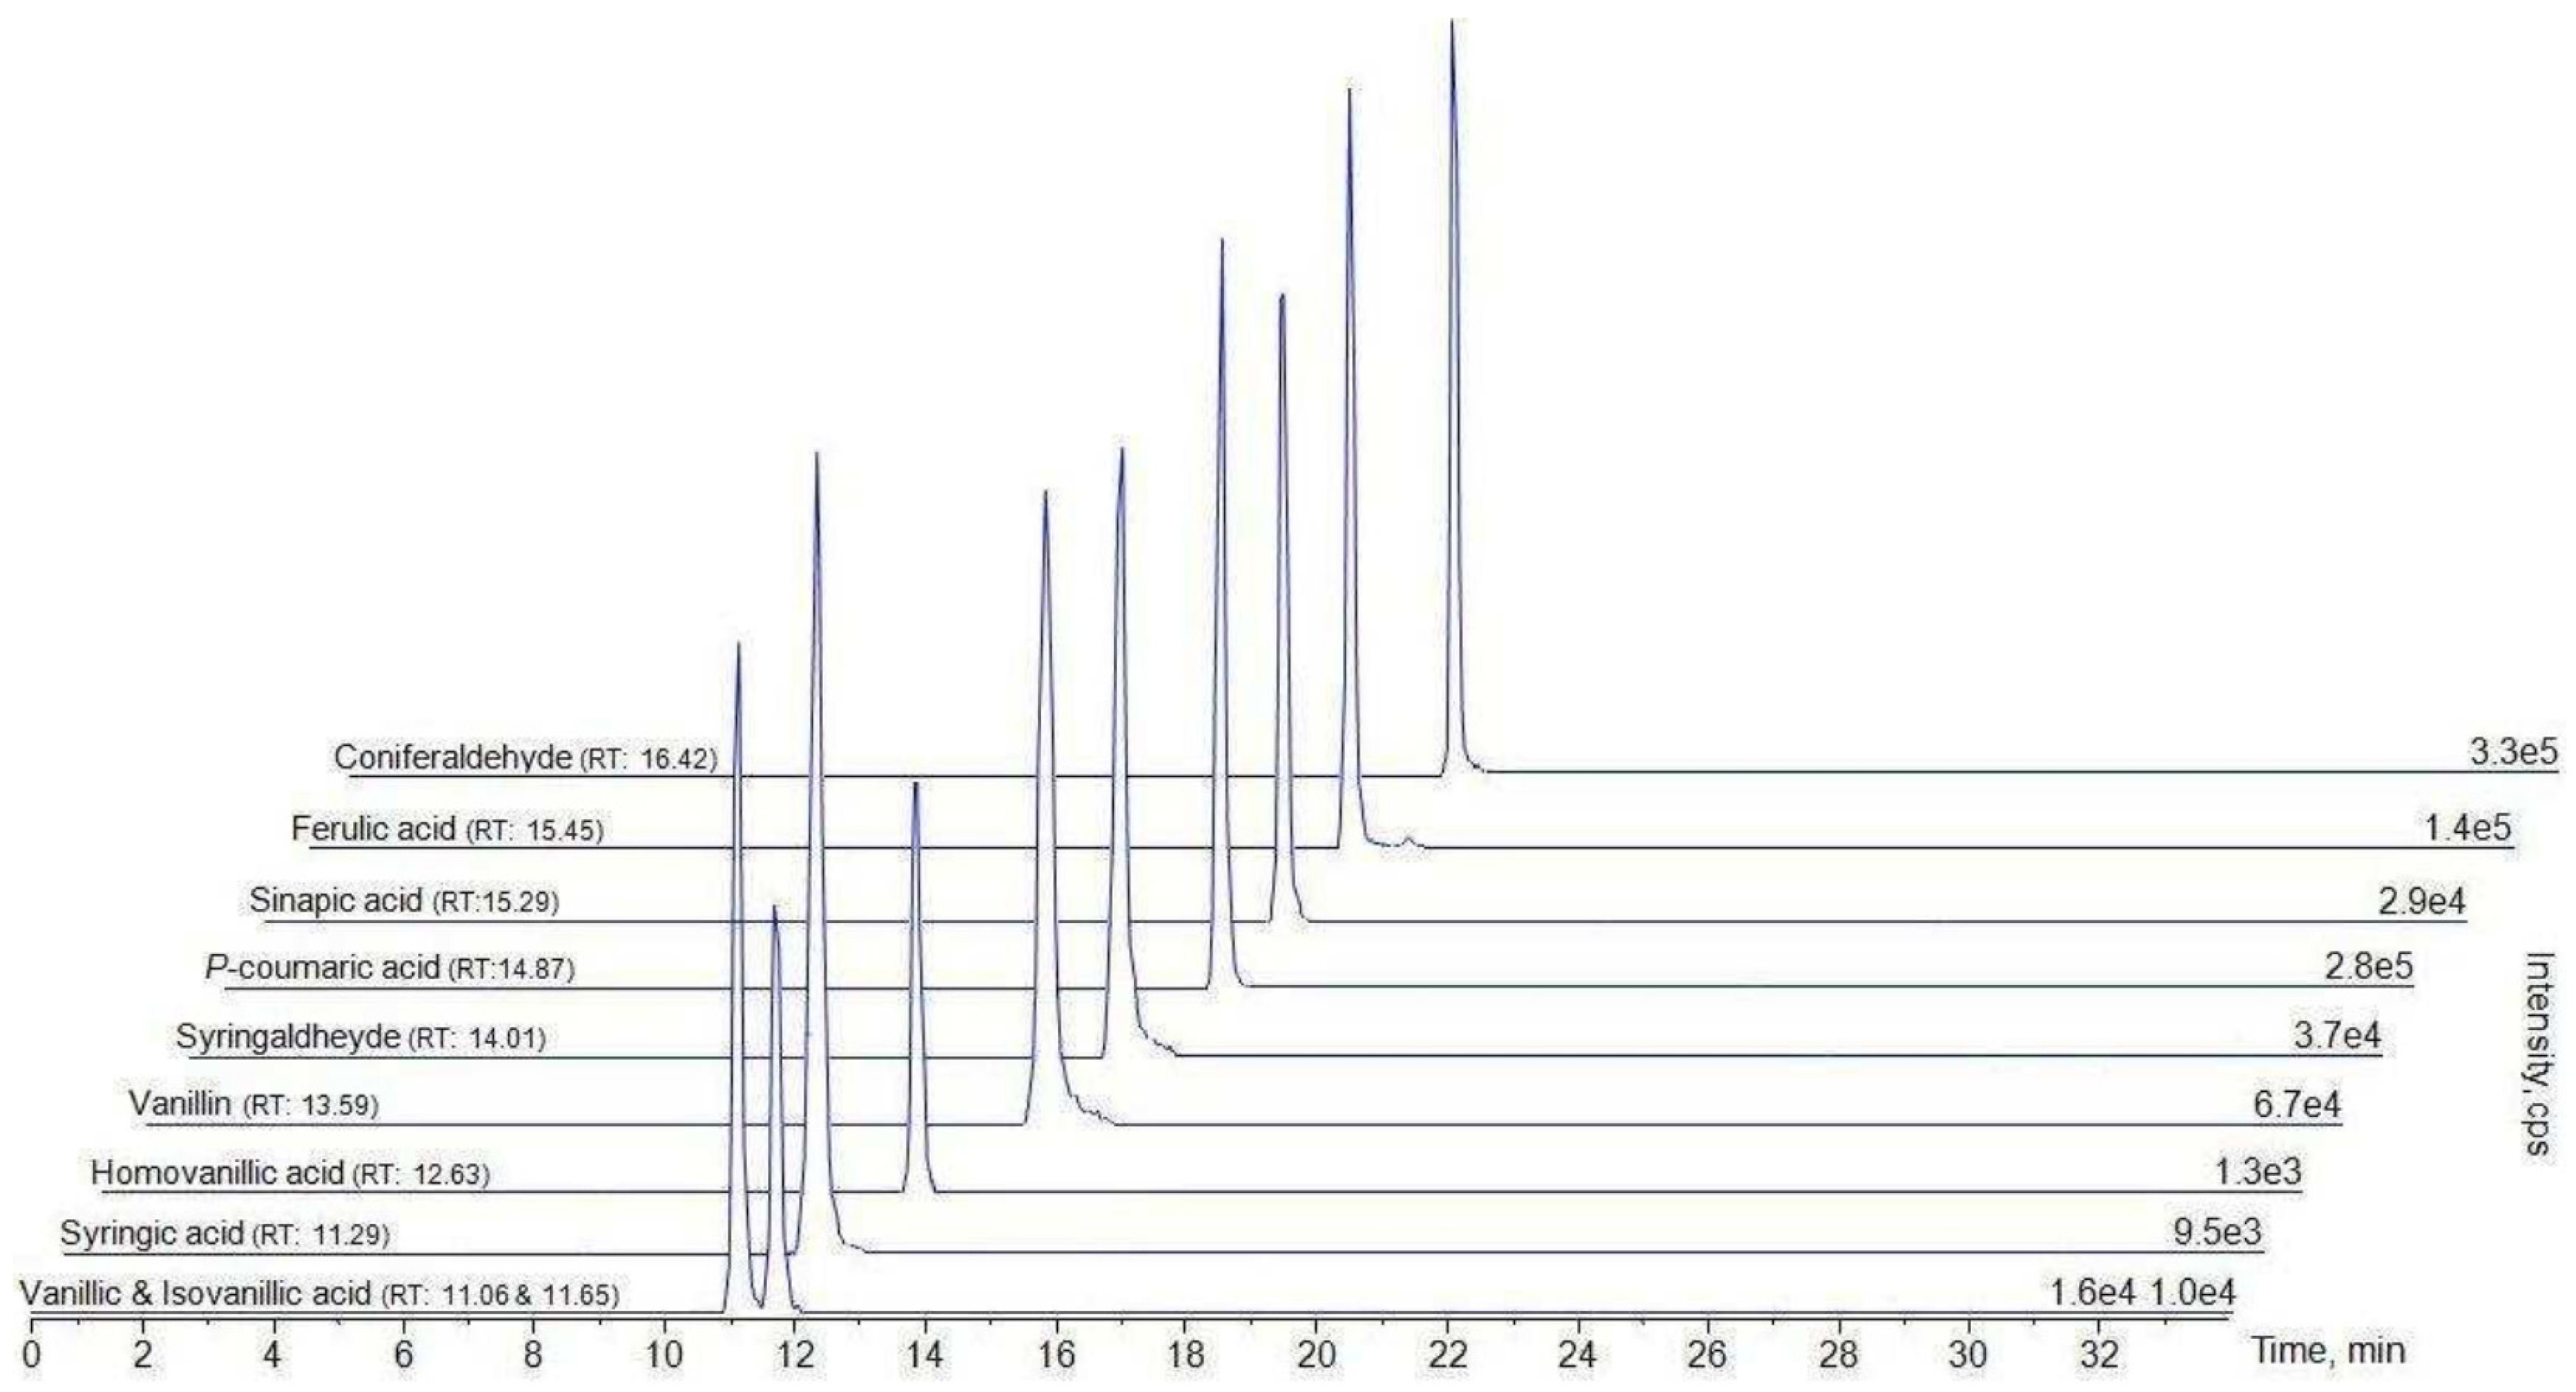
Liquid chromatography-tandem mass spectrometry (LC-MS/MS) is utilized to quantify aromatic acids such as biomass burning tracers, is pretty effective, and has simplified the pretreatment of samples without needing derivatization of biomass burning products like vanillic acid, isovanillic acid, homovanillic acid, and syringic acid. For example, Hoffmann et al. developed and validated an HPLC-APCI-MS/MS (high-performance liquid chromatography-atmospheric pressure chemical ionization-tandem mass spectrometry) method for measuring biomass burning tracers [47,48]. The analysis time is short (only 15 min), the detection limit is low, and the recovery rate is high, which is suitable for the identification and quantification of aromatic acids in aerosol or other samples. More recently, in the research of Zangrando [8]., an effective and rapid HPLC-(-)-ESI-MS/MS (high-performance liquid chromatography-(-)-electrospray ionization-tandem mass spectrometry) analytical method was reported for quantitative determinations of aromatic acids, such as biomass burning tracers. An example of a total ion chromatographic analysis is shown in Figure 3 [12,49]. In addition, this approach shows considerably low limits of detection for vanillic acid and syringic acid. In our previous study, a fast and effective HPLC-MS/MS method was developed and validated, and 20 kinds of biomass burning tracers in aerosol samples were successfully determined, with low limits of detection and high accuracy in 10 min analyses. The preparation of aerosol samples is a single-step derivation saving more time than before. The details of this method and aerosol sample preparation can be obtained in [50,51].
2. Determination of Biomass Burning Types
Lignin pyrolysis products are an important component of the fine aerosol particles from wood and biomass burning [21,52]. However, the presence of individual syringyl, coumaryl, or vanillyl-type compounds in an aerosol or smoke sample cannot be a unique indicator for the original sources of biomass burning, but the relative proportions of such tracers can be used to distinguish the type of burned fuels. At present, there are many methods to determine biomass burning types, such as tracer ratios, principal component analysis, source tracer ratio, positive matrix factor analysis, etc. The following describes the advantages and disadvantages of these methods. Because of complex atmospheric processes like photochemical aging, phase-separation/partition and deposition, and varied chemical lifetimes, characteristic tracers and specific ratios have constraints in targeting transported pollution sources and classifying the contributions of the respective biofuels. Therefore, we select stable, long-lifetime compounds as biomass burning tracers to improve the results of identifying biomass burning types.
2.1. The Ratios of Tracers to Identify the Type of Biomass Burning
The most common and basic method for identifying the type of biomass burning in the atmosphere is the ratio method. In previous studies, the ratio method was divided into four types, including the ratios of levoglucosan to mannosan [53], levoglucosan to OC [54,55], levoglucosan to potassium, vanillic acid to syringic acid, and syringic acid to 4-hydroxybenzoic acid [56].
2.1.1. Levoglucosan/K+
Previous studies used the levoglucosan/potassium (Levo/K+) ratio to distinguish specific types of biomass burning in ambient aerosols [57]. For forest fire aerosols, the ratio of Levo/K+ is typically above zero; for example, the ratio in Amazon forest fire smoke is 0.38–22.0, and the ratio in U.S. forest fire smoke is 4.35–58.8 [58,59,60]. Incineration of agricultural wastes is typically found to have a relatively low ratio of Levo/K+ because potassium fertilizer is a large K+ contributor. For example, Cheng et al. reported that the burning of crop residuals such as wheat straw, rice straw, and corn straw had a Levo/K+ ratio that was higher during the winter (0.51 ± 0.15) compared with the summer (0.21 ± 0.16), while the Levo/K+ ratio averaged 0.11 ± 0.06 during the biomass burning period in Beijing aerosols [1,61]. The Mkoma study reported lower Levo/K+ ratios with an average value of 0.37 ± 0.1 ranging from 0.82–0.57 in PM2.5 and 0.38 ± 0.2 ranging from 0.16–0.87 in PM2.5 during wet days, suggesting that the sampling site in Tanzania may be impacted by emissions of K+ from the burning of plants and from the soils that contain a high abundance of K+ [62]. In addition, the lower ratio of Levo/K+ was 0.25 ± 0.7 ranging from 0.14–0.36 in PM2.5 and was 0.23 ± 0.06 ranging from 0.14–0.36 in PM10 dry burning days, which indicates that Tanzania burned agricultural crop residuals [62]. Several studies on crop burning residue in Asia have reported the Levo/K+ ratio as ranging from 0.1 to 1.2 [61,62,63,64]. In the latest research conducted in the Chiang Mai Basin, due to the burning of crop residuals, the ratio of Levo/K+ in PM10 ranged from 0.51–0.56 in the dry season [65]. In a study by Thepnuan et al., the ratio of Levo/K+ was 0.92 ± 0.35, indicating that the ambient aerosols in Chiang Mai during the dry season in 2016 were influenced by burning forest and agricultural crop residuals, such as rice straw, maize, and sugar cane [56].
2.1.2. Levoglucosan/Mannosan
Galactosan and mannosan are isomers of levoglucosan and products of hemicellulose thermal decomposition, while levoglucosan is a product of cellulose thermal decomposition [17]. Hardwood contains a higher amount of cellulose than hemicellulose; therefore, the ratio of levoglucosan to mannosan (L/M) can also be used to distinguish the type of biomass burning [66] (i.e., softwood vs. hardwood) [17,67,68]. Previous studies have found that L/M ratios of burned crop residues are often > 40 [69], while the L/M ratios of burning hardwood are within the range of 15–25, and the L/M ratio of burning softwood is 3–10 [64,68,70]. For example, a high L/M ratio of biomass combustion aerosols produced by burning straw (40–42) was calculated [64]. In the North China Plain, aerosols are concentrated in the mountains, from severe levels of wheat straw burning (40–46) [70]. In a study by Fu et al. [71], the L/M ratios varied from 25 to 35, which were similar during sampling periods at the Hetian site, and the L/M ratios ranged from 33 to 60 and 23 to 59 in TSP and PM2.5 samples, respectively, at the Tazhong site. Therefore, high L/M ratios ranging from 23 to 60, found in their study, indicate that crop residues, hardwood, and herbaceous plants are the main fuel types for biomass burning in the Taklimakan region [71]. In the research of Thepnuan et al., the L/M ratios are in the range of 15.7–37.6, with an average of 20.4 ± 4.1, which was much higher than the values calculated from softwood burning (2.6–5.0) [64,67]. Similar to those calculated from hardwood burning (13–32) [60,64], Asian crop residue burning was 12–55, and corn straw burning was 19.5 ± 3.4 [1,56,61,64]. In Tanzania, East Africa, in 2011, during wet and dry seasons, it was found that the L/M ratios were fairly high, ranging from 10 to 13 in PM2.5 and from 9 to 13 in PM10. Such a high proportion indicates that the biomass burned in this land is dominantly hardwood and crop residues [62]. In Zhu’s study, higher monthly average L/M ratios (38.9) in November–January suggest that the burning substrate is primarily hardwood, a mixture of softwood and hardwood, or a mixture of softwood and plant straws in MNA [66]. The low L/M ratios (2.1–4.8) in May–June, however, indicate that the aerosol in Okinawa is influenced by the burning of softwood [66]. Finally, the lower L/M ratios in Kang’s study (average 4.2) suggested that the aerosols were mainly associated with the burning of softwood in the marine atmosphere over the East China Sea [72]. See Table 1 for more research on L/M identification of biomass combustion types.
There are many studies regarding the identification of biomass burning type by using levo/K+ and L/M ratios separately. However, as shown in [61], these two ratios are typically combined to infer potential sources of biomass burning. For example, in Thailand, the L/M ratios were approximate to those gained from leaf litter in dry dipterocarp forest and maize residues with an average of 19.0 ± 3.5 and 24.2 ± 12.3, respectively, while the Levo/K+ ratio is about the available leaf litter in mixed deciduous forests, with an average of 0.90 ± 0.88. The results of these two ratios indicated an origin from agricultural waste burning and forest fires, which was presented in Figure 4 [56].
In addition, Jung et al. reported that hardwood combustion has a relatively high ratio of L/M and Levo/K+, with average values of 26 and 28, respectively, and variation ranges of 2.2–195 and 11–146 [88]. The Levo/K+ ratios from the burnings of softwood were similar to those from the burnings of hardwood, with an average of 46 and a range of 4.6–261. The L/M ratios from the burnings of softwood were, however, much lower than those from the burnings of hardwood, with an average of 4.3 and a range of 2.5–6.7. The L/M ratios from the burning of Asian crop residue were similar to those from burning hardwood, with an average of 29 and a range of 12–55, whereas the Levo/K+ ratios from burning Asian crop residue were much lower than those from burning hardwood and softwood, with a value of 0.53 and a range of 0.1–1.2. In their study, Jung et al. reported aerosol samples collected from 5–8 November that showed a very low concentration of mannosan [88]. The Levo/K+ ratio of this sample was similar to other data, while the L/M ratio was much higher. Therefore, the elevated L/M ratio in this aerosol sample could be explained by elevated emissions from burnings of crop residue, grass, or hardwood. The Levo/K+ ratios calculated in this study were similar to those from burnings of grass and Asian crop residue, whereas the L/M ratios were similar to those obtained from the burnings of leaf and softwood. Calculated data in their study were located between the leaf/softwood cluster and the Asian crop residue/grass cluster; therefore, the tracers of biomass burning collected in their study might be a mixture of aerosols produced by burning grass, crop residue, leaf, and softwood, which was shown in Figure 5 [11,88].
2.1.3. Levoglucosan/OC or Levoglucosan/EC
The ratios of biomass burning tracers to OC and EC concentrations have also been used to identify various types of biomass burning [89]. Figure 6 shows a map of levoglucosan to OC ratios (Levo/OC ratios) and levoglucosan to EC ratios (Levo/EC ratios) from different types of biomass burning according to previous studies [53,55,60,63,68]. In the research of Jung et al. [88], the Levo/OC ratios and Levo/EC ratios suggested indicate the tendency of burning leaves and grass. Besides, the increasing trend was within the variability of crop residue burning in Asia [55,63]. Therefore, this study showed that grass, leaves, and crop residues were the main sources of biomass burning in the Daejeon air during the rice harvest season. Finally, this method of identifying the biomass burning types was similar to the previously reported method of burning agricultural residue during the fall rice harvest in Korea [90].
2.1.4. Vanillic Acid/Syringic Acid
The concentration of each tracer in an aerosol depends on the combustion conditions, amounts, and biomass burning type. For example, a low concentration of syringic acid may result from a lower amount of hardwood in burning emissions, while a higher concentration of p-hydroxybenzoic acid suggests a dominance of herbaceous plants [33]. Moreover, for the same quantity of different types of biofuels, the ratio of two biomass-burning tracers can be characteristics of the biomass, and it is more accurate than the single concentration. Therefore, concentration ratios of different aromatic acids are regarded as more important indicators to infer the type of biomass burning [21,33]. Recently, the ratio of vanillic acid/syringic acid (VA/SyA) has been used for identifying the biomass burning source in aerosols [1,17,33,59,91]. Figure 7 summarizes typical VA/SyA ratios of different potential sources (softwood, hardwood, herbaceous plants, grass, and other biomass burning sources) over the world. Briefly, the VA/SyA ratios ranged from 0.12 to 4.00 for hardwood burning and ranged from 8.57 to 11.9 for softwood burning, whereas the ratios of grass or herbaceous plants are between the hardwood burning and softwood burning, with values ranging from 0.40–5.03. The SA/VA ratios for burning woody angiosperms (hardwood) and non-woody angiosperms (herbaceous plants) were 1.90–2.44 and 0.10–2.00, respectively, while SA/VA ratios of burning gymnosperms (0.01) and non-woody gymnosperms (0.03–0.24) were much lower [22,33]. Therefore, if the proportions overlap, it is difficult to distinguish the type of biomass burning, especially when there are more than two emission sources. For example, Wan et al. reported VA/SyA ratios in aerosols collected in Lumbini, South Asia, ranging from 0.39 to 2.56 with a mean of 1.28 ± 0.50, which indicated herbaceous plants (crop residue) and hardwood as likely sources [92]. A previous study reported that the VA/SyA ratio was 1.70 ± 0.36 in Malaysia, while Indonesian peat-land fires period, which was approximately three times higher than the VA/SyA ratio (0.59 ± 0.27) on normal days, which provided a good indicator of the impact from the Indonesian peatland fires [93]. In aerosol samples from Beijing and Godavari, the SA/VA ratios were 2.21 (2.05–2.48) and 0.71 (0.62–0.96), respectively, suggesting that hardwood and grass (including agricultural residue) were more likely to be the sources for the biomass burning aerosols in these two regions [94]. In addition, the ratios of vanillin (VAN) and syringaldehyde (SyAH) were further applied to identify the sources of aerosol samples [49].
2.1.5. Vanillic/p-hydroxybenzoic Acid
The ratio of vanillic/p-hydroxybenzoic acid (VA/p-HBA) is also applied to identify types of biomass burning [1,95,96,97]. For example, the content of vanillic acid produced by burning conifers is higher than that of p-hydroxybenzoic acid, resulting in a higher VA/p-HBA ratio [88,98,99]. The VA/p-HBA ratio produced by pinewood in Europe is 8.75 [97], while the VA/p-HBA ratio after burning ponderosa pine was 19.75 [1,98]. In contrast, burning herbaceous plants contributes higher yields of p-HBA than VA, and Iinuma found that peat fires produced more p-HBA than VA [96]. In addition, P-HBA with almost no VA was released by grassland fires in the North American tundra [98,100]. In Gao’s study, the ratio of VA to p-HBA was determined as 0.51 in PM10 samples from Beijing and 0.70 in PM2.5 samples from Godavari, South Asia. Such low values indicate that agricultural residue is substantially burned for cooking or heating for the residents of the North China Plain and South Asia [94]. The ratio of VA/p-HBA in aerosol samples collected in Washington, D.C. is 0.35, which indicates that the burning of herbaceous plants in this area is greater than that of conifers [94]. It should be noted that the relative abundance of aromatic acids in the environment is not only controlled by emission characteristics but also affected by possible transformations in the atmosphere (such as photochemical degradation). Therefore, the ratios of VA/p-HBA close to the source area of biomass combustion may be more reliable than that far away from the receptor area.
2.1.6. K+/EC, char-EC/soot-EC, FLU/(FLU + PYR) and IP/(IP + BgP)
There are many other methods to identify biomass burning sources such as K+/EC, char-EC/soot-EC, PAH, and others. Here we briefly introduce three ratio methods.
First, K+/EC can be used to identify biomass burning. For example, in Cao et al.’s study, they examined aerosols during biomass burning periods. A strong positive correlation was observed among K+, OC, EC, and WSOC during the biomass burning episodes, indicating an important contribution of crop residues burning to carbonaceous aerosols during this biomass burning period. The ratios of OC/EC, K+/OC, K+/EC, and WSOC/OC for the agricultural-residue burning emissions were evaluated as 10.4 ± 0.5, 0.054 ± 0.006, 0.57 ± 0.07, and 0.48 ± 0.01, respectively [95]. The OC/EC ratio of 10.4, calculated in that study, was much higher than that for the wheat-residue burning (3.0) but similar to the previously reported ratio in paddy-residue burning (10.6) [96].
Second, the soot-EC/char-EC ratio depends on a mixture of different sources: motor vehicle emissions and possibly grass burning result in higher soot-EC/char-EC ratios, while wood combustion, particularly biomass burning by smoldering at low temperature, produces lower soot-EC/char-EC ratios [97,98]. In coal combustion, this ratio can be very low or high, depending on the type of coal [99]. In Lim’s study, the EC2 + 3/EC1 ratio of 1.25 in summer was comparable to the ratio of 1.67 for motor vehicle exhaust [97,100].
Finally, a FLU/(FLU + PYR) > 0.5 indicates coal and biomass burning. While a ratio of IP/(IP + BgP) > 0.6 represents plant burning [101].
2.2. Principal Component Analysis
2.2.1. Introduction of PCA
The basic idea of principal component analysis is described in [102]. Briefly, a few principal components are derived from original variables, and the information of the original variables is retained as much as possible, though they are not related. It does not require information on the source component spectrum, but one principal component may contain multiple sources.
2.2.2. Application of PCA
In the field of aerosols, PCA is usually used to identify pollution sources. For example, Wang et al. collected aerosol samples with a large capacity sampler in the Yellow Sea. Then, the ions and metals were quantified by ICS-3000 and ICP-MS, and the combustion source of light oil combustion, sea salt, SOA (secondary organic aerosol), and soil/metal melting was determined by PCA [103]. Xu et al. collected PM10 aerosol samples in Fuzhou with a high volume sampler. Ions were quantified by ICS-3000, and a mixture of secondary inorganic aerosols, marine aerosols, and traffic sources were identified by PCA [104]. Thepnuan et al. collected PM2.5 aerosol samples in Chiang Mai Province, Thailand, using a mini volume air sampler. ICS-5000 and ICS-3000 were used to quantify the ions and sugar alcohols and sugars in samples. Then PCA was applied to identify the sources of pollutants in this field. Five factors, such as biomass burning of agricultural wastes, traffic-related emission, photochemical formation of SO2 generated by traffic/industrial activity, biomass burning, dust, and sea salt [56]. However, there is no research on using PCA to identify the types of biomass burning, such as softwood, hardwood, grass, peat wood, and seed oil combustion. If sufficient data are available, PCA can be applied to identify these different types of burn products. The advantage of PCA is that before PMF analysis, PCA can be selected to preliminarily determine the sources of pollution in the studied area. The disadvantages are that there must be enough samples and that one sample may contain more sources of pollution.
2.3. Source Tracer Ratio
2.3.1. Introduction of Source Tracer Ratio
The source tracer ratio method assumes that there is a fixed emission ratio between the compound emitted from a certain source and the tracer of the source and that the ratio will not change during the transmission process. Through the emission ratio and the concentration of the tracer, the contribution ratio of the compound from this primary source can be calculated as follows [105]:
In the formula, , , represent the measured concentration of the compound, the concentration from the primary source, and the concentration from other sources, respectively. ER is the ratio of this compound to the tracer, that is, the emission ratio.
The emission ratio was determined through observation data. The specific calculation method assumes that ER is a known value, and then can be obtained according to Equation (2) by subtracting the primary emission concentration and the background concentration from the measured concentration. Because has nothing to do with the selected discharge, there should be no correlation between and . By testing different ER values within a certain range, the square correlation coefficient r2 of and corresponding to different ERs can be obtained. The ER corresponding to the lowest value in this series of r2 is considered to be the actual emission ratio.
2.3.2. Application of Source Tracer Ratio
When applying the source tracer ratio method to determine the type of biomass burning, each term in the formula can be defined by itself. For example, in our previous study [106], SO2 was selected as the tracer for coal burning, and then the concentration of levoglucosan was divided into two parts (Equation (3)): the concentration of levoglucosan from coal burning () and the concentration of levoglucosan from other types of biomass burning (). The enhancement ratio (ERs) can be determined when the r2 between the concentration of levoglucosan from other biomass burning and the concentration of SO2 is the minimum. Finally, the contribution of coal burning to levoglucosan is calculated to be 15%, indicating that the types of biomass burning include coal, such as peat and lignite burning.
The application of the source tracer ratio method is not prevalent. According to its principle, appropriate tracers can be selected to identify the type of biomass burning, such as peat, lignite, tobacco, etc. At the same time, the contribution of corresponding biomass burning to the total biomass burning can be determined. The advantage of using the ratio of source tracer is that it is simple and requires less data, but the disadvantage is that it relies too much on the choice of tracers.
2.4. PMF
2.4.1. Introduction of PMF
Positive matrix factor analysis is an effective technique for source analysis, which estimates the composition of pollution sources and their contribution to the environmental concentration based on measured data at the receptor site. There is no need to require source component spectrum information. Therefore, it is more suitable for areas where the pollution sources are not very clear. The data matrix X with m rows and n columns (m and n are the number of samples and the number of species, respectively) is decomposed into the product of two matrices G (m multiplied by p) and F (p multiplied by n), and adding a residual matrix E:
in which Xij is the concentration of species j in sample i, p is the number of sources, g is the contribution of the source, f is the mass ratio of the species to the source, and e is the residual.
The PMF’s G and F are derived by minimizing the objective function Q as follows:
The US EPA PMF 5.0 software is used for analysis. In the input data, The uncertainty matrix uij of the sample is calculated according to the recommended method in the operation manual: ① If the concentration of the substance in the environmental sample is lower than or equal to the detection limit of the analytical method, the uncertainty Unc = (5/6) × MDL, where MDL is the detection limit of the analytical method; ② If the concentration of the substance in the environmental sample is higher than the detection limit of the analytical method, the calculation formula of the uncertainty is:
In order to obtain reliable simulation results, the species are screened according to the data quality. In the calculation, PMF models can decrease uncertainty by operating a bootstrap from −1 to 1, and the conditions are continuously optimized until obtaining excellent results.
2.4.2. The Application of PMF
In previous studies, PMF was also used to identify the sources of pollutants in the atmosphere [107,108,109,110]. For example, Sowlat et al. collected the quantity and size of atmospheric particles in the range of 14–760 nm (mobility diameter) by using a scanning mobility particle sizer (SMPSTM, TSI Model 3081) and particles in the range of 0.3–10 µm (optical diameter) were measured using an optical particle sizer in the University of Southern California’s (USC) park campus [111]. Then, PMF was applied to analyze the sources of organic compounds. Six sources, including nucleation, traffic 1, traffic 2, urban background aerosol, secondary aerosol, and soil/road dust, were determined during the sampling period.
However, only two studies have used PMF to determine the type of biomass burning. Bari et al. applied the PMF method to identify the sources of pollution from November 2005 to March 2006, and six source types were determined, including hardwood burning, softwood burning, light oil burning, traffic, road dust, and other, as shown in Table 2 [89]. The contrition of each source was 43.1%, 5.8%, 13.4%, 7.2%, 8.2%, and 21.5%, respectively. PMF was also used to study the type of biomass burning in Nanjing aerosols in the year 2016. In this study, the contribution of hardwood burning, softwood burning, and grass burning to the total biomass burning in four seasons was calculated, and factor profiles, time-series variation of contribution, and contribution of each type of biomass burning in four seasons are given in Figure 8 and Figure 9 [51]. PMF can not only identify the type of biomass burning but also calculate the contribution of each burning source in a time series. The disadvantage is that the quantity of data required is large; at least 90 samples should be analyzed, and the more data, the more accurate it is.
3. Summary and Perspectives
In this review, we introduced various types of biomass burning, including Asian crop residuals, wildfire, peatland, leaf, forest, grass, herbaceous plants, hardwood, softwood, wheat, oil, and lignite, as well as the main components released. First, different tracers of biomass burning were introduced. Levoglucosan is a common tracer of biomass burning in the atmosphere. Methoxyphenols such as p-hydroxybenzoic acid, vanillic acid, isovanillic acid, syringic acid, p-coumaric acid, ferulic acid, and homovanillic acid are unique trace molecular markers of biomass burning in atmospheric aerosols. 1,6-anhydro-2-acetamido-2-deoxyglucose is regarded as a specific marker for chitin in biomass burning emissions; wax esters are regarded as unique tracers for this source. Nicotine is a tracer of tobacco burning in aerosol samples.
Second, comprehensive methods to infer sources of biomass burning were illustrated. Single tracers cannot readily identify the source of biomass burning because hardwood and softwood can release the same tracers. However, the relative proportion of tracers is different in various plant species. To distinguish the types of biomass burning, five proportion methods have been adopted in this field, levoglucosan to K+, levoglucosan to mannosan, levoglucosan to OC, levoglucosan to EC, vanillic acid to syringic acid, and vanillic acid to 4-hydroxybenzoic acid. Other simple methods introduced include K+/EC, char-EC/soot-EC, and characteristic ratios of PAHs.
Finally, this paper summarizes three other methods, including source tracer ratio, principal component analysis, and the positive matrix fraction method. Both advantages and disadvantages are shown in this review, as well as the limitations of the ratio method to identify sources. Therefore, in the future, PCA, STR, and PMF, combined with the ratio method, will play a dominant role in the identification of biomass burning sources.
Author Contributions
Conceptualization, M.C. (Mindong Chen) and W.L.; formal analysis, P.G.; investigation, J.T. and Y.C.; resources, M.C. (Maoyu Cao); data curation, D.N. and K.H.; writing—original draft preparation, W.L.; writing—review and editing, W.L.; funding acquisition, M.C. (Mindong Chen). All authors have read and agreed to the published version of the manuscript.
Funding
This research was funded by the National Natural Science Foundation of China, grant number (21976094); and the National Key Research and Development Project, grant number 2018YFC0213802.
Conflicts of Interest
The authors declare no conflict of interest.
References
- Andreae, M.O.; Merlet, P. Emission of trace gases and aerosols from biomass burning. Glob. Biogeochem. Cycles 2001, 15, 955–966. [Google Scholar] [CrossRef] [Green Version]
- Werf, G.; Randerson, J.T.; Giglio, L.; Collatz, G.J.; Leeuwen, T. Global fire emissions and the contribution of deforestation, savanna, forest, agriculture, and peat fires. Atmos. Chem. Phys. 2010, 10, 16153–16230. [Google Scholar]
- Crutzen, P.J.; Andreae, M.O. Biomass Burning in the Tropics: Impact on Atmospheric Chemistry and Biogeochemical Cycles. Science 1990, 250, 1669–1678. [Google Scholar] [CrossRef]
- Lelieveld, J.; Evans, J.S.; Fnais, M.; Giannadaki, D.; Pozzer, A. The contribution of outdoor air pollution sources to premature mortality on a global scale. Nature 2015, 525, 367–371. [Google Scholar] [CrossRef]
- Gustafsson, Ö.; Kruså, M.; Zencak, Z.; Sheesley, R.J.; Granat, L.; Engström, E.; Praveen, P.S.; Rao, P.S.P.; Leck, C.; Rodhe, H. Brown Clouds over South Asia: Biomass or Fossil Fuel Combustion? Science 2009, 323, 495–498. [Google Scholar] [CrossRef] [PubMed]
- Venkataraman, C.; Habib, G.; Eiguren-Fernandez, A.; Miguel, A.H.; Friedlander, S.K. Residential Biofuels in South Asia: Carbonaceous Aerosol Emissions and Climate Impacts. Science 2005, 307, 1454–1456. [Google Scholar] [CrossRef] [PubMed] [Green Version]
- Iinuma, Y.; Keywood, M.; Herrmann, H. Characterization of primary and secondary organic aerosols in Melbourne airshed: The influence of biogenic emissions, wood smoke and bushfires. Atmos. Environ. 2016, 130, 54–63. [Google Scholar] [CrossRef]
- Zangrando, R.; Barbaro, E.; Zennaro, P.; Rossi, S.; Kehrwald, N.M.; Gabrieli, J.; Barbante, C.; Gambaro, A. Molecular markers of biomass burning in arctic aerosols. Environ. Sci. Technol. 2013, 47, 8565–8574. [Google Scholar] [CrossRef]
- Tang, Y. Influences of biomass burning during the Transport and Chemical Evolution Over the Pacific (TRACE-P) experiment identified by the regional chemical transport model. J. Geophys. Res. Atmos. 2003, 108, 8824. [Google Scholar] [CrossRef] [Green Version]
- Giungato, P.; Barbieri, P.; Cozzutto, S.; Licen, S. Sustainable domestic burning of residual biomasses from the Friuli Venezia Giulia region. J. Clean. Prod. 2017, 172, 3841–3850. [Google Scholar] [CrossRef]
- Chen, J.; Li, C.; Ristovski, Z.; Milic, A.; Gu, Y.; Islam, M.S.; Wang, S.; Hao, J.; Zhang, H.; He, C.; et al. A review of biomass burning: Emissions and impacts on air quality, health and climate in China. Sci. Total Environ. 2017, 579, 1000–1034. [Google Scholar] [CrossRef] [PubMed] [Green Version]
- Crutzen, P.J.; Heidt, L.E.; Krasnec, J.P.; Pollock, W.H. Biomass burning as a source of atmospheric gases CO, H2, N2O, NO, CH3Cl and COS. Nature 1979, 282, 253–256. [Google Scholar] [CrossRef]
- Christian, T.J.; Yokelson, R.J.; Carvalho, J.A., Jr. The tropical forest and fire emissions experiment: Trace gases emitted by smoldering logs and dung from deforestation and pasture fires in Brazil. J. Geophys. Res. 2007, 112, D18308. [Google Scholar] [CrossRef] [Green Version]
- Wan, X.; Kawamura, K.; Ram, K.; Kang, S.; Loewen, M.; Gao, S.; Wu, G.; Fu, P.; Zhang, Y.; Bhattarai, H.; et al. Aromatic acids as biomass-burning tracers in atmospheric aerosols and ice cores: A review. Environ. Pollut. 2019, 247, 216–228. [Google Scholar] [CrossRef] [PubMed]
- Cullis, C.F.; Benson, S.W.; Fristrom, R.M.; Homann, K.H.; Blazowski, W.S. The Mechanisms of Pyrolysis Oxidation, and Burning of Organic Materials; U.S. Government Printing Office: Washington, DC, USA, 1972.
- Simoneit, B.; Elias, V.O. Organic tracers from biomass burning in atmospheric particulate matter over the ocean. Mar. Chem. 2000, 69, 301–312. [Google Scholar] [CrossRef]
- Simoneit, B.R.T. Biomass burning—A review of organic tracers for smoke from incomplete combustion. Appl. Geochem. 2002, 17, 129–162. [Google Scholar] [CrossRef]
- Kawamura, K.; Izawa, Y.; Mochida, M.; Shiraiwa, T. Ice core records of biomass burning tracers (levoglucosan and dehydroabietic, vanillic and p-hydroxybenzoic acids) and total organic carbon for past 300 years in the Kamchatka Peninsula, Northeast Asia. Geochim. Cosmochim. Acta 2012, 99, 317–329. [Google Scholar] [CrossRef] [Green Version]
- Shi, G.; Wang, X.C.; Li, Y.; Trengove, R.; Hu, Z.; Mi, M.; Li, X.; Yu, J.; Hunter, B.; He, T. Organic tracers from biomass burning in snow from the coast to the ice sheet summit of East Antarctica. Atmos. Environ. 2019, 201, 231–241. [Google Scholar] [CrossRef]
- Chen, L.; Li, Q.; Wu, D.; Sun, H.; Wei, Y.; Ding, X.; Chen, H.; Cheng, T.; Chen, J. Size distribution and chemical composition of primary particles emitted during open biomass burning processes: Impacts on cloud condensation nuclei activation. Sci. Total Environ. 2019, 674, 179–188. [Google Scholar] [CrossRef] [PubMed]
- Simoneit, B.; Rogge, W.F.; Mazurek, M.A.; Standley, L.J.; Cass, G.R. Lignin pyrolysis products, lignans, and resin acids as specific tracers of plant classes in emissions from biomass combustion. Environ. Sci. Technol. 1993, 27, 2533–2541. [Google Scholar] [CrossRef]
- Shakya, K.M.; Louchouarn, P.; Griffin, R.J. Lignin-Derived Phenols in Houston Aerosols: Implications for Natural Background Sources. Environ. Sci. Technol. 2011, 45, 8268–8275. [Google Scholar] [CrossRef] [PubMed]
- Hawthorne, S.B.; Miller, D.J.; Barkley, R.M.; Krieger, M.S. Identification of methoxylated phenols as candidate tracers for atmospheric wood smoke pollution. Environ. Sci. Technol. 1988, 22, 1191–1196. [Google Scholar] [CrossRef] [PubMed]
- Hawthorne, S.B.; Miller, D.J.; Langenfeld, J.J.; Krieger, M.S. PM-10 high-volume collection and quantitation of semi- and nonvolatile phenols, methoxylated phenols, alkanes, and polycyclic aromatic hydrocarbons from winter urban air and their relationship to wood smoke emissions. Environ. Sci. Technol. 1992, 26, 2251–2262. [Google Scholar] [CrossRef]
- Sakakibara, J.; Ina, H. Recent Development on the Chemistry of Lignan Compounds. J. Synth. Org. Chem. Jpn. 1975, 33, 604–623. [Google Scholar] [CrossRef]
- Grimshaw, J. Depsides, Hydrolysable Tannins, Lignans, Lignin and Humic Acid. In Rodd’s Chemistry of Carbon Compounds, 2nd ed.; Elsevier: Amsterdam, The Netherlands, 1964. [Google Scholar]
- Standley, L.J.; Simoneit, B. Resin diterpenoids as tracers for biomass combustion aerosols. J. Atmos. Chem. 1994, 18, 1–15. [Google Scholar] [CrossRef]
- Hedges, J.I.; Ertel, J.R. Characterization of lignin by Gas Capillary Chromatography of Cupric Oxide Oxidation Products. Anal. Chem. 1981, 54, 174–178. [Google Scholar] [CrossRef]
- Hawthorne, S.B.; Krieger, M.S.; Miller, D.J.; Mathiason, M.B. Collection and quantitation of methoxylated phenol tracers for atmospheric pollution from residential wood stoves. Environ. Sci. Technol. 1989, 23, 129–134. [Google Scholar] [CrossRef]
- Wong, J.; Tsagkaraki, M.; Tsiodra, I.; Mihalopoulos, N.; Weber, R.J. Atmospheric evolution of molecular-weight-separated brown carbon from biomass burning. Atmos. Chem. Phys. 2019, 19, 7319–7334. [Google Scholar]
- Oros, D.R.; Simoneit, B. Identification and emission rates of molecular tracers in coal smoke particulate matter. Fuel 2000, 79, 515–536. [Google Scholar] [CrossRef]
- Spindler, G.; Gnauk, T.; Grüner, A.; Iinuma, Y.; Müller, K.; Scheinhardt, S.; Herrmann, H. Size-segregated characterization of PM 10 at the EMEP site Melpitz (Germany) using a five-stage impactor: A six year study. J. Atmos. Chem. 2012, 69, 127–157. [Google Scholar] [CrossRef]
- Myers-Pigg, A.N.; Griffin, R.J.; Louchouarn, P.; Norwood, M.J.; Sterne, A.; Cevik, B.K. Signatures of Biomass Burning Aerosols in the Plume of a Saltmarsh Wildfire in South Texas. Environ. Sci. Technol. 2016, 50, 9308–9314. [Google Scholar] [CrossRef]
- Shafizadeh, F. The chemistry of pyrolysis and combustion. Adv. Chem. 1984, 207, 489–529. [Google Scholar]
- Richards, G.N.; Shafizadeh, F.; Stevenson, T.T. Influence of sodium chloride on volatile products formed by pyrolysis of cellulose: Identification of hydroxybenzenes and 1-hydroxy-2-propanone as major products. Carbohydr. Res. 1983, 117, 322–327. [Google Scholar] [CrossRef]
- Hakeem, I.G.; Halder, P.; Marzbali, M.H.; Patel, S.; Shah, K. Research progress on levoglucosan production via pyrolysis of lignocellulosic biomass and its effective recovery from bio-oil. J. Environ. Chem. Eng. 2021, 9, 105614. [Google Scholar] [CrossRef]
- Hornig, J.F.; Soderberg, R.H.; Barefoot, A.C.; Galasyn, J.F. Wood smoke analysis: Vaporization losses of PAH from filters and levoglucosan as a distinctive marker for wood smoke. In Polynuclear Aromatic Hydrocarbons: Mechanisms, Methods, and Metabolism; Battelle Press: Columbus, OH, USA, 1985. [Google Scholar]
- Steven, B.; Taehyoung, L.; Paul, R.; Jeffrey, C. Wintertime Residential Biomass Burning in Las Vegas, Nevada; Marker Components and Apportionment Methods. Atmosphere 2016, 7, 58. [Google Scholar]
- Locker, H.B. The Use of Levoglucosan to Assess the Environmental Impact of Residential Wood-Burning on Air Quality. Ph.D. Thesis, Dartmouth College, Hanover, NH, USA, 1988. [Google Scholar]
- Meng, J.; Liu, X.; Hou, Z.; Yi, Y.; Yan, L.; Li, Z.; Cao, J.; Li, J.; Wang, G. Molecular characteristics and stable carbon isotope compositions of dicarboxylic acids and related compounds in the urban atmosphere of the North China Plain: Implications for aqueous phase formation of SOA during the haze periods. Sci. Total Environ. 2020, 705, 135256. [Google Scholar] [CrossRef] [PubMed]
- Li, J.; Li, J.; Wang, G.; Zhang, T.; Li, L. Molecular characteristics of organic compositions in fresh and aged biomass burning aerosols. Sci. Total Environ. 2020, 741, 140247. [Google Scholar] [CrossRef] [PubMed]
- Hennigan, C.J.; Sullivan, A.P.; Collett, J.L.; Robinson, A.L. Levoglucosan stability in biomass burning particles exposed to hydroxyl radicals. Geophys. Res. Lett. 2010, 37, L09806. [Google Scholar] [CrossRef] [Green Version]
- Mochida, M.; Kawamura, K. Hygroscopic properties of levoglucosan and related organic compounds characteristic to biomass burning aerosol particles. J. Geophys. Res. Atmos. 2004, 109, D21202. [Google Scholar] [CrossRef] [Green Version]
- Jiang, L.Q.; Fang, Z.; Zhao, Z.L.; Zheng, A.Q.; Wang, X.; Li, H.B. Levoglucosan and its hydrolysates via fast pyrolysis of lignocellulose for microbial biofuels: A state-of-the-art review. Renew. Sustain. Energy Rev. 2019, 105, 215–229. [Google Scholar] [CrossRef]
- Bates, A.L.; Hatcher, P.G.; Lerchiii, H.; Cecil, C.B.; Neuzil, S.G. Studies of a peatified angiosperm log cross section from Indonesia by nuclear magnetic resonance spectroscopy and analytical pyrolysis. Org. Geochem. 1991, 17, 37–45. [Google Scholar] [CrossRef]
- Fabbri, D.; Torri, C.; Simoneit, B.R.T.; Marynowski, L.; Rushdi, A.I.; Fabiańska, M.J. Levoglucosan and other cellulose and lignin markers in emissions from burning of Miocene lignites. Atmos. Environ. 2009, 43, 2286–2295. [Google Scholar] [CrossRef]
- Hoffmann, D.; Iinuma, Y.; Herrmann, H. Analysis of polar aromatic biomass burning tracers in combustion aerosol using HPLC-MS. In Proceedings of the European Aerosol Conference (EAC), Ghent, Belgium, 28 August–2 September 2005. [Google Scholar]
- Hoffmann, D.; Iinuma, Y.; Herrmann, H. Development of a method for fast analysis of phenolic molecular markers in biomass burning particles using high performance liquid chromatography/atmospheric pressure chemical ionisation mass spectrometry. J. Chromatogr. A 2007, 1143, 168–175. [Google Scholar] [CrossRef] [PubMed]
- Zangrando, R.; Barbaro, E.; Vecchiato, M.; Kehrwald, N.M.; Barbante, C.; Gambaro, A. Levoglucosan and phenols in Antarctic marine, coastal and plateau aerosols. Sci. Total Environ. 2016, 544, 606–616. [Google Scholar] [CrossRef]
- Li, W.; Chen, M.; Ge, X.; Gu, C.; Yu, W.; Nie, D. Validation of a sensitive high performance liquid chromatography tandem mass spectrometric method for measuring carbohydrates in aerosol samples. J. Chromatogr. A 2020, 1619, 460941. [Google Scholar] [CrossRef]
- Li, W.; Wang, J.; Qi, L.; Yu, W.; Nie, D.; Shi, S.; Gu, C.; Ge, X.; Chen, M. Molecular characterization of biomass burning tracer compounds in fine particles in Nanjing, China. Atmos. Environ. 2020, 240, 117837. [Google Scholar] [CrossRef]
- Simoneit, B.R.T.; Oros, D.R.; Elias, V.O. Molecular tracers for smoke from charring/burning of chitin biopolymer. Chemosphere—Glob. Chang. Sci. 2000, 2, 101–105. [Google Scholar] [CrossRef]
- Schmidl, C.; Marr, I.L.; Caseiro, A.; Kotianova, P.; Berner, A.; Bauer, H.; Kasper-Giebl, A.; Puxbaum, H. Chemical characterisation of fine particle emissions from wood stove combustion of common woods growing in mid-European Alpine regions. Atmos. Environ. 2008, 42, 126–141. [Google Scholar] [CrossRef]
- Pio, C.A.; Legrand, M.; Alves, C.A.; Oliveira, T.; Afonso, J.; Caseiro, A.; Puxbaum, H.; Sanchez-Ochoa, A.; Gelencsér, A. Chemical composition of atmospheric aerosols during the 2003 summer intense forest fire period. Atmos. Environ. 2008, 42, 7530–7543. [Google Scholar] [CrossRef]
- Sullivan, A.P.; Holden, A.S.; Patterson, L.A.; Mcmeeking, G.R.; Kreidenweis, S.M.; Malm, W.C.; Hao, W.M.; And, C.; Collett, J.L. A method for smoke marker measurements and its potential application for determining the contribution of biomass burning from wildfires and prescribed fires to ambient PM2.5 organic carbon. J. Geophys. Res. Atmos. 2008, 113, D22302. [Google Scholar] [CrossRef]
- Thepnuan, D.; Chantara, S.; Lee, C.T.; Lin, N.H.; Tsai, Y.I. Molecular markers for biomass burning associated with the characterization of PM2.5 and component sources during dry season haze episodes in Upper South East Asia. Sci. Total Environ. 2019, 658, 708–722. [Google Scholar] [CrossRef] [PubMed]
- Khan, J.Z.; Sun, L.; Tian, Y.; Shi, G.; Feng, Y. Chemical characterization and source apportionment of PM1 and PM2.5 in Tianjin, China: Impacts of biomass burning and primary biogenic sources. J. Environ. Sci. 2021, 99, 198–211. [Google Scholar] [CrossRef] [PubMed]
- Fine, P.M.; Cass, G.R.; Simoneit, B.R.T. Characterization of Fine Particle Emissions from Burning Church Candles. Environ. Sci. Technol. 1999, 33, 2352–2362. [Google Scholar] [CrossRef]
- Fine, P.M.; Cass, G.R.; Simoneit, B.R.T. Chemical Characterization of Fine Particle Emissions from the Fireplace Combustion of Wood Types Grown in the Midwestern and Western United States. Environ. Eng. Sci. 2004, 21, 387–409. [Google Scholar] [CrossRef]
- Fine, P.M.; Cass, G.R.; Simoneit, B.R.T. Chemical Characterization of Fine Particle Emissions from the Wood Stove Combustion of Prevalent United States Tree Species. Environ. Eng. Sci. 2004, 21, 705–721. [Google Scholar] [CrossRef]
- Cheng, Y.; Engling, G.; He, K.B.; Duan, F.K.; Ma, Y.L.; Du, Z.Y.; Liu, J.M.; Zheng, M.; Weber, R.J. Biomass burning contribution to Beijing aerosol. Atmos. Chem. Phys. 2013, 13, 7765–7781. [Google Scholar] [CrossRef] [Green Version]
- Mkoma, S.L.; Kawamura, K.; Fu, P.Q. Contributions of biomass/biofuel burning to organic aerosols and particulate matter in Tanzania, East Africa, based on analyses of ionic species, organic and elemental carbon, levoglucosan and mannosan. Atmos. Chem. Phys. 2013, 13, 10325–10338. [Google Scholar] [CrossRef] [Green Version]
- Sheesley, R.J.; Schauer, J.J.; Chowdhury, Z.; Cass, G.R.; Simoneit, B.R.T. Characterization of organic aerosols emitted from the combustion of biomass indigenous to South Asia. J. Geophys. Res. Atmos. 2003, 108, D22302. [Google Scholar] [CrossRef] [Green Version]
- Engling, G.; Lee, J.J.; Tsai, Y.-W.; Lung, S.-C.C.; Chou, C.C.K.; Chan, C.-Y. Size-Resolved Anhydrosugar Composition in Smoke Aerosol from Controlled Field Burning of Rice Straw. Aerosol Sci. Technol. 2009, 43, 662–672. [Google Scholar] [CrossRef]
- Tao, M.; Chen, L.; Wang, Z.; Tao, J.; Su, L. Satellite observation of abnormal yellow haze clouds over East China during summer agricultural burning season. Atmos. Environ. 2013, 79, 632–640. [Google Scholar] [CrossRef]
- Zhu, C.; Kawamura, K.; Kunwar, B. Effect of biomass burning over the western North Pacific Rim: Wintertime maxima of anhydrosugars in ambient aerosols from Okinawa. Atmos. Chem. Phys. 2015, 15, 1959–1973. [Google Scholar] [CrossRef]
- Zhang, Y.Y.; Obrist, D.; Zielinska, B.; Gertler, A. Particulate emissions from different types of biomass burning. Atmos. Environ. 2013, 72, 27–35. [Google Scholar] [CrossRef]
- Schmidl, C.; Luisser, M.; Padouvas, E.; Lasselsberger, L.; Rzaca, M.; Ramirez-Santa Cruz, C.; Handler, M.; Peng, G.; Bauer, H.; Puxbaum, H. Particulate and gaseous emissions from manually and automatically fired small scale combustion systems. Atmos. Environ. 2011, 45, 7443–7454. [Google Scholar] [CrossRef]
- Pashynska, V.; Vermeylen, R.; Vas, G.; Maenhaut, W.; Claeys, M. Development of a gas chromatographic/ion trap mass spectrometric method for the determination of levoglucosan and saccharidic compounds in atmospheric aerosols. J. Mass Spectrom. 2002, 37, 1249–1257. [Google Scholar] [CrossRef]
- Fu, P.; Zhuang, G.; Sun, Y.; Wang, Q.; Chen, J.; Ren, L.; Yang, F.; Wang, Z.; Pan, X.; Li, X.; et al. Molecular markers of biomass burning, fungal spores and biogenic SOA in the Taklimakan desert aerosols. Atmos. Environ. 2016, 130, 64–73. [Google Scholar] [CrossRef]
- Fu, P.; Kawamura, K.; Kobayashi, M.; Simoneit, B.R.T. Seasonal variations of sugars in atmospheric particulate matter from Gosan, Jeju Island: Significant contributions of airborne pollen and Asian dust in spring. Atmos. Environ. 2012, 55, 234–239. [Google Scholar] [CrossRef] [Green Version]
- Kang, M.; Fu, P.; Kawamura, K.; Yang, F.; Zhang, H.; Zang, Z.; Ren, H.; Ren, L.; Zhao, Y.; Sun, Y.; et al. Characterization of biogenic primary and secondary organic aerosols in the marine atmosphere over the East China Sea. Atmos. Chem. Phys. 2018. under review. [Google Scholar] [CrossRef] [Green Version]
- Nolte, C.G.; Schauer, J.J.; Cass, G.R.; Simoneit, B.R. Highly polar organic compounds present in wood smoke and in the ambient atmosphere. Environ. Sci. Technol. 2001, 35, 1912–1919. [Google Scholar] [CrossRef] [PubMed]
- Fine, P.M.; Cass, G.R.; Simoneit, B.R.T. Chemical characterzation of fine particle emissions from the fireplace combustion of woods grown in the Southern United States. Environ. Sci. Technol. 2002, 36, 1442–1451. [Google Scholar] [CrossRef] [PubMed]
- Engling, G.; Carrico, C.M.; Kreidenweis, S.M.; Collett, J.L.; Day, D.E.; Malm, W.C.; Lincoln, E.; Hao, W.M.; Iinuma, Y.; Herrmann, H. Determination of levoglucosan in biomass combustion aerosol by high-performance anion-exchange chromatography with pulsed amperometric detection. Atmos. Environ. 2006, 40, S299–S311. [Google Scholar] [CrossRef]
- Oros, D.R.; Simoneit, B.R.T. Identifification and emission factors of molecular tracers in organic aerosols from biomass burning. Part 2. Deciduous trees. Appl. Geochem. 2001, 16, 1545–1565. [Google Scholar] [CrossRef]
- Oros, D.R.; Simoneit, B.R.T. Identifification and emission factors of molecular tracers in organic aerosols from biomass burning. Part 1. Temperate climate conifers. Appl. Geochem. 2001, 16, 1513–1544. [Google Scholar] [CrossRef]
- Otto, A.; Gondokusumo, R.; Simpson, M.J. Characterization and quantifification of biomarkers from biomass burning at a recent wildfifire site in Northern Alberta, Canada. Appl. Geochem. 2006, 21, 166–183. [Google Scholar] [CrossRef]
- Ward, T.J.; Hamilton, R.F., Jr.; Dixon, R.W.; Paulsen, M.; Simpson, C.D. Characterization and evaluation of smoke tracers in PM: Results from the 2003 Montana wildfifire season. Atmos. Environ. 2006, 40, 7005–7017. [Google Scholar] [CrossRef]
- Oros, D.R.; Radzi bin Abas, M.; Omar, N.Y.M.J.; Rahman, N.A.; Simoneit, B.R.T. Identifification and emission factors of molecular tracers in organic aerosols from biomass burning: 3. Grasses. Appl. Geochem. 2006, 21, 919–940. [Google Scholar] [CrossRef]
- Medeiros, P.M.; Simoneit, B.R.T. Source profifiles of organic compounds emitted upon combustion of green vegetation from temperate climate forests. Environ. Sci. Technol. 2008, 40, 8310–8316. [Google Scholar] [CrossRef] [PubMed]
- Yttri, K.E.; Dye, C.; Slørdal, L.H.; Braathen, O.-A. Quantifification of monosaccharide anhydrides by liquid chromatography combined with mass spectrometry: Application to aerosol samples from an urban and a suburban site inflfluenced by small-scale wood burning. J. Air Waste Manag. Assoc. 2005, 55, 1169–1177. [Google Scholar] [CrossRef] [PubMed] [Green Version]
- Simoneit, B.R.T.; Elias, V.O.; Kobayashi, M.; Kawamura, K.; Rushdi, A.I.; Medeiros, P.M.; Rogge, W.F.; Didyk, B.M. Sugars—dominant water-soluble organic compounds in soils and characterization as tracers in atmospheric particulate matter. Environ. Sci. Technol. 2004, 38, 5939–5949. [Google Scholar] [CrossRef] [PubMed]
- Simoneit, B.R.T.; Kobayashi, M.; Mochida, M.; Kawamura, K.; Lee, M.-H.; Lim, H.-J.; Turpin, B.J.; Komazaki, Y. Composition and major sources of organic compounds of aerosol particulate matter sampled during the ACE-Asia campaign. J. Geophys. Res. Atmos. 2004, 109. [Google Scholar] [CrossRef] [Green Version]
- Medeiros, P.M.; Conte, M.H.; Weber, J.C.; Simoneit, B.R.T. Sugars as source indicators of biogenic organic carbon in aerosols collected above the Howland Experimental Forest, Maine. Atmos. Environ. 2006, 40, 1694–1705. [Google Scholar] [CrossRef] [Green Version]
- Zdráhal, Z.; Oliveira, J.; Vermeylen, R.; Claeys, M.; Maenhaut, W. Improved method for quantifying levoglucosan and related monosaccharide anhydrides in atmospheric aerosols and application to samples from urban and tropical locations. Environ. Sci. Technol. 2002, 36, 747–753. [Google Scholar] [CrossRef]
- Sandradevi, J.; Prevot, A.S.H.; Alfarra, M.R.; Szidat, S.; Wehrli, M.N.; Ruff, M.; Weimer, S.; Lanz, V.A.; Weingartner, E.; Perron, N.; et al. Comparison of several wood smoke markers and source apportionment methods for wood burning particulate mass. Atmos. Chem. Phys. Discuss. 2008, 8, 8091–8118. [Google Scholar]
- Jung, J.; Lee, S.; Kim, H.; Kim, D.; Lee, H.; Oh, S. Quantitative determination of the biomass-burning contribution to atmospheric carbonaceous aerosols in Daejeon, Korea, during the rice-harvest period. Atmos. Environ. 2014, 89, 642–650. [Google Scholar] [CrossRef]
- Bari, M.A.; Baumbach, G.; Kuch, B.; Scheffknecht, G. Wood smoke as a source of particle-phase organic compounds in residential areas. Atmos. Environ. 2009, 43, 4722–4732. [Google Scholar] [CrossRef]
- Ryu, S.Y.; Kim, J.E.; Zhuanshi, H.; Kim, Y.J.; Kang, G.U. Chemical Composition of Post-Harvest Biomass Burning Aerosols in Gwangju, Korea. J. Air Waste Manag. Assoc. 2004, 54, 1124–1137. [Google Scholar] [CrossRef] [PubMed]
- Yang, H.; Yan, R.; Chen, H.; Lee, D.H.; Zheng, C. Characteristics of hemicelluloses, cellulose and lignin pyrolysis. Fuel 2007, 86, 1781–1788. [Google Scholar] [CrossRef]
- Wan, X.; Kang, S.; Li, Q.; Rupakheti, D.; Zhang, Q.; Guo, J.; Chen, P.; Tripathee, L.; Rupakheti, M.; Panday, A.K.; et al. Organic molecular tracers in the atmospheric aerosols from Lumbini, Nepal, in the northern Indo-Gangetic Plain: Influence of biomass burning. Atmos. Chem. Phys. 2017, 17, 8867–8885. [Google Scholar] [CrossRef] [Green Version]
- Fujii, Y.; Tohno, S.; Amil, N.; Latif, M.T.; Oda, M.; Matsumoto, J.; Mizohata, A. Annual variations of carbonaceous PM2.5 in Malaysia: Influence by Indonesian peatland fires. Atmos. Chem. Phys. 2015, 15, 13319–13329. [Google Scholar] [CrossRef] [Green Version]
- Gao, S.; Xu, B.; Dong, X.; Zheng, X.; Wan, X.; Kang, S.; Song, Q.; Kawamura, K.; Cong, Z. Biomass-burning derived aromatic acids in NIST standard reference material 1649b and the environmental implications. Atmos. Environ. 2018, 185, 180–185. [Google Scholar] [CrossRef]
- Cao, F.; Zhang, S.C.; Kawamura, K.; Zhang, Y.L. Inorganic markers, carbonaceous components and stable carbon isotope from biomass burning aerosols in Northeast China. Sci. Total Environ. 2016, 572, 1244–1251. [Google Scholar] [CrossRef] [PubMed]
- Rajput, P.; Sarin, M.; Sharma, D.; Singh, D. Characteristics and Emission Budget of Carbonaceous Species from Post-Harvest Agricultural-Waste Burning in Source Region of the Indo-Gangetic Plain. Tellus Ser. B Chem. Phys. Meteorol. 2014, 66, 21026. [Google Scholar] [CrossRef] [Green Version]
- Chow, J.C.; Watson, J.G.; Kuhns, H.; Etyemezian, V.; Lowenthal, D.H.; Crow, D.; Kohl, S.D.; Engelbrecht, J.P.; Green, M.C. Source profiles for industrial, mobile, and area sources in the Big Bend Regional Aerosol Visibility and Observational study. Chemosphere 2004, 54, 185–208. [Google Scholar] [CrossRef]
- Chen, L.W.A.; Moosmueller, H.; Arnott, W.P.; Chow, J.C.; Watson, J.G.; Susott, R.A.; Babbitt, R.B.; Wold, C.E.; Lincoln, E.N.; Hao, W.M. Emissions from laboratory combustion of wildland fuels: Emission factors and source profiles. Environ. Sci. Technol. 2007, 41, 4317–4325. [Google Scholar] [CrossRef]
- Han, Y.M.; Cao, J.J.; Lee, S.C.; Ho, K.F.; An, Z.S. Different characteristics of char and soot in the atmosphere and their ratio as an indicator for source identification in Xi’an, China. Atmos. Chem. Phys. 2010, 10, 1487–1495. [Google Scholar] [CrossRef] [Green Version]
- Lim, S.; Lee, M.; Lee, G.; Kim, S.; Yoon, S.; Kang, K. Ionic and carbonaceous compositions of PM10, PM2.5 and PM1.0 at Gosan ABC Superstation and their ratios as source signature. Atmos. Chem. Phys. Discuss. 2012, 12, 2007–2024. [Google Scholar] [CrossRef] [Green Version]
- Idris, S.S.; Rahman, N.A.; Ismail, K. Combustion characteristics of Malaysian oil palm biomass, sub-bituminous coal and their respective blends via thermogravimetric analysis (TGA). Bioresour. Technol. 2012, 123, 581–591. [Google Scholar] [CrossRef]
- Sun, J.; Shen, Z.; Zhang, Y.; Zhang, Q.; Lei, Y.; Huang, Y.; Niu, X.; Xu, H.; Cao, J.; Ho, S.S.H.; et al. Characterization of PM2.5 source profiles from typical biomass burning of maize straw, wheat straw, wood branch, and their processed products (briquette and charcoal) in China. Atmos. Environ. 2019, 205, 36–45. [Google Scholar] [CrossRef]
- Wang, L.; Qi, J.H.; Shi, J.H.; Chen, X.J.; Gao, H.W. Source apportionment of particulate pollutants in the atmosphere over the Northern Yellow Sea. Atmos. Environ. 2013, 70, 425–434. [Google Scholar] [CrossRef]
- Xu, L.; Chen, X.; Chen, J.; Zhang, F.; He, C.; Du, K.; Wang, Y. Characterization of PM10 atmospheric aerosol at urban and urban background sites in Fuzhou city, China. Environ. Sci. Pollut. Res. Int. 2012, 19, 1443–1453. [Google Scholar] [CrossRef]
- Yuan, B.; Liu, R.; Shao, R.; Sihua, L.U.; Streets, R.G. Biomass burning contributions to ambient VOCs species at a receptor site in the Pearl River Delta (PRD), China. Environ. Sci. Technol. 2010, 44, 4577. [Google Scholar] [CrossRef]
- Li, W.; Wang, M.; Chen, M.; Hu, K.; Ge, X.; Nie, D.; Gu, C.; Yu, W.; Cheng, Y. Carbohydrates observations in suburb Nanjing, Yangtze River of Delta during 2017–2018: Concentration, seasonal variation, and source apportionment. Atmos. Environ. 2020, 243, 117843. [Google Scholar] [CrossRef]
- Singhai, A.; Habib, G.; Raman, R.S.; Gupta, T. Chemical characterization of PM1.0 aerosol in Delhi and source apportionment using positive matrix factorization. Environ. Sci. Pollut. Res. 2017, 24, 445–462. [Google Scholar]
- Yao, L.; Yang, L.; Yuan, Q.; Yan, C.; Dong, C.; Meng, C.; Sui, X.; Yang, F.; Lu, Y.; Wang, W. Sources apportionment of PM2.5 in a background site in the North China Plain. Sci. Total Environ. 2016, 541, 590–598. [Google Scholar] [CrossRef]
- Kim, S.; Kim, T.Y.; Yi, S.M.; Heo, J. Source apportionment of PM2.5 using positive matrix factorization (PMF) at a rural site in Korea. J. Environ. Manag. 2018, 214, 325–334. [Google Scholar] [CrossRef]
- Kumagai, K. Characterization and Source Apportionment Studies of PM2.5 Using Organic Marker-based Positive Matrix Factorization. J. Jpn. Soc. Atmos. Environ. 2018, 53, A50–A52. [Google Scholar]
- Sowlat, M.H.; Hasheminassab, S.; Sioutas, C. Source apportionment of ambient particle number concentrations in central Los Angeles using positive matrix factorization (PMF). Atmos. Chem. Phys. 2016, 16, 4849–4866. [Google Scholar] [CrossRef] [Green Version]
Figure 1.
Schematic of the sources, transport, and deposition of biomass burning emissions [14].
Figure 1.
Schematic of the sources, transport, and deposition of biomass burning emissions [14].

Figure 2.
Chromatographic separation of biomass burning tracers using GC-MS/MS [17].
Figure 2.
Chromatographic separation of biomass burning tracers using GC-MS/MS [17].

Figure 3.
Chromatographic separation of biomass burning tracers by LC-MS/MS (1.6e4 means 1.6 × 10⁴) [12].
Figure 3.
Chromatographic separation of biomass burning tracers by LC-MS/MS (1.6e4 means 1.6 × 10⁴) [12].

Figure 4.
Scatter plot of Levoglucosan to K+ ratios versus levoglucosan to mannosan ratios from different types of biomass burning [56].
Figure 4.
Scatter plot of Levoglucosan to K+ ratios versus levoglucosan to mannosan ratios from different types of biomass burning [56].

Figure 5.
Scatter plot of levoglucosan to K+ ratio versus levoglucosan to mannosan ratio of different types of biomass burning emissions [88].
Figure 5.
Scatter plot of levoglucosan to K+ ratio versus levoglucosan to mannosan ratio of different types of biomass burning emissions [88].

Figure 6.
Scatter plots of levoglucosan to OC ratios versus levoglucosan to EC ratios of (a) different types of biomass-burning emissions and (b) average of the Asian crop residue, grass, and leaf burnings [88].
Figure 6.
Scatter plots of levoglucosan to OC ratios versus levoglucosan to EC ratios of (a) different types of biomass-burning emissions and (b) average of the Asian crop residue, grass, and leaf burnings [88].

Figure 7.
Comparison of VA/SyA mass ratios obtained from hardwood, softwood, grass, and other burning sources [1].
Figure 7.
Comparison of VA/SyA mass ratios obtained from hardwood, softwood, grass, and other burning sources [1].

Figure 8.
Profiles of type of biomass burning in Nanjing aerosols in 2016 [51].
Figure 8.
Profiles of type of biomass burning in Nanjing aerosols in 2016 [51].

Figure 9.
Changes of contribution of different types of biomass burning on days (a) and in four seasons (b) [51].
Figure 9.
Changes of contribution of different types of biomass burning on days (a) and in four seasons (b) [51].


Table 1.
Ratios of anhydrosaccharides in source test emissions from lignite and biomass burning [46].
Table 1.
Ratios of anhydrosaccharides in source test emissions from lignite and biomass burning [46].
| Sample Type | L/M | L/(M + G) | Data Source | |
|---|---|---|---|---|
| Lignite | Jsp11 | 31 | 31 | Fabbri et al. (2009) [46] |
| S6s | 92 | 92 | Fabbri et al. (2009) [46] | |
| Lst6 | 40 | 40 | Fabbri et al. (2009) [46] | |
| Average | 54 | 54 | ||
| Hardwoods | 22 | 17.6 | Nolte et al. (2001) [73], Fine et al. (2002) [74] | |
| 13–24 | Fine et al. (2004) [59] | |||
| 14.5–14.6 | 8.5–9.9 | Schmidl et al. (2008) [53] | ||
| 13.8–32.3 | 4.5–14 | Engling et al. (2006) [75] | ||
| 3.3–8.4 | 1.5–2.1 | Oros and Simoneit (2001b) [76] | ||
| Softwoods (conifer) | 4 | 3.6 | Nolte et al. (2001) [73], Fine et al. (2002) [74] | |
| 3.9–6.7 | Fine et al. (2004) [59] | |||
| 2.6–5.0 | 2.4–5.0 | Engling et al. (2006) [75] | ||
| 3.6–3.9 | 1.8–2.8 | Schmidl et al. (2008) [53] | ||
| 0.6–13.8 | 0.4–6.1 | Oros and Simoneit (2001a) [77] | ||
| Charred pine wood | 2.5 | 2.0 | Otto et al. (2006) [78] | |
| Charred pine cone | 0.3 | 0.2 | Otto et al. (2006) [78] | |
| Forest fire smoke | 4.8–5.6 | 3.2–3.9 | Ward et al. (2006) [79] | |
| Grasses | 2.0–33.3 | 1.7–9.5 | Oros et al. (2006) [80] | |
| Green hardwood litter | 4 | 2 | Medeiros and Simoneit (2008) [81] | |
| Green softwood litter | 3.6 | 2.1 | Medeiros and Simoneit (2008) [81] | |
| Atmospheric aerosols | 3.5–75 | 3.2–14 | Pashynska et al. (2002) [82], Yttri et al. (2005) [82], Ward et al. (2006) [79], Simoneit et al. (2004b,c) [83,84], Medeiros et al. (2006) [85], Zdra’hal et al. (2002) [86], Sandradevi et al. (2008) [87] | |
Table 2.
Organic compound mass fractions (%) of the six identified source factor mass concentrations and contribution (%) of each source to the mass concentration of the determined organic compounds in residential areas [89].
Table 2.
Organic compound mass fractions (%) of the six identified source factor mass concentrations and contribution (%) of each source to the mass concentration of the determined organic compounds in residential areas [89].
| Compounds | Factor 1 | Factor 2 | Factor 3 | Factor 4 | Factor 5 | Factor 6 |
|---|---|---|---|---|---|---|
| Anthracene (Ant) | 0.03 | 1.02 | 0.16 | 0.52 | 0.34 | 0.00 |
| Retene (Ret) | 1.27 | 2.02 | 0.00 | 0.85 | 0.32 | 0.30 |
| Fluoranthene (Flut) | 0.80 | 0.18 | 10.61 | 4.80 | 0.61 | 0.00 |
| Pyrene (Py) | 0.75 | 3.03 | 8.89 | 1.51 | 3.94 | 0.23 |
| Chrysene (Chr) | 0.37 | 1.30 | 2.90 | 1.77 | 3.35 | 0.95 |
| Benzo[a]anthracene (BaA) | 0.66 | 0.31 | 3.42 | 2.86 | 4.17 | 1.39 |
| Benzo[k + b]fluoranthene (B[k + b]F) | 0.54 | 1.82 | 2.11 | 1.33 | 3.88 | 1.60 |
| Benzo[a]pyrene (BaP) | 0.21 | 1.63 | 2.77 | 0.88 | 3.64 | 1.29 |
| Benzo[e]pyrene (BeP) | 0.42 | 1.21 | 1.94 | 1.44 | 3.07 | 0.98 |
| Perylene (Prl) | 0.92 | 1.29 | 0.23 | 1.56 | 0.00 | 0.00 |
| Dibenzo[a,h]anthracene (DBahA) | 0.05 | 0.80 | 0.00 | 1.17 | 0.61 | 0.01 |
| Indeno[1,2,3-cd]pyrene (IP) | 0.32 | 1.53 | 0.62 | 1.05 | 2.40 | 1.36 |
| Benzo[ghi]perylene (BghiP) | 0.19 | 1.78 | 1.11 | 2.80 | 2.84 | 1.83 |
| Syringaldehyde | 18.84 | 1.44 | 0.00 | 0.00 | 0.00 | 6.53 |
| Acetosyringone | 52.54 | 1.46 | 0.00 | 0.00 | 0.00 | 29.92 |
| Propionylsyringol | 9.87 | 1.19 | 0.00 | 0.57 | 0.00 | 6.73 |
| Sinapylaldehyde | 21.98 | 8.34 | 0.00 | 0.00 | 0.00 | 1.35 |
| Vanillin | 0.19 | 1.57 | 0.00 | 0.00 | 0.00 | 1.28 |
| Acetovanillone | 1.13 | 1.72 | 0.00 | 0.00 | 0.00 | 0.35 |
| Guaiacylacetone | 5.27 | 5.73 | 0.00 | 0.00 | 0.00 | 1.66 |
| Coniferylaldehyde | 1.15 | 2.65 | 0.00 | 0.00 | 0.05 | 0.66 |
| Levoglucosan | 34.80 | 51.41 | 0.00 | 0.00 | 0.00 | 3.76 |
| Dehydroabietic acid | 6.29 | 29.65 | 0.00 | 0.00 | 0.00 | 0.93 |
| Biomass burning types | Hardwood | Softwood | Light oil | Traffic | Road dust | Others |
| Contribution (%) | 43.1 | 5.8 | 13.4 | 7.2 | 8.2 | 21.5 |
Publisher’s Note: MDPI stays neutral with regard to jurisdictional claims in published maps and institutional affiliations. |
© 2021 by the authors. Licensee MDPI, Basel, Switzerland. This article is an open access article distributed under the terms and conditions of the Creative Commons Attribution (CC BY) license (https://creativecommons.org/licenses/by/4.0/).
Share and Cite
MDPI and ACS Style
Li, W.; Ge, P.; Chen, M.; Tang, J.; Cao, M.; Cui, Y.; Hu, K.; Nie, D. Tracers from Biomass Burning Emissions and Identification of Biomass Burning. Atmosphere 2021, 12, 1401. https://0-doi-org.brum.beds.ac.uk/10.3390/atmos12111401
AMA Style
Li W, Ge P, Chen M, Tang J, Cao M, Cui Y, Hu K, Nie D. Tracers from Biomass Burning Emissions and Identification of Biomass Burning. Atmosphere. 2021; 12(11):1401. https://0-doi-org.brum.beds.ac.uk/10.3390/atmos12111401
Chicago/Turabian StyleLi, Wenjing, Pengxiang Ge, Mindong Chen, Jiajie Tang, Maoyu Cao, Yan Cui, Kun Hu, and Dongyang Nie. 2021. "Tracers from Biomass Burning Emissions and Identification of Biomass Burning" Atmosphere 12, no. 11: 1401. https://0-doi-org.brum.beds.ac.uk/10.3390/atmos12111401
Note that from the first issue of 2016, this journal uses article numbers instead of page numbers. See further details here.